


Abstract
Uncovering the interdependencies among barrier factors and pinpointing the most critical obstacles are essential to overcoming the resistance encountered by photovoltaic (PV) integration into electricity markets. This study first employs grounded theory to identify and categorize the key barriers impeding PV participation, thereby constructing a comprehensive barrier factor model. Subsequently, Interpretive Structural Modeling (ISM) is applied to systematically analyze the interrelations and hierarchical structure among these barriers. The results reveal that: (1) The complex system of PV participation comprises 15 distinct barriers, which can be grouped into 4 overarching categories: economic and cost-related challenges, policy and regulatory uncertainties, technological and infrastructure constraints, and environmental and resource limitations. (2) These barriers form a six-tier hierarchical structure, reflecting their layered influence. (3) Root-level barriers—such as inadequate government fiscal support and the absence of a comprehensive coordination mechanism—play a foundational role in hindering progress. In response, this study proposes policy recommendations, including establishing a unified and effective coordination framework to align renewable energy policies and formulating standardized guidelines for PV panel recycling.
1. Introduction
The ongoing global shift toward cleaner energy sources, coupled with rapid technological progress in renewables, is positioning photovoltaic (PV) generation as a vital pillar of sustainable power within electricity markets. Guided by carbon neutrality objectives, many governments are actively advancing the large-scale deployment of renewable energy, leading to a steady rise in PV’s share of total power generation. Projections suggest that PV could contribute as much as 40% of total installed energy capacity in the near future [1]. In China, data from the National Renewable Energy Center show that grid-connected PV capacity soared from 6 GW in 2012 to 886 GW in 2024—an impressive trajectory of growth. Yet, PV development still encounters considerable challenges. These include the inherent intermittency and instability of solar power, high capital and operational costs, and growing concerns around PV waste disposal and recycling. These challenges represent significant barriers to PV integration into electricity trading markets, warranting closer examination of their underlying interconnections.
Prior studies have mainly investigated the obstacles faced by emerging players entering electricity markets. For instance, Cicek [2] analyzed renewable energy usage in Turkey and the EU, exploring the market-specific barriers to deployment in the Turkish context. Similarly, Liam critically reviewed Australia’s policy landscape, incentive structures, and regulatory frameworks to uncover the constraints in the renewable sector. However, these investigations primarily relied on qualitative methods and were largely limited to listing obstacles without offering a systematic identification or prioritization of the key ones. In response to these gaps, Sunil [3] employed the Analytic Hierarchy Process (AHP) to rank barriers hindering renewable energy expansion in India. Nonetheless, as a multi-criteria decision-making tool, AHP mainly emphasizes the weighting of expert opinions while neglecting the intricate interdependencies among barrier factors. In contrast, Tomas [4] adopted the Analytic Network Process (ANP) to examine renewable energy barriers in Colombia’s electricity market. While ANP accommodates complex interrelations among factors, it remains heavily reliant on expert input, which can introduce subjectivity into the analysis.
More recent studies have shifted from general renewable deployment barriers to PV’s concrete market participation challenges under evolving power-market reforms. For example, Yu et al. [5] highlights that PV revenue and dispatch outcomes are increasingly shaped by forecast errors, imbalance settlement exposure, and balancing-market interactions, rather than purely technical integration issues. In China, policy and market-design discussions increasingly emphasize green power trading and standardization across regions, reflecting the institutional side of PV market integration [6]. Meanwhile, the rapid scale-up of PV has also intensified the policy urgency of end-of-life governance and recycling systems, which directly affects PV’s long-term sustainability and compliance costs [1]. Despite these advances, the literature still lacks an integrated, PV-specific framework that jointly maps (1) the lack of a systematic identification framework targeting specific obstacles in the PV market, (2) cross-category interactions among obstacles, and (3) the multi-level hierarchy of barriers.
Against this backdrop, the present study draws upon authoritative journal articles and policy reports in the renewable energy domain—especially regarding PV—to identify relevant barriers using grounded theory. This foundation enables the construction of a comprehensive barrier factor model. Subsequently, Interpretive Structural Modeling (ISM) is employed to analyze the structural relationships among these factors, followed by the MICMAC approach to determine the most influential barriers within the system.
2. Literature Review
Extensive research has been conducted globally on the barriers to implementing renewable energy technologies. However, the specific relationships among the factors hindering PV integration into electricity markets remain underexplored. While the literature provides a wealth of studies on general barriers to renewable energy deployment and market entry, few delve into the systemic interactions among these obstacles—an area this study aims to address.
Much of the existing research has concentrated on barriers to the application of renewable energy technologies, encompassing technical limitations, rural adoption challenges, and policy-related constraints. For example, Sunil [3] conducted a detailed assessment of the major obstacles to adopting renewable and green energy technologies in India and ranked them using the AHP. His findings highlighted the lack of political commitment and environmental concerns as the dominant impediments. Robinson [7] examined the technical, organizational, and knowledge-related challenges facing renewable energy projects in rural electricity markets before reaching full operational efficiency. Similarly, Helene [8] explored the drivers and constraints of rural electrification in Tanzania and Mozambique. Liam [9] critically analyzed Australia’s renewable energy policies, incentives, and regulatory frameworks, identifying key barriers within the national energy sector. In a comparative analysis, Zhao [10] reviewed the characteristics of Renewable Portfolio Standards (RPS) in major industrialized nations and identified five dimensions of barriers to RPS implementation in China.
In addition, the literature has extensively discussed the obstacles to renewable energy integration into power markets. Jing Hu [11], for instance, offered a comprehensive review of the barriers hindering large-scale renewable energy integration within the EU’s electricity market design, emphasizing the urgent need for structural reforms. Tomas [4] assessed renewable energy barriers in Colombia’s electricity sector, classifying them into technological, social, and economic categories. His study found that major challenges include high capital and operational costs, weak coordination between public and private stakeholders, and inadequate development planning. Cicek [5] further analyzed renewable energy use in Turkey and the EU, offering a detailed evaluation of Turkey’s current market conditions and associated barriers.
In summary, three key limitations are evident in existing studies: First, most research identifies barriers based solely on literature reviews without systematically refining or integrating these factors into a coherent framework. Second, the literature tends to rely on qualitative approaches, offering descriptive lists of barriers without conducting rigorous quantitative analyses to prioritize or evaluate their impact. Even where key barriers are identified, the dynamic interrelationships among them are frequently neglected. Third, existing research seldom differentiates among the specific challenges faced by various emerging market players—such as PV, hydropower, or wind energy—leading to conclusions that often lack both generalizability and context-specific applicability.
3. Research Methodology
3.1. Data Sources
To ensure a robust and diverse empirical foundation, this study collected a wide array of textual data from multiple sources and formats. The primary data were drawn from published research in CNKI (China National Knowledge Infrastructure), as well as articles on PV participation in electricity markets retrieved from Sogou WeChat and Baidu News. Only materials directly relevant to the research theme were retained. Data collection took place from 1 September to 1 November 2024, yielding a corpus of approximately 155,000 characters. CNKI offered authoritative and systematically organized academic resources. Sogou WeChat provided real-time academic updates from public accounts—including those affiliated with academic and library institutions—adding timeliness and scholarly value. Baidu News contributed practical, case-oriented articles with high reference significance.
After initial collection, the data underwent a thorough cleaning process, resulting in 122,000 valid characters. These texts were randomly shuffled and indexed as S1 through S1282, with a total of 1282 text segments. A random 80% sample (roughly 97,600 characters) was selected for grounded coding, while the remaining 20% was reserved for theoretical saturation testing. NVivo12 was employed to conduct three levels of coding, enabling the identification of core and subcategories and their interrelations. To minimize bias and enhance reliability, three trained coders participated: two performed independent coding, and a third reconciled discrepancies. Only those codes on which all coders agreed were included in the final analysis, thereby ensuring the objectivity and consistency of the results.
3.2. Grounded Theory
Uncovering the factors that hinder PV integration into electricity markets is inherently complex and unstructured, characterized by high uncertainty and intertwined variables. Relying solely on quantitative techniques would risk overlooking critical qualitative insights and failing to fully capture the underlying dynamics. Similarly, extracting barrier factors from superficial literature reviews can introduce subjective bias, undermining the credibility of the findings. Grounded theory, by contrast, is a systematic and data-driven approach ideal for theory construction in under-theorized or poorly understood domains. It is especially valuable for tracing the root causes of observed phenomena based on empirical evidence. Thus, this study adopts grounded theory to conduct an exploratory investigation of the barriers to PV market participation, aiming to develop a conceptual model grounded in actual data.
3.3. Interpretive Structural Modeling (ISM)
Interpretive Structural Modeling (ISM), developed by Warfield [12], is a structured analytical tool from systems science used to reveal complex relationships among elements in large and ambiguous systems. The multifaceted barriers to PV participation—many of which interact directly and indirectly—make ISM a highly appropriate method for this study. ISM constructs multi-level hierarchical directed graphs to illuminate the structure of the system and the relationships between its internal components. Compared to conventional factor analysis techniques, ISM requires only a small sample of expert input yet yields rich insights into the hierarchy and interdependencies of system elements. Applying ISM in this context enables a scientifically rigorous and feasible mapping of how barriers to PV integration are layered and interlinked. Accordingly, this study utilizes ISM to examine the structural interactions among the identified barrier factors and to reveal the underlying architecture of these challenges.
3.4. MICMAC Analysis
To further clarify the roles of each barrier in the system, this study employs the MICMAC (Cross-Impact Matrix Multiplication Applied to Classification) method. MICMAC categorizes system elements based on their driving power and dependence, offering insights into which factors are foundational drivers and which are consequences or dependent variables. By evaluating the strength and direction of influence between elements, MICMAC helps distinguish critical levers for intervention and informs more strategic policy decisions. This structured approach is especially useful for navigating complex systems and provides practical guidance for decision-making in dynamic energy policy environments.
4. Building a Grounded Theory Model of Barriers to PV Participation in the Electricity Market
4.1. Open Coding
Open coding involves thoroughly reading the raw textual data and deconstructing the material without any preconceived framework, then assigning conceptual labels to segments of text to progressively distill meaning and restructure the data in a new format. This bottom-up process emphasizes openness and objectivity, with the coder identifying meaningful statements word by word, line by line, and event by event. In this study, statements were retained as “relevant” if they explicitly described PV participation in electricity markets, including (1) market access conditions and rules (e.g., eligibility requirements, trading mechanisms, or settlement arrangements), (2) participation processes and operational requirements (e.g., bidding/offer submission, forecasting obligations, imbalance settlement or penalty exposure), and/or (3) market-related barriers, risks, or performance outcomes (e.g., curtailment due to grid constraints, transaction costs, revenue uncertainty, or compliance burdens). For instance, statements such as “PV generators must submit day-ahead bids and bear imbalance charges when forecasts deviate” and “grid congestion leads to frequent curtailment that reduces market revenues” were coded as relevant. By contrast, content was excluded as “irrelevant” or “low-information” when it did not inform market participation, such as general descriptions of PV technology or environmental benefits without linking to trading/settlement (e.g., “PV is clean and should be promoted”), background commentary unrelated to market behavior, purely repetitive remarks, or vague confirmations with no actionable meaning (e.g., “yes, that’s right”). After multiple rounds of review and refinement, 317 valid statements were identified, each associated with an initial concept. To ensure the reliability and consistency of the coding process, this study employed a method where two coders independently coded the data without mutual consultation. After the initial coding was completed, we used Cohen’s Kappa coefficient to quantitatively evaluate the consistency of conceptual labeling between the two coders. The Kappa coefficient for the first round of coding was 0.72, indicating a level of “substantial agreement.” Subsequently, the two coders discussed the concepts on which they had disagreements until full consensus was reached on all concept labels. After multiple rounds of review, refinement, and consistency checks, it was found that many concepts overlapped or were semantically similar, necessitating further synthesis. After excluding low-frequency concepts (those that appeared fewer than two times), we analyzed and integrated the remaining concepts into 15 higher-level categories, as detailed in Table 1.
Table 1.
Examples of open coding.
4.2. Axial Coding
Axial coding builds upon the outcomes of open coding by identifying and structuring the relationships among categories. Through iterative comparison and conceptual linkage, four overarching themes emerged as major categories of barriers to PV integration into electricity markets: economic and cost-related challenges, uncertainties in policies and regulations, limitations in technology and infrastructure, and resource and environmental constraints. These four principal categories, which form the analytical backbone of this study, are summarized in Table 2.
Table 2.
Main categories formed by principal axis coding.
4.3. Selective Coding
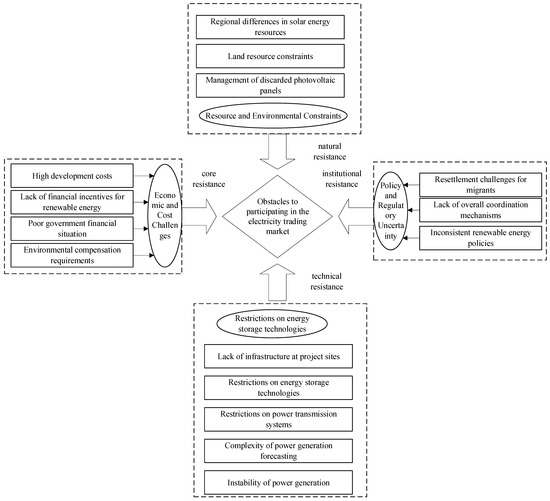
Selective coding refers to systematically linking the core category extracted from the original data with other categories, verifying their relationships, and refining underdeveloped conceptual structures. In this study, grounded theory analysis began with the core concept of “barriers to PV participation in electricity trading markets” and subsequently summarized and organized related concepts and categories. Thus, the “barriers to participation in the electricity trading market” are defined as the core category. Through logical organization and comparative analysis of the four main categories in relation to this core concept, a typical relational structure and connotation of the main categories driving urban–rural integrated development was derived, as shown in Table 3. Specifically, economic and cost challenges represent the core resistance to PV participation; policy and regulatory uncertainty is identified as the institutional resistance; technological and infrastructure limitations are defined as the technical resistance; and resource and environmental constraints constitute the natural resistance. Based on this analysis, a barrier factor model for PV participation in electricity trading markets was constructed, as illustrated in Figure 1.
Table 3.
Adjacency matrix of the ISM model for obstacle factors of photovoltaic participation in the electricity trading market.
Figure 1.
Model of obstacle factors for photovoltaic participation in the electricity trading market.
As shown in Figure 1, PV participation in electricity trading markets involves 15 key barrier factors, which can be further grouped into four categories based on their attributes: economic and cost challenges, policy and regulatory uncertainty, technological and infrastructure limitations, and resource and environmental constraints. Economic and cost challenges stem from internal market dynamics and cost considerations, affecting PV’s competitiveness and profitability, and are thus defined as the “core resistance.” Policy and regulatory uncertainty arises from changes in electricity market regulations and unclear policy directions introduced by policymakers and regulators, representing an external uncertainty that significantly impacts PV participation. It is therefore defined as the “institutional resistance.” Technological and infrastructure limitations refer to the technological bottlenecks and underdeveloped infrastructure encountered during PV market participation, which form foundational obstacles to the smooth operation of the power trading system. These are categorized as “technical resistance.” Resource and environmental constraints highlight the reliance and limitations PV power faces in the processes of development, transmission, and usage, reflecting the need for coordination and balance with the natural environment. These are thus defined as “natural resistance.”
4.4. Theoretical Saturation Test
To verify the robustness of the model, the remaining 20% of the collected textual data (around 24,400 characters) was subjected to three-level grounded coding. The analysis yielded no new concepts or categories, indicating that this study had reached theoretical saturation. This confirms the completeness and internal consistency of the developed framework.
5. Analysis of Barrier Factors in the PV Participation in the Electricity Trading Market Based on ISM
5.1. Construction of the ISM Model for PV Participation in the Electricity Trading Market
When applying the ISM model for analysis, the expert consultation method is often used to scientifically determine the influence relationships among system factors. This study first defines the 15 factors that hinder photovoltaic participation in the electricity trading market, as summarized earlier, as the set of barrier factors B for the ISM model, and assigns them the following codes: B1 High development costs, B2 Environmental compensation requirements, B3 Resettlement challenges, B4 Power transmission system restrictions, B5 Lack of financial incentives for renewable energy, B6 Lack of overall coordination mechanisms, B7 Lack of infrastructure at project sites, B8 Photovoltaic panel waste management, B9 Poor government financial conditions, B10 Inconsistent renewable energy policies, B11 Complexity of power generation forecasting, B12 Energy storage technology restrictions, B13 Regional solar energy resource differences, B14 Power generation instability, and B15 Land resource restrictions.
Subsequently, we distributed questionnaires via email to 20 experts (including 10 university scholars and 10 government department managers) in the field of photovoltaic and electricity trading research. The selection criteria for experts are as follows: (1) University scholars (n = 10): All hold the title of associate professor or above, with their research directions closely related to photovoltaic grid-connection technology or electricity market mechanisms. They have published at least 5 SCI/SSCI papers in relevant fields as the first author or corresponding author. (2) Government department managers (n = 10): They have directly participated in or been responsible for the formulation of renewable energy policies at the provincial level or above, the supervision of electricity market operations, or related project management, and possess at least 8 years of industry management experience. Detailed information about the experts can be found in Appendix A. These expert resources are primarily sourced from the expert pool accumulated through the project “Suggestions on the Path and Mechanism for Hebei’s New Energy to Participate in the Electricity Market.”
Based on the results of the first round of expert questionnaires, we preliminarily determined the direct influence relationships among the obstacle factors and constructed an initial adjacency matrix. To verify and optimize these judgments, this study adopted the Delphi method for multiple rounds of iteration. After summarizing the first-round results, we anonymously fed them back to all experts. The experts then made a second round of independent judgments based on the collective opinions and engaged in in-depth discussions on relationships with divergent views. This iterative process continued for two rounds until the opinions of all experts stabilized and no significant changes occurred. For influence relationships that still had divergent opinions after multiple rounds of discussion, this study set a consensus threshold: Only when over 90% of the experts identified a direct influence relationship between two factors was the relationship finally included in the model. The setting of this 90% threshold refers to classic Delphi research methods, which are widely used to define “high consensus.” It aims to ensure that each influence relationship finally determined has received overwhelming support from the expert panel, thereby significantly enhancing the reliability and robustness of the input data for the ISM model. Ultimately, based on the expert consensus obtained through this process, we obtained a definitive adjacency matrix for subsequent ISM analysis.
Ultimately, the unique adjacency matrix is determined, where: is the number of barrier factors, is the matrix element, and are the barrier factor codes. If has a direct influence on , then is 1; if has no direct influence on , then is 0. It is a matrix with only 0, 1 elements, as shown in Table 3.
According to the formula , calculate , , …, in sequence. Here, represents the identity matrix of the same order as the adjacency matrix , used to reflect the accessibility of the factors themselves, and is the number of operations. Based on this, the accessible matrix is calculated through Matlab 2022b programming, as shown in Table 4.
Table 4.
Reachability matrix of the ISM model for obstacle factors of photovoltaic participation in the electricity trading market.
Based on the accessible matrix M, calculate the reachable set and the antecedent set for all factors. If , then is the highest-level factor set. After finding the highest-level factor set, the corresponding rows and columns in the accessible matrix can be crossed out accordingly. Then, a new highest-level factor is sought from the remaining matrix.
This calculation is performed iteratively until the factor sets contained in each level are found. Table 5 shows the final hierarchical results.
Table 5.
Hierarchical iteration of obstacle factors for photovoltaic participation in the electricity trading market.
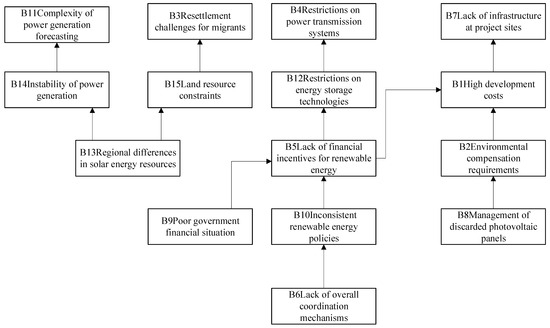
Based on the aforementioned hierarchical division, an explanatory structure model of the factors influencing social media information impact has been constructed, as shown in Figure 2.
Figure 2.
ISM of obstacle factors for PV participation in the electricity trading market.
Figure 2 illustrates the hierarchical structure of barriers to PV participation in electricity trading markets, organized into five interdependent levels. These barriers form a multilayered system where each level interacts with others through various channels, collectively impeding PV integration. At the top level, B3, B4, B7, and B11 emerge as the most critical endpoints—representing the culmination of the system’s obstructive forces and serving as the dominant constraints within the overall framework. The full set of barriers functions as a cohesive and inseparable system.
The second level comprises generation instability, limitations in energy storage technologies, land resource constraints, and high development costs. Variability in geography and climate results in uneven solar resource distribution, which in turn affects the consistency of PV generation and narrows location options for PV project development. Financial incentives are instrumental in advancing technology adoption; the absence of targeted support—such as subsidies, tax relief, or R&D funding—stifles progress in energy storage technology. Additionally, the lack of renewable energy subsidies forces investors to shoulder greater risk, thereby escalating development costs.
The third level includes regional disparities in solar energy potential, insufficient fiscal support for renewables, and environmental compensation requirements. Among these, regional solar disparities—primarily driven by natural factors—exist relatively independently within the system, receiving little influence from other barriers. In contrast, poor government finances have a direct effect on the availability of renewable energy incentives, with fiscal stress potentially leading to subsidy cutbacks or cancellations. Moreover, improper handling of decommissioned PV panels poses risks of ecological damage, such as contamination of land and water sources. To mitigate such harm, compensatory measures are often required to restore ecosystem functions.
Sensitivity check: To examine whether minor changes in expert judgments could substantially affect the ISM hierarchy, we conducted a one-at-a-time perturbation analysis on the final adjacency matrix. Specifically, we flipped one relationship at a time (i.e., changing a single entry from 1 to 0 to mimic a conservative reassessment of a direct influence), recomputed the reachability matrix via transitive closure, and repeated the standard ISM level partition procedure. Overall, the hierarchical structure proved robust: the five-level architecture was retained in 11 out of 13 single-link deletion tests (84.6%), and the top-level barrier set {B3, B4, B7, B11} remained unchanged in all tests (100%). At the factor level, on average 93.3% of barriers preserved their original level assignment under these minor perturbations. These results indicate that the main structural findings are not driven by isolated expert judgments while also highlighting that a small subset of relationships may exert disproportionate influence on the hierarchy.
5.2. Driving Force—Dependency Analysis
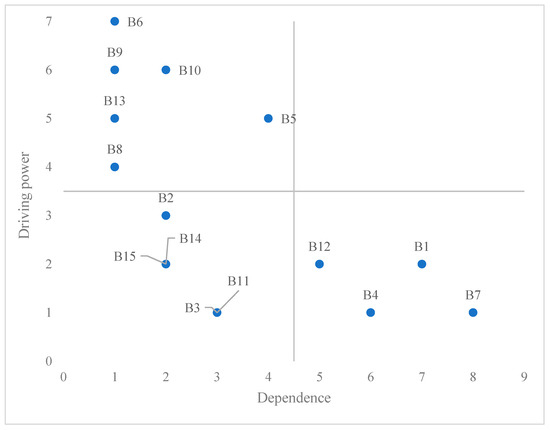
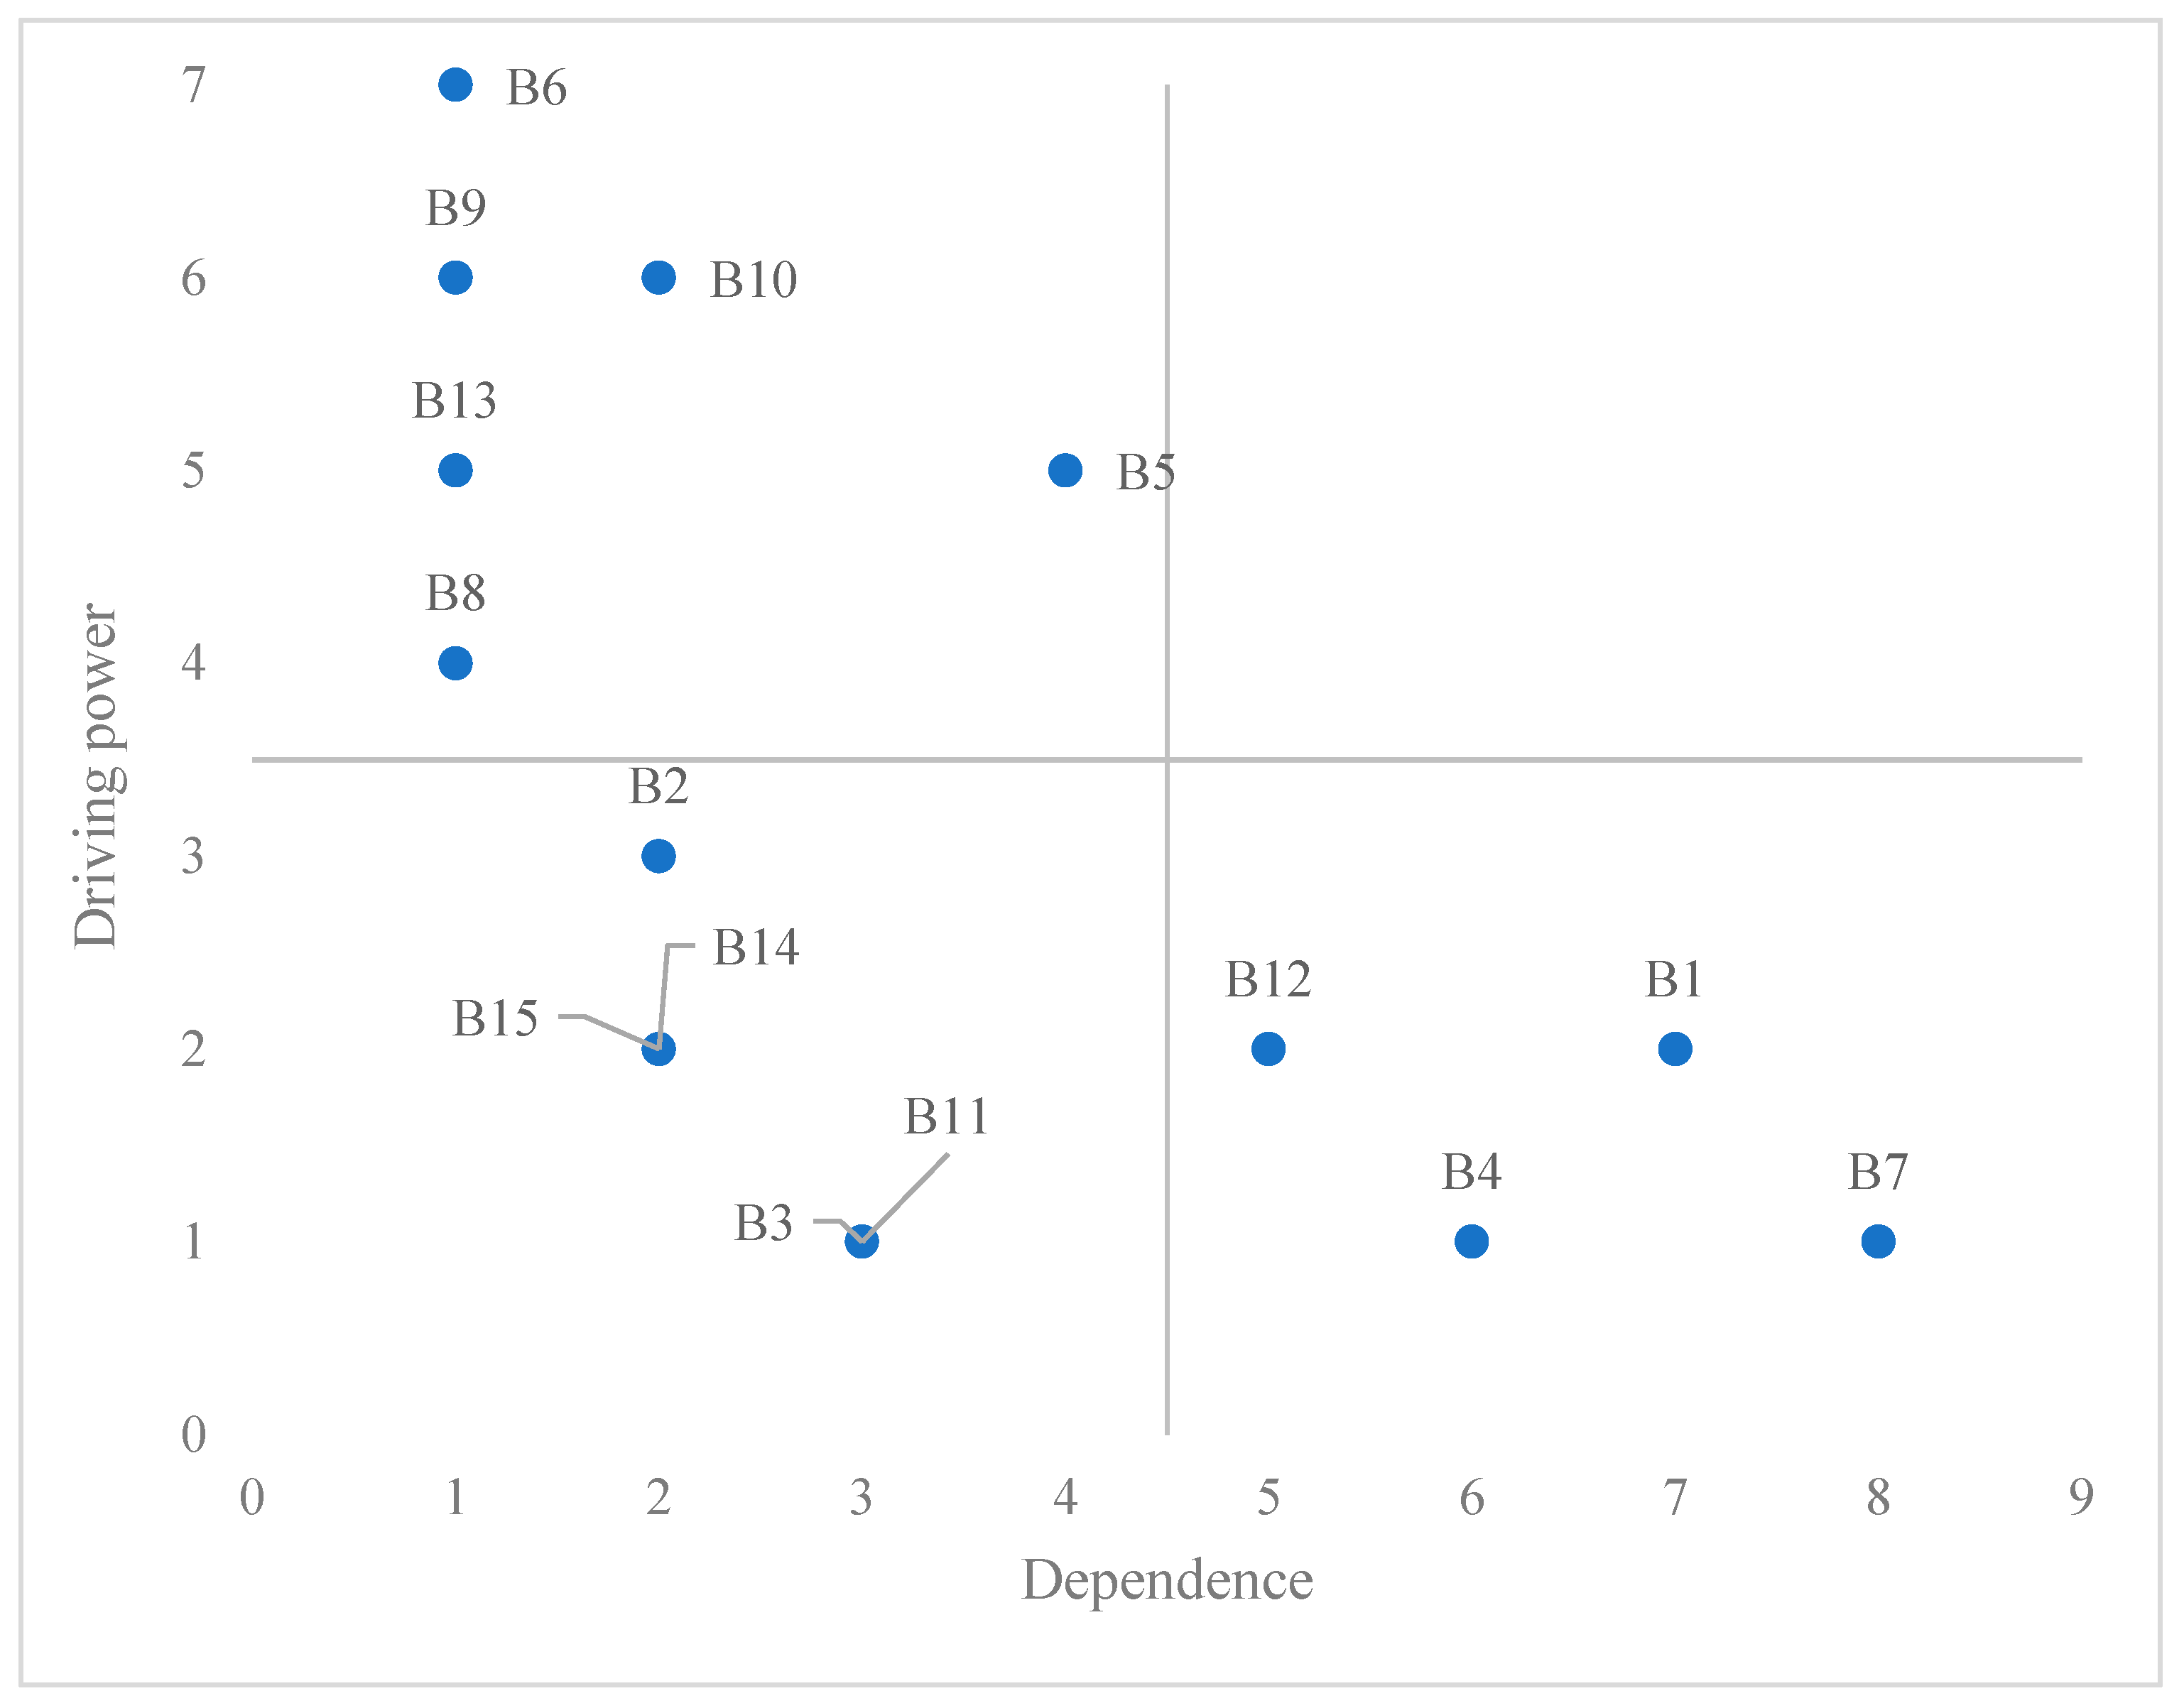
The cross-influencing factor matrix multiplication method is an analytical approach used to examine the influence and dependency relationships among various factors within a system. Based on the principle of matrix multiplication, this method analyzes the mutual relationships between factors by calculating the cross-influencing factor matrix multiplication. The results are represented using coordinate axes, where the horizontal axis represents dependency and the vertical axis represents driving force. The driving force value of factor is the sum of the elements in the row where the element in the reachability matrix is located, and the dependency value of factor is the sum of the elements in the column where the element in the reachability matrix is located. A greater driving force indicates that the formative factor has a stronger influence on other factors, while a greater dependency implies that the formative factor is more reliant on other factors. The research results are shown in Table 6. Using dependency as the horizontal axis and driving force as the vertical axis, a driving force—dependency two-dimensional coordinate graph is constructed based on the values of driving force and dependency, and the formative factors are classified into four clusters, namely, the Connected Cluster (I), the Independent Cluster (II), the Spontaneous Cluster (III), and the Dependent Cluster (IV), as illustrated in Figure 3.
Table 6.
Driving force values and dependency values.
Figure 3.
Coordinate quadrant diagram of obstacle factors.
The first quadrant, or linkage cluster, is typically composed of factors with both high dependence and high driving power. In this study, none of the identified barriers fall into this quadrant, suggesting that the factors extracted exhibit high independence and do not form ambiguous or entangled clusters.
The second quadrant, representing the independent cluster, includes B6, B9, and B10. These align with the root-level drivers identified in the ISM model. Such factors have strong influence but are minimally affected by others. Their changes tend to cascade throughout the system, triggering shifts in other dependent factors. Hence, targeting these high-leverage points can enhance overall control of the system.
The third quadrant, known as the autonomous cluster, consists of B2, B3, B11, B14, and B15. These factors have limited influence and weak dependence, indicating that their effect on the system’s overall dynamics is minor. However, several—such as B2, B14, and B15—occupy intermediary positions in the ISM hierarchy. They function as bridges, mediating between upper- and lower-level barriers.
The fourth quadrant, or dependent cluster, features high dependence and low driving power. It includes B1, B4, B7, and B12, all of which are sensitive to upstream factors. For instance, B4 and B7, located at the first level of the ISM model, are especially vulnerable to changes in higher-level drivers, suggesting that indirect intervention through other barriers may be most effective.
6. Policy Recommendations
The ISM-MICMAC analysis identifies the lack of overall coordination mechanisms (B6) as a fundamental, independent barrier with extensive downstream effects. This barrier specifically manifests as insufficient coordination between central and local governments, as well as among key regulatory bodies such as the National Energy Administration and the Ministry of Ecology and Environment. For instance, misalignment between national PV policy objectives and local implementation can lead to inconsistent enforcement and support for projects, while poor inter-agency coordination causes approval delays and regulatory conflicts. Similar issues have also emerged in other emerging markets: For instance, India encountered obstacles during the early stages of renewable energy development due to a disconnect between federal targets and state-level implementation, while Brazil experienced delays in project approvals stemming from fragmented regulatory functions. Overcoming this systemic bottleneck is therefore critical. A primary strategic response should be to establish a centralized, high-level coordination framework. This framework would be tasked with integrating and aligning renewable energy policies across different administrative and regulatory layers, thereby preventing policy fragmentation and ensuring a coherent strategy for integrating emerging market entities into the electricity market.
Poor government financial situation (B9) constitutes a critical barrier that exerts a driving influence on several other barriers. Given the constraints imposed by weak public finances, policy design should shift toward mobilizing market resources through institutional innovation, thereby avoiding excessive reliance on direct fiscal transfers. An industry-wide recycling fund based on the extended producer responsibility regime could be established by levying a fixed treatment fee on photovoltaic equipment manufacturers and importers, thereby creating a sustainable funding pool and shifting fiscal responsibility from the public sector to the production stage. This model has been successfully implemented in Brazil’s reverse logistics system, effectively shifting financial responsibility from the public sector to the production sector. At the same time, public–private partnership models should be actively explored to channel private capital into the construction and operation of recycling infrastructure, while the government focuses on providing land, policy commitments, and credit guarantees. On the incentive side, a “spend less, guide more” strategy can be adopted by using tiered tax relief and preferential green credit policies to reduce compliance costs for compliant firms, and by incorporating product recyclability into the evaluation criteria of public procurement so that market orders exert pressure on the value chain to assume environmental responsibilities. In addition, issuing dedicated green bonds or providing financing guarantees can attract long-term, stable capital into this field, ultimately fostering a virtuous development pattern in which the market plays the primary role and the government provides complementary support.
Additionally, the government should expedite the development of regulations for managing PV panel waste, including clear designation of responsible parties, standardized recycling procedures, and enforcement mechanisms. Legal clarity will provide a foundation for managing end-of-life PV products. Equally important is the establishment of technical standards for PV recycling to ensure safe and effective handling. A certification system should be developed to accredit qualified recyclers and provide incentives for compliance. To foster broader participation, economic instruments—such as subsidies and tax breaks—should be employed to motivate enterprises and individuals to engage in PV recycling, thereby strengthening the circular economy within the solar sector. This measure aligns with Brazil’s experience, where the management of PV panel waste has lagged behind the rapid expansion of solar technology, resulting in challenges in terms of infrastructure and regulatory frameworks. The Brazilian government has recognized the importance of enhancing the sustainability of the solar energy sector by formalizing recycling standards. Furthermore, PV recycling policies in the Middle East and North Africa (MENA) region could benefit from stronger economic incentives and certification systems, particularly given the region’s growing solar industry and the absence of an adequate waste management framework.
7. Conclusions
Drawing on both literature analysis and questionnaire-based investigations, this study systematically identified the key barriers impeding photovoltaic (PV) participation in electricity trading markets. Through grounded theory, we extracted 15 core barriers. These were then evaluated via expert consultation to assess their interrelations, and the combined ISM-MICMAC methodology was used to uncover the hierarchical structure and central constraints within the system.
This research contributes meaningfully to academic understanding. Notably, it pioneers the application of grounded theory to the context of PV market integration, culminating in the development of a structured barrier factor model. Building on this foundation, the ISM model offered a systematic decomposition of the barrier hierarchy, shedding light on how different obstacles interact. Furthermore, the MICMAC analysis distinguished between high-impact driving forces and more passive dependent variables, enhancing clarity in system dynamics.
This study also delivers significant practical value. First, it provides a nuanced understanding of the specific challenges faced by PV as an emerging market player in power trading contexts. Second, the exploration of the internal dynamics among barriers offers targeted insights for policymakers and stakeholders seeking to mitigate these constraints.
Nonetheless, this study has several limitations that should be acknowledged. (1) The findings are inherently dependent on expert judgments, and while the Delphi method was employed to refine selection criteria, the specific sample composition may still introduce certain biases in the results. (2) As with all grounded theory approaches, the emergent framework is influenced by the source corpus—using different policy documents or interview transcripts could yield variations in the identified barrier structure. (3) While the ISM framework effectively mapped hierarchical relationships, it does not fully capture the underlying logical causality among factors. Future research could adopt Total Interpretive Structural Modeling (TISM) to better uncover these causal mechanisms. Additionally, expanding the scope beyond PV to include other renewable energy participants such as wind and hydropower would enhance the generalizability of the findings.
Author Contributions
Writing—original draft, Funding acquisition, S.H.; Writing—original draft, Writing—review & editing, Methodology, Software, Resources, M.Y.; Supervision, Project administration, G.M.; Methodology, Software, X.X.; Visualization, Data curation, H.L.; Project administration, Investigation, C.X. All authors have read and agreed to the published version of the manuscript.
Funding
This work is supported by the China Scholarship Council (grant number 202509040028) and Postgraduate Research & Practice Innovation Program of Jiangsu Province [grant number KYCX25_1545].
Data Availability Statement
The raw data supporting the conclusions of this article will be made available by the authors on request.
Conflicts of Interest
Authors Shiyao Hu, Guozhen Ma, Xiaobin Xu, and Hangtian Li were employed by the company Economic and Technological Research Institute, State Grid Hebei Electric Power Co., Ltd. The remaining authors declare that the research was conducted in the absence of any commercial or financial relationships that could be construed as a potential conflict of interest.
Appendix A
Table A1.
Anonymized profiles of the 20 experts.
References
- Tan, Q.; Qiao, L.; Wen, X.; Wang, Z. Short-term scheduling of a hybrid pumped storage-photovoltaic power complementary system considering market-oriented electricity prices. Energy 2025, 329, 136687. [Google Scholar] [CrossRef] [Scilit]
- Nalan, Ç.B.; Murat, Ö.; Nuri, Ö. Renewable energy market conditions and barriers in Turkey. Renew. Sustain. Energy Rev. 2009, 13, 1428–1436. [Google Scholar] [CrossRef] [Scilit]
- Luthra, S.; Kumar, S.; Garg, D.; Haleem, A. Barriers to renewable/sustainable energy technologies adoption: Indian perspective. Renew. Sustain. Energy Rev. 2015, 41, 762–776. [Google Scholar] [CrossRef] [Scilit]
- Gómez-Navarro, T.; Ribó-Pérez, D. Assessing the obstacles to the participation of renewable energy sources in the electricity market of Colombia. Renew. Sustain. Energy Rev. 2018, 90, 131–141. [Google Scholar] [CrossRef] [Scilit]
- Yu, J.; Zhang, X.; He, X.; Wang, C.; Lan, J.; Huang, J. Optimized Dispatch of a Photovoltaic-Inclusive Virtual Power Plant Based on a Weighted Solar Irradiance Probability Model. Energies 2025, 18, 4882. [Google Scholar] [CrossRef] [Scilit]
- Gao, J.; Zhang, L. How to restrict informal recycling of photovoltaic modules: Research on closed-loop supply chain decision-making of photovoltaic modules under different recycling subsidy policies. J. Clean. Prod. 2025, 531, 146904. [Google Scholar] [CrossRef] [Scilit]
- Alazraki, R.; Haselip, J. Assessing the uptake of small-scale photovoltaic electricity production in Argentina: The PERMER project. J. Clean. Prod. 2007, 15, 131–142. [Google Scholar] [CrossRef] [Scilit]
- Ahlborg, H.; Hammar, L. Drivers and barriers to rural electrification in Tanzania and Mozambique–Grid-extension, off-grid, and renewable energy technologies. Renew. Energy 2014, 61, 117–124. [Google Scholar] [CrossRef] [Scilit]
- Byrnes, L.; Brown, C.; Foster, J.; Wagner, L.D. Australian renewable energy policy: Barriers and challenges. Renew. Energy 2013, 60, 711–721. [Google Scholar] [CrossRef] [Scilit]
- Zhao, X.-G.; Feng, T.-T.; Cui, L.; Feng, X. The barriers and institutional arrangements of the implementation of renewable portfolio standard: A perspective of China. Renew. Sustain. Energy Rev. 2014, 30, 371–380. [Google Scholar] [CrossRef] [Scilit]
- Hu, J.; Harmsen, R.; Crijns-Graus, W.; Worrell, E.; van den Broek, M. Identifying barriers to large-scale integration of variable renewable electricity into the electricity market: A literature review of market design. Renew. Sustain. Energy Rev. 2018, 81, 2181–2195. [Google Scholar] [CrossRef] [Scilit]
- Yang, M.; Qu, S.; Ji, Y.; Abdoulrahaman, D. Vulnerability of fresh agricultural products supply chain: Assessment, interrelationship analysis and control strategies. Socio-Econ. Plan. Sci. 2024, 94, 101928. [Google Scholar] [CrossRef] [Scilit]

Disclaimer/Publisher’s Note: The statements, opinions and data contained in all publications are solely those of the individual author(s) and contributor(s) and not of MDPI and/or the editor(s). MDPI and/or the editor(s) disclaim responsibility for any injury to people or property resulting from any ideas, methods, instructions or products referred to in the content. |
© 2026 by the authors. Licensee MDPI, Basel, Switzerland. This article is an open access article distributed under the terms and conditions of the Creative Commons Attribution (CC BY) license.