5.1. Construction of the ISM Model for PV Participation in the Electricity Trading Market
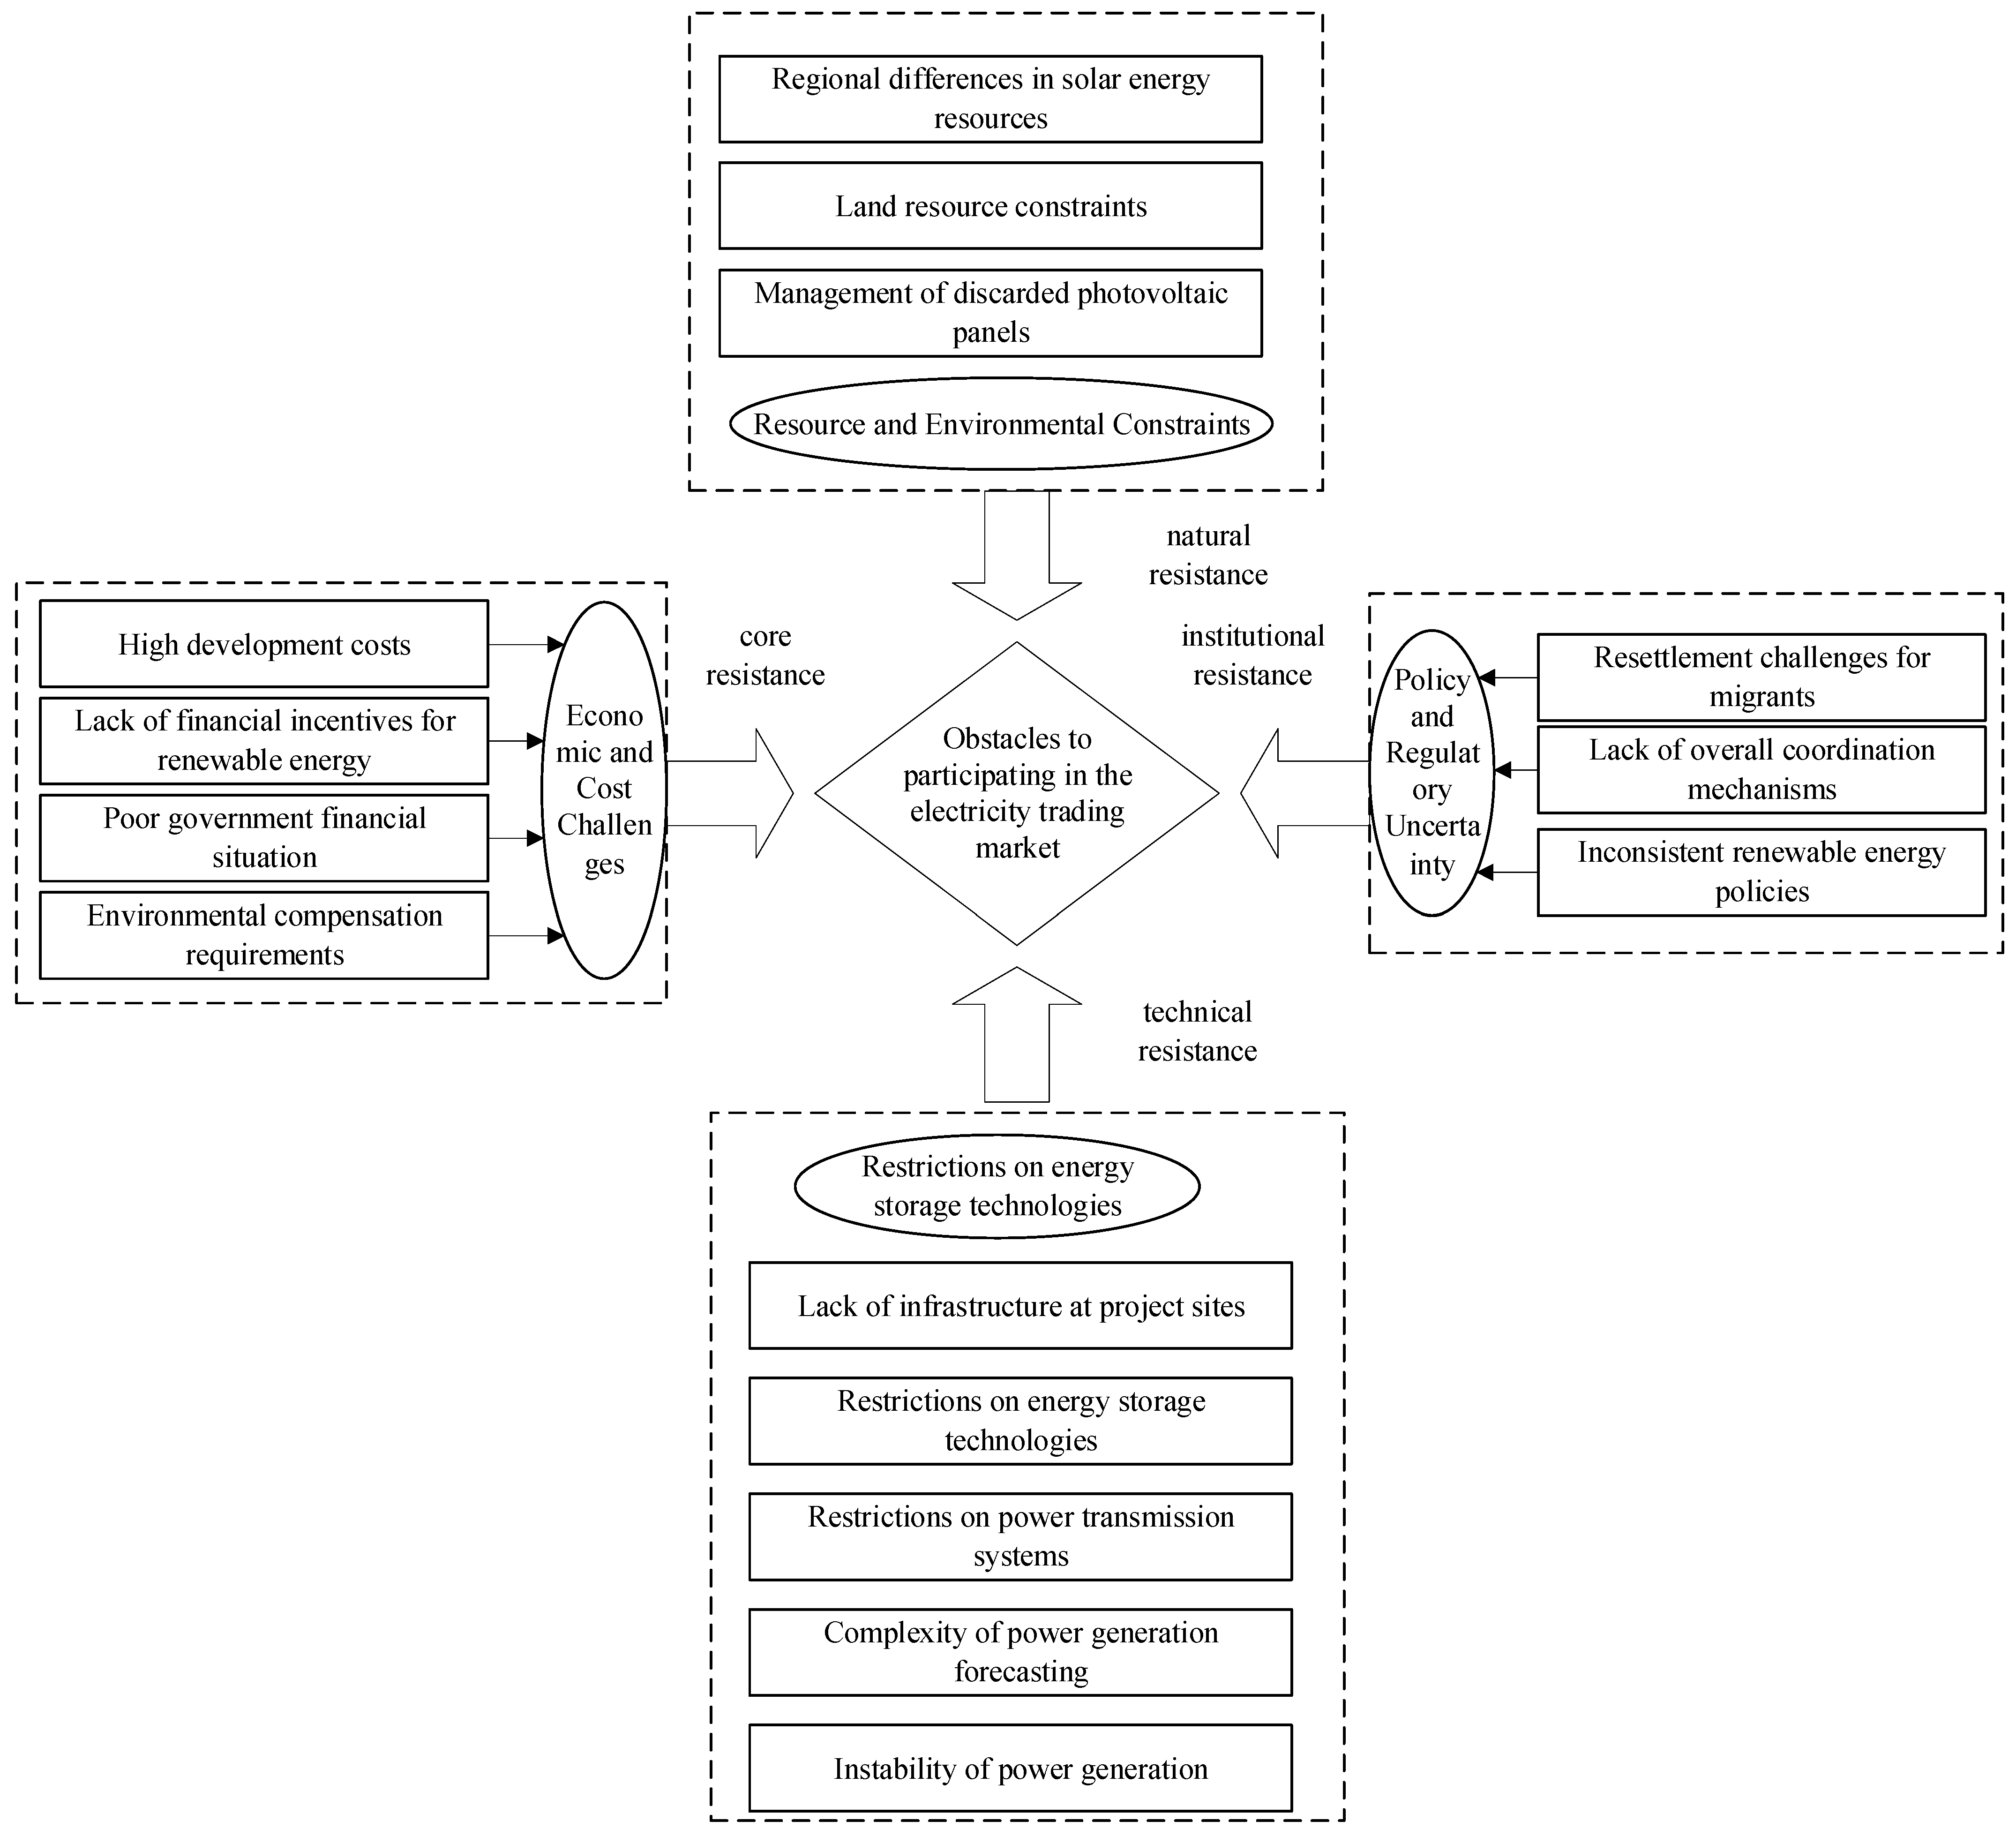
When applying the ISM model for analysis, the expert consultation method is often used to scientifically determine the influence relationships among system factors. This study first defines the 15 factors that hinder photovoltaic participation in the electricity trading market, as summarized earlier, as the set of barrier factors B for the ISM model, and assigns them the following codes: B1 High development costs, B2 Environmental compensation requirements, B3 Resettlement challenges, B4 Power transmission system restrictions, B5 Lack of financial incentives for renewable energy, B6 Lack of overall coordination mechanisms, B7 Lack of infrastructure at project sites, B8 Photovoltaic panel waste management, B9 Poor government financial conditions, B10 Inconsistent renewable energy policies, B11 Complexity of power generation forecasting, B12 Energy storage technology restrictions, B13 Regional solar energy resource differences, B14 Power generation instability, and B15 Land resource restrictions.
Subsequently, we distributed questionnaires via email to 20 experts (including 10 university scholars and 10 government department managers) in the field of photovoltaic and electricity trading research. The selection criteria for experts are as follows: (1) University scholars (n = 10): All hold the title of associate professor or above, with their research directions closely related to photovoltaic grid-connection technology or electricity market mechanisms. They have published at least 5 SCI/SSCI papers in relevant fields as the first author or corresponding author. (2) Government department managers (n = 10): They have directly participated in or been responsible for the formulation of renewable energy policies at the provincial level or above, the supervision of electricity market operations, or related project management, and possess at least 8 years of industry management experience. Detailed information about the experts can be found in
Appendix A. These expert resources are primarily sourced from the expert pool accumulated through the project “Suggestions on the Path and Mechanism for Hebei’s New Energy to Participate in the Electricity Market.”
Based on the results of the first round of expert questionnaires, we preliminarily determined the direct influence relationships among the obstacle factors and constructed an initial adjacency matrix. To verify and optimize these judgments, this study adopted the Delphi method for multiple rounds of iteration. After summarizing the first-round results, we anonymously fed them back to all experts. The experts then made a second round of independent judgments based on the collective opinions and engaged in in-depth discussions on relationships with divergent views. This iterative process continued for two rounds until the opinions of all experts stabilized and no significant changes occurred. For influence relationships that still had divergent opinions after multiple rounds of discussion, this study set a consensus threshold: Only when over 90% of the experts identified a direct influence relationship between two factors was the relationship finally included in the model. The setting of this 90% threshold refers to classic Delphi research methods, which are widely used to define “high consensus.” It aims to ensure that each influence relationship finally determined has received overwhelming support from the expert panel, thereby significantly enhancing the reliability and robustness of the input data for the ISM model. Ultimately, based on the expert consensus obtained through this process, we obtained a definitive adjacency matrix for subsequent ISM analysis.
Ultimately, the unique adjacency matrix
is determined, where:
is the number of barrier factors,
is the matrix element, and
are the barrier factor codes. If
has a direct influence on
, then
is 1; if
has no direct influence on
, then
is 0. It is a matrix with only 0, 1 elements, as shown in
Table 3.
According to the formula
, calculate
,
, …,
in sequence. Here,
represents the identity matrix of the same order as the adjacency matrix
, used to reflect the accessibility of the factors themselves, and
is the number of operations. Based on this, the accessible matrix
is calculated through Matlab 2022b programming, as shown in
Table 4.
Based on the accessible matrix M, calculate the reachable set and the antecedent set for all factors. If , then is the highest-level factor set. After finding the highest-level factor set, the corresponding rows and columns in the accessible matrix can be crossed out accordingly. Then, a new highest-level factor is sought from the remaining matrix.
This calculation is performed iteratively until the factor sets contained in each level are found.
Table 5 shows the final hierarchical results.
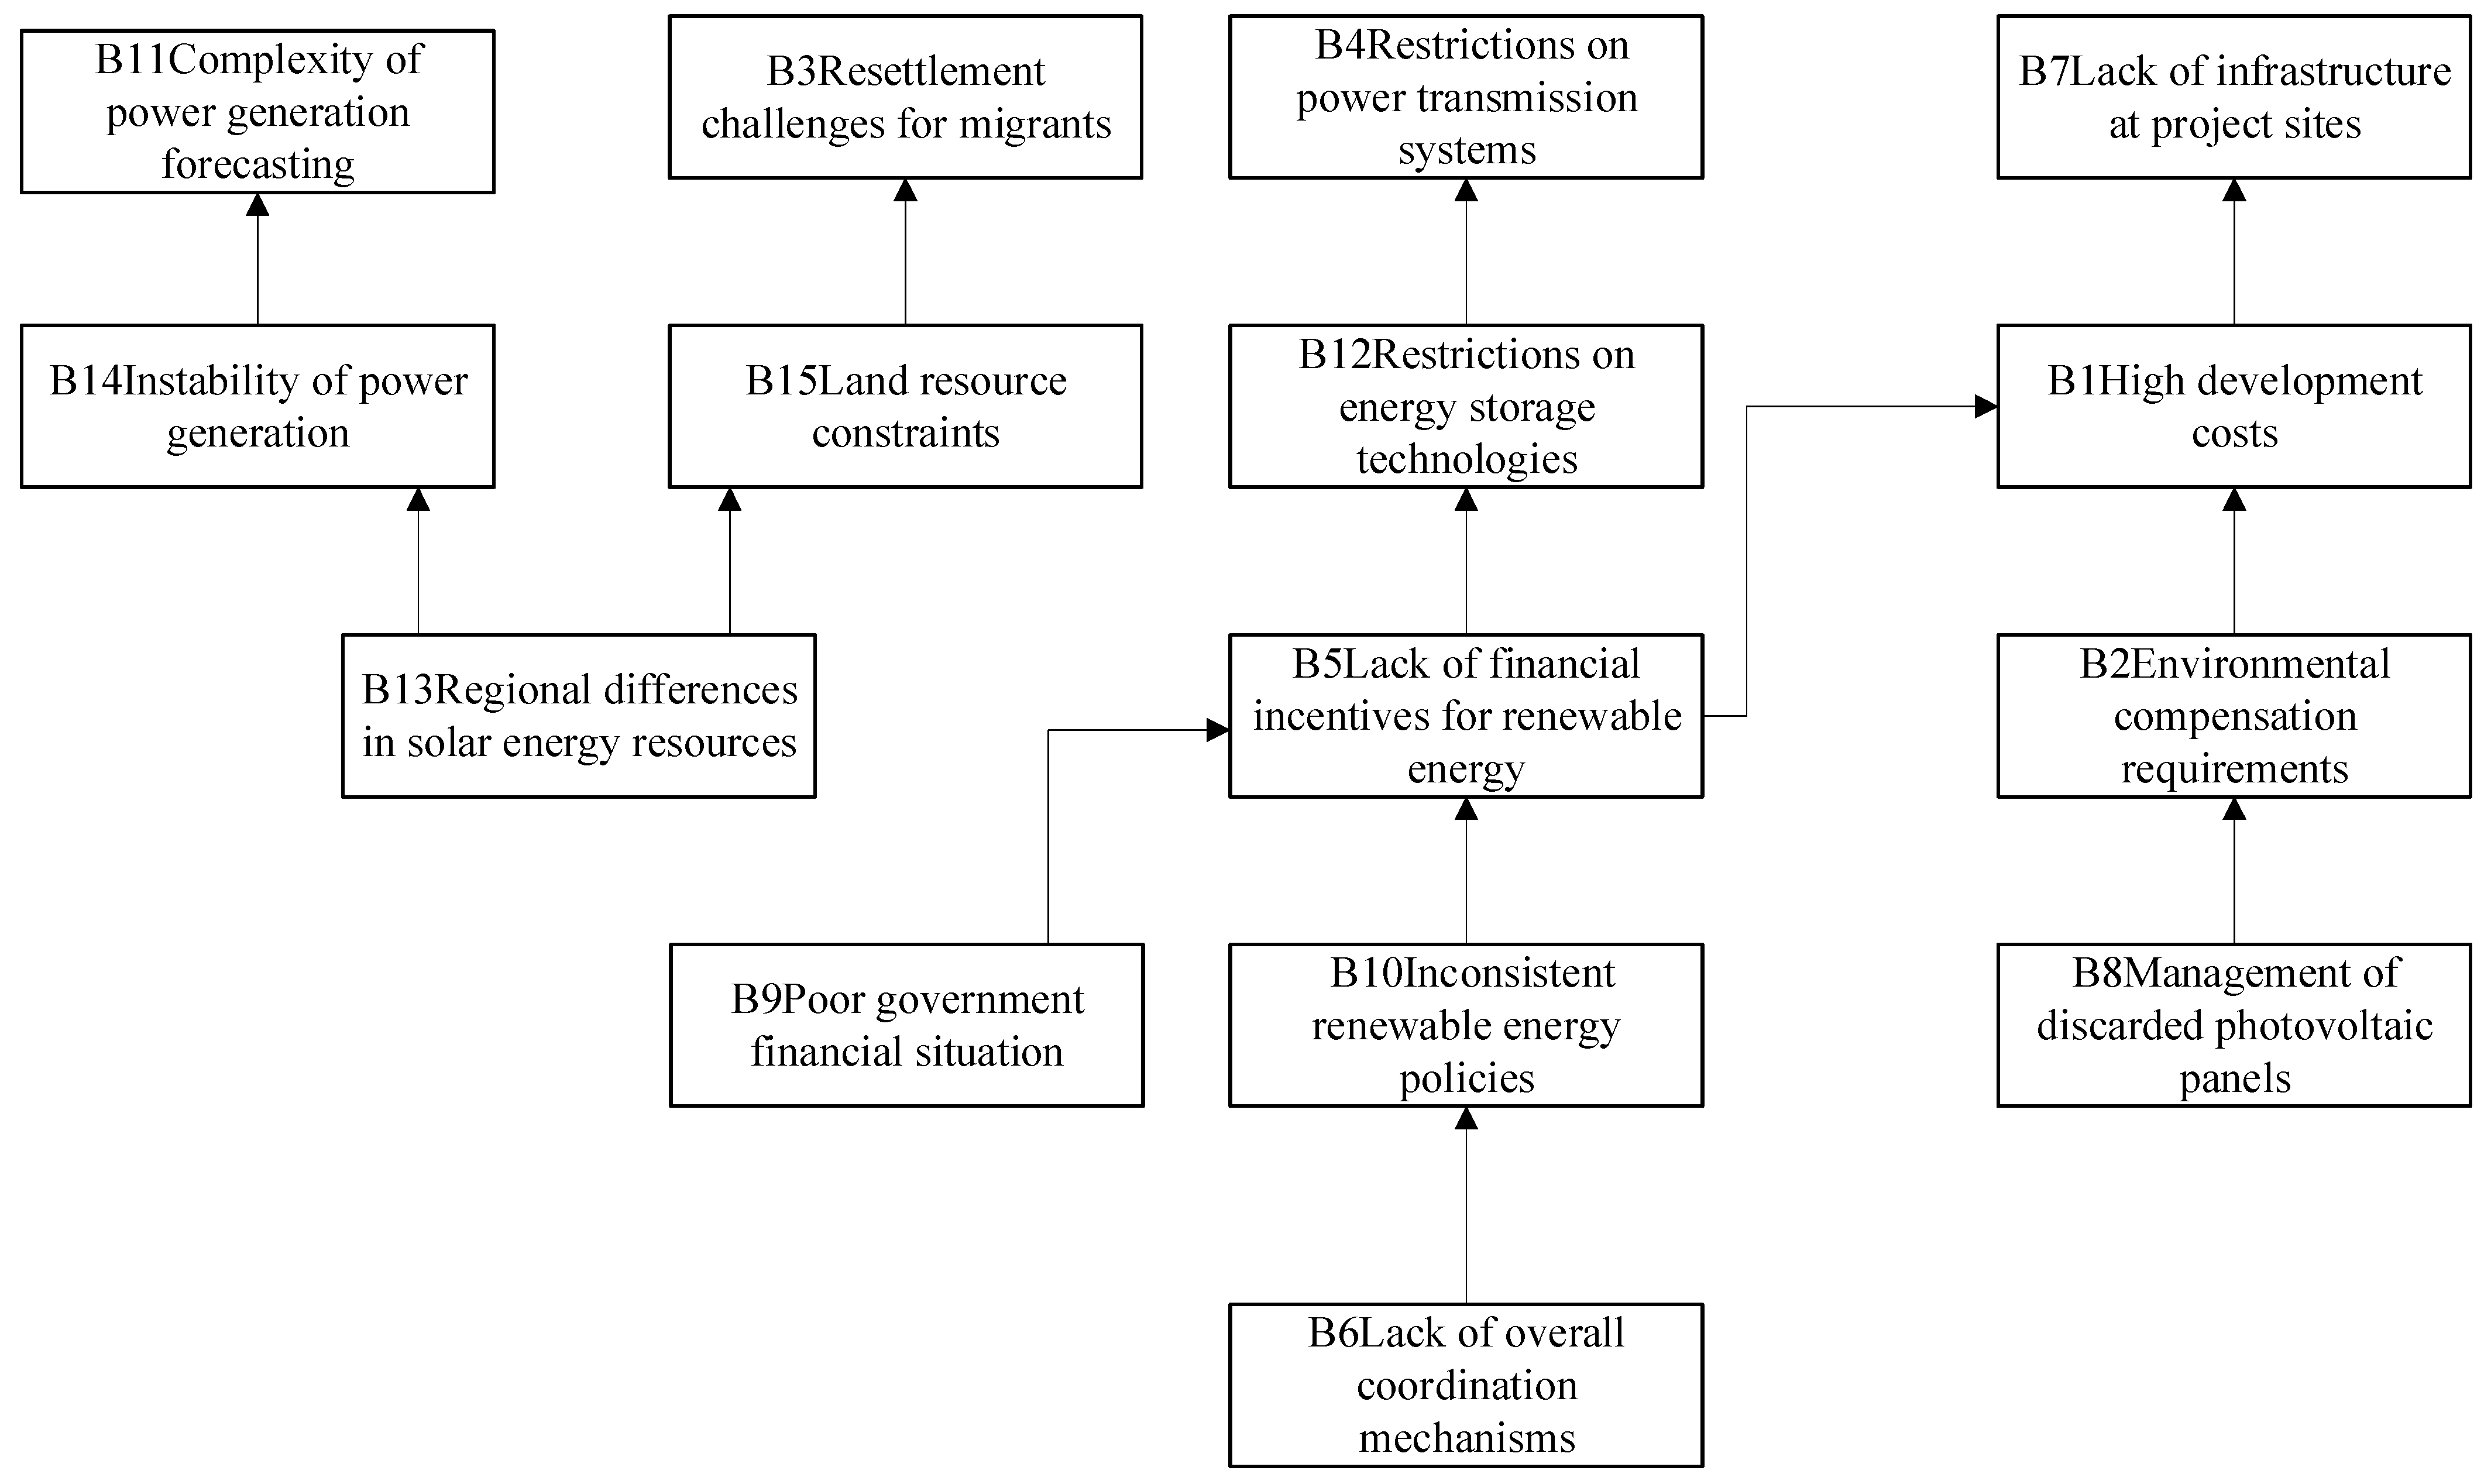
Based on the aforementioned hierarchical division, an explanatory structure model of the factors influencing social media information impact has been constructed, as shown in
Figure 2.
Figure 2 illustrates the hierarchical structure of barriers to PV participation in electricity trading markets, organized into five interdependent levels. These barriers form a multilayered system where each level interacts with others through various channels, collectively impeding PV integration. At the top level, B3, B4, B7, and B11 emerge as the most critical endpoints—representing the culmination of the system’s obstructive forces and serving as the dominant constraints within the overall framework. The full set of barriers functions as a cohesive and inseparable system.
The second level comprises generation instability, limitations in energy storage technologies, land resource constraints, and high development costs. Variability in geography and climate results in uneven solar resource distribution, which in turn affects the consistency of PV generation and narrows location options for PV project development. Financial incentives are instrumental in advancing technology adoption; the absence of targeted support—such as subsidies, tax relief, or R&D funding—stifles progress in energy storage technology. Additionally, the lack of renewable energy subsidies forces investors to shoulder greater risk, thereby escalating development costs.
The third level includes regional disparities in solar energy potential, insufficient fiscal support for renewables, and environmental compensation requirements. Among these, regional solar disparities—primarily driven by natural factors—exist relatively independently within the system, receiving little influence from other barriers. In contrast, poor government finances have a direct effect on the availability of renewable energy incentives, with fiscal stress potentially leading to subsidy cutbacks or cancellations. Moreover, improper handling of decommissioned PV panels poses risks of ecological damage, such as contamination of land and water sources. To mitigate such harm, compensatory measures are often required to restore ecosystem functions.
Sensitivity check: To examine whether minor changes in expert judgments could substantially affect the ISM hierarchy, we conducted a one-at-a-time perturbation analysis on the final adjacency matrix. Specifically, we flipped one relationship at a time (i.e., changing a single entry from 1 to 0 to mimic a conservative reassessment of a direct influence), recomputed the reachability matrix via transitive closure, and repeated the standard ISM level partition procedure. Overall, the hierarchical structure proved robust: the five-level architecture was retained in 11 out of 13 single-link deletion tests (84.6%), and the top-level barrier set {B3, B4, B7, B11} remained unchanged in all tests (100%). At the factor level, on average 93.3% of barriers preserved their original level assignment under these minor perturbations. These results indicate that the main structural findings are not driven by isolated expert judgments while also highlighting that a small subset of relationships may exert disproportionate influence on the hierarchy.
5.2. Driving Force—Dependency Analysis
The cross-influencing factor matrix multiplication method is an analytical approach used to examine the influence and dependency relationships among various factors within a system. Based on the principle of matrix multiplication, this method analyzes the mutual relationships between factors by calculating the cross-influencing factor matrix multiplication. The results are represented using coordinate axes, where the horizontal axis represents dependency and the vertical axis represents driving force. The driving force value of factor
is the sum of the elements in the row where the element
in the reachability matrix is located, and the dependency value of factor
is the sum of the elements in the column where the element
in the reachability matrix is located. A greater driving force indicates that the formative factor has a stronger influence on other factors, while a greater dependency implies that the formative factor is more reliant on other factors. The research results are shown in
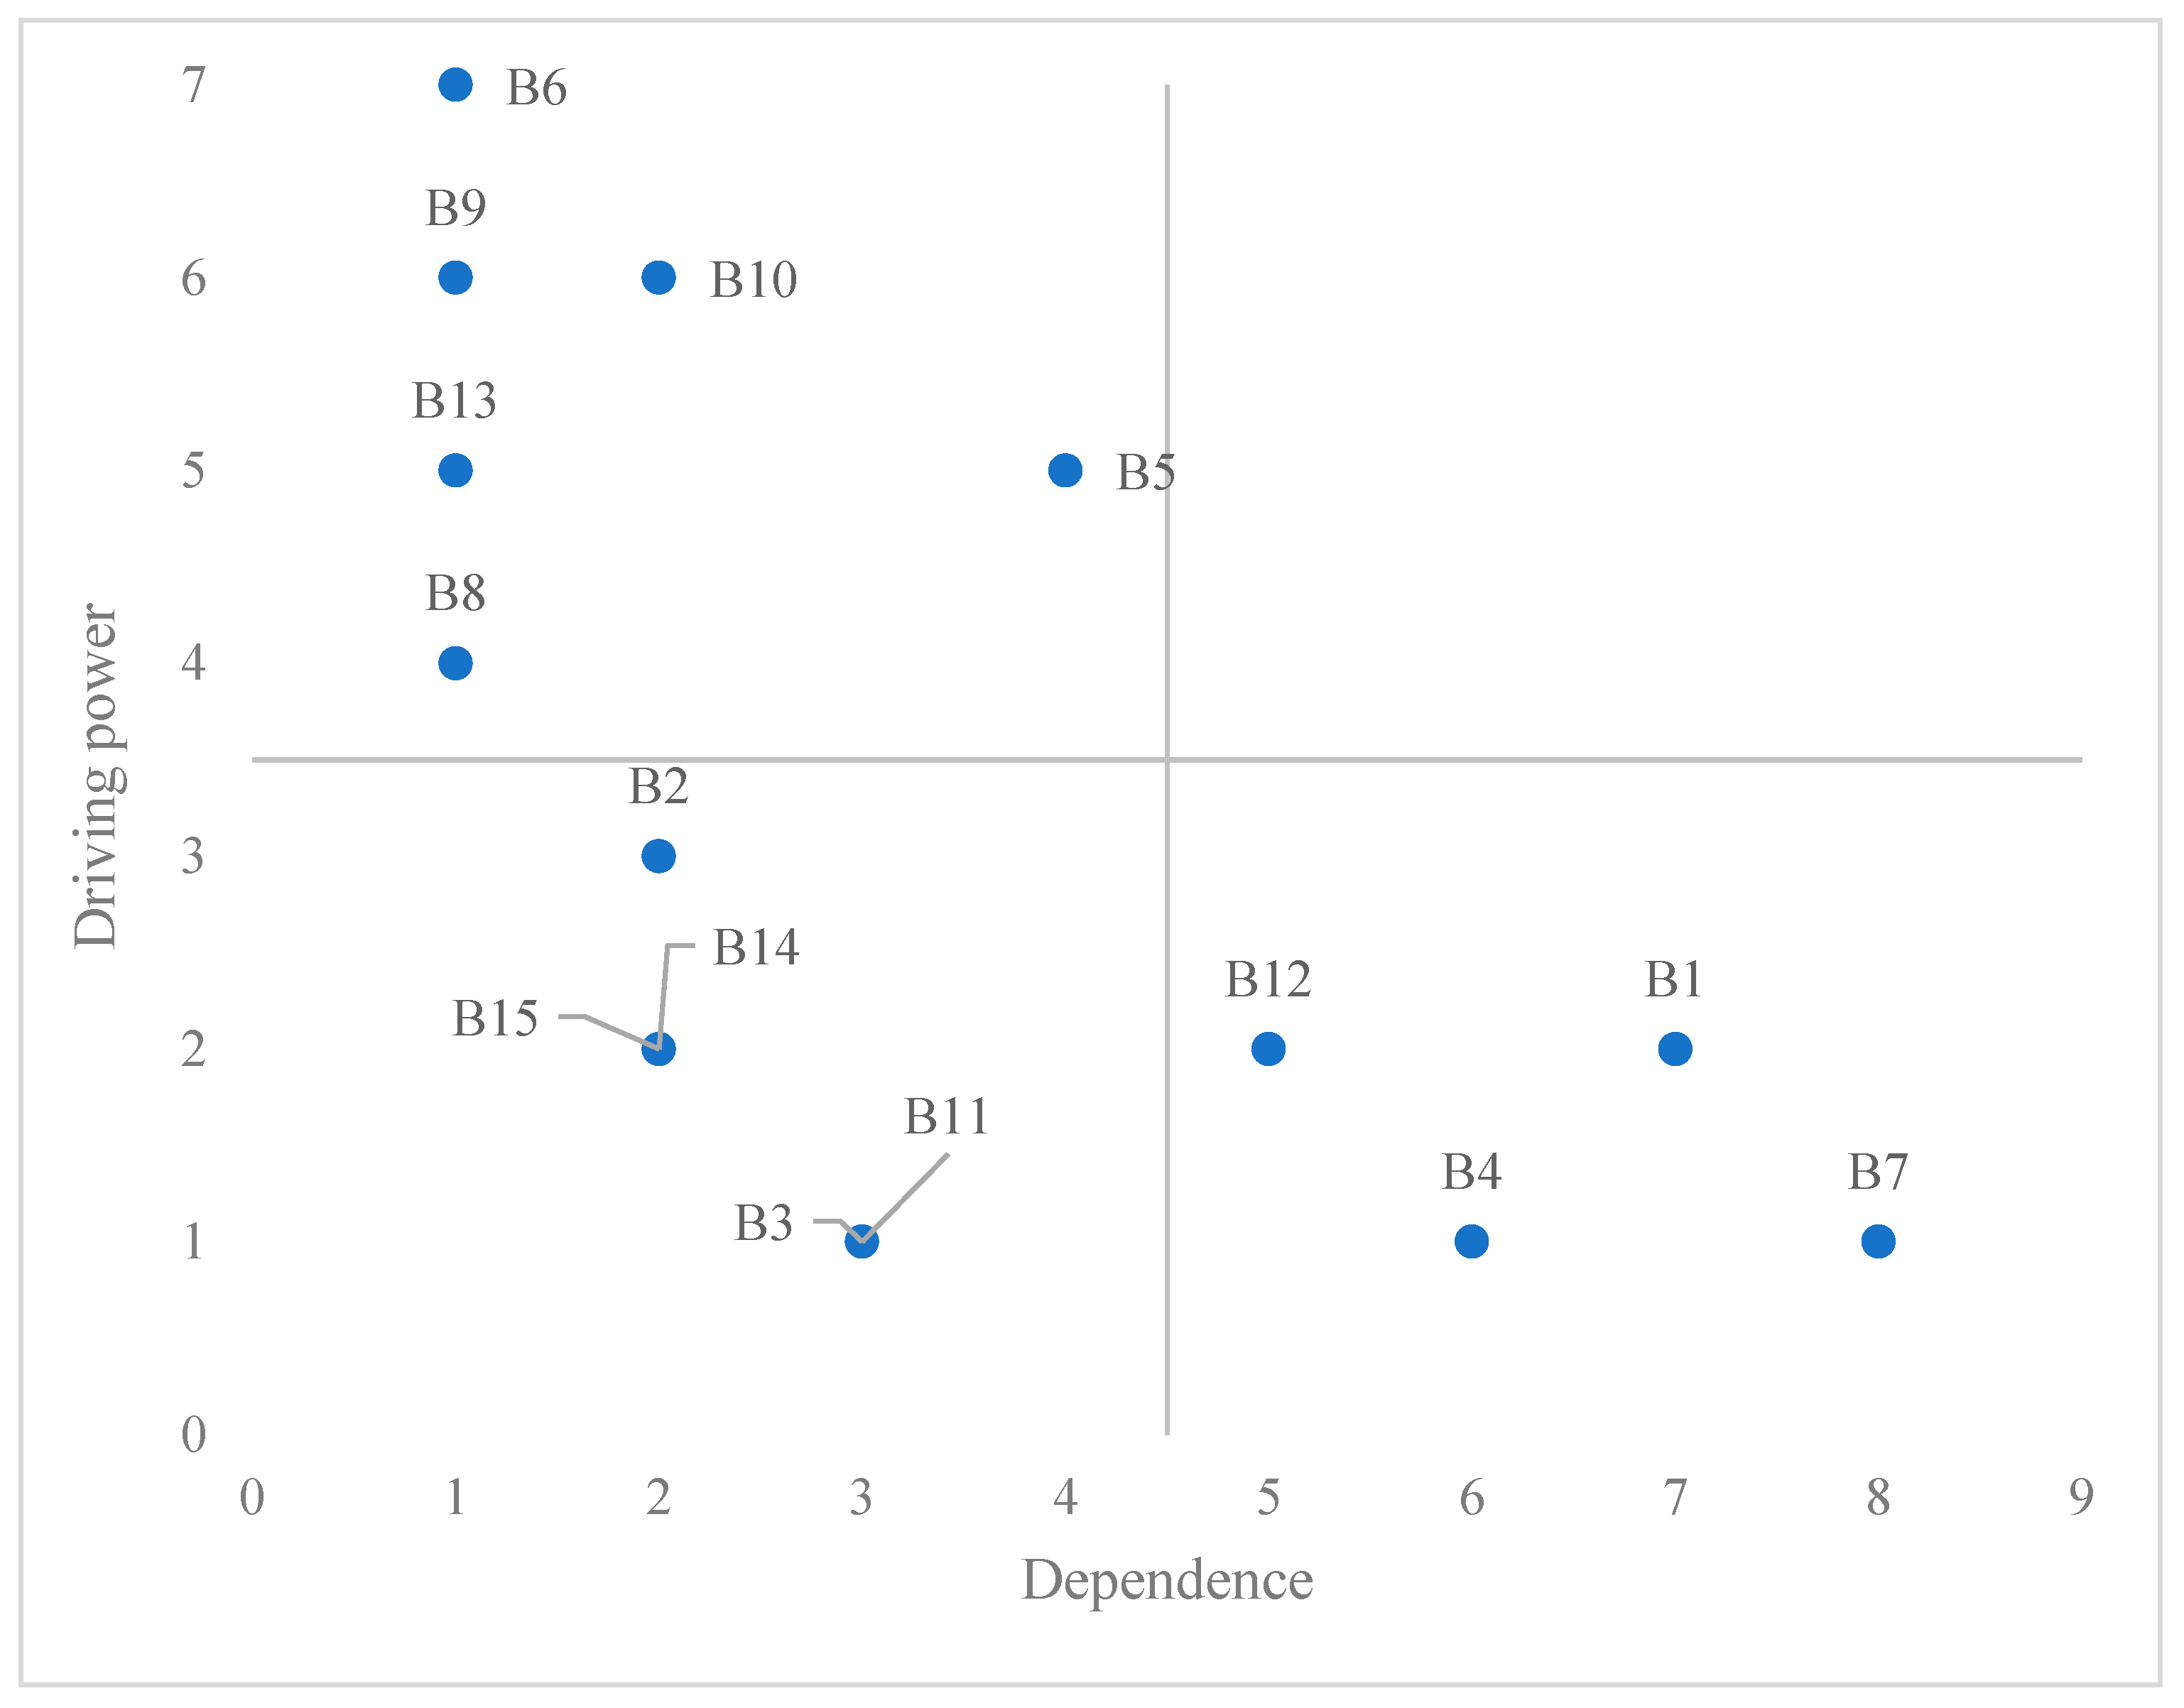
Table 6. Using dependency as the horizontal axis and driving force as the vertical axis, a driving force—dependency two-dimensional coordinate graph is constructed based on the values of driving force and dependency, and the formative factors are classified into four clusters, namely, the Connected Cluster (I), the Independent Cluster (II), the Spontaneous Cluster (III), and the Dependent Cluster (IV), as illustrated in
Figure 3.
The first quadrant, or linkage cluster, is typically composed of factors with both high dependence and high driving power. In this study, none of the identified barriers fall into this quadrant, suggesting that the factors extracted exhibit high independence and do not form ambiguous or entangled clusters.
The second quadrant, representing the independent cluster, includes B6, B9, and B10. These align with the root-level drivers identified in the ISM model. Such factors have strong influence but are minimally affected by others. Their changes tend to cascade throughout the system, triggering shifts in other dependent factors. Hence, targeting these high-leverage points can enhance overall control of the system.
The third quadrant, known as the autonomous cluster, consists of B2, B3, B11, B14, and B15. These factors have limited influence and weak dependence, indicating that their effect on the system’s overall dynamics is minor. However, several—such as B2, B14, and B15—occupy intermediary positions in the ISM hierarchy. They function as bridges, mediating between upper- and lower-level barriers.
The fourth quadrant, or dependent cluster, features high dependence and low driving power. It includes B1, B4, B7, and B12, all of which are sensitive to upstream factors. For instance, B4 and B7, located at the first level of the ISM model, are especially vulnerable to changes in higher-level drivers, suggesting that indirect intervention through other barriers may be most effective.