


Abstract
The Lake Worth Lagoon is an urban subtropical estuary impaired by discharge conveyed through the C-51 canal. To date, the origin of impairment has not been rigorously demonstrated. This study successfully applied a balance-of-flow framework to identify the predominant water source(s) conveyed to the S5A Complex, located at the headwaters of the C-51 canal. The results reveal distinct seasonal differences. During the dry season, water delivered to the S5A Complex was predominantly derived from Lake Okeechobee. During the wet season, agricultural runoff was the predominant source. Over the duration of the study, S5A Complex water management operations released 72% of the annual flow into the C-51 canal during the dry season. During the wet season, the predominant source of water flowing through the C-51 canal was locally derived from urban stormwater runoff. These findings contradict previous studies that have reported that Lake Worth Lagoon pollutant loads are derived from wet-season agricultural runoff. The analysis also revealed that recent construction upgrades designed to improve the quality of water released to the northern Everglades have (1) reduced the volume of lake water delivered to the S5A Complex during the dry season and (2) created a novel water source that, at times, contributes substantially to the S5A Complex. The results of this study deviate substantially from the currently accepted paradigm regarding the origin of Lake Worth Lagoon impairment, thus affirming the value of the periodic reassessment of adaptive management plans to ensure resource management and restoration strategies are based upon the best available information.
1. Introduction
Globally, historic surface water diversion projects constructed to mitigate flooding and facilitate resource development (e.g., energy, agriculture) have resulted in the extensive degradation of coastal zone geomorphology, water quality, and ecosystem function [1,2,3,4]. In South Florida, water diversion projects designed to drain the Everglades began in the 1880s and now consist of a complex network of canals and water control structures (1) centered on Lake Okeechobee (LO, abbreviations defined in Table 1) and areas to the south (e.g., Everglades Agricultural and Water Conservation Areas), (2) extending northward (i.e., Kissimmee River basin), as well as (3) westward to the Gulf of Mexico, and (4) eastward to the Atlantic coastline (Figure 1).
Table 1.
Key to abbreviations.
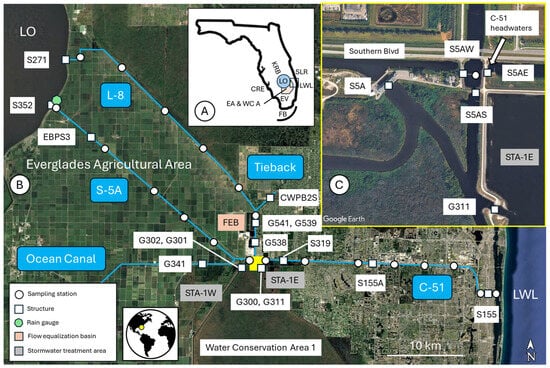
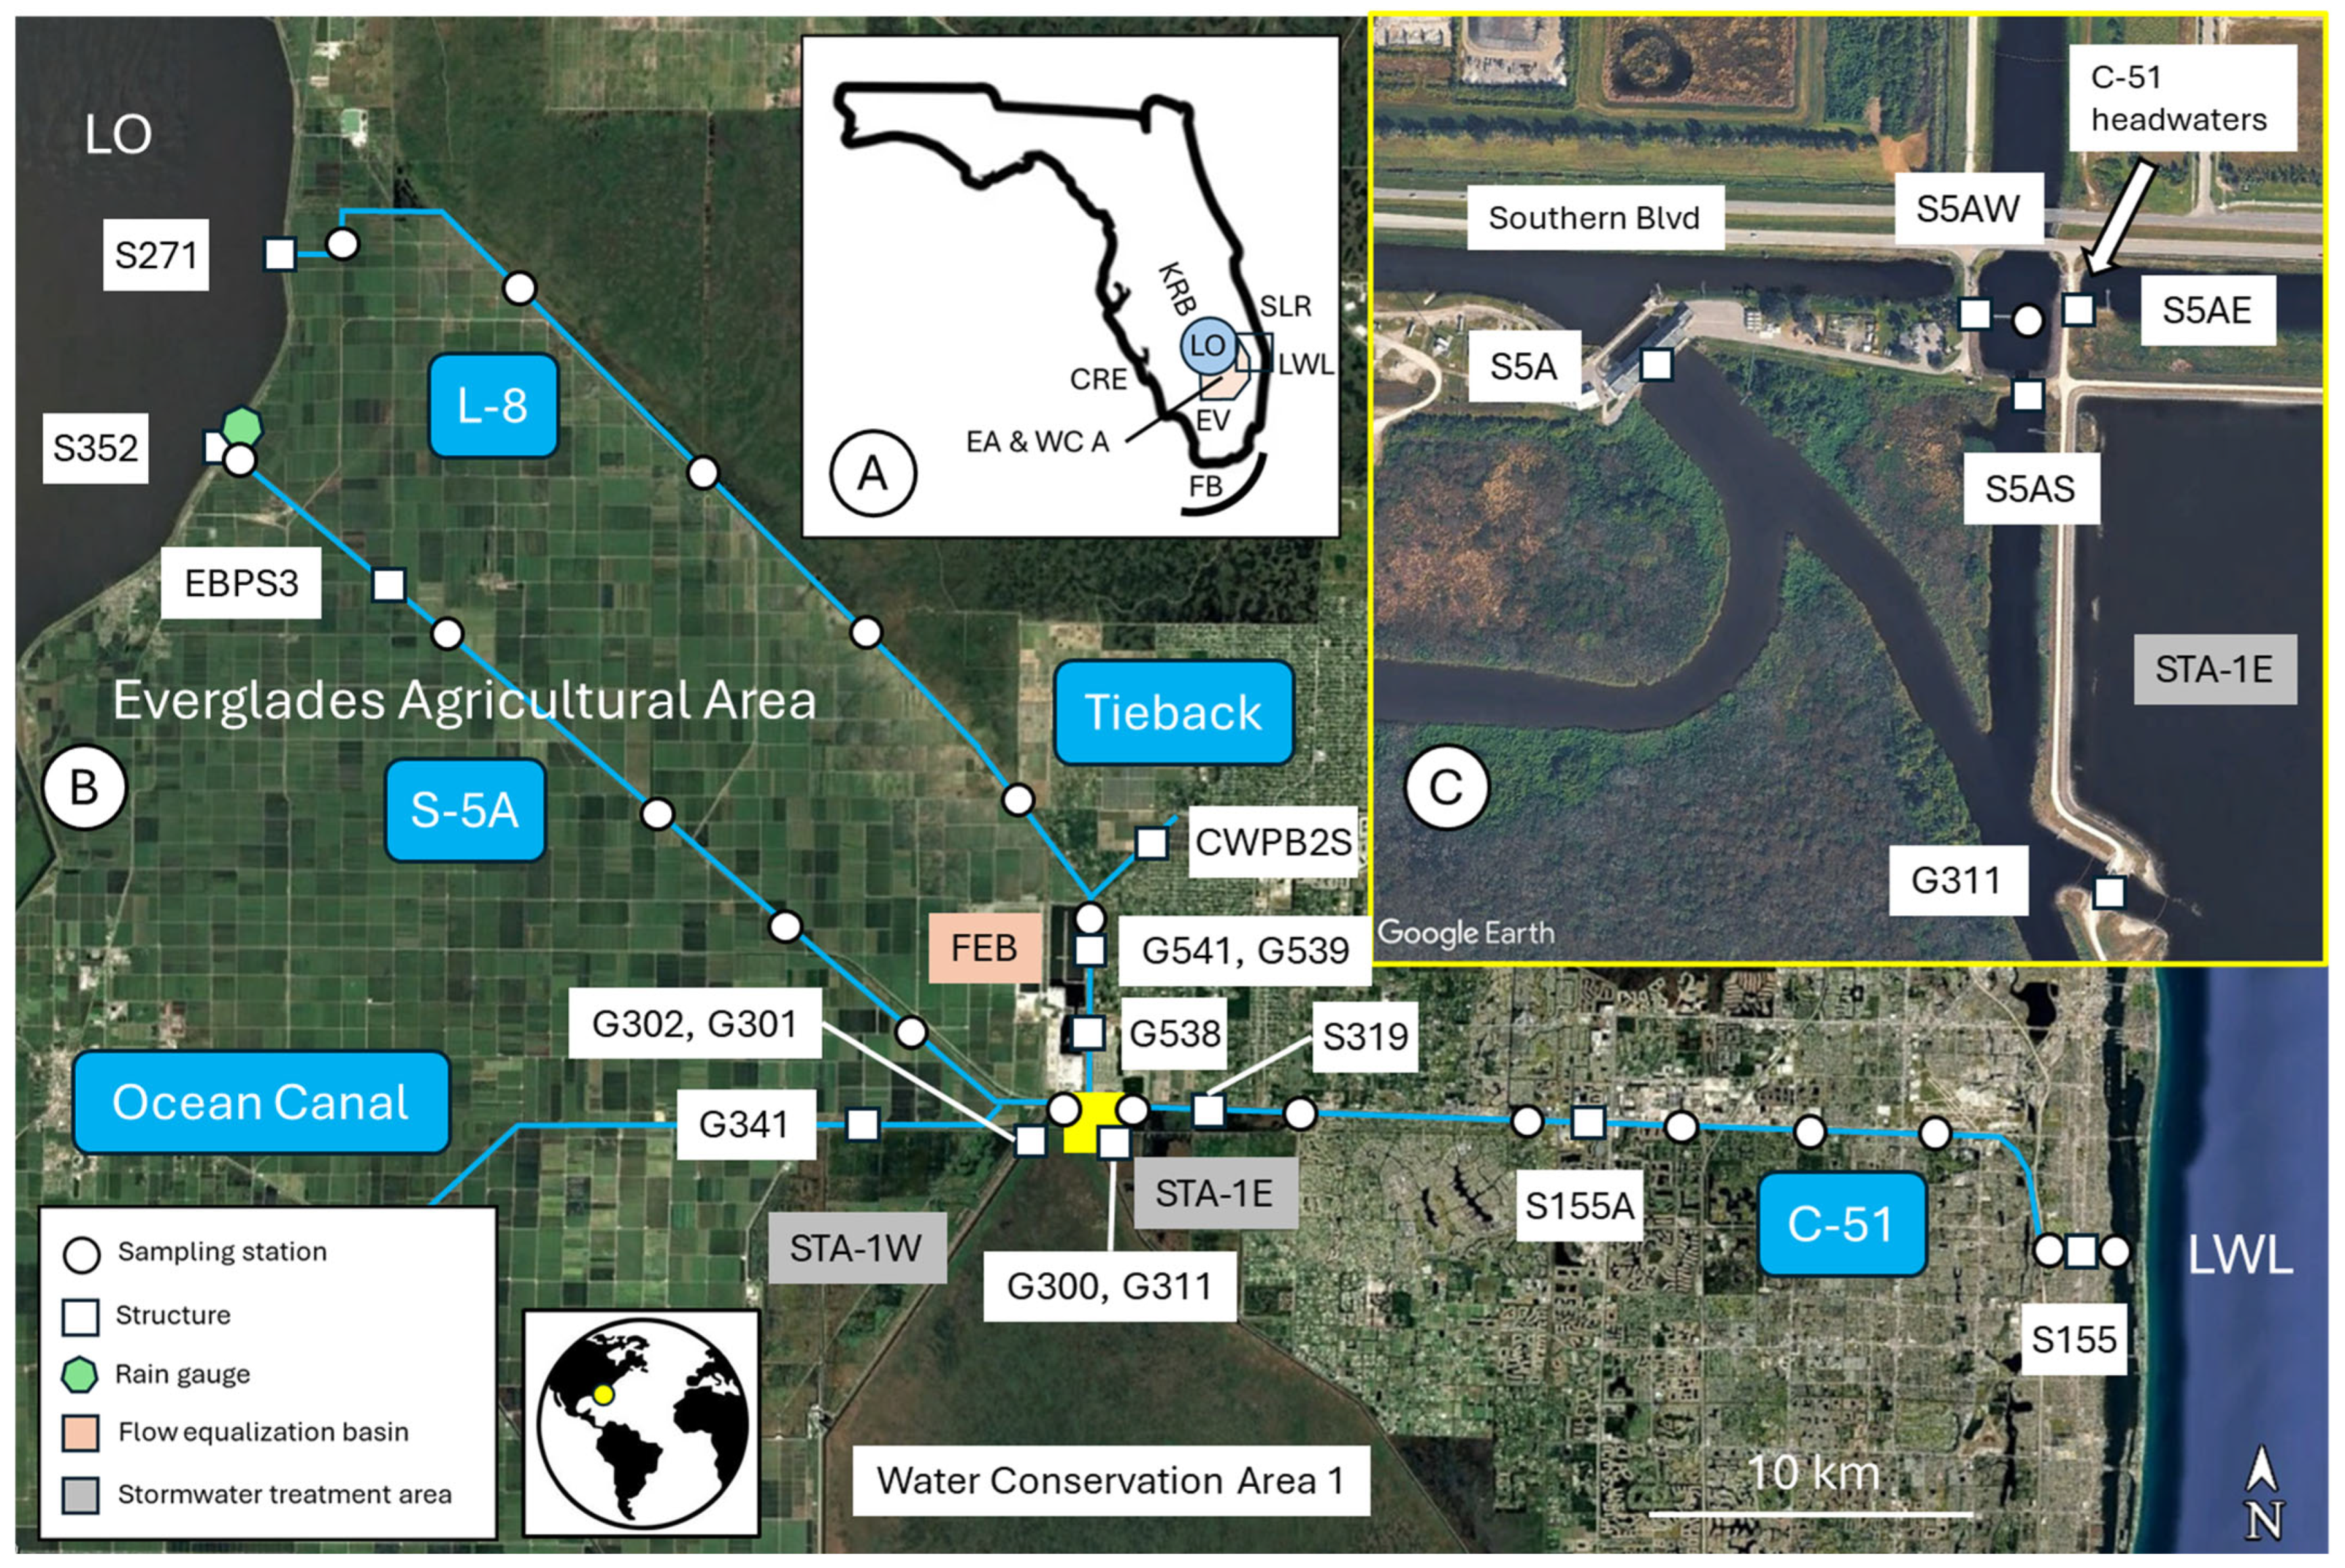
Figure 1.
(A) (inset) Map of Florida showing location of study domain (black box). (B) Location of canal sampling stations, water control structures, rain gauge, and basins. (C) (inset) Eastern half of the STA Inflow Basin and S5A Complex showing location of the C-51W headwater structure S5AE. See Table 1 for key to abbreviations.
On the peninsula’s mainland, this has resulted in soil compaction, saltwater intrusion, loss of key landscape features (e.g., tree islands), and substantial shifts in native plant community distribution [5]. On the coasts, the diversion of freshwater has resulted in water quantity and quality impairment of estuaries (e.g., Caloosahatchee River, St. Lucie River, and Lake Worth Lagoon), bays (e.g., Florida Bay), and coral reefs yielding losses of essential habitat (e.g., seagrass meadows and oyster reefs), harmful algal blooms [6,7,8,9,10,11], and a decline in reef resilience [12]. In 1991, the Everglades Protection Act was enacted with the goal of restoring the southerly ‘environmental flow’ [13] of nutrient-limited water to the Everglades. To achieve this goal, several stormwater treatment areas (e.g., STA-1W, Figure 1), reported as the largest in the world [14], were constructed along the perimeter of the Everglades Agricultural Area (EAA). While there has been substantial progress in Everglades restoration, the reduction of Gulf of Mexico and Atlantic coast water quantity and quality impairment has received less attention.
The Lake Worth Lagoon (LWL) is a ~34 km long urban estuary located on the Atlantic Coast that has been substantially degraded by freshwater diversion into the lagoon through the C-51 canal outfall. The origin of the C-51 canal pollutants has historically been attributed to stormwater runoff [6,15]. The estuary is designated as impaired for nutrients (i.e., TN and TP), chlorophyll, and copper [16]. The C-51 canal conveys contaminated sediment (e.g., heavy metals and phosphorus) to the lagoon at levels which exceed the State of Florida’s regulatory thresholds [17,18]. The cumulative effect of these discharges includes reduced seagrass coverage, density, and species composition [6,18,19].
Trefry et al. [20] concluded that the source of LWL impairment was from areas ‘further west’ of the C-51 canal (i.e., the EAA) based upon a spatial and temporal analysis of metal ratios in sediments obtained from the lagoon and C-51 canal. The EAA canal network receives water from LO and agricultural runoff, both of which are subject to Best Management Practices (BMPs) to reduce disproportionally high levels of phosphorus [14,21,22]. They recommended that additional work be performed in the EAA to better constrain the origin of LWL impairment. However, to date, a rigorous evaluation of the sediments and water flowing from LO and through the EAA has not been conducted. After Trefry’s work, a significant redesign and expansion of STA-1W (Figure 1) was initiated to upgrade the existing configuration of 1545 ha and four cells to 4375 ha and eleven cells. The upgrades were designed to reduce phosphorous concentrations discharging into the headwaters of the Everglades through Conservation Area 1 (CA 1; [14]). Additionally, a 950-acre flow equalization basin (FEB) with a storage capacity of ~15 billion gallons was constructed to improve the ability of water managers to maintain optimal water levels and reduce the frequency of dry-out conditions in STA-1E and STA-1W by temporarily storing runoff during peak flow. Construction upgrades to STA-1W were completed in two steps that began in November 2015 and were completed in December 2024 [23]. The FEB was operational in 2018. To date, the efficacy of these upgrades on water flow and LWL pollutant flux has not been described.
This investigation utilized a balance of flow (BOF) or daily water balance [9] to (1) apportion the sources of water (e.g., LO, runoff) flowing into the headwaters of the C-51 canal (i.e., S5A Complex) and (2) assess C-51 water management operations to determine the seasonal contribution of headwater flow at the point of discharge or outflow into LWL. The analysis considered data collected from 1 May 2024 to 1 May 2026. This interval coincided with three field campaigns undertaken to quantify sediment and water geochemistry corresponding to the conditions of flow and related source allocations during the wet (1 May to 31 October) and dry (1 November to 30 April) seasons. Additionally, a comparison between the conditions of flow before and after construction of the water quality improvement projects described previously was undertaken to assess what effect, if any, the upgrades had on the predominant sources of sediment and water flowing into the S5A Complex. All of the work described herein was part of a larger research project designed to identify the origin of pollutants contributing to the impairment of the LWL.
2. Study Area
The project study domain extends from LO to LWL. This investigation focused on three primary canals (i.e., L-8 North, L-8 South, and S-5A) and basins (i.e., FEB, STA-1 Inflow Basin, and S5A Complex) located in the western half of the study domain. The L-8 canal was constructed along the northern edge of the EAA to divert wet-season runoff to LO or tide (i.e., the coast). The watershed covers ~41,000 hectares, and the canal is 41 km long. It is subdivided into two segments. The L-8 North segment begins at the S271 headwater structure located along the shores of LO. The L-8 North canal terminates at the G541 tailwater structure located at the north end of the L-8 South canal segment. A third structure, CWPB2S, is a water supply pump station located on the L-8 Tieback canal (Tieback, Figure 1), which connects about 2 km north of G541.
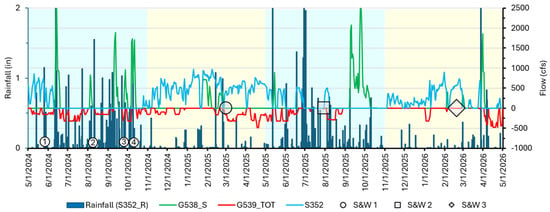
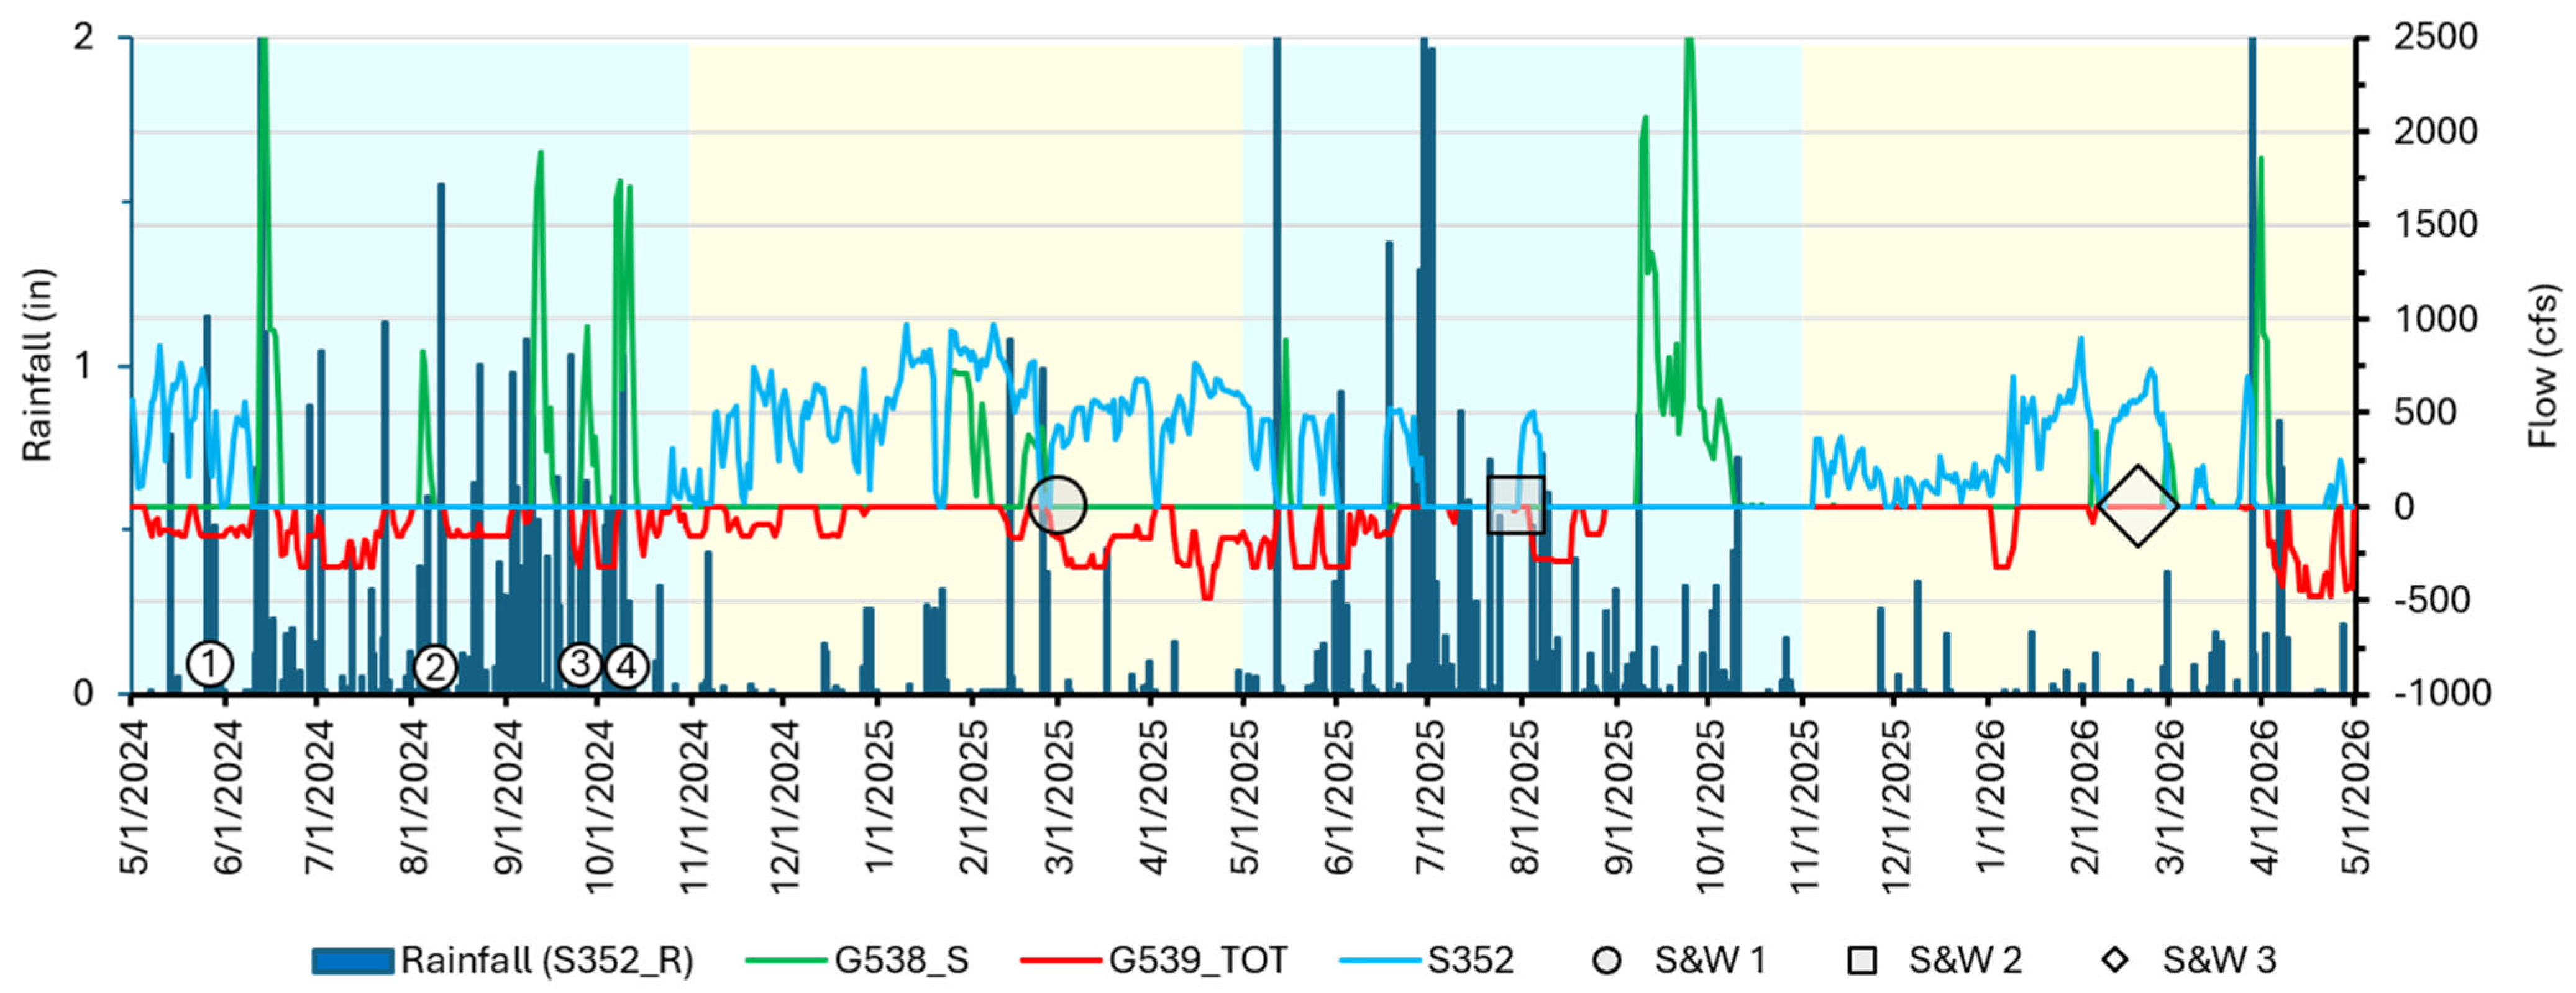
The L-8 South segment is ~5 km long and located adjacent to the L-8 FEB. This segment has no watershed and extends from the headwater structure G541 to Southern Boulevard, along the northern boundary of the S5A Complex (Figure 1). There is no tailwater structure separating the L-8 South canal from the S5A Complex. Water is directed into the FEB through G538 in pulses of short duration (i.e., days to weeks) and high flow (>750 cubic feet per second; cfs) (Figure 2).
Figure 2.
FEB hydrologic conditions. Lake Okeechobee outflow through S-5A headwater structure S352 was relatively low during the wet seasons (blue) and higher in the dry season (yellow). The relatively high and persistent S352 discharge during 2024–2025 dry-season differences related to LO-stage recovery operations. Pulsed FEB inflow consisting predominantly of S-5A agricultural runoff through the G538 structure occurred more frequently during the wet seasons and exceeded 750 cfs during four tropical rainfall events. This water was released into the C-51 headwater structure (S5A Complex) via L-8 South through G539 as a steady, low flow. Circled numbers: 1 = tropical depression, 2 = Tropical Storm Debbie, 3 = Hurricane Helene, and 4 = Hurricane Milton.
It then moves through a series of six interconnected cells before reaching the G539 pump station, where water is discharged into L-8 South at a sustained (i.e., weeks to months), low rate of flow (<250 cfs). This modulation of stormwater flow is necessary to maintain environmental conditions in the STAs that promote the biogenic processes responsible for phosphorus removal, as required to achieve state water quality standards [24]. The residence time of water within the FEB is unknown. While nutrient removal was not a design function of the FEB, changes in the geochemical composition of water flowing through the structure are expected, in part related to the influence of groundwater seepage and evaporation [25] over the duration of its residence time. Additionally, changes in the suspended load or TSS are likely to occur as the water progresses through the basin. However, to date, this has not been quantified. For these reasons, in this study the FEB was treated as a novel point source, in addition to and distinct from LO and EAA runoff.
In the S-5A watershed, flow is managed to minimize the flooding of agricultural lands during the wet season and provide water supply for agricultural and conservation use during the dry season. The watershed encompasses ~50,000 hectares, and the canal is 34 km long. It originates at the S352 headwater structure on LO and terminates at the S5A pump station, located at the headwaters of the STA-1 Inflow Basin. Three additional structures control water flow into or out of the S-5A canal. The first is EBPS3, located ~6 km east of the S352 headwater structure, which exchanges water between the canal and adjacent agricultural lands. The second is the G341 structure located on the Ocean Canal, which confluences S-5A about 2 km west of the S-5A tailwater pump station. In the balance-of-flow analysis, water flowing through both structures and into the S-5A canal was allocated to runoff. A third structure, S5AW, controls water flow between the S-5A canal and the S5A Complex.
The STA-1 Inflow Basin is ~200 hectares and consists of a network of short canals (<2 km) and six structures. Water from the S-5A canal enters the basin at the S5A pump station and may subsequently be diverted into STA-1W through G302, into Water Conservation Area 1 (CA1) via S301 and G300, into the S5A Complex through S5AS, or into STA-1E via G311.
The S5A Complex is a ~50-hectare basin located at the nexus of the L-8 South canal, the S-5A canal, the STA-1 Inflow Basin, and the C-51W canal. The basin exchanges water on all four sides, three of which are controlled by structures (i.e., S5AW, S5AS, and S5AE). On the northern boundary, water exchange with the L-8 South canal is governed by water management operations at structures in the complex (i.e., S5AS) and canal (i.e., G538, G539, and G541).
3. Methods
3.1. Balance of Flow
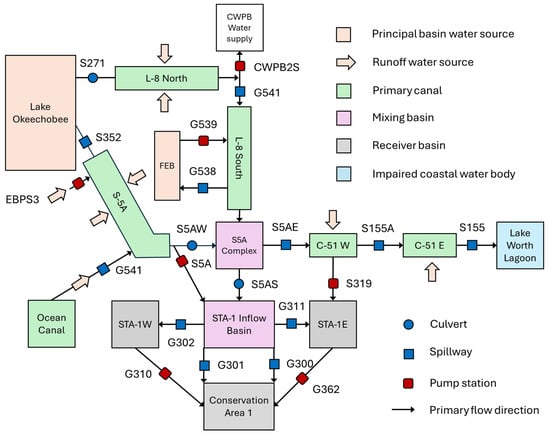
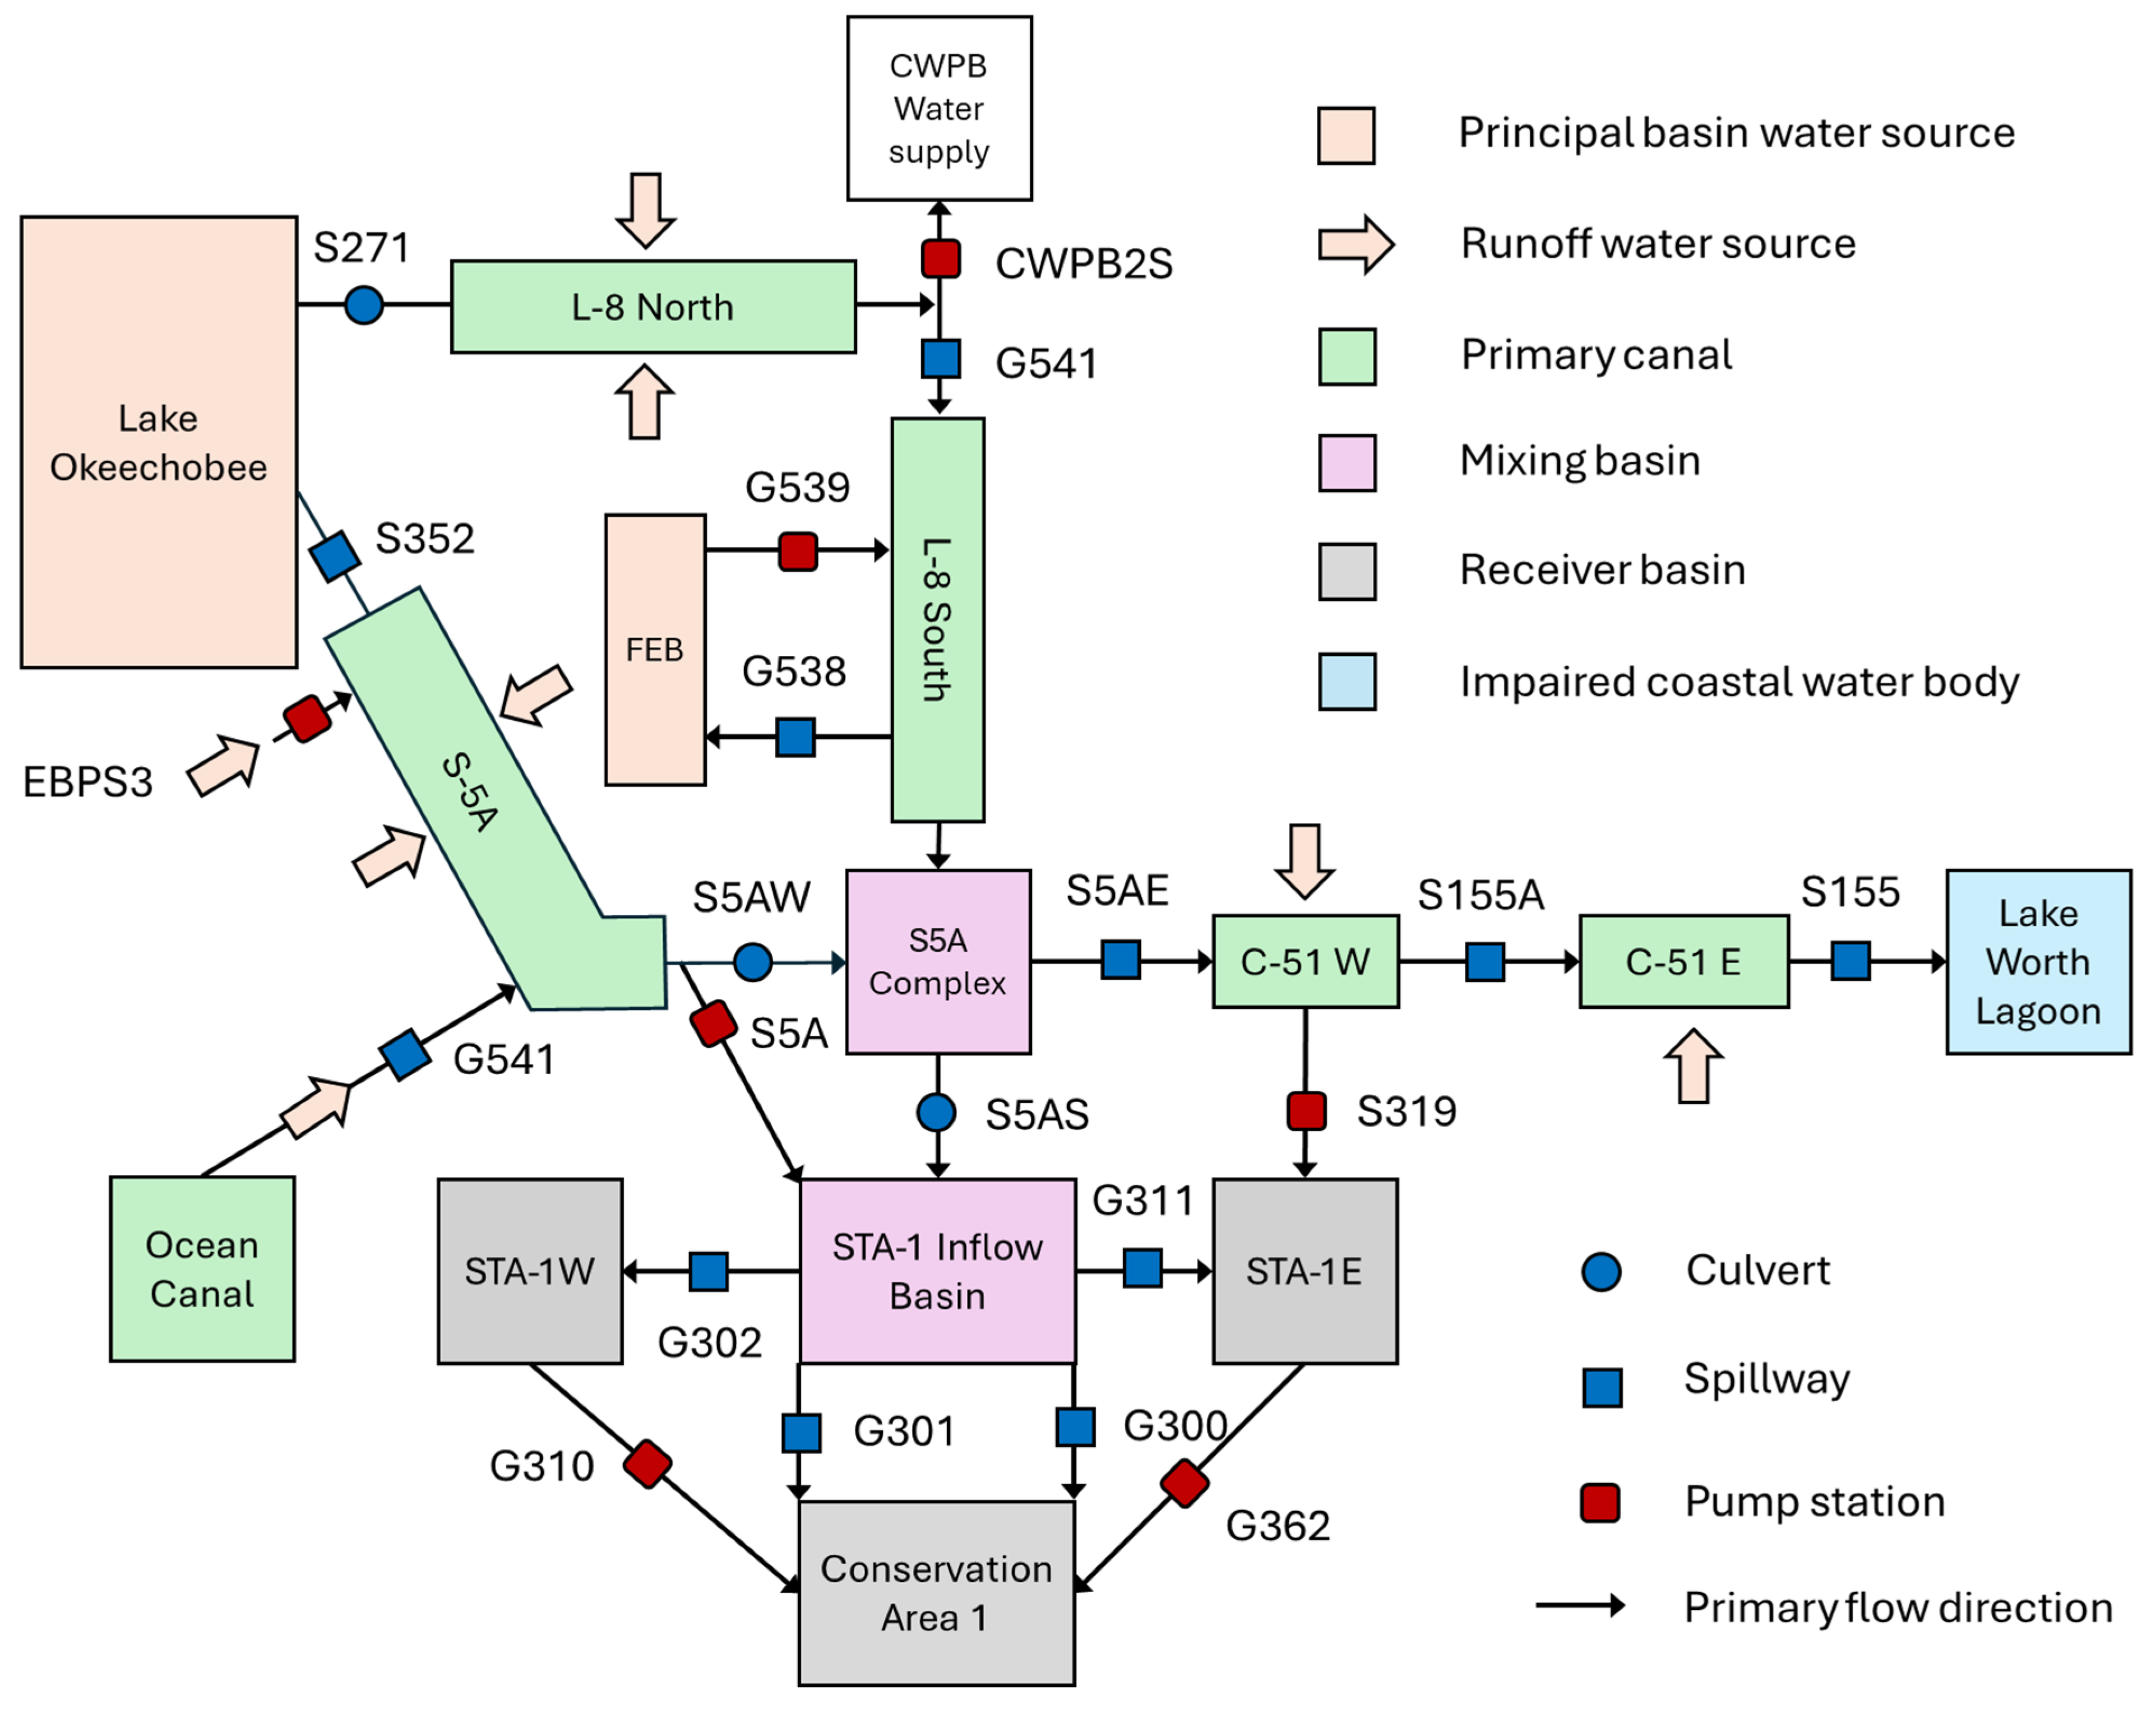
Water flow (rate and direction) through the study domain is primarily controlled by a network of structures (e.g., culverts, spillways, and pump stations) managed by the South Florida Water Management District (SFWMD, Figure 3).
Figure 3.
Schematic diagram of water flow through the study domain. This analysis focused on the western half of the study domain. Flow data at the S271 structure were collected at station L8.441.
These structures are gauged, and the data are publicly available through the SFWMD’s DBHYDRO online database [26]. In addition, there are secondary structures, maintained by other water management authorities (e.g., Lake Worth Drainage District, Indian Trails Improvement District, and South Florida Conservation District), that discharge (i.e., runoff) into or withdraw (i.e., water supply) water from the L-8 and S-5A canals. Some of these are gauged, and the data available are accessible using DBHYDRO. A third structural category consists of privately managed or tertiary operations, for which stage and flow data are not publicly available.
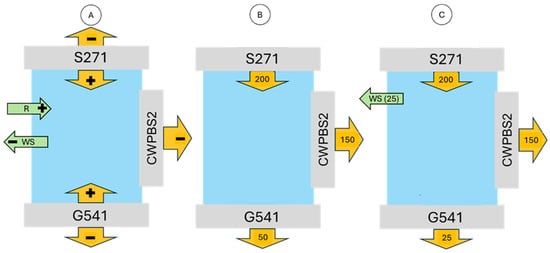
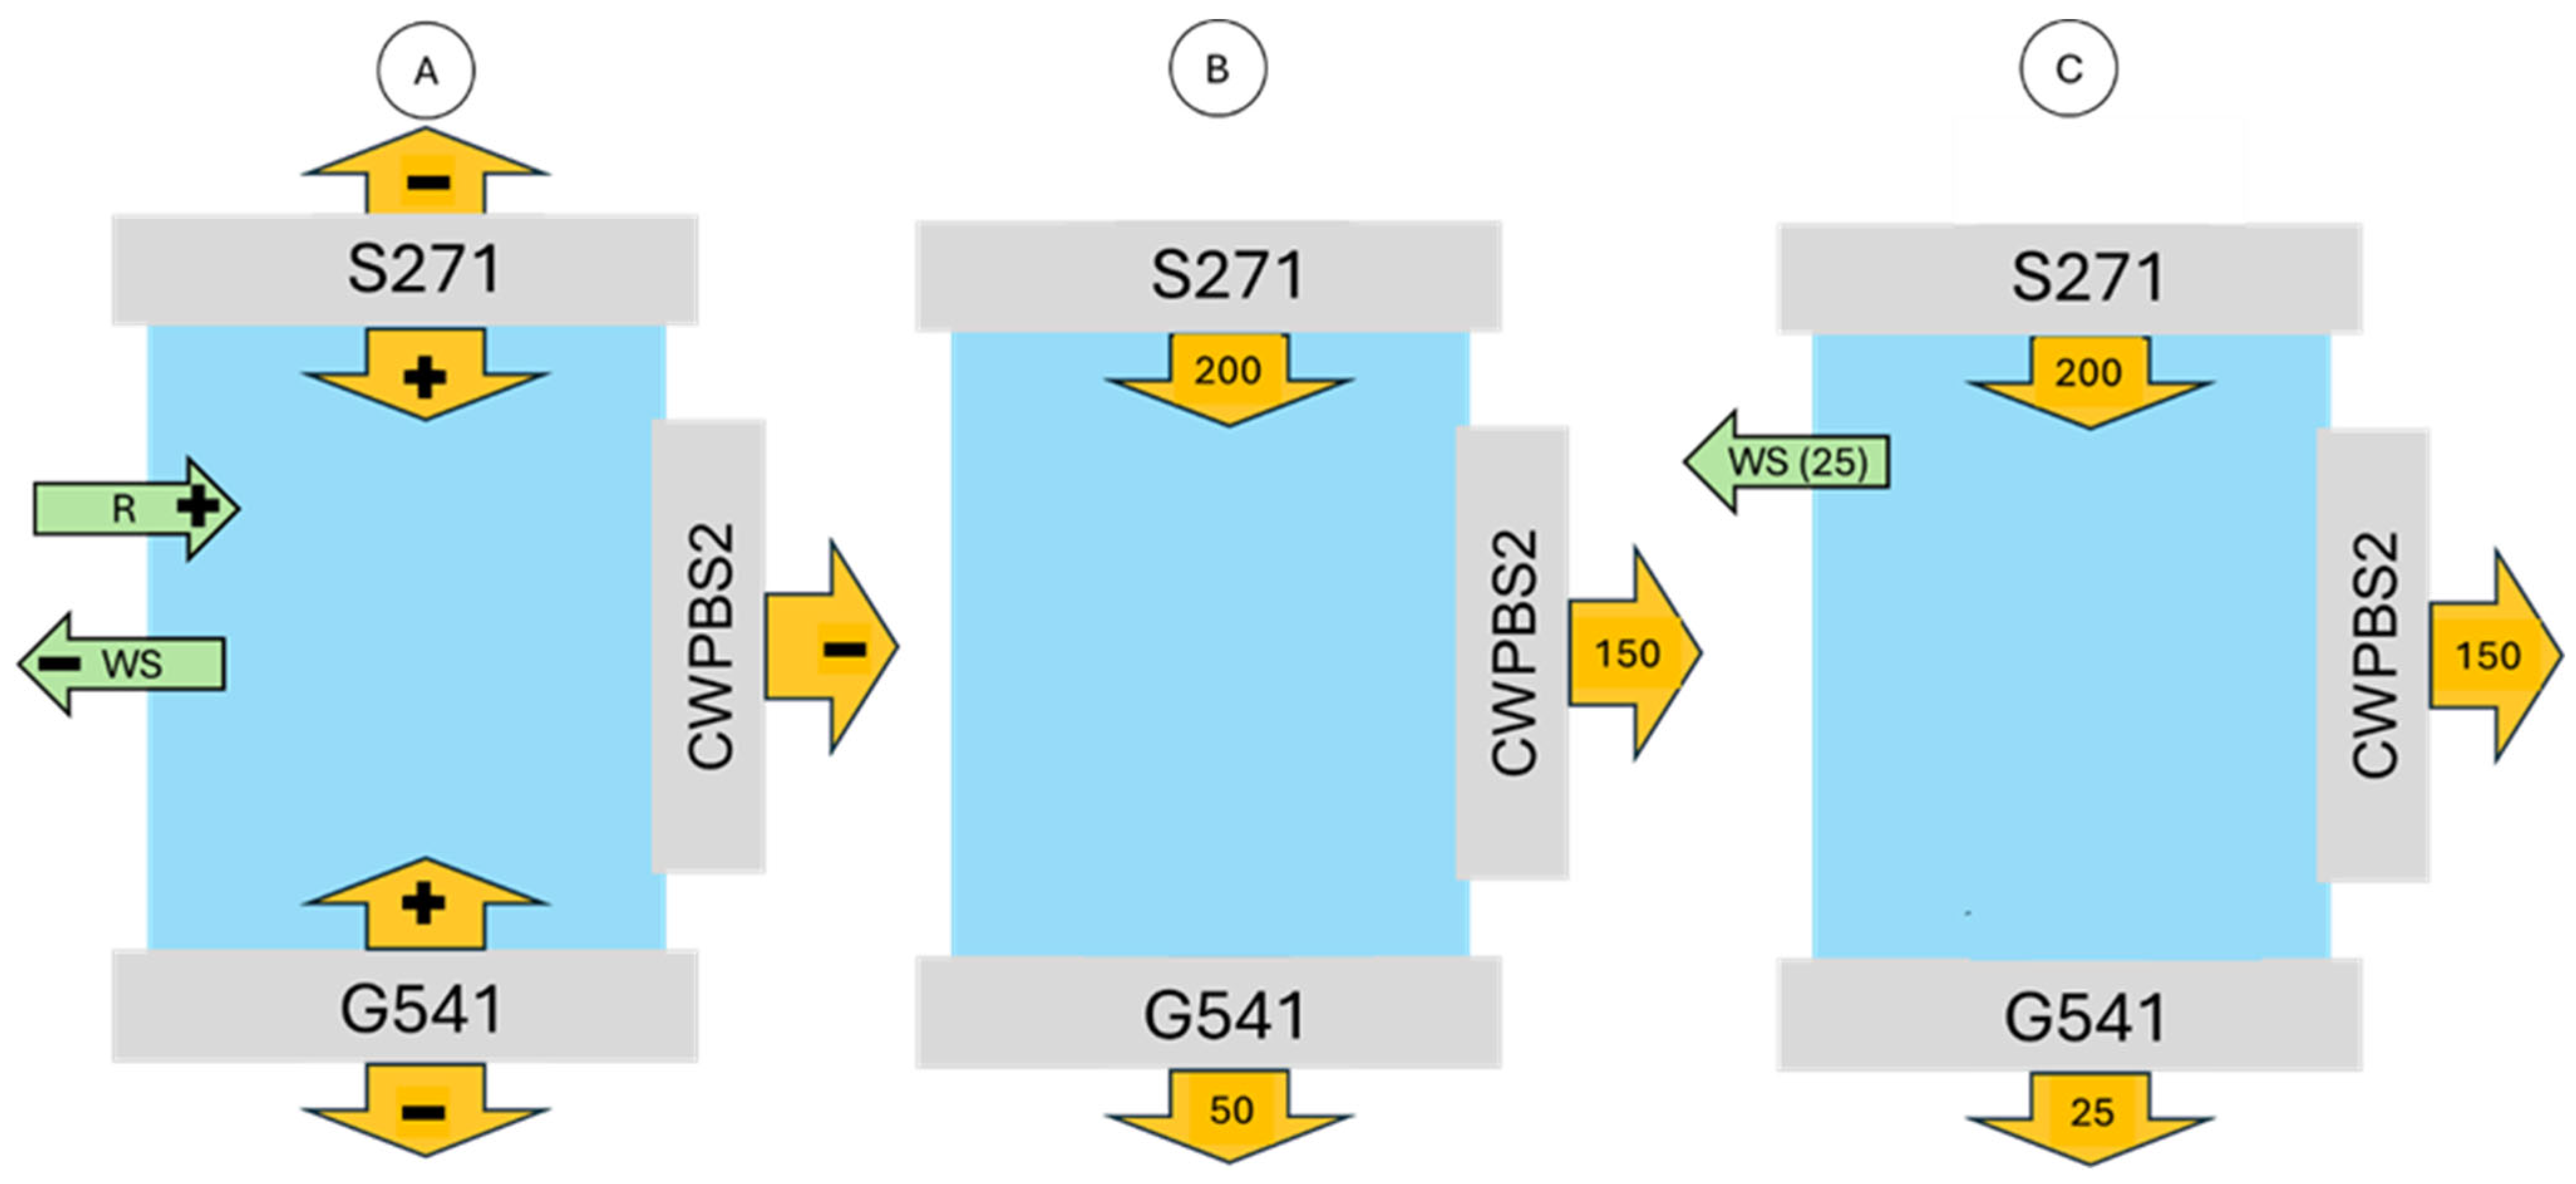
As a result, the contribution of runoff and water supply at ungauged structures was estimated using a balance-of-flow approach. For example, in Figure 4A, the average inflow and outflow associated with L-8 North water control structures are illustrated. At the headwaters of L-8 North is the S271 structure which controls the flow of LO water into the canal (positive, inflow) or canal water into the lake (negative, outflow). To the south, G541 controls the flow of water into L-8 South (negative, outflow) or into the L-8 North canal (positive, inflow). The CWPBS2 structure, a City of West Palm Beach water supply pump station, conveys water out of the L-8 North canal (negative, outflow) through the L-8 Tieback canal.
Figure 4.
Conceptualization of inflows (+) and outflows (−) of water at the L-8 North canal tailwater structure. (A) Flow pathways at the two water control structures (i.e., S271 and G541) and a water supply pump station (i.e., CWPBS2). Runoff (R, inflow) and water supply (WS, outflow) values are deduced to balance known inflows and outflows. (B) Flow is balanced. (C) Unbalanced flow (i.e., the sum of inputs and outputs is not zero) through primary structures. A water supply allocation equivalent to the inflow deficit is required to balance flow. Values are in cubic feet per second (cfs).
In Figure 4B, hypothetical flow values on a day of sediment and water sampling are indicated. In this example, a balance of flow is evident because the inflows (i.e., S271) are equal to the outflows (i.e., CWPBS2 and G541). Therefore, the sole source of water in the L-8 North canal is from LO via structure S271. The source of water outflowing at the tailwater structure G541 and into the next segment of the canal network (i.e., L-8 South) is assigned to LO at a value of 100%. An alternative scenario is illustrated in Figure 4C, in which flow is unbalanced because inflow through S271 exceeds the combined outflow at G541 and CWPBS2. This inflow surplus is balanced by allocating an equivalent value (i.e., 25 cfs) to outflow or water supply at an ungauged secondary or tertiary structure. This does not change the source attribution of water outflowing at the tailwater structure G541 (i.e., 100% LO) because a runoff allocation was not necessary to balance flow. If the balance of flow had been negative, it would have been necessary to allocate an equivalent flow to runoff. Had a runoff allocation been required to balance flow, the contribution of LO water outflowing at G541 would have to be reduced proportionally to the total runoff allocation necessary to achieve a sum of zero.
The uncertainty in DBHYDRO flow values can be as large as 20% when the head difference across a culvert or spillway structure is small (e.g., tenths of a foot, Paul Linton, Personal Communication, 19 December 2025). Therefore, in this study, the balance-of-flow water source allocations were categorized as predominant (≥50% of flow), subordinate (>20 to <50% of flow), and uncertain accessory (≤20%). Only flows exceeding the uncertainty threshold were considered in the final assessment and allocation of LO, EAA runoff, FEB, and C-51 urban runoff during the wet and dry seasons.
3.2. Data Collection and Analysis
DBHYDRO flow values are reported as positive or negative, and the sign is relative to the primary direction of flow at each station. For example, at the G541 spillway located at the southern end of the L-8 North canal (Figure 3), the primary direction of flow is to tide, and therefore the DBHYDRO values are positive when water flows in that direction. However, for the purposes of this investigation, this condition represents L-8 North canal outflow, and therefore the sign must be treated as negative in the context of balancing L-8 North inflows and outflows. In such cases, the sign of the DBYDRO flow data was reversed to conform to the water balance framework, and the values were labeled accordingly (i.e., neg G541). All DBHYDRO units of measurement are reported using the U.S. Customary, which was therefore used in this investigation.
Flow analysis was conducted in two steps. First, daily average stage, water flow, and rainfall data from DBHYDRO stations within the study domain were quantified to characterize wet- and dry-season conditions. This was done to establish general hydrologic trends and provide context for the analysis of flow corresponding to the three sampling campaigns. The second step consisted of the analysis of the DBHYDRO data corresponding to the sampling campaigns. This was accomplished by evaluating the conditions over the 14 days that preceded the last day of sample collection. This period of observation was selected to capture the residence time of canal water flowing through the canal network at rates greater than 50 cfs [27]. Flow data from C-51W headwater and C-51E tailwater structures were also harvested from DBHYDRO to document seasonal water management operations. This information was then coupled with the S5A Complex water source allocation results to document the relative contribution of LO, agricultural runoff, the FEB, and urban runoff to the C-51 canal during the wet and dry seasons and the three sampling campaigns.
During discussions with SFWMD regarding the preliminary balance-of-flow results, anomalous values corresponding to the S5AS structure were identified. Specifically, a large runoff (STA-1 Inflow Basin) or water supply (S5A Complex) allocation was required to balance flow. These allocations were inconsistent with the size of the STA-1 Inflow Basin and the absence of water supply structures in the S5A Complex. Our SFWMD partners identified that these erroneous water allocations resulted from an overestimation of flow rates caused by the error in the S5AS flow equation, and they are currently working to resolve the issue. At present, the reported flow rates for this structure are overestimated, and the corresponding balance-of-flow water allocation was designated as erroneous. This issue did not inhibit the ability to track water flow or allocate water sources, as the values could be estimated using alternative methods (e.g., assume balance of flow was zero, assessment of seasonal data).
A comparison between the conditions of flow before and after completion of the water quality improvement projects was accomplished by analyzing DBHYDRO average daily rainfall as measured at the S352 gauge (Figure 1) and flow values acquired at the STA Inflow Basin (S5A_P) and STA-1W (i.e., G302_S) headwater structures over a duration of five years before (i.e., 2010 to 2015) and after (i.e., 2020 to 2025) construction. Rainfall was considered because water management operations are largely dictated by the need to minimize the flooding of agricultural lands during the wet season and provide water supply for agricultural and conservation use during the dry season. Without knowledge of rainfall during the two five-year intervals, differences in flow could be erroneously attributed to the new construction, when in fact they may reflect differences in rainfall. Water available to STA-1W is primarily controlled by what is delivered to the STA Inflow Basin, and therefore flow was evaluated at both of those structures. Given that the assumptions of normality and homogeneity of variance were not met by performing the Shapiro–Wilk and Fligner–Killeen tests, respectively, this analysis utilized Welch’s adjusted ANOVA [28] in R [29]. The effect of FEB construction could not be evaluated similarly since it did not exist prior to the construction upgrades. Rather, the effect of the FEB on C-51 water quantity and quality was evaluated in association with the analysis of seasonal and sampling flow.
4. Results
4.1. Seasonal Flow
The objective of this task was to quantify the predominant and subordinate source(s) of water flowing into the C-51 headwater structure (i.e., S5A Complex) during the wet and dry seasons. This was accomplished by tracking inflows and outflows of average daily flow in each element of the study domain using DBHYDRO data collected during two wet (CY2024 and 2025) and two dry (CY2024–2025 and 2025–2026) seasons. The 2024 wet season included one tropical disturbance (11–14 June), one tropical storm (3–5 August), and two hurricanes (Helene, 26–27 September; Milton, 9–10 October). In contrast, no tropical rainfall events occurred during the 2025 wet season, which delivered below-average rainfall across much of the South Florida region [30]. During the 2024–2025 dry season, the US Army Corps of Engineers initiated ‘recovery operations’ to reduce lake levels that had been relatively high for the preceding five years [31]. In the study domain, this was accomplished by increasing the maximum allowable release or discharge at S-271 and S-352. Recovery operations were conducted from 7 December 2024 through May 2025. Normal operations resumed thereafter.
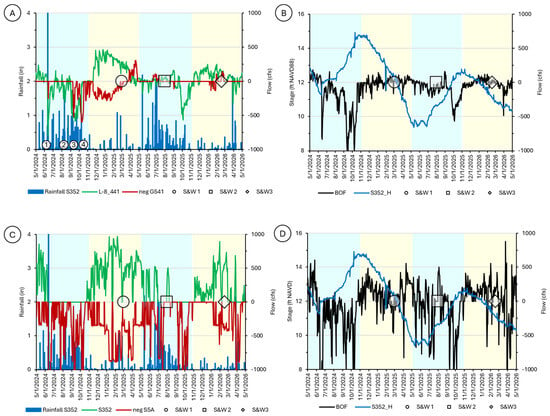
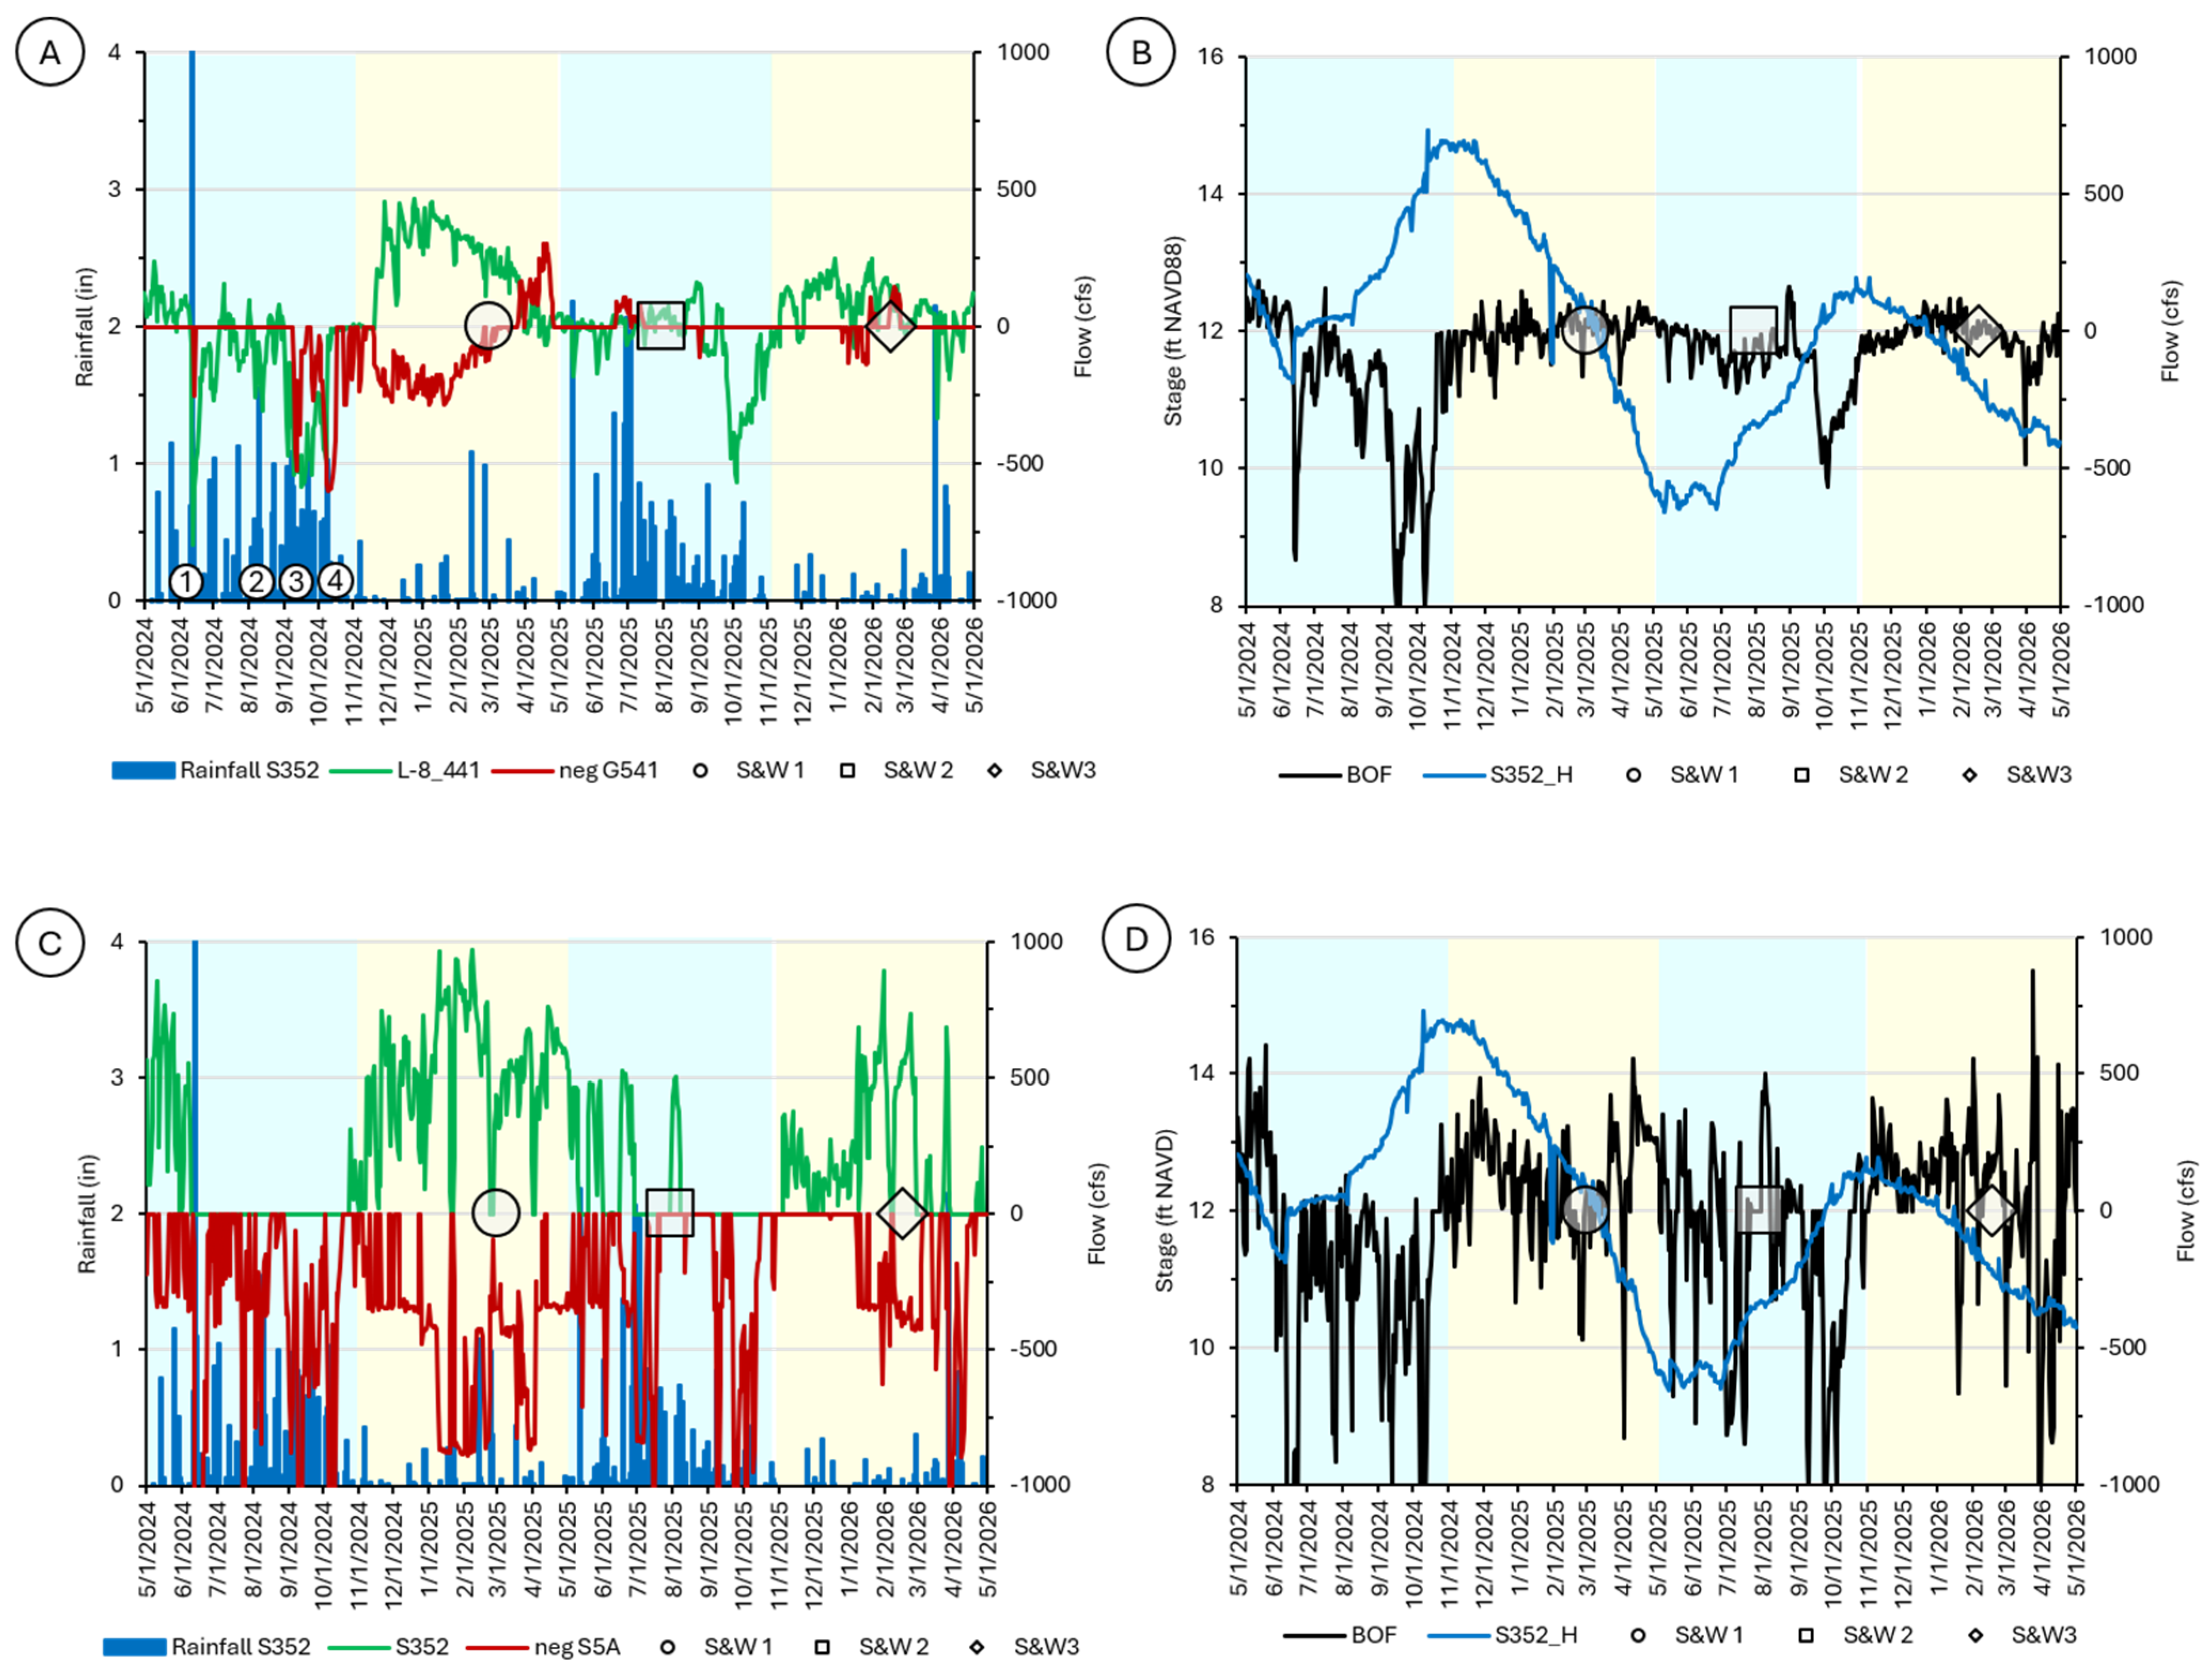
The data indicate that the predominant source of water flow through L-8 North and into L-8 South during the 2024 and 2025 wet season was RO (Figure 5A,B, Table 2). Exchange in flow between L-8 South and the FEB yielded a tailwater mixture consisting predominantly derived from FEB; however, in 2024, it included a subordinate L-8 North component. During both wet seasons, S-5A tailwater outflow through S5A pump station and into the STA-1 Inflow Basin was predominantly runoff with subordinate contribution from LO (Figure 5C,D, Table 2). During the 2024 wet season, ~75% of the S-5A flow entering the STA-1 Inflow Basin was diverted into STA-1W through G302 before entering the S5A Complex. During the 2025 wet season, ~55% of the flow was diverted into STA-1W. On average, inflow into the S5A Complex from the FEB was limited during both wet seasons, and therefore the mix of water entering the S5A Complex consisted predominantly of S-5A RO with a subordinate S-5A LO component (Table 2).
Figure 5.
Wet (blue) and dry (yellow) seasonal hydrographic conditions in the Everglades Agricultural Area that includes the L-8 North (A,B) and S-5A (C,D) watersheds. Also shown are the dates of sampling (e.g., S&W 1). Series color key. (A,C) Green = headwater flow; red = tailwater flow. (B,D) Blue = LO stage; black = balance of flow (inflow–outflow). Circled numbers: 1 = tropical depression, 2 = Tropical Storm Debbie, 3 = Hurricane Helene, and 4 = Hurricane Milton. Dates of sampling are also shown (e.g., S&W 1).
Table 2.
Summary of wet-season flow (cfs) in each of the five watershed elements of the study domain. Negative values indicate outflow. Parenthesized abbreviations identify the origin or source of the water flowing through the corresponding structure. See Table 1 for key to abbreviations.
During the dry season, water entering L-8 South from L-8 North was predominantly from LO, with a subordinate component of RO during the 2025–2026 season (Figure 5A,B, Table 3). Upon entering L-8 South and mixing with FEB outflow, the water flowing into the S5A Complex was, on average, predominantly FEB, with a subordinate LO contribution from L-8 North in 2024–2025. Flow through S-5A was predominantly LO water (Figure 5C,D, Table 3), which was transmitted through the STA-1 Inflow Basin and into the S5A Complex without being mixed with other sources (e.g., FEB). Hence, S5A Complex dry-season water sources were predominantly derived from LO via S-5A. During the 2024–2025 dry season, about 35% of the S-5A lake water flow entering the STA-1 Inflow Basin was diverted into STA-1W before entering the S5A Complex. About 61% of the S-5A lake water flow entering the STA-1 Inflow Basin was diverted into STA-1W during the 2025–2026 dry season. Although dry-season flow through the study domain during 2024–2025 was higher than 2025–2026 because of the recovery operations noted previously, the proportional allocation of water sources moving through the system did not change.
Table 3.
Summary of dry-season flow (cfs) in each of the five watershed elements of the study domain. Negative values indicate outflow. Parenthesized abbreviations identify the origin or source of the water flowing through the corresponding structure. See Table 1 for key to abbreviations.
4.2. Sampling Flow
Three sediment and water sample collection field campaigns were conducted. One was undertaken during the 2024–2025 dry season (S&W 1), a second during the 2025 wet season (S&W 2), and the last in the 2025–2026 dry season (S&W 3) (Figure 2 and Figure 5).
4.2.1. 2024–2025 Dry Season (S&W 1)
During the 2024–2025 dry-season sampling or S&W 1, all of the water passing through G541 and into L-8 South was from LO (Table 4). Flow was nearly balanced, requiring a minor water supply allocation (i.e., 17 cfs). This water supply allocation is consistent with known daily average withdrawals at secondary or tertiary L-8 North structures (e.g., ~50 cfs by the Cypress Grove Community Development District; Paul Linton, Personal Communication 26 September 2025). In L-8 South, the water mixture was predominantly FEB (Table 4). The positive balance of flow or excess inflow was allocated as an outflow to the S5A Complex. Water in the S-5A was predominantly from LO. No additional inflow mixed with the S-5A water during conveyance through the STA-1 Inflow Basin and into the S5A Complex, so the Inflow Basin water source allocations did not change (Table 4). Over the 14-day interval of analysis, about 17% of the S-5A flow entering the STA-1 Inflow Basin was diverted into STA-1W through G302 before entering the S5A Complex. The source allocations at the headwaters of the C-51 canal or in the S5A Complex consisted predominantly of S-5A lake water with a subordinate mix of FEB water.
Table 4.
Summary of flow (cfs) during S&W 1 and S&W 3 dry-season sampling over 14-day interval of analysis. Parenthesized abbreviations identify the origin or source of the water flowing through the corresponding structure. Source of water outflowing each canal or basin is identified as the tailwater source. See Table 1 for key to flow abbreviations.
4.2.2. 2025 Wet Season (S&W 2)
During 2025 wet-season sampling or S&W 2, water in the L-8 North canal predominantly consisted of runoff and subordinately of lake water (Table 5). The runoff allocation necessary to balance flow (85 cfs) was consistent with field observations, as one unit at the private pump station located ~1 km south of the headwater structure was operational and discharging water into the canal at the time of sampling. Furthermore, discussions with Palm Beach County partners indicated that daily average runoff flows on the order of 100 cfs are reasonable in both the L-8 North and S-5A watersheds. However, because there was no L-8 North flow through G541 and into L-8 South at the time of sampling, water entering the S5A Complex from L-8 South was derived entirely from the FEB (Table 5). All water conveyed by S-5A during S&W 2 wet-season sampling originated from LO (Table 5). To balance flow in S-5A, a relatively large (~200 cfs) water supply allocation was required. This allocation was inconsistent with field observations at a privately operated pump located about 5 km west of S5A Complex, where one unit was conveying runoff from the adjacent agricultural land into the canal. This conflicting observation highlights a limitation in the balance-of-flow approach used in this investigation: the water supply or runoff allocations necessary to balance flow may in fact represent the sum of multiple inflows and outflows at ungauged secondary and tertiary structures. Consequently, runoff at one location may not be recognized or accurately allocated if it was balanced by or partially offset by water supply at another location. No S-5A water was transmitted into the STA-1 Inflow Basin via the S5A pump station (Table 5), and this is logically correlated with below-average rainfall during the 2025 wet season. The percentage of Inflow Basin water diverted into STA-1W during the 14-day period of observation could not be estimated. Based on the seasonal data (Figure 5C), the water flowing out of the STA-1 Inflow Basin and into the S5A Complex during S&W 2 was deduced to have been derived entirely from LO via the S-5A canal.
Table 5.
Summary of average flow rates (cfs) during S&W 2 wet-season sampling over 14-day interval of analysis. Parenthesized abbreviations identify the origin or source of the water flowing through the corresponding structure. Source of water outflowing each canal or basin is identified as the tailwater source. See Table 1 for key to flow abbreviations.
4.2.3. 2025–2026 Dry Season (S&W 3)
During the 2025–2026 dry-season sampling or S&W 3, flow was nearly balanced in L-8 North, requiring a minor water supply allocation (9 cfs). Water was flowing into the canal from L-8 South (Table 4). In L-8 South, the water mixture could not be determined because there was no flow exchanging with the basin at any of the structures during the 14-day period of observation. Water in the S-5A canal consisted entirely of LO. No additional inflow mixed with the S-5A water during conveyance through the STA-1 Inflow Basin and into the S5A Complex, so the Inflow Basin water source allocations did not change (Table 4). Over the 14-day interval of analysis, about 18% of the S-5A flow entering the STA-1 Inflow Basin was diverted into STA-1W through G302 before entering the S5A Complex. During S&W 3, the source allocations at the headwaters of the C-51 canal or in the S5A Complex consisted entirely of S-5A lake water.
4.3. C-51W Headwater Sources
All LO, EAA runoff, and FEB water flowing through the C-51 canal and into LWL is conveyed through the S5A Complex structure S5AE. Both the 2024 and 2025 wet-season flow data indicate that the water entering the S5A Complex was derived from the S-5A watershed or EAA and predominantly consisted of agricultural runoff with a subordinate contribution from LO (Table 6). The wet-season sample (S&W 2) water source allocation was different than that of the average 2025 wet season, as it consisted predominantly of lake water. The difference between the average 2025 wet season and S&W 2 water source allocations was attributed to below-average rainfall that occurred in June and July, and which required the use of lake water to offset the deficit in water supply required to meet agricultural demand. Consequently, the water source allocation during S&W 2 more closely resembled that observed during the average dry season.
Table 6.
Summary of seasonal and sampling event S5A Complex water source allocations. See Table 1 for key to abbreviations.
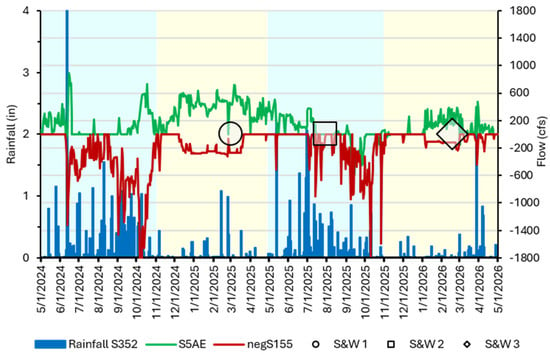
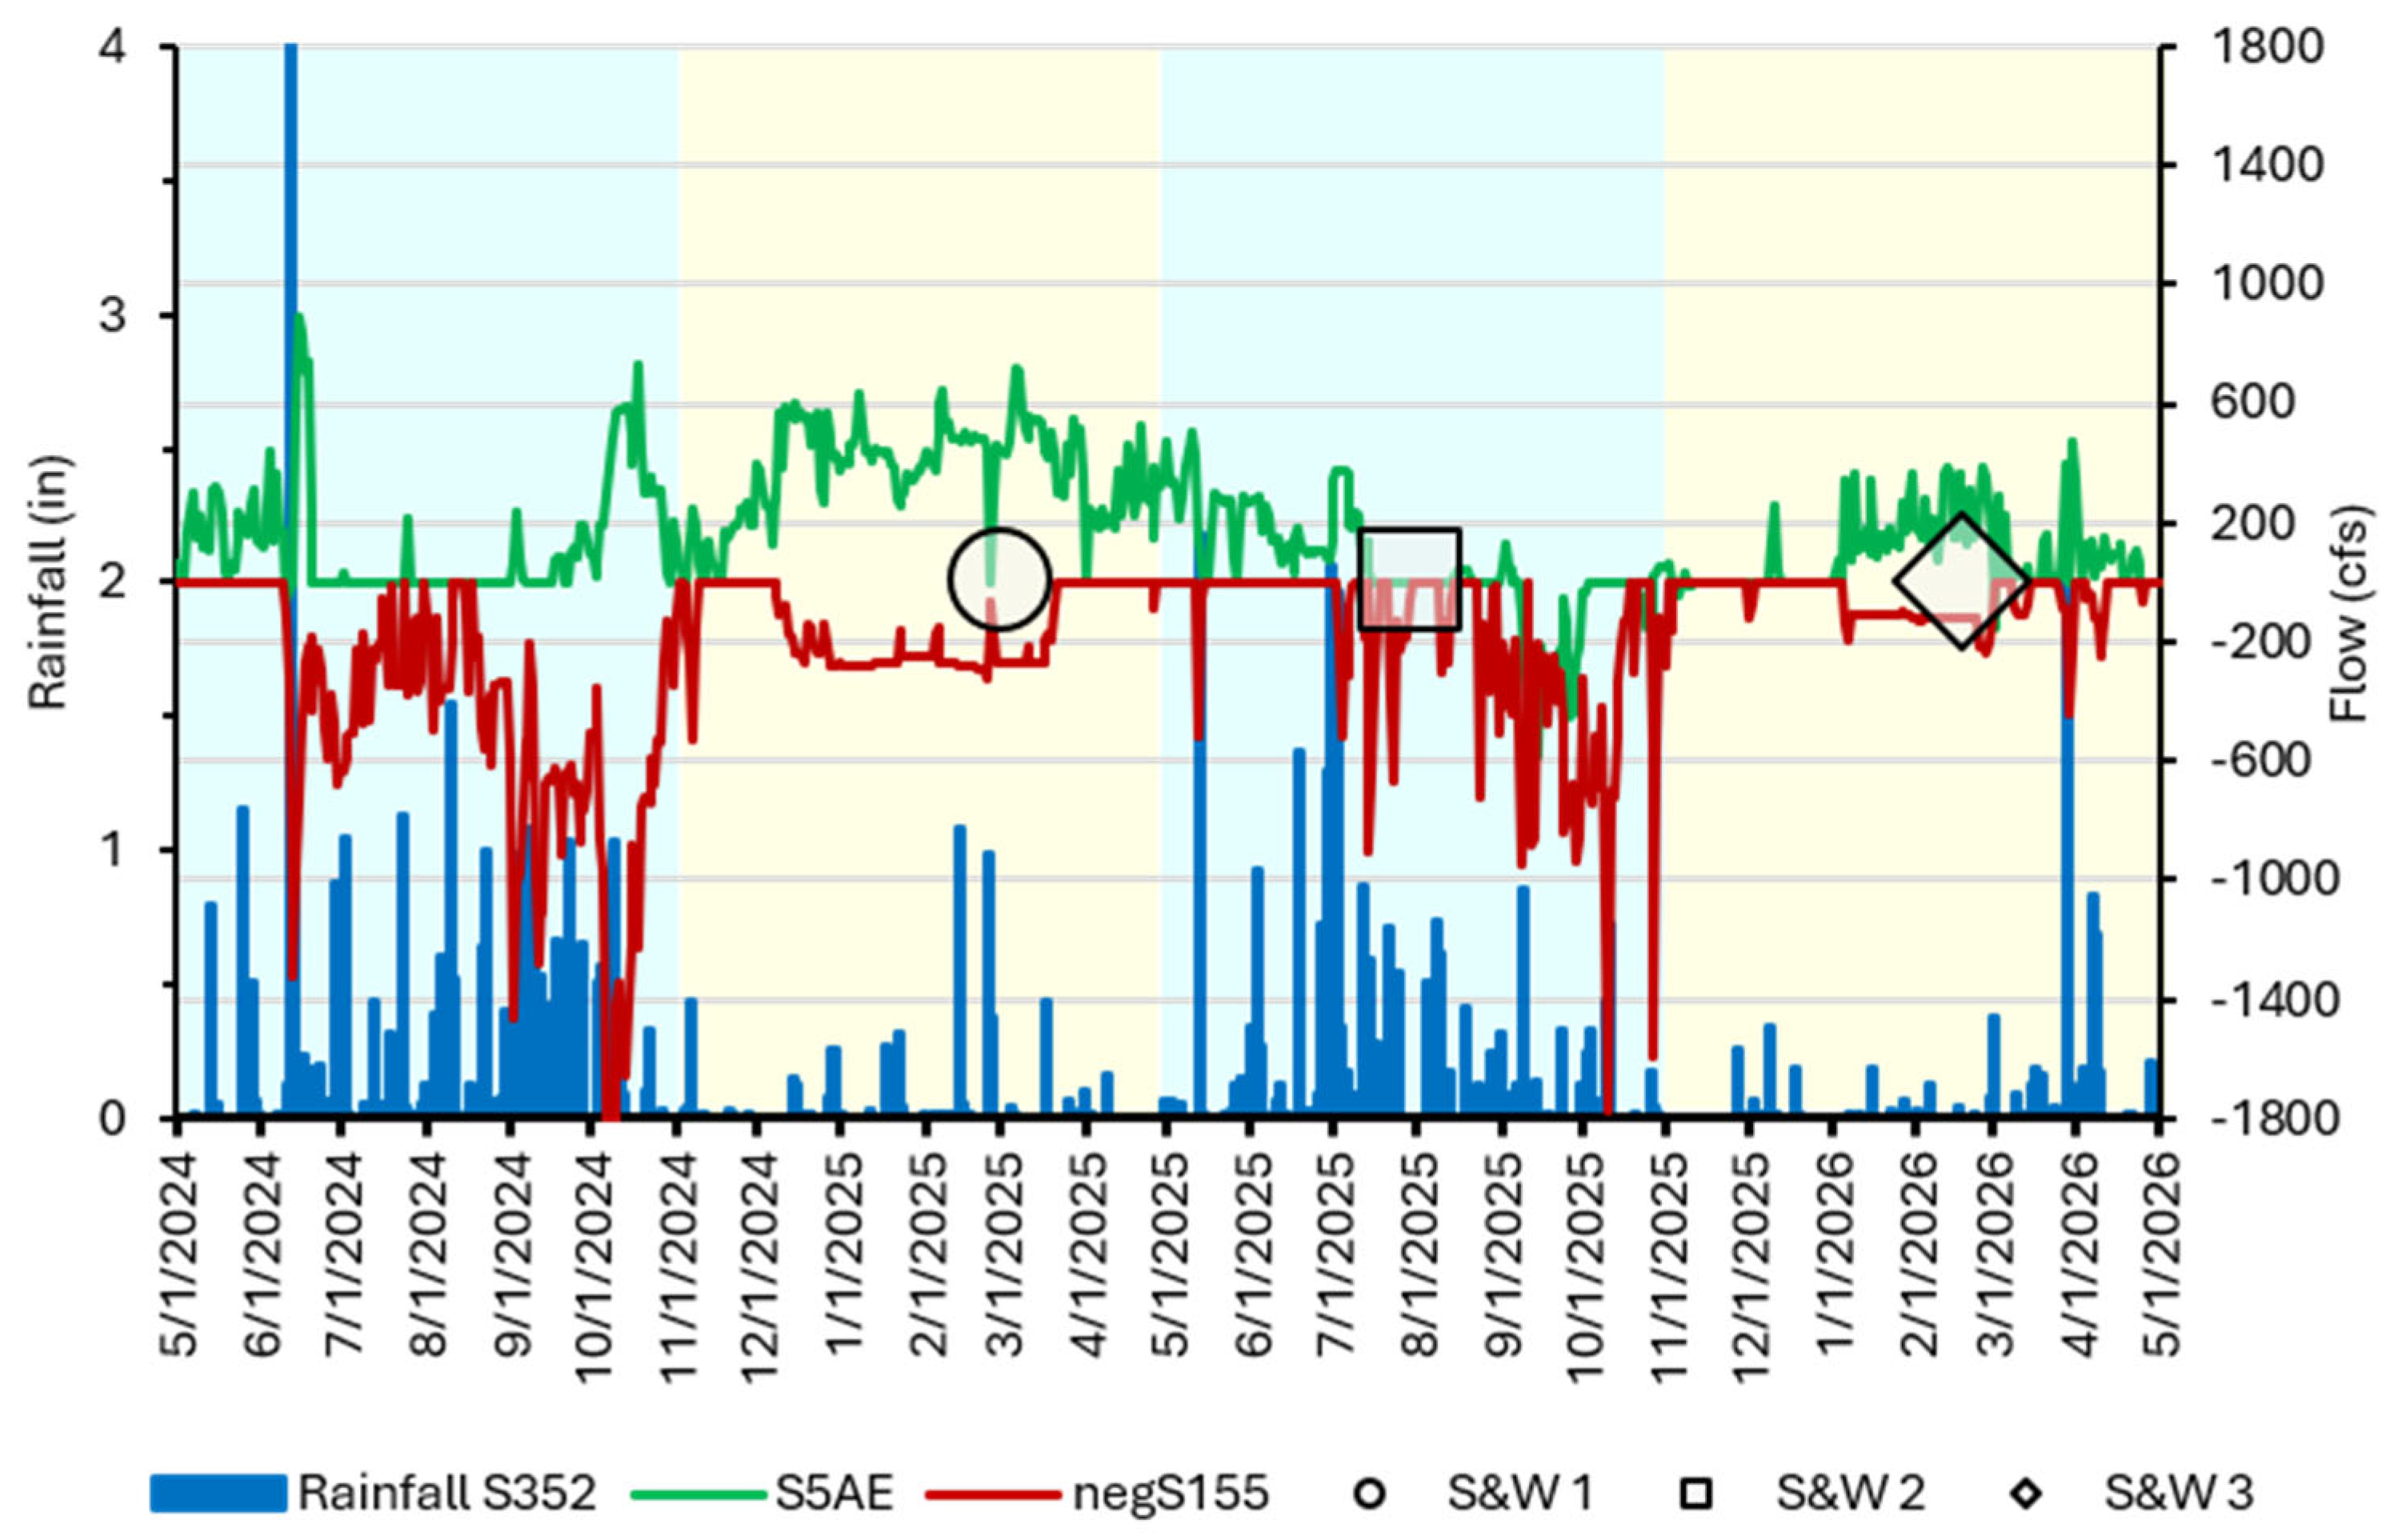
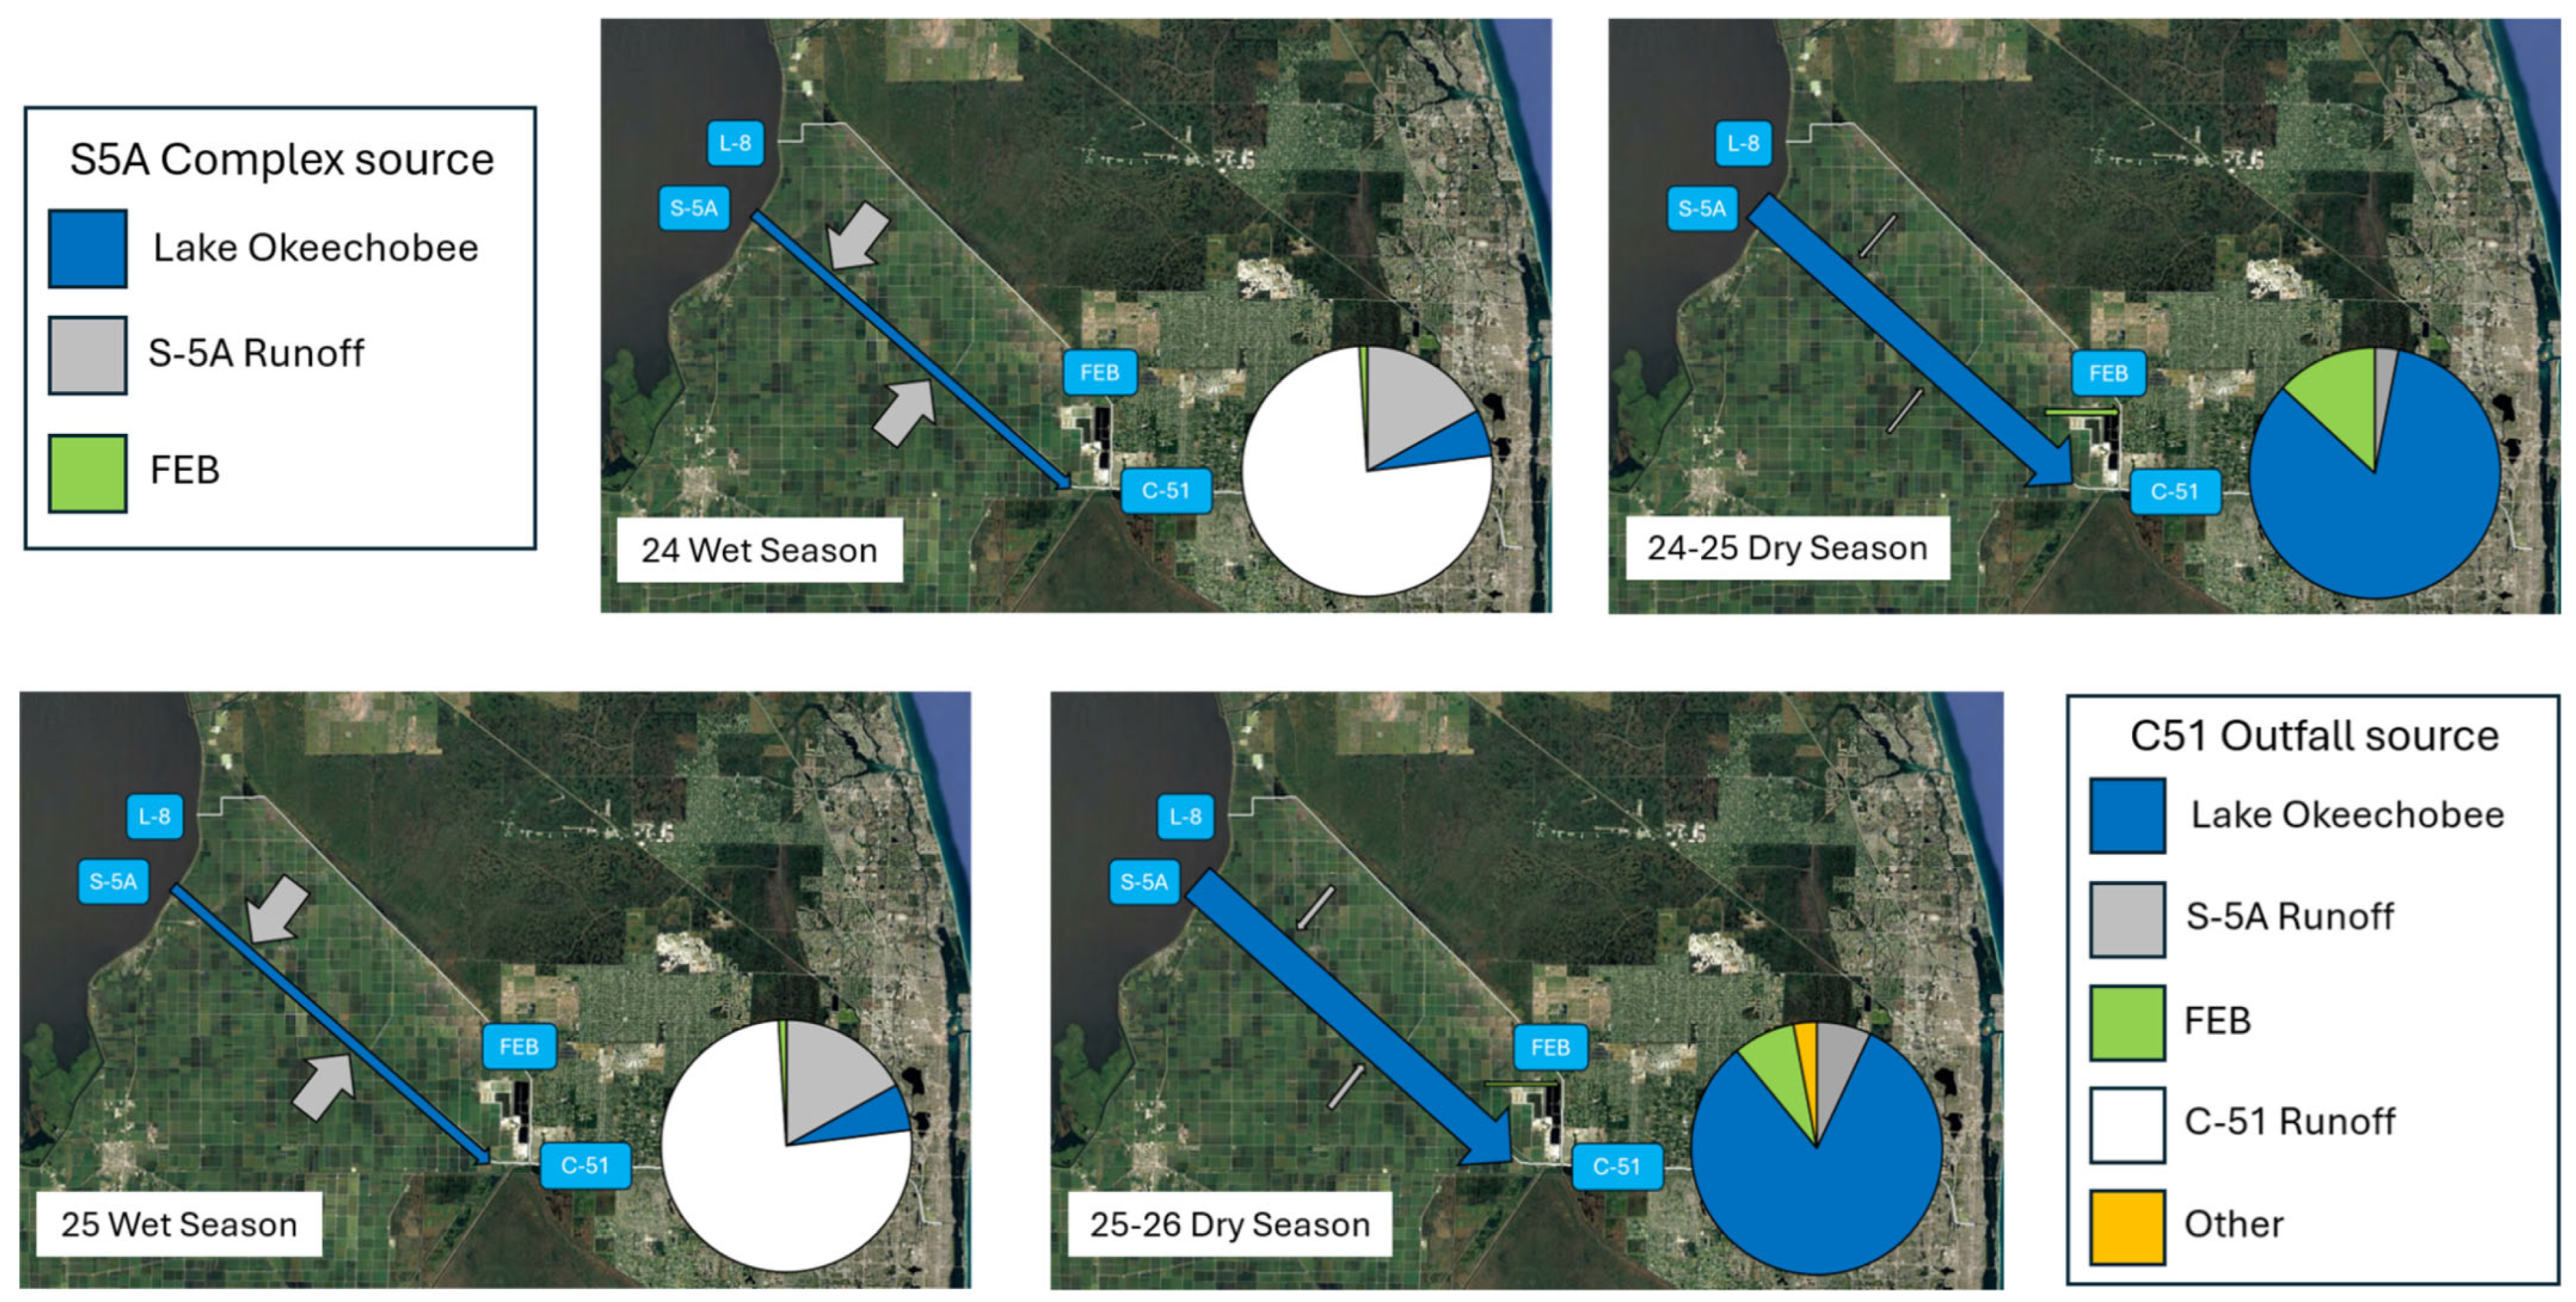
During both the 2024–2025 and 2025–2026 dry season, the balance-of-flow results indicate that, on average, the water in the S5A Complex was predominantly from Lake Okeechobee and conveyed to the C-51 headwaters by the S-5A canal (Table 4). The predominant water source allocations corresponding to both S&W 1 and S&W 3 were the same as the seasonal values. The seasonal flow through the C-51W headwater structure S5AE was much higher during the 2024–2025 dry season (364 cfs) than during the 2025–2025 dry season (89 cfs) (Figure 6). This corresponds to the increasing flow associated with LO recovery operations. A comparison between C-51W inflow at the S5AE structure (low) and outflow into LWL (high) at the S155 structure indicates that during the wet season, discharge into the estuary is predominantly derived from urban runoff. In marked contrast, during the dry season, the C-51 canal water discharging water into LWL was derived predominantly from Lake Okeechobee via S-5A (Figure 7).
Figure 6.
Average daily rainfall and C-51 inflow at the headwater (i.e., S5AE) and outflow at the tailwater (i.e., negS155) structures during the two wet (blue) and dry (yellow) seasons considered in this analysis. Dates of sampling are also shown (e.g., S&W 1).
Figure 7.
Water source allocations at the headwaters of the C-51 Canal (i.e., S5A Complex) and at the C-51 Outfall to the LWL. Width of arrow is proportional to flow. See Table 1 forkey to abbreviations.
4.4. Efficacy of Water Quality Improvement Projects
The construction of the FEB and enhancements to STA-1W were designed to improve the quality of water discharging through CA1 and into the Everglades headwaters. The efficacy of STA-1W water quality construction upgrades was evaluated by enumerating the difference between average daily rainfall and flow into the STA Inflow Basin and STA-1W over a duration of 5 years before (2010–2015) and after (2020–2025) construction was completed (Table 7). The results indicate that there was no statistically significant difference in rainfall. There was a significant dry-season increase in volume of water diverted into STA-Inflow Basin and STA-1W after construction. There was also a significant decrease in wet-season flow into STA-1W after construction. As previously described in both the seasonal and sampling analysis of flow, the newly constructed FEB now contributes a novel and, at times, significant volume of water that enters the S5A Complex (Table 2, Table 3, Table 4 and Table 5) and, at times, was released into the C-51 canal (Table 6).
Table 7.
DBHYDRO average daily rainfall (inches) and flow (cfs) organized into five-year intervals before and after the STA-1W water quality improvement projects were completed. p = probability.
5. Discussion
Managing surface water to achieve environmental objectives (i.e., environmental flows) requires a basic understanding of how changes in flow (e.g., direction and magnitude) affect water quantity and quality [13]. This investigation successfully applied a balance-of-flow framework to (1) quantify the source of water flowing into the S5A Complex during two wet and dry seasons and three field sampling campaigns; (2) determine the seasonal contribution of S5A Complex headwater flow to the C-51 canal and at the point of discharge into LWL; and (3) assess the effects of recent water quality improvement projects on LWL impairment. The results revealed a distinct difference between the average daily dry and wet-season flow. During the wet season, EAA runoff from the S-5A watershed was the predominant source of water reaching the S5A Complex. During the dry season, water flowing into the S5A Complex was predominantly from LO and transmitted through the S-5A canal. Montefiore et al. [9] described a similar seasonal water source allocation of LO and watershed runoff for the Caloosahatchee River and Estuary Watershed, located in Southwest Florida (see CRE in Figure 1). Modest differences between the seasonal and sampling source allocations were observed and attributed to adjustments of flow implemented by water management operators in response to sub-seasonal observations (e.g., rainfall, water supply). Over the duration of analysis, about 55% of the S-5A canal water entering the STA-1 Inflow Basin was diverted into STA-1W, with a higher proportion (~75%) occurring during the wet season. The predominance of EAA runoff in the wet season appears to have had limited influence on the composition of water flowing through the C-51 canal and into LWL because flow through the headwater structure S5AE was relatively low. Hence, the wet-season runoff from the canal’s urban landscape was the predominant source of water flowing into LWL. In contrast, the dry-season flow through the headwater structure S5AE was relatively high. During this time, S-5A LO water was conveyed through the C-51 canal and into LWL. Recognition of LO as the predominant source of water flowing through the C-51 canal during the dry season deviates substantially from the currently accepted paradigm attributing LWL impairment to wet-season stormwater runoff [6,18].
Lake Okeechobee stage recovery operations conducted during the 2024–2025 dry season substantially increased flow, but not water source allocations in comparison to the 2025–2026 dry season. That being said, the higher 2024–2025 dry-season recovery flow of S-5A LO water into the C-51 canal may be a potential source of LWL ‘event’ pollutant loading that deserves to be investigated. The observed intra- (e.g., seasonal) and inter-annual (e.g., recovery operations) differences in water management operations present challenges when attempting to broaden the application of the outcome of the balance of flow and water source allocations presented herein beyond the interval of analysis. While a generalized water management operations framework is evident, it is not predictable. The similarities between the two dry- and wet-season data sets generated during this investigation suggest a pattern or cycle may exist from which to initiate discussions of adaptive management upgrades to reduce sediment and water quality impairment in the LWL. However, the acquisition of additional data is always warranted to ensure those discussions yield successful outcomes.
The comparison between the seasonal and 14-day sample water source allocations revealed differences, and this may in part account for the lack of significant correlation between water quality values, rainfall, and discharge, as has been previously reported [18]. Practitioners conducting water- or sediment-quality monitoring programs are therefore encouraged to evaluate their data within the context of the hydrodynamic conditions coincident with the dates of sample collection.
During the dry season, the predominant source of water entering LWL was from LO (Table 4). The analysis of flow data generated before and after completion of the STA-1W construction upgrades suggest that dry-season diversion of LO water into STA-1W increased after construction. If it is determined through subsequent investigations that LO is a significant source of LWL sediment and water quality impairment, the efficacy of these construction upgrades may be mitigative. Although there was no difference between pre- and post-construction wet-season flow (EAA RO) into the STA Inflow Basin, the volume of water diverted into STA-1W was significantly lower. These results are counterintuitive and could not alone be used to evaluate the legacy of construction upgrades to LWL wet-season impairment.
Perhaps the most substantial, affirmed legacy of the recent STA-1W construction upgrades to balance of flow and water source allocations within the study domain was the creation of the FEB. This basin represents a new source of water that can be conveyed into the C-51 canal via the S5A Complex. During S&W 1 sampling, water derived from the FEB accounted for 28% of the flow entering the S5A Complex that was subsequently conveyed into the C-51 canal. Notably, previous investigations designed to quantify sediment and water quality trends associated with LWL impairment have relied on DBHYDRO data collected at the primary water control structures on L-8, S-5A, and C-51. Since construction of the FEB was completed, three additional structures (G541, G539, and G538) now provide relevant hydrodynamic (i.e., stage and flow) and water quality (i.e., grab samples) data. Future investigations developed to address LWL sediment and water quality challenges should incorporate the FEB into the analysis.
Upon completion of an ongoing physical and geochemical analysis of canal sediment, total suspended solids, and water samples collected during three sampling campaigns, those data will be interpreted within the context of the balance of flow and water sourcing as described herein. It is anticipated that these results will provide a novel framework for identifying temporal (i.e., wet vs dry season) and spatial (e.g., L-8 vs S5A) analytical patterns that can be used to constrain the origin and context of pollutant loading to the LWL and adjacent coastal waters. In turn, those results are expected to facilitate discussion of (1) possible upgrades to existing BMPs (e.g., water management, nutrient and sediment controls, and infrastructure improvements; [21,32] or (2) future mitigation projects (e.g., sediment traps, bio-geoengineering, structural re-engineering, and environmental dredging; c.f. [33,34,35,36] intended to mitigate the historical impairment and commensurate degradation of LWL’s ecosystem services. The methodological approach utilized in this investigation is broadly applicable to other regions where resource managers are applying adaptive management strategies to mitigate the effects of freshwater diversion on upland and coastal ecosystems.
6. Conclusions
This investigation demonstrated the utility of a balance-of-flow framework to quantify environmental flow and identify the source(s) of water entering the S5A Complex, located at the headwaters of the C-51 canal, over a two-year interval. During the wet season, S-5A agricultural runoff was the predominant water source. During the dry season, water flowing into the S5A Complex was predominantly from LO and transmitted by the S-5A canal. Fifty-percent more water was released into the C-51 during the dry seasons, suggesting LO may be the predominant source of sediment and water discharging into and impairing the LWL. This observation contradicts previous studies that have reported that LWL pollutant loads originate as wet-season agricultural runoff.
The recent STA-1W water quality improvement projects appear to have had a mitigative effect on LWL impairment. Specifically, there was a significant post-construction dry-season increase in the volume of LO water diverted into STA-1W prior to reaching the S5A Complex or C-51 headwaters. Practitioners are encouraged to undertake additional flow investigations to affirm, refine, or reject this initial assessment of construction efficacy on LWL impairment. Construction of the FEB has created a new source of water that, at times, contributed substantially to the S5A Complex water budget. It is therefore recommended that future investigations developed to address LWL sediment and water quality challenges incorporate the FEB as a novel water source that is distinct from LO and EAA watershed runoff, as has been traditionally considered. The results of this study deviate substantially from the currently accepted paradigm that stormwater runoff from areas ‘further west’ of the C-51 Canal is the source of LWL impairment, thus affirming the value of the periodic reassessment of adaptive management plans to ensure resource management and restoration strategies are based upon the best available information.
Author Contributions
R.W.P. and L.J.S., conceptualization, data curation, formal analysis, investigation, methodology, project administration, supervision, validation, visualization, and writing; O.O. and L.A.M.J., formal analysis, investigation, validation, and editing; P.R.G. and M.C., formal analysis, investigation, methodology, validation, visualization, and writing. All authors have read and agreed to the published version of the manuscript.
Funding
Project funding was provided by EPA South Florida Program Grant Number (FAIN) 03409224.
Data Availability Statement
All data utilized in this study are publicly availability, and the links are provided in this publication.
Acknowledgments
The South Florida Water Management District and Palm Beach County (project partners) are recognized for providing institutional knowledge that has substantially informed the project team. However, the authors are solely responsible for the content of this publication. Funding for project collaborator and Lesmes A. M. Jerez was provided in part by the College of Arts, Science, and Education (CASE) at Florida International University. This is contribution number 2160 from the Institute of Environment at Florida International University, Miami.
Conflicts of Interest
The authors declare no conflicts of interest.
References
- Das, A.; Justic, D.; Inoue, M.; Hoda, A.; Huang, H.; Park, D. Impacts of Mississippi River Diversions on Salinity Gradients in a Deltaic Louisiana Estuary: Ecological and Management Implications. Estuar. Coast. Shelf Sci. 2012, 111, 17–26. [Google Scholar] [CrossRef] [Scilit]
- Kingsford, R.T. Ecological Impacts of Dams, Water Diversions and River Management on Floodplain Wetlands in Australia. Austral Ecol. 2000, 25, 109–127. [Google Scholar] [CrossRef]
- Liu, Q.; Li, F.; Zhang, Q.; Li, J.; Zhang, Y.; Tu, C.; Ouyang, Z. Impact of Water Diversion on the Hydrogeochemical Characterization of Surface Water and Groundwater in the Yellow River Delta. Appl. Geochem. 2014, 48, 83–92. [Google Scholar] [CrossRef] [Scilit]
- Sklar, F.H.; Browder, J.A. Coastal Environmental Impacts Brought About by Alterations to Freshwater Flow in the Gulf of Mexico. Environ. Manag. 1998, 22, 547–562. [Google Scholar] [CrossRef] [Scilit] [PubMed]
- Sklar, F.H.; Chimney, M.J.; Newman, S.; McCormick, P.; Gawlik, D.; Miao, S.; McVoy, C.; Said, W.; Newman, J.; Coronado, C.; et al. The Ecological–Societal Underpinnings of Everglades Restoration. Front. Ecol. Environ. 2005, 3, 161–169. [Google Scholar] [CrossRef] [Scilit]
- Buzzelli, C.; Chen, Z.; Doering, P.; Kahn, A. Assessment of Freshwater Inflow and Water Quality for an Urbanized, Subtropical Estuary (Lake Worth Lagoon, Florida, USA). Mar. Technol. Soc. J. 2018, 52, 19–31. [Google Scholar] [CrossRef] [Scilit]
- Herbert, D.A.; Perry, W.B.; Cosby, B.J.; Fourqurean, J.W. Projected Reorganization of Florida Bay Seagrass Communities in Response to the Increased Freshwater Inflow of Everglades Restoration. Estuaries Coasts 2011, 34, 973–992. [Google Scholar] [CrossRef] [Scilit]
- Lewis, D.M.; Cook, G.S. Freshwater Discharge Disrupts Linkages between the Environment and Estuarine Fish Community. Ecol. Indic. 2023, 151, 110282. [Google Scholar] [CrossRef] [Scilit]
- Montefiore, L.R.; Kaplan, D.; Phlips, E.J.; Milbrandt, E.C.; Arias, M.E.; Morrison, E.; Nelson, N.G. Downstream Nutrient Concentrations Depend on Watershed Inputs More Than Reservoir Releases in a Highly Engineered Watershed. Water Resour. Res. 2024, 60, e2023WR035590. [Google Scholar] [CrossRef] [Scilit]
- Rumbold, D.; Doering, P. Water Quality and Source of Freshwater Discharge to the Caloosahatchee Estuary, Florida: 2009–2018. J. Am. Water Resour. Assoc. 2020, 83, 2–20. [Google Scholar] [CrossRef] [Scilit]
- Wang, M.; Nim, C.J.; Son, S.; Shi, W. Characterization of Turbidity in Florida’s Lake Okeechobee and Caloosahatchee and St. Lucie Estuaries Using MODIS-Aqua Measurements. Water Res. 2012, 46, 5410–5422. [Google Scholar] [CrossRef] [Scilit] [PubMed]
- Whitall, D.; Williams, G.J.; Aeby, G.S.; Davies, A.; Spring, D.L.; Walker, B.K. Terrestrial Runoff and Meteorology Drive Changes in Coral Reef Water Quality in Southeast Florida. Mar. Ecol. Prog. Ser. 2025, 774, 123–141. [Google Scholar] [CrossRef] [Scilit]
- Harris, A.; Porter, M.; McKay, S.K.; Mulchandani, A.; Stone, M. Hydraulic Analysis for Assessing Environmental Flow Selection and Ecological Model Formulation. Ecohydrology 2024, 17, e2681. [Google Scholar] [CrossRef] [Scilit]
- Armstrong, C.; Piccone, T.; Dombrowski, J. The Largest Constructed Treatment Wetland Project in the World: The Story of the Everglades Stormwater Treatment Areas. Ecol. Eng. 2023, 193, 107005. [Google Scholar] [CrossRef] [Scilit]
- Crigger, D.; Graves, G.; Fike, D. Lake Worth Lagoon Conceptual Ecological Model. Wetlands 2005, 25, 943–954. [Google Scholar] [CrossRef] [Scilit]
- Florida Department of Environmental Protection Verified List of Impaired Waters in the Group 3 Basins Cycle 3- Lake Worth Lagoon—Palm Beach Coast. Available online: https://floridadep.gov/dear/watershed-assessment-section/documents/verified-list-impaired-waters-group-3-basins-cycle-3-1 (accessed on 12 June 2023).
- Daroub, S.H.; Rodriguez, A.F.; Lang, T.A.; Tootoonchi, M. Water Quality Trends in the West Palm Beach C-51 Canal Impacting Lake Worth Lagoon; Everglades Research and Education Center, Institute of Food and Agriculture, University of Florida: Gainesville, FL, USA, 2020. [Google Scholar]
- Rodriguez, A.F.; Tootoonchi, M.; Daroub, S.H. Changes in Nitrogen and Phosphorus within a Decade in Waters along a Major Canal and Estuary in South Florida. J. Environ. Qual. 2022, 51, 826–836. [Google Scholar] [CrossRef] [Scilit] [PubMed]
- Palm Beach County Lake Worth Lagoon Management Plan. 2021. Available online: https://discover.pbcgov.org/erm/LWLagoon/Management-Plan.aspx (accessed on 12 June 2023).
- Trefry, J.H.; Trocine, R.P.; Bennett, H. Sediment Sourcing Study of Lake Worth Lagoon and C-51 Basin, Palm Beach County; Florida Institute of Technology: Melbourne, FL, USA, 2009. [Google Scholar]
- Rice, R.; Bhadah, J.; Lang, T.; Daroub, S.; Baucum, L. Farm-Level Phosphorus-Reduction Best Management Practices in the Everglades Agricultural Area. Proc. Fla. State Hortic. Soc. 2013, 126, 300–304. [Google Scholar]
- Welch, Z.; Jones, P.; Olson, S.; Baranski, M.; Betts, A.; Carruthers, H.; Chastant, J.; Marchio, D.; Zamorano, M. Chapter 8B: Lake Okeechobee Watershed Protection Plan; South Florida Water Management District: West Palm Beach, FL, USA, 2025.
- Shuford, R.; Otero, J.; Harris, J. Chapter 5A: Restoration Strategies—Design and Construction Status of Water Quality Improvement Projects. In 2026 South Florida Environmental Report—Volume I; South Florida Water Management District: West Palm Beach, FL, USA, 2026. [Google Scholar]
- McBryan, J.; Reilly, L. L-8 Reservoir/Flow Equalization Basin Project Draft Project Operations Manual; South Florida Water Management District: West Palm Beach, FL, USA, 2015.
- DB Environmental. L-8 FEB and STA Operational Guidance Study; South Florida Water Management District: West Palm Beach, FL, USA, 2020.
- South Florida Water Management District DBHYDRO (Environmental Data). Available online: https://www.sfwmd.gov/science-data/dbhydro (accessed on 3 May 2023).
- Parkinson, R.W.; Orimolade, O.; Jerez, L.M. Channel Geometry and Sediment Distribution in the Lake Worth Lagoon Modified Watershed; Floria International University: Miami, FL, USA, 2025. [Google Scholar]
- Helsel, D.; Hirsch, R.; Ryberg, K.; Archfield, S.; Gilroy, E. Chapter 3A Statistical Methods in Water Resources. In Statistical Analysis; Book 4 Hydrological Analysis and Interpretation; US Department of the Interior: Washington, DC, USA, 2020. [Google Scholar] [CrossRef] [Scilit]
- R Core Team. R: A Language and Environment for Statistical Computing; R Foundation for Statistical Computing: Vienna, Austria, 2016. [Google Scholar]
- South Indian River Water Control District South Florida’s Drier than Normal Wet Season. Available online: https://www.sirwcd.org/south-florida-s-drier-than-normal-wet-season#page-content (accessed on 30 December 2025).
- United States Army Corps of Engineers Lake Okeechobee Recovery Operations Begin 7 December 2024. Available online: https://www.saj.usace.army.mil/Media/News-Releases/Article/3987238/lake-okeechobee-recovery-operations-begin-december-7/ (accessed on 1 May 2026).
- Daroub, S.H.; Van Horn, S.; Lang, T.A.; Diaz, O.A. Best Management Practices and Long-Term Water Quality Trends in the Everglades Agricultural Area. Crit. Rev. Environ. Sci. Technol. 2011, 41, 608–632. [Google Scholar] [CrossRef] [Scilit]
- EutroPHIX. Reducing Legacy Phosphorus to Help Improve Water Quality and Ecosystem Function. 2026. Available online: https://restorelakeokeechobee.com/#overview (accessed on 1 May 2026).
- Fox, A.L.; Trefry, J.H. Environmental Dredging to Remove Fine-Grained, Organic-Rich Sediments and Reduce Inputs of Nitrogen and Phosphorus to a Subtropical Estuary. Mar. Technol. Soc. J. 2018, 52, 42–57. [Google Scholar] [CrossRef] [Scilit]
- Pickering, N.; Baker, E. Watershed Scale Planning to Reduce the Land-Based Sources of Pollution (LBSP) for the Protection of Coral Reefs in Southeast Florida; Horsley Witten Group: Sandwich, MA, USA, 2015. [Google Scholar]
- South Florida Engineering and Consulting. C-51 Canal Sediment Trap Assessment; South Florida Water Management District: West Palm Beach, FL, USA, 2020.

Disclaimer/Publisher’s Note: The statements, opinions and data contained in all publications are solely those of the individual author(s) and contributor(s) and not of MDPI and/or the editor(s). MDPI and/or the editor(s) disclaim responsibility for any injury to people or property resulting from any ideas, methods, instructions or products referred to in the content. |
© 2026 by the authors. Licensee MDPI, Basel, Switzerland. This article is an open access article distributed under the terms and conditions of the Creative Commons Attribution (CC BY) license.