


Abstract
Coffee quality results from the interplay between genotype, environment, and cultivation practices, but whether the effect of agricultural management depends on altitude remains poorly understood. We hypothesized that the response of roasted coffee chemistry and cup quality to management would differ among altitudinal zones. Composite samples representative of sustainable and conventional management in three altitudinal zones (low, <900; mid, 900–1100; high, >1100 m.a.s.l.) were obtained from eighteen commercial Coffea arabica L. farms in Veracruz, Mexico (management monitored in 2023–2024 and 2024–2025; cherries sampled in the 2024–2025 harvest), and their physicochemical properties, phenolic compounds, caffeine, in vitro antioxidant capacity, and Specialty Coffee Association (SCA) cup quality were evaluated. Altitude was the main source of variation in pH, total phenolic and flavonoid contents, and total cup score. In contrast, management mainly affected chlorogenic acids (CGA), caffeine, and hydrolyzable tannins, which were higher under sustainable management (CGA: 22.52 vs. 16.82 mg g−1). The management × altitude interaction was significant (p ≤ 0.017) for all phenolic compounds, caffeine, and antioxidant assays, with the largest differences between systems in the mid zone, where sustainable samples showed the highest CGA (30.27 mg g−1) and FRAP values (675.30 µmol Trolox equivalents g−1). All samples reached specialty grade (82.08–84.75 points); total cup score increased with altitude and did not differ between management systems. These results indicate that management effects on coffee chemistry depend on altitude.
1. Introduction
Coffee is one of the most consumed beverages worldwide and an agricultural product with significant economic and social relevance. More than 25 million families depend on its production, with over 160 million bags commercialized annually. Brazil, Vietnam, Indonesia, and Colombia lead global production, while Mexico is the world’s ninth-largest coffee producer [1]. Its popularity stems from a combination of sensory qualities, stimulating effects, and antioxidant properties, driven by a complex chemical profile that includes chlorogenic acids, sugars, trigonelline, lipids, caffeine, and other metabolites that shape flavor, aroma, mouthfeel, and balance [2]. Caffeine, the main coffee alkaloid, exerts stimulating effects by blocking adenosine receptors in the central nervous system [3]. At the same time, phenolic compounds such as chlorogenic acids, caffeic acid, ferulic acid, p-coumaric acid, quercetin, and tannins contribute to the prevention of chronic diseases through their antioxidant, anti-inflammatory, antipyretic, and antineoplastic properties [4,5].
These metabolites activate antioxidant pathways such as Nrf2 and HO1, reinforcing their potential for health benefits [6,7,8]. The chemical composition of coffee, and thus its quality, depends on factors such as variety, geographical origin, agricultural management, and environmental conditions [9]. Coffea arabica L. is the most appreciated species for its sensory complexity, attributed to its allotetraploid genome, which allows broad regulation of metabolic pathways that favor the accumulation of caffeine, lipids, terpenes, and chlorogenic acids, key compounds in the sensory and functional profile of coffee [10,11]. Among the environmental factors, altitude is one of the most decisive for coffee quality [12]. At higher altitudes, the decrease in temperature modifies photosynthetic and transpiration rates [13], which induces slower fruit ripening and favors the accumulation of sucrose, fatty acids, and volatile compounds that intensify attributes such as aroma, taste, mouthfeel, acidity, and sweetness [14,15].
In contrast, low altitude zones with elevated temperatures accelerate ripening, reduce desirable flavor precursors, increase compounds associated with green or green earthy notes, and increase the incidence of sensory defects [16]. Agricultural management also influences coffee quality. Conventional management, based on synthetic fertilizers and pesticides, increases the availability of nitrogen and phosphorus, stimulating the expression of methyltransferase genes and favoring the biosynthesis of caffeine and flavonoids such as quercetin [7,8].
As a result, medium-light roasted coffees under conventional management have shown elevated levels of caffeine, phenols, flavonoids, and chlorogenic acids [17]. However, evidence also supports a superior bioactive profile in coffees produced under sustainable management. Studies report significantly higher concentrations of phenolic acids and flavonoids in sustainable systems [18], attributable to conditions such as increased organic matter, active soil microbiota, UV-shading, optimized water balance, and careful post-harvest handling factors that favor the synthesis and conservation of bioactive metabolites [19,20,21]. In addition, sustainable management brings environmental and social benefits such as conservation of biodiversity, use of organic inputs, soil and water protection, fair trade, and access to differentiated markets [22]. In contrast, conventional management can lead to erosion, soil acidification, changes in the soil microbial community, and water pollution.
Despite these advances, the interaction between altitude and management systems remains poorly resolved. Previous work has typically examined altitude and management as independent factors or assessed them within a single production system, so few studies have tested, as an explicit interaction term, the extent to which altitude modulates bean chemistry responses to management practice. Moreover, studies that integrate physicochemical composition, bioactive profile, antioxidant capacity, and certified sensory grading on the same set of commercial farms are scarce, and Mesoamerican mid-altitude coffee (below 1400 m.a.s.l.) is markedly under-represented in this literature relative to Andean, Brazilian, and East African origins. This absence is particularly relevant for the state of Veracruz, one of the main coffee-growing regions, recognized for its high yields, agroecological diversity, and cup quality, which makes it a national benchmark for Coffea arabica L. production.
Accordingly, this study aimed to evaluate the effect of agricultural management (sustainable and conventional) in three altitudinal zones (low, medium, and high) of the state of Veracruz, Mexico, on the physicochemical properties, phenolic compounds, caffeine, in vitro antioxidant capacity, and sensory quality of roasted coffee (Coffea arabica L.). We hypothesized that bean chemistry and cup quality would respond differently to agricultural management across altitudinal zones, meaning we expected a significant management × altitude interaction.
2. Materials and Methods
2.1. Plant Material, Management System and Production Area
We conducted the study at eighteen commercial Coffea arabica L. farms in the coffee-producing region of Veracruz, Mexico, distributed across three altitudinal zones: low zone (<900 m.a.s.l.), mid zone (900–1100 m.a.s.l.), and high zone (>1100 m.a.s.l.). Within each altitudinal zone, six farms were included, three managed under a sustainable system and three under a conventional system, yielding three farms per management × altitude combination for a total of eighteen farms across the study area (Table 1). Plant selection criteria were standardized across all sites: only five-year-old plants of cultivar Colombia, planted at a density of 2 × 1.5 m and exhibiting similar canopy diameter, were eligible for inclusion. Farms under the sustainable system had been managed under certified organic practices for an average of 12 years, whereas the conventional farms had been under uninterrupted conventional management over a comparable period; both systems therefore represented long-established production conditions rather than recent conversions. Farms were selected according to the following criteria: (i) certified organic or uninterrupted conventional management for at least ten years; (ii) plantations of cultivar Colombia of the same age and planting density; and (iii) location within the elevation range of the corresponding altitudinal zone. To verify that each farm consistently followed its declared management system, we monitored agronomic practices over two consecutive production cycles (2023–2024 and 2024–2025) through farm visits and producer records. Coffee cherries were sampled only during the second cycle (2024–2025 harvest; November 2024–February 2025).
Table 1.
Characterization of the eighteen Coffea arabica L. farms included in the study, distributed across altitudinal zones and management systems in Veracruz, Mexico.
2.1.1. Management System
Sustainable management: Sustainable management was characterized by the absence of synthetic fertilizers or chemical inputs. Nutrition was provided exclusively through compost prepared on-farm by the producers with coffee pulp, goat manure, zeolite, dolomitic lime, and phosphoric rock, materials locally available in the region and permitted under organic certification standards, with a nutritional composition of 35% organic matter, 1.1% nitrogen (N), 1% phosphorus (P), 2% potassium (K), and 1.8% magnesium (Mg). Compost was applied at 2 kg per plant per season, with timing adjusted by altitudinal zone: February for low-zone farms and March for mid- and high-zone farms, in each monitored cycle (2023 and 2024), to align with the crop’s phenological stage at each elevation. Weed control was performed manually four times per year (January, March, July, and October). We pruned coffee plants and shade trees in February of each monitored cycle (2023 and 2024).
Conventional management: Nutrition was provided through a commercial NPK fertilizer (20-10-20; Yara, Isla Veracruz, Mexico), applied in two doses of 120 g per plant in June and October of each monitored cycle (2023 and 2024). Weed control was performed manually twice per year (February and August). Pruning was carried out in February of each monitored cycle (2023 and 2024). In both systems, workers selectively hand-harvested fully ripe coffee cherries.
2.1.2. Coffee-Growing Region and Altitudinal Conditions
We defined zone boundaries based on elevation alone, following the altitudinal strata conventionally used in Mexican coffee production agroecology; we used the Köppen–Geiger climate classification [23] only to describe each zone’s climate, not to delimit the altitudinal strata. We unambiguously assigned all eighteen farms to their respective zones based on GPS-recorded altitude measurements.
Low zone (˂900 m.a.s.l.): Six farms were located in this zone, three under sustainable management (farms 7–9; 876–885 m.a.s.l.; 19.100–19.146° N, 96.848–96.857° W) and three under conventional management (farms 16–18; 767–799 m.a.s.l.; 19.067–19.334° N, 96.815–96.860 °W). The area is characterized by Aw, Cwa, and Cfa climates, with mean annual temperatures of 18–26 °C and annual precipitation of 900–2100 mm. The predominant soils are Leptosol (70.44%), Andosol (13.52%), Luvisol (10.67%), Vertisol (2.79%), and Phaeozem (2.08%).
Middle zone (900–1100 m.a.s.l.): Six farms were located in this zone, three under sustainable management (farms 4–6; 954–1014 m.a.s.l.; 19.308–19.318° N, 96.912–96.923° W) and three under conventional management (farms 13–15; 973–1084 m.a.s.l.; 19.103–19.124° N, 96.910–96.915° W). The climate is Aw and Cwa, with mean annual temperatures of 20–26 °C and annual precipitation of 1100–1600 mm. The predominant soils are Leptosol (65.28%), Luvisol (28.06%), Phaeozem (6.02%), and Vertisol (0.33%).
High zone (˃1100 m.a.s.l.): Six farms were located in this zone, three under sustainable management (farms 1–3; 1335–1378 m.a.s.l.; 19.158–19.164° N, 96.960–96.986° W) and three under conventional management (farms 10–12; 1300–1362 m.a.s.l.; 19.144–19.168° N, 96.950–96.986° W). The climate is Cfa and Aw, with mean annual temperatures of 16–26 °C and annual precipitation of 1100–1600 mm. The predominant soils are Andosol (44.28%), Luvisol (42.88%), and Leptosol (9.87%).
2.2. Experimental Design
A 2 × 3 factorial arrangement was adopted, with management system (sustainable, S; and conventional, C) and altitudinal gradient (low, L; mid, M; and high, H) as fixed factors, yielding six factor-level combinations (SL, SM, SH, CL, CM, CH).
Within each farm, five representative plants were randomly selected and spatially distributed across the entire farm surface. Each selected plant met the same morphological criteria (canopy diameter, stem diameter, plant age, and cultivar). We harvested all ripe cherries from each of the five selected plants separately at commercial maturity (full red color) during the 2024–2025 harvest (November 2024–February 2025). For each plant, three independent subsamples were obtained from different canopy positions (upper, middle, and lower thirds), yielding 15 subsamples per farm (5 plants × 3 positions). The subsamples from the three farms of each management × altitude combination (45 subsamples) were pooled to obtain a composite sample representative of each production condition, analogous to a commercial lot. All analytical determinations were performed in triplicate on each composite sample.
2.3. Sample Processing
Postharvest processing followed a standard two-stage wet-dry method. In the wet processing stage, cherries were pulped on the day of harvest using a disc pulper (10 kg capacity). Natural fermentation removed mucilage for 24 h at ambient temperature, followed by thorough washing with pressurized potable water. Beans were then dried in the shade to a moisture content of 12% (w.b.), verified with a grain moisture meter. In the dry processing stage, we weighed parchment coffee (250 g per replicate) and hulled it using a mechanical coffee huller. The resulting green coffee beans were visually selected following [23] quality standards, packed in sealed airtight bags, and stored at room temperature in a dry environment until roasting.
We roasted the beans in a drum roaster (BYZ-4-L550, Nanyang Dongyi Machinery Equip. Co., Ltd., Nanyang, China) at 180 °C for 6 min, reaching a medium roast level confirmed by visual color assessment against the Agtron roast color reference scale (Agtron Inc., Reno, NV, USA). The beans were immediately air-cooled to room temperature and degassed for 24 h before grinding and laboratory analysis.
2.4. Determination of Physicochemical Properties
The physicochemical properties of roasted coffee were determined from 10 g of ground sample. The pH was measured following the methodology described by Huang et al. [24], using a pH meter (OAKTON, pH550, Cole-Parmer, Vernon Hills, IL, USA). The titratable acidity was quantified according to AOAC International [25] method 942.15, by titration with NaOH (0.1 N) and using bromothymol blue (1%) as an indicator; results were expressed as chlorogenic acid equivalents (% CGA eq), since chlorogenic acids are among the main acid compounds in roasted coffee. Color was evaluated with a colorimeter (CM508d, Minolta Camera Co., Ltd., Osaka, Japan), and the L*, a*, and b*values were used to calculate chroma (C*) and hue angle (h°).
2.5. Determination of Phenolic Compounds, Tannins and Caffeine
All reagents were of analytical grade (≥98% purity) and were purchased from Sigma-Aldrich (St. Louis, MO, USA). Extracts were prepared from 10 g of ground roasted coffee with methanol 80% (v v−1) by ultrasound-assisted extraction (Ultrasonic Cleaner 32V118A, Ultrasonic Power Corporation, Freeport, IL, USA) for 30 min, followed by centrifugation at 10,000× g for 10 min. Total phenolic content was determined by the Folin–Ciocalteu method described by Singleton et al. [26]. Absorbance was measured at 725 nm on a UV/Visible spectrophotometer (GENESYS 150, Thermo Fisher Scientific, Waltham, MA, USA). The results were expressed as milligrams of gallic acid equivalents per gram of dry weight (mg GAE g−1 DW). The flavonoid content was quantified based on the formation of the AlCl3·6H2O complex [27]. Results were expressed as milligrams of quercetin equivalents per gram of dry weight (mg QE g−1 DW). Hydrolyzable tannins were quantified according to Willis [28] using 0.5 mL of sample and 2.5 mL of 2.5% potassium iodate; absorbance was recorded at 550 nm; results were expressed as milligrams of tannic acid equivalent per gram of dry weight (mg TAE g−1 DW). Condensed tannins were determined using the vanillin assay described by Wu et al. [29] at 4% by measuring absorbance at 500 nm, and the results were expressed in milligrams of catechin equivalents per gram of dry weight (mg CE g−1 DW). Caffeine and chlorogenic acids (CGA) were determined using the methodology of Atlabachew et al. [30]. After acetonitrile extraction, the upper phase was diluted 1:20 (v/v) and used for subsequent spectrophotometric readings at 274 nm (caffeine) and 325 nm (CGA), with results expressed in mg g−1. Quantification was performed using external calibration curves prepared with caffeine and chlorogenic acid standards (R2 = 0.9973 and R2 = 0.9957, respectively).
2.6. Determination of Antioxidant Activity
Antioxidant activity was evaluated using three complementary methods: DPPH• radical scavenging activity [31], reduction of the ABTS•+ radical cation according to [32] and the ferric reducing antioxidant power (FRAP) assay according to Benzie & Strain [33]. Absorbance readings were recorded on the same UV/Visible spectrophotometer described in Section 2.5 (GENESYS 150, Thermo Fisher Scientific, Waltham, MA, USA) at 515 nm (DPPH), 734 nm (ABTS) and 593 nm (FRAP). The results were expressed as micromoles of Trolox equivalents per gram of dry weight (μmol TE g−1 DW). All assays were performed in triplicate.
2.7. Sensory Evaluation Procedure
The sensory quality of roasted coffee was evaluated by a panel of three Q-Graders certified by the Coffee Quality Institute (CQI) under the standards of the Specialty Coffee Association (SCA) [23]. Samples were presented in randomized and blinded order using three-digit codes to prevent bias. Each evaluator independently assessed five cups per sample following the SCA Cupping Protocol [23] fragrance/aroma, flavor, aftertaste, acidity, body, balance, and overall impression were scored from 6 to 10 points in 0.25-point increments, whereas uniformity, clean cup, and sweetness were scored by assigning 2 points per acceptable cup (maximum 10 points). For each cup, we extracted medium-roasted ground coffee (8.25 g) with 150 mL of water at 93 °C. The cupping session was conducted in a standardized environment free of interfering odors, at a controlled room temperature of 20–25 °C.
The sensory evaluation was conducted in accordance with the ethical principles of the Declaration of Helsinki [34]. Participation was voluntary, and all Q-Graders provided informed verbal consent before the sessions and could withdraw at any time. Verbal rather than written consent was obtained because the evaluation was a no-risk professional grading of a food product and no personal data were collected. In coffee cupping, the evaluators act as trained judges of product quality rather than as research subjects; no personal, physiological, or health-related information about them was collected, and the samples were commercially acceptable food products [35]. Under Mexican regulations, this activity corresponds to research without risk (Article 17, Section I) [36].
2.8. Statistical Analysis
Data were analyzed by two-way ANOVA with management systems, altitudinal zone, and their interaction as fixed factors, using the analytical replicates (n = 3) of each composite sample; sensory scores were analyzed using the Q-Grader as a blocking factor (n = 3 evaluators). F statistics and p values are reported in Table S1. Normality and homoscedasticity of residuals were verified with the Shapiro–Wilk and Levene tests; slight departures from normality were found only for total flavonoid content and overall impression (p = 0.039 and 0.006), to which ANOVA is robust given the balanced design. Means were compared by Tukey’s HSD test (p ≤ 0.05). We applied PCA to the standardized sensory attributes and RDA to the standardized bioactive compounds, constrained by management systems and mean elevation, with significance tested by 999 permutations. All analyses were performed in Python 3.12 (statsmodels 0.15, SciPy 1.17, and NumPy 2.4), and figures were generated with Matplotlib 3.10.
3. Results and Discussion
3.1. Physicochemical Properties
Table 2 shows the effects of management system and altitudinal zone on pH, titratable acidity (TA), and color parameters. Management affected only TA, which was higher in the conventional samples (8.94 vs. 8.12% CGA eq.; p = 0.022). A possible explanation is the higher nitrogen supply under NPK fertilization, although this was not assessed in the present study; TA is a key chemical descriptor associated with perceived sourness in coffee [37]. Altitude had a stronger effect (Table S1): the mid-altitude samples showed the highest TA (9.95% CGA eq.) and the lowest pH (4.77), whereas the low-altitude samples showed the lowest TA (7.24% CGA eq.). Higher temperatures at low altitude accelerate fruit respiration and ripening, which has been associated with lower organic acid contents in the bean [38,39].
Table 2.
Effect of agricultural management system, altitudinal zone and their interaction on the physicochemical properties in coffee beans (Coffea arabica L.).
Altitude also affected color: the mid-altitude samples showed the highest chroma (C* = 6.70) and angle (h° = 45.41°), whereas the low-altitude samples showed the lowest values (4.85 and 41.49°, respectively); lightness (L*) did not differ among treatments. Since all samples were roasted under the same conditions, these differences likely reflect variations in the precursors of Maillard reactions and caramelization, such as sugars, free amino acids, and CGA, which determine melanoidin formation and the color of roasted coffee [40,41]. The management × altitude interaction was not significant for pH, TA, or color parameters (p = 0.084–0.516; Table S1), indicating that these properties were mainly determined by altitude.
3.2. Total Phenolic Content, Flavonoids and Chlorogenic Acids
Total phenols, flavonoids, and chlorogenic acids (CGAs) differed significantly between treatments (Table 3). The conventional samples showed slightly higher total phenolic (38.59 vs. 36.99 mg GAE g−1) and flavonoid contents (27.25 vs. 24.41 mg QE g−1) than the sustainable samples. A plausible but untested explanation is the higher nitrogen supply under NPK fertilization (20-10-20), since nitrogen availability has been associated with stimulation of phenylalanine ammonia-lyase (PAL) activity, a key enzyme of the phenylpropanoid pathway, in other crops [16,42].
Table 3.
Effect of agricultural management system, altitudinal zone, and their interaction on total phenolic content, total flavonoid content, chlorogenic acids, tannins, and caffeine in roasted coffee (Coffea arabica L.).
In contrast, CGAs were 33.9% higher in the sustainable samples (22.52 vs. 16.82 mg g−1). Although CGAs, flavonoids, and other phenolics share the phenylpropanoid pathway, they do not necessarily respond uniformly to nitrogen availability; in other plant systems, a higher nitrogen supply has been associated with a preferential allocation toward the flavonoid branch [43], and in coffee, PAL isoforms with different roles in CGA and flavonoid accumulation have been described [44]. Whether these mechanisms operate under the field conditions of this study remains to be tested. Total phenolic and CGA contents were comparable to those reported by Liao et al. [45] for medium-light roasted Arabica coffee from Brazil, Ethiopia, and Mexico.
Altitude strongly affected these compounds. The mid-altitude samples showed the highest total phenolic (42.14 mg GAE g−1) and flavonoid contents (33.66 mg QE g−1), followed by the low-altitude samples, whereas the high-altitude samples showed the lowest values (33.47 mg GAE g−1 and 16.18 mg QE g−1), 20.57% and 51.93% lower than in the mid zone. Similar peaks of phenolic compounds at intermediate elevations have been reported by Zaman et al. [46] and attributed to moderate temperatures and radiation levels.
CGAs showed a different pattern: it was similarly high in the mid (24.54 mg g−1) and high zones (22.17 mg g−1) and lowest in the low zone (12.31 mg g−1). Lower temperatures and higher UV radiation at higher elevations have been associated with the accumulation of defense-related phenolics, including CGA [47]. These CGA contents were similar to those reported by Rusinek et al. [48] for Arabica coffees from Peru, Costa Rica, Guatemala, and Ethiopia.
The management × altitude interaction was significant for total phenolics, flavonoids, and CGAs (p < 0.001; Table S1), indicating that the effect of management differed among altitudinal zones. The sustainable × mid-altitude samples had the highest total phenolic and flavonoid contents (SM: 43.56 mg GAE g−1 and 36.07 mg QE g−1). It is possible that the intermediate conditions of this zone favored the response to organic matter inputs, which release nutrients gradually and stimulate soil microbial activity [20,21] however, this hypothesis requires confirmation in studies including farm-level replication.
In contrast, in the low and high zones, conventional samples showed higher total phenolic and flavonoid contents than sustainable samples (Table 3); hence, the management effect changed with altitude. For CGA, sustainable samples showed higher values in the mid (SM: 30.27 mg g−1) and high zones (SH: 25.38 mg g−1), whereas the low zone showed no differences between management systems (11.93–12.70 mg g−1). Thus, the largest management-related difference in CGAs occurred at mid altitude, a pattern that may be related to the moderate temperatures and UV radiation of this zone [46]. In the low zone, conventional farms were located at slightly lower elevations than sustainable farms (767–799 vs. 876–885 m.a.s.l.; Table 1), which may have contributed to the differences observed between management systems in this zone.
3.3. Content of Hydrolyzable and Condensed Tannins
Tannins are water-soluble polyphenols able to form complexes with proteins and polysaccharides, and they act as defense compounds against herbivores and pathogens [49]. In coffee, condensed (CT) and hydrolyzable (HT) tannins have been associated with antimicrobial and antioxidant activities [50]. CT did not differ between management systems (21.01 vs. 20.40 mg CE g−1; p = 0.349), suggesting that their accumulation is less sensitive to nitrogen availability [42]. In contrast, HT were higher in the sustainable samples (26.22 vs. 18.15 mg TAE g−1). A plausible but untested explanation is the high C/N ratio of organically managed systems, which in other species has been associated with greater allocation of carbon to gallic acid-derived compounds [13].
Altitude also affected tannin contents. CT were highest in the low (22.93 mg CE g−1) and high zones (21.88 mg CE g−1) and lowest in the mid zone (17.31 mg CE g−1), whereas HT were highest in the low zone (24.68 mg TAE g−1). Higher temperatures and herbivore pressure at low elevations, and lower temperatures and higher UV radiation at high elevations, have been associated with the accumulation of defense-related polyphenols, including tannins [42,49]. In the mid zone, where CGAs and flavonoids reached their highest values, CT showed its lowest values, suggesting a different allocation among phenolic classes under these conditions. The interaction was significant for both tannin types (Table S1): the highest CT and HT contents were found in the sustainable × low-altitude samples (SL: 26.09 mg CE g−1 and 28.81 mg TAE g−1), while the lowest values corresponded to SM for CT (16.18 mg CE g−1) and to CM for HT (16.03 mg TAE g−1).
3.4. Caffeine Content
Caffeine contents ranged from 14.81 to 35.04 mg g−1 (Table 3). A value of 17.19 mg g−1 has been reported for medium-roasted coffee by Atlabachew et al. [30], close to the lowest values found in this study (CM and CL), Duangjai et al. [51] reported 27.65 mg g−1 in medium-roasted Arabica coffee. The sustainable samples showed 48.15% more caffeine than the conventional samples (28.92 vs. 19.52 mg g−1). Viana et al. [20] reported that shaded, organically managed systems generate microenvironments with moderate physiological stress and greater microbial activity, conditions that have been associated with caffeine accumulation. Because we quantified caffeine by UV spectrophotometry, we cannot completely rule out a partial contribution of other UV-absorbing compounds, such as CGA, to the measured values.
Caffeine increased with altitude (low: 18.26; mid: 24.93; high: 29.47 mg g−1), a pattern that has been attributed to lower temperatures and slower fruit maturation at high elevations [52]. The high-altitude farms (1300–1378 m.a.s.l.) were located approximately 500 m above the low-altitude farms (767–885 m.a.s.l.), which, considering a typical decrease in air temperature of about 0.6 °C per 100 m of elevation [53] corresponds to mean temperatures roughly 3 °C lower. The interaction followed a pattern similar to CGA: sustainable × mid-altitude samples showed the highest caffeine content (SM: 35.04 mg g−1), and the largest difference between management systems occurred in the mid zone. Caffeine and CGAs were strongly correlated (r = 0.82; Figure 1C), which agrees with reports of co-regulation of both compounds in coffee [54,55].
Figure 1.
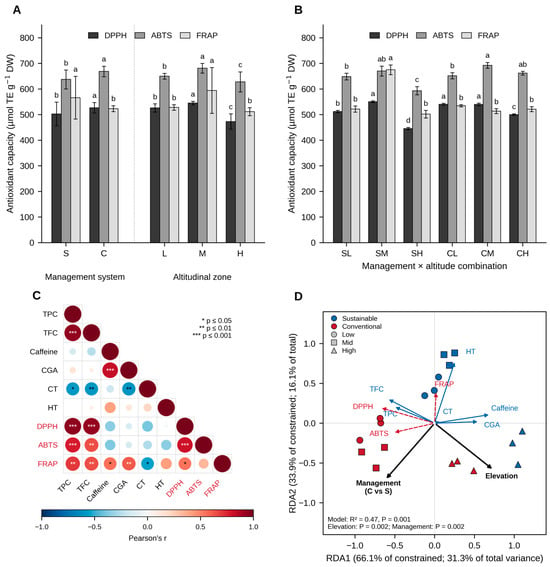
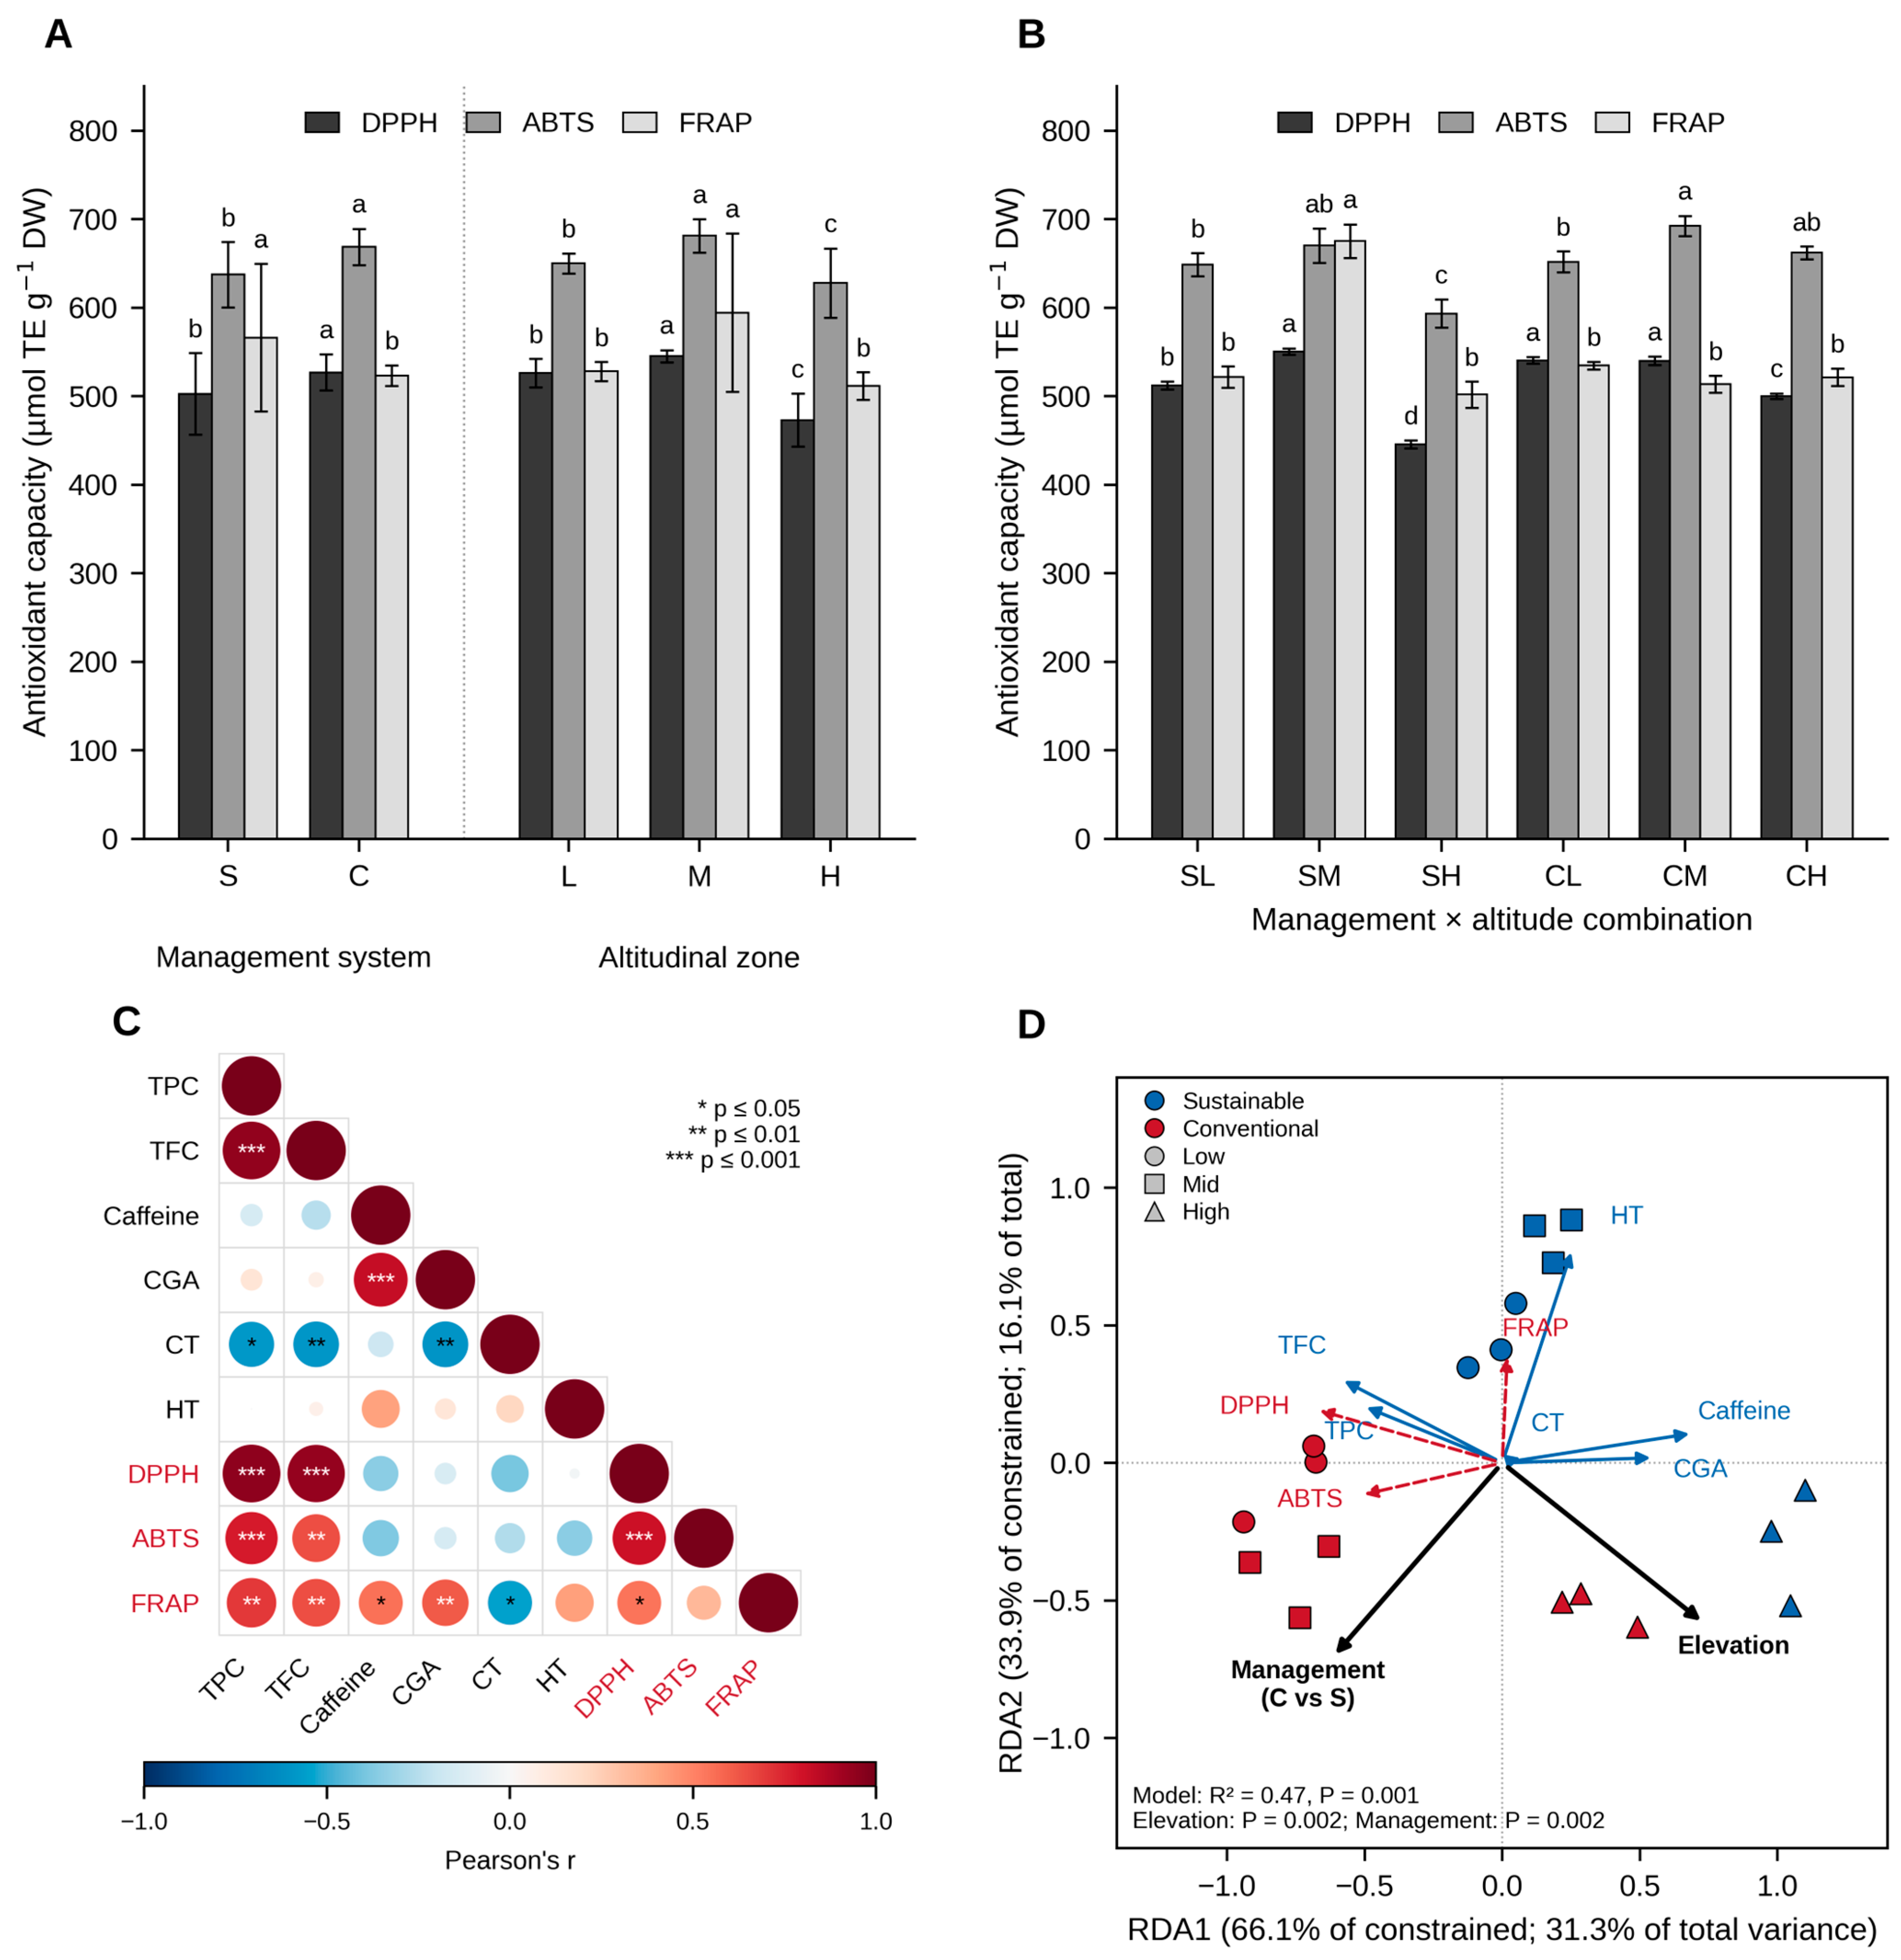
In vitro antioxidant capacity of roasted coffee (Coffea arabica L.): (A) Main effects of management system (S, sustainable; C, conventional) and altitudinal zone (L, low; M, mid; H, high); (B) management × altitude combinations (SL, SM, SH: sustainable management in the low, mid, and high zones; CL, CM, CH: conventional management in the low, mid, and high zones). (C) Pearson correlation matrix between bioactive compounds and antioxidant assays (n = 18), antioxidant assays are labeled in red and bioactive compounds in black; (D) redundancy analysis (RDA) of bioactive compounds constrained by management system and mean elevation of each management × altitude combination, with antioxidant assays projected as supplementary variables (dashed red arrows); solid blue arrows represent bioactive compounds and solid black arrows represent the constraining variables; model significance was assessed with 999 permutations. Bars represent mean ± SD (n = 9 for management, n = 6 for altitude, and n = 3 analytical replicates for combinations). Within each assay and factor, different lowercase letters above the bars indicate significant differences (Tukey’s HSD, p ≤ 0.05). TPC: total phenolic content; TFC: total flavonoid content; CGA: chlorogenic acids; CT: condensed tannins; HT: hydrolyzable tannins; TE: Trolox equivalents; DW: dry weight.
3.5. Antioxidant Activity
Management significantly affected the three assays (Figure 1A). Conventional samples showed higher DPPH (526.88 ± 20.32 μmol TE g−1 DW) and ABTS values (668.78 ± 20.39 μmol TE g−1 DW), consistent with their higher total phenolic and flavonoid contents, which correlated most strongly with these assays (Figure 1C). In contrast, the sustainable samples showed the highest FRAP value (566.29 ± 83.30 μmol TE g−1 DW), and FRAP was positively correlated with caffeine and CGA, which were higher in these samples. Caffeine and CGAs can form π-π stacking complexes that are stable in aqueous solutions at pH 3–5 [56]; since the FRAP assay is performed at pH 3.6, the formation of these complexes may have contributed to the reducing activity measured [57], although this was not directly evaluated.
Regarding the altitudinal gradient (Figure 1A), all three assays differed significantly among zones (p < 0.001). Mid-altitude samples showed the highest antioxidant capacity (DPPH: 545.17 ± 6.89; ABTS: 681.29 ± 18.80; FRAP: 594.47 ± 89.55 μmol TE g−1 DW), whereas high-altitude samples showed the lowest DPPH and ABTS values. This agrees with Hernández-Ayala et al. [4], who reported that the antioxidant activity of coffee is mainly due to phenolic acids rather than caffeine. The management × altitude interaction was also significant for the three assays (p ≤ 0.004; Figure 1B); the sustainable × mid-altitude samples (SM) showed the highest FRAP value (675.30 μmol TE g−1 DW) and, together with CL and CM, the highest DPPH values, whereas the sustainable × high-altitude samples (SH) showed the lowest DPPH and ABTS values (445.75 and 593.46 μmol TE g−1 DW, respectively).
In addition, this study evaluated medium-roasted coffee, a roast degree that retains a high proportion of thermally stable polyphenols and shows higher antioxidant activity than darker roasts. The Redundancy Analysis (Figure 1D) showed that management systems and elevation jointly explained 47.4% of the variance in bioactive composition (p = 0.001), with RDA1 accounting for 66.1% of the constrained variance; both elevation and management contributed significantly to the model (p = 0.002). Caffeine and CGAs were associated with higher elevations, HT with sustainable samples, and total phenolics, flavonoids, DPPH, and ABTS with conventional low- and mid-altitude samples. This distribution is consistent with the patterns described above for each compound: greater UV radiation and lower temperatures at high elevations have been associated with the accumulation of caffeine and CGAs as part of plant defense responses [52].
Taken together, the sustainable × mid-altitude samples (SM) had the highest total phenolic, flavonoid, CGA, and caffeine contents (Table 3), along with the highest FRAP and DPPH values, although not the highest ABTS value (Figure 1B). In the RDA, these samples were positioned in the direction of HT and FRAP (Figure 1D). This concurrence suggests that the moderate temperature and radiation conditions of the mid zone, together with sustainable management, were associated with the simultaneous accumulation of several compounds with antioxidant activity [58], among which CGAs are considered major contributors to the antioxidant capacity of coffee [4]. However, since these results correspond to composite samples from a single harvest, they should be interpreted as associations between production conditions and bean composition rather than as causal relationships, an approach that requires linking treatment effects through a coherent physiological framework and should be confirmed in farm-level, multi-season studies [59,60].
3.6. Sensory Evaluation
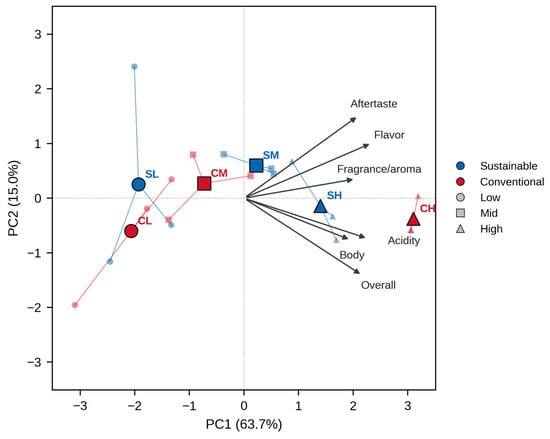
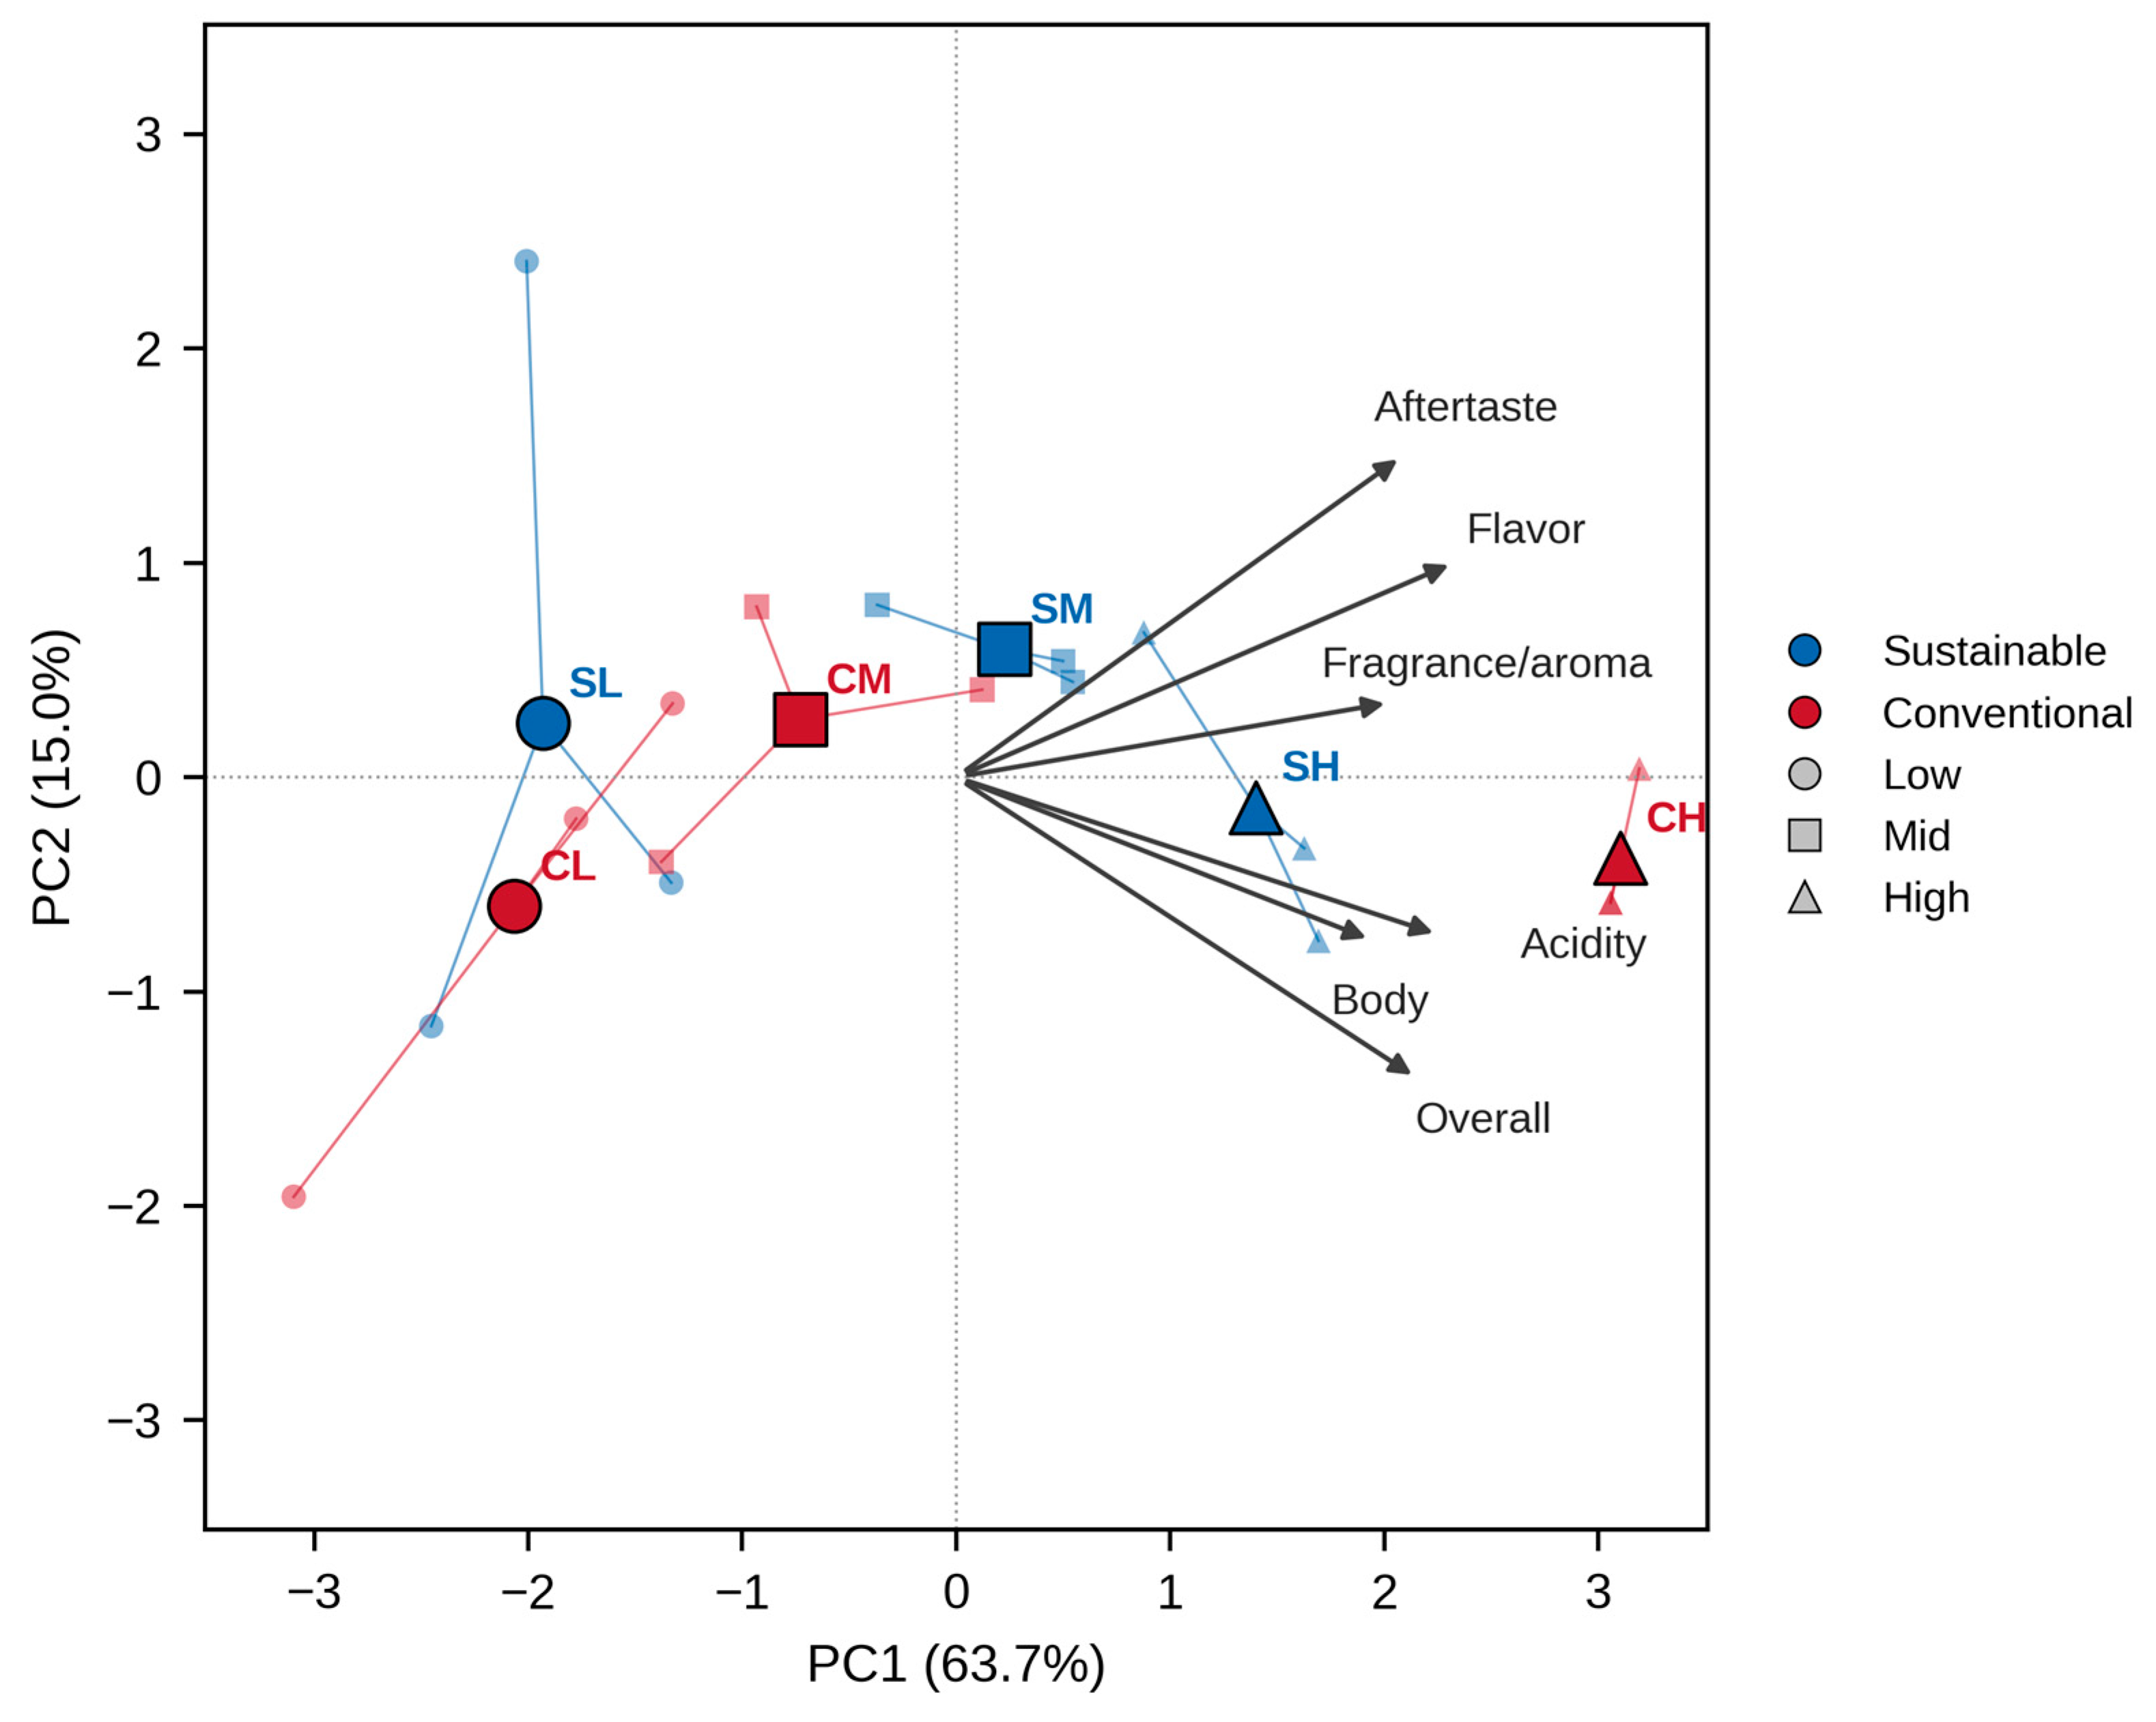
The first principal components explained 78.7% of the variability in the sensory attributes (Figure 2; Table 4). We excluded uniformity, clean cup, sweetness, and balance from the analysis because they did not vary among samples (Table 5). PC1 (eigenvalue = 3.82; 63.7% of the variance) showed high positive loadings for all attributes (0.727–0.869; p ≤ 0.001) and was therefore interpreted as overall sensory quality. PC2 (eigenvalue = 0.90; 15.0%) contrasted aftertaste (0.559) with overall impression (−0.524) but explained a small proportion of the variance. Body provides viscosity and mouthfeel; acidity confers brightness associated with organic acids such as citric, malic, and phosphoric acids; flavor integrates basic tastes and retronasal aroma; and aftertaste reflects the persistence of the finish [2].
Figure 2.
Principal component analysis (PCA) biplot of SCA sensory attributes of roasted coffee (Coffea arabica L.) by management systems and altitudinal zone. Small symbols represent individual Q-Grader scores, and large symbols represent the mean of each management × altitude combination. We excluded uniformity, clean cup, sweetness, and balance because they did not vary among samples. SL: Sustainable × Low; SM: Sustainable × Mid; SH: Sustainable × High; CL: Conventional × Low; CM: Conventional × Mid; CH: Conventional × High.
Table 4.
Loadings of SCA sensory attributes on the first two principal components.
Table 5.
SCA sensory scores of roasted coffee (Coffea arabica L.) by management system, altitudinal zone, and their interaction.
Along PC1, samples were ordered mainly by altitude: high-altitude samples (CH and SH) were on the positive side, mid-altitude samples near the origin, and low-altitude samples (SL and CL) on the negative side (Figure 2). Accordingly, altitude was the main source of variation in total SCA score (p < 0.001; Table 5), increasing from the low (82.17 points) to the mid (83.08) and high (84.33) zones. All samples reached specialty grade (≥80 points), with total scores ranging from 82.08 (CL) to 84.75 (CH). Fragrance/aroma, flavor, aftertaste, acidity, body and overall impression were also highest, or among the highest, in the high-altitude samples (Table 5). Lower temperatures and slower fruit ripening at high elevations favor the accumulation of sugars, acids, and aroma precursors, which has been associated with more complex profiles with higher acidity and body [15,47]. Correlations between chemical variables and sensory attributes, calculated on the six treatment means, showed positive trends of caffeine and CGAs with fragrance/aroma, flavor, and aftertaste (r = 0.53–0.74) and negative trends of flavonoids and DPPH with fragrance/aroma (r = −0.74 and −0.72); however, none were significant (p > 0.05; Table S2), so these associations should be confirmed with a larger number of samples.
Management did not affect total SCA score (sustainable: 83.17; conventional: 83.22 points; p = 0.591) or any individual attribute (p ≥ 0.207), indicating that both systems produced coffees of equivalent overall cup quality. However, the management × altitude interaction was significant for total score (p < 0.001): in the high zone, the conventional samples scored higher than the sustainable ones (CH: 84.75 vs. SH: 83.92), whereas in the low and mid zones the differences between management systems were not significant. The expression of sensory attributes also depends on roasting conditions and the associated non-enzymatic reactions (Maillard reaction, Strecker degradation and caramelization), which determine aroma formation and flavor modulation [61,62].
4. Conclusions
Under the conditions evaluated, altitude was the main factor associated with the physicochemical properties, phenolic and flavonoid contents, and sensory quality of roasted Coffea arabica L. from Veracruz, Mexico. In contrast, agricultural management mainly affected chlorogenic acid, caffeine, and hydrolyzable tannins, which were higher in the sustainable samples. Management effects depended on altitude for all phenolic compounds, caffeine, and antioxidant assays, with the largest differences between systems in the mid-altitude zone, where sustainable samples showed the highest total phenolic, flavonoid, CGA, and caffeine contents and FRAP values. Total cup score increased with altitude and did not differ between management systems; all samples reached specialty grade, with the highest score in the conventional × high-altitude samples. These results indicate that management strategies aimed at improving coffee’s bioactive profile should consider altitudinal context, and mid- and high-altitude zones are promising for producing specialty coffee with high CGA and caffeine contents under sustainable practices. Further studies, including farm-level replication and multiple harvest seasons, are recommended to confirm these patterns.
Supplementary Materials
The following supporting information can be downloaded at: https://www.mdpi.com/article/10.3390/appliedchem6040082/s1, Table S1. F statistics and p values (in parentheses) from two-way ANOVA for management system (M), altitudinal zone (A) and their interaction (M × A). Sensory attributes were analyzed with the Q-Grader as a blocking factor; Table S2. Pearson correlation coefficients (r) between chemical variables and SCA sensory attributes, calculated on the means of the six management × altitude combinations (n = 6).
Author Contributions
Conceptualization, A.G.-Z., A.D.H.-F., J.M.P.-E., Z.H.P.-G. and C.U.L.-P.; methodology, A.G.-Z., A.D.H.-F., J.G.-T., Z.H.P.-G. and C.U.L.-P.; validation, A.G.-Z., J.M.P.-E., Z.H.P.-G., J.P.-M. and C.U.L.-P.; formal analysis, A.G.-Z., A.D.H.-F., J.G.-T. and C.U.L.-P.; investigation, A.G.-Z., A.D.H.-F., A.M.-N., J.G.-T. and C.U.L.-P.; resources, A.G.-Z., A.D.H.-F. and C.U.L.-P.; data curation, A.G.-Z., A.D.H.-F. and C.U.L.-P.; writing—original draft preparation, A.G.-Z., J.G.-T. and C.U.L.-P.; writing—review and editing, A.G.-Z. and C.U.L.-P.; visualization, A.G.-Z., A.D.H.-F., J.P.-M. and C.U.L.-P. All authors have read and agreed to the published version of the manuscript.
Funding
This research received no external funding.
Institutional Review Board Statement
Under Mexican legislation, ethics committee approval is required for research involving human beings within the scope of health research, as established in the General Health Law (Ley General de Salud (Articles 96 and 98; https://www.diputados.gob.mx/LeyesBiblio/pdf/LGS.pdf, accessed on 29 October 2026) and in the Regulation of the General Health Law on Health Research (Reglamento de la ley General de Salud en Materia de Investigacion para la salud; https://www.diputados.gob.mx/leyesBiblio/regley/Reg_LGS_MIS.pdf, accessed on 29 October 2026). According to this legislation, healt research comprises actions that contribute to the knowledge of biological and psychological processes in human beings, the relationships between the causes of disease, medical practice and social structure, the prevention and control of health problems, and the provision of health services. Since the present study consisted of the sensory quality grading of a food product (roasted coffee) by adult certified professional evaluators (Q-Graders), whose scores describe the coffee samples rather than the evaluators, and did not involve clinical, biomedical or health-related procedures, it does not fall within the scope of this legislation; therefore, ethics committee approval was not required. In any case, this activity corresponds to research without risk according to Article 17, Section I, of the aforementioned Regulation. The study was conducted in accordance with the principles of the Declaration of Helsinki.
Informed Consent Statement
Verbal informed consent was obtained from the participants. Verbal consent was obtained rather than written because the study consisted of a non-invasive, no-risk sensory quality grading of a commercial food product, performed by adult certified professional evaluators (Q-Graders) as part of their routine professional activity, and no personal, physiological or health-related data about them were collected o recorded.
Data Availability Statement
The original contributions presented in this study are included in the article/Supplementary Material. Further inquiries can be directed to the corresponding authors.
Acknowledgments
The authors thank SECIHTI-Call for National Scholarships for Graduate Studies (Scholarship No. 161567).
Conflicts of Interest
The authors declare no conflicts of interest.
References
- Blanco-Pacheco, T.E.; De-La-Rosa-Cadavid, M.L.; Quintero-Castañeda, C.Y. Corporate Sustainability in the Coffee Industry: Organic Certification for Small Producers in the Sierra Nevada de Santa Marta, Colombia. Sustainability 2025, 17, 10975. [Google Scholar] [CrossRef] [Scilit]
- Zuim, M.P.S.; Filete, C.A.; dos Santos Gomes, W.; de França Schaffel, I.; Moreli, A.P.; Gonçalves, L.C.; Pinheiro, G.B.; Rebuli, C.P.; de Castro, E.V.R.; Pereira, L.L.; et al. Chemical and Sensory Profile of Coffea arabica L. Cultivated in Different Regions of Minas Gerais-Brazil. Eur. Food Res. Technol. 2026, 252, 185. [Google Scholar] [CrossRef] [Scilit]
- Gaspar, S.; Ramos, F. Caffeine: Consumption and Health Effects. In Encyclopedia of Food and Health; Caballero, B., Finglas, P.M., Toldrá, F., Eds.; Elsevier: Oxford, UK, 2016; pp. 573–578. [Google Scholar]
- Hernández-Ayala, L.F.; Guzmán-López, E.G.; Pérez-González, A.; Reina, M.; Galano, A. Molecular Insights on Coffee Components as Chemical Antioxidants. J. Mex. Chem. Soc. 2024, 68, 888–969. [Google Scholar] [CrossRef] [Scilit]
- Wei, F.; Tanokura, M. Organic Compounds in Green Coffee Beans. In Coffee in Health and Disease Prevention; Preedy, V.R., Ed.; Elsevier: San Diego, CA, USA, 2015; pp. 149–162. [Google Scholar]
- Aroufai, İ.A.; Sabuncu, M.; Dülger Altiner, D.; Sahan, Y. Antioxidant Properties and Bioaccessibility of Coffee Beans and Their Coffee Silverskin Grown in Different Countries. J. Food Meas. Charact. 2022, 16, 1873–1888. [Google Scholar] [CrossRef] [Scilit]
- Finta, H.; Pál, S.; Solymár, M.; Faust, Z.; Cherecheș, M.-C.; Ruța, F.; Ceană, D.-E.; Buicu, C.-F.; Nemes-Nagy, E. Bioactive Compounds in Coffee: Metabolism, Bioavailability and Health Effects—A Review. Molecules 2026, 31, 1404. [Google Scholar] [CrossRef] [Scilit] [PubMed]
- Yang, G.-B.; Cen, Q.-J.; Bin, Z.-J.; Lu, Z.-Z.; Qin, J.-F.; Rasheed, U.; Chen, G.-L. From Germplasm to Cup: A Comprehensive Review of the Genetic, Environmental, and Postharvest Determinants of Coffee Quality and Their Interactions. Agriculture 2026, 16, 739. [Google Scholar] [CrossRef] [Scilit]
- Kagisye, A.; Nibasumba, A.; Nduwayo, G.; Bielders, C.L. What Agronomic and Environmental Factors Drive Coffee Yield in Burundi? A Country-Wide Study. Eur. J. Agron. 2025, 171, 127788. [Google Scholar] [CrossRef] [Scilit]
- Sarmiento-Soler, A.; Vaast, P.; Hoffmann, M.P.; Jassogne, L.; van Asten, P.; Graefe, S.; Rötter, R.P. Effect of Cropping System, Shade Cover and Altitudinal Gradient on Coffee Yield Components at Mt. Elgon, Uganda. Agric. Ecosyst. Environ. 2020, 295, 106887. [Google Scholar] [CrossRef] [Scilit]
- Urugo, M.M.; Worku, M.; Tola, Y.B.; Gemede, H.F. Ethiopian Coffee: Production Systems, Geographical Origin Traceability, and European Union Deforestation Regulation Directive Compliance. J. Agric. Food Res. 2025, 19, 101695. [Google Scholar] [CrossRef] [Scilit]
- Dharmaraj, S.; Veerapandian, C.; Vijayaram, E.; Nagarethinam, B.; Sivanandham, V. Characterization of Physicochemical Properties and Volatile Compounds Profiles of Shevaroy Coffee during Ripening and Identification of Volatile Compound Biomarkers. J. Food Meas. Charact. 2026, 20, 1912–1930. [Google Scholar] [CrossRef] [Scilit]
- Wang, X.; Wang, Y.; Hu, G.; Hong, D.; Guo, T.; Li, J.; Li, Z.; Qiu, M. Review on Factors Affecting Coffee Volatiles: From Seed to Cup. J. Sci. Food Agric. 2022, 102, 1341–1352. [Google Scholar] [CrossRef] [Scilit] [PubMed]
- Borém, F.M.; Shuler, J.; DaMatta, F.M.; Ramalho, J.D.C. Environmental and Post-Harvest Processing Factors That Impact Coffee Quality. In Coffee–A Glimpse into the Future; Damatta, F.M., Ramalho, J.C., Eds.; Advances in Botanical Research; Academic Press: Cambridge, MA, USA, 2025; Volume 114, pp. 525–558. [Google Scholar]
- Hu, R.; Xu, F.; Chen, X.; Kuang, Q.; Xiao, X.; Dong, W. The Growing Altitude Influences the Flavor Precursors, Sensory Characteristics and Cupping Quality of the Pu’er Coffee Bean. Foods 2024, 13, 3842. [Google Scholar] [CrossRef] [Scilit] [PubMed]
- Mamuye, M.; Gallemore, C.; Jespersen, K.; Kasongi, N.; Berecha, G. Changing Rainfall and Temperature Trends and Variability at Different Spatiotemporal Scales Threaten Coffee Production in Certain Elevations. Environ. Chall. 2024, 15, 100950. [Google Scholar] [CrossRef] [Scilit]
- Nuñez-Alejos, L.; León-Roque, N.; Nuñez-León, J.L.; Miyagusuku-Cruzado, G. Effect of Fermentation and Roasting on Bioactive Compounds in Coffea arabica Varieties. Food Chem. Adv. 2026, 11, 101281. [Google Scholar] [CrossRef] [Scilit]
- Król, K.; Gantner, M.; Tatarak, A.; Hallmann, E. The Content of Polyphenols in Coffee Beans as Roasting, Origin and Storage Effect. Eur. Food Res. Technol. 2020, 246, 33–39. [Google Scholar] [CrossRef] [Scilit]
- Cueva-Carhuatanta, C.; Choque-Incaluque, E.; Carrera-Rojo, R.P.; Maravi Loyola, J.; Hermoza-Gutiérrez, M.; Cántaro-Segura, H.; Fernandez-Huaytalla, E.; Gutiérrez-Reynoso, D.L.; Quispe-Jacobo, F.; Ccapa-Ramirez, K. Morpho-Physicochemical, Bioactive, and Antioxidant Profiling of Peruvian Coffea arabica L. Germplasm Reveals Promising Accessions for Agronomic and Nutraceutical Breeding. Plants 2026, 15, 13. [Google Scholar] [CrossRef] [Scilit] [PubMed]
- Viana, G.S.; Santana, D.B.; Pereira, L.d.A.; Tieghi, H.; da Silva, V.F.; Ayer, J.E.B.; Dias, D.F.; Soares, M.G.; Chagas-Paula, D.A.; Mincato, R.L.; et al. Association between Higher Coffee Quality, Bioactive Chemical Profile and Sustainable Practices. Front. Agron. 2025, 7, 1645329. [Google Scholar] [CrossRef] [Scilit]
- Xu, S.; Liu, Y.; Sun, Z.; Chen, G.; Ma, F.; Yang, N.; de Melo Virginio Filho, E.; Fisk, I.D. Effects of Agro-Forestry Systems on the Physical and Chemical Characteristics of Green Coffee Beans. Front. Nutr. 2023, 10, 1198802. [Google Scholar] [CrossRef] [Scilit] [PubMed]
- Reidsma, P.; Jeuffroy, M.-H. Farming Systems Analysis and Design for Sustainable Intensification: New Methods and Assessments. Eur. J. Agron. 2017, 82, 203–205. [Google Scholar] [CrossRef] [Scilit]
- Specialty Coffee Association. SCA Protocols: Cupping Specialty Coffee; Technical Standard Committee: Santa Ana, CA, USA, 2015. [Google Scholar]
- Huang, G.; Liu, S.; Chen, G.-L.; Zhao, Y.; Huang, Q.; Cen, Q.; Ren, E.-F. Effects of Harvesting Periods and Cultivar on the Physicochemical and Sensory Properties of Two Coffee Bean Varieties. Foods 2025, 14, 3135. [Google Scholar] [CrossRef] [Scilit] [PubMed]
- AOAC International. Official Methods of Analysis of AOAC International, 22nd ed.; AOAC International: Rockville, MD, USA, 2023. [Google Scholar]
- Singleton, V.L.; Orthofer, R.; Lamuela-Raventós, R.M. Analysis of Total Phenols and Other Oxidation Substrates and Antioxidants by Means of Folin-Ciocalteu Reagent. In Methods in Enzymology; Academic Press: Cambridge, MA, USA, 1999; Volume 299, pp. 152–178. [Google Scholar]
- Hernández-Fuentes, A.D.; Arroyo-Aguilar, J.E.; Gutiérrez-Tlahque, J.; Santiago-Saenz, Y.O.; Quintero-Lira, A.; Reyes-Fuentes, M.; López-Palestina, C.U. Application of Cu Nanoparticles in Chitosan-PVA Hydrogels in a Native Tomato Genotype: Evaluation of the Postharvest Behavior of the Physicochemical and Bioactive Components of the Fruits. Food Bioprocess Technol. 2023, 16, 1953–1962. [Google Scholar] [CrossRef] [Scilit]
- Willis, R. Improved Method for Measuring Hydrolyzable Tannins Using Potassium Iodate. Analyst 1998, 123, 435–439. [Google Scholar] [CrossRef] [Scilit]
- Wu, H.; Lu, P.; Liu, Z.; Sharifi-Rad, J.; Suleria, H.A.R. Impact of Roasting on the Phenolic and Volatile Compounds in Coffee Beans. Food Sci. Nutr. 2022, 10, 2408–2425. [Google Scholar] [CrossRef] [Scilit] [PubMed]
- Atlabachew, M.; Abebe, A.; Alemneh Wubieneh, T.; Tefera Habtemariam, Y. Rapid and Simultaneous Determination of Trigonelline, Caffeine, and Chlorogenic Acid in Green Coffee Bean Extract. Food Sci. Nutr. 2021, 9, 5028–5035. [Google Scholar] [CrossRef] [Scilit] [PubMed]
- Brand-Williams, W.; Cuvelier, M.E.; Berset, C. Use of a Free Radical Method to Evaluate Antioxidant Activity. LWT-Food Sci. Technol. 1995, 28, 25–30. [Google Scholar] [CrossRef] [Scilit]
- Re, R.; Pellegrini, N.; Proteggente, A.; Pannala, A.; Yang, M.; Rice-Evans, C. Antioxidant Activity Applying an Improved ABTS Radical Cation Decolorization Assay. Free Radic. Biol. Med. 1999, 26, 1231–1237. [Google Scholar] [CrossRef] [Scilit] [PubMed]
- Benzie, I.F.F.; Strain, J.J. The Ferric Reducing Ability of Plasma (FRAP) as a Measure of “Antioxidant Power”: The FRAP Assay. Anal. Biochem. 1996, 239, 70–76. [Google Scholar] [CrossRef] [Scilit] [PubMed]
- World Medical Association. World Medical Association Declaration of Helsinki. JAMA 2025, 333, 71. [Google Scholar] [CrossRef] [Scilit] [PubMed]
- Peñuela-Martínez, A.E.; Osorio-Giraldo, C.V.; Buitrago-Zuluaga, C.; Medina-Rivera, R.D. Development of Fermentation Strategies for Quality Mild Coffee Production (Coffea arabica L.) Based on Oxygen Availability and Processing Time. Foods 2025, 14, 3001. [Google Scholar] [CrossRef] [Scilit] [PubMed]
- Secretaría de Salud. Secretaría de Salud Reglamento de La Ley General de Salud En Materia de Investigación Para La Salud; Diaro Oficial de la Federación: Ciudad de México, Mexico, 1987. [Google Scholar]
- Batali, M.E.; Cotter, A.R.; Frost, S.C.; Ristenpart, W.D.; Guinard, J.-X. Titratable Acidity, Perceived Sourness, and Liking of Acidity in Drip Brewed Coffee. ACS Food Sci. Technol. 2021, 1, 559–569. [Google Scholar] [CrossRef] [Scilit]
- da Silva Oliveira, E.C.; da Luz, J.M.R.; de Castro, M.G.; Filgueiras, P.R.; Guarçoni, R.C.; de Castro, E.V.R.; da Silva, M.d.C.S.; Pereira, L.L. Chemical and Sensory Discrimination of Coffee: Impacts of the Planting Altitude and Fermentation. Eur. Food Res. Technol. 2022, 248, 659–669. [Google Scholar] [CrossRef] [Scilit]
- Echeverri-Giraldo, L.F.; Osorio Pérez, V.; Tabares Arboleda, C.; Vargas Gutiérrez, L.J.; Imbachi Quinchua, L.C. Content of Acidic Compounds in the Bean of Coffea arabica L., Produced in the Department of Cesar (Colombia), and Its Relationship with the Sensorial Attribute of Acidity. Separations 2024, 11, 52. [Google Scholar] [CrossRef] [Scilit]
- Coelho, E.G.; Bertarini, P.L.L.; Gomes, M.S.; Amaral, L.R.; Zotarelli, M.F.; Santos, L.D.; Santana, R.C. Physicochemical and Sensory Properties of Arabica Coffee Beans of Arara Cv. Dried Using Different Methods. Foods 2024, 13, 642. [Google Scholar] [CrossRef] [Scilit] [PubMed]
- Wei, F.; Tanokura, M. Changes in Coffee Beans during Roasting. In Coffee in Health and Disease Prevention; Preedy, V.R., Patel, V.B., Eds.; Elsevier: Amsterdam, The Netherlands, 2025; pp. 125–137. [Google Scholar]
- Narvekar, A.S.; Tharayil, N. Nitrogen Fertilization Influences the Quantity, Composition, and Tissue Association of Foliar Phenolics in Strawberries. Front. Plant Sci. 2021, 12, 613839. [Google Scholar] [CrossRef] [Scilit] [PubMed]
- Lepelley, M.; Mahesh, V.; McCarthy, J.; Rigoreau, M.; Crouzillat, D.; Chabrillange, N.; de Kochko, A.; Campa, C. Characterization, High-Resolution Mapping and Differential Expression of Three Homologous PAL Genes in Coffea Canephora Pierre (Rubiaceae). Planta 2012, 236, 313–326. [Google Scholar] [CrossRef] [Scilit] [PubMed]
- Górecki, M.; Hallmann, E. The Antioxidant Content of Coffee and Its In Vitro Activity as an Effect of Its Production Method and Roasting and Brewing Time. Antioxidants 2020, 9, 308. [Google Scholar] [CrossRef] [Scilit] [PubMed]
- Liao, Y.-C.; Kim, T.; Silva, J.L.; Hu, W.-Y.; Chen, B.-Y. Effects of Roasting Degrees on Phenolic Compounds and Antioxidant Activity in Coffee Beans from Different Geographic Origins. LWT 2022, 168, 113965. [Google Scholar] [CrossRef] [Scilit]
- Zaman, S.; Li, Z.; Dong, Y.; Lou, G.; Shan, S.; Zhang, C. Different Elevation Affects the Biochemical Composition and Regulatory Patterns of Polyphenol Compounds in Coffea arabica. Beverage Plant Res. 2025, 5, e033. [Google Scholar] [CrossRef] [Scilit]
- Choque-Quispe, K.; Reynoso-Canicani, D.D.; Aguirre-Landa, J.P.; Agreda Cerna, H.W.; Villegas Casaverde, M.; Prado Canchari, A.; Mescco Cáceres, E.; Quispe Chambilla, L.; Carrión Sánchez, H.M.; Torres Flores, Y.; et al. Impact of Altitudinal Gradients on Exportable Performance, and Physical and Cup Quality of Coffee (Coffea arabica L.) Grown in Inter-Andean Valley. Resources 2025, 14, 136. [Google Scholar] [CrossRef] [Scilit]
- Rusinek, R.; Dobrzański, B.; Gawrysiak-Witulska, M.; Siger, A.; Oniszczuk, A.; Tabor, S.; Gancarz, M. Effect of Climate, Growing Region, Country of Origin, and Post-Harvest Processing on the of Content Chlorogenic Acids (CGAs) and Aromatic Compounds in Roasted Coffee Beans. Sci. Rep. 2025, 15, 30117. [Google Scholar] [CrossRef] [Scilit] [PubMed]
- Tang, Z.; Shi, L.; Liang, S.; Yin, J.; Dong, W.; Zou, C.; Xu, Y. Recent Advances of Tannase: Production, Characterization, Purification, and Application in the Tea Industry. Foods 2024, 14, 79. [Google Scholar] [CrossRef] [Scilit] [PubMed]
- García-Rodríguez, S.R.; Reynoso-Ponce, H.; Muñiz-Márquez, D.B.; Reyes-Munguía, A.; de la Rosa-Hernández, M.; Wong-Paz, J.E. Evaluation of Condensed Tannins from Coffee Pulp (Coffea arabica) as a Natural Preservative: Study in a Model Food. Sustain. Food Technol. 2026, 4, 885–893. [Google Scholar] [CrossRef] [Scilit]
- Duangjai, A.; Saokaew, S.; Goh, B.-H.; Phisalprapa, P. Shifting of Physicochemical and Biological Characteristics of Coffee Roasting Under Ultrasound-Assisted Extraction. Front. Nutr. 2021, 8, 724591. [Google Scholar] [CrossRef] [Scilit] [PubMed]
- Qing, S.; Ding, Z.; Zhang, L.; Chen, T.; Li, W.; Lv, Z. Metabolomics Analysis Revealed the Chemical Mechanism of Powerful Antioxidant Activity of Coffea arabica at High-Altitude Regions. LWT 2026, 247, 119264. [Google Scholar] [CrossRef] [Scilit]
- Dutra, E.; Muñoz-Sabater, J.; Boussetta, S.; Komori, T.; Hirahara, S.; Balsamo, G. Environmental Lapse Rate for High-Resolution Land Surface Downscaling: An Application to ERA5. Earth Space Sci. 2020, 7, e2019EA000984. [Google Scholar] [CrossRef] [Scilit]
- de Sousa, L.P.; Guerreiro Filho, O.; Costa Mondego, J.M. Differences between the Leaf Mycobiome of Coffea arabica and Wild Coffee Species and Their Modulation by Caffeine/Chlorogenic Acid Content. Microorganisms 2021, 9, 2296. [Google Scholar] [CrossRef] [Scilit] [PubMed]
- Perrois, C.; Strickler, S.R.; Mathieu, G.; Lepelley, M.; Bedon, L.; Michaux, S.; Husson, J.; Mueller, L.; Privat, I. Differential Regulation of Caffeine Metabolism in Coffea arabica (Arabica) and Coffea Canephora (Robusta). Planta 2015, 241, 179–191. [Google Scholar] [CrossRef] [Scilit] [PubMed]
- Nemzer, B.; Edwards, J.; Kalita, D. Matrix-Specific Effects on Caffeine and Chlorogenic Acid Complexation in a Novel Extract of Whole Coffea arabica Coffee Cherry by NMR Spectroscopy. Molecules 2022, 27, 7803. [Google Scholar] [CrossRef] [Scilit] [PubMed]
- Munteanu, I.G.; Apetrei, C. Analytical Methods Used in Determining Antioxidant Activity: A Review. Int. J. Mol. Sci. 2021, 22, 3380. [Google Scholar] [CrossRef] [Scilit] [PubMed]
- Alcázar Magaña, A.; Kamimura, N.; Soumyanath, A.; Stevens, J.F.; Maier, C.S. Caffeoylquinic Acids: Chemistry, Biosynthesis, Occurrence, Analytical Challenges, and Bioactivity. Plant J. 2021, 107, 1299–1319. [Google Scholar] [CrossRef] [Scilit] [PubMed]
- Ahmed, S.; Brinkley, S.; Smith, E.; Sela, A.; Theisen, M.; Thibodeau, C.; Warne, T.; Anderson, E.; Van Dusen, N.; Giuliano, P.; et al. Climate Change and Coffee Quality: Systematic Review on the Effects of Environmental and Management Variation on Secondary Metabolites and Sensory Attributes of Coffea arabica and Coffea canephora. Front. Plant Sci. 2021, 12, 708013. [Google Scholar] [CrossRef] [Scilit] [PubMed]
- Zhou, J.; Zhan, L.; Zhang, D.; Xu, S.; Li, Z.; Zhang, Y.; Dai, J.; Cui, Z.; Tian, X.; Dong, H. Belowground Reorganization Complements Canopy Regulation in Stabilizing Yield Formation of Dual-Planting Cotton. Field Crops Res. 2026, 345, 110563. [Google Scholar] [CrossRef] [Scilit]
- Cao, X.; Wu, H.; Viejo, C.G.; Dunshea, F.R.; Suleria, H.A.R. Effects of Postharvest Processing on Aroma Formation in Roasted Coffee—A Review. Int. J. Food Sci. Technol. 2023, 58, 1007–1027. [Google Scholar] [CrossRef] [Scilit]
- Oliveira Nascimento, M.; Simalie Ombredane, A.; de Lacerda de Oliveira, L. Descriptive Sensory Tests for Evaluating Coffea arabica: A Systematic Review. Coffee Sci. 2024, 19, e192204. [Google Scholar] [CrossRef] [Scilit]

Disclaimer/Publisher’s Note: The statements, opinions and data contained in all publications are solely those of the individual author(s) and contributor(s) and not of MDPI and/or the editor(s). MDPI and/or the editor(s) disclaim responsibility for any injury to people or property resulting from any ideas, methods, instructions or products referred to in the content. |
© 2026 by the authors. Licensee MDPI, Basel, Switzerland. This article is an open access article distributed under the terms and conditions of the Creative Commons Attribution (CC BY) license.