


Abstract
The chemical and quality characteristics of honey vary considerably according to floral source, geographical provenance, environmental conditions, and post-harvest handling, complicating its characterization and authentication. In this study, physicochemical properties, bioactive constituents, enzymatic activity, and exploratory chemometric patterns were evaluated in thirteen honey samples representing different declared botanical types, including sage, meadow, chestnut, acacia, and pine honeys, from different geographical origins. Physicochemical characterization comprised moisture content, refractive index, specific optical rotation, electrical conductivity, pH, free acidity, hydroxymethylfurfural (HMF), reducing sugars, ash content, qualitative mineral composition, and preliminary authenticity-related tests. Total phenolic content determined by the Folin–Ciocalteu assay (TPC-FC), total flavonoid content (TFC), total phenolic content determined by the Prussian Blue assay (TPC-PB), proline content, and diastase activity were also evaluated. Statistical analysis included one-way analysis of variance (ANOVA) followed by Tukey’s HSD test, Pearson correlation analysis, and principal component analysis (PCA). One-way ANOVA followed by Tukey’s HSD test indicated significant differences in the measured analytical responses among the individual honey samples for the evaluated bioactive parameters (p < 0.05); these comparisons were restricted to the investigated samples and were not interpreted as inferential differences among botanical or geographical populations. Pearson correlation analysis revealed several moderate-to-strong associations among the analytical variables; however, none remained statistically significant after Benjamini–Hochberg false discovery rate (FDR) correction for the 91 pairwise comparisons. Given the small number of independent honey samples (n = 13), these correlation patterns were interpreted as exploratory. PCA provided an exploratory representation of the multivariate structure of the dataset, with PC1, PC2, and PC3 explaining 22.51%, 20.88%, and 13.01% of the total variance, respectively, for a cumulative contribution of 56.40%. The principal components reflected contributions from multiple physicochemical, bioactive, and enzymatic variables; however, no clear or consistent grouping according to declared botanical type or geographical origin was observed. Taken together, the results demonstrate substantial compositional heterogeneity among the investigated honey samples and highlight the value of integrating physicochemical, bioactive, enzymatic, and exploratory chemometric information for multidimensional honey characterization. Given the small and unbalanced sample set and the absence of formal melissopalynological authentication, the observed multivariate patterns should be interpreted as exploratory rather than as evidence of definitive botanical or geographical classification.
1. Introduction
Honey is a naturally derived food produced by Apis mellifera from floral nectar or from secretions of plant origin. Owing to its complex chemical composition, nutritional value, sensory characteristics, and diverse biological properties, honey has attracted considerable scientific interest not only as a natural sweetener but also as a functional food [1,2]. Antioxidant, antimicrobial, and anti-inflammatory effects have been associated with several of its naturally occurring constituents, particularly phenolic compounds and flavonoids [1,3,4,5].
Considerable compositional variability exists among honeys and is influenced by botanical origin, geographical provenance, climatic and environmental conditions, bee-related factors, season, and post-harvest handling. These factors may result in distinct physicochemical, nutritional, and bioactive profiles among different honey types [6,7,8,9,10]. Characterization of such variability is therefore important for evaluating honey quality, establishing botanical and geographical origin, and supporting authenticity assessment [11,12,13,14,15]. Concerns regarding honey adulteration have further emphasized the need for reliable analytical approaches capable of evaluating product authenticity and detecting compositional irregularities [16,17,18].
Carbohydrates constitute the major fraction of honey, with fructose and glucose predominating [7,19], whereas smaller amounts of organic acids, proteins, amino acids, enzymes, minerals, vitamins, phenolic acids, flavonoids, and volatile compounds contribute to its overall chemical complexity [1,2,7,20]. Although present at comparatively lower concentrations, many of these minor constituents contribute substantially to the nutritional, sensory, and biological characteristics of honey [1,3,5,20]. Consequently, physicochemical characterization provides essential information regarding honey maturity, freshness, quality, and conformity with established quality criteria [10,11,12,21].
Individual physicochemical parameters provide complementary information about different aspects of honey quality. Moisture content is particularly important for storage stability because elevated water levels increase susceptibility to fermentation and may reduce shelf life [10,21,22]. Electrical conductivity and ash content are closely associated with the mineral fraction of honey and can contribute to differentiation according to botanical and geographical origin [6,10,23,24,25]. Hydroxymethylfurfural (HMF) is widely used as an indicator of thermal exposure and storage history because its concentration generally increases during heating and prolonged storage [10,26,27,28]. Other parameters, including pH, free acidity, reducing sugars, optical rotation, diastase activity, and mineral composition, provide additional information for physicochemical characterization, quality assessment, and authenticity evaluation [10,12,21,24,29].
The minor bioactive fraction provides an additional basis for differentiation among honey samples. Phenolic acids and flavonoids are of particular interest because of their contribution to antioxidant activity and their potential usefulness as indicators of botanical origin [1,26,30,31,32,33]. Their concentrations vary substantially among honey types as a consequence of differences in floral and geographical origin. Relationships among phenolic content, antioxidant activity, and honey color have also been reported, with darker honeys frequently exhibiting higher concentrations of phenolic constituents and greater antioxidant potential than lighter varieties [33,34,35,36]. Color-related characteristics have additionally been investigated as complementary descriptors for distinguishing honeys of different botanical origins [37,38].
Interpreting numerous analytical variables simultaneously can be challenging because honey represents a chemically heterogeneous matrix. Chemometric approaches allow physicochemical and bioactive variables to be evaluated collectively rather than as isolated measurements. Principal component analysis (PCA) is particularly useful for reducing data dimensionality, visualizing similarities and differences among samples, and identifying the variables contributing most strongly to multivariate sample separation. Correlation analysis, in turn, provides information on the strength and direction of associations among measured physicochemical and bioactive parameters [14,15,25]. The integration of these statistical approaches with conventional analytical measurements can therefore improve the characterization and differentiation of honey samples according to their botanical and geographical origin [13,14,15,25].
The present study investigated thirteen honey samples of different declared botanical types and geographical origins to comparatively evaluate their physicochemical, bioactive, and enzymatic characteristics and assess compositional variability among the investigated samples. Univariate and multivariate statistical approaches, including analysis of variance (ANOVA), Pearson correlation analysis, and principal component analysis (PCA), were applied to examine differences in the measured analytical responses among the individual honey samples, relationships among analytical variables, and patterns of multivariate variation. ANOVA-based comparisons were restricted to the individual samples investigated and were not intended to infer differences among botanical or geographical populations. The scientific contribution of the study lies in the integrated evaluation of these complementary analytical dimensions within the same sample set, enabling sample-to-sample variability and relationships among quality-related parameters to be examined within a unified analytical framework. Given the limited and unbalanced sample set and the absence of formal melissopalynological authentication, the chemometric analysis was interpreted as an exploratory assessment of compositional variation rather than as evidence of definitive botanical or geographical classification.
2. Materials and Methods
2.1. Honey Samples
A set of thirteen honey samples representing different declared botanical types and geographical origins was included in the study. The honey samples were obtained from the respective beekeepers or producers in March 2024 and comprised one sage honey (H1), five meadow honeys (H2, H3, H5, H10, and H11), one chestnut honey (H4), four acacia honeys (H6–H9), and two pine honeys (H12 and H13). The samples originated from Kosovo, Albania, North Macedonia, Croatia, and Turkey. According to information provided by the respective beekeepers or producers, all honey samples were produced by Apis mellifera. Bee species was not independently verified as part of the present study and was therefore not included as a variable in the comparative evaluation.
Information on botanical origin was provided by the respective beekeepers or producers according to the predominant floral source and production area. No formal melissopalynological analysis was performed; therefore, the botanical classifications are reported throughout the study as declared botanical origins and should not be regarded as independently verified floral origins. For sample identification and subsequent data analysis, the honeys were coded H1–H13. Given the relatively small and unequal representation of the declared botanical types within the sample set, including botanical types represented by a single sample, within-group variability could not be estimated for all declared botanical groups. Therefore, direct between-type comparisons were considered descriptive and exploratory rather than equivalent inferential group comparisons, and the statistical and chemometric analyses were not intended to establish definitive botanical or geographical classification.
Geographical information was assigned according to the reported production or collection locality. Approximate geographical coordinates for these localities are provided in Table 1 to facilitate geographical interpretation of the sample set. The precise GPS positions of the individual apiaries or collection points were not recorded during sampling; therefore, the coordinates correspond to the reported localities rather than to the exact sampling sites.
Table 1.
Declared botanical type, geographical origin, and approximate geographical coordinates of the investigated honey samples.
Following acquisition, the samples were kept in sealed glass containers, away from direct sunlight, at a laboratory temperature ranging from 25 to 30 °C during the storage period. Analytical measurements were initiated within approximately one week after receipt of the samples and were carried out progressively over a period of approximately two months. Throughout the period preceding analysis, all samples were maintained under the same storage conditions. Physicochemical, bioactive, and enzymatic measurements were performed at the Department of Chemistry, Faculty of Mathematical and Natural Sciences, University of Prishtina, under consistent laboratory conditions across the complete sample set. The analytical results were subsequently processed using the statistical and chemometric procedures described below. The declared botanical type, locality, country of origin, and approximate geographical coordinates for samples H1–H13 are summarized in Table 1.
The selected samples represented different declared botanical types and geographical origins, allowing comparative evaluation of their physicochemical characteristics, bioactive composition, and overall chemical variability. Because the declared botanical groups were represented by unequal numbers of samples, including botanical types represented by a single sample, between-type comparisons were considered descriptive and exploratory rather than equivalent inferential group comparisons.
2.2. Physicochemical Analysis
The physicochemical characterization of the honey samples comprised measurements of moisture, refractive index, specific optical rotation, electrical conductivity, pH, free acidity, hydroxymethylfurfural (HMF), reducing sugars, and ash. Except where indicated otherwise, each honey sample was independently prepared and analyzed in triplicate (n = 3), corresponding to three separate sample preparations rather than repeated measurements of the same preparation. The results are reported as mean ± standard deviation (SD) of the three independent determinations. Separate preparations were used for each analytical parameter; therefore, heating applied as part of a specific analytical procedure was not applied to the aliquots used for the determination of HMF or other parameters measured using separate preparations.
2.2.1. Moisture Content and Refractive Index
Refractive measurements were performed using an Abbe refractometer (Carl Zeiss Jena, Jena, Germany) [21]. The prism was cleaned before analysis, and the instrument was checked using distilled water. Samples showing crystallization were heated gently to approximately 50 °C until the crystals had dissolved, then returned to room temperature and homogenized. A portion of each prepared sample was transferred directly onto the prism, and its refractive index was recorded. The corresponding moisture percentage was obtained using the standard Chataway/Wedmore conversion table referenced to 20 °C. Where required, the measured refractive index was temperature-corrected to 20 °C before conversion. Moisture content was expressed as % (w/w), corresponding to grams of water per 100 g of honey.
2.2.2. Specific Optical Rotation
Optical rotation was evaluated using clarified aqueous honey extracts prepared according to established procedures for honey optical rotation analysis [29]. Briefly, 10.0 g of honey was dissolved in 30 mL of distilled water with magnetic stirring at approximately 60 °C. Clarification was initiated by adding 10 mL of Carrez I solution (15 g potassium hexacyanoferrate (II) (Merck KGaA, Darmstadt, Germany) made up to 100 mL with distilled water), followed by approximately 30 s of mixing. Subsequently, 10 mL of Carrez II solution (30 g zinc acetate (Merck KGaA, Darmstadt, Germany) made up to 100 mL with distilled water) was introduced, and the mixture was stirred for a further 30 s. Distilled water was then added to bring the total volume to 100 mL. After standing overnight to allow clarification and precipitation, the preparation was filtered, and the resulting clear filtrate was used for measurement.
Prior to analysis, the polarimeter tube was conditioned with a small volume of the corresponding filtrate and then filled with the same solution. Angular rotation was measured at the sodium D-line (589 nm) using an MCP 5100 polarimeter (Anton Paar GmbH, Graz, Austria) fitted with a 1 dm tube. The observed angular rotation (α, °) was converted to specific optical rotation by accounting for the optical path length (l, dm) and honey concentration (c, g/mL), according to [α]ᴰ20 = α/(l × c), and the results were expressed as °·mL·g−1·dm−1.
2.2.3. Electrical Conductivity
Conductivity measurements were obtained using an inoLab Cond 720 conductivity meter (WTW GmbH, Weilheim, Germany) [21,23]. A 7.5 g portion of each honey was dissolved in 50 mL of distilled water while stirring at approximately 450 rpm. Gentle heating, not exceeding 50 °C, was applied where necessary to obtain complete dissolution. The solutions were subsequently brought back to room temperature before analysis. Measurements were performed at 25 °C by placing the conductivity electrode directly into each prepared solution. Between samples, the electrode was rinsed thoroughly with distilled water. Instrument readings obtained in µS/cm were converted to mS/cm for reporting.
2.2.4. pH Determination
For pH measurement, 5.0 g of honey was dispersed in 37.5 mL of distilled water [21,23]. Dissolution was assisted by stirring at approximately 500–1000 rpm, with gentle heating up to 50 °C where required. Each solution was allowed to return to room temperature before instrumental measurement.
Universal indicator strips and an ISOLAB portable pH/mV/temperature meter (Cat. No. 616.01.001; ISOLAB Laborgeräte GmbH, Eschau, Germany) were used only for preliminary assessment. The values included in the final dataset were obtained with a HI5522 multiparameter bench-top pH meter (Hanna Instruments, Woonsocket, RI, USA) equipped with a calibrated electrode. The electrode was rinsed with distilled water between samples, immersed in the prepared solution, and the reading was recorded after stabilization. Final measurements were conducted at approximately 25.1 °C.
2.2.5. Free Acidity
Free acidity was determined by titration with 0.1 M NaOH (Merck KGaA, Darmstadt, Germany), based on standard honey acidity determination procedures [21]. CO2-free water was obtained by heating distilled water to approximately 80 °C, followed by cooling to room temperature. For analysis, 5.0 g of honey was dissolved in 37.5 mL of the prepared water and 2–3 drops of phenolphthalein (Merck KGaA, Darmstadt, Germany) were added. The solution was titrated with 0.1 M NaOH until a stable pale-pink coloration was reached. A reagent blank consisting of 42.5 mL of CO2-free distilled water and 2–3 drops of phenolphthalein (Merck KGaA, Darmstadt, Germany) was treated identically. The NaOH volume obtained for the blank was deducted from the sample titre. Free acidity was calculated from the blank-corrected NaOH consumption according to the following equation: Free acidity (meq/kg) = [(Vs − Vβ) × CNaOH × 1000]/m, where Vs is the volume of NaOH consumed by the honey sample (mL), Vβ is the volume consumed by the reagent blank (mL), CNaOH is the NaOH concentration (0.1 mol/L), and m is the mass of the honey sample (g). For the 5.0 g honey portion used in the present study, the equation simplifies to Free acidity (meq/kg) = 20 × (Vs − Vβ). Results are expressed as meq/kg honey.
2.2.6. Hydroxymethylfurfural (HMF)
HMF was quantified spectrophotometrically using the Winkler method [28]. A 5.0 g portion of honey was dissolved in 10 mL of distilled water with magnetic stirring at approximately 60 °C. The solution was clarified by sequential addition of 1 mL of Carrez I (15 g potassium hexacyanoferrate (II) (Merck KGaA, Darmstadt, Germany)/100 mL distilled water) and 1 mL of Carrez II (30 g zinc acetate (Merck KGaA, Darmstadt, Germany)/100 mL distilled water). After adjustment to 25 mL with distilled water, the preparation was filtered. The initial 5 mL of filtrate was discarded, and the remaining clear fraction was retained for analysis.
The chromogenic reagents were prepared separately. Barbituric acid (Sigma-Aldrich, Inc., St. Louis, MO, USA) solution was prepared by dissolving 0.25 g in 50 mL of distilled water at approximately 50 °C while stirring at 500 rpm. For the p-toluidine reagent, 5.0 g of p-toluidine (Sigma-Aldrich, Inc., St. Louis, MO, USA) was dissolved in 25 mL of 2-propanol (Sigma-Aldrich, Inc., St. Louis, MO, USA) using a water bath, after which 5 mL of glacial acetic acid (Sigma-Aldrich, Inc., St. Louis, MO, USA) was added. Following cooling, the mixture was brought to 50 mL with 2-propanol and kept protected from light for 24 h before use.
For color development, 2 mL of clarified honey filtrate was combined with 5 mL of p-toluidine reagent and 1 mL of barbituric acid solution. The corresponding reference solution contained the same quantities of filtrate and p-toluidine, but 1 mL of distilled water replaced the barbituric acid reagent. Following mixing and a 5 min reaction period, absorbance was recorded at 550 nm using a T70+ UV–Visible spectrophotometer (PG Instruments Ltd., Lutterworth, UK) against the corresponding reference. HMF concentration was calculated from the absorbance using a Winkler factor of 192, a dilution factor of 10, and the 5.0 g sample mass, expressed as mg/kg honey.
2.2.7. Reducing Sugars
Reducing sugars were quantified using a Lane–Eynon titrimetric procedure, based on established methods for honey sugar determination [21]. In this procedure, Fehling reagent was first standardized using an invert sugar solution and was subsequently used for analysis of the honey samples.
The invert sugar standard was prepared from 0.985 g of sucrose (Sigma-Aldrich, Inc., St. Louis, MO, USA) in 500 mL of distilled water. After addition of 2 mL of concentrated H2SO4 (Sigma-Aldrich, Inc., St. Louis, MO, USA), the preparation was carefully heated for approximately 30 min, then maintained at room temperature for 24 h. It was subsequently neutralized with Na2CO3 (Sigma-Aldrich, Inc., St. Louis, MO, USA) and adjusted to a final volume of 1000 mL with distilled water.
For standardization, 5 mL each of Fehling A and Fehling B (Sigma-Aldrich, Inc., St. Louis, MO, USA) were combined in a 250 mL Erlenmeyer flask and brought to boiling. The invert sugar standard was delivered gradually from a burette while boiling was maintained. As the endpoint approached, 1 mL of methylene blue (Sigma-Aldrich, Inc., St. Louis, MO, USA) was added, and titration was continued until the blue coloration disappeared and a reddish–brown endpoint was obtained. Three independent standardizations produced a mean titre of 48.83 mL, from which a Fehling factor (S) of approximately 0.049 was obtained.
For determination in honey, 1.0 g of sample was transferred to a 250 mL volumetric flask, initially dissolved in approximately 150 mL of distilled water, then brought to volume with distilled water. Separately, 5 mL of Fehling A, 5 mL of Fehling B, and 20 mL of distilled water were combined and heated to boiling. The diluted honey solution was added progressively from a burette under continued boiling. Near the endpoint, 1 mL of methylene blue was added, and titration was continued until the blue color disappeared and the characteristic reddish endpoint was reached.
The percentage of reducing sugars was calculated from the titre of the diluted honey solution using the experimentally determined Fehling factor (S = 0.049), the 250 mL dilution volume, and the initial sample mass of 1.0 g.
2.2.8. Ash Content
Ash content was determined gravimetrically based on standard honey-analysis procedures [21]. Clean, dry porcelain crucibles were weighed before use. A 5.0 g portion of each honey sample was transferred to its corresponding crucible. Before furnace treatment, the samples were heated gradually over a flame to remove moisture and promote carbonization. Heating was continued carefully until visible smoke was no longer produced, thereby minimizing the risk of sample loss during subsequent incineration.
Prior to ashing, the KR 260 electric muffle furnace (W.C. Heraeus, Hanau, Germany) was maintained at 600 °C for 2 h. The crucibles containing the carbonized samples were subsequently placed in the furnace and heated at 600 °C for 3 h. After completion of incineration, the crucibles were removed, allowed to cool, and transferred to a desiccator for 30 min before weighing.
Ash content was calculated according to
where m0 represents the mass of the empty crucible (g), m1 is the mass of the crucible plus honey before incineration (g), and m2 is the mass of the crucible plus the remaining ash after incineration and cooling (g).
Ash (%) = [(m2 − m0)/(m1 − m0)] × 100
All physicochemical measurements described above were performed in triplicate (n = 3), and the results are reported as mean ± standard deviation (SD).
2.3. Determination of Bioactive Compounds
2.3.1. Total Phenolic Content
Total phenolic content determined by the Folin–Ciocalteu assay (TPC-FC). Total phenolic content was determined using the Folin–Ciocalteu spectrophotometric assay [30,39,40]. For sample preparation, 2.5 g of honey was dissolved in 25 mL of methanol (Sigma-Aldrich). A 1.0 mL aliquot of the resulting solution was transferred to a test tube, followed by 5.0 mL of 10% Folin–Ciocalteu reagent (Sigma-Aldrich), and the mixture was mixed for 1 min. After 5 min, 4.0 mL of sodium carbonate solution (75 mg/mL, Sigma-Aldrich) was added, and the reaction mixtures were incubated at 45 °C for 30 min, consistent with previously reported Folin–Ciocalteu conditions used for the determination of phenolic content in honey [39,40]. After incubation, the solutions were allowed to cool, and absorbance was measured at 765 nm using a T70+ UV–Visible spectrophotometer (PG Instruments Ltd., Lutterworth, UK).
Quantification was performed using gallic acid (Sigma-Aldrich) as an external standard. Calibration solutions containing 0, 0.025, 0.050, 0.075, and 0.100 mg/mL gallic acid were subjected to the same analytical procedure as the honey samples. Mean absorbance values of 0.3013, 0.3356, 0.3813, 0.4190, and 0.4556, respectively, were obtained. The resulting calibration equation was y = 1.568x + 0.3002, with R2 = 0.9983, demonstrating satisfactory linearity over the investigated concentration range. The absorbance values of the honey samples generally fell within the experimental calibration range; however, the sample with the highest TPC-FC (H10) showed an absorbance slightly above the upper calibration value.
The gallic acid-equivalent concentration of each honey sample was calculated from the calibration equation as x = (A − 0.3002)/1.568, where A is the measured absorbance and x is the gallic acid-equivalent concentration (mg/mL). Considering that 2.5 g of honey was diluted to a final volume of 25 mL, TPC-FC was calculated according to the equation TPC-FC (mg GAE/kg) = [x (mg/mL) × 25 (mL)/2.5 (g)] × 1000 (g/kg). Thus, the overall conversion factor from the extract concentration to the honey mass basis was 10,000. Results were expressed as mg gallic acid equivalents per kilogram of honey (mg GAE/kg). All measurements were performed in triplicate (n = 3), and the results are reported as mean ± standard deviation (SD).
2.3.2. Total Flavonoid Content
Total flavonoid content (TFC). Total flavonoid content (TFC) was determined using a modified aluminum chloride (AlCl3) colorimetric assay coupled with UV–Visible spectrophotometric detection [31,32]. For sample preparation, 1.0 g of honey was dissolved in 10 mL of distilled water with magnetic stirring, and after complete dissolution, the solution was brought to a final volume of 20 mL with distilled water. For color development, 1.0 mL of the prepared honey solution was combined with 1.0 mL of 2% AlCl3 solution (Sigma-Aldrich). After thorough mixing, the reaction mixture was maintained at room temperature (20–25 °C) for approximately 30 min to allow formation of the flavonoid–AlCl3 complex. Absorbance was then recorded at 430 nm using a T70+ UV–Visible spectrophotometer (PG Instruments Ltd., Lutterworth, UK) against a corresponding blank prepared using the same reagents and experimental conditions but without the honey sample.
For quantitative determination, an experimental calibration curve was constructed using rutin as the reference standard over the concentration range of 10–100 µg/mL. Linear regression of the experimental calibration data yielded the equation y = 0.0008x + 0.0549, with R2 = 0.9905, where y represents absorbance and x represents rutin concentration (µg/mL). The rutin-equivalent concentration of each honey sample was calculated as x = (A − 0.0549)/0.0008, where A is the measured absorbance. Considering that 1.0 g of honey was diluted to a final volume of 20 mL, TFC was calculated according to the equation expressed as TFC (mg RE/kg) = [x(mg/mL) × 20 (mL)]/1.0 (g). Since 1 µg/g is numerically equivalent to 1 mg/kg, the resulting values were expressed as mg rutin equivalents per kilogram of honey (mg RE/kg). Measurements were performed in triplicate (n = 3), and the results are reported as mean ± standard deviation (SD).
2.3.3. Total Phenolic Content Determined by the Prussian Blue Assay
Total phenolic content determined by the Prussian Blue assay (TPC-PB). Total phenolic content was determined using a Prussian Blue colorimetric assay based on the ferric/ferricyanide reagent system [32,41]. The assay is based on the reduction of ferric ions by phenolic compounds and the subsequent formation of a blue-colored complex suitable for spectrophotometric determination. Because the assay provides an overall colorimetric response rather than compound-specific quantification of individual phenolic compounds, the results were quantified relative to a gallic acid calibration curve and expressed as mg gallic acid equivalents per kilogram of honey (mg GAE/kg).
For sample preparation, 1.0 g of honey was dissolved in 50 mL of distilled water with magnetic stirring until complete dissolution. A 5.0 mL aliquot of the prepared honey solution was transferred to a test tube, followed by 3.0 mL of 0.1 M FeNH4(SO4)2·12H2O (Sigma-Aldrich) prepared in 0.1 M HCl (Sigma-Aldrich). After 20 min, 3.0 mL of 0.008 M K3[Fe(CN)6] (Sigma-Aldrich) was added. The reaction mixture was thoroughly mixed and allowed to stand for a further 20 min at room temperature, after which the absorbance was measured at 720 nm using a T70+ UV–Visible spectrophotometer (PG Instruments Ltd., Lutterworth, UK) against a corresponding reagent blank prepared using the same reagents and experimental procedure but without the honey sample.
Quantification was performed using gallic acid (Sigma-Aldrich) as the reference standard. Calibration solutions were prepared at concentrations of 0.3, 0.9, 1.5, 2.0, and 3.0 g/L gallic acid. The gallic acid calibration solutions were subjected to the same color-development procedure and measurement conditions as the honey samples. The relationship between absorbance and gallic acid concentration was described by the linear regression equation y = 0.8921x + 0.0612, with R2 = 0.9997, indicating excellent linearity over the investigated concentration range. TPC-PB values were obtained from the gallic acid calibration equation based on the measured absorbance of each sample. The concentrations derived from the calibration curve were corrected for the sample preparation and dilution steps and normalized to the initial mass of honey used for analysis (1.0 g). The final results were expressed as mg gallic acid equivalents per kilogram of honey (mg GAE/kg). Measurements were performed in triplicate (n = 3), and the results are reported as mean ± standard deviation (SD).
2.3.4. Determination of Proline Content
Proline content. Proline content was determined using an adapted ninhydrin colorimetric method based on the International Honey Commission (IHC) procedure, as described and evaluated by Truzzi et al. [42], followed by UV–Visible spectrophotometric measurement at 510 nm. The experimental conditions used in the present study were adapted from the referenced procedure and were applied consistently to all honey samples, calibration standards, and reagent blanks. The method is based on the formation of a colored reaction product between proline and ninhydrin under acidic conditions, which is subsequently measured spectrophotometrically at 510 nm.
For sample preparation, 1.0 g of honey was dissolved in 10 mL of distilled water with magnetic stirring, and the resulting solution was subsequently adjusted to a final volume of 20 mL. A 0.5 mL aliquot of this solution was combined with 1.0 mL of 98% formic acid (Sigma-Aldrich) and 1.0 mL of ninhydrin reagent. The ninhydrin reagent was prepared by dissolving 1.0 g of ninhydrin (Sigma-Aldrich) in 25 mL of ethanol (Sigma-Aldrich) and subsequently adjusting the solution to a final volume of 50 mL with ethanol.
A reagent blank was prepared in parallel by replacing the honey solution with 0.5 mL of distilled water while maintaining the same amounts of 98% formic acid (1.0 mL) and ninhydrin solution (1.0 mL). Samples and blanks were subjected to the same reaction conditions. The mixtures were first placed in a boiling water bath for 15 min and were subsequently maintained at 70 °C for 10 min. After addition of 5.0 mL of 2-propanol (Sigma-Aldrich), the mixtures were maintained at 70 °C for 45 min, after which absorbance was measured at 510 nm using a T70+ UV–Visible spectrophotometer (PG Instruments Ltd., Lutterworth, UK) against the reagent blank.
For quantitative calculation, the calibration relationship covered the concentration range of 0–100 ppm, with concentration points of 0, 20, 40, 60, 80, and 100 ppm. Proline calibration standards at these concentration levels were prepared by appropriate dilution of the proline standard solution. A 0.5 mL aliquot of each calibration standard was subjected to the same color-development procedure and reaction conditions as the honey samples, including the addition of 1.0 mL of 98% formic acid and 1.0 mL of ninhydrin reagent, the corresponding heating steps, addition of 5.0 mL of 2-propanol, and subsequent absorbance measurement at 510 nm. The corresponding linear relationship was y = 0.0065x + 0.001, with R2 = 0.9999, where y represents the absorbance measured at 510 nm and x represents the proline-equivalent concentration in the prepared honey solution before the color-development reaction, expressed in ppm (µg/mL). Proline content was converted to mg/kg honey by accounting for the sample preparation, in which 1.0 g of honey was diluted to a final volume of 20 mL, according to:
Proline (mg/kg) = [x (µg/mL) × 20 (mL)]/1.0 (g) = 20x
Considering that 1 µg/g is equivalent to 1 mg/kg, the calculated values were expressed as mg proline/kg honey. Measurements were performed in triplicate (n = 3), using independently prepared analytical replicates, and the results are reported as mean ± standard deviation (SD).
2.4. Statistical Analysis
Experimental data are presented as mean ± standard deviation (SD) based on three independently prepared analytical replicates for each honey sample (n = 3). Each replicate corresponded to a separate sample preparation followed by an independent analytical determination, rather than repeated instrumental measurements of the same prepared solution. These determinations therefore represent analytical replicates of the same honey sample and should not be interpreted as independent biological replicates. Each individual honey sample (H1–H13) constituted a sample-level experimental unit in the study.
For the analytical parameters measured in triplicate, one-way analysis of variance (ANOVA), followed by Tukey’s honestly significant difference (HSD) test, was applied to evaluate differences in the measured analytical responses among the individual honey samples (H1–H13) relative to their within-sample analytical variability. Honey sample identity (H1–H13) was used as the categorical factor. Accordingly, the ANOVA and Tukey’s HSD results were restricted to comparisons of analytical responses among the individual samples investigated and were not interpreted as inferential comparisons among, or generalized to, botanical or geographical populations. Statistical significance was established at p < 0.05. Within each analytical parameter, different superscript letters indicate differences in analytical response among the investigated individual samples according to Tukey’s HSD test (p < 0.05).
The assumptions underlying the one-way ANOVA were assessed using the Shapiro–Wilk test for normality of residuals and Levene’s test for homogeneity of variances. Levene’s test did not indicate significant heterogeneity of variances for any of the evaluated parameters (p > 0.05). However, the Shapiro–Wilk test indicated departures from normality of the residuals for several parameters, whereas the normality assumption was not rejected for TFC and TPC-FC (p > 0.05). Given the small number of analytical replicates per sample (n = 3) and the observed departures from normality, the ANOVA and Tukey’s HSD results were interpreted cautiously and were restricted to exploratory comparisons of the measured analytical responses among the individual samples rather than confirmatory inference regarding botanical or geographical populations.
Associations among the measured physicochemical, bioactive, and enzymatic variables were evaluated using Pearson’s correlation coefficient (r). The variables included in the correlation analysis were moisture content, refractive index, specific optical rotation, electrical conductivity (EC), pH, free acidity, hydroxymethylfurfural (HMF) content, reducing sugar content, ash content, total flavonoid content (TFC), total phenolic content determined by the Prussian Blue assay (TPC-PB), proline content, total phenolic content determined by the Folin–Ciocalteu assay (TPC-FC), and diastase activity. Pearson correlation analysis was performed using the 13 independent honey samples (n = 13), with each individual honey sample representing one observation. Because the 14 analytical variables resulted in 91 pairwise correlations, the corresponding p-values were adjusted for multiple testing using the Benjamini–Hochberg false discovery rate (FDR) procedure. Statistical significance after multiple-testing correction was defined as an FDR-adjusted p-value < 0.05. Given the relatively small number of independent honey samples (n = 13), the estimated correlation coefficients were interpreted cautiously as exploratory measures of association within the investigated dataset.
For multivariate analysis, principal component analysis (PCA) was performed using the same 14 physicochemical, bioactive, and enzymatic variables after standardization to minimize the influence of differences in measurement units and scales. The first three principal components (PC1, PC2, and PC3) were examined, and sample–variable relationships were visualized using the PC1–PC2, PC1–PC3, and PC2–PC3 component combinations. Given the relatively small number of honey samples (n = 13) in relation to the number of analytical variables, PCA was used as an exploratory multivariate approach to visualize patterns of variation and sample–variable relationships within the investigated dataset, rather than as a definitive classification or authentication method.
All statistical analyses were performed using Python 3.13.5 (Python Software Foundation, Wilmington, DE, USA), with NumPy, pandas, SciPy, statsmodels, and scikit-learn. One-way ANOVA, Pearson correlation analysis, the Shapiro–Wilk test, and Levene’s test were performed using SciPy, Tukey’s HSD multiple-comparison test was performed using statsmodels, and data standardization and principal component analysis (PCA) were performed using scikit-learn. Graphical representations were generated using Matplotlib (version 3.10.8).
3. Results and Discussion
3.1. Physicochemical Properties
The physicochemical data obtained for the thirteen honey samples are presented in Table 2. The measurements revealed substantial variation across the sample set, reflecting differences in physicochemical composition among the investigated honey samples. Such variability may be associated with multiple factors, including declared botanical and geographical origin, environmental conditions, maturation status, and post-harvest handling; however, the contribution of individual factors cannot be established from the present dataset. Comparable variability in physicochemical characteristics has been reported for honeys of different botanical and geographical origins [43,44,45,46,47]. Data are reported as mean ± standard deviation (SD) from three independently prepared analytical replicates for each honey sample (n = 3).
Table 2.
Physicochemical properties of honey samples.
Moisture content varied between 14.8 and 21.0% (w/w), with H4 showing the lowest value (14.8 ± 0.2%) and H5 the highest (21.0 ± 0.2%). With the exception of H5, all samples were below the maximum moisture content of 20% specified for honey in general by the Codex Alimentarius Standard for Honey (CXS 12-1981) and Council Directive 2001/110/EC, which provide specific exceptions for certain honey categories [48,49]. The slightly elevated moisture content observed for H5 may have implications for storage stability, since increased water availability can favor fermentation and reduce product shelf life [21,22]. Variations in honey moisture content may be associated with several factors, including declared botanical and geographical origin, climatic conditions, maturity at harvest, and storage conditions [8,43,44,46].
The measured refractive indices ranged from 1.484 to 1.499. As expected, refractive index varied inversely with moisture content because refractometric determination of honey moisture is based on the established relationship between these two parameters [21,43]. Therefore, refractive index was considered a complementary physicochemical parameter rather than an independent indicator of sample variability.
Marked differences were also observed in specific optical rotation, which ranged from −30.0 to +53.0°·mL·g−1·dm−1. Negative rotations characterized H1 and H6–H10, whereas H2–H5 and H11–H13 displayed positive values. The highest positive rotation was recorded for H12, declared as pine honey (+53.0 ± 0.1°·mL·g−1·dm−1), while H9 showed the most negative value (−30.0 ± 0.1°·mL·g−1·dm−1). Optical rotation depends on the relative contribution of optically active sugars and has been proposed as a useful complementary parameter for honey characterization and authentication [29]. Positive optical rotation has also been reported more frequently for honeydew-type honeys than for many nectar honeys [29,50]. However, because individual sugars were not separately quantified in the present study, the observed rotations cannot be directly attributed to particular carbohydrate profiles. Therefore, optical rotation was interpreted as a supporting physicochemical descriptor rather than as an independent marker of botanical origin. Accordingly, its inclusion in the present study provides complementary information on compositional differences among the honey samples and supports their overall physicochemical characterization when interpreted together with the other analytical parameters.
The investigated honeys exhibited pH values ranging from 3.9 to 6.2, confirming their generally acidic nature while demonstrating considerable variation among samples. The highest pH value (6.2 ± 0.1) was observed for H1, declared as sage honey and originating from Shishtavec, Albania. Although this comparatively high value may reflect differences in honey composition, it cannot be specifically attributed to the declared botanical type or geographical origin based on the present dataset. All samples were prepared and analyzed using the same analytical procedure, making systematic differences in sample preparation or measurement unlikely to account for this observation. Similar variability in pH has been reported among honey samples of different botanical and geographical origins [43,44,45,46,47].
Such differences may be related to variation in organic acids, mineral composition, and botanical source. The acidic environment of honey also contributes to its physicochemical stability and to conditions that may restrict microbial growth [3,46]. Because individual organic acids were not quantified in the present study, however, the differences in pH cannot be attributed to specific acids, including gluconic acid.
Thus, pH was included as a complementary quality parameter because it provides information on the acid–base characteristics of the samples and, when considered together with free acidity and the other physicochemical variables, contributes to a more comprehensive characterization of the investigated honeys.
Electrical conductivity varied from 0.05 to 0.55 mS/cm, with H4 displaying the highest value. Differences in conductivity among honey samples may arise from variations in ionic constituents, including mineral salts, organic acids, proteins, and other charged components, and conductivity has therefore been widely used as a physicochemical descriptor in honey characterization [23,24,25,50]. The values recorded for most investigated samples were below the 0.8 mS/cm maximum specified for honeys not belonging to the categories for which different conductivity criteria apply. Notably, H4, declared as chestnut honey, exhibited an electrical conductivity of 0.55 ± 0.0003 mS/cm, which is below the minimum value of 0.8 mS/cm specified for chestnut and honeydew honeys by the Codex Alimentarius Standard for Honey and Council Directive 2001/110/EC [48,49]. This discrepancy should be interpreted cautiously because the botanical designation of H4 was based on producer information and was not independently confirmed by formal melissopalynological analysis. Therefore, the conductivity result alone cannot establish or exclude the declared botanical origin.
Free acidity ranged from 4.0 to 12.2 meq/kg. The highest value was observed in H4 (12.2 ± 0.9 meq/kg), followed by H3 (11.0 ± 0.9 meq/kg) and H10 (10.0 ± 0.4 meq/kg), whereas H9 showed the lowest value (4.0 ± 1.3 meq/kg). Variability in honey acidity may be associated with declared botanical origin, maturation stage, storage conditions, and differences in organic-acid composition [8,10,44]. Because individual organic acids were not quantified in the present study, no association with a particular acid can be established.
The ash content varied considerably among samples, ranging from 0.014 to 0.574%. H8, declared as acacia honey and originating from Resen, North Macedonia, showed the lowest ash content (0.014 ± 0.003%), whereas the highest value was found in H5, declared as meadow honey and originating from Bajram Curri, Albania (0.574 ± 0.003%). Ash content provides information on the inorganic fraction of honey, and variations in mineral composition may be associated with botanical and geographical characteristics [24,25]. For comparison, published data indicate that the total mineral content of blossom honeys is generally approximately 0.1–0.2%, whereas substantially higher levels, approaching 1%, may occur in honeydew honeys [25]. Although ash content and total mineral content are not analytically identical parameters, these literature data illustrate the broad variability of the mineral-associated fraction of honey. The wide range observed in the present samples should therefore be interpreted cautiously, particularly because their botanical origins were producer- or beekeeper-declared and were not independently confirmed by formal melissopalynological analysis. Because dissolved mineral constituents contribute to the ionic properties of honey, ash content may also be related to electrical conductivity [24,25]. Nevertheless, any relationship between these variables within the present sample set was interpreted in the context of the exploratory correlation analysis and the applied multiple-testing correction.
HMF concentrations ranged from 24.2 ± 0.2 to 68.7 ± 0.2 mg/kg. The lowest concentration was recorded in H10 (24.2 ± 0.2 mg/kg), followed by H7 (24.9 ± 0.3 mg/kg), whereas H13 showed the highest value (68.7 ± 0.2 mg/kg). HMF concentrations remained below 40 mg/kg in most samples, with the exceptions of H8 (43.0 ± 0.3 mg/kg) and H13 (68.7 ± 0.2 mg/kg).
HMF is widely used as an indicator related to honey freshness, storage history, and thermal exposure [10,12,28]. Its accumulation is influenced by several interacting factors, including storage time and temperature, acidity, carbohydrate composition, and processing conditions [10,28]. Consequently, the comparatively high concentrations observed for H8 and H13 cannot, on the basis of the available information, be attributed specifically to thermal treatment. According to the Codex Alimentarius Standard for Honey (CXS 12-1981) and Council Directive 2001/110/EC, the maximum HMF content is 40 mg/kg for honey in general, except baker’s honey. A higher limit of 80 mg/kg applies specifically to honey of declared origin from countries or regions with tropical ambient temperatures (tropical climate) and to blends of such honeys [11,12]. Accordingly, application of the 80 mg/kg limit depends on the declared geographical origin meeting this specific climatic criterion and should not be inferred solely from an elevated HMF value. In the present study, H8 originated from Resen, North Macedonia, whereas H13 originated from Dalaman, Turkey. Therefore, the 80 mg/kg criterion was not automatically applied to either sample solely on the basis of geographical origin. Under the general 40 mg/kg criterion, both H8 and H13 exceeded the specified HMF limit.
The proportion of reducing sugars ranged from 48.0 to 78.3%, demonstrating pronounced variability among the samples. H2 showed the highest content (78.3 ± 0.10%), followed by H11 (71.2 ± 0.30%) and H7 (70.0 ± 0.30%). The lowest values were observed in H12 (48.0 ± 0.30%), H10 (49.0 ± 0.30%), and H13 (49.4 ± 0.30%). Reducing sugars constitute a major fraction of honey carbohydrates, with glucose and fructose representing the principal reducing monosaccharides [7,19]. Their concentrations may vary according to botanical source, nectar composition, honey type, and other compositional characteristics [10,43,51]. Since glucose, fructose, and other individual sugars were not quantified separately in the present study, the observed differences were interpreted only at the level of total reducing sugars. According to the Codex Alimentarius Standard for Honey (CXS 12-1981) and Council Directive 2001/110/EC, the compositional criterion for sugars is expressed as the sum of fructose and glucose, with minimum values of 60 g/100 g for blossom honey and 45 g/100 g for honeydew honey and blends of blossom and honeydew honey [48,49]. In the present study, however, reducing sugars were determined using the Lane–Eynon method rather than by separate quantification of fructose and glucose. Therefore, the measured total reducing-sugar values cannot be considered directly equivalent to the regulatory fructose-plus-glucose parameter, and definitive assessment of compliance with these category-specific limits cannot be made from the present data. Accordingly, the reducing-sugar results were interpreted as a comparative physicochemical parameter within the investigated sample set rather than as a direct regulatory determination of fructose and glucose content.
Comparison of samples sharing the same declared honey type further revealed substantial within-type variability. Among the acacia samples (H6–H9), moisture content ranged from 15.0 to 18.0%, electrical conductivity from 0.05 to 0.15 mS/cm, and specific optical rotation from −30.0 to −10.8°·mL·g−1·dm−1, demonstrating physicochemical differences despite their common declared botanical designation. The meadow samples (H2, H3, H5, H10, and H11) likewise exhibited considerable variation; for example, moisture ranged from 16.0 to 21.0%, while reducing sugars ranged from 49.0 to 78.3%. The two pine samples, H12 from Kosovo and H13 from Turkey, showed the same free acidity (8.0 meq/kg) but differed in electrical conductivity (0.17 vs. 0.29 mS/cm), specific optical rotation (+53.0 vs. +31.0°·mL·g−1·dm−1), and HMF content (34.2 vs. 68.7 mg/kg), respectively. These within-type differences demonstrate that samples sharing the same declared botanical type may nevertheless exhibit substantial physicochemical variability. However, the contribution of geographical and environmental conditions, compositional variability, maturity, processing, or storage history cannot be established from the present dataset. Because the botanical designations were producer-declared and were not independently confirmed by melissopalynological analysis, these comparisons should be interpreted as exploratory rather than as definitive evidence of botanical differentiation.
Overall, the physicochemical dataset demonstrated marked compositional differences among the thirteen honey samples. Because no single physicochemical parameter in the present dataset was sufficient to characterize the samples according to their declared botanical or geographical origin, the samples were interpreted on the basis of their combined moisture content, refractive index, optical rotation, electrical conductivity, pH, free acidity, ash, HMF, and reducing-sugar profiles. Multivariable physicochemical approaches have similarly been used to support honey characterization and authentication [25,52,53]. These parameters were subsequently integrated with the bioactive measurements and chemometric analyses to examine relationships among samples and identify the variables contributing most strongly to the observed multivariate variation.
3.2. Bioactive Compounds and Enzymatic Activity
The levels of total phenolic content determined by the Folin–Ciocalteu assay (TPC-FC), total flavonoid content (TFC), total phenolic content determined by the Prussian Blue assay (TPC-PB), and proline, together with diastase activity, in the thirteen honey samples are presented in Table 3. Considerable sample-to-sample variation was observed across the investigated bioactive and enzymatic parameters, illustrating the compositional heterogeneity of the honey set. Previous studies have reported that phenolic and other bioactive constituents of honey may vary in relation to factors such as floral source, environmental conditions, geographical provenance, and processing-related factors [35,54,55,56,57,58,59]. However, these factors were not independently evaluated as determinants of variability in the present study. Given the limited number of samples and the absence of formal melissopalynological authentication, the observed differences among the investigated samples cannot be attributed specifically to any of these factors.
Table 3.
Bioactive and enzymatic characteristics of the investigated honey samples.
The total phenolic content determined by the Folin–Ciocalteu assay (TPC-FC) ranged from 56.12 ± 0.24 to 1034.00 ± 0.15 mg GAE/kg. H10 exhibited the highest TPC-FC (1034.00 ± 0.15 mg GAE/kg), followed by comparatively high values in H8 (629.00 ± 0.15 mg GAE/kg), H1 (610.80 ± 0.24 mg GAE/kg), H2 (502.60 ± 0.15 mg GAE/kg), and H6 (438.77 ± 0.10 mg GAE/kg). In contrast, H3 showed the lowest TPC-FC (56.12 ± 0.24 mg GAE/kg).
The broad distribution of TPC-FC values is consistent with previous reports showing substantial variation in this parameter among honeys of different botanical and geographical origins [35,54,55,56,57]. However, the Folin–Ciocalteu assay is not specific exclusively to phenolic compounds, and its response may also be influenced by non-phenolic reducing substances present in honey. Therefore, the TPC-FC values reported in the present study should be interpreted as Folin–Ciocalteu reducing capacity expressed as gallic acid equivalents rather than as a selective quantification of phenolic compounds alone. Previous studies have reported that phenolic composition may be influenced by floral source, geographical provenance, and environmental conditions [33,35,55,58,59]; however, these factors were not independently demonstrated to explain the variability observed in the present dataset. Accordingly, TPC-FC alone cannot be considered a specific marker of botanical origin and was interpreted together with the other physicochemical, bioactive, enzymatic, and chemometric variables.
The total flavonoid content (TFC) also varied markedly among samples, ranging from 217.6 ± 2.6 to 1617.6 ± 3.0 mg RE/kg. The highest TFC was observed in H3 (1617.6 ± 3.0 mg RE/kg), followed by H6 (1432.6 ± 2.4 mg RE/kg), H4 (1217.6 ± 2.0 mg RE/kg), and H10 (1212.6 ± 6.2 mg RE/kg). The lowest TFC values occurred in H11 (217.6 ± 2.6 mg RE/kg) and H9 (237.6 ± 3.0 mg RE/kg).
Previous studies have reported that flavonoid levels in honey may vary in relation to factors such as botanical source, geographical origin, and environmental conditions [33,35,54,55,58]. However, these factors were not independently evaluated as determinants of TFC variability in the present dataset, and the observed differences therefore cannot be attributed specifically to any of them. Flavonoids form an important component of the phenolic fraction of honey and contribute to its antioxidant properties, although their abundance and composition may vary considerably among honey types [1,33,34,55,59]. Because individual flavonoid compounds were not identified or quantified in the present study, the observed differences were interpreted only at the level of the overall flavonoid response obtained with the applied colorimetric assay. TFC was therefore treated as one component of the overall bioactive profile and interpreted jointly with TPC-FC, TPC-PB, proline, diastase activity, and the physicochemical variables in the subsequent statistical and chemometric analyses.
The total phenolic content determined by the Prussian Blue assay (TPC-PB) showed substantial variation among the investigated honey samples, ranging from 78.92 ± 0.21 to 424.32 ± 0.29 mg GAE/kg (Table 3). The highest TPC-PB values were observed for H6 (424.32 ± 0.29 mg GAE/kg) and H12 (424.32 ± 0.26 mg GAE/kg), followed by H4 (383.18 ± 0.33 mg GAE/kg), H10 (383.18 ± 0.27 mg GAE/kg), H7 (349.60 ± 0.23 mg GAE/kg), and H13 (349.60 ± 0.29 mg GAE/kg). The lowest values were recorded for H3 (78.92 ± 0.21 mg GAE/kg) and H9 (78.92 ± 0.26 mg GAE/kg).
The broad distribution of TPC-PB values further illustrates the heterogeneity of the bioactive profiles within the investigated honey set. The Prussian Blue assay provides an overall colorimetric response to phenolic compounds rather than compound-specific quantification of individual phenolic acids [32,41]. Accordingly, the values obtained using this assay were expressed relative to the gallic acid calibration as mg GAE/kg and should not be interpreted as concentrations of individual phenolic acids. Previous studies have reported that phenolic constituents in honey may vary in relation to botanical origin, geographical provenance, environmental conditions, and the availability of floral resources [33,34,35,55]. However, these factors were not independently evaluated as determinants of variability in the present dataset, and the observed differences therefore cannot be attributed specifically to any of them. TPC-PB was therefore interpreted as a complementary measure of the overall phenolic response and evaluated jointly with TPC-FC, TFC, proline, diastase activity, and the physicochemical variables in the subsequent statistical and chemometric analyses.
The proline content varied markedly among the honey samples, ranging from 70.8 ± 5.8 to 1458.4 ± 4.0 mg/kg (Table 3). H3 exhibited the highest proline content (1458.4 ± 4.0 mg/kg), followed by H12 (1080.0 ± 3.8 mg/kg), H8 (603.0 ± 5.4 mg/kg), and H5 (584.6 ± 4.8 mg/kg). In contrast, the lowest proline contents were observed in H7 (70.8 ± 5.8 mg/kg), H9 (77.2 ± 2.8 mg/kg), and H11 (104.6 ± 6.0 mg/kg).
Proline is a naturally occurring amino acid in honey and has been investigated as a compositional parameter related to honey characterization and maturity [42]. Previous studies have reported that proline concentration may vary among honey samples in relation to botanical source and other compositional factors [42]. Nevertheless, because substantial variability was observed within the present sample set and the factors potentially contributing to this variability were not independently evaluated, proline was not interpreted as an independent indicator of authenticity or overall honey quality but as one component of the broader analytical profile.
Diastase activity also varied among the investigated honey samples, ranging from 5.34 to 12.06 DN (Table 3). The highest diastase activity was observed in H12 (12.06 DN), followed by H9 (9.26 DN) and H8 (8.64 DN), whereas the lowest value was recorded for H7 (5.34 DN). The remaining samples showed intermediate activities ranging from 7.36 to 8.34 DN. Diastase is naturally present in honey, and its activity may decrease during prolonged storage or exposure to elevated temperatures; consequently, it is commonly considered together with other physicochemical parameters in honey-quality assessment [10,11,21]. Diastase activity was therefore interpreted together with HMF as a complementary parameter potentially associated with storage- and heat-related changes. Nevertheless, both parameters may be influenced by several factors, including botanical characteristics, natural enzyme content, storage conditions, and processing history. Accordingly, the observed values were not used to infer a specific thermal or storage history for individual samples. Diastase activity was considered an enzymatic characteristic complementary to the physicochemical and bioactive parameters and was included in the subsequent correlation and multivariate analyses.
Comparison of the four measured bioactive parameters revealed distinct patterns among the thirteen honey samples, with no single sample exhibiting the highest values for all four parameters. H10, for example, showed the highest TPC-FC (1034.00 ± 0.15 mg GAE/kg), together with comparatively elevated TFC (1212.6 ± 6.2 mg RE/kg) and TPC-PB (383.18 ± 0.27 mg GAE/kg) values. High TPC-FC values were also recorded for H8 and H1, whereas H6 and H12 exhibited the highest TPC-PB values (424.32 ± 0.29 and 424.32 ± 0.26 mg GAE/kg, respectively), followed by H4 and H10 (383.18 ± 0.33 and 383.18 ± 0.27 mg GAE/kg, respectively). In contrast, H3 showed the highest TFC but the lowest TPC-FC, demonstrating that the investigated bioactive variables did not vary in parallel across the sample set.
Comparison of samples sharing the same declared honey type further demonstrated substantial within-type variability in their bioactive profiles. The meadow samples (H2, H3, H5, H10, and H11) showed particularly broad variation, with TPC-FC ranging from 56.12 mg GAE/kg in H3 to 1034.00 mg GAE/kg in H10, TFC from 217.6 mg RE/kg in H11 to 1617.6 mg RE/kg in H3, and proline from 104.6 mg/kg in H11 to 1458.4 mg/kg in H3. Considerable variability was also observed among the acacia samples (H6–H9), for which TFC ranged from 237.6 to 1432.6 mg RE/kg, TPC-PB from 78.92 to 424.32 mg GAE/kg, and proline from 70.8 to 603.0 mg/kg. The two pine samples, H12 from Kosovo and H13 from Turkey, also differed in TFC (292.6 vs. 962.6 mg RE/kg), proline (1080.0 vs. 504.6 mg/kg), and TPC-FC (198.10 vs. 140.00 mg GAE/kg), although both exhibited comparatively high TPC-PB values (424.32 and 349.60 mg GAE/kg, respectively). These within-type differences demonstrate substantial compositional variability among samples sharing the same declared botanical designation. However, given the small and unequal number of samples within the declared botanical groups and the absence of formal melissopalynological authentication, these patterns should be interpreted as exploratory sample-level differences rather than as evidence of definitive botanical or geographical differentiation.
These contrasting distributions highlight the compositional diversity of the investigated honeys. Previous studies have likewise reported that phenolic and related bioactive profiles may vary substantially in relation to botanical and geographical origin, as well as environmental conditions [33,34,35,54,55,58]. However, given the design and sample size of the present study, the observed variability cannot be attributed specifically to these factors. Consequently, TPC-FC, TPC-PB, TFC, proline, and diastase activity were treated as complementary compositional and enzymatic descriptors and were subsequently evaluated together with the physicochemical variables through correlation and multivariate analyses.
3.3. Pearson Correlation Analysis
To examine relationships among the physicochemical, bioactive, and enzymatic characteristics of the investigated honey samples, Pearson correlation analysis was performed. The variables included in the analysis were moisture content, refractive index, specific optical rotation, electrical conductivity (EC), pH, free acidity, hydroxymethylfurfural (HMF) content, reducing sugar content, ash content, total flavonoid content (TFC), total phenolic content determined by the Prussian Blue assay (TPC-PB), proline content, total phenolic content determined by the Folin–Ciocalteu assay (TPC-FC), and diastase activity. Pearson correlation coefficients (r) and the corresponding p-values were calculated to assess the strength and direction of linear associations among the measured variables. To account for multiple testing across the 91 pairwise correlations, the resulting p-values were adjusted using the Benjamini–Hochberg false discovery rate (FDR) procedure. The complete correlation matrix is presented as a heatmap in Figure 1. Given the relatively small number of independent honey samples (n = 13), the correlation analysis was interpreted as exploratory. The limited sample size reduces the stability and generalizability of the estimated correlation coefficients; therefore, the observed associations were interpreted cautiously as patterns within the present dataset rather than as definitive relationships among honey characteristics.
Figure 1.
Pearson correlation matrix for the physicochemical, bioactive, and enzymatic parameters of the investigated honey samples (n = 13). Pearson correlation coefficients (r) are displayed within the matrix. TPC-PB, total phenolic content determined by the Prussian Blue assay; TPC-FC, total phenolic content determined by the Folin–Ciocalteu assay. After Benjamini–Hochberg false discovery rate correction for 91 pairwise comparisons, no correlation remained statistically significant at an FDR-adjusted p-value < 0.05.
Before correction for multiple testing, four correlations reached the nominal significance level of p < 0.05. A strong negative correlation was observed between moisture content and refractive index (r = −0.814, p = 0.0007), reflecting the expected inverse relationship between these two parameters. Electrical conductivity (EC) was positively correlated with free acidity (r = 0.683, p = 0.0101), while positive correlations were also observed between free acidity and TFC (r = 0.603, p = 0.0291) and between specific optical rotation and proline content (r = 0.589, p = 0.0342). However, after Benjamini–Hochberg FDR correction across all 91 pairwise comparisons, none of these associations remained statistically significant at an FDR-adjusted p-value < 0.05. The corresponding adjusted p-values were 0.0636, 0.4573, 0.7791, and 0.7791, respectively. Accordingly, these relationships were interpreted as exploratory correlation patterns rather than statistically confirmed associations and should not be interpreted as evidence of direct causal relationships.
None of the remaining variable pairs showed statistically significant associations after FDR correction. In particular, TFC and TPC-FC showed only a weak positive correlation (r = 0.145, unadjusted p = 0.6369). This limited association may reflect the fact that the two colorimetric assays characterize overlapping but not identical aspects of the honey bioactive profile. Flavonoids represent only one fraction of the broader phenolic composition, whereas the Folin–Ciocalteu assay used for TPC-FC provides a broader reducing response and may also be influenced by non-phenolic reducing constituents. In addition, the AlCl3 colorimetric response used for TFC depends on the chemical structure and complexation behavior of individual flavonoids. Accordingly, TFC and TPC-FC were interpreted as complementary rather than interchangeable descriptors of the bioactive profile.
The strongest negative correlation was observed between moisture content and refractive index (r = −0.814, unadjusted p = 0.0007); however, this association did not remain statistically significant after Benjamini–Hochberg FDR correction (adjusted p = 0.0636). As moisture content increased, refractive index decreased, consistent with the established dependence of honey refractive properties on water content [21,43].
Among the physicochemical and compositional variables, electrical conductivity (EC) showed a significant positive correlation with free acidity (r = 0.683, p = 0.0101). This association indicates that, within the present dataset, samples with higher electrical conductivity tended to exhibit higher free acidity. Because electrical conductivity in honey is influenced by ionic and compositional constituents, including minerals, organic acids, proteins, and other charged components [23,24,25], this relationship should be interpreted as an association between compositional characteristics rather than evidence of direct causality.
A significant positive correlation was also observed between free acidity and total flavonoid content (TFC) (r = 0.603, p = 0.0291). This result indicates that samples with higher free acidity tended to show higher TFC within the investigated sample set. However, given the limited number of independent samples and the exploratory nature of the correlation analysis, this association should not be interpreted as evidence that free acidity directly determines flavonoid content. Rather, the observed relationship may reflect broader compositional differences among the investigated honeys.
Specific optical rotation and proline content were also significantly positively correlated (r = 0.589, p = 0.0342). Thus, samples with more positive optical rotation values tended to exhibit higher proline contents within the present dataset. Since specific optical rotation reflects the combined contribution of optically active constituents in honey, whereas proline represents one component of its amino-acid fraction, the observed association should be regarded as a dataset-specific compositional relationship rather than evidence of a direct mechanistic connection between these parameters.
Several additional moderate correlations were observed but did not reach statistical significance after FDR correction. Moisture content showed negative correlations with TFC (r = −0.467) and reducing sugars (r = −0.440). Reducing sugars showed negative correlations with TPC-PB (r = −0.445) and diastase activity (r = −0.426). Other moderate relationships included HMF with specific optical rotation (r = 0.421), free acidity with TPC-PB (r = 0.427), free acidity with proline (r = 0.454), and specific optical rotation with diastase activity (r = 0.492). TFC and TPC-FC showed only a weak positive correlation (r = 0.145, unadjusted p = 0.6369), indicating limited covariation between these two parameters within the investigated honey samples and supporting their interpretation as complementary rather than interchangeable descriptors of the bioactive profile. These relationships represent exploratory trends within the present dataset and cannot be considered statistically confirmed associations.
Overall, four statistically significant correlations were identified at p < 0.05: moisture content–refractive index, EC–free acidity, free acidity–TFC, and specific optical rotation–proline content. No statistically significant correlations involving diastase activity were identified. Given the relatively small sample size (n = 13), all correlations were interpreted as exploratory and as reflecting relationships within the present dataset rather than broadly generalizable associations. The correlation analysis provided a complementary basis for the subsequent principal component analysis (PCA), in which the combined contribution of the physicochemical, bioactive, and enzymatic variables to the multivariate distribution of the investigated samples was evaluated.
3.4. Principal Component Analysis (PCA)
Principal component analysis (PCA) was performed as an exploratory multivariate approach to visualize the main patterns of variability among the investigated honey samples and the contributions of the measured physicochemical, bioactive, and enzymatic variables to the multivariate structure of the dataset. Given the relatively small number of independent honey samples (n = 13) in relation to the number of analytical variables, the PCA was not intended as a definitive classification or authentication model, and its results were interpreted cautiously. Fourteen analytical variables were included in the analysis: moisture content, refractive index, specific optical rotation, electrical conductivity (EC), pH, free acidity, hydroxymethylfurfural (HMF) content, reducing sugar content, ash content, total flavonoid content (TFC), total phenolic content determined by the Prussian Blue assay (TPC-PB), proline content, total phenolic content determined by the Folin–Ciocalteu assay (TPC-FC), and diastase activity. All variables were standardized prior to PCA to minimize the influence of differences in measurement units and scales.
The first three principal components (PC1–PC3) were retained for interpretation and together accounted for 56.40% of the total variance. PC1 explained 22.51% of the variance, PC2 explained 20.88%, and PC3 explained 13.01%, with cumulative explained variances of 22.51%, 43.39%, and 56.40%, respectively. The percentage of variance explained by each component is presented in Table 4.
Table 4.
Explained and cumulative variance of the first three principal components.
Moisture content and refractive index were initially included as separate measured physicochemical parameters; however, their strong inverse association (r = −0.814), although not statistically significant after FDR correction (adjusted p = 0.0636), indicated substantial shared information. Their simultaneous inclusion and its potential influence on the PCA were therefore specifically considered when interpreting the multivariate results. A sensitivity analysis excluding refractive index was additionally performed to assess the robustness of the PCA structure. Exclusion of refractive index resulted in only a limited change in the cumulative variance explained by the first three components (57.71% compared with 56.40% in the complete model), indicating that the overall multivariate structure was not substantially altered by the simultaneous inclusion of these two strongly related variables. Accordingly, the complete PCA containing all 14 measured variables was retained for interpretation.
PCA and related chemometric approaches have been applied to integrate multiple analytical parameters in honey characterization [14,25]. The loading values of the variables contributing most strongly to the principal components are summarized in Table 5, while the distribution of the honey samples and the contributions of the investigated variables are illustrated in Figure 2 and Figure 3, respectively. Given the exploratory nature of the analysis, the PCA plots were interpreted primarily in terms of sample-level variation and variable contributions rather than as evidence of definitive botanical or geographical classification.
Table 5.
PCA loadings of the physicochemical, bioactive, and enzymatic variables for the first three principal components.
Figure 2.
PCA score plots of the investigated honey samples based on the first three principal components: (a) PC1–PC2, explaining 43.39% of the total variance; (b) PC1–PC3, explaining 35.52%; and (c) PC2–PC3, explaining 33.89%. PC1, PC2, and PC3 individually accounted for 22.51%, 20.88%, and 13.01% of the total variance, respectively.
Figure 3.
PCA loading plots showing the contributions of the physicochemical, bioactive, and enzymatic variables to the first three principal components: (a) PC1–PC2, (b) PC1–PC3, and (c) PC2–PC3. PC1, PC2, and PC3 explained 22.51%, 20.88%, and 13.01% of the total variance, respectively.
The first three principal components collectively explained 56.40% of the total variance, with PC1 accounting for 22.51%, PC2 for 20.88%, and PC3 for 13.01%. Among the three possible two-dimensional representations, the PC1–PC2 combination captured the largest proportion of the total variance (43.39%), compared with PC1–PC3 (35.52%) and PC2–PC3 (33.89%). Consequently, the PC1–PC2 score plot was used as the primary two-dimensional representation of sample distribution.
Although the PC1–PC2 plane accounted for less than half of the total variance, this result reflects the multidimensional nature of the dataset, in which multiple physicochemical, bioactive, and enzymatic variables contributed to sample variability. Consideration of PC1, PC2, and PC3 together, accounting for 56.40% of the total variance, therefore provided a broader representation of the multivariate structure than any individual two-dimensional projection. PCA and related chemometric approaches have been used in honey studies to explore complex compositional datasets and relationships among analytical characteristics [14,25]. In the present study, however, the PCA was interpreted as an exploratory assessment of sample-level variation rather than as evidence of definitive botanical or geographical classification.
Examination of the PCA loadings indicated that PC1 was primarily associated with free acidity (0.865), EC (0.698), proline (0.695), specific optical rotation (0.641), TFC (0.603), and TPC-PB (0.548). These variables loaded in the same positive direction, indicating that they contributed jointly to the variation represented by PC1.
PC2 was characterized primarily by a strong positive loading for moisture (0.818) and negative loadings for refractive index (−0.742) and TFC (−0.601). Positive contributions were also observed for HMF (0.638), specific optical rotation (0.545), and diastase activity (0.520), whereas reducing sugars loaded negatively (−0.531). The opposite loadings of moisture and refractive index are consistent with the strong inverse association observed between these variables in the Pearson correlation analysis, although this association did not remain statistically significant after FDR correction.
PC3 was influenced most strongly by ash (0.759) and reducing sugars (0.636) in the positive direction and by TPC-PB (−0.563) in the negative direction. TPC-FC also showed a moderate negative loading (−0.464). Thus, the first three components reflected different combinations of physicochemical, bioactive, and enzymatic characteristics rather than a single dominant analytical dimension.
The PCA score plots revealed a broad distribution of the investigated honey samples across the principal component space, reflecting considerable variability in their combined physicochemical, bioactive, and enzymatic profiles. In the PC1–PC2 projection (Figure 2a), which accounted for 43.39% of the total variance, H3, H4, H6, H10, H12, and H13 were positioned on the positive side of PC1, whereas H2, H5, H7, H8, H9, and H11 showed negative PC1 scores; H1 was located close to the PC1 origin. Along PC2, H5, H8, H9, H11, H12, and H13 showed positive scores, whereas H1, H2, H3, H4, H6, H7, and H10 were positioned in the negative PC2 region. Among the more distinct positions, H9 showed the most negative PC1 score, H5 exhibited the highest positive PC2 score, and H4 was characterized by a comparatively high positive PC1 and negative PC2 score.
The complementary PC1–PC3 projection (Figure 2b), accounting for 35.52% of the total variance, provided additional information on sample-level variation. H3 showed a pronounced positive PC3 score and was also positioned on the positive side of PC1, whereas H10 exhibited the most negative PC3 score. H12 and H13 were located in the positive PC1/negative PC3 region, while H9, H7, and H8 occupied the negative PC1/negative PC3 region. In contrast, H2, H5, and H11 showed negative PC1 but positive PC3 scores.
The PC2–PC3 projection (Figure 2c), which represented 33.89% of the total variance, further illustrated the contribution of PC3 to the multivariate distribution. H5 showed high positive scores for both PC2 and PC3, whereas H10 was located in the negative regions of both components. H12 and H13 occupied the positive PC2/negative PC3 region, while H3 was distinguished by a comparatively high positive PC3 score despite its slightly negative PC2 position. These patterns further demonstrate the heterogeneous distribution of the investigated samples across the multivariate space.
Taken together, the three score-plot projections indicate that the relationships among the samples were not completely represented by the conventional PC1–PC2 plane alone. PC3 contributed additional information on sample-level variability, and consideration of PC1, PC2, and PC3 together accounted for 56.40% of the total variance. Importantly, the score plots did not reveal a clear or consistent grouping of the samples according to their declared botanical type or geographical origin. Rather, the broad dispersion reflects the compositional heterogeneity of the investigated sample set. Accordingly, the PCA results were interpreted as an exploratory visualization of multivariate sample variation and variable relationships rather than as evidence of definitive botanical or geographical classification. This interpretation is consistent with the exploratory application of PCA to complex honey compositional datasets [14,25].
The PCA loading plots (Figure 3) revealed distinct contributions of the physicochemical, bioactive, and enzymatic variables to the first three principal components. PC1 was characterized primarily by positive loadings for free acidity (0.865), EC (0.698), proline (0.695), specific optical rotation (0.641), TFC (0.603), and TPC-PB (0.548). These variables were oriented in the same positive direction and therefore contributed jointly to the variation represented by PC1. In contrast, reducing sugars (−0.472) and moisture content (−0.223) were oriented toward the negative side of PC1, although their contributions were less pronounced. Thus, PC1 primarily represented a combined gradient involving physicochemical, bioactive, and compositional characteristics rather than a single analytical parameter.
PC2 was characterized by a strong positive loading for moisture content (0.818) and strong negative loadings for refractive index (−0.742) and TFC (−0.601). Positive contributions were also observed for HMF (0.638), specific optical rotation (0.545), and diastase activity (0.520), whereas reducing sugars (−0.531) were oriented toward the negative side of PC2. The opposite orientation of moisture content and refractive index is consistent with the strong inverse relationship identified between these variables in the Pearson correlation analysis. PC2 therefore represented an additional compositional gradient involving water-related physicochemical properties together with bioactive and enzymatic characteristics.
PC3 captured additional variation not represented by the first two components. Ash content (0.759) and reducing sugars (0.636) showed the strongest positive loadings on PC3, whereas TPC-PB (−0.563) exhibited a pronounced negative loading. TPC-FC (−0.464) also contributed negatively to PC3, while pH (0.391) showed a moderate positive contribution. These opposing contributions indicate that PC3 provided complementary information on the relationships among physicochemical and bioactive characteristics that was not fully represented in the PC1–PC2 plane.
Taken together, the loading and score plots indicate that the distribution of the investigated honey samples resulted from the combined contribution of multiple physicochemical, bioactive, and enzymatic variables, rather than from any single analytical parameter. Consideration of the first three principal components, which together explained 56.40% of the total variance, provided a broader representation of the multivariate structure of the dataset than the PC1–PC2 projection alone. Nevertheless, the PCA did not reveal a clear grouping according to declared botanical type or geographical origin. Therefore, the observed multivariate patterns were interpreted as exploratory sample-level compositional variation rather than evidence of definitive botanical or geographical classification. This interpretation is consistent with the use of PCA as an exploratory chemometric tool for integrating multiple honey-quality variables and examining complex compositional patterns [14,25].
4. Conclusions
This study demonstrates substantial multidimensional compositional variability among thirteen honey samples of different declared botanical types and geographical origins. The main finding is that no single physicochemical, bioactive, or enzymatic parameter adequately captured the differences among the investigated samples. Instead, the combined evaluation of physicochemical properties, TPC-FC, TFC, TPC-PB, proline content, and diastase activity provided a more comprehensive representation of sample-level compositional variation. Pearson correlation analysis revealed several moderate-to-strong nominal associations; however, none remained statistically significant after Benjamini–Hochberg FDR correction for multiple testing. Similarly, PCA revealed multivariate variation among the samples but did not produce clear or consistent grouping according to declared botanical type or geographical origin. These statistical findings therefore support an exploratory interpretation of the dataset rather than definitive botanical or geographical discrimination.
Several methodological limitations should be considered when interpreting these findings. The study comprised a relatively small and unbalanced set of thirteen independent honey samples, with some declared botanical types represented by only one sample. In addition, the declared botanical origins were based on information provided by the respective beekeepers or producers and were not independently verified by formal melissopalynological analysis. The small sample size relative to the number of analytical variables also limits the stability and generalizability of the correlation and PCA results. Consequently, the observed differences and multivariate patterns should be regarded as specific to the investigated sample set and should not be generalized to broader botanical or geographical populations.
From a practical perspective, the findings highlight the value of combining complementary physicochemical, bioactive, and enzymatic measurements for multidimensional honey characterization rather than relying on a single quality or compositional marker. The different analytical approaches provide complementary information on honey composition and quality-related characteristics and may therefore serve as a useful basis for preliminary comparative assessment. However, the present analytical framework should not be considered sufficient on its own for definitive authentication of botanical or geographical origin.
Future research should extend this approach to larger, more balanced, and independently authenticated sample sets, including multiple biological samples for each botanical and geographical group. Systematic melissopalynological verification should be combined with complementary chromatographic and elemental analyses to provide more specific compositional information. Such studies could also enable the development and external validation of more robust multivariate classification models and provide a stronger basis for evaluating the potential of integrated analytical approaches in honey authentication and botanical or geographical differentiation.
Author Contributions
Conceptualization, A.R.-N. and M.D.-S.; methodology, A.R.-N.; investigation, E.R. and A.L.; formal analysis, A.R.-N.; data curation, A.R.-N.; writing—original draft preparation, A.R.-N.; writing—review and editing, A.R.-N., M.D.-S. and M.A.; supervision, A.R.-N. and M.D.-S.; project administration, A.R.-N. All authors have read and agreed to the published version of the manuscript.
Funding
This research received no external funding.
Institutional Review Board Statement
Not applicable.
Informed Consent Statement
Not applicable.
Data Availability Statement
The data presented in this study are available within the article.
Acknowledgments
The authors gratefully acknowledge the Department of Chemistry, Faculty of Mathematical and Natural Sciences, University of Prishtina, Kosovo, for providing laboratory facilities and technical support for this research.
Conflicts of Interest
The authors declare no conflicts of interest.
References
- Cianciosi, D.; Forbes-Hernández, T.Y.; Afrin, S.; Gasparrini, M.; Reboredo-Rodriguez, P.; Manna, P.P.; Zhang, J.; Bravo Lamas, L.; Martínez Flórez, S.; Agudo Toyos, P.; et al. Phenolic compounds in honey and their associated health benefits: A review. Molecules 2018, 23, 2322. [Google Scholar] [CrossRef] [Scilit] [PubMed]
- Baglio, E. Chemistry and Technology of Honey Production; Springer: Cham, Switzerland, 2018. [Google Scholar] [CrossRef] [Scilit]
- Al-Kafaween, M.A.; Alwahsh, M.; Hilmi, A.B.M.; Abulebdah, D.H. Physicochemical characteristics and bioactive compounds of different types of honey and their biological and therapeutic properties: A comprehensive review. Antibiotics 2023, 12, 337. [Google Scholar] [CrossRef] [Scilit] [PubMed]
- Sharaf El-Din, M.G.; Farrag, A.F.S.; Wu, L.; Huang, Y.; Wang, K. Health benefits of honey: A critical review on the homology of medicine and food in traditional and modern contexts. J. Tradit. Chin. Med. Sci. 2025, 12, 147–164. [Google Scholar] [CrossRef] [Scilit]
- Alvarez-Suarez, J.M.; Giampieri, F.; Battino, M. Honey as a source of dietary antioxidants: Structures, bioavailability and evidence of protective effects against human chronic diseases. Curr. Med. Chem. 2013, 20, 621–638. [Google Scholar] [CrossRef] [Scilit] [PubMed]
- El Sohaimy, S.A.; Masry, S.H.D.; Shehata, M.G. Physicochemical characteristics of honey from different origins. Ann. Agric. Sci. 2015, 60, 279–287. [Google Scholar] [CrossRef] [Scilit]
- da Silva, P.M.; Gauche, C.; Gonzaga, L.V.; Costa, A.C.O.; Fett, R. Honey: Chemical composition, stability and authenticity. Food Chem. 2016, 196, 309–323. [Google Scholar] [CrossRef] [Scilit] [PubMed]
- Escriche, I.; Tanleque-Alberto, F.; Visquert, M.; Oroian, M. Physicochemical and rheological characterization of honey from Mozambique. LWT 2017, 86, 108–115. [Google Scholar] [CrossRef] [Scilit]
- Smetanska, I.; Alharthi, S.S.; Selim, K.A. Physicochemical, antioxidant capacity and color analysis of six honeys from different origin. J. King Saud Univ. Sci. 2021, 33, 101447. [Google Scholar] [CrossRef] [Scilit]
- Kiran, C.; Riyaz, M. Understanding the physicochemical profile of honey: A comprehensive review of quality and authenticity parameters. J. Food Compos. Anal. 2026, 151, 108993. [Google Scholar] [CrossRef] [Scilit]
- Bogdanov, S.; Lüllmann, C.; Peter, M.; von der Ohe, W.; Russmann, H.; Vorwohl, G.; Oddo, L.P.; Sabatini, A.G.; Marcazzan, G.L.; Piro, R.; et al. Honey quality and international regulatory standards: Review by the International Honey Commission. Bee World 1999, 80, 61–69. [Google Scholar] [CrossRef] [Scilit]
- Puścion-Jakubik, A.; Borawska, M.H.; Socha, K. Modern methods for assessing the quality of bee honey and botanical origin identification. Foods 2020, 9, 1028. [Google Scholar] [CrossRef] [Scilit] [PubMed]
- Zhang, X.-H.; Gu, H.-W.; Liu, R.-J.; Qing, X.-D.; Nie, J.-F. A comprehensive review of the current trends and recent advancements on the authenticity of honey. Food Chem. X 2023, 19, 100850. [Google Scholar] [CrossRef] [Scilit] [PubMed]
- Karabagias, I.K.; Badeka, A.V.; Kontakos, S.; Karabournioti, S.; Kontominas, M.G. Botanical discrimination of Greek unifloral honeys with physico-chemical and chemometric analyses. Food Chem. 2014, 165, 181–190. [Google Scholar] [CrossRef] [Scilit] [PubMed]
- Khare, T.; Mosa, K.A.; Hamdy, R.; Elnaggar, A.; Malik, S.; Khan, S.K.; El-Keblawy, A.; Lamghari, F.; Alhmoudi, A.M.S.; Alyammahi, K.M. Cutting-edge approaches for honey authentication: Chemical, molecular, and AI-driven strategies for botanical origin verification. J. Food Compos. Anal. 2025, 146, 107974. [Google Scholar] [CrossRef] [Scilit]
- Tosun, M.; Keleş, F. Investigation methods for detecting honey samples adulterated with sucrose syrup. J. Food Compos. Anal. 2021, 101, 103941. [Google Scholar] [CrossRef] [Scilit]
- Bose, D.; Padmavati, M. Honey authentication: A review of the issues and challenges associated with honey adulteration. Food Biosci. 2024, 61, 105004. [Google Scholar] [CrossRef] [Scilit]
- Chin, N.L.; Sowndhararajan, K. A review on analytical methods for honey classification, identification and authentication. In Honey Analysis—New Advances and Challenges; Toledo, V.A.A., Chambó, E.D., Eds.; IntechOpen: London, UK, 2020. [Google Scholar] [CrossRef] [Scilit]
- Doner, L.W. The sugars of honey—A review. J. Sci. Food Agric. 1977, 28, 443–456. [Google Scholar] [CrossRef] [Scilit] [PubMed]
- Bonsignore, G.; Martinotti, S.; Ranzato, E. Honey bioactive molecules: There is a world beyond the sugars. BioTech 2024, 13, 47. [Google Scholar] [CrossRef] [Scilit] [PubMed]
- Bicudo de Almeida-Muradian, L.; Barth, O.M.; Dietemann, V.; Eyer, M.; da Silva de Freitas, A.; Martel, A.-C.; Marcazzan, G.L.; Marchese, C.M.; Mucignat-Caretta, C.; Pascual-Maté, A.; et al. Standard methods for Apis mellifera honey research. J. Apic. Res. 2020, 59, 1–62. [Google Scholar] [CrossRef] [Scilit]
- White, J.W., Jr. Moisture in honey: Review of chemical and physical methods. J. Assoc. Off. Anal. Chem. 1969, 52, 729–737. [Google Scholar] [CrossRef] [Scilit]
- Acquarone, C.; Buera, P.; Elizalde, B. Pattern of pH and electrical conductivity upon honey dilution as a complementary tool for discriminating geographical origin of honeys. Food Chem. 2007, 101, 695–703. [Google Scholar] [CrossRef] [Scilit]
- Thakur, M.; Gupta, N.; Sharma, H.K.; Devi, S. Physicochemical characteristics and mineral status of honey from different agro-climatic zones of Himachal Pradesh, India. Br. Food J. 2021, 123, 3789–3804. [Google Scholar] [CrossRef] [Scilit]
- Pavlin, A.; Kočar, D.; Imperl, J.; Kolar, M.; Marolt, G.; Petrova, P. Honey origin authentication via mineral profiling combined with chemometric approaches. Foods 2023, 12, 2826. [Google Scholar] [CrossRef] [Scilit] [PubMed]
- Pauliuc, D.; Dranca, F.; Oroian, M. Antioxidant activity, total phenolic content, individual phenolics and physicochemical parameters suitability for Romanian honey authentication. Foods 2020, 9, 306. [Google Scholar] [CrossRef] [Scilit] [PubMed]
- Jaśkiewicz, K.; Szczęsna, T.; Jachuła, J. How Phenolic Compounds Profile and Antioxidant Activity Depend on Botanical Origin of Honey—A Case of Polish Varietal Honeys. Molecules 2025, 30, 360. [Google Scholar] [CrossRef] [Scilit] [PubMed]
- Fazakas, D.; Mot, A.C. Spectrophotometric assessment of 5-HMF in thermally treated honey: Analytical performance comparison of classical and modified methods. Chemistry 2025, 7, 64. [Google Scholar] [CrossRef] [Scilit]
- Gerginova, D.; Kurteva, V.; Simova, S. Optical rotation—A reliable parameter for authentication of honey? Molecules 2022, 27, 8916. [Google Scholar] [CrossRef] [Scilit] [PubMed]
- Fastovets, A.; Barabash, R.; Syrotchuk, O.; Alekseev, S.; Ischenko, M. Classical vs modified Folin–Ciocalteu assay for total phenolic content determination in honey. ACS Food Sci. Technol. 2026, 6, 2267–2272. [Google Scholar] [CrossRef] [Scilit]
- Sultana, S.; Lozada Lawag, I.; Lim, L.Y.; Foster, K.J.; Locher, C. A critical exploration of the total flavonoid content assay for honey. Methods Protoc. 2024, 7, 95. [Google Scholar] [CrossRef] [Scilit] [PubMed]
- Price, M.L.; Butler, L.G. Rapid visual estimation and spectrophotometric determination of tannin content of sorghum grain. J. Agric. Food Chem. 1977, 25, 1268–1273. [Google Scholar] [CrossRef] [Scilit]
- Becerril-Sánchez, A.L.; Quintero-Salazar, B.; Dublán-García, O.; Escalona-Buendía, H.B. Phenolic compounds in honey and their relationship with antioxidant activity, botanical origin, and color. Antioxidants 2021, 10, 1700. [Google Scholar] [CrossRef] [Scilit] [PubMed]
- Wilczyńska, A.; Żak, N. Polyphenols as the main compounds influencing the antioxidant effect of honey—A review. Int. J. Mol. Sci. 2024, 25, 10606. [Google Scholar] [CrossRef] [Scilit] [PubMed]
- Akgün, N.; Çelik, Ö.F.; Kelebekli, L. Physicochemical properties, total phenolic content, and antioxidant activity of chestnut, rhododendron, acacia and multifloral honey. J. Food Meas. Charact. 2021, 15, 3501–3508. [Google Scholar] [CrossRef] [Scilit]
- Bertoncelj, J.; Doberšek, U.; Jamnik, M.; Golob, T. Evaluation of the phenolic content, antioxidant activity and colour of Slovenian honey. Food Chem. 2007, 105, 822–828. [Google Scholar] [CrossRef] [Scilit]
- Tuberoso, C.I.G.; Jerković, I.; Sarais, G.; Congiu, F.; Marijanović, Z.; Kuś, P.M. Color evaluation of seventeen European unifloral honey types by means of spectrophotometrically determined CIE LCabh(ab)° chromaticity coordinates. Food Chem. 2014, 145, 284–291. [Google Scholar] [CrossRef] [Scilit] [PubMed]
- Escuredo, O.; Rodríguez-Flores, M.S.; Rojo-Martínez, S.; Seijo, M.C. Contribution to the chromatic characterization of unifloral honeys from Galicia (NW Spain). Foods 2019, 8, 233. [Google Scholar] [CrossRef] [Scilit] [PubMed]
- Vujčić Bok, V.; Šola, I.; Rusak, G.; Budisavljević, A.; Nguyen, R.; Ludwig-Müller, J.; Maleš, Ž. Phenolic content and antioxidant activity of Croatian and German honey. Acta Pharm. 2024, 74, 673–692. [Google Scholar] [CrossRef] [Scilit] [PubMed]
- Šola, I.; Vujčić Bok, V.; Fabijanić, I.; Jablan, J.; Borgese, L.; Humski, A.; Mikulić, M.; Sanković, K.; Franić, Z.; Rusak, G. Influence of Season, Hive Position, Extraction Method and Storage Temperature on Polyphenols and Antioxidant Activity of Croatian Honey. Molecules 2025, 30, 919. [Google Scholar] [CrossRef] [Scilit] [PubMed]
- Stern, J.L.; Hagerman, A.E.; Steinberg, P.D.; Winter, F.C.; Estes, J.A. A new assay for quantifying brown algal phlorotannins and comparisons to previous methods. J. Chem. Ecol. 1996, 22, 1273–1293. [Google Scholar] [CrossRef] [Scilit] [PubMed]
- Truzzi, C.; Annibaldi, A.; Illuminati, S.; Finale, C.; Scarponi, G. Determination of proline in honey: Comparison between official methods, optimization and validation of the analytical methodology. Food Chem. 2014, 150, 477–481. [Google Scholar] [CrossRef] [Scilit] [PubMed]
- Tesfaye, O.; Muleta, D.; Desalegn, A. A comparative study on the physicochemical and antioxidant properties of honeys from Apis mellifera L. and Meliponula beccarii L. collected from Western Oromia, Ethiopia. Int. J. Food Sci. 2024, 2024, 4448277. [Google Scholar] [CrossRef] [Scilit] [PubMed]
- Hajian-Tilaki, A.; Esmaeilzadeh Kenari, R.; Farahmandfar, R.; Razavi, R. Comparative study of physiochemical properties in Iranian multi-floral honeys: Local vs. commercial varieties. Heliyon 2024, 10, e37550. [Google Scholar] [CrossRef] [Scilit] [PubMed]
- Royo, V.d.A.; de Oliveira, D.A.; Veloso, P.H.F.; Sacramento, V.d.M.; Olimpio, E.L.A.; de Souza, L.F.; Pires, N.d.C.; Martins, C.H.G.; Santiago, M.B.; Alves, T.M.d.A.; et al. Physicochemical profile, antioxidant and antimicrobial activities of honeys produced in Minas Gerais (Brazil). Antibiotics 2022, 11, 1429. [Google Scholar] [CrossRef] [Scilit] [PubMed]
- Luca, L.; Pauliuc, D.; Ursachi, F.; Oroian, M. Physicochemical parameters, microbiological quality, and antibacterial activity of honey from the Bucovina region of Romania. Sci. Rep. 2025, 15, 4358. [Google Scholar] [CrossRef] [Scilit] [PubMed]
- Ribeiro, R.J.; Garcia, R.C.; Tonelli, L.L.; Chiamolera, S.R.; Favreto, L.P.; Oliveira, S.S.; Camargo, S.C.; Galhardo, D. Physicochemical characterization, bioactive compounds and antioxidant activity of Apis mellifera honey from Western Paraná State, Brazil. Acta Bras. 2022, 6, 95–100. [Google Scholar] [CrossRef] [Scilit]
- CXS 12-1981; Codex Alimentarius—Standard for Honey. FAO: Rome, Italy; WHO: Geneva, Switzerland, 2022.
- Council of the European Union. Council Directive 2001/110/EC of 20 December 2001 relating to honey. Off. J. Eur. Communities 2002, L 10, 47–52. [Google Scholar]
- Seraglio, S.K.T.; Silva, B.; Bergamo, G.; Brugnerotto, P.; Gonzaga, L.V.; Fett, R.; Costa, A.C.O. An overview of physicochemical characteristics and health-promoting properties of honeydew honey. Food Res. Int. 2019, 119, 44–66. [Google Scholar] [CrossRef] [Scilit] [PubMed]
- Zhang, G.; Liu, Y.; Luo, Y.; Zhang, C.; Li, S.; Zheng, H.; Jiang, X.; Hu, F. Comparison of the physicochemical properties, microbial communities, and hydrocarbon composition of honeys produced by different Apis species. Foods 2024, 13, 3753. [Google Scholar] [CrossRef] [Scilit] [PubMed]
- Mostoles, D.; de Krijger, F.; Mara, A.; Sanna, G.; Saurina, J.; Sentellas, S.; Núñez, O. Honey geographical origin characterization and authentication based on spectrophotometric assays, physicochemical parameters, and LC-MS/MS polyphenolic profiling. Foods 2025, 14, 3828. [Google Scholar] [CrossRef] [Scilit] [PubMed]
- Oroian, M.; Ropciuc, S. Honey authentication based on physicochemical parameters and phenolic compounds. Comput. Electron. Agric. 2017, 138, 148–156. [Google Scholar] [CrossRef] [Scilit]
- Khalil, M.I.; Moniruzzaman, M.; Boukraâ, L.; Benhanifia, M.; Islam, M.A.; Islam, M.N.; Sulaiman, S.A.; Gan, S.H. Physicochemical and antioxidant properties of Algerian honey. Molecules 2012, 17, 11199–11215. [Google Scholar] [CrossRef] [Scilit] [PubMed]
- Fechner, D.C.; Hidalgo, M.J.; Ruiz Díaz, J.D.; Gil, R.A.; Pellerano, R.G. Geographical origin authentication of honey produced in Argentina. Food Biosci. 2020, 33, 100483. [Google Scholar] [CrossRef] [Scilit]
- Belay, A.; Solomon, W.K.; Bultossa, G.; Adgaba, N.; Melaku, S. Botanical origin, colour, granulation, and sensory properties of the Harenna forest honey, Bale, Ethiopia. Food Chem. 2015, 167, 213–219. [Google Scholar] [CrossRef] [Scilit] [PubMed]
- Serra Bonvehí, J.; Ventura Coll, F.; Orantes Bermejo, J.F. Characterization of avocado honey (Persea americana Mill.) produced in Southern Spain. Food Chem. 2019, 287, 214–221. [Google Scholar] [CrossRef] [Scilit] [PubMed]
- Ja’afar, N.L.; Ab Aziz, N.A.; Zakaria, Z.; Mustapha, M.; Mohamed, M.; Mustafa, M.Z.; Hashim, S. A narrative review on the physicochemical profiles, bioactive compounds, and therapeutic potentials of stingless bee honey. Discov. Food 2025, 5, 150. [Google Scholar] [CrossRef] [Scilit]
- Osés, S.M.; Sancho, M.T. Honey and bee products: Characterization, bioactivities, and authenticity. Foods 2026, 15, 647. [Google Scholar] [CrossRef] [Scilit] [PubMed]
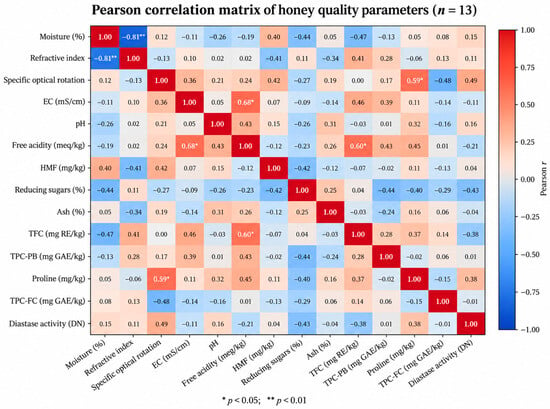
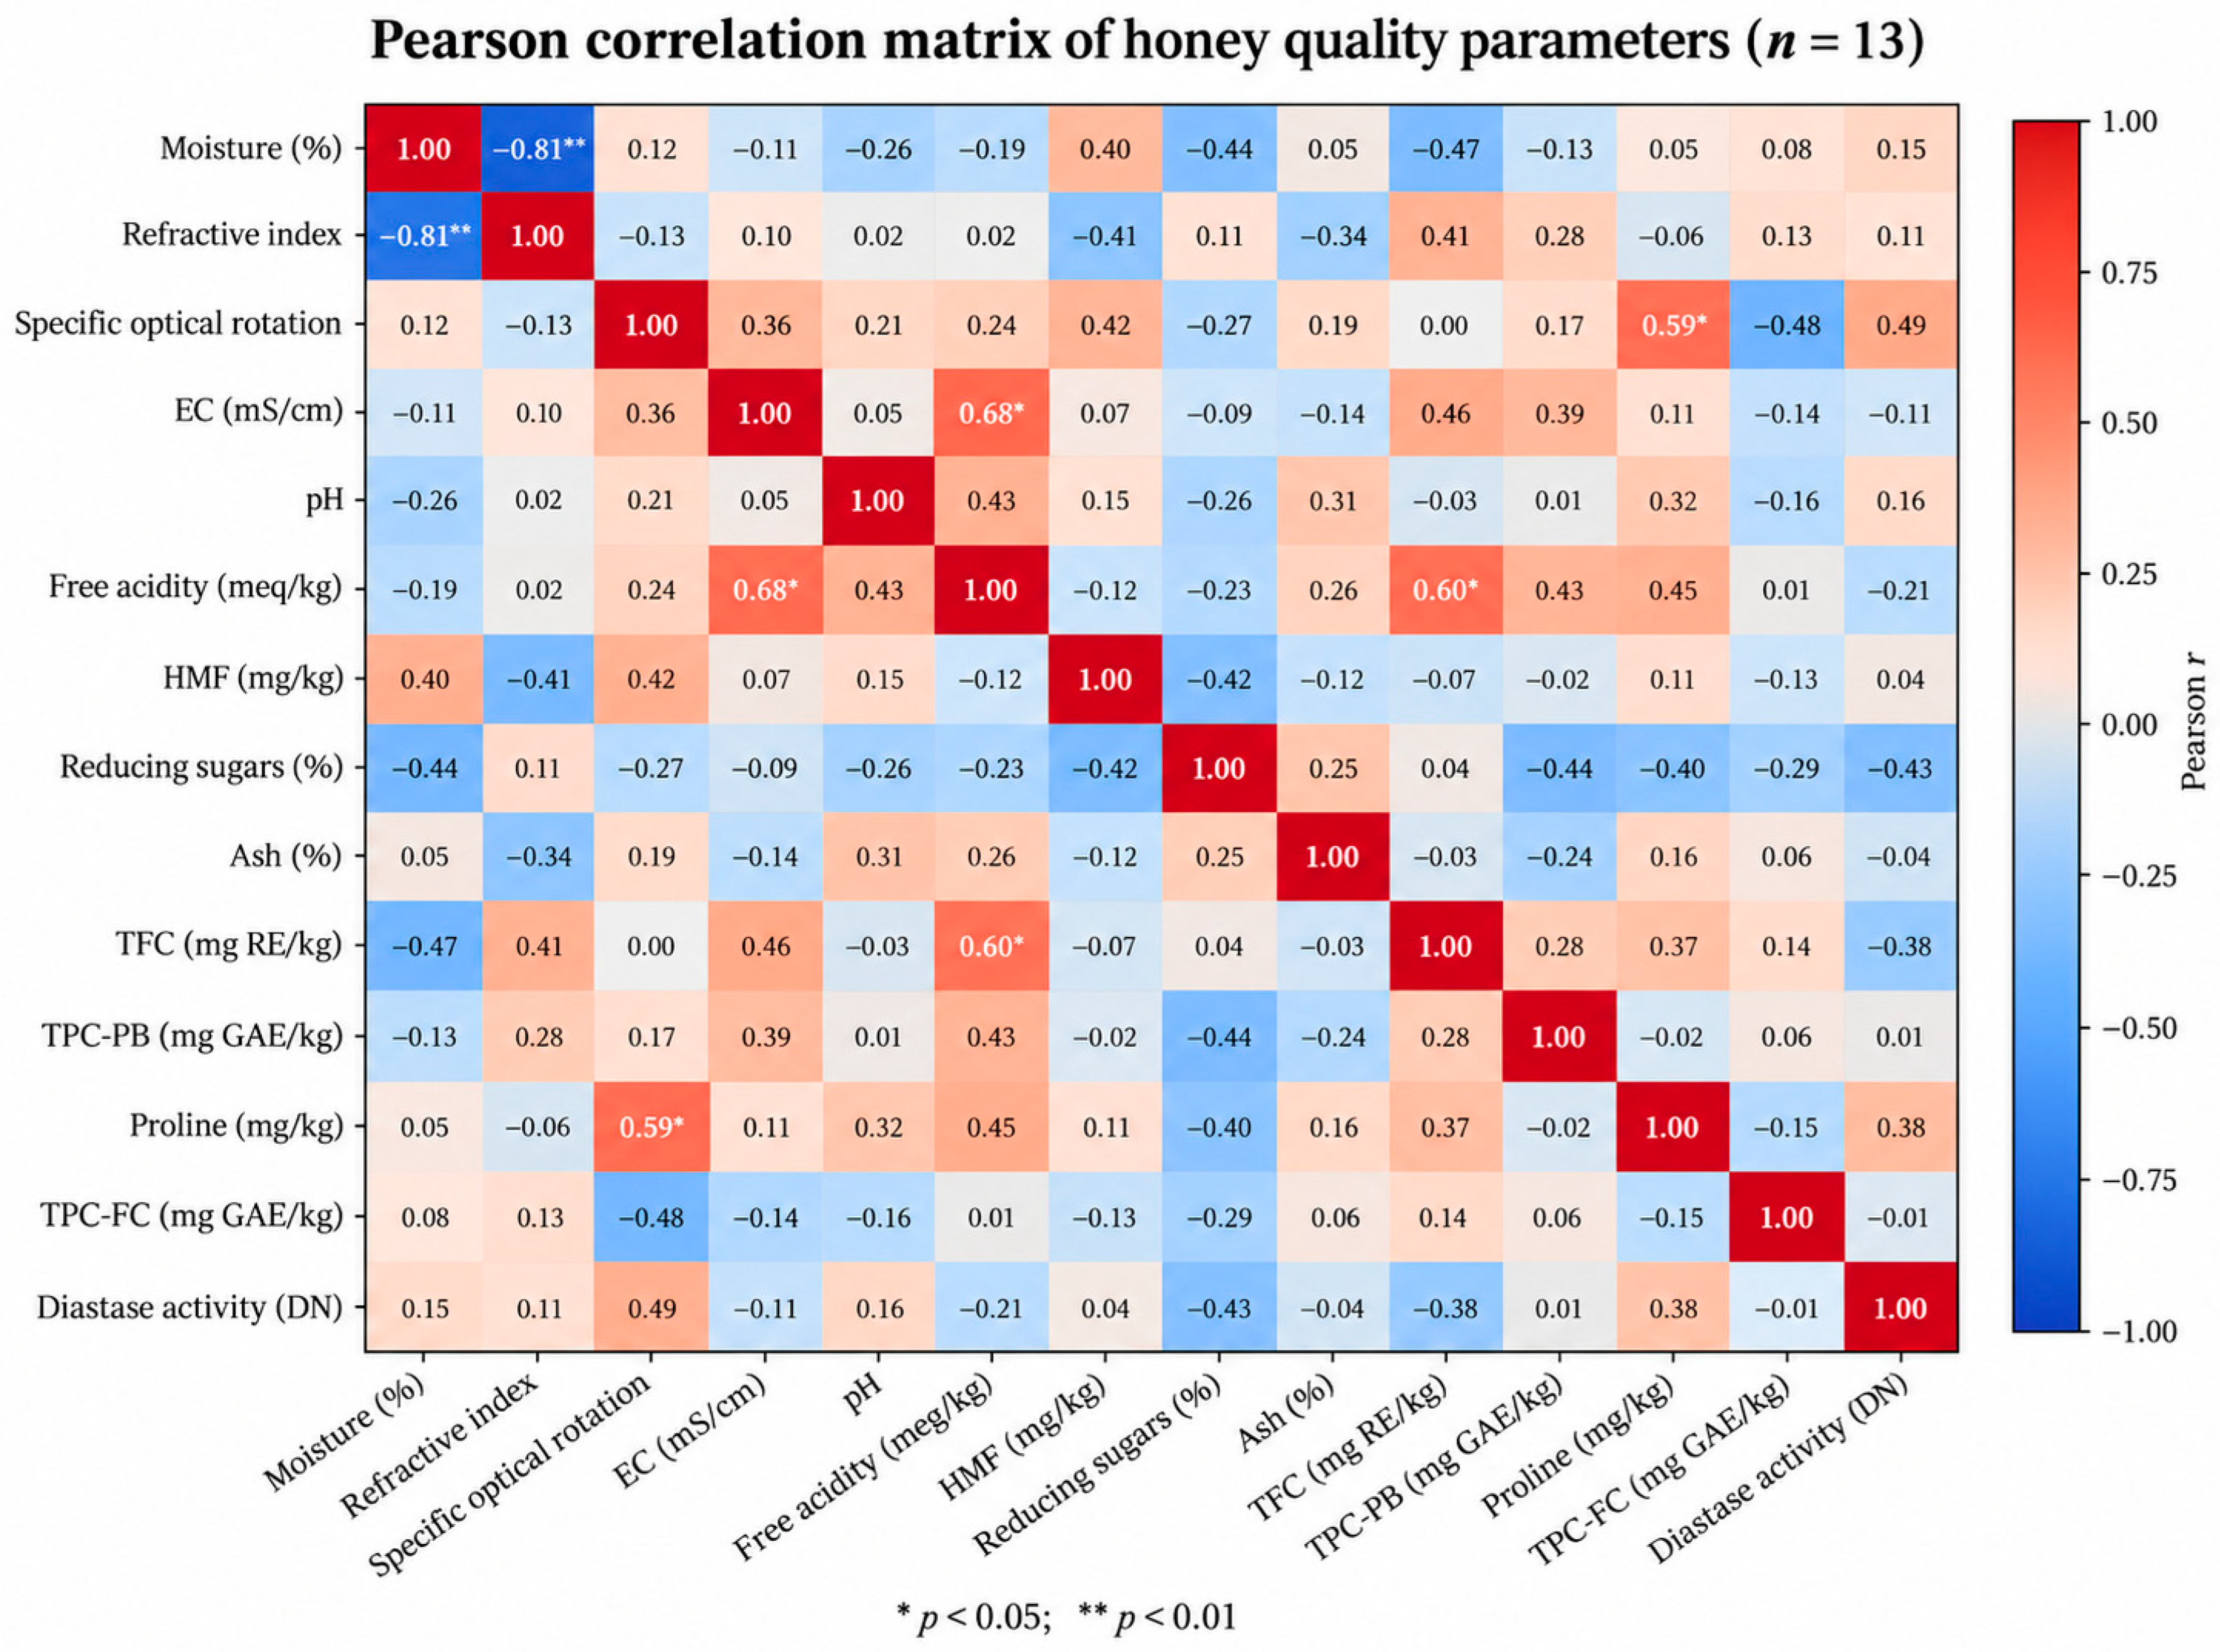
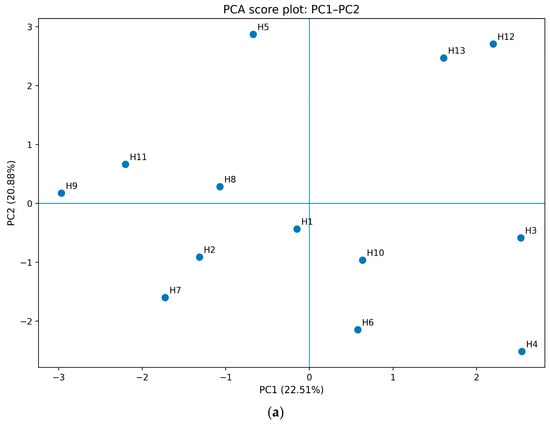
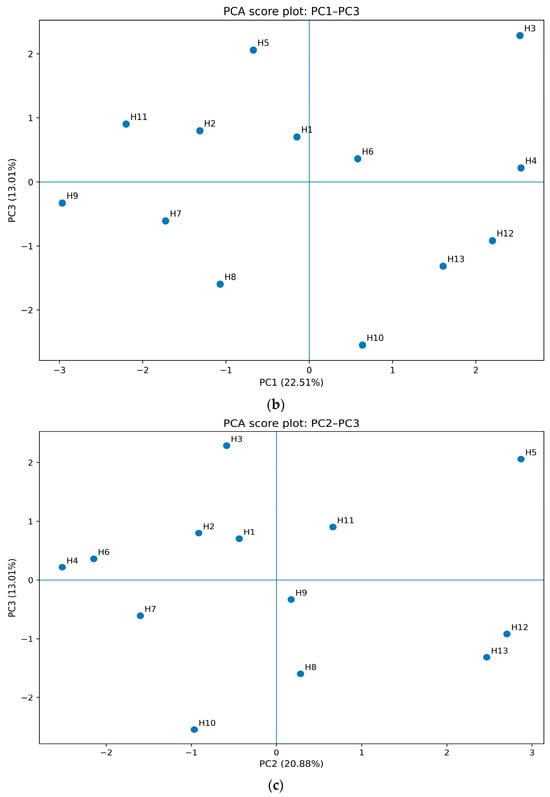
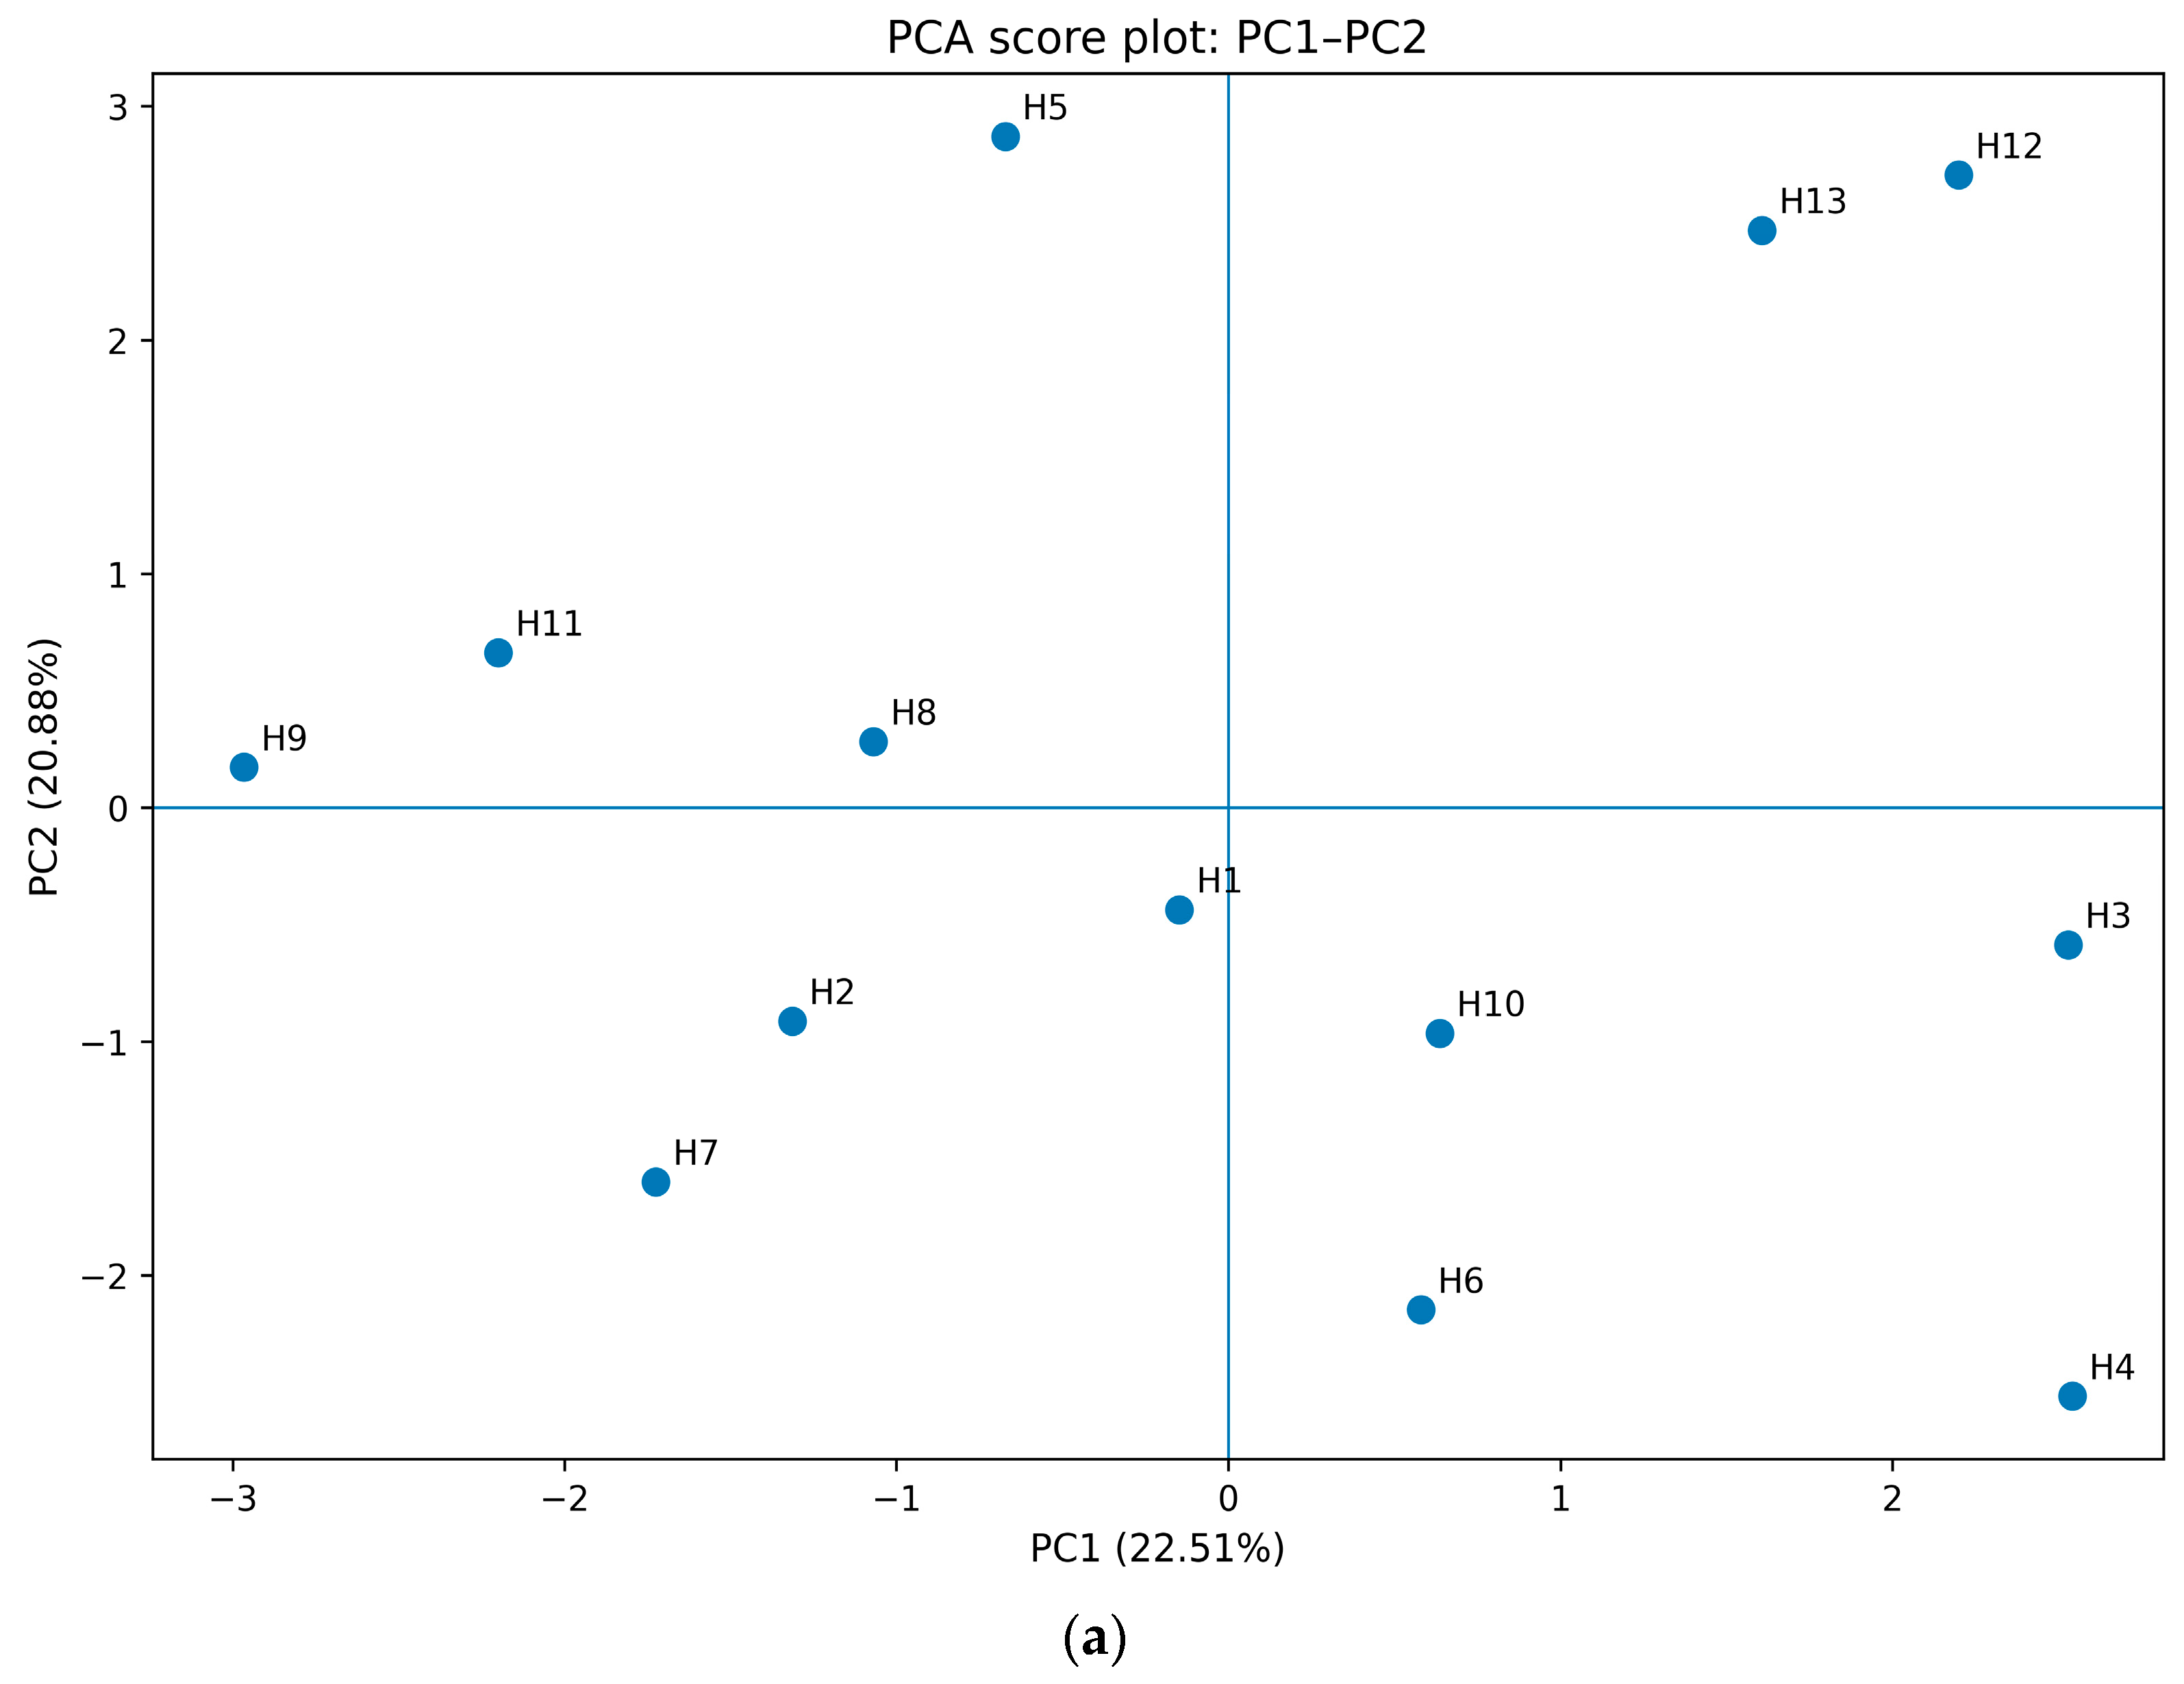
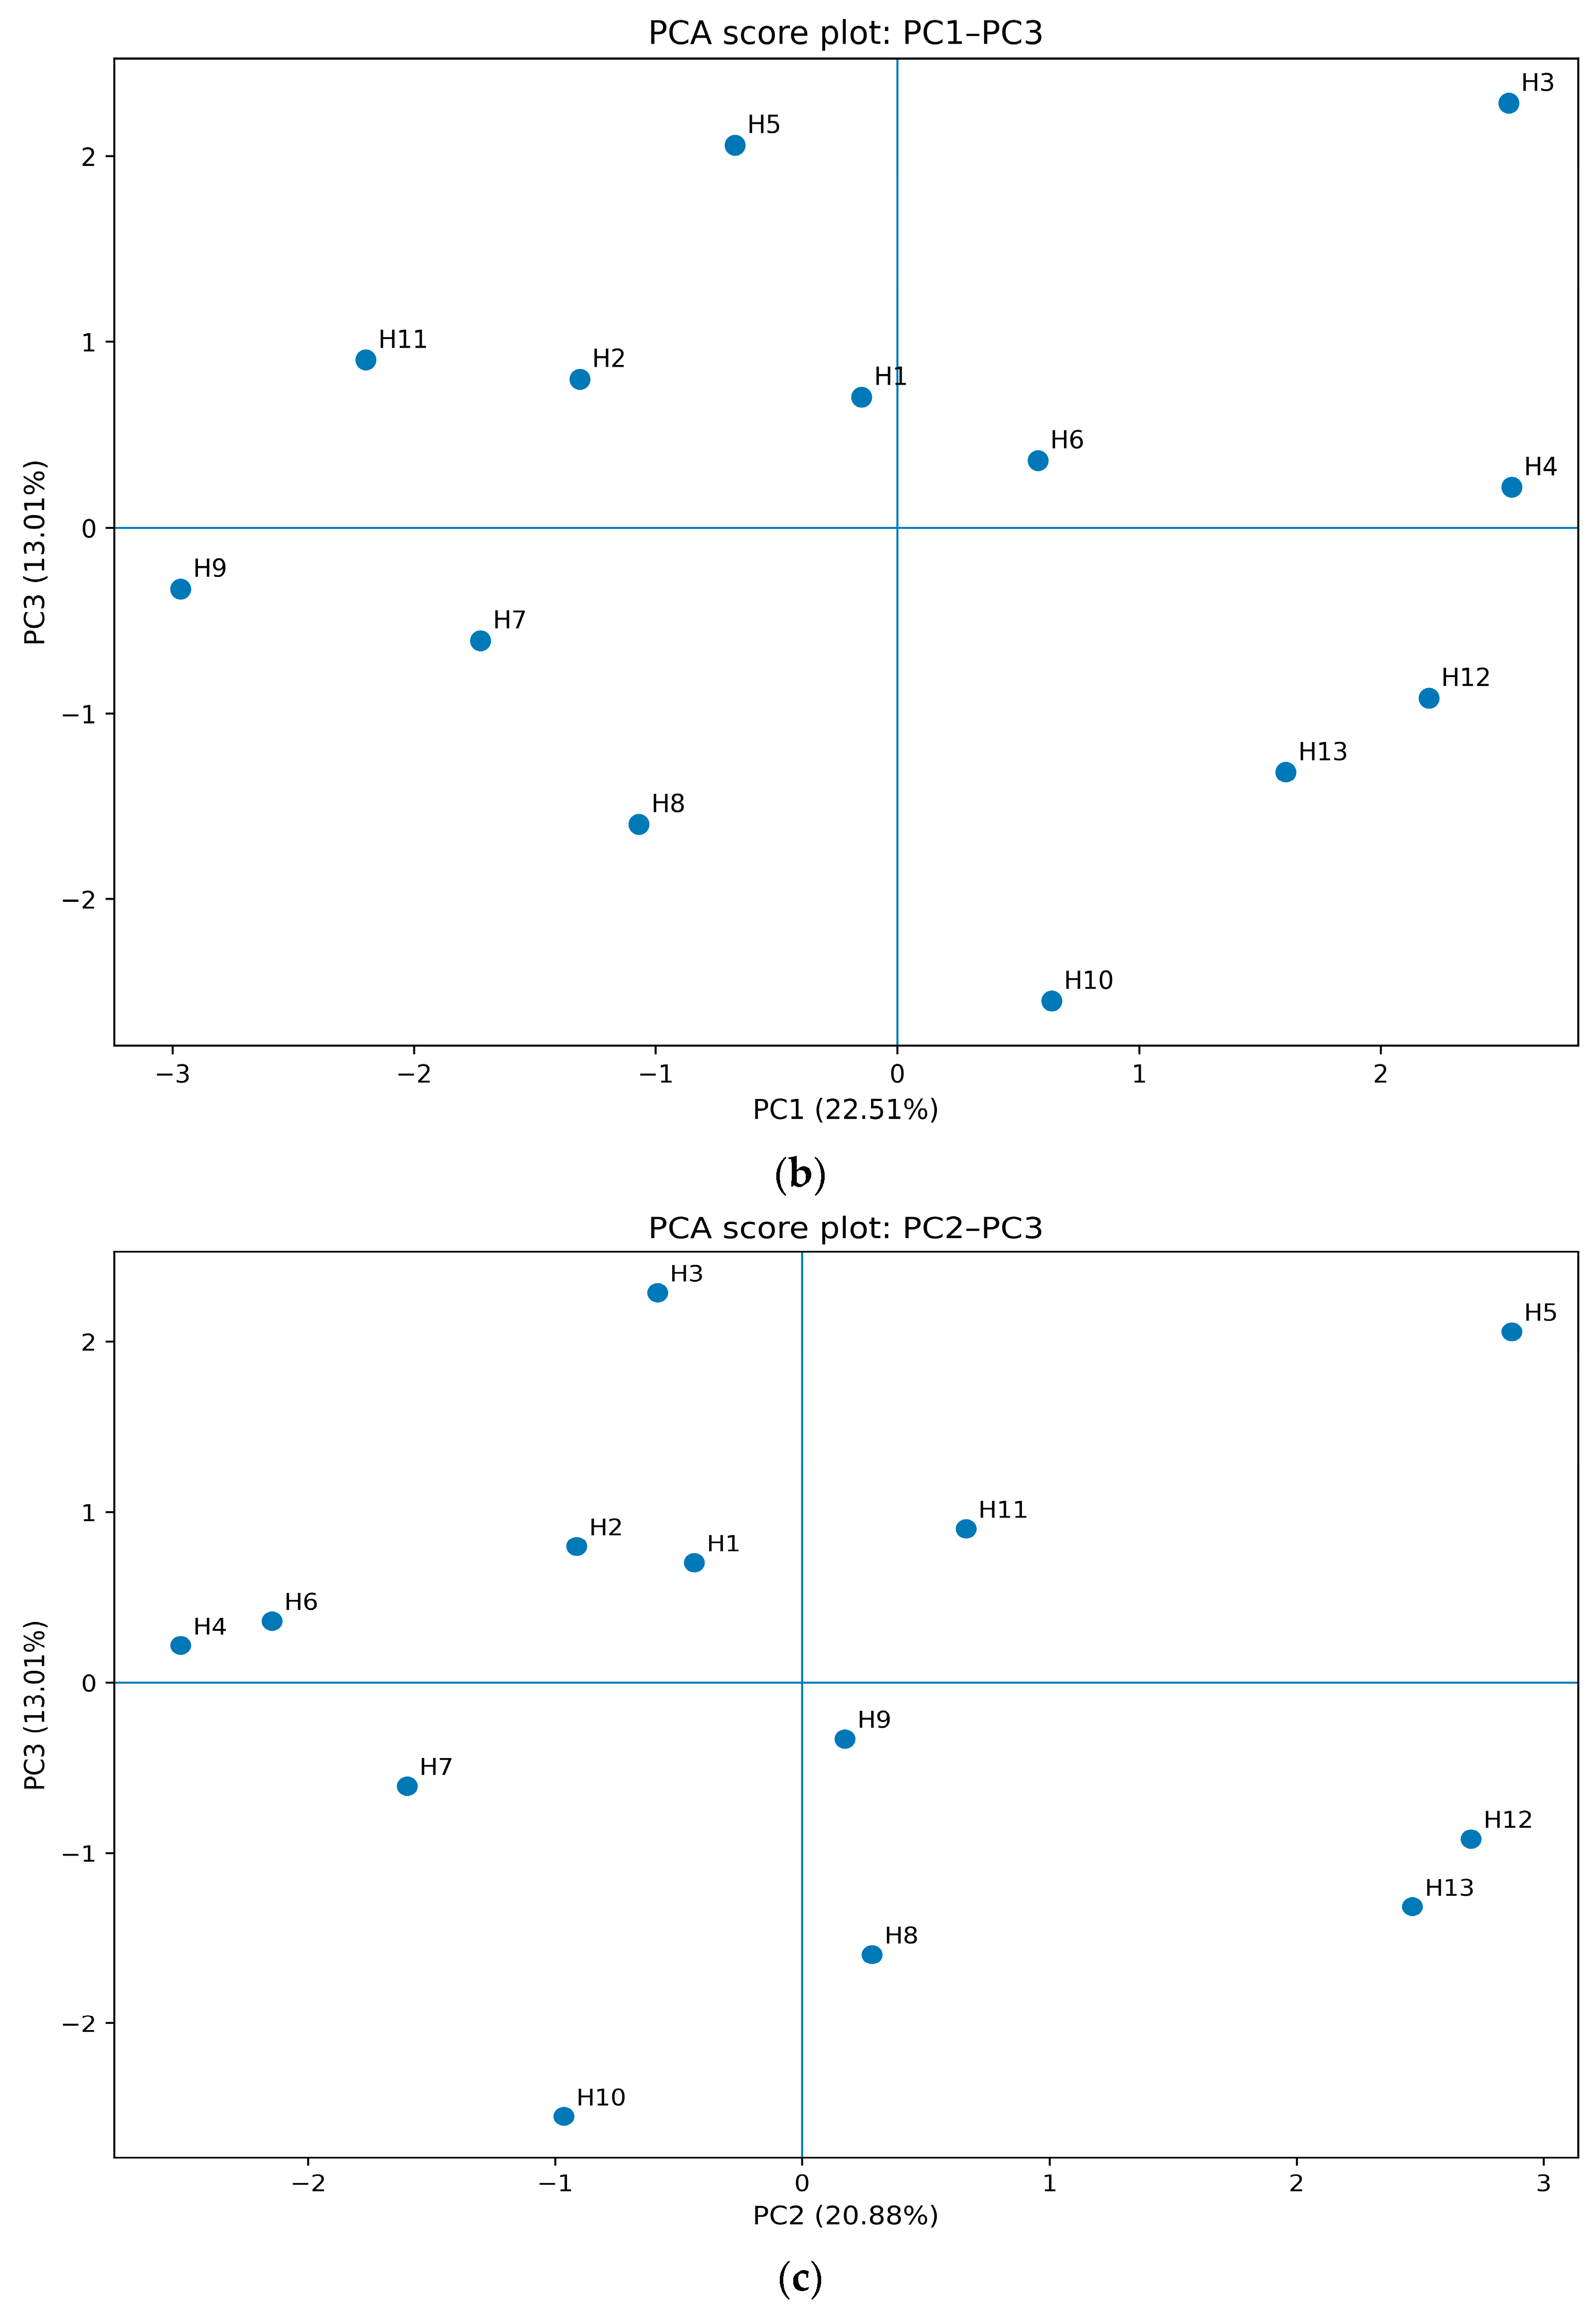
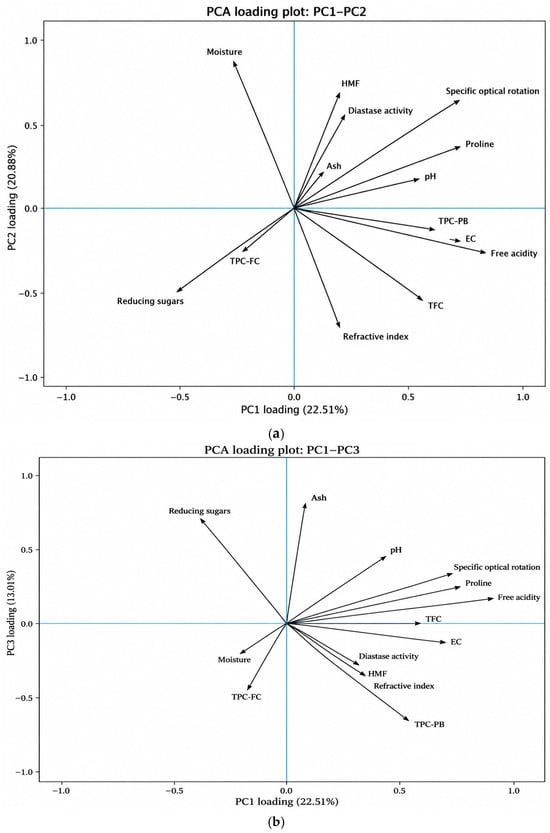
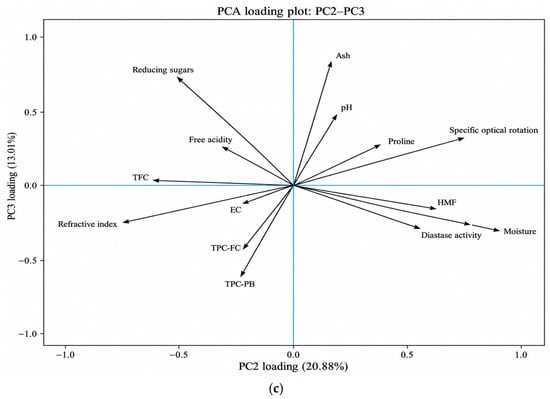
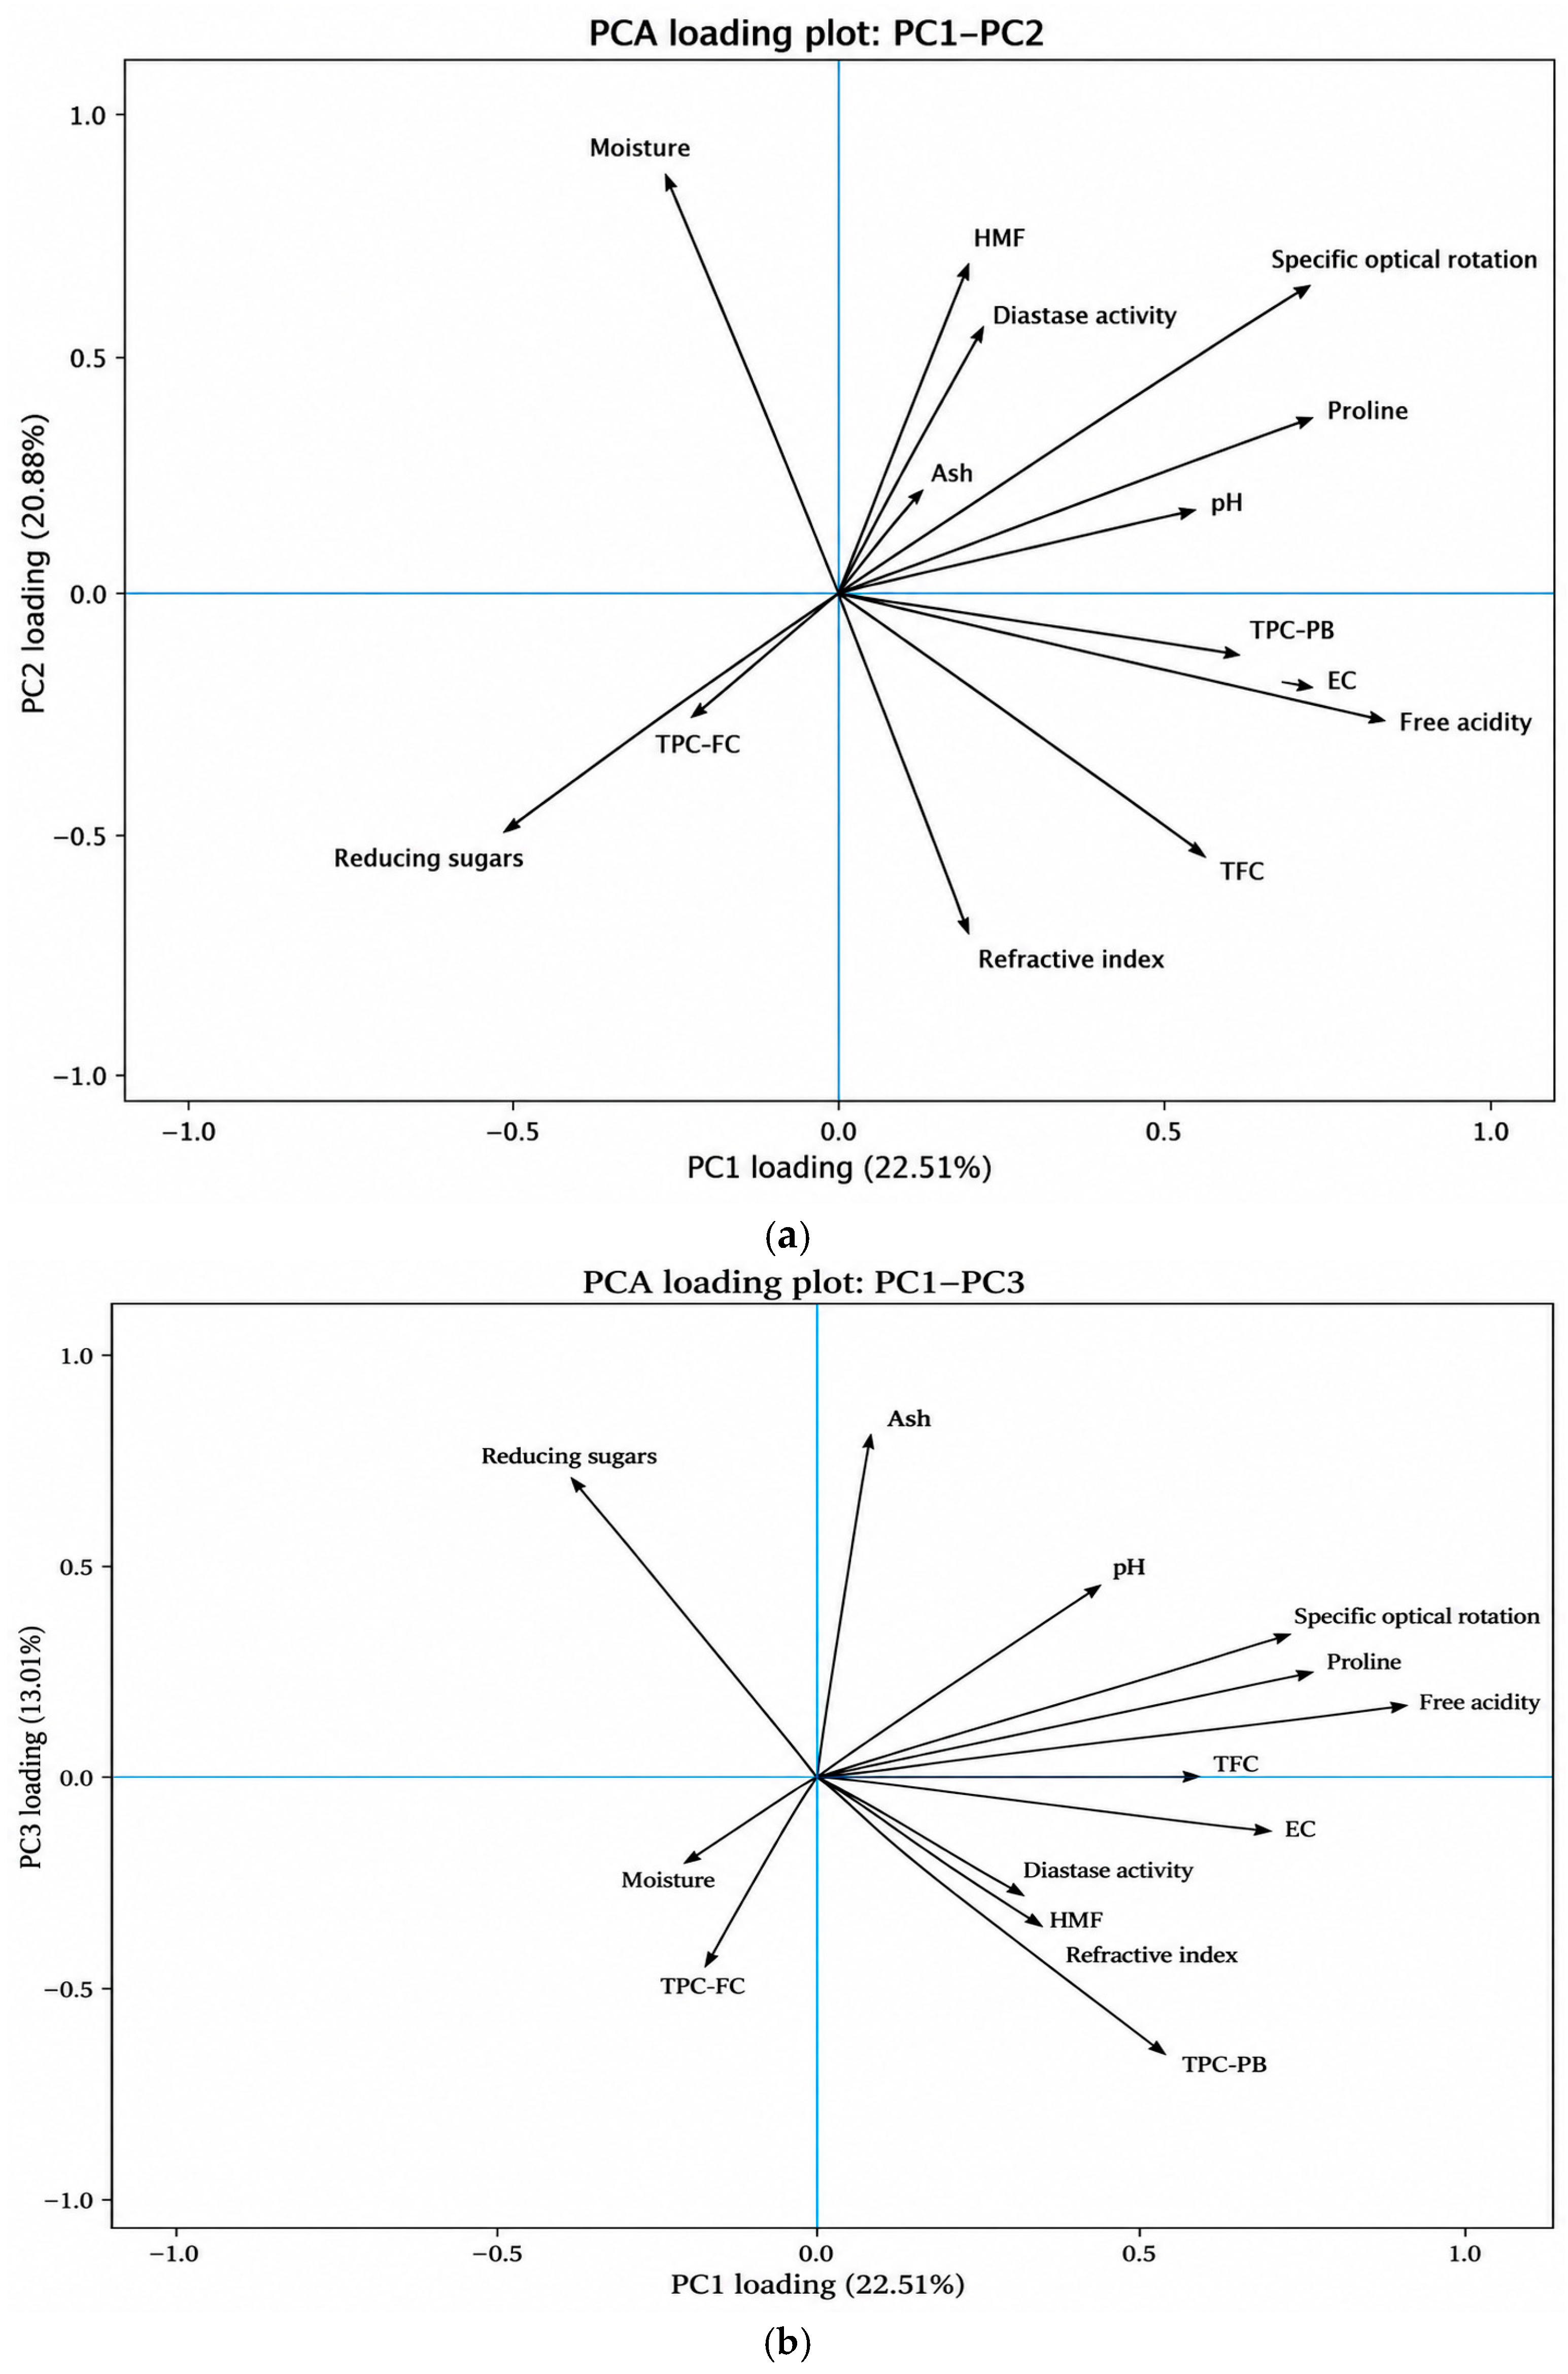
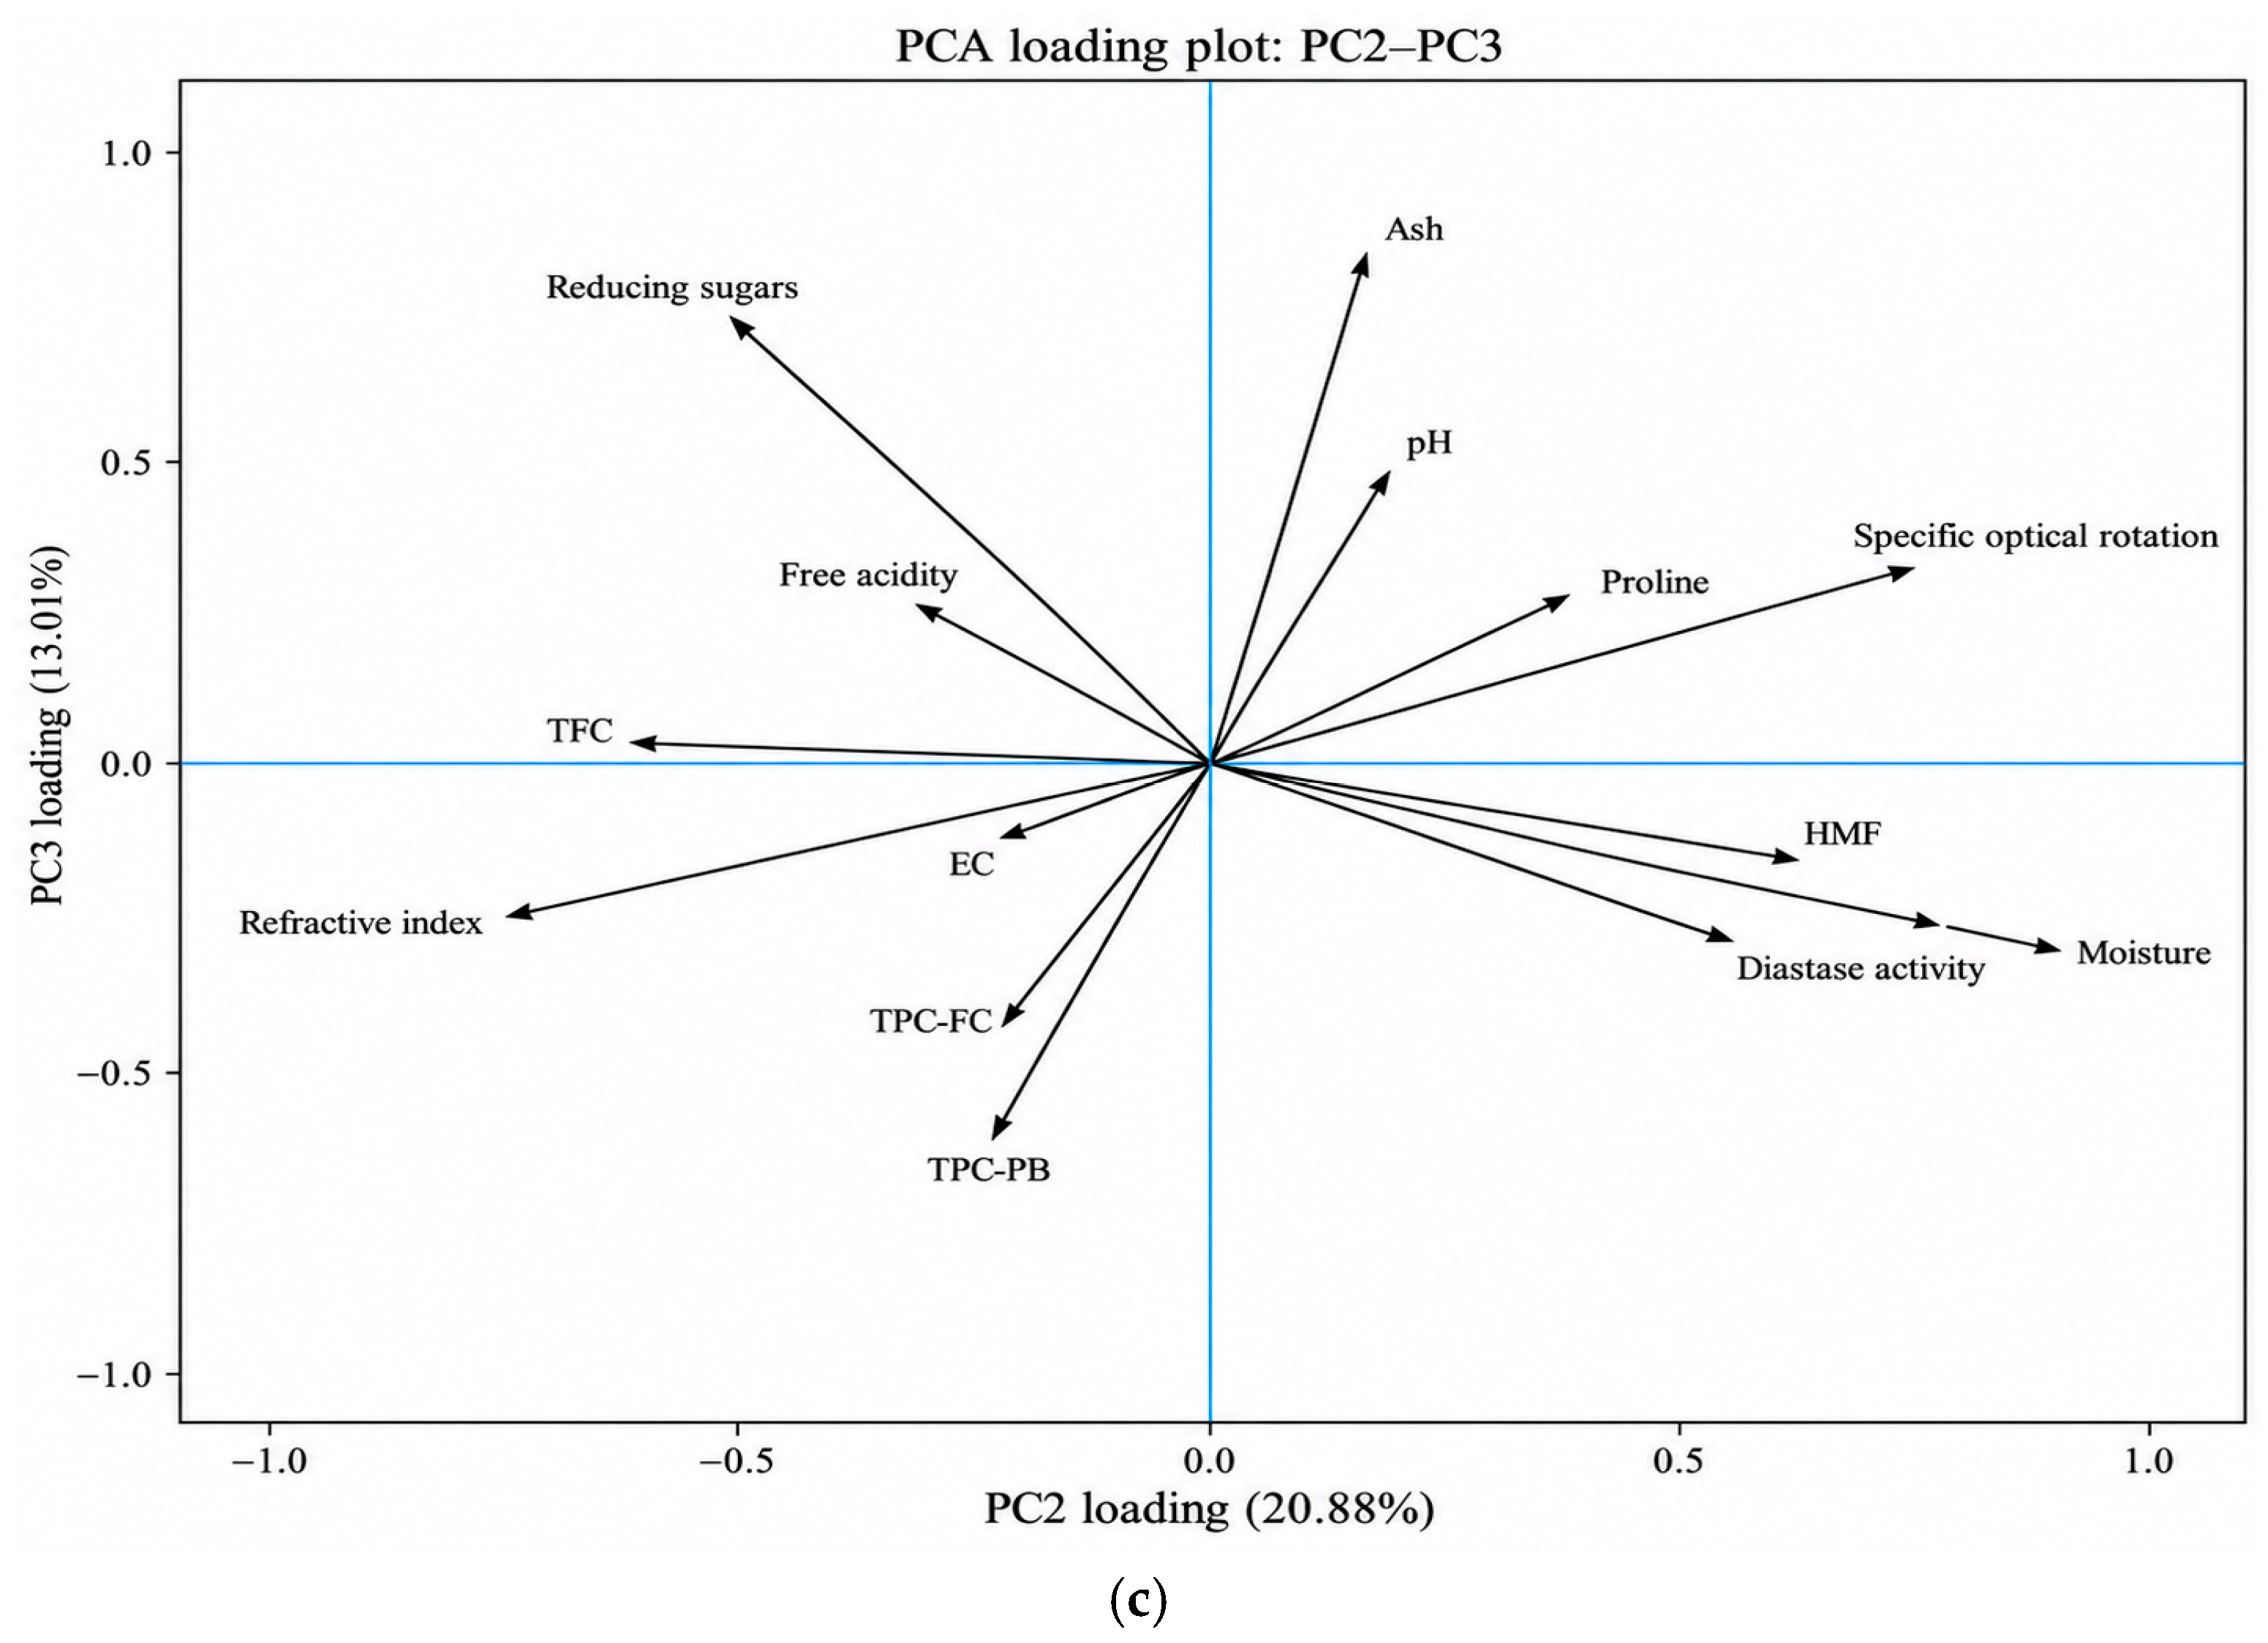

Disclaimer/Publisher’s Note: The statements, opinions and data contained in all publications are solely those of the individual author(s) and contributor(s) and not of MDPI and/or the editor(s). MDPI and/or the editor(s) disclaim responsibility for any injury to people or property resulting from any ideas, methods, instructions or products referred to in the content. |
© 2026 by the authors. Licensee MDPI, Basel, Switzerland. This article is an open access article distributed under the terms and conditions of the Creative Commons Attribution (CC BY) license.