


Abstract
The method of extraction of edible oils from nuts significantly affects both the yield and the quality of the oil. The main objective of this study was to evaluate the chemical and lipid composition of pecan nuts, as well as the extracted pecan oil (EPO) and mechanically pressed pecan oil (MPPO). The residual material obtained after mechanical pressing (expeller) was also examined for its oil content and fatty acid composition. The glyceride oil content of the extracted nuts with hexane is higher than that of the oil isolated by mechanical pressing (66.3 vs. 65.0%). Pecan nuts are a rich source of unsaturated fatty acids, with polyunsaturated (mainly linoleic acid) and monounsaturated (oleic acid) being predominant. The amount of linoleic acid is about 35% in EPO and MPPO, but almost three times lower in the residual pecan oil (RPO): 11.8%. The major fatty acid in all examined oils is oleic acid, which was higher in EPO and MPPO (51.4% and 53.1%) than in RPO (42.4%). The physicochemical properties of EPO and MPPO are also analyzed, and significant differences are observed in all parameters (peroxide, acid and iodine values, K232, K270 and relative density) excluding the refractive index. The identified bioactive compounds (sterols, tocopherols and phospholipids) are secondary substances of pecan oil, but are important for its oxidative stability, which is 15 h for EPO and 24 h for MPPO.
1. Introduction
Pecan is a representative of the Juglandaceae family. Its production has increased in the last 10 years, as North America is a global producer (up to 90% of the pecan nuts are produced there) [1]. According to the International Nut and Dried Fruit Council Foundation [2], the USA produced 51% and Mexico 41%. Pecan nuts can be consumed raw, roasted and salted or in baked and confectionery products [3]. Pecan kernels are one of the most preferred nuts because they have an especially distinctive flavor and nutritional properties [4,5]. They are an excellent source of energy due to the high content of lipids. According to Toro-Vazquez et al. [6], the content of glyceride oil is 65–75% and the energy value is 691 kcal/100 g of pecan nuts. The content of glyceride oil depends on the conditions of growth, maturity and variety as well as the past productivity of the pecan tree.
In turn, pecan kernels are distinguished by their human health benefits, which are due to the presence of micronutrients, dietary fibers, proteins, vitamins, and bioactive compounds (sterols, tocopherols, phospholipids) [7]. According to the United States Department of Agriculture National Nutrient Database [USDA], pecans, per 100 g, have 2.52 g water, 9.17 g protein, 71.97 g fat, and 13.86 g carbohydrates [8]. Except for their basic nutritional components, all pecans contain minor levels of phenolics. According to Wu et al. [9], pecan kernels are characterized by the highest total phenolic content and antioxidant activity among nuts, fruits, and vegetables rich in phenolics.
Lipids are the main components of pecan nuts. The oil is rich in poly- and monounsaturated acids, which reduce the blood levels of low-density lipoproteins (LDLs) compared to saturated fatty acids. The content of saturated fatty acids is lower than 9%, as is the content of high-oleic safflower (4–8%) and canola (<7.0%) oils [6]. Venkatachalam and Sathe [10] reported the quantities of saturated, monounsaturated, and polyunsaturated fatty acids in pecan glyceride oil to be 8.35%, 66.7%, and 24.9% of total fatty acids in the oil, respectively. On the other hand, the content of monounsaturated fatty acids in hazelnut oil (≈80–81%) and almond oil (60–80%) has also been reported [6]. The content of oleic and linoleic acids is 66.6% and 23.6%, respectively [10]. Toro-Vazquez et al. [6] reported that the oxidative stability of pecan oil depends on the levels of oleic, linoleic, and linolenic fatty acids. Most of the pecan oils worldwide have a considerably high concentration of oleic acid (60–75%) and good oxidative stability (induction time—8.5–10.8 h). The concentration of natural antioxidants α-, γ-, and δ-tocopherol is substantially high.
The aim of this study was to compare the characteristics of pecan oils obtained by different extraction techniques in order to assess their influence on lipid composition in terms of fatty acids, sterols, tocopherols and phospholipids, as well as their physicochemical characteristics. The scientific literature provides extensive information on the general chemical composition of pecan nuts, including macronutrients, phenolics and fatty acids, but offers only limited comparative data on how different extraction techniques affect the general lipid profile of pecan oil. Most studies consider individual lipid classes separately and do not simultaneously examine fatty acids, sterols, tocopherols and phospholipids within a single analytical framework. In contrast, the present study aims to provide a comprehensive comparison of oils obtained by mechanical pressing and solvent extraction, together with the residual expeller material. This integrated approach will reveal how the extraction method affects not only the quantitative yield of glyceride oil, but also the distribution of minor lipid constituents necessary for nutritional quality and oxidative stability.
2. Materials and Methods
2.1. Sampling and Plant Material
The analyses were carried out with pecan nuts purchased from the local market. The country of origin was the Netherlands. The nuts were raw, packaged in 70 g polypropylene bags, had an expiration date of May 2024, and were sold under the Albert Heijn brand. Fifteen batches were obtained and homogenized, and three representative subsamples were collected for analysis. The pecan oil was isolated by extraction with n-hexane and by pressing using a Yoda Classic press machine. The remaining nut cake after the pressing was subjected to extraction with n-hexane, and the oil content of residual pecan oil was determined to be 1.3%. The solvents and reagents had a high analytical grade. They were used without additional purification.
2.2. Isolation of Glyceride Oil, Determination of Oil Content and Chemical Composition of Pecan Nuts
Pecan glyceride oil was isolated using two techniques: extraction with hexane (boiling range 40–60 °C, CAS No. 110-54-3, Merck, Darmstadt, Germany) for 8 h using a Soxhlet apparatus [11] and mechanical extraction by pressing with an electric pressing machine. The liquid-to-solid ratio for the solvent extraction was 10:1 (v/v). The reflux temperature was 70 °C. A rotary vacuum evaporator was used for the evaporation of the solvent after finishing the extraction process. The residual quantity of hexane was removed with a stream of nitrogen gas. The oil content was calculated as the difference between the weight of the flask with glyceride oil and the empty flask. Protein content was analyzed with a UDK 152 Kjeldahl System (Velp Scientiffica, Via Strasione, Italy) [12]. The total content of fibers, ash and moisture of the pecan nuts was determined according to AOAC [13]. According to FAO [14], the content of carbohydrates is calculated as follows:
Carbohydrate content = 100 − (weight in grams [protein + lipids + water + ash] in 100 g of dry seeds).
The energy value of the seeds is calculated using the following formula [14]:
where EV—energy value; C—carbohydrates (%); L—lipids (%); P—proteins (%)
EV = C × 4 + L × 9 + P × 4 (kcal/100 g),
2.3. Physicochemical Characteristics of Glyceride Oil
The physicochemical properties of the pecan oils (peroxide value, acid value and iodine value) were determined based on Refs. [15,16,17]. The relative density of the oils was determined according to ISO 279:1998 [18]. It represents the dimensionless ratio between the mass of the substance and the mass of distilled water at the same temperature. The refractive index was analyzed by Abbe refractometer following previously published procedures [19]. The absorbance at 232 and 270 nm (A232 and A270) was determined using a Boeco S26 spectrophotometer (BOECO, Hamburg, Germany) [20]. The stability of oils was determined by Rancimat apparatus Methrom 679 (Methrom, Herisau, Switzerland). The principle of analysis was measurement of the induction period using conductometric detection of volatile compounds as the conditions of measurement at 100 °C and an air flow rate of 20 L/h [21].
2.4. Determination of Fatty Acid Composition
Gas chromatography (GC) is used for determination of the fatty acid composition of pecan oils [22]. Fatty acid methyl esters (FAMEs) were prepared by pre-esterification with sulfuric acid in methanol as a catalyst [23]. Determination was performed on an Agilent 8860 gas chromatograph (Santa Clara, CA, USA) equipped with a DB Fast FAME capillary column (Agilent, Santa Clara, CA, USA; 30 m × 0.25 mm × 0.25 µm (film thickness)) and a flame ionization detector (FID). The column temperature gradient was as follows: the starting temperature was 70 °C, which was held for 1 min. Then it was raised to 180 °C at a rate of 6 °C/min. After that, it was raised to 250 °C at a rate of 5 °C/min. The injector and detector temperatures were 270 °C and 300 °C, respectively. The carrier gas was nitrogen. Identification was carried out by comparison of the retention times of a standard mixture of FAME (FAME mix consisted of 37 components, Supelco, Bellefonte, PA, USA). The percentage of each identified FAMEs was calculated using the area normalization method according to ISO 12966-1 [22], as follows:
where Ai is the peak area of the individual fatty acid methyl ester, ∑A is the sum of the peak areas of all identified fatty acid methyl esters, and wi is the mass percentage of FAMEs.
wi (%) = Ai/∑A × 100,
2.5. Analysis of Sterols
Sterols were analyzed following saponification of the glyceride oil and extraction of the unsaponifiable fraction with n-hexane [24]. Total sterols were quantified spectrophotometrically at 597 nm after thin-layer chromatography (TLC) separation [25]. Individual sterols were analyzed by GC-FID using an Agilent 8860 system (Santa Clara, CA, USA) fitted with a DB-5 column (25 m × 0.25 mm × 0.25 µm). The oven was programmed from 90 °C (3 min) to 290 °C at 15 °C/min and subsequently to 310 °C at 4 °C/min (10 min). The injector and detector were maintained at 300 and 320 °C, respectively, with nitrogen as the carrier gas. Sterols were identified by comparison with authentic standards of β-sitosterol, campesterol, cholesterol (Acros Organics, Morris Plains, NJ, USA), and stigmasterol (Sigma-Aldrich, St. Louis, MO, USA). Δ5-Avenasterol was assigned using its relative retention time (RRT) [26].
2.6. Analysis of Tocopherols
Tocopherols were quantified by high-performance liquid chromatography using a Merck–Hitachi system (Merck, Darmstadt, Germany) equipped with a Nucleosil Si 50-5 column (250 × 4 mm) and fluorescence detector F 1000 [27]. The analysis was performed with n-hexane/dioxane (96:4, v/v) as the mobile phase at a flow rate of 1 mL/min; fluorescence was monitored at 290 nm excitation and 330 nm emission. An aliquot (20 μL) of a 2% oil solution in n-hexane was injected. Tocopherols were identified by retention-time comparison with α-, β-, γ-, and δ-tocopherol standards (Merck KGaA, Darmstadt, Germany), and quantified from the corresponding peak areas relative to those of the standard solution.
2.7. Analysis of Phospholipids
The phospholipid fraction was obtained by Folch extraction using chloroform/methanol (2:1, v/v) [28]. Phospholipid classes were separated by two-dimensional TLC on 20 × 20 cm silica gel 60 G plates (0.2 mm) impregnated with 1% aqueous (NH4)2SO4. The solvent systems were chloroform/methanol/ammonia (65:25:5, v/v/v) and chloroform/acetone/methanol/acetic acid/water (50:20:10:10:5, v/v/v) [29]. Identification was based on Rf values obtained under identical conditions using authentic phospholipid standards. Quantification was performed from a standard calibration curve based on phosphorus determination at 700 nm [30].
2.8. Statistical Analysis
Measurements were performed in three independent replicates (n = 3) and expressed as mean ± SD. Differences among groups were tested by one-way ANOVA followed by Tukey’s multiple-comparisons test, with statistical significance set at p < 0.05. Statistical analyses were performed using IBM SPSS Statistics, version 19.
3. Results and Discussion
3.1. Chemical Composition of the Studied Pecan Nuts
The chemical composition of pecan nuts was established. The main analyzed components were proteins, carbohydrates, crude fibers, ash and moisture. The energy value was calculated. All results are presented in Table 1.
Table 1.
Chemical composition of pecan nuts
All examined components in pecan nuts had good health benefits. The content of protein was 13.3%, which is higher than that reported by the USDA [8] (9.17%) and by Toro-Vazquez et al. [6], wherein the protein content from three regions in Mexico was found to be 8.2–8.7%. The amount of protein contributes to the high nutritional value of pecan nuts. The investigated pecan nuts were characterized by a higher content of carbohydrates than that reported by the USDA [8] (15.8% vs. 13.9%). The total amount of dietary fibers was close to that reported by the USDA [8] (12.5% vs. 9.6%), while the ash content was the same (1.5%). The quantity of moisture in the analyzed pecan nuts was similar to that reported by the USDA [8] and Toro-Vazquez et al. (2.5–4.0%) [6]. The analyzed pecan nuts had an energy value of 713 kcal/100 g, which is in agreement with the study by Kiralan et al. [31], who reported about 691 kcal/100 g of pecan nuts.
3.2. Physicochemical Properties of Extracted Pecan Oil and Mechanically Pressed Pecan Oil
In recent years, interest in the consumption of healthy foods has grown, mainly vegetable oils rich in unsaturated fatty acids. Modern trends are focused on producing oils from nuts using methods that aim to preserve the health benefits of the oils. There are several methods for obtaining pecan oil—traditional extraction with solvent and mechanical extraction (pressing). Extraction with n-hexane is the most popular method for a high yield of oil and, in turn, the process of pressing is the best extraction method for human health [32]. The physicochemical properties of pecan oils isolated by extraction and pressing are given in Table 2.
Table 2.
Physicochemical properties of extracted pecan oil (EPO) and mechanically pressed pecan oil (MPPO).*
The pecan nuts had a high oil content, the yield of which differed depending on the extraction method. The content of glyceride oil differed: for EPO it was 66.3%, and for MPPO it was 65.0%. This indicates that the method of oil isolation affects to some extent the yield of glyceride oil. The results are similar to the literature data, which show a similar oil content—close to 70% [6,33]. The results for the physicochemical properties of the pecan oils are as follows: the peroxide value for EPO was considerably higher than for MPPO. The peroxide value for EPO in Juhaimi et al. [34] was similar to our results, at 17.33 meqO2/kg. The acid and iodine values were almost the same for both analyzed oils. The acid value of EPO (0.8 mg KOH/g) was two times higher than that reported by Juhaimi et al. [34], which was 0.44 mg KOH/g. The iodine value shows the degree of unsaturation of the fatty acids in the oils. The value was about 113–115 g I2/100 g, which is relatively high. It makes a very good semi-dry pecan oil. The data for other oils (sesame oil, 104–120 g I2/100 g and rapeseed oil, 94–120 g I2/100 g) based on Codex-Stan 210 [35] are close to those of EPO (112.8 g I2/100 g) and MPPO (114.9 g I2/100 g) in this study, while the iodine value of walnut oil is higher, at 132–162 g I2/100 g [36]. The iodine value depends on the highest content of unsaturated fatty acids in the oils. The results for the relative density and the refractive indexes of EPO and MPPO meet the requirements for vegetable oils, and they were similar to each other. The relative densities of soybean oil (0.919–0.925), sunflower oil (0.918–0.923) and rapeseed oil (0.910–0.920) based on Codex-Stan 210 [35] are similar to those of EPO and MPPO in this study. The refractive index of these vegetable oils (1.460–1.470) is also similar to our results (1.4731 for both EPO and MPPO).
An indicator of the secondary products of oxidation of unsaturated lipids is K232 and K270, which is the absorption in iso-octane at 232 and 270 nm [37]. The results for EPO at A232 (0.772) correspond to slightly oxidized oil (0.70–0.85), while the value for MPPO (0.360) corresponds to fresh oil (up to 0.60) [37]. The results show that the method of extraction affects the degree of oxidation of the oils. In this regard, significant differences can be found in the oxidative stability of the analyzed oils, such as MPPO being about 1.6 times more stable than EPO. Some literature data show a correlation between lipid composition and the stability of vegetable oils. Toro-Vazquez et al. [6] reported the induction time for the oxidation (h) of pecan oil from three states in central Mexico, determined by an instrument from Omnion Inc., Rockland, MA, USA at 110 °C, which was found to be 6.13–7.21 h.
3.3. Lipid Composition
The oil from pecan nuts is a good source of biologically active substances—unsaponifiable matter, sterols, phospholipids and tocopherols (vitamin E). The results are shown in Table 3.
Table 3.
Content of biologically active components of EPO and MPPO.*
Unsaponifiable matter was found to be 4.2% (EPO) and 2.4% (MPPO). Our results are higher than the results of other authors. According to Kornsteiner et al. [38], the content of unsaponifiable matter of extracted pecan oil ranged between 0.30 and 0.45%. Generally, the information regarding the amount of unsaponifiable matter in pecan oils is limited, although these components are important for explaining the biological mechanisms in reducing cardiovascular diseases [38].
3.3.1. Total and Individual Composition of Sterols, Phospholipids and Tocopherols
The total sterol content was established, and it was equal for both oils (0.2%), which means it was not influenced by the extraction method. The results are similar to those reported by do Prado et al. [39], where the total sterol content of pecan oils from Brazil was found to be 0.19% and 0.22%. The individual sterol composition was investigated in addition to the total sterol content. The main components in EPO were found to be β-sitosterol (99.6%), followed by a minor amount of ∆5-avenasterol (0.4%), as well as 98.5% β-sitosterol and 1.5% ∆5-avenasterol for MPPO (Figure S1). The results correlate with the literature regarding the qualitative sterol composition but differ regarding the quantitative composition. According to Bouali et al. [40], the amount of ∆5-avenasterol for extracted pecan oil was over 10% and the content of β-sitosterol could be identified in large limits (32.6–2134 mg/100 g oil). The rest of the individual sterols (campesterol and stigmasterol) were not detected in either analyzed pecan oil, while Bouali et al. [40] reported minor amounts of these components.
Phospholipid content was determined, and the amount was found to be equal—0.5% for EPO and MPPO. It was established that the total phospholipid content was lower than reported earlier for pecan oil (1.19%) by Song et al. [41]. The amount of phospholipids in pecan oil was lower than that in other vegetable oils (1.0–1.5%) [35,42].
The total amount of tocopherols in the analyzed EPO and MPPO was investigated, and it was found to be 190 mg/kg for EPO and 326 mg/kg for MPPO. γ-Tocopherol was the only identified tocopherol. According to Prado et al. [39], the tocopherol content of cold-pressed pecan oil was 249–392 mg/kg. γ-Tocopherol predominated (the level varied between 236.4 and 284 mg/kg), followed by α-tocopherol and minor amounts of β-tocopherol and δ-tocopherol [39]. Other authors, such as Castelo-Branco et al., Fernandes et al., and Gong et al. [43,44,45], reported the content of γ-tocopherol for MPPO to be 197.1–381.0 mg/kg oil, while Soxhlet oil extraction showed lower results (236 mg/kg oil) [34].
Previous researchers reported that tocopherols have significant biological importance [46]. The levels of vitamin E are also important to nutrition, and lower amounts lead to a higher risk of atherosclerosis or other degenerative diseases [47].
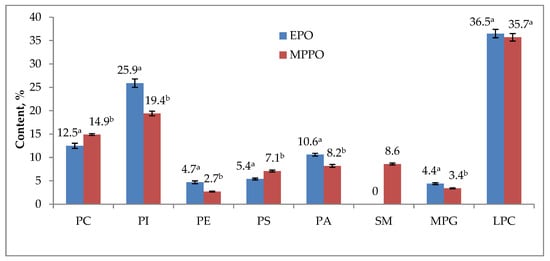
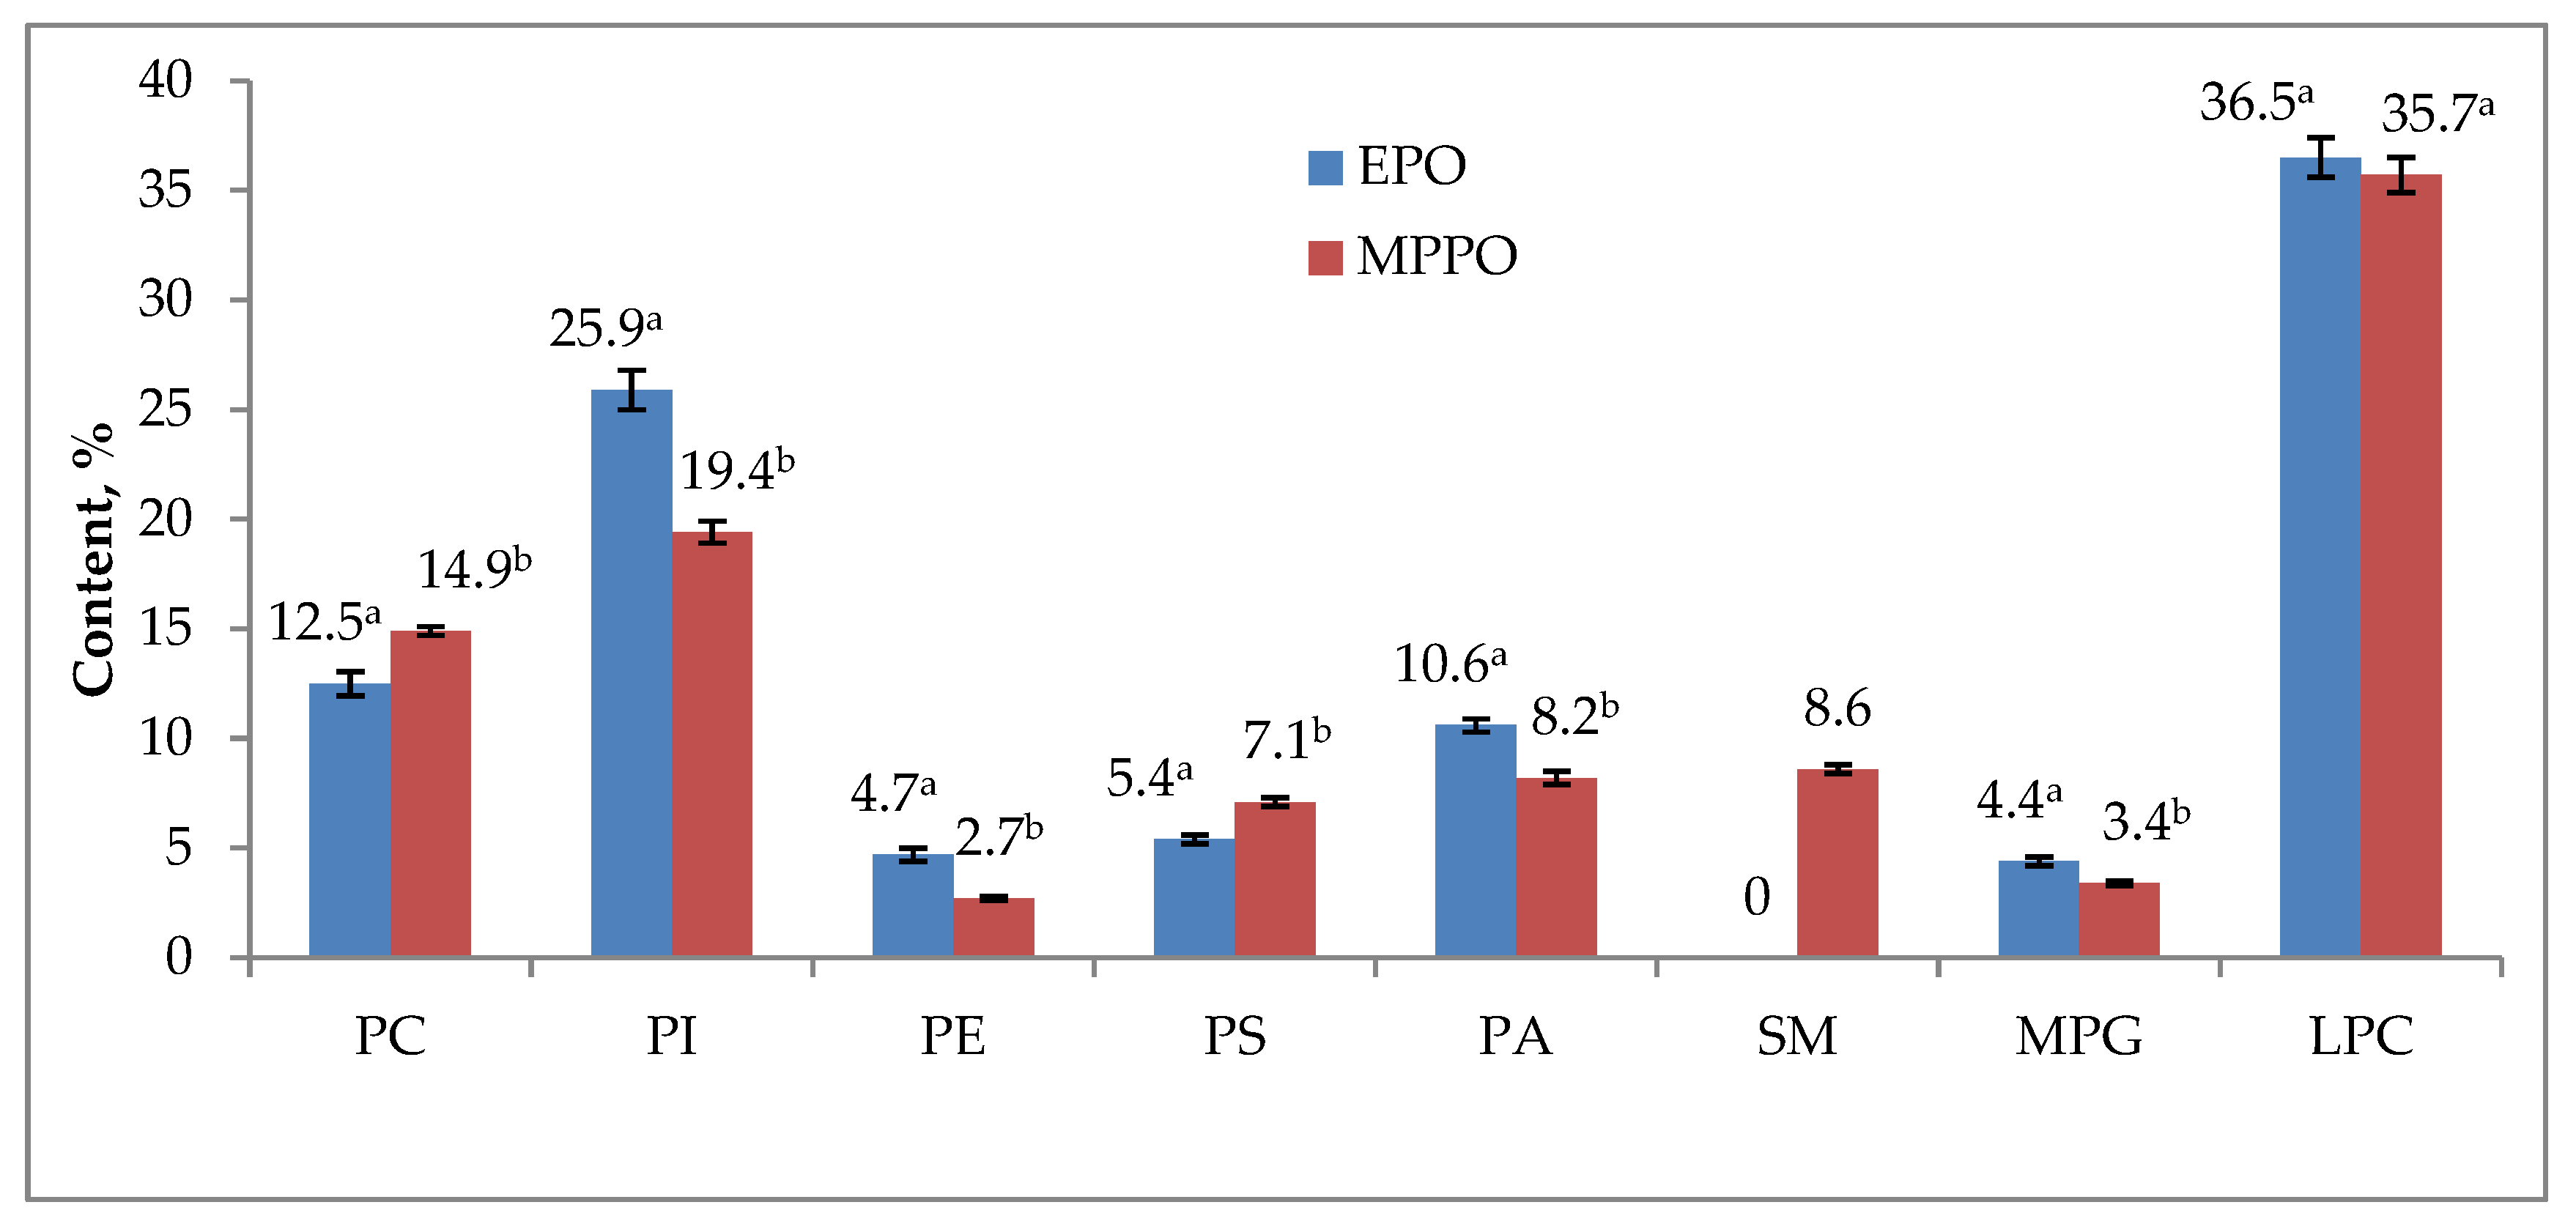
The phospholipid composition of EPO and MPPO was determined, and it is presented in Figure 1.
Figure 1.
Composition of individual phospholipids in EPO and MPPO. Legend: PI—phosphatidylinositol; PC—phosphatidylcholine; PE—phosphatidylethanolamine; PS—phosphatidylserine; PA—phosphatidic acid; SM—sphingomyelin; MPG—monophosphatidylglycerol; LPC—lysophosphatidylcholine. All analyses were conducted in triplicate (n = 3), and the results are presented as mean ± standard deviation (SD). Different letters for the same component depict significant differences among the results.
The individual phospholipid composition of EPO and MPPO consisted of eight components (phosphatidylcholine (PC), phosphatidylinositol (PI), phosphatidylethanolamine (PE), phosphatidylserine (PS), phosphatidic acid (PA), sphingomyelin (SM), monophosphatidylglycerol (MPG) and lysophosphatidylcholine (LPC)), which is in agreement with Alvarez-Parrilla et al. [33]. These phospholipid classes are abundant in many vegetable oils. Phospholipids are biologically important constituents of cellular membranes and possess amphiphilic structures that enable them to interact simultaneously with aqueous and lipid phases. Consequently, phospholipids such as PC, PI, PE, PS, PA, and LPC may contribute to the emulsifying properties of oils by adsorbing at oil–water interfaces and reducing interfacial tension. Their effects on oxidative and storage stability are complex and depend on phospholipid class, concentration, fatty acid composition, interfacial localization, and interactions with other minor oil constituents. Phospholipids may enhance oxidative stability through synergistic interactions with tocopherols and other antioxidants; however, some phospholipids may also promote oxidation under specific conditions, particularly through their interactions with pro-oxidative metal ions [48]. The main components of the phospholipid fraction of the analyzed EPO and MPPO were LPC, PI, PC and PA. The rest of them (PE, PS and MPG) were observed in quantities lower than 10%. The content of PE significantly differed from that reported earlier by Song et al. [41] (17.1% vs. 2.7–4.7% (MPPO/EPO)). SM was isolated only from MPPO in a total content of 8.6%. The predominant phospholipid was LPC, and the quantities for both oils (EPO and MPPO) were very close (36.5–35.7%). A significant difference in the amount of PI was determined: EPO vs. MPPO = 25.9 vs. 19.4%. The data reported by Song et al. [41] were similar (24.5%). The quantities of the rest of the analyzed phospholipids differed from each other by about 2%—the content of PC and PS was higher in MPPO, while the content of PI, PA and MPG was higher in EPO.
3.3.2. Fatty Acid Composition
The lipid profile of EPO, MPPO and RPO was investigated. The fatty acid composition is given in Table 4 and Figure S2.
Table 4.
Fatty acid composition of EPO, MPPO and RPO.*
The oil isolated from pecan nuts was rich in unsaturated fatty acids. Depending on the extraction method, it was observed that the fatty acid composition of EPO and MPPO was similar and MUFAs predominated, followed by PUFAs. The main ones identified were found to be oleic (51.4–53.1%) and linoleic (34.8–35.1%) fatty acids. It is good to know that the content of fatty acids depends on the genotype, maturity, and harvest year. According to Rudolph et al. [49], the content of linoleic acid decreased during maturation, while the content of oleic acid increased with ripening.
The results for the amount of oleic and linoleic acid (86%—EPO and 88%—MPPO) are close to those reported by other authors [34,39,50]. The content of oleic acid was 68.53% in EPO and 69.43% in MPPO in Juhaimi et al. [34], compared with 51.4% and 53.1%, respectively, in the present study, while the content of linoleic acid was 18.46% in EPO and 19.32% in MPPO in Juhaimi et al. [34], compared with 34.8% and 35.1%, respectively, in the present study. The fraction of SFA is composed of palmitic acid and stearic acid. According to some authors, the amount of palmitic acid and stearic acid was found to be 4.7–5.59% and 1.49–2.5%, respectively [34,39,50]. The amount of palmitic acid for EPO and MPPO was almost the same (6.7 and 6.6%, respectively), but a little bit higher than that reported earlier by Juhaimi et al. [34], wherein the quantity of palmitic acid of the extracted pecan oil was 4.83% vs. 5.36% for the cold-pressed one. The content of stearic acid in the oils examined in the current study was as follows: 2.6% (EPO) and 2.4% (MPPO), which is a little bit more than that reported by Juhaimi et al. [34] (0.96% by Soxhlet and 1.49% by cold pressing).
The residue of pecan nuts obtained after mechanical pressing, called pecan nut cake (expeller), was examined, and the oil content was found to be 1.3%. The fatty acid composition of the residual oil was also determined, and it was characterized by a different amount of some of the main fatty acids. The content of palmitic acid (23.5%) was about four times higher than that in EPO (6.6%) and MPPO (6.7%). The amount of oleic acid (42.4%) was the highest among all identified fatty acids, but lower than that in EPO (51.4%) and MPPO (53.1%).
There are significant differences between the quantities of fatty acids of the analyzed residual pecan oil and the earlier reported data. Comparing the results of Salvador et al. [51] to those of the current study, the content of oleic acid in RPO was 70.7% vs. 42.4%, that of linoleic acid was 20.1% vs. 11.8%, that of palmitic acid was 6.30% vs. 23.5% and that of stearic acid was 2.31% vs. 14.1% (RPO in the present study), respectively.
EPO, MPPO and RPO were rich in unsaturated fatty acids, and the main ones were MUFAs. The content of PUFAs was similar for EPO and MPPO (36.1% and 36.4%, respectively), while the content of PUFAs in RPO was about three times lower (13.4%). This was accompanied by a higher content of SFAs (40.6% in RPO vs. 11.6% in EPO and 9.7% in MPPO).
4. Conclusions
This study demonstrates that the extraction method exerts a decisive influence on the chemical and lipid composition of pecan oil, including its fatty acid profile, bioactive constituents, and individual phospholipid distribution. Both mechanically pressed and solvent-extracted oils exhibit favorable nutritional characteristics, largely due to their high levels of oleic and linoleic acids, γ-tocopherol, and β-sitosterol. The compositional differences observed between EPO and MPPO indicate that the choice of extraction technique should be aligned with the intended application and the desired quality attributes of the final product. Mechanical pressing is suitable for producing minimally processed pecan oil, whereas solvent extraction may be preferred when higher extraction efficiency or a distinct recovery pattern of minor lipid components is required. The high tocopherol content and favorable lipid profile highlight the potential of pecan oil for various food applications, provided that appropriate storage conditions—protection from light, oxygen, and elevated temperatures—are ensured to maintain its nutritional value and oxidative stability. By evaluating multiple lipid classes alongside physicochemical properties relevant to food quality and industrial processing—and by including the less frequently analyzed expeller residue—this work provides new insights into how processing conditions shape the lipid profile of pecan oil and enhances current understanding of its nutritional and technological potential. Future research should explore additional extraction technologies for pecan kernels, as well as accelerated and long-term storage studies, to further clarify the relationships between extraction conditions, oil composition, oxidative stability, and industrial applicability.
Supplementary Materials
The following supporting information can be downloaded at: https://www.mdpi.com/article/10.3390/appliedchem6030059/s1, Figure S1: Chromatograms of the sterol composition of extracted and mechanically pressed pecan oil and Figure S2: Chromatograms of the fatty acid composition of extracted, mechanically pressed, and residual pecan oil.
Author Contributions
Conceptualization, O.T.; methodology, O.T. and Z.P.; validation, O.T. and Z.P.; formal analysis, O.T. and Z.P.; investigation, O.T. and Z.P.; resources, O.T.; data curation, Z.P.; writing—original draft preparation, O.T.; writing—review and editing Z.P. and O.T.; visualization, O.T.; supervision, Z.P.; project administration, O.T.; funding acquisition, O.T. All authors have read and agreed to the published version of the manuscript.
Funding
This research was funded by the Fund for Scientific Research of University of Plovdiv ‘Paisii Hilendarski’, grant number № MУПД25-XΦ-009.
Institutional Review Board Statement
Not applicable.
Informed Consent Statement
Not applicable.
Data Availability Statement
The original contributions presented in this study are included in the article and Supplementary Materials. Further inquiries can be directed to the corresponding author.
Conflicts of Interest
The authors declare no conflicts of interest.
References
- Burin, M.A.; Ferronato, C.; Amorim, M.P.; Pereira, L.M.; Bilibio, D.; Bender, J.P.; Echevarria, D.P.; Garcia, H.O.; Nunez, J.G.; Bruno, A.N.; et al. Extraction of Pecan Nut (Carya illinoinensis) Oil Using Different Techniques and Its Antitumor Potential in Human Cancer Cells. J. Supercrit. Fluids 2022, 179, 105409. [Google Scholar] [CrossRef] [Scilit]
- International Nut and Dried Fruit Council Foundation. Statistical Yearbook 2017–2018. 2018. Available online: https://inc.nutfruit.org/resources-categories/statistical-yearbooks/ (accessed on 1 April 2026).
- Shakerardekani, A.; Karim, R.; Ghazali, H.; Chin, N. Textural, Rheological and Sensory Properties and Oxidative Stability of Nut Spreads—A Review. Int. J. Mol. Sci. 2013, 14, 4223–4241. [Google Scholar] [CrossRef] [Scilit]
- Hal, G.D. Pecan Food Potential in Prehistoric North America. Econ. Bot. 2000, 54, 103–112. [Google Scholar] [CrossRef] [Scilit]
- Ojeda-Barrios, D.L.; Hernández-Rodríguez, O.A.; López-Ochoa, G.R.; Martínez-Téllez, J.J. Evolución de los Sistemas de Producción de Nuez en México. Tecnociencia Chihuah. 2009, 3, 115–120. [Google Scholar]
- Toro-Vazquez, J.F.; Charó-Alonso, M.A.; Pérez-Briceño, F. Fatty Acid Composition and Its Relationship with Physicochemical Properties of Pecan (Carya illinoensis) Oil. J. Am. Oil Chem. Soc. 1999, 76, 957–965. [Google Scholar] [CrossRef] [Scilit]
- Amarowicz, R.; Gong, Y.; Pegg, R.B. Recent Advances in Our Knowledge of the Biological Properties of Nuts. In Wild Plants, Mushrooms and Nuts: Functional Food Properties and Applications; John Wiley & Sons: Hoboken, NJ, USA, 2016; pp. 377–409. [Google Scholar]
- USDA Agricultural Research Service. USDA Food Composition Database. 2018. Available online: https://fdc.nal.usda.gov/download-datasets (accessed on 18 December 2025).
- Wu, X.; Beecher, G.R.; Holden, J.M.; Haytowitz, D.B.; Gebhardt, S.E.; Prior, R.L. Lipophilic and Hydrophilic Antioxidant Capacities of Common Foods in the United States. J. Agric. Food Chem. 2004, 52, 4026–4037. [Google Scholar] [CrossRef] [Scilit] [PubMed]
- Venkatachalam, M.; Sathe, S.K. Chemical Composition of Selected Edible Nut Seeds. J. Agric. Food Chem. 2006, 54, 4705–4714. [Google Scholar] [CrossRef] [Scilit] [PubMed]
- ISO 659:2014; Oilseeds—Determination of Oil Content (Reference Method). ISO: Geneva, Switzerland, 2014.
- ISO 1871:2009; Food and Feed Products—General Guidelines for the Determination of Nitrogen by the Kjeldahl Method. ISO: Geneva, Switzerland, 2009.
- AOAC. Official Methods of Analysis, 20th ed.; Method 976.06; AOAC: Arlington, VA, USA, 2016. [Google Scholar]
- FAO. Food Energy—Methods of Analysis and Conversion Factors; FAO Food and Nutrition Paper 77; FAO: Rome, Italy, 2003. [Google Scholar]
- ISO 3960:2007; Animal and Vegetable Fats and Oils—Determination of Peroxide Value. ISO: Geneva, Switzerland, 2007.
- ISO 660:2009; Animal and Vegetable Fats and Oils—Determination of Acid Value and Acidity. ISO: Geneva, Switzerland, 2009.
- AOCS. Official Methods and Recommended Practices of the American Oil Chemists Society, 5th ed.; AOCS Press: Champaign, IL, USA, 1999. [Google Scholar]
- ISO 279:1998; Essential Oils-Determination of Relative Density at 20 °C-Reference Method. ISO: Geneva, Switzerland, 1998.
- ISO 6320:2000; Animal and Vegetable Fats and Oils—Determination of Refractive Index. ISO: Geneva, Switzerland, 2000.
- ISO 3656:2011; Animal and Vegetable Fats and Oils—Determination of Ultraviolet Absorbance. ISO: Geneva, Switzerland, 2011.
- ISO 6886:2006; Animal and Vegetable Fats and Oils—Determination of Oxidative Stability (Accelerated Oxidation Test). ISO: Geneva, Switzerland, 2006.
- ISO 12966-1:2014; Gas Chromatography of Fatty Acid Methyl Esters—Part 1: Guidelines. ISO: Geneva, Switzerland, 2014.
- ISO 12966-2:2011; Gas Chromatography of Fatty Acid Methyl Esters—Part 2: Preparation of Methyl Esters. ISO: Geneva, Switzerland, 2011.
- ISO 18609:2000; Animal and Vegetable Fats and Oils—Determination of Unsaponifiable Matter. ISO: Geneva, Switzerland, 2000.
- Ivanov, S.; Bitcheva, P.; Konova, B. Méthode de détermination chromatographyque et colorimétrique des phytosterols dans les huiles végétales et les concentres steroliques. Rev. Fr. Corps Gras 1972, 19, 177–180. [Google Scholar]
- ISO 12228-1:2014; Determination of Sterols—Part 1: Gas Chromatographic Method. ISO: Geneva, Switzerland, 2014.
- ISO 9936:2016; Determination of Tocopherol and Tocotrienol Contents by HPLC. ISO: Geneva, Switzerland, 2016.
- Folch, J.; Lees, M.; Sloane-Stanley, G.H. A Simple Method for Isolation and Purification of Total Lipids from Animal Tissues. J. Biol. Chem. 1957, 226, 497–509. [Google Scholar] [CrossRef] [Scilit]
- Schneiter, R.; Daum, G. Analysis of Yeast Lipids. In Yeast Protocols, 2nd ed.; Methods in Molecular Biology; Humana Press: Totowa, NJ, USA, 2006; Volume 313. [Google Scholar] [CrossRef] [Scilit]
- ISO 10540-1:2014; Determination of Phosphorus Content—Part 1: Colorimetric Method. ISO: Geneva, Switzerland, 2014.
- Kiralan, S.S.; Kiralan, M.; Ozkan, G. Cold Pressed Pecan (Carya illinoinensis) Oil. In Cold Pressed Oils; Academic Press: Cambridge, MA, USA, 2020; pp. 515–524. [Google Scholar] [CrossRef] [Scilit]
- Cockerham, S.N.; Gorman, W.; Maness, N.; Lillywhite, J. Feasibility Assessment of Investing in a Pecan Oil and Flour Processing Facility Using New Extraction Technology. Ph.D. Thesis, New Mexico State University, Las Cruces, NM, USA, 2012. [Google Scholar]
- Alvarez-Parrilla, E.; Urrea-López, R.; de la Rosa, L.A. Bioactive Components and Health Effects of Pecan Nuts and Their Byproducts: A Review. J. Food Bioact. 2018, 1, 56–92. [Google Scholar] [CrossRef] [Scilit]
- Juhaimi, F.A.; Özcan, M.M.; Uslu, N.; Doğu, S. Pecan Walnut Oil Quality and Phenolic Compounds as Affected by Microwave and Conventional Roasting. J. Food Sci. Technol. 2017, 54, 4436–4441. [Google Scholar] [CrossRef] [Scilit]
- Codex-Stan 210-1999; Codex Standard for Named Vegetable Oils. Codex Alimentarius Commission: Rome, Italy, 1999.
- Prasad, R.B.N. Walnuts and Pecans. In Encyclopedia of Food Sciences and Nutrition; Academic Press: Amsterdam, The Netherlands, 2003; pp. 6071–6079. [Google Scholar] [CrossRef] [Scilit]
- Popov, A.; Yanishlieva, N. Autooxidation and Stability of Lipids; House of the Bulgarian Academy of Sciences: Sofia, Bulgaria, 1976; p. 131. [Google Scholar]
- Kornsteiner, M.; Wagner, K.H.; Elmadfa, I. Tocopherols and Total Phenolics in 10 Different Nut Types. Food Chem. 2006, 98, 381–387. [Google Scholar] [CrossRef] [Scilit]
- do Prado, A.C.P.; Manion, B.A.; Seetharaman, K.; Deschamps, F.C.; Arellano, D.B.; Block, J.M. Relationship Between Antioxidant Properties and Chemical Composition of the Oil and Shell of Pecan Nuts. Ind. Crops Prod. 2013, 45, 64–73. [Google Scholar] [CrossRef] [Scilit]
- Bouali, I.; Trabelsi, H.; Herchi, W.; Martine, L.; Albouchi, A.; Bouzaien, G.; Sifi, S.; Boukhchina, S.; Berdeaux, O. Analysis of Pecan Nut Unsaponifiable Fraction: Effect of Ripening Stage on Phytosterols and Phytostanols. Food Chem. 2014, 164, 309–316. [Google Scholar] [CrossRef] [Scilit]
- Song, S.; Cheong, L.Z.; Wang, H.; Man, Q.Q.; Pang, S.J.; Li, Y.Q.; Zhang, J. Characterization of Phospholipid Profiles in Six Kinds of Nut Using HILIC-ESI-IT-TOF-MS. Food Chem. 2018, 240, 1171–1178. [Google Scholar] [CrossRef] [Scilit]
- O’Brien, D.R.; Farr, W.E.; Wan, P.J. Introduction to Fats and Oils Technology, 2nd ed.; AOCS Press: Champaign, IL, USA, 2000. [Google Scholar]
- Castelo-Branco, V.N.; Santana, I.; Di-Sarli, V.O.; Freitas, S.P.; Torres, A.G. Antioxidant Capacity as a Surrogate Measure of Vegetable Oil Quality and Stability. Eur. J. Lipid Sci. Technol. 2016, 118, 224–235. [Google Scholar] [CrossRef] [Scilit]
- Fernandes, G.D.; Gómez-Coca, R.B.; Pérez-Camino, M.C.; Moreda, W.; Barrera-Arellano, D. Chemical Characterization of Major and Minor Compounds of Nut Oils. J. Chem. 2017, 2017, 2609549. [Google Scholar] [CrossRef] [Scilit]
- Gong, Y.; Pegg, R.B.; Carr, E.C.; Parrish, D.R.; Kellett, M.E.; Kerrihard, A.L. Chemical and Nutritive Characteristics of Tree Nut Oils Available in the U.S. Market. Eur. J. Lipid Sci. Technol. 2017, 119, 1600520. [Google Scholar] [CrossRef] [Scilit]
- Wagner, K.H.; Kamal-Eldin, A.; Elmadfa, I. Gamma-Tocopherol—An Underestimated Vitamin? Ann. Nutr. Metab. 2004, 48, 169–188. [Google Scholar] [CrossRef] [Scilit]
- Elmadfa, I.; Wagner, K.H. Vitamin E and Stability of Plant Oils. Fett–Lipid 1997, 99, 234–238. [Google Scholar]
- Zhao, Q.; Wang, M.; Zhang, W.; Zhao, W.; Yang, R. Impact of Phosphatidylcholine and Phosphatidylethanolamine on the Oxidative Stability of Stripped Peanut Oil and Bulk Peanut Oil. Food Chem. 2020, 311, 125962. [Google Scholar] [CrossRef] [Scilit]
- Rudolph, C.J.; Odell, G.V.; Hinrichs, H.A.; Hopfer, D.A.; Kays, S.J. Genetic, Environmental and Maturity Effects on Pecan Kernel Composition. J. Food Qual. 1992, 15, 263–278. [Google Scholar] [CrossRef] [Scilit]
- Scapinello, J.; Magro, J.D.; Block, J.M.; Di Luccio, M.; Tres, M.V.; Oliveira, J.V. Fatty Acid Profile of Pecan Nut Oils Obtained from Pressurized n-Butane and Cold Pressing. J. Food Sci. Technol. 2017, 54, 3366–3369. [Google Scholar] [CrossRef] [Scilit]
- Salvador, A.A.; Podestá, R.; Block, J.M.; Ferreira, S.R.S. Increasing the Value of Pecan Nut Cake by Oil Extraction and Antioxidant Activity Evaluation. J. Supercrit. Fluids 2016, 116, 215–222. [Google Scholar] [CrossRef] [Scilit]

Disclaimer/Publisher’s Note: The statements, opinions and data contained in all publications are solely those of the individual author(s) and contributor(s) and not of MDPI and/or the editor(s). MDPI and/or the editor(s) disclaim responsibility for any injury to people or property resulting from any ideas, methods, instructions or products referred to in the content. |
© 2026 by the authors. Licensee MDPI, Basel, Switzerland. This article is an open access article distributed under the terms and conditions of the Creative Commons Attribution (CC BY) license.