


Abstract
For continuous crystallization of pharmaceutical and organic chemical compounds in a plug flow crystallizer, seed slurry, prepared in advance, is continuously fed into the crystallizer for controlled secondary nucleation and subsequently desired crystal properties. It is well known that the preparation of macro seed crystals using either the dry or wet method is a highly time-, energy- and material-intensive process, often taking many hours to prepare a 1 L seed slurry. The focus of this work is to examine whether how the seed slurry is made up could have any effect on the final crystal properties. We divide the seed slurry into two parts: the “saturation part” corresponds to the amount of solute required to establish solid–liquid equilibrium and is fully dissolved, and the “supersaturation part” involves a small amount of solid seed crystals in excess of the equilibrium saturation condition. The hypothesis states that if dissolved seed crystals have lost their surface properties (such as size, morphology, interfacial effects), the final crystal size distributions would then inherit that of the solid seed crystals. If this is true, this would provide a great and efficient shortcut for the lengthy and energy-intensive process of making up seed slurries, as product crystals from a previous batch of any size distribution could be used for the make-up of the saturation part of the seed slurry. Using adipic acid and L-glutamic acid with high and low solubilities, the hypothesis has been validated experimentally under batch conditions.
1. Introduction
Seeding is a predominant method used in the laboratory and at industrial scales of crystallization processes, where seed crystals are added to induce and control secondary nucleation and further crystal growth [1,2,3]. Seed crystals are generally prepared by milling and sieving processes; milling involves either the dry or wet method with and without external stimuli (e.g., ultrasonic irradiation) [4,5,6,7]. Seed size and seed loading have been the two most investigated parameters in seeded crystallization processes, once the purpose of seeding is known [8,9,10,11,12]. The forms of seed crystals (size distribution and shape) [13] and the design and preparation of seed recipe [14] are the associated subjects. A recent review on seeding has well documented the intensive research in this area [15]. The following findings have become the wisdom and the practical guide in terms of seeding: for a given seed mass, when the seed size is reduced, the nucleated mass decreases and the amount of seed growth increases. For a given seed size, as the seed mass is increased, the same outcome is expected. Insufficient seed loading promotes significant formation of fines [16,17], leading to excessive nucleation and/or fouling, as well as unfavourable particle shapes, agglomeration and reduced purification performance with the potential inclusion of impurities [18].
Successful seeding strategy requires a combination of correct seed size (μm) and correct seed mass (kg), while the exact figures for the two parameters may change for different compounds. By applying the McCabe’s ΔL law [19] and obeying the following assumptions the final crystal size can be estimated from Equation (1): (i) primary nucleation is suppressed by seeds; (ii) crystals neither agglomerate nor break; (iii) crystal shape remains constant throughout the process; and (iv) crystals grow solely on seeds.
where CS is the seed loading (%) [17,20,21], WS the mass of inoculum seeds (g), Ytheo the theoretical mass (g), Wsol the mass of solvent (g), and Csat and Cfinal are the saturation and final concentration (gsolute gsolvent−1) respectively. The seed mass, WS, is further evaluated from WP = WS + Ytheo, where WP is the mass of crystals produced (g). Based on the above assumptions together with the conserved number of seed crystals (N) and the unchanged crystal morphology (represented by the shape factor (F) = the ratio of surface and volume shape factors), and letting LS and LP be the characteristic sizes of seeds (μm) and the product crystals (μm), respectively, and ρS the density of solid crystal (g mL−1), the mass ratio between the product crystals and the seeds takes the equation below:
Further simplifications of the left side of Equation (2) using Equation (1) lead to
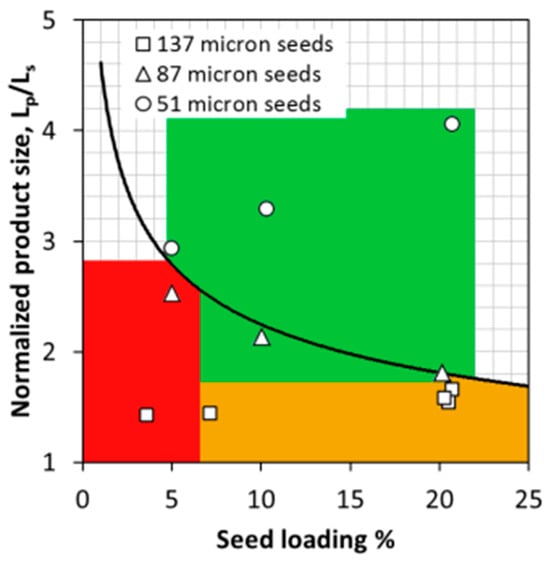
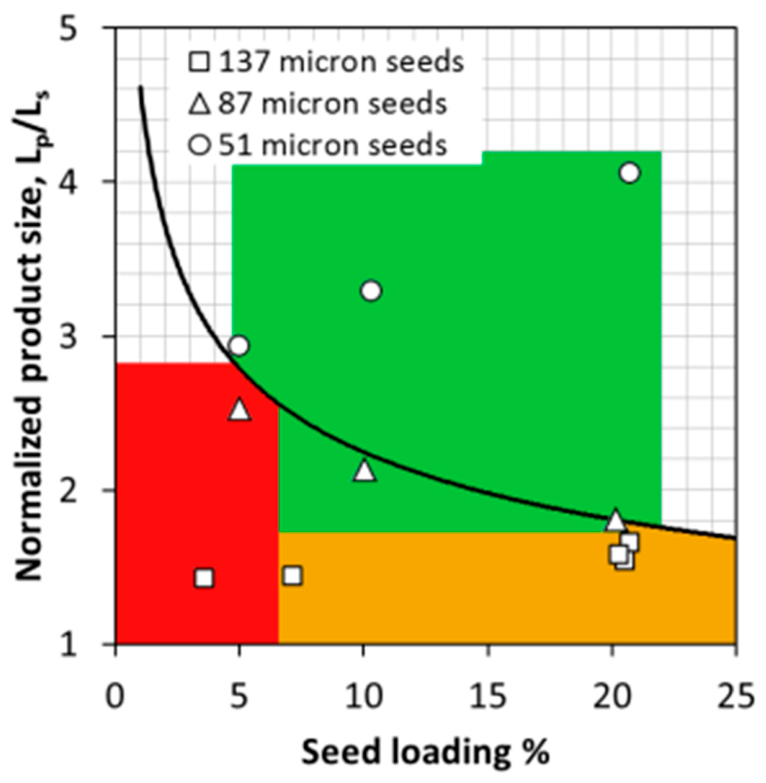
where Lp/Ls on the left is termed as the normalized product size. The above equation can be used to estimate the size of the product crystals, LP, when the characteristic size of seed crystals, LS, and the seed loading, CS, are known. Plotting Lp/Ls as a function of the seed loading/mass is the typical seed response curve shown in Figure 1, demonstrating that the increase in seed loading decreases the normalized product size. Figure 1 also serves as a very useful tool for formulating seeding strategy, as the seed response curve itself represents the growth-dominated mechanism. The area above the curve is associated with the normalized product sizes being larger than the ideal values and is facilitated with crystal growth and non-encrustation; the area below the curve is where the final normalized product sizes are smaller than Lp/Ls due to either the occurrence of primary nucleation, which leads to excessive small crystals without control, or insufficient seed crystal surfaces for the solute material to grow on, making the solute molecules move to the crystallizer walls, leading to severe encrustation and blockage, especially when seeds of larger sizes are combined with smaller seed loading. The above was demonstrated and realized in terms of the seeding traffic light map in a seeded cooling crystallization of a fine chemical compound [22], when operating in the green zone, encrustation was avoided for the entire running duration of 8 h.
Figure 1.
Seeding traffic light map. Red—severe blockage; amber—minor blockage; green—no blockage [22].
In continuous crystallization of pharmaceutical APIs in plug flow tubular crystallizers or MSMPR, continuous seeding in terms of seed slurry is required. Taking a standard NiTech DN15 (NiTech Solutions Ltd., Edinburgh, UK) continuous oscillatory baffled crystallizer of 2.5 L as an example, the main feed is 50 mL min−1, the seed input is 10 mL min−1, and it requires 4.8 L of seed slurry for an 8 h operation. The preparation of seeds by either a dry or wet process is a time- and energy-intensive process [23], even with the elegant system involving wet milling with a recycle loop and multi online sensors [24], a large number of hours was still required for producing a 1 L seed slurry with the rotor in the wet mill running from 10,000 to 20,000 rpm (intensive consumption of energy), there are still challenges in interpreting the online measurements [25] and scaling in the connecting pipes to the wet mills [26,27]. Locating the wet mills within the stirred tank was one of the remedies for reducing scaling [28].
The seed slurry for continuous crystallization processes consists of a slightly supersaturated solution that is traditionally made up of macro crystals of 5–50 μm [29] of narrow size distribution. In this study, we are investigating whether the make-up of the seed slurry could affect the particle size distribution of the resulting products. The seed slurry is divided into two parts: the saturation part where all solid seed crystals are dissolved and the supersaturation part where crystals stay in their solid form. According to thermodynamics, properties of solid crystals would have been lost upon a full dissolution in liquid, such as the molecular structure, particle size distribution, shape, morphology, surface characteristics and so on. From the classical nucleation theory, one would hypothesize that the final product crystal size distribution (CSD) should only be affected by the CSD of solid crystals in the supersaturation part, since the dissolved crystals to achieve the saturation part of the seed slurry would play no role in influencing the resulting CSD of the product crystals. If this hypothesis is valid, this would present a great and efficient shortcut to the intensive seed preparation process, saving a tremendous amount of time, energy and the seeds of desired ranges. The focus of the work is to test this hypothesis.
Note that in continuous crystallization practice, seed slurries are routinely prepared using well-defined macro-scale crystals for both the saturated and supersaturated portions, a protocol widely adopted but rarely justified or critically examined in the open literature. It remains unclear whether this practice is scientifically necessary or simply reflects a conservative operational approach. The novelty of this work therefore lies not in re-establishing known seeding principles but in experimentally validating that crystals fully dissolved in the saturation part of the seed slurry do not influence the final CSD, thereby challenging an entrenched common practice. This insight has direct practical implications, as it enables a simplified seed preparation strategy that can significantly reduce time, energy, and material consumption in continuous crystallization processes.
2. Experimental Set Up and Procedures
2.1. Oscillatory Baffled Crystallizer
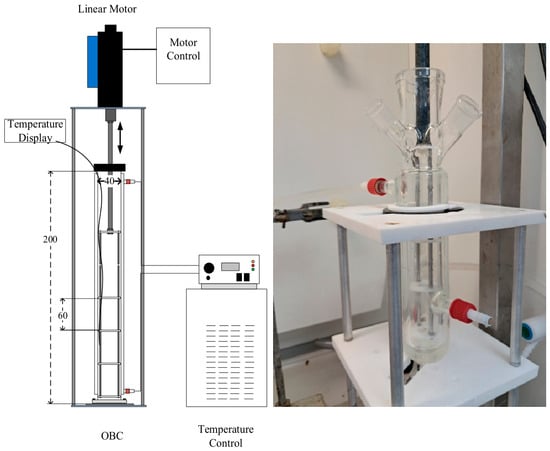
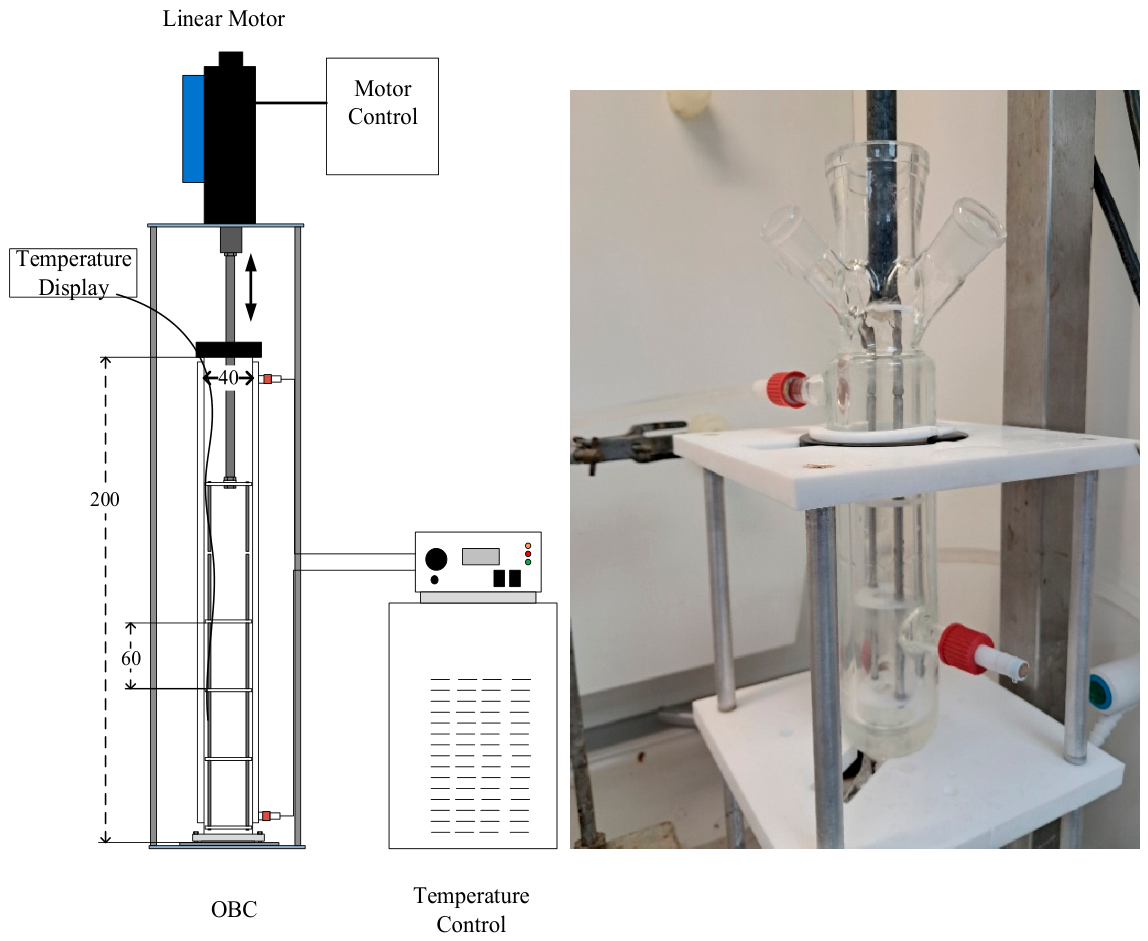
Figure 2 is a schematic set-up of a batch oscillatory baffled crystallizer (OBC). The OBC consists of a jacketed glass column and a set of three orifice baffles. The column diameter is 40 mm and the column height is 200 mm, providing a working volume of 200 mL. The baffle and the orifice diameters are 38 mm and 18.8 mm, respectively, giving the restriction ratio of 22%. The baffle set is connected to a linear motor drive (Copley Controls Corp., Canton, MA, USA, Xenus™, XSL-230-18) and a control unit, delivering various oscillation frequencies (0.5 to 5 Hz) and amplitudes (0 to 40 mm). The vessel is held in position by a stainless-steel flange to minimize vibration. Heating and cooling to the OBC are provided by a Grant GP200R2 heater/chiller (Grant Instruments (Cambridge) Ltd., Royston, UK), with the jacket fluid being water. Temperature is continuously monitored by using stainless steel T-Type thermocouples recorded by a PC.
Figure 2.
Schematic of a batch oscillatory baffled crystallizer (left) and photo (right).
The OBC used in this study was operated in batch mode, not continuous mode. Continuous crystallization is emphasized in the Abstract and Introduction because the motivation for this work arises from a key industrial bottleneck in continuous crystallization—namely, the substantial time and energy required to prepare seed slurries. A batch OBR was employed as a well-controlled experimental platform to test the underlying hypothesis while decoupling hydrodynamic and residence-time complexities inherent to continuous operation. The findings are therefore directly relevant to continuous crystallization practice, even though the hypothesis was experimentally examined under batch conditions.
2.2. Chemicals and Analytical Methods
Adipic acid (99% purity) was purchased from Fisher Scientific UK Ltd. (Loughborough, UK) in the form of white crystalline and odourless powder. Adipic acid (AA) is generally regarded as a single-form system under solution crystallization conditions. Although a triclinic structure has been reported based on single-crystal X-ray diffraction at 100 K, this corresponds to a low-temperature solid-state phase rather than a polymorph obtainable under practical crystallization conditions [30]. To date, no experimental crystallization or growth conditions have been reported that reproducibly yield this form; therefore, the commonly observed monoclinic form remains the relevant crystal form for our study.
L-Glutamic acid (99% purity) was purchased from Thermo Scientific (Waltham, MA, USA), also an odourless powder, and distilled water was prepared in-house. The crystal size distributions were analyzed by a Mastersizer 3000™ (Malvern, Worcestershire, UK). L-glutamic acid (LGA) is a well-characterized polymorphic system with two known forms: the metastable α-form and the thermodynamically stable β-form [31,32]. The α-polymorph is more challenging to obtain and tends to transform to the β-form as supersaturation, mixing intensity, cooling rate, or residence time increase—consistent with a solution-mediated polymorphic transformation process [33]. We intentionally selected the metastable α-form as the focus of our study because its controlled formation represents a stricter test of our hypothesis, given its greater susceptibility to transformation compared to the stable β-form. Consequently, if the proposed mechanism holds for the metastable α-form, it is expected to be applicable to the stable β-form as well.
2.3. Experiments Procedures
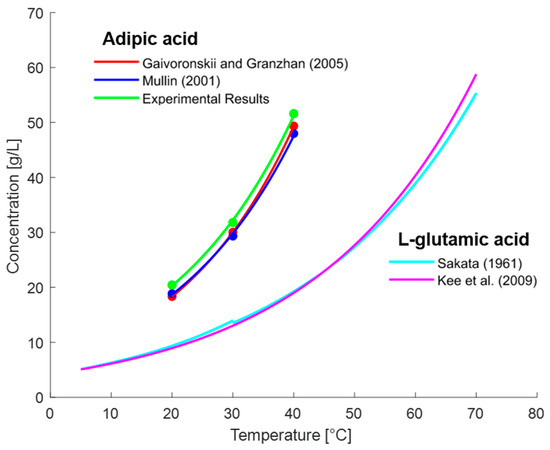
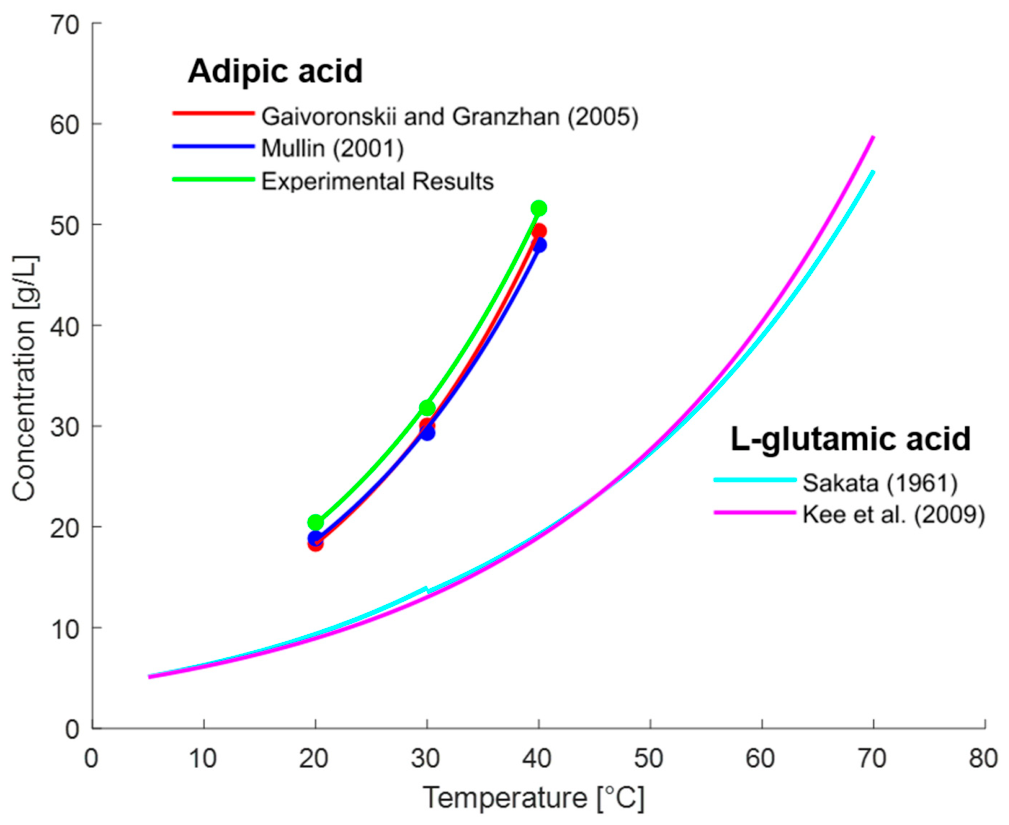
Solubility of adipic acid in water from the literature [34,35,36] was measured and verified at three temperatures and plotted in Figure 3 and summarized in Table 1. The agreement between the literature and experimental data is reasonably good, and experimental data is used throughout this work. The solubility of L-glutamic acid was taken from the literature [37] and is also shown in Figure 3. Because L-glutamic acid was used in our previous studies, the literature solubility data was sufficiently accurate and agreed with the experimental validations [38,39,40,41].
Figure 3.
Solubility of adipic acid and α-form L-glutamic acid in water at selected temperatures, the latter was plotted using parameter-fitting equations from the literature [32,37]. For the mentioned literature: the purple line is [32], the red line is [34], the blue line is [36], and the ocean blue is [37].
Table 1.
Comparison of the experimental and literature solubility data of adipic acid in water at selected temperatures.
The following procedure was used for the experiments where mixing conditions, the degree of supercooling and the seeding location are fixed, the only independent variable here was how the slurry was made up.
2.4. Main Solution
The main solutions were prepared by dissolving 51.61 g adipic acid (Table 1) or 32.0 g L-glutamic acid in 1000 mL distilled water at 40 °C and 55 °C respectively in a jacketed beaker to reach its saturation concentration, before being heated up and maintained at 50 °C and 70 °C, respectively, for 30 min to ensure complete dissolution. The hot solution was then hot-filtered through a 1.2 µm glass fibre to remove any foreign bodies. The hot-filtered solution was added to the pre-warmed (50 °C/70 °C) OBC before oscillation of 1.0/1.5 Hz and 20 mm was applied. The oscillation intensity was kept unchanged throughout experiments. The initial supersaturation was just above 1 for both cases. The solution was then cooled to 20/15 °C at a linear rate of 0.25/0.5 °C min−1, delivering 20/40 °C supercooling for the adipic acid and L-glutamic acid respectively. At 38/53 °C, a seed slurry was added to the OBC in a one-off fashion. At the end of crystallization, the solution in the OBC was maintained at 20/15 °C for 5 min and was transferred to a holding vessel at 20/15 °C where filtration was carried out. The harvested crystals were weighed and dried in an oven at 40 °C. The particle size distribution of the dried crystals was then measured using the Malvern Mastersizer 3000 particle sizer. Table 2 recaps the experimental conditions for crystallization of both compounds, note that a larger supercooling was used for L-glutamic acid in comparison to that for adipic acid due to its flatter slope for solubility.
Table 2.
Summary of the conditions for the crystallizations of adipic acid and L-glutamic acid.
2.5. Seed Slurry
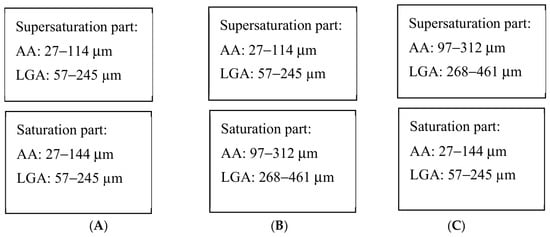
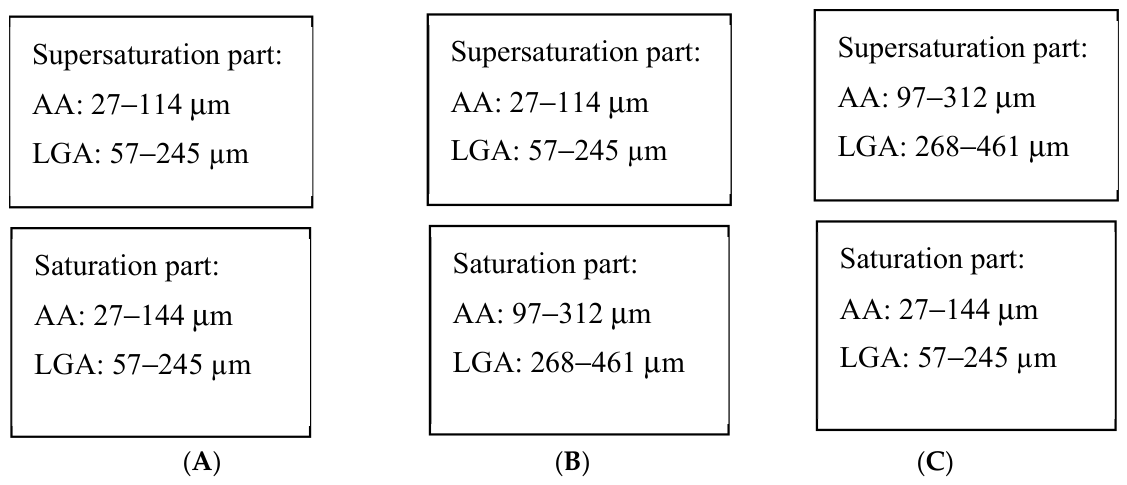
As articulated earlier, the seed slurry is divided into the saturation part and the supersaturation part. For the adipic acid, two categories of seed crystals were prepared: the coarse crystals (97 to 312 µm) and the fine crystals (27 to 114 µm).
L-glutamic acid crystals have an α-form and a β-form. The crystals purchased from Thermos Scientific were mostly α-form. These crystals were sieved to obtain the “coarse” (268 to 461 µm) seeds. The “fine” seeds were obtained by washing sieved crystals with deionized water until their sizes reached the range of (57 to 245 µm). Note that the crystals purchased from the suppliers had different size distributions, the selections of coarse and fine seed sizes for both L-glutamic acid and adipic acid are also different due to the limitation of existing mesh sizes available.
Seed slurry was added at 38 °C for adipic acid and 53 °C for L-glutamic acid, i.e., 2 °C supercooling from the saturation temperature of 40/55 °C respectively. The saturation part of the slurry was made up by dissolving 1.21 g of adipic acid or 0.75 g L-glutamic acid in 25 mL distilled water corresponding to its saturation concentration at 38/53 °C. Table 3 shows the corresponding concentrations of each part, clearly the mass of the supersaturation part is significantly smaller than that of the saturation part.
Table 3.
Composition of the saturation and supersaturation parts for adipic acid and L-glutamic acid.
In this study, the crystal form was fixed across all experiments, the cooling rate and supercooling (supersaturation) range were also held constant. This experimental design ensures that seed shape and surface characteristics are comparable between different slurry preparations, thereby isolating the effect of how the seed slurry is prepared as the sole variable influencing the observed differences in product crystal size distribution.
Figure 4 sketches how each of the seed slurries was made up. The first seed slurry was made up using all fine seed crystals for both the saturation and supersaturation parts as shown in Figure 4A, this represents the base and traditional case. In Figure 4B, the saturation part of the seed solution was made of coarse crystals with a wide size distribution and a larger mean size, only the supersaturation part consisted of fine crystals. The hypothesis is that if the dissolved crystals in the saturation part have lost their properties, the product crystal size distribution would then inherit that of the fine crystals; comparing the CSDs would allow us to examine the validity of this hypothesis. If the hypothesis was true, the make-up combination shown in Figure 4C would further reinforce and validate the hypothesis. Each of the experiments was performed twice for repeatability.
Figure 4.
The make-up of the seed slurries for adipic acid (AA) and L-glutamic acid (LGA): (A)—both parts consist of fine crystals; (B)—the saturation part consists of coarse crystals and the supersaturation part of fine crystals; (C)—the saturation part consists of fine crystals and the supersaturation part of coarse crystals.
3. Results and Discussion
The following terminologies are adopted thereafter for the purpose of clarity. The combination of fine solid seeds in the slurry with coarse crystals was termed here to as “fine seeds–coarse slurry”, equally for the “coarse seeds–fine slurry”, and “fine seeds–fine slurry” combinations. The crystal size distributions (CSDs) of the solid seed crystals of either fine or coarse were measured prior to the experiments and were compared with that of the product crystals to examine/validate the hypothesis. The analysis of CSDs was conducted for both L-glutamic acid and adipic acid, including t-tests to determine whether there was a statistically significant difference between D50 when different crystal sizes were used for both the saturation parts and supersaturation parts.
3.1. L-Glutamic Acid
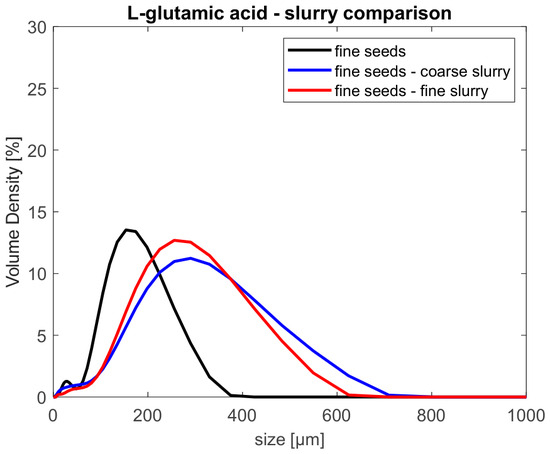
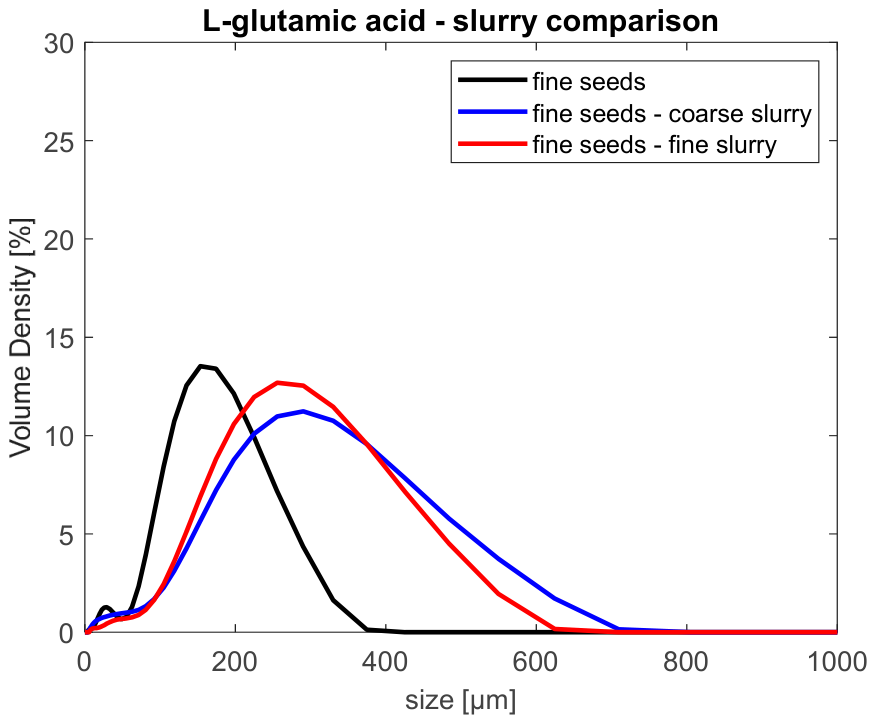
Figure 5 compiles the CSDs where the supersaturation part consists of only fine crystals, while the saturation part constitutes either fine or coarse crystals. It can be seen that the CSDs of both products shifted to the right of the CSD of the seed crystals (the black curve). This matches the expectation that the seed crystals would grow as a result of the supersaturated solution. When comparing the CSD of fine seeds–coarse slurry (blue) with that of fine seeds–fine slurry (red), these are very similar, so are the D values in Table 4, supporting the hypothesis that the make-up of the slurry would not affect the properties of the resulting products.
Figure 5.
Crystal size distributions of L-glutamic acid products for fine seeds–coarse slurry (blue) and fine seeds–fine slurry (red). The black curve shows the size distribution of the fine seeds.
Table 4.
The D values for L-glutamic acid samples.
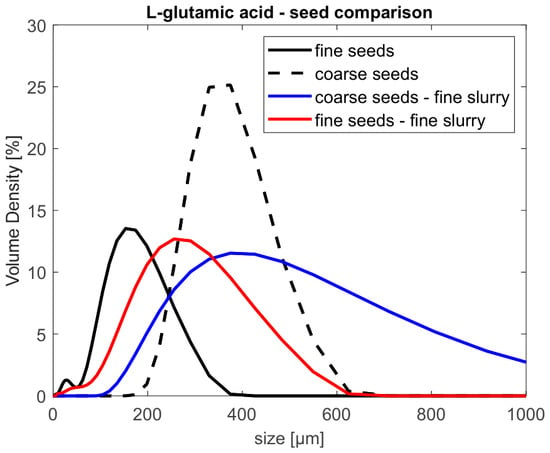
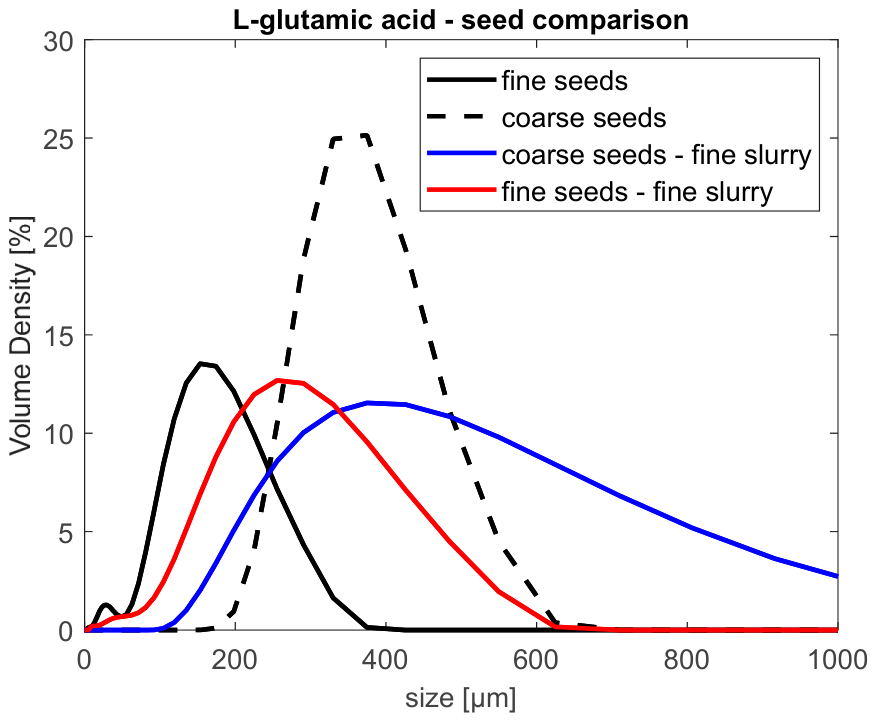
Further investigations were performed using the fine slurry while varying the make-up of the supersaturation part; the CSDs are shown in Figure 6. Clearly the product CSD (blue) in Figure 6 has shifted to the right relative to the seeds used (dotted black curve) with a much broader span and smaller growth (see Table 4), as was expected. The CSD in black (fine seeds) and the CSD in red (fine seeds–fine slurry) are the same as these in Figure 5 and plotted again for comparison. The data once again support the hypothesis that the size distribution of the solid seeds, rather than the make-up of the slurry, determines the size distribution of the products.
Figure 6.
Crystal size distributions of L-glutamic acid products for coarse seeds–fine slurry (blue) and fine seeds–fine slurry (red). The solid black curve shows the CSD of the fine seeds and the dotted black curve shows the CSD of the coarse seeds.
The experimental data of L-glutamic acid support the hypothesis. Adipic acid was selected to repeat the tests and determine whether the results are compound specific. The solubility of adipic acid is much steeper than that of L-glutamic acid, this would increase the compound coverage if the hypothesis were still valid.
3.2. Adipic Acid
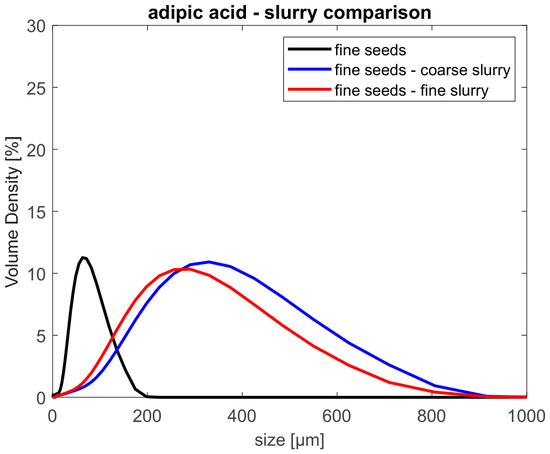
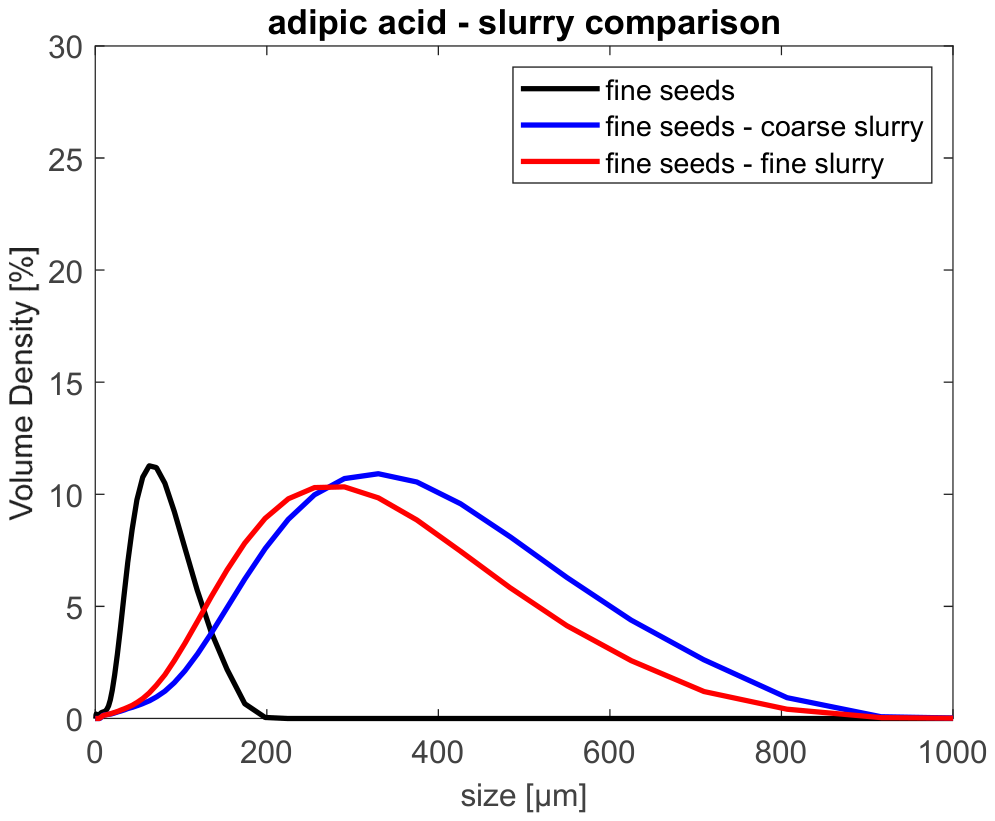
The same experimental procedures as the LGA were followed. The comparison of the CSD of adipic acid products for the fine seeds–coarse slurry and fine seeds–fine slurry combinations are shown in Figure 7 where both product CSDs have again shifted to the right compared with the CSD of the seeds (the black curve) due to the expected crystal growth. The D values in Table 5 are again similar for the two cases with a similar margin of variance as these for L-glutamic acid. Accordingly the data of adipic acid also support the hypothesis that it is the make-up of the supersaturation part that influences the resulting product CSDs.
Figure 7.
Crystal size distributions of adipic acid products for fine seeds–coarse slurry (blue) and fine seeds–fine slurry (red). The black curve shows the size distribution of the fine seeds.
Table 5.
The D values for adipic acid samples.
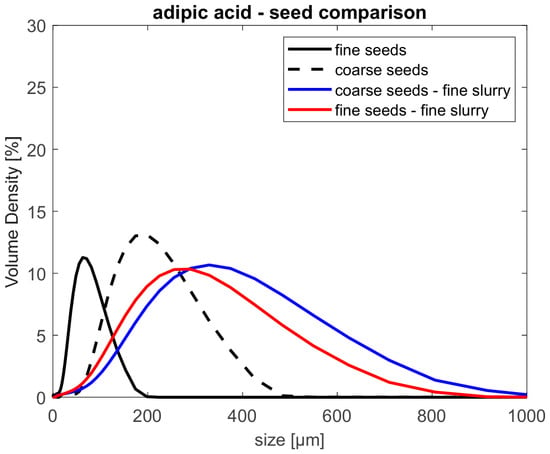
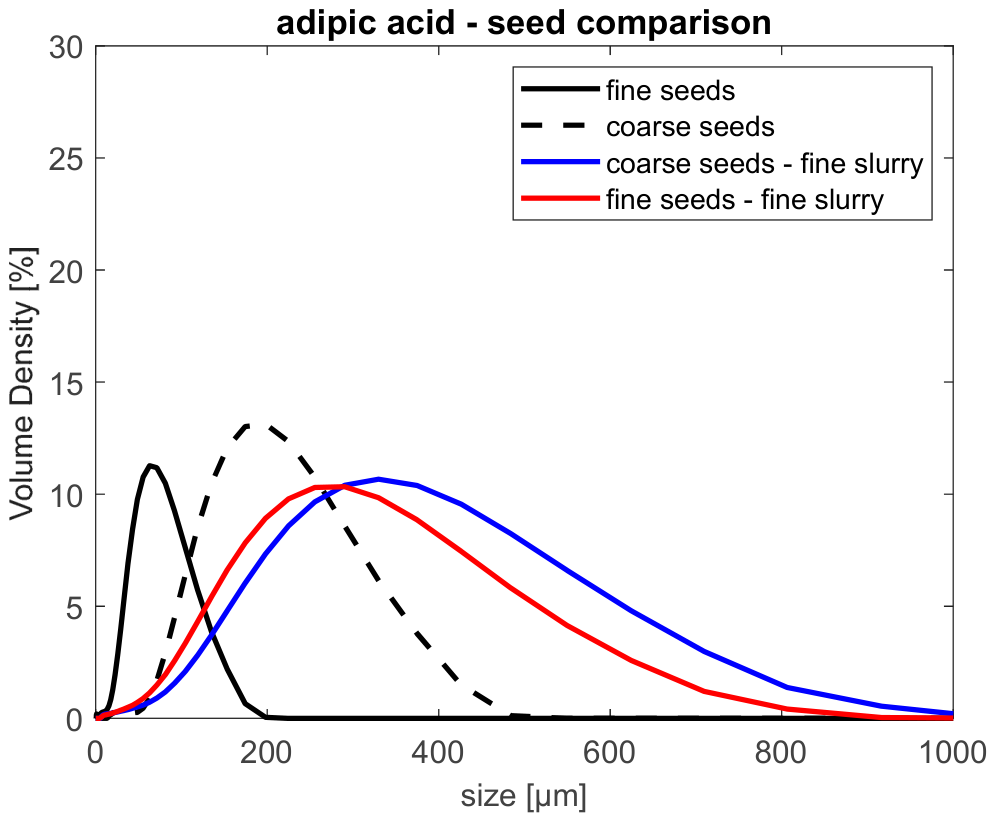
Figure 8 displays the CSDs where the make-up of the saturation part remained the same, but the formation of the supersaturation part varied. The CSDs of the fine seeds (black curve) and the fine seeds–fine slurry (red curve) are taken directly from Figure 7 for the purpose of comparison. Clearly the product CSD (blue curve) has shifted to the right of its corresponding seed CSD (dotted black curve), the corresponding D values are summarized in Table 5 where the mean product size for the coarse seeds–fine slurry (blue curve) has grown 1.6 times that of the coarse seeds (dotted black curve), while the mean size for the fine seeds–fine slurry (red curve) grew 4.4 times that of the fine seeds (black curve). These are within the expectations, as the mean size of the coarse seeds is about 3 times bigger than that of the fine seeds.
Figure 8.
Crystal size distributions of adipic acid products for coarse seeds–fine slurry (blue) and fine seeds–fine slurry (red). The solid black curve shows the CSD of the fine seeds and the dotted black curve shows the CSD of the coarse seeds.
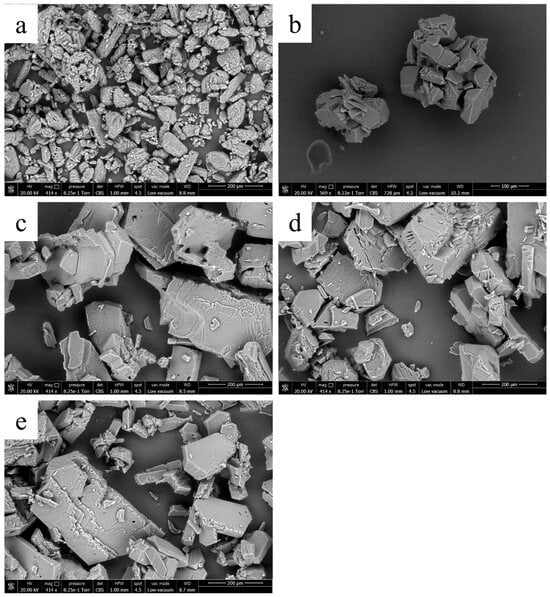
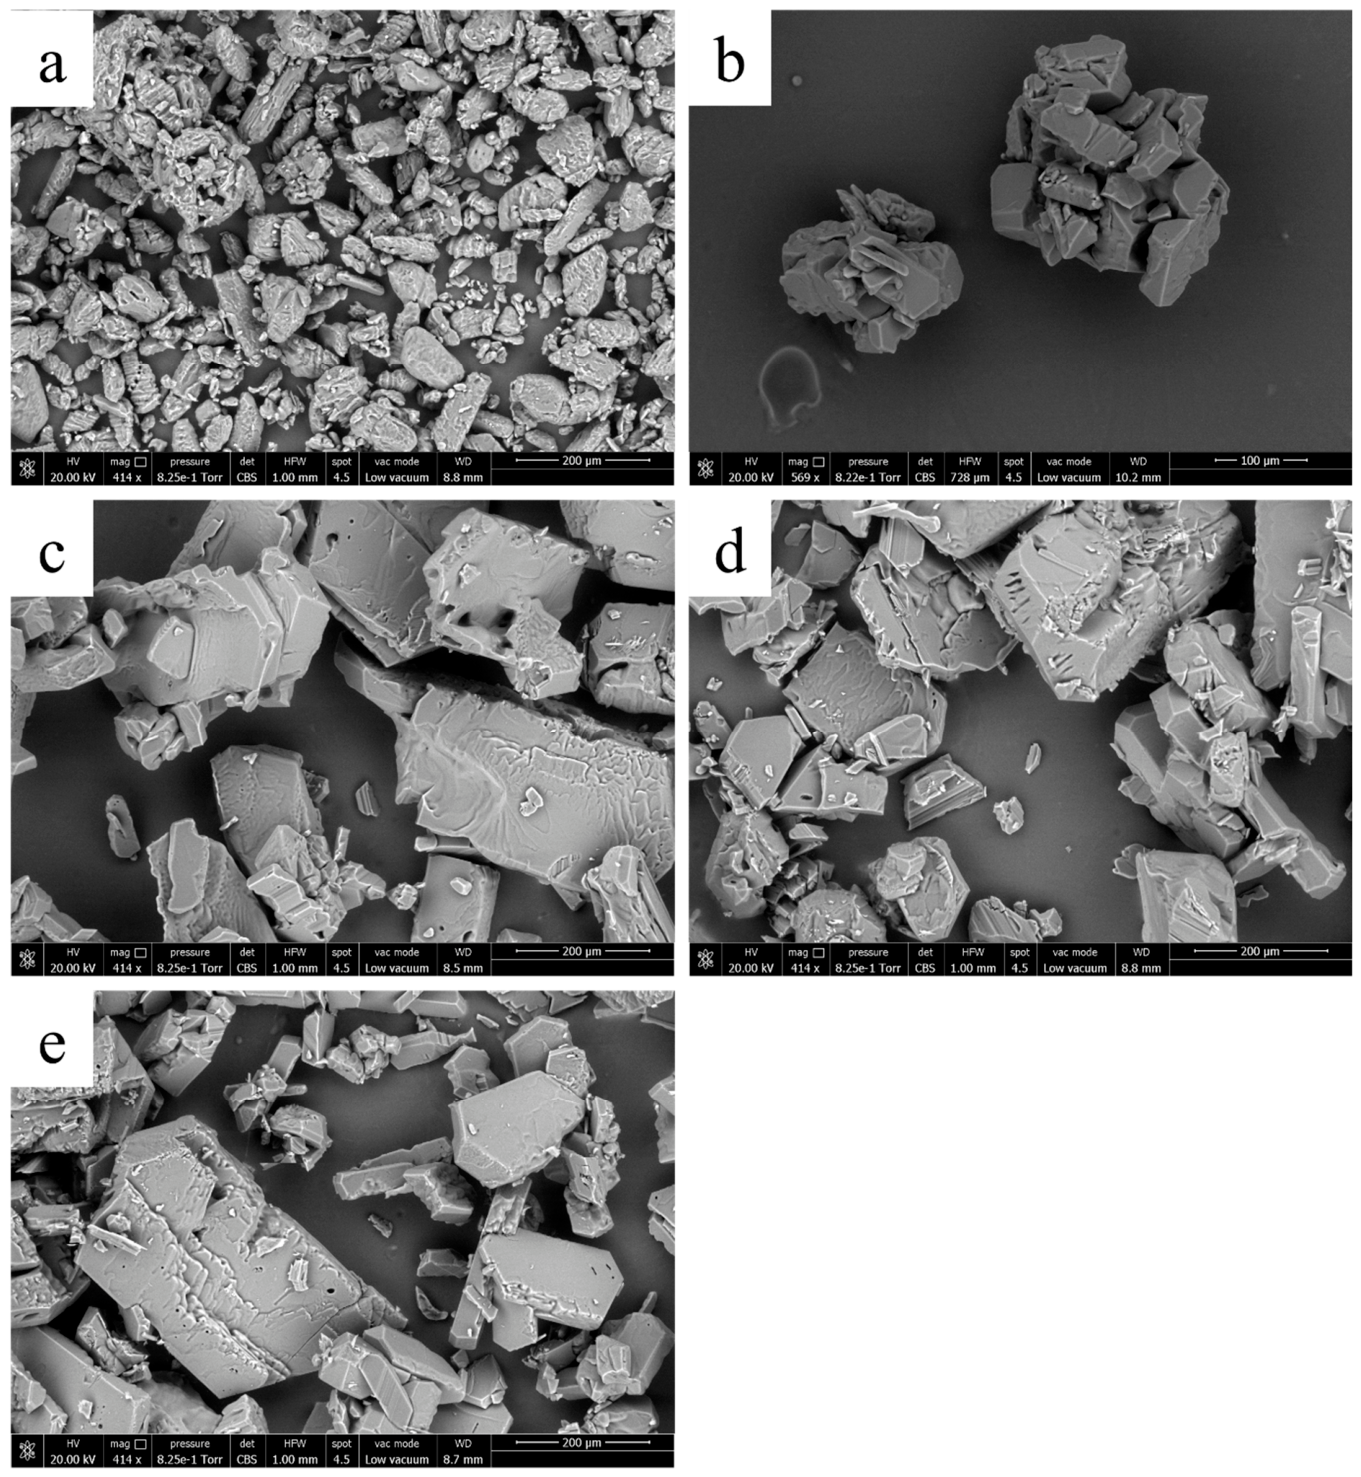
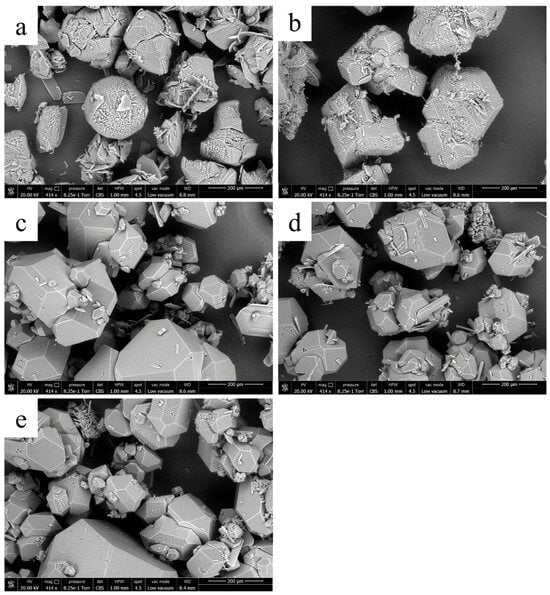
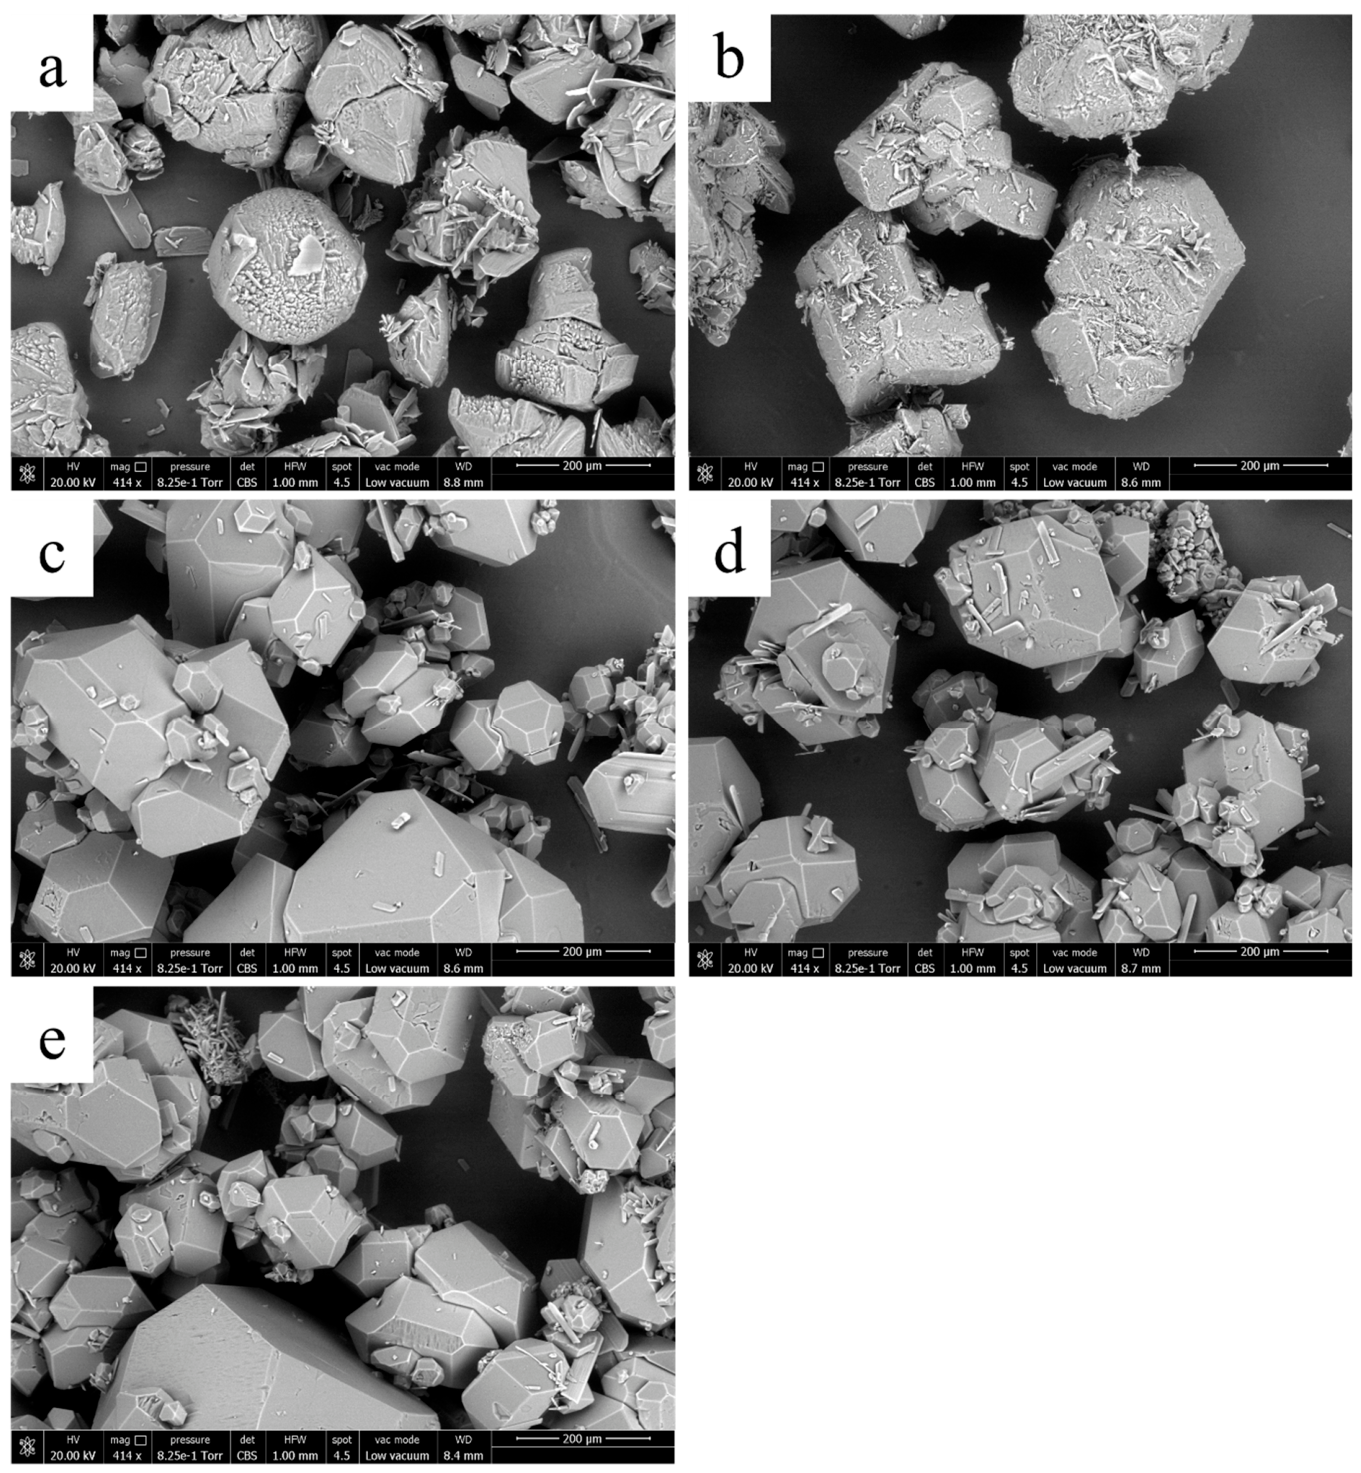
Figure 9 and Figure 10 show the SEM images of both the seed crystals and the final product crystals for both AA and LGA, indicating that the seeds used in the saturation and supersaturation parts of the slurry exhibit the same crystal morphology and surface features, and that the product crystals retain this morphology. This additional characterization confirms that differences in crystal size distribution do not arise from variations in seed shape or surface state, thereby supporting the conclusion that fully dissolved seeds in the saturated portion of the slurry have no influence on the final CSD.
Figure 9.
SEM images of adipic acid fine seeds (a), coarse seeds (b), fine seeds–coarse slurry products (c), coarse seeds–fine slurry products (d), and fine seeds–fine slurry products (e).
Figure 10.
SEM images of L-glutamic acid fine seeds (a), coarse seeds (b), fine seeds–coarse slurry products (c), coarse seeds–fine slurry products (d), and fine seeds–fine slurry products (e).
3.3. Hypothesis Tests
Each experiment was performed twice to obtain the mean values for D10, D50 and D90 presented above, which is the minimum required repetitions to perform t-tests on the sample means. Four comparisons were made between the different crystal sizes used for the saturation part and supersaturation part for both L-glutamic acid and adipic acid. The D50 values were used to determine whether there was a statistically significant difference (at a 5% significance level) between the sizes of the resulting product crystals. Table 6 shows whether the null hypothesis was rejected or not rejected for each combination. The null hypothesis is that the D50 values come from independent random samples from normal distributions with equal means and equal but unknown variances. If the null hypothesis is rejected, this means that at the 5% significance level, there is a statistically significant difference between sample means.
Table 6.
t-test results comparing D50 sizes at a 5% significance level.
The t-tests in Table 6 support the main conclusion of this work, which is that there was no statistically significant difference in the resulting product crystal sizes when different crystal sizes were dissolved to make the saturated solution. An expected result was that the null hypothesis would be rejected for different seed sizes, since one would expect that fewer, larger seeds would grow into larger crystals compared with a larger number of smaller seeds. This expectation was met for the L-glutamic acid case, but not for the adipic acid case despite the approximately threefold difference in seed size. We do not interpret this result as evidence that seed crystals have no influence. Rather, it suggests that the influence of the initial seed population is masked by other crystallization mechanisms. In particular, adipic acid is known to exhibit pronounced secondary nucleation behaviour during cooling crystallization. The literature studies [42,43,44,45] have reported that under such conditions the generation of new crystals can become sufficiently extensive that the final crystal population is no longer determined solely by the original seed distribution.
It is also noteworthy that the LGA experiments were conducted with a larger total supercooling (40 °C versus 20 °C for AA) and a higher cooling rate (0.5 °C min−1 versus 0.25 °C min−1). Despite the stronger thermal driving force, the seed effect remained statistically detectable for LGA but not for AA. This suggests that the differing outcomes are related to intrinsic crystallization behaviour rather than simply the magnitude of supersaturation generation. In summary, the results demonstrate that the seed crystals above saturation are the dominant factor governing the final CSD when their influence is not overwhelmed by competing nucleation mechanisms.
4. Conclusions
The preparation of seed slurries for continuous crystallization of pharmaceutical and chemical compounds is often a lengthy, material- and energy-intensive process. It is therefore important to examine the effectiveness of conventional seed slurry preparation strategies. In this work, two compounds with distinctly different solubility characteristics, L-glutamic acid and adipic acid, were used to test the hypothesis of whether dissolved crystals contribute to the final crystal size distribution (CSD) of the product.
For both L-glutamic acid and adipic acid crystallizations, no evidence was found that the dissolved crystals comprising the saturation part of the seed slurry influenced either the size distribution or morphology of the final product crystals. This finding was consistently supported by the statistical analysis. The results therefore indicate that the dissolved crystal fraction does not play a significant role in determining the final product CSD under the conditions investigated.
For L-glutamic acid, the experimental results further demonstrate that the product CSD is influenced by the size of the seed crystals present above saturation. In contrast, no statistically significant seed-size effect was observed for adipic acid. This behaviour is consistent with the stronger tendency of adipic acid toward secondary nucleation reported in the literature, which may obscure the influence of the initial seed population on the final product CSD.
The practical significance of these findings is that size-controlled microcrystals are not required for the saturation portion of the seed slurry. Instead, crystals of arbitrary size from previous batches may be used to establish the saturation component, potentially reducing the time, energy, and material requirements associated with seed preparation by more than 90%. Such a reduction would alleviate a major bottleneck in continuous crystallization processes.
Although the experiments reported here were conducted under batch conditions, the mechanistic conclusions provide a strong basis for application to continuous crystallization systems. Further studies under continuous operating conditions are nevertheless required to confirm the generality of these findings.
Author Contributions
Conceptualization: X.N.; methodology: X.N., A.R., Q.F.C. and Y.N.C.; software: A.R.; validation: A.R., Y.N.C. and Q.F.C.; formal analysis: A.R. and Y.N.C.; investigation: A.R., Y.N.C. and Q.F.C.; resources, X.N.; data curation: A.R. and Y.N.C.; writing—original draft: A.R. and X.N.; writing—review and editing: X.N.; visualization: A.R., Y.N.C. and Q.F.C.; supervision: X.N.; project administration: X.N.; funding acquisition: X.N. All authors have read and agreed to the published version of the manuscript.
Funding
This research was funded by the EU Horizon Grant (No. CL4-101058279) and the UKRI Horizon Europe Guarantee (No. 10041471).
Institutional Review Board Statement
Not applicable.
Informed Consent Statement
Not applicable.
Data Availability Statement
Data is available on request from the corresponding author.
Acknowledgments
The authors wish to thank the EU Horizon Grant (No. CL4-101058279) and the UKRI Horizon Europe Guarantee (No. 10041471) for funding this research. Thanks also go to Douglas Wanger for the fabrication of the experimental rig.
Conflicts of Interest
The authors declare no conflicts of interest.
References
- Lenka, M.; Sarkar, D. Improving Crystal Size Distribution by Internal Seeding Combined Cooling/Antisolvent Crystallization with a Cooling/Heating Cycle. J. Cryst. Growth 2018, 486, 130–136. [Google Scholar] [CrossRef] [Scilit]
- Unno, J.; Hirasawa, I. Partial Seeding Policy for Controlling the Crystal Quality in Batch Cooling Crystallization. Chem. Eng. Technol. 2020, 43, 1065–1071. [Google Scholar] [CrossRef] [Scilit]
- Parambil, J.V.; Heng, J.Y.Y. Seeding in Crystallisation; Roberts, K.J., Docherty, R., Tamura, R., Eds.; Springer: Dordrecht, The Netherlands, 2017. [Google Scholar]
- Anderson, N.G. Practical Process Research & Development—A Guide for Organic Chemists; Academic Press: Cambridge, MA, USA, 2012. [Google Scholar]
- Variankaval, N.; Cote, A.S.; Doherty, M.F. From Form to Function: Crystallization of Active Pharmaceutical Ingredients. AIChE J. 2008, 54, 1682–1688. [Google Scholar] [CrossRef] [Scilit]
- Ticehurst, M.D.; Marziano, I. Integration of Active Pharmaceutical Ingredient Solid Form Selection and Particle Engineering into Drug Product Design. J. Pharm. Pharmacol. 2015, 67, 782–802. [Google Scholar] [CrossRef] [Scilit] [PubMed]
- Brown, C.J.; McGinty, J.; Islam, M.T.; Rajoub, N.; Arjmandi-Tash, O.; Ottoboni, S.; Shahid, M.; Urwin, S.J.; Lee, Y.S.; Chong, M.W.S.; et al. Integrated Continuous Process Design for Crystallisation, Spherical Agglomeration, and Filtration of Lovastatin. J. Pharm. Innov. 2024, 9, 19. [Google Scholar]
- Eder, R.J.P.; Schmitt, E.K.; Grill, J.; Radl, S.; Gruber-Woelfler, H.; Khinast, J.G. Seed Loading Effects on the Mean Crystal Size of Acetylsalicylic Acid in a Continuous-Flow Crystallization Device. Cryst. Res. Technol. 2011, 46, 227–237. [Google Scholar] [CrossRef] [Scilit]
- Liu, J.J.; Ma, C.Y.; Hu, Y.D.; Wang, X.Z. Effect of Seed Loading and Cooling Rate on Crystal Size and Shape Distributions in Protein Crystallization—A Study Using Morphological Population Balance Simulation. Comput. Chem. Eng. 2010, 34, 1945–1952. [Google Scholar] [CrossRef] [Scilit]
- Lung-Somarriba, B.L.M.; Moscosa-Santillan, M.; Porte, C.; Delacroix, A. Effect of Seeded Surface Area on Crystal Size Distribution in Glycine Batch Cooling Crystallization: A Seeding Methodology. J. Cryst. Growth 2004, 270, 624–632. [Google Scholar] [CrossRef] [Scilit]
- Huang, D.C.; Liu, W.; Zhao, S.K.; Shi, Y.Q.; Wang, Z.X.; Sun, Y.M. Quantitative Design of Seed Load for Solution Cooling Crystallization Based on Kinetic Analysis. Chem. Eng. J. 2010, 156, 360–365. [Google Scholar] [CrossRef] [Scilit]
- Kang, Y.-S.; Ward, J.D. Analysis of Seed Loading and Supersaturation Trajectories for Two-Dimensional Crystallization Systems. Ind. Eng. Chem. Res. 2017, 56, 10798–10812. [Google Scholar] [CrossRef] [Scilit]
- Adnan, S.Z.; Samad, N.A.F.A. Effects of Different Seed Forms on Crystal Size Distribution for Seeded Batch Crystallization Process. Mater. Today Proc. 2024, 107, 23–28. [Google Scholar] [CrossRef] [Scilit]
- Zhang, F.; Liu, T.; Chen, W.; Ma, C.Y.; Wang, X.Z. Seed Recipe Design for Batch Cooling Crystallization with Application to L-Glutamic Acid. Ind. Eng. Chem. Res. 2019, 58, 3175–3187. [Google Scholar] [CrossRef] [Scilit]
- He, Y.; Gao, Z.; Zhang, T.; Sun, J.; Ma, Y.; Tian, N.; Gong, J. Seeding Techniques and Optimization of Solution Crystallization Processes. Org. Process Res. Dev. 2020, 24, 1839–1849. [Google Scholar] [CrossRef] [Scilit]
- Hojjati, H.; Rohani, S. Cooling and Seeding Effect on Supersaturation and Final Crystal Size Distribution (CSD) of Ammonium Sulphate in a Batch Crystallizer. Chem. Eng. Process. Process Intensif. 2005, 44, 949–957. [Google Scholar] [CrossRef] [Scilit]
- Kubota, N.; Doki, N.; Yokota, M.; Jagadesh, D. Seeding Effect on Product Crystal Size in Batch Crystallization. J. Chem. Eng. Jpn. 2002, 35, 1063–1071. [Google Scholar] [CrossRef] [Scilit]
- Peña, R.; Jarmer, D.J.; Burcham, C.L.; Nagy, Z.K. Further Understanding of Agglomeration Mechanisms in Spherical Crystallization Systems: Benzoic Acid Case Study. Cryst. Growth Des. 2019, 19, 1668–1679. [Google Scholar] [CrossRef] [Scilit]
- McCabe, W.L.; Smith, J.C.; Harriott, P. Unit Operations of Chemical Engineering, 5th ed.; McGraw-Hill: Columbus, OH, USA, 1993. [Google Scholar]
- Doki, N.; Kubota, N.; Sato, A.; Yokota, M.; Hamada, O.; Masumi, F. Scaleup Experiments on Seeded Batch Cooling Crystallization of Potassium Alum. AIChE J. 1999, 45, 2527–2533. [Google Scholar] [CrossRef] [Scilit]
- Beckmann, W. Seeding the Desired Polymorph: Background, Possibilities, Limitations, and Case Studies. Org. Process Res. Dev. 2000, 4, 372–383. [Google Scholar] [CrossRef] [Scilit]
- Ni, X. Continuous Crystallisation with Oscillatory Baffled Crystalliser Technology; Yazdanpanah, N., Nagy, Z.K., Eds.; The Royal Society of Chemistry: London, UK, 2020. [Google Scholar]
- Pickles, T.; Svoboda, V.; Marziano, I.; Brown, C.J.; Florence, A.J. Integration of a Model-Driven Workflow into an Industrial Pharmaceutical Facility: Supporting Process Development of API Crystallisation. CrystEngComm 2024, 26, 4678–4689. [Google Scholar] [CrossRef] [Scilit]
- Brown, C.J.; McGlone, T.; Yerdelen, S.; Srirambhatla, V.; Mabbott, F.; Gurung, R.; Briuglia, M.L.; Ahmed, B.; Polyzois, H.; McGinty, J.; et al. Enabling Precision Manufacturing of Active Pharmaceutical Ingredients: Workflow for Seeded Cooling Continuous Crystallisations. Mol. Syst. Des. Eng. 2018, 3, 518–549. [Google Scholar] [CrossRef] [Scilit]
- Agimelen, O.S.; Svoboda, V.; Ahmed, B.; Cardona, J.; Dziewierz, J.; Brown, C.J.; McGlone, T.; Cleary, A.; Tachtatzis, C.; Michie, C.; et al. Multi-Sensor Inline Measurements of Crystal Size and Shape Distributions during High Shear Wet Milling of Crystal Slurries. Adv. Powder Technol. 2018, 29, 2987–2995. [Google Scholar] [CrossRef] [Scilit]
- Harter, A.; Schenck, L.; Lee, I.; Cote, A. High-Shear Rotor–Stator Wet Milling for Drug Substances: Expanding Capability with Improved Scalability. Org. Process Res. Dev. 2013, 17, 1334–1335. [Google Scholar] [CrossRef] [Scilit]
- Luciani, C.V. Impact of Process Parameters on the Grinding Limit in High-Shear Wet Milling. Org. Process Res. Dev. 2018, 22, 1328–1333. [Google Scholar] [CrossRef] [Scilit]
- Yang, Y.; Ahmed, B.; Mitchell, C.; Quon, J.L.; Siddique, H.; Houson, I.; Florence, A.J.; Papageorgiou, C.D. Investigation of Wet Milling and Indirect Ultrasound as Means for Controlling Nucleation in the Continuous Crystallization of an Active Pharmaceutical Ingredient. Org. Process Res. Dev. 2021, 25, 2119–2132. [Google Scholar] [CrossRef] [Scilit]
- Bergfors, T. Seeds to Crystals. J. Struct. Biol. 2003, 142, 66–76. [Google Scholar] [CrossRef] [Scilit] [PubMed]
- Fun, H.K.; Chantrapromma, S. A Triclinic Polymorph of Hexanedioic Acid. Acta Crystallogr. Sect. E Struct. Rep. Online 2009, 65, o624. [Google Scholar] [CrossRef] [Scilit] [PubMed]
- Turner, T.D.; Dawson, N.; Edwards, M.; Pickering, J.H.; Hammond, R.B.; Docherty, R.; Roberts, K.J. A Digital Mechanistic Workflow for Predicting Solvent-Mediated Crystal Morphology: The α and β Forms of l -Glutamic Acid. Cryst. Growth Des. 2022, 22, 3042–3059. [Google Scholar] [CrossRef] [Scilit] [PubMed]
- Kee, N.C.S.; Tan, R.B.H.; Braatz, R.D. Selective Crystallization of the Metastable α-Form of L-Glutamic Acid Using Concentration Feedback Control. Cryst. Growth Des. 2009, 9, 3044–3051. [Google Scholar] [CrossRef] [Scilit]
- Dharmayat, S.; Hammond, R.B.; Lai, X.; Ma, C.; Purba, E.; Roberts, K.J.; Chen, Z.P.; Martin, E.; Morris, J.; Bytheway, R. An Examination of the Kinetics of the Solution-Mediated Polymorphic Phase Transformation between a- and β-Forms of L-Glutamic Acid as Determined Using Online Powder X-Ray Diffraction. Cryst. Growth Des. 2008, 8, 2205–2216. [Google Scholar] [CrossRef] [Scilit]
- Gaivoronskii, A.N.; Granzhan, V.A. Solubility of Adipic Acid in Organic Solvents and Water. Russ. J. Appl. Chem. 2005, 78, 404–408. [Google Scholar] [CrossRef] [Scilit]
- Mao, Z.; Sun, X.; Luan, X.; Wang, Y.; Liu, G. Measurement and Correlation of Solubilities of Adipic Acid in Different Solvents. Chin. J. Chem. Eng. 2009, 17, 473–477. [Google Scholar] [CrossRef] [Scilit]
- Mullin, J.W. Crystallisation, 4th ed.; Butterworth Heinemann: Oxford, UK, 2001. [Google Scholar]
- Sakata, Y. Studies on the Polymorphism of L-Glutamic Acid Part I: Effect of Coexisting Substance on Polymorphic Crystallization. Agric. Biol. Chem. 1961, 25, 835–837. [Google Scholar] [CrossRef] [Scilit]
- Ni, X.; Valentine, A.; Liao, A.; Sermage, S.B.C.; Thomson, C.G.; Roberts, D. On the Crystal Polymorphic Forms of L-Glutamic Acid Following Temperature Programmed Crystallisation in a Batch Oscillatory Baffled Crystalliser. Cryst. Growth Des. 2004, 4, 1129–1135. [Google Scholar] [CrossRef] [Scilit]
- Ni, X.; Liao, A. Effects of Cooling Rate and Solution Concentration on Solution Crystallisation of L-Glutamic Acid in an Oscillatory Baffled Crystalliser. Cryst. Growth Des. 2008, 8, 2875–2881. [Google Scholar] [CrossRef] [Scilit]
- Ni, X.; Liao, A. Effects of Mixing, Seeding, Material and Final Temperature on Solution Crystallisation of L-Glutamic Acid in an Oscillatory Baffled Crystalliser. Chem. Eng. J. 2010, 156, 226–233. [Google Scholar] [CrossRef] [Scilit]
- Huo, Y.; Liu, G.; Wang, X.; Ma, C.; Ni, X. On-Line Detection of Particle Agglomeration during Solution Crystallization by Microscopic Double-View Image Analysis. Ind. Eng. Chem. Res. 2017, 56, 11257–11269. [Google Scholar] [CrossRef] [Scilit]
- Nielsen, A.E. Inhibition of the Rates of Nucleation and Growth of Hexanedioic Acid Crystals by Related Compounds. Faraday Discuss. Chem. Soc. 1976, 61, 153–164. [Google Scholar] [CrossRef] [Scilit]
- Rossi, D.; Gavriilidis, A.; Kuhn, S.; Candel, M.A.; Jones, A.G.; Price, C.; Mazzei, L. Adipic Acid Primary Nucleation Kinetics from Probability Distributions in Droplet-Based Systems under Stagnant and Flow Conditions. Cryst. Growth Des. 2015, 15, 1784–1791. [Google Scholar] [CrossRef] [Scilit]
- Narducci, O.; Jones, A.G.; Kougoulos, E. Crystal Product Engineering in the Seeded Cooling Crystallization of Adipic Acid from Aqueous Solution. Org. Process Res. Dev. 2011, 15, 974–980. [Google Scholar] [CrossRef] [Scilit]
- Doki, N.; Yokota, M.; Nakamura, H.; Sasaki, S.; Kubota, N. Seeded Batch Cooling Crystallization of Adipic Acid from Ethanol Solution. J. Chem. Eng. Jpn. 2003, 36, 1001–1004. [Google Scholar] [CrossRef] [Scilit]

Disclaimer/Publisher’s Note: The statements, opinions and data contained in all publications are solely those of the individual author(s) and contributor(s) and not of MDPI and/or the editor(s). MDPI and/or the editor(s) disclaim responsibility for any injury to people or property resulting from any ideas, methods, instructions or products referred to in the content. |
© 2026 by the authors. Licensee MDPI, Basel, Switzerland. This article is an open access article distributed under the terms and conditions of the Creative Commons Attribution (CC BY) license.