


Abstract
Background: Although conventional cardiovascular risk scores are widely used, they do not fully capture the molecular mechanisms underlying vascular injury in type 2 diabetes mellitus (T2DM). This study investigated the association between the miR-34a/SIRT1 regulatory axis and cardiometabolic risk in T2DM by integrating biomarkers of inflammation, oxidative stress, and endothelial dysfunction. Methods: A cross-sectional study included 128 adults (96 with T2DM and 32 non-diabetic controls). Cardiometabolic risk was stratified using the Framingham Risk Score. Circulating miR-34a expression was quantified by RT-qPCR, whereas SIRT1 and biomarkers of inflammation (IL-6, TNF-α, and hs-CRP), oxidative stress (MDA and TAC), and endothelial dysfunction (VCAM-1 and ICAM-1) were measured using ELISA or standardized biochemical assays. Multivariate regression and receiver operating characteristic (ROC) analyses were performed. Results: Compared with medium-risk patients, individuals classified as high risk exhibited longer diabetes duration, higher body mass index, blood pressure, fasting glucose, and HbA1c levels (all p < 0.05), together with increased circulating miR-34a, inflammatory, oxidative stress, and endothelial dysfunction biomarkers, whereas SIRT1 and total antioxidant capacity were significantly reduced (all p < 0.001). These molecular alterations remained independently associated with risk after adjustment for age, sex, body mass index, smoking status, physical activity, dyslipidemia, HbA1c, and medication use. The combined biomarker model integrating miR-34a, SIRT1, hs-CRP, MDA, and VCAM-1 demonstrated excellent discriminatory performance for identifying high-risk individuals (AUC = 0.92; sensitivity = 86.4%; specificity = 85.5%). Conclusions: Cardiometabolic risk in T2DM is associated with a coordinated molecular signature characterized by miR-34a upregulation, SIRT1 suppression, systemic inflammation, oxidative stress, and endothelial dysfunction. These findings suggest that integrated biomarker profiling may complement conventional risk assessment and support future precision cardiometabolic strategies.
1. Introduction
Type 2 diabetes mellitus (T2DM) is one of the most prevalent chronic metabolic disorders worldwide and represents a major public health challenge because of its strong association with cardiovascular morbidity and mortality. Individuals with T2DM exhibit a two- to fourfold increased risk of developing cardiovascular disease (CVD), which remains the leading cause of death in this population. Even individuals with prediabetes demonstrate an increased risk of vascular complications, emphasizing the importance of early identification of cardiometabolic alterations associated with disease progression [1,2,3,4,5].
The development of cardiovascular complications in T2DM is multifactorial and involves complex interactions among chronic hyperglycemia, insulin resistance, oxidative stress, inflammation, endothelial dysfunction, and vascular remodeling. Persistent hyperglycemia promotes the formation of advanced glycation end products (AGEs), excessive production of reactive oxygen species (ROS), and activation of inflammatory pathways, which collectively contribute to endothelial injury and accelerated atherosclerosis [6,7,8]. Although conventional clinical markers such as glycated hemoglobin (HbA1c), lipid profile, and blood pressure remain important for risk assessment, they do not fully capture the molecular mechanisms underlying cardiovascular disease development in diabetic individuals. Consequently, there is growing interest in identifying circulating biomarkers that reflect the biological processes driving vascular injury and cardiovascular risk progression [1,3,9,10].
MicroRNAs (miRNAs) are small non-coding RNA molecules that regulate gene expression at the post-transcriptional level and play fundamental roles in cellular homeostasis. Among these, microRNA-34a (miR-34a) has emerged as a multifunctional regulator involved in apoptosis, cellular senescence, oxidative stress, inflammation, and metabolic regulation. Dysregulated miR-34a expression has been reported in several pathological conditions, including cancer, chronic inflammatory diseases, cardiovascular disorders, and age-related tissue dysfunction [11,12,13]. In oncology, miR-34a has been extensively characterized as a tumor suppressor involved in cell-cycle regulation and apoptosis, whereas in inflammatory and cardiovascular diseases it has been associated with endothelial dysfunction, vascular aging, oxidative stress, and tissue injury [12,13,14].
In the context of diabetes, elevated miR-34a expression has been associated with insulin resistance, pancreatic β-cell dysfunction, impaired insulin secretion, and vascular complications [13,15,16,17]. Experimental studies have demonstrated that miR-34a promotes β-cell apoptosis through modulation of anti-apoptotic pathways and contributes to metabolic dysregulation by targeting proteins involved in insulin signaling [13,15]. More importantly, accumulating evidence indicates that miR-34a may directly contribute to diabetic vascular injury through suppression of sirtuin 1 (SIRT1), a critical regulator of endothelial homeostasis [10,18,19].
SIRT1 is a nicotinamide adenine dinucleotide (NAD+)-dependent deacetylase that exerts pleiotropic protective effects on the cardiovascular system. Through regulation of endothelial nitric oxide synthase (eNOS), mitochondrial function, oxidative stress responses, inflammatory signaling pathways, and cellular senescence, SIRT1 plays a central role in maintaining vascular integrity and endothelial function [20,21,22,23]. Experimental studies have shown that increased miR-34a expression suppresses SIRT1 activity, resulting in reduced nitric oxide bioavailability, increased oxidative stress, endothelial dysfunction, and activation of pro-inflammatory pathways [18,24,25]. These mechanisms have been implicated in the progression of atherosclerosis and diabetic vascular complications, suggesting that dysregulation of the miR-34a/SIRT1 axis may represent an important molecular link between metabolic disturbances and cardiovascular disease [13,18,19,22].
Recent evidence further supports the concept that integrated molecular biomarker panels may improve cardiovascular risk prediction beyond traditional clinical variables [26,27,28]. Biomarkers reflecting inflammation, oxidative stress, endothelial dysfunction, and microRNA-mediated regulation may provide a more comprehensive assessment of the biological processes driving cardiovascular risk in individuals with T2DM. However, despite increasing evidence regarding the individual roles of miR-34a and SIRT1, the relationship between the circulating miR-34a/SIRT1 regulatory axis and the broader network of inflammatory, oxidative, and endothelial biomarkers remains incompletely characterized in the context of cardiovascular risk stratification.
Therefore, the present study aimed to investigate circulating miR-34a expression and its regulatory target SIRT1 in individuals with T2DM and to evaluate their association with cardiovascular risk categories defined by the Framingham Risk Score. In addition, inflammatory mediators (IL-6, TNF-α, and hs-CRP), oxidative stress markers (malondialdehyde and total antioxidant capacity), and endothelial dysfunction biomarkers (VCAM-1 and ICAM-1) were assessed to characterize the integrated molecular profile associated with cardiovascular risk. We hypothesized that dysregulation of the miR-34a/SIRT1 axis is associated with increased cardiovascular risk and reflects a coordinated network of metabolic, inflammatory, oxidative, and vascular alterations in T2DM.
2. Materials and Methods
2.1. Patients’ Samples
A total of 128 adults were enrolled in this cross-sectional study, comprising 96 patients diagnosed with type 2 diabetes mellitus (T2DM) and 32 metabolically healthy individuals who served as the control group. Participant recruitment was conducted consecutively between July 2022 and December 2024 at the Ambulatory of Stomatological Diseases of the Southwest of Goiás (ADESGO), through a collaborative initiative involving the Federal University of Jataí (UFJ), the Municipal Health Secretariat of Jataí, Goiás, and accredited private clinical laboratories. Consecutive enrollment of eligible volunteers was adopted to minimize selection bias and to ensure that the study population reflected routine clinical practice.
Eligible participants were at least 18 years of age, capable of providing fasting blood samples, and willing to participate by signing an informed consent form. Individuals assigned to the T2DM group had a previous clinical diagnosis of type 2 diabetes established according to the American Diabetes Association (ADA) criteria. Control participants presented fasting plasma glucose concentrations below 100 mg/dL and had no history of diabetes or other chronic metabolic disorders.
Participants were excluded if they were pregnant or breastfeeding, had type 1 diabetes mellitus, active infectious or inflammatory conditions, malignant disease, chronic kidney disease stage III or higher, or were receiving corticosteroid or immunosuppressive treatment. Samples showing hemolysis or insufficient plasma volume, as well as participants with incomplete clinical or laboratory information, were also excluded from the analyses.
The required sample size was estimated before participant recruitment using G*Power version 3.1. Calculations were based on a two-sided t-test, assuming an effect size (Cohen’s d) of 0.60 for differences in circulating miR-34a expression, a significance level of 5%, and statistical power of 80%. Under these assumptions, at least 108 participants were required. The inclusion of 128 individuals exceeded this minimum requirement, providing adequate statistical power for the planned analyses.
The study protocol complied with the ethical principles established in the Declaration of Helsinki and received approval from the Research Ethics Committee (CAAE: 69791717.0.0000.5083; approval date: 19 September 2017). All volunteers provided written informed consent before any study-related procedures were performed. Because this investigation followed an observational cross-sectional design, registration as a clinical trial was not applicable. The study design, conduct, and reporting adhered to the recommendations of the Strengthening the Reporting of Observational Studies in Epidemiology (STROBE) Statement.
2.2. Clinical, Anthropometric and Metabolic Assessments
Clinical information, anthropometric measurements, and routine biochemical data were obtained from participant evaluations and medical records whenever available. Body weight, height, and waist circumference were measured at the time of enrollment using standardized procedures. Venous blood was collected after an overnight fast of 12–14 h. Before sample collection, participants were advised to abstain from alcohol consumption for at least 72 h and to avoid strenuous exercise to minimize potential influences on biochemical and molecular measurements.
Cardiovascular risk among individuals with T2DM was estimated using the Framingham Risk Score proposed by Wilson et al. (1998) [29], which combines demographic and clinical variables, including age, sex, total cholesterol, HDL cholesterol, systolic blood pressure, antihypertensive therapy, smoking status, and diabetes, to estimate the probability of developing coronary heart disease over the subsequent 10 years. Based on the calculated score, participants were classified as low (<10%), intermediate (10–20%), or high (>20%) cardiovascular risk.
Risk stratification was performed only for participants with T2DM. Individuals in the control group were included exclusively as a reference population for molecular and biochemical analyses and were therefore not assigned to Framingham risk categories. Consequently, all comparative analyses considered controls independently from the intermediate- and high-risk diabetic groups.
Habitual physical activity was evaluated using the short version of the International Physical Activity Questionnaire (IPAQ), previously validated by Matsudo et al. (2001) [30]. Weekly energy expenditure was expressed as metabolic equivalent minutes (MET-min/week) by applying standard conversion factors of 3.3 METs for walking, 4.0 METs for moderate-intensity activities, and 8.0 METs for vigorous-intensity activities. According to established IPAQ criteria, participants were categorized as having low (<600 MET-min/week), moderate (600–3000 MET-min/week), or high (>3000 MET-min/week) levels of physical activity.
Additional clinical information, including smoking habits, dyslipidemia, and ongoing pharmacological treatment, was retrieved from medical records and confirmed through structured interviews whenever possible. These variables were considered potential confounding factors and were incorporated into multivariable statistical models when complete information was available.
Only a limited number of diabetic participants met the criteria for the low cardiovascular risk category. Because this subgroup was too small to support reliable statistical comparisons, it was not analyzed separately. Consequently, subsequent analyses focused on the intermediate- and high-risk T2DM groups, thereby improving the robustness and statistical power of the comparisons.
Information regarding antidiabetic medications was collected from clinical records and participant interviews. The distribution of pharmacological therapies according to cardiovascular risk category is summarized in Supplementary Table S1.
2.3. microRNAs and RNA Isolation
Circulating RNA, including microRNAs, was extracted from 500 μL of plasma using the Norgen® Plasma/Serum Circulating and Exosomal RNA Purification Kit (Norgen Biotek Corp., Thorold, ON, Canada) following the recommended extraction procedure. During RNA isolation, an exogenous U6 small nuclear RNA (GenBank accession NM-001207056) was incorporated as an internal reference to monitor extraction efficiency and normalize downstream analyses. Purified RNA was recovered in 100 μL of the supplied elution buffer.
Total RNA from peripheral blood cells was independently isolated with TRIzol® reagent (Invitrogen, Carlsbad, CA, USA). Approximately 1 μg of RNA was subsequently reverse-transcribed into complementary DNA (cDNA) using the High-Capacity cDNA Reverse Transcription Kit (Thermo Fisher Scientific, Waltham, MA, USA).
Expression of miR-34a was determined by quantitative real-time PCR (RT-qPCR) using TaqMan™ Universal PCR Master Mix II (No UNG, Thermo Fisher Scientific). Amplification reactions were prepared in a final volume of 20 μL and analyzed on an Applied Biosystems 7500 Real-Time PCR System (Applied Biosystems, Foster City, CA, USA). The thermal profile consisted of an initial activation step at 95 °C for 10 min, followed by 40 amplification cycles of denaturation at 95 °C for 15 s and annealing/extension at 60 °C for 60 s.
Specific detection of hsa-miR-34a-5p was achieved using the corresponding TaqMan™ MicroRNA Assay (Assay ID 000426) (Applied Biosystems, Foster City, CA, USA), whereas U6 snRNA (Assay ID 001973) served as the endogenous reference for normalization. Each biological sample was analyzed in triplicate, and non-template controls were included in every experimental run to verify the absence of reagent contamination or nonspecific amplification. Relative miRNA expression was calculated using the comparative 2−ΔΔCq method after normalization against U6 snRNA.
The primer and probe sequences were not reported because the assays employed are commercially available TaqMan™ products with proprietary oligonucleotide designs. Instead, the manufacturer assay identification numbers are provided to facilitate methodological reproducibility.
To minimize potential analytical bias, all molecular procedures—including RNA isolation, reverse transcription, and RT-qPCR analyses—were performed by investigators who were unaware of participants’ clinical characteristics and cardiovascular risk classification through sample processing and data acquisition.
2.4. Protein Biomarkers by Enzyme-Linked Immunosorbent Assay (ELISA)
Venous blood was obtained from participants following an overnight fast of 12–14 h using EDTA-containing collection tubes (BD Vacutainer®, Becton, Dickinson and Company, Franklin Lakes, NJ, USA). Plasma was separated within one hour after collection by centrifugation at 1500× g for 15 min at 4 °C. Following careful removal of the plasma fraction to avoid contamination with blood cells, aliquots ranging from 200 to 500 μL were prepared and immediately stored at −80 °C until laboratory analyses. To preserve protein integrity, each aliquot was thawed only once immediately before analysis. Samples were gently homogenized after thawing and inspected for visible evidence of hemolysis; specimens showing hemolysis were excluded from subsequent analyses.
Plasma concentrations of SIRT1, IL-6, TNF-α, high-sensitivity C-reactive protein (hs-CRP), vascular cell adhesion molecule-1 (VCAM-1), and intercellular adhesion molecule-1 (ICAM-1) were determined using commercially available high-sensitivity sandwich ELISAs. The assays employed were the Human SIRT1 ELISA Kit (Abcam, Cambridge, UK; Cat. No. ab171573), Human IL-6 Quantikine HS ELISA Kit (R&D Systems, Minneapolis, MN, USA; Cat. No. HS600B), Human TNF-α Quantikine HS ELISA Kit (R&D Systems; Cat. No. HSTA00E), Human hs-CRP ELISA Kit (Thermo Fisher Scientific, Waltham, MA, USA; Cat. No. EHCRP), Human VCAM-1/CD106 Quantikine ELISA Kit (R&D Systems; Cat. No. DVC00), and Human ICAM-1/CD54 Quantikine ELISA Kit (R&D Systems; Cat. No. DCD540). All assays were performed in accordance with the manufacturers’ recommended procedures.
The SIRT1 assay used in this study provides a quantitative detection interval of 0.63–40 ng/mL with a reported analytical sensitivity of approximately 0.132 ng/mL. Plasma SIRT1 concentrations measured in the control group (3.41 ± 0.43 ng/mL) served as the reference values for comparisons with diabetic participants classified according to cardiovascular risk.
Calibration curves for each biomarker were generated using seven serial dilutions of the supplied recombinant standards, and analyte concentrations were interpolated by four-parameter logistic (4-PL) regression. Absorbance readings were acquired at 450 nm with wavelength correction at 570 nm using a BioTek Synergy HTX Multi-Mode Microplate Reader (Agilent Technologies, Santa Clara, CA, USA).
Preliminary optimization experiments were performed to define the most appropriate sample dilution for each biomarker. Based on these experiments, plasma samples were analyzed after dilution at ratios of 1:2 for SIRT1, 1:100 for hs-CRP, and 1:50 for VCAM-1 and ICAM-1, whereas IL-6 and TNF-α were quantified using undiluted plasma. Dilutions were prepared with the corresponding assay buffers supplied with each kit.
Every sample was analyzed in triplicate, and the average of the three measurements was used for statistical analyses. Analytical precision within each assay was evaluated through the coefficient of variation (CV), calculated for each set of triplicate measurements. Replicates with a CV exceeding 10% were repeated. In addition, internal quality-control samples were included on every microplate to monitor assay performance, maintaining inter-assay variability below 12% for all biomarkers.
To reduce possible plate-to-plate variation, samples from controls and diabetic participants representing different cardiovascular risk categories were randomly distributed across assay plates. Laboratory personnel responsible for ELISA measurements remained blind to the clinical characteristics and cardiovascular risk classification of all participants throughout the analytical procedures. Blank wells and internal quality-control samples were incorporated into each experimental run to verify assay consistency and analytical reliability.
2.5. Oxidative Stress Markers—Malondialdehyde (MDA)
Lipid peroxidation was assessed by quantifying plasma malondialdehyde (MDA), a widely used indicator of oxidative damage, through the thiobarbituric acid reactive substances (TBARS) method. Measurements were performed with a commercially available TBARS Assay Kit (Cayman Chemical, Ann Arbor, MI, USA; Cat. No. 10009055).
For each determination, 100 μL of plasma was combined with sodium dodecyl sulfate and thiobarbituric acid reagents under acidic conditions to promote the formation of MDA–TBA adducts. The reaction mixture was heated at 95 °C for 60 min and subsequently cooled on ice for approximately 10 min. After centrifugation at 1600× g for 10 min to remove precipitated proteins, the clarified supernatant was transferred to a 96-well microplate for spectrophotometric analysis.
Optical density was recorded at 532 nm using a BioTek Synergy HTX Multi-Mode Microplate Reader (Agilent Technologies, Santa Clara, CA, USA). Quantification of MDA was based on a calibration curve prepared from seven serial dilutions of 1,1,3,3-tetramethoxypropane (TMP), the reference precursor for MDA. Sample concentrations were obtained by linear interpolation of the standard curve and expressed as nmol/mL of plasma.
According to the assay specifications, the analytical detection limit was 0.1 μM, with a working range extending from 0.1 to 20 μM. All plasma samples were analyzed in triplicate to improve measurement reliability. Analytical reproducibility was monitored by calculating the coefficient of variation (CV) for each set of replicates. Measurements showing a CV greater than 10% were repeated, while overall inter-assay variability remained below 12% throughout the study.
2.6. Oxidative Stress Markers—Total Antioxidant Capacity (TAC)
The antioxidant status of plasma samples was evaluated by measuring total antioxidant capacity (TAC) using a ferric reducing antioxidant power (FRAP) assay with a commercial Total Antioxidant Capacity Assay Kit (Abcam, Cambridge, UK; Cat. No. ab65329). This colorimetric method estimates the overall reducing capacity of biological samples by quantifying the conversion of ferric (Fe3+) ions into ferrous (Fe2+) ions in an acidic environment. The newly generated Fe2+ ions subsequently react with 2,4,6-tripyridyl-s-triazine (TPTZ), producing a blue-colored complex whose intensity is directly proportional to the antioxidant capacity of the sample.
For each determination, 20 μL of plasma was incubated with 180 μL of freshly prepared FRAP reagent composed of acetate buffer (300 mM, pH 3.6), TPTZ solution (10 mM prepared in 40 mM HCl), and ferric chloride (FeCl3·6H2O, 20 mM). The reaction mixture was maintained at 37 °C for 30 min under light-protected conditions before absorbance measurements were obtained.
Optical density was recorded at 593 nm using a BioTek Synergy HTX Multi-Mode Microplate Reader (Agilent Technologies, Santa Clara, CA, USA). TAC values were calculated from a calibration curve prepared with Trolox standards ranging from 0 to 2.0 mM and expressed as millimoles of Trolox equivalents per liter (mmol TE/L).
The assay exhibited an analytical sensitivity of 0.05 mmol/L and a working measurement interval of 0.05–2.0 mmol/L. Each plasma sample was analyzed in triplicate, and the average value was considered for subsequent statistical analyses. Analytical precision was monitored by calculating the coefficient of variation for replicate measurements, maintaining intra-assay variability below 8%. Internal quality-control samples included on every assay plate confirmed assay reproducibility throughout the study, with inter-assay coefficients of variation consistently remaining below 10%.
2.7. Statistical Analysis of Biomarkers
Statistical analyses were conducted using GraphPad Prism version 8.0.0 for Windows (GraphPad Software, San Diego, CA, USA). Prior to inferential testing, the distribution of continuous variables was evaluated using the Shapiro–Wilk normality test, complemented by visual examination of histograms and quantile–quantile (Q–Q) plots. Homogeneity of variances was verified using Levene’s test.
Variables with a Gaussian distribution are presented as mean ± standard deviation (SD), whereas skewed data are reported as median with the corresponding interquartile range (IQR). Comparisons between two independent groups were performed using the unpaired Student’s t-test when parametric assumptions were satisfied or the Mann–Whitney U test for non-normally distributed variables.
Differences among the three study groups (Control, T2DM–Medium Risk, and T2DM–High Risk) were examined using one-way analysis of variance (ANOVA) followed by Tukey’s multiple-comparison test for normally distributed variables. When distributional assumptions were not fulfilled, the Kruskal–Wallis test with Dunn’s post hoc correction was applied instead. To minimize false-positive findings resulting from multiple biomarker comparisons, p-values were additionally adjusted using the Benjamini–Hochberg false discovery rate (FDR) procedure whenever appropriate.
Relationships among circulating miR-34a expression, SIRT1 concentrations, inflammatory cytokines, oxidative stress markers, endothelial dysfunction biomarkers, and cardiovascular risk scores were explored by correlation analysis. Pearson’s correlation coefficient was used for variables exhibiting normal distributions, whereas Spearman’s rank correlation coefficient was applied to non-parametric data. Correlation strength was interpreted according to conventional criteria as weak (r < 0.30), moderate (r = 0.30–0.60), or strong (r > 0.60).
To determine whether the miR-34a/SIRT1 regulatory axis was independently associated with cardiovascular risk, multivariable linear regression models were constructed after adjustment for clinically relevant covariates, including age, sex, body mass index, smoking status, physical activity level (IPAQ classification), dyslipidemia, glycated hemoglobin (HbA1c), and pharmacological treatment whenever these data were available. Regression coefficients (β) and their corresponding 95% confidence intervals (95% CI) were calculated for each model.
The discriminatory capacity of the evaluated biomarkers for identifying individuals with high cardiovascular risk was further investigated using binary logistic regression, considering medium- and high-risk T2DM participants as the outcome categories. Odds ratios (ORs) and 95% confidence intervals were estimated for each model.
Receiver operating characteristic (ROC) curve analysis was subsequently performed to examine the diagnostic performance of individual biomarkers as well as the integrated biomarker panel for distinguishing participants with high cardiovascular risk (Framingham score >20%) from those classified as intermediate risk (10–20%). Diagnostic accuracy was summarized by calculating the area under the ROC curve (AUC) with corresponding 95% confidence intervals. Optimal decision thresholds were established using the Youden index, and the resulting sensitivity and specificity values were determined for each biomarker and for the combined predictive model. Comparisons among ROC models were based primarily on AUC values, with larger AUCs indicating greater discriminatory performance. Statistical significance was established at a two-sided p-value < 0.05.
3. Results
3.1. Clinical, Anthropometric, and Metabolic Characteristics
Clinical, anthropometric, and metabolic characteristics of study participants are presented in Table 1. Compared with non-diabetic controls, individuals with T2DM exhibited higher BMI, fasting glucose, HbA1c levels, systolic and diastolic blood pressure, and a greater prevalence of dyslipidemia, smoking, physical inactivity, hepatic steatosis, and obesity. Among participants with T2DM, those classified as high cardiovascular risk were significantly older and had a longer duration of diabetes than individuals in the medium-risk group. High-risk individuals also exhibited significantly higher BMI, systolic and diastolic blood pressure, fasting glucose, and HbA1c levels. In addition, dyslipidemia, current smoking, physical inactivity, hepatic steatosis, and obesity were more prevalent among high-risk patients. These findings indicate that greater cardiovascular risk in T2DM is associated with longer disease duration, poorer glycemic control, increased adiposity, elevated blood pressure, and a higher burden of adverse cardiometabolic and lifestyle-related risk factors.
Table 1.
Clinical, anthropometric, and metabolic characteristics of study participants according to cardiovascular risk stratification *.
Pharmacological treatment characteristics are summarized in Supplementary Table S1. Metformin was the most frequently prescribed antidiabetic medication in both cardiovascular risk groups. Insulin therapy was more common among individuals classified as high cardiovascular risk, whereas the use of sulfonylureas and SGLT2 inhibitors showed similar distributions between groups.
3.2. miR-34a Expression According to Cardiovascular Risk
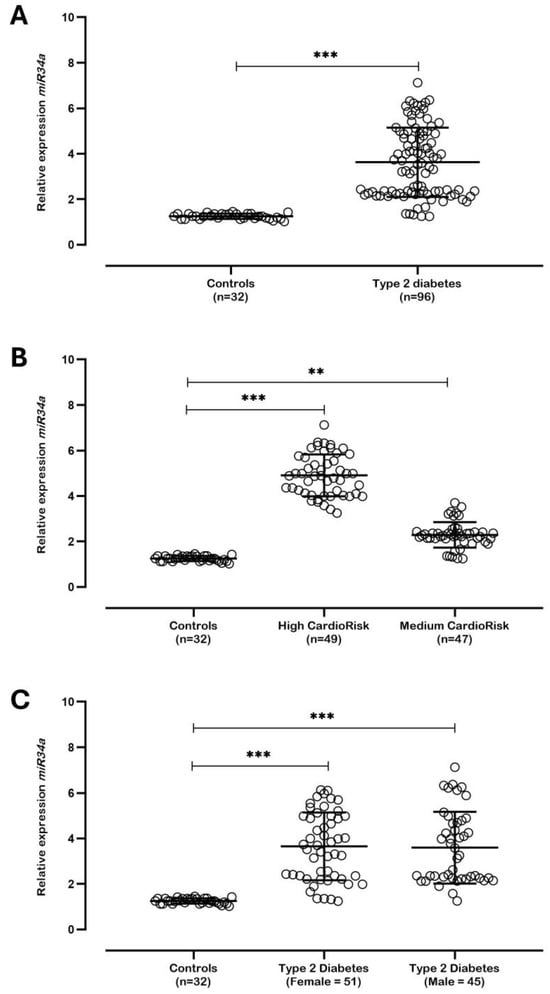
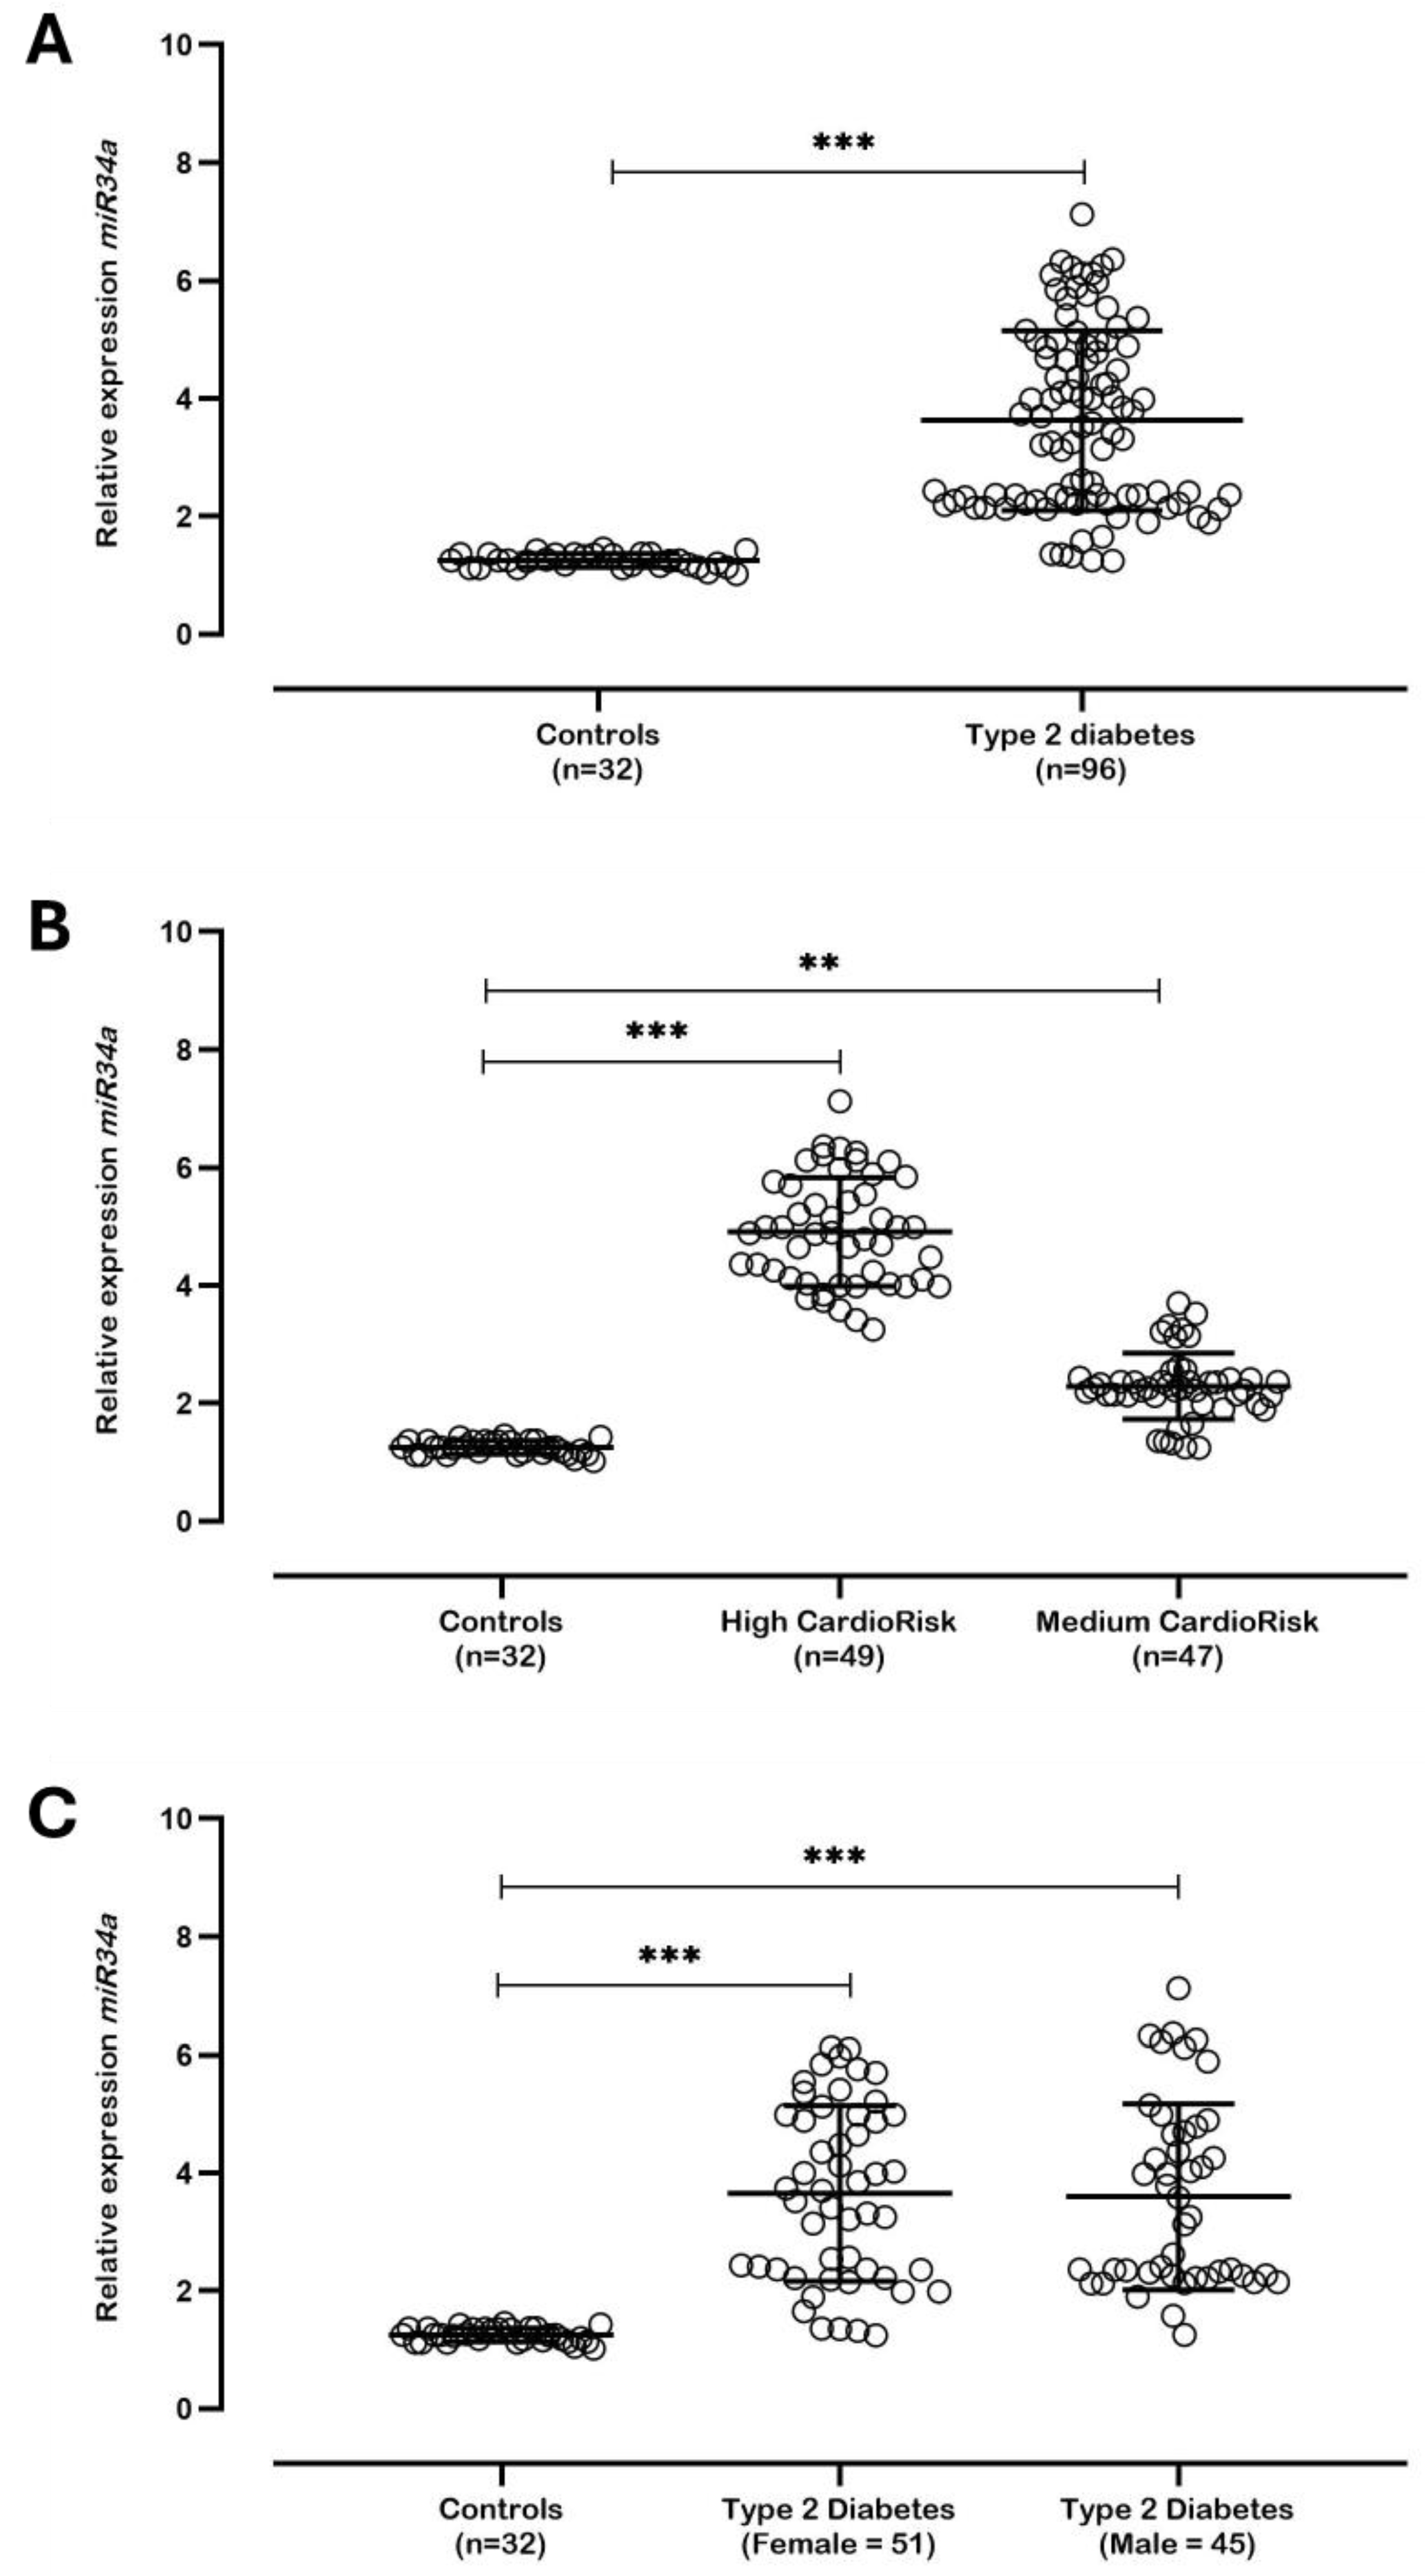
In this study, individuals with type 2 diabetes exhibited significantly higher miR-34a levels compared to non-diabetic controls (p < 0.001), consistent with their association with inflammatory and metabolic dysregulation in diabetes (Figure 1A). Among diabetic individuals, those classified as “T2DM High Risk” showed significantly elevated miR-34a levels compared to the “T2DM Medium Risk group and non-diabetic controls, highlighting its potential as a biomarker for cardiovascular complications (Figure 1B). This is consistent with evidence linking higher miR-34a levels to severe cardiovascular conditions, likely driven by increased endothelial stress and systemic inflammation. Sex-stratified analysis is presented in Figure 1C. No mechanistic inference was made from this comparison due to the exploratory nature of the analysis (Figure 1C). Non-diabetic controls exhibited the lowest miR-34a levels, representing normal physiological conditions.
Figure 1.
Differential expression of miR-34a across diabetic subgroups and clinical stratifications. (A) Relative expression levels of miR-34a in non-diabetic controls (n = 32) compared to individuals with type 2 diabetes mellitus (T2DM; n = 96). (B) Stratified analysis of miR-34a expression among controls and T2DM individuals categorized according to cardiovascular risk as medium and high risk. (C) Sex-based comparison of miR-34a expression between controls and T2DM individuals, stratified by gender. Statistical comparisons were performed using the Mann–Whitney U test (panel (A)) and Kruskal–Wallis test followed by Dunn’s multiple-comparison post hoc test (panels (B,C)). Horizontal brackets indicate pairwise comparisons. Statistical significance is represented as ** p < 0.01, *** p < 0.001.
3.3. Integrated Molecular Biomarker Profile
An integrated analysis of molecular biomarkers revealed a progressive deterioration of the cardiometabolic profile across cardiovascular risk categories. Individuals classified as high cardiovascular risk exhibited significantly higher circulating miR-34a expression, inflammatory mediators (IL-6, TNF-α, and hs-CRP), oxidative stress marker levels (MDA), and endothelial dysfunction markers (VCAM-1 and ICAM-1), accompanied by a marked reduction in SIRT1 concentrations and total antioxidant capacity (TAC) (all p < 0.001) (Table 2).
Table 2.
Integrated molecular biomarkers according to cardiovascular risk stratification in type 2 diabetes mellitus (T2DM) *.
A progressive and statistically significant molecular deterioration was observed across cardiovascular risk categories (Controls → T2DM Medium Risk → T2DM High Risk; all p < 0.001) (Table 2). Circulating miR-34a expression increased markedly according to cardiovascular risk status, rising from 1.24 ± 0.18-fold in controls to 2.41 ± 0.52-fold in the medium-risk group and reaching 4.78 ± 1.01-fold in high-risk individuals (Table 2). Conversely, SIRT1 concentrations demonstrated a progressive decline, decreasing from 3.41 ± 0.43 ng/mL in controls to 2.45 ± 0.42 ng/mL in medium-risk patients and 1.67 ± 0.37 ng/mL in high-risk patients (Table 2). This inverse relationship supports the existence of a dysregulated miR-34a/SIRT1 regulatory axis associated with cardiovascular risk progression.
Inflammatory biomarkers exhibited a similar graded response (Table 2). IL-6 levels increased from 1.82 ± 0.54 pg/mL in controls to 3.45 ± 0.78 pg/mL and 5.12 ± 1.05 pg/mL in the medium- and high-risk groups, respectively. Likewise, TNF-α concentrations increased progressively from 2.95 ± 0.72 pg/mL in controls to 4.88 ± 0.94 pg/mL and 6.73 ± 1.12 pg/mL in the medium- and high-risk groups. The most pronounced inflammatory change was observed for hs-CRP, which increased more than fivefold between controls (1.21 ± 0.63 mg/L) and high-risk T2DM individuals (6.42 ± 1.75 mg/L) (Table 2), indicating substantial systemic inflammatory burden and reinforcing the association between inflammation and cardiovascular risk severity.
Analysis of oxidative stress biomarkers revealed significant redox imbalance accompanying cardiovascular risk progression (Table 2). Plasma MDA concentrations increased from 2.10 ± 0.42 nmol/mL in controls to 3.48 ± 0.63 nmol/mL in medium-risk individuals and 4.92 ± 0.81 nmol/mL in the high-risk group. In contrast, total antioxidant capacity exhibited an inverse trend, decreasing from 1.78 ± 0.28 mmol Trolox equivalents/L in controls to 1.32 ± 0.24 mmol/L and 0.94 ± 0.19 mmol/L in medium- and high-risk patients, respectively (Table 2). These findings indicate progressive oxidative stress and impaired antioxidant defense mechanisms in individuals with elevated cardiovascular risk.
Markers of endothelial dysfunction also increased significantly across cardiovascular risk categories (Table 2). VCAM-1 concentrations increased from 471.4 ± 66.2 ng/mL in controls to 784.2 ± 89.7 ng/mL in medium-risk individuals and 1047.3 ± 117.8 ng/mL in high-risk patients. Similarly, ICAM-1 levels rose from 219.1 ± 31.2 ng/mL in controls to 364.5 ± 54.7 ng/mL and 466.8 ± 45.8 ng/mL in the medium- and high-risk groups, respectively (Table 2). These findings indicate progressive endothelial activation and vascular injury associated with increasing cardiovascular risk.
Importantly, the increase in inflammatory, oxidative stress, and endothelial dysfunction markers paralleled the pattern observed for miR-34a expression and SIRT1 suppression (Table 2), suggesting convergence of multiple pathophysiological pathways involved in cardiovascular disease development in T2DM. Collectively, these results demonstrate that individuals classified as high cardiovascular risk exhibit a coordinated molecular profile characterized by miR-34a upregulation, SIRT1 suppression, systemic inflammation, oxidative stress, and endothelial dysfunction. The convergence of these pathways supports the hypothesis that the miR-34a/SIRT1 axis may represent an important molecular pathway associated with cardiovascular risk in T2DM, linking metabolic dysregulation to cardiovascular vulnerability.
Importantly, the observed molecular alterations were not limited to comparisons between diabetic and non-diabetic individuals. Significant differences were detected between medium- and high-risk T2DM groups, demonstrating the ability of the evaluated biomarkers to discriminate distinct cardiovascular risk profiles within the diabetic population itself. These findings suggest that integrated molecular profiling may provide additional prognostic information beyond conventional clinical risk assessment tools.
To determine whether the observed molecular alterations were independently associated with cardiovascular risk, a multivariate regression analysis was performed adjusting for age, sex, body mass index, smoking status, physical activity level, dyslipidemia, HbA1c levels, and medication use when available. Increased miR-34a expression, hs-CRP, MDA, and VCAM-1 levels remained independently associated with higher cardiovascular risk, whereas SIRT1 concentrations remained inversely associated with cardiovascular risk after adjustment (Table 3). These findings indicate that dysregulation of the miR-34a/SIRT1 axis contributes to cardiovascular risk independently of major demographic and clinical confounding factors.
Table 3.
Multivariate regression analysis of factors independently associated with cardiovascular risk in individuals with type 2 diabetes mellitus.
3.4. Predictive Performance of Biomarkers for Cardiovascular Risk Stratification
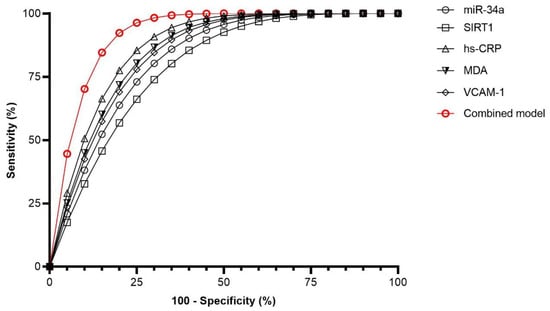
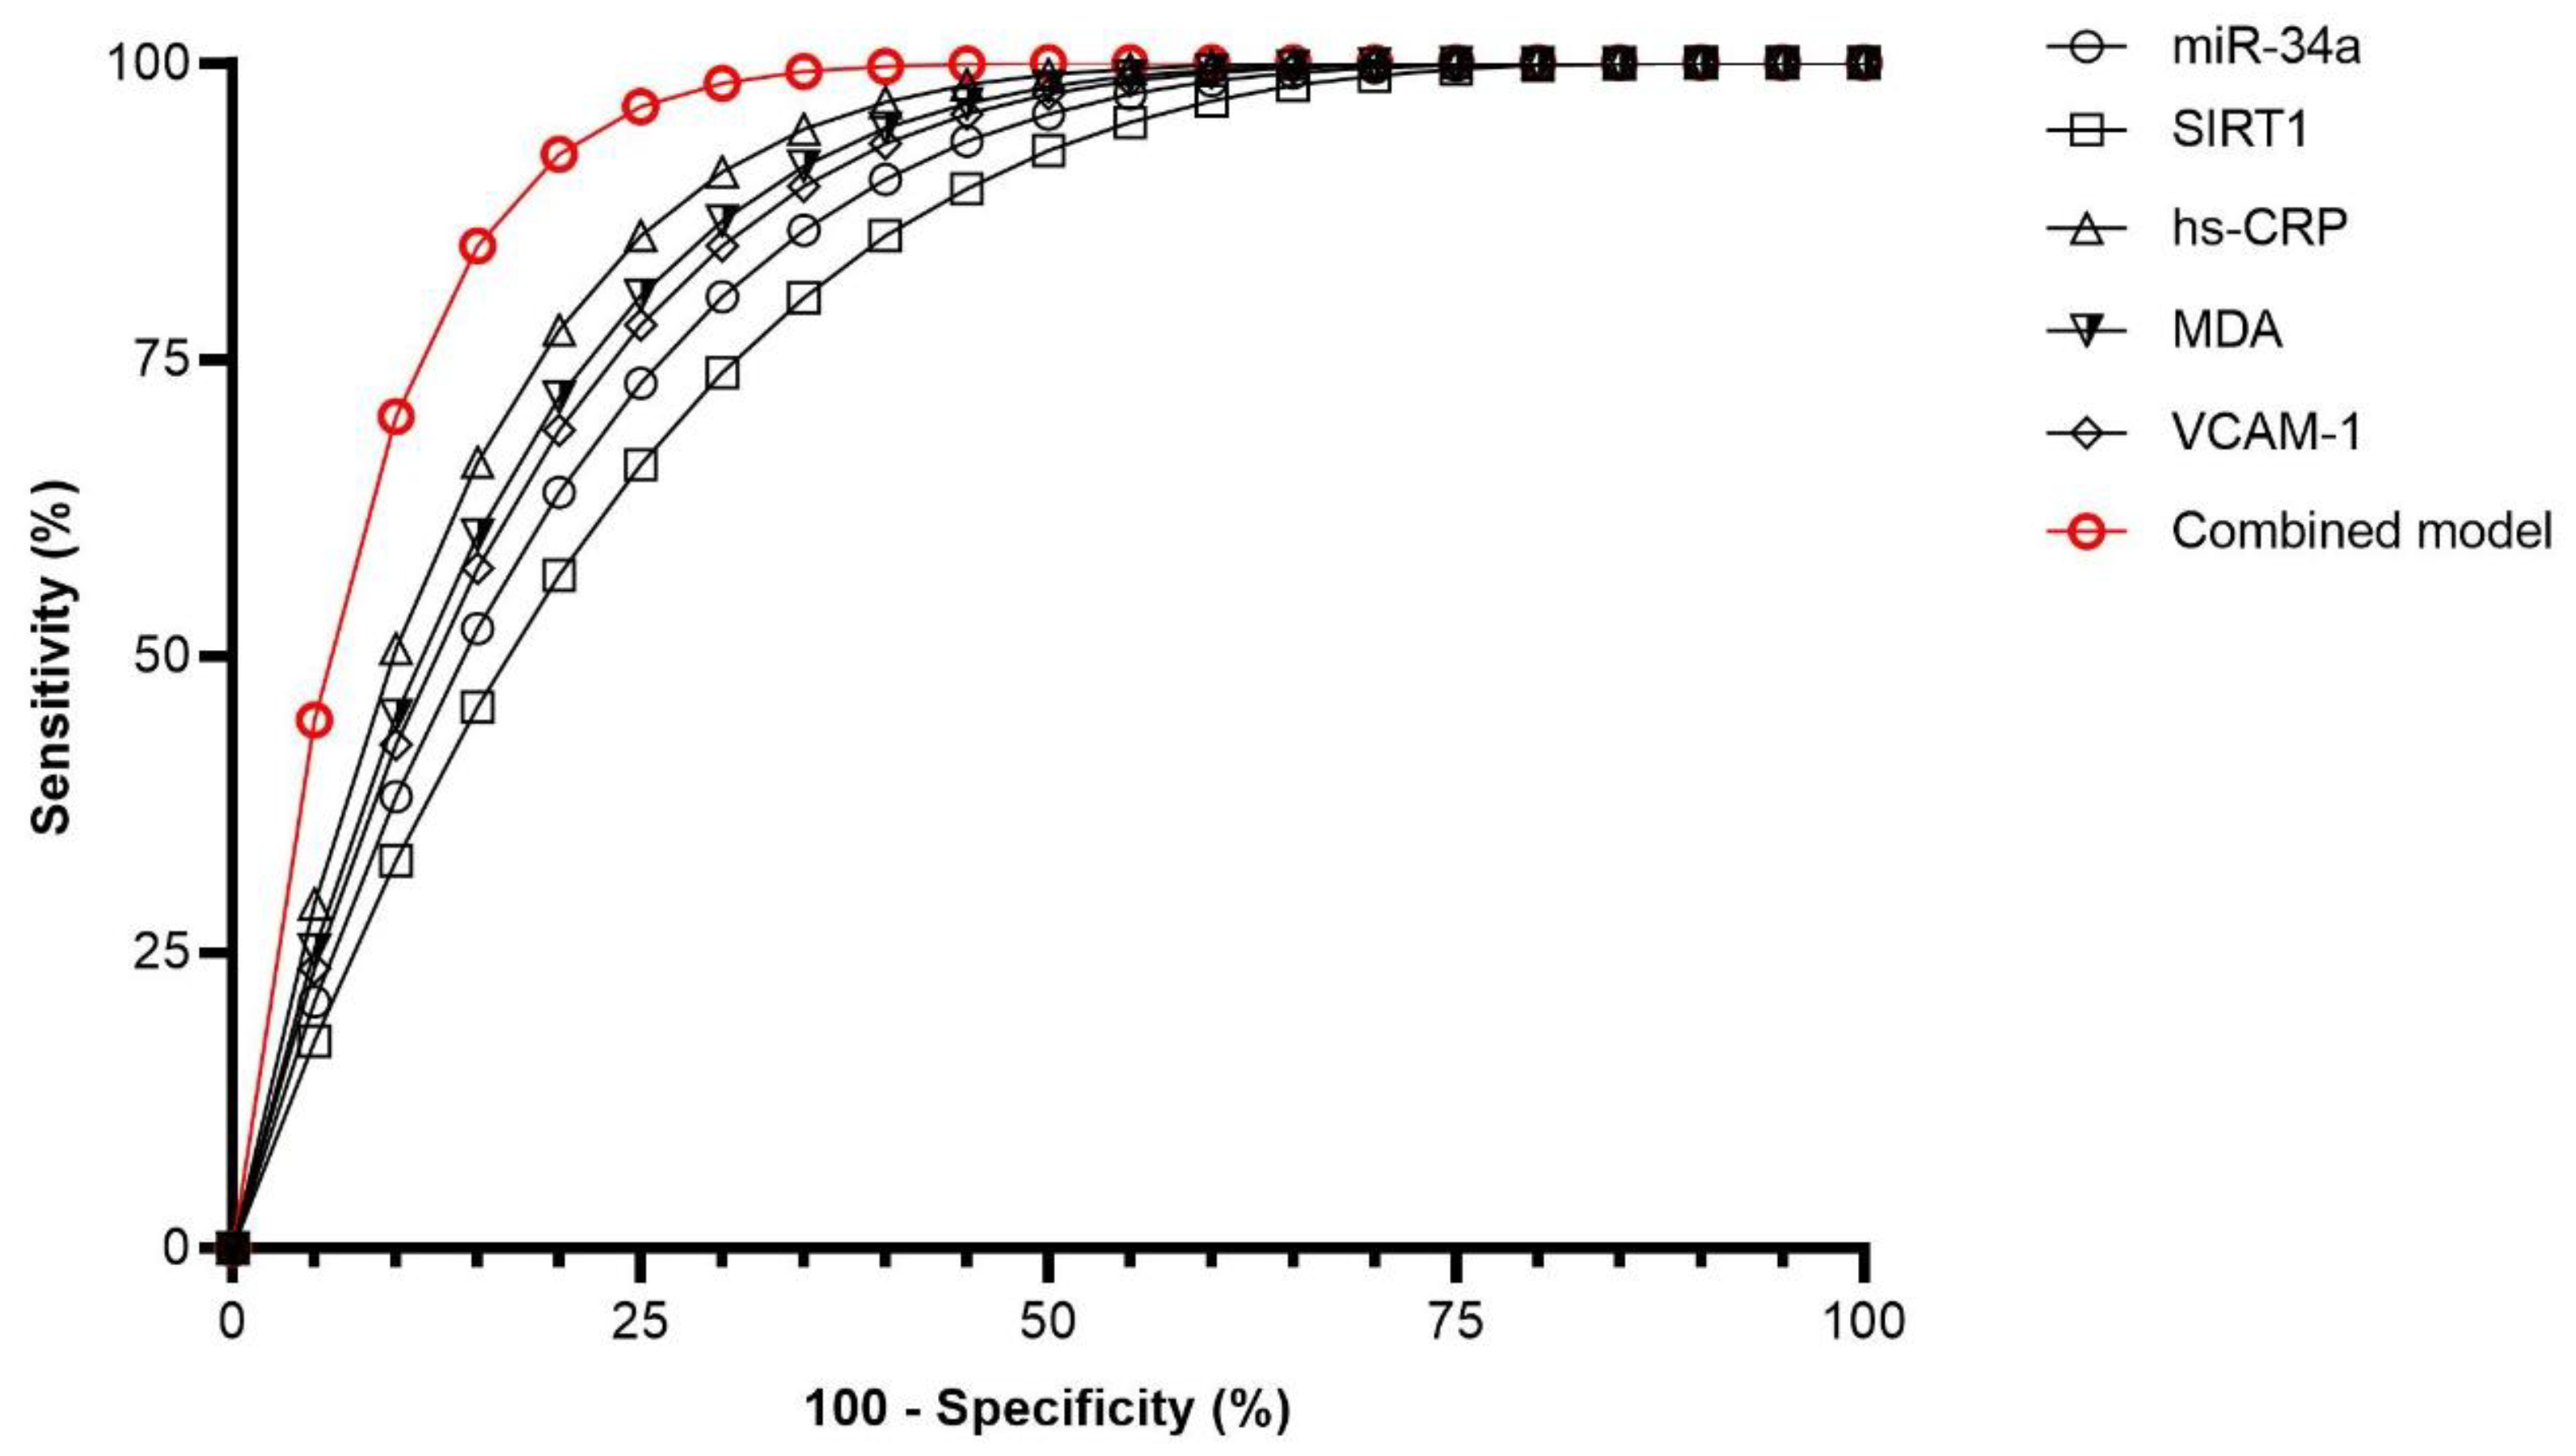
ROC curve analysis demonstrated that all evaluated biomarkers exhibited discriminatory capacity for identifying high cardiovascular risk among individuals with T2DM (Figure 2; Table 4). The combined model integrating miR-34a, SIRT1, hs-CRP, MDA, and VCAM-1 achieved the highest predictive performance (AUC = 0.92), exceeding all individual biomarkers. Detailed performance metrics, including AUCs, confidence intervals, cut-off values, sensitivity, specificity, and Youden indices, are presented in Table 4.
Figure 2.
Receiver operating characteristic (ROC) curve analysis for prediction of high cardiovascular risk in individuals with type 2 diabetes mellitus (T2DM). ROC curves were generated to evaluate the discriminatory performance of individual biomarkers and an integrated biomarker model for distinguishing high cardiovascular risk (Framingham score ≥20%) from medium cardiovascular risk (Framingham score 10–20%) among individuals with T2DM. The combined model integrating miR-34a, SIRT1, hs-CRP, MDA, and VCAM-1 demonstrated the highest discriminative performance. Abbreviations: AUC, area under the curve; hs-CRP, high-sensitivity C-reactive protein; MDA, malondialdehyde; ROC, receiver operating characteristic; SIRT1, sirtuin 1; T2DM, type 2 diabetes mellitus; VCAM-1, vascular cell adhesion molecule-1.
Table 4.
Predictive performance of individual biomarkers and the combined model for identification of high cardiovascular risk in T2DM *.
Notably, the combined model integrating miR-34a, SIRT1, hs-CRP, MDA, and VCAM-1 demonstrated excellent discriminative performance, achieving the highest AUC value (0.92, 95% CI: 0.86–0.96), with a sensitivity of 86.4% and specificity of 85.5% (Figure 2, Table 4). The combined model also exhibited the highest Youden index (0.72), indicating superior overall diagnostic accuracy compared with any individual biomarker.
Importantly, the ROC curves shown in Figure 2 demonstrate that the combined model consistently outperformed all individual biomarkers across the entire range of sensitivity and specificity values, highlighting the added value of integrating markers associated with miR-34a/SIRT1 signaling, inflammation, oxidative stress, and endothelial dysfunction.
These findings demonstrate that integrated molecular profiling substantially improves cardiovascular risk stratification in T2DM and supports the clinical utility of combining biomarkers reflecting miR-34a/SIRT1 signaling, inflammation, oxidative stress, and endothelial dysfunction for identifying individuals at elevated cardiovascular risk (Figure 2, Table 4).
3.5. Proposed Molecular Framework Associated with Cardiovascular Risk in T2DM
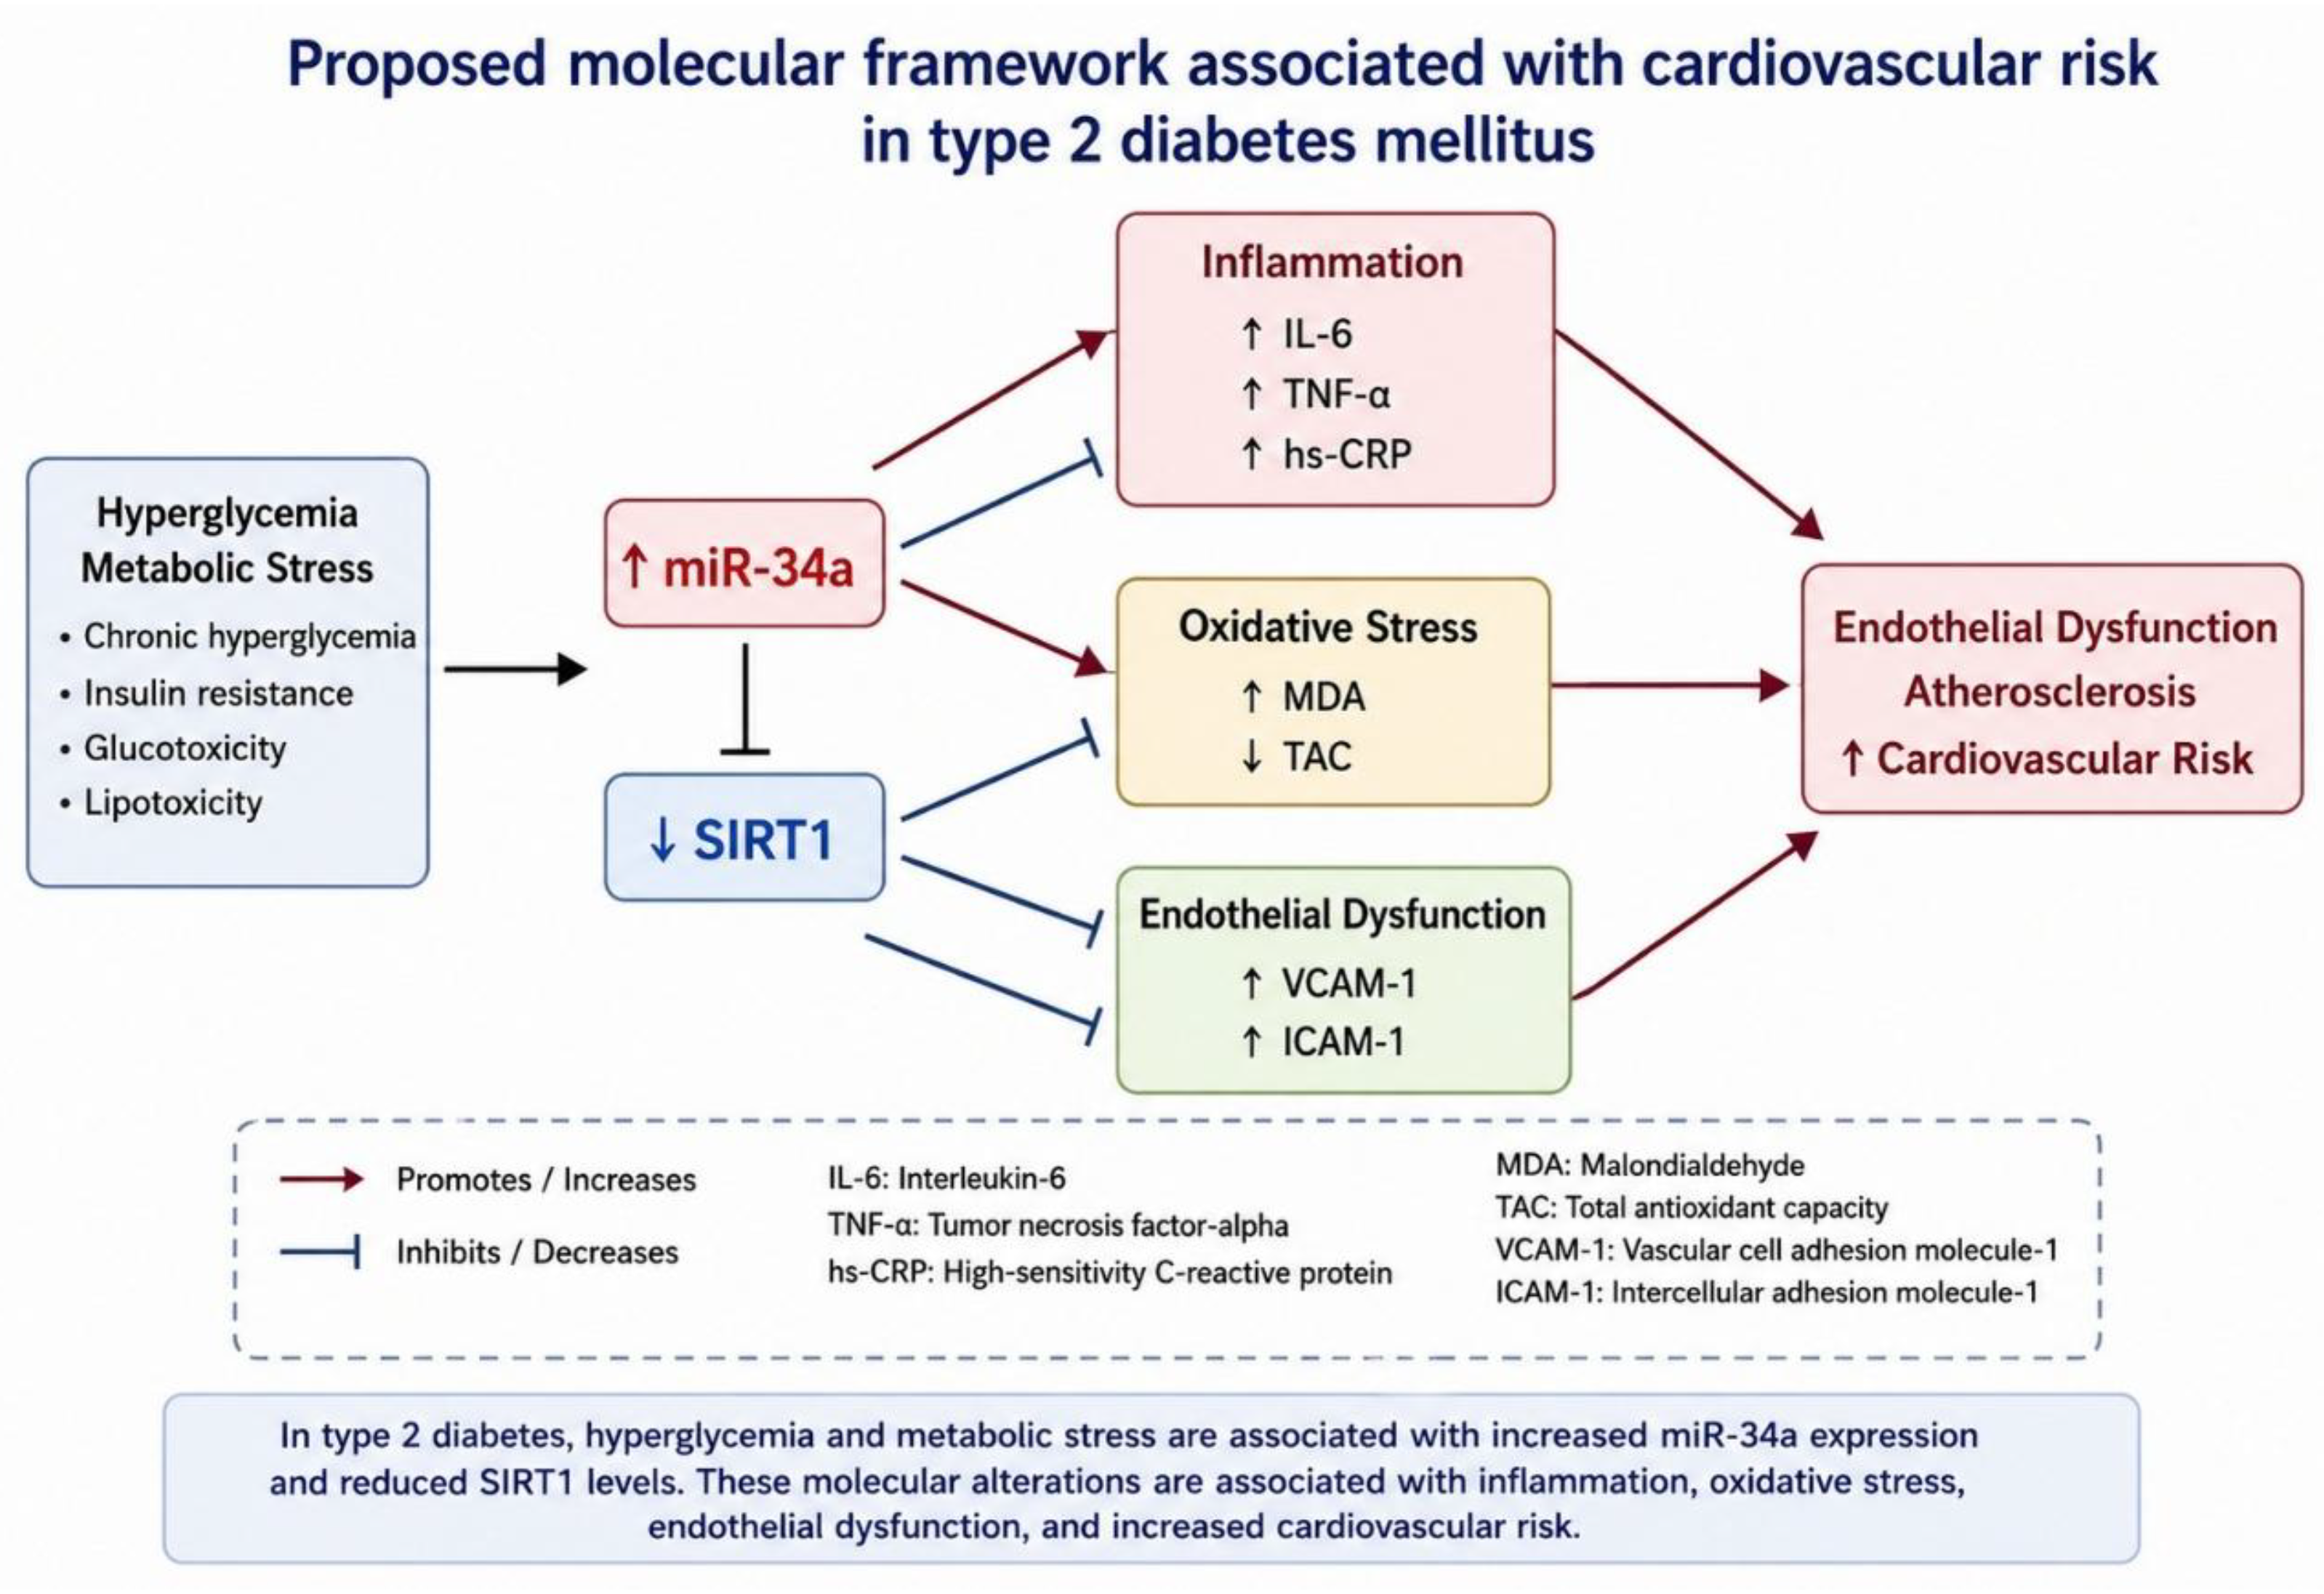
To integrate the molecular and biochemical findings obtained in the present study, an integrated mechanistic model was developed and is presented in Figure 3. The model illustrates the proposed biological interactions linking hyperglycemia and metabolic stress to cardiovascular risk progression in individuals with T2DM. As shown in Figure 3, chronic metabolic disturbances are associated with increased circulating miR-34a expression and concomitant suppression of SIRT1, suggesting dysregulation of the miR-34a/SIRT1 regulatory axis. This molecular imbalance is accompanied by progressive increases in inflammatory mediators (IL-6, TNF-α, and hs-CRP), oxidative stress markers (elevated MDA and reduced TAC), and endothelial dysfunction markers (VCAM-1 and ICAM-1). Collectively, these alterations contribute to endothelial activation, vascular injury, and atherosclerotic progression, ultimately leading to increased cardiovascular risk. The model is consistent with the biomarker profiles observed in high-risk T2DM individuals and highlights the miR-34a/SIRT1 axis as a potential mechanistic link connecting metabolic dysregulation, systemic inflammation, oxidative stress, and endothelial dysfunction.
Figure 3.
Proposed molecular framework associated with cardiovascular risk in type 2 diabetes mellitus (T2DM), illustrating the observed associations among inflammation, oxidative stress, endothelial dysfunction, and cardiovascular risk. Red arrows indicate positive associations or activation (promotion/increased expression or activity), whereas blue arrows indicate negative associations or inhibition (suppression/decreased expression or activity). Specifically, increased miR-34a promotes inflammation and oxidative stress while suppressing SIRT1 expression. Reduced SIRT1 contributes to increased inflammation, oxidative stress, and endothelial dysfunction, ultimately favoring atherosclerosis and increased cardiovascular risk.
4. Discussion
Type 2 diabetes mellitus (T2DM) is a multifactorial metabolic disorder associated with a substantially increased risk of cardiovascular disease, which remains the leading cause of morbidity and mortality among affected individuals [1,2,3]. The pathogenesis of diabetic cardiovascular complications involves complex interactions among chronic hyperglycemia, insulin resistance, inflammation, oxidative stress, endothelial dysfunction, and vascular remodeling [6,7,8,9]. Consequently, there is growing interest in identifying molecular biomarkers capable of complementing conventional clinical risk assessment tools and providing insights into the biological mechanisms underlying cardiovascular risk progression [1,10].
In the present study, we identified a coordinated molecular signature associated with increasing cardiovascular risk in individuals with T2DM. Participants classified as high cardiovascular risk according to the Framingham Risk Score were older, had a longer duration of diabetes, higher body mass index, elevated systolic and diastolic blood pressure, poorer glycemic control, and a greater prevalence of dyslipidemia, smoking, physical inactivity, hepatic steatosis, and obesity. These findings are consistent with the established clinical determinants of cardiovascular disease in diabetes and support the validity of the cardiovascular risk stratification adopted in the present study [3,10].
Beyond these conventional risk factors, we observed a progressive increase in circulating miR-34a expression accompanied by a marked reduction in circulating SIRT1 concentrations across cardiovascular risk categories. Importantly, these molecular alterations remained independently associated with cardiovascular risk after adjustment for age, sex, BMI, smoking status, physical activity, dyslipidemia, HbA1c, and medication use when available. These findings suggest that dysregulation of the miR-34a/SIRT1 regulatory axis may provide biological information beyond traditional clinical variables.
MicroRNA-34a is a multifunctional regulatory molecule implicated in numerous pathological processes, including cancer, chronic inflammatory disorders, cardiovascular diseases, and metabolic dysfunction [11,13]. Although initially characterized as a tumor suppressor involved in cell-cycle regulation and apoptosis, accumulating evidence demonstrates that persistent miR-34a overexpression may contribute to tissue injury, inflammation, oxidative stress, vascular aging, and endothelial dysfunction [12,13]. In diabetes, elevated miR-34a expression has been associated with β-cell dysfunction, insulin resistance, diabetic complications, and cardiovascular disease progression [12,16,17]. Therefore, the increased miR-34a levels observed in our high-risk T2DM cohort are consistent with its recognized role as a mediator of metabolic and vascular dysfunction.
A central mechanism linking miR-34a to cardiovascular injury involves suppression of SIRT1, a NAD+-dependent deacetylase that exerts protective effects on endothelial cells, vascular smooth muscle cells, and cardiomyocytes [19,20,21,22,23,24,25]. Experimental studies have demonstrated that miR-34a directly targets SIRT1, resulting in reduced endothelial nitric oxide synthase (eNOS) activity, impaired nitric oxide bioavailability, increased oxidative stress, and activation of inflammatory signaling pathways [18,19,20]. Consistent with these observations, we found a robust inverse pattern characterized by elevated miR-34a expression and reduced circulating SIRT1 levels in individuals with higher cardiovascular risk. Recent clinical evidence has also identified reduced SIRT1 concentrations as a predictor of adverse cardiovascular outcomes in diabetic patients, further supporting the biological relevance of this pathway [27,28].
The inflammatory profile observed in the present study further supports the involvement of the miR-34a/SIRT1 axis in diabetic vascular injury. Concentrations of IL-6, TNF-α, and hs-CRP increased progressively from controls to medium-risk and high-risk T2DM individuals. These biomarkers are recognized mediators of endothelial dysfunction, insulin resistance, and atherosclerotic progression. Experimental evidence suggests that reduced SIRT1 activity enhances NF-κB signaling, thereby promoting the transcription of pro-inflammatory cytokines and amplifying vascular inflammation [19,24,31]. The parallel increase in miR-34a expression and inflammatory mediators observed in our cohort is therefore biologically plausible and consistent with previous mechanistic studies.
Oxidative stress represents another critical component of diabetic cardiovascular disease. Individuals with high cardiovascular risk exhibited significantly elevated MDA concentrations and reduced total antioxidant capacity, indicating substantial redox imbalance. These findings are consistent with current evidence demonstrating that excessive reactive oxygen species production contributes to endothelial injury, mitochondrial dysfunction, vascular stiffness, myocardial remodeling, and atherosclerotic plaque development in diabetes [7,8]. SIRT1 plays a major role in cellular antioxidant defense through regulation of FOXO transcription factors, mitochondrial function, and oxidative stress response pathways [21,22,31]. Consequently, reduced SIRT1 expression may contribute directly to the oxidative stress profile observed in high-risk participants.
Similarly, endothelial dysfunction markers VCAM-1 and ICAM-1 increased progressively according to cardiovascular risk status. These adhesion molecules are involved in leukocyte recruitment, vascular inflammation, and early atherosclerotic lesion formation [32]. The observed elevation of VCAM-1 and ICAM-1, together with increased inflammatory and oxidative stress biomarkers, supports the concept that endothelial activation represents a downstream manifestation of the broader molecular disturbances associated with miR-34a/SIRT1 dysregulation.
One of the most relevant findings of this study was the performance of the integrated biomarker model. While individual biomarkers demonstrated good discriminatory capacity, the combined model incorporating miR-34a, SIRT1, hs-CRP, MDA, and VCAM-1 achieved an AUC of 0.92, with sensitivity and specificity exceeding 85%. These results suggest that cardiovascular risk in T2DM cannot be adequately explained by isolated molecular pathways but rather emerges from a complex network involving inflammation, oxidative stress, endothelial dysfunction, and microRNA-mediated regulation. Recent studies have increasingly emphasized the value of multimarker strategies, innovative miRNA-based biomarkers, and machine-learning-based cardiovascular prediction models capable of integrating distinct biological pathways to improve risk assessment and support precision medicine approaches in diabetes [9,14,26,28,33]. Our findings support this concept and suggest that integrated molecular profiling may enhance precision cardiovascular medicine in T2DM.
An important consideration is that cardiovascular risk stratification was based on the Framingham Risk Score, which already incorporates diabetes as a major determinant of risk [29]. Nevertheless, substantial heterogeneity in biomarker profiles was observed among individuals with T2DM despite sharing the same diagnosis. This observation suggests that molecular biomarkers related to the miR-34a/SIRT1 axis may capture pathophysiological alterations not fully reflected by conventional clinical scores and may therefore provide complementary information for cardiovascular risk assessment.
Some limitations should be acknowledged. First, the cross-sectional design precludes causal inference and does not allow determination of temporal relationships between miR-34a/SIRT1 dysregulation and cardiovascular risk progression. Second, functional studies were not performed to directly validate the mechanistic pathways suggested by the biomarker analyses. Third, the absence of longitudinal follow-up prevents evaluation of the predictive value of these biomarkers for future cardiovascular events. Finally, although multivariate analyses accounted for major demographic, lifestyle, and clinical confounders, detailed treatment-specific information was not uniformly available for all participants. Pharmacological treatment data available for a subset of the cohort are presented in Supplementary Table S1; however, the effects of individual antidiabetic therapies on biomarker expression and cardiovascular risk could not be systematically assessed. Future prospective studies with comprehensive medication records are warranted to clarify the potential influence of pharmacological interventions on the miR-34a/SIRT1 axis and related cardiovascular biomarkers.
In conclusion, cardiovascular risk in T2DM is associated with a coordinated molecular signature characterized by increased miR-34a expression, reduced SIRT1 concentrations, systemic inflammation, oxidative stress, and endothelial dysfunction. The integration of these biomarkers demonstrated excellent discriminatory performance for identifying individuals at elevated cardiovascular risk and supports the potential utility of multimarker approaches in precision cardiometabolic medicine. Future longitudinal and mechanistic studies are warranted to validate these findings and explore the therapeutic potential of targeting the miR-34a/SIRT1 regulatory network.
Supplementary Materials
The following supporting information can be downloaded at: https://www.mdpi.com/article/10.3390/ijtm6030029/s1, Table S1: Pharmacological treatment characteristics of individuals with type 2 diabetes mellitus (T2DM) according to cardiovascular risk stratification.
Author Contributions
F.M.d.O.: Wrote the manuscript with input from all authors. Planned the experiments; F.S.L.N.: Planned and performed the experiments; E.V.F.: Discussed the results and contributed to the final manuscript; M.B.: Discussed the results and contributed to the final manuscript; D.M.d.O.: Discussed the results and contributed to the final manuscript; C.S.S.: Supervised the findings of this work. All authors have read and agreed to the published version of the manuscript.
Funding
This research received institutional support from the Association for Health Education & Research, Brazil, and the Genomic Medicine Study Group. No specific grant from any funding agency in the public, commercial, or not-for-profit sectors was received.
Institutional Review Board Statement
This study was conducted in accordance with the Declaration of Helsinki and was approved by the Research Ethics Committee of the Federal University of Jataí, Brazil (CAAE: 69791717.0.0000.5083; approval date: 19 September 2017). This study was conducted and reported in accordance with the STROBE Statement.
Informed Consent Statement
Written informed consent was obtained from all participants prior to enrollment in the study.
Data Availability Statement
The data supporting the findings of this study are available from the corresponding author upon reasonable request.
Acknowledgments
Research group in Molecular Epidemiology (EPIMOL), CNPq, Brazil. Association for Health Education & Research, Brazil. Genomic Medicine Study Group (GMEG).
Conflicts of Interest
The authors declare no potential conflicts of interest.
References
- Ma, C.X.; Ma, X.N.; Guan, C.H.; Li, Y.D.; Mauricio, D.; Fu, S.B. Cardiovascular disease in type 2 diabetes mellitus: Progress toward personalized management. Cardiovasc. Diabetol. 2022, 21, 74. [Google Scholar] [CrossRef] [Scilit] [PubMed]
- Liu, Z.; Wang, H.; Yang, Z.; Lu, Y.; Zou, C. Causal associations between type 1 diabetes mellitus and cardiovascular diseases: A Mendelian randomization study. Cardiovasc. Diabetol. 2023, 22, 236. [Google Scholar] [CrossRef] [Scilit] [PubMed]
- Yun, J.S.; Ko, S.H. Current trends in epidemiology of cardiovascular disease and cardiovascular risk management in type 2 diabetes. Metabolism 2021, 123, 154838. [Google Scholar] [CrossRef] [Scilit] [PubMed]
- Huri, H.Z.; Ling, D.Y.; Ahmad, W.A. Association between glycemic control and antidiabetic drugs in type 2 diabetes mellitus patients with cardiovascular complications. Drug Des. Dev. Ther. 2015, 9, 4735–4749. [Google Scholar] [CrossRef] [Scilit] [PubMed]
- Martinez, M.; Santamarina, J.; Pavesi, A.; Musso, C.; Umpierrez, G.E. Glycemic variability and cardiovascular disease in patients with type 2 diabetes. BMJ Open Diabetes Res. Care 2021, 9, e002032. [Google Scholar] [CrossRef] [Scilit] [PubMed]
- Viigimaa, M.; Sachinidis, A.; Toumpourleka, M.; Koutsampasopoulos, K.; Alliksoo, S.; Titma, T. Macrovascular Complications of Type 2 Diabetes Mellitus. Curr. Vasc. Pharmacol. 2020, 18, 110–116. [Google Scholar] [CrossRef] [Scilit] [PubMed]
- Priya, H.K.; Jha, K.P.; Kumar, N.; Singh, S. Reactive Oxygen Species and Mitochondrial Calcium’s Roles in the Development of Atherosclerosis. Curr. Pharm. Des. 2024, 30, 1812–1821. [Google Scholar] [CrossRef] [Scilit] [PubMed]
- Batty, M.; Bennett, M.R.; Yu, E. The Role of Oxidative Stress in Atherosclerosis. Cells 2022, 11, 3843. [Google Scholar] [CrossRef] [Scilit] [PubMed]
- Ktenopoulos, N.; Anagnostopoulou, L.; Apostolos, A.; Iliakis, P.; Karakasis, P.; Milaras, N.; Theofilis, P.; Fragoulis, C.; Drakopoulou, M.; Synetos, A.; et al. Cellular and Molecular Pathways in Diabetes-Associated Heart Failure: Emerging Mechanistic Insights and Therapeutic Opportunities. Curr. Issues Mol. Biol. 2025, 47, 886. [Google Scholar] [CrossRef] [Scilit] [PubMed]
- Reurean-Pintilei, D.; Potcovaru, C.G.; Salmen, T.; Mititelu-Tartau, L.; Cinteză, D.; Lazăr, S.; Pantea Stoian, A.; Timar, R.; Timar, B. Assessment of Cardiovascular Risk Categories and Achievement of Therapeutic Targets in European Patients with Type 2 Diabetes. J. Clin. Med. 2024, 13, 2196. [Google Scholar] [CrossRef] [Scilit] [PubMed]
- Li, W.J.; Wang, Y.; Liu, R.; Kasinski, A.L.; Shen, H.; Slack, F.J.; Tang, D.G. MicroRNA-34a: Potent Tumor Suppressor, Cancer Stem Cell Inhibitor, and Potential Anticancer Therapeutic. Front. Cell Dev. Biol. 2021, 9, 640587. [Google Scholar] [CrossRef] [Scilit] [PubMed]
- Thounaojam, M.C.; Bartoli, M. MicroRNA-34a and vascular senescence in diabetes. Aging 2019, 11, 11799–11800. [Google Scholar] [CrossRef] [Scilit] [PubMed]
- Hua, C.C.; Liu, X.M.; Liang, L.R.; Wang, L.F.; Zhong, J.C. Targeting the microRNA-34a as a Novel Therapeutic Strategy for Cardiovascular Diseases. Front. Cardiovasc. Med. 2022, 8, 784044. [Google Scholar] [CrossRef] [Scilit] [PubMed]
- Iside, C.; Picone, F.; Di Pietro, P.; Abate, A.C.; Prete, V.; Damato, A.; Venturini, E.; Akeel, S.; Petralia, S.; Vecchione, C.; et al. MicroRNA Signatures in Cardiometabolic Disorders as a Next-Generation Diagnostic Approach: Current Insight. Int. J. Mol. Sci. 2025, 26, 10769. [Google Scholar] [CrossRef] [Scilit] [PubMed]
- Chen, Q.; Shen, Z.; Mao, Y.; Li, Q.; Liu, Y.; Mei, M.; Qiu, F.; Wang, M. Inhibition of microRNA-34a mediates protection of thymosin beta 4 in endothelial progenitor cells against advanced glycation endproducts by targeting B-cell lymphoma 2. Can. J. Physiol. Pharmacol. 2019, 97, 945–951. [Google Scholar] [CrossRef] [Scilit] [PubMed]
- Kaur, P.; Kotru, S.; Singh, S.; Munshi, A. Role of miRNAs in diabetic neuropathy: Mechanisms and possible interventions. Mol. Neurobiol. 2022, 59, 1836–1849. [Google Scholar] [CrossRef] [Scilit] [PubMed]
- Żarek-Starzewska, A.; Klimczak-Tomaniak, D.; Mądrecka, A.; Sygitowicz, G.; Janiszewski, M.; Kuch, M. From Type 2 Diabetes Mellitus To Diabetic Cardiomyopathy—A Systematic Review On The Role Of MicroRNA. Curr. Diabetes Rep. 2025, 25, 42. [Google Scholar] [CrossRef] [Scilit] [PubMed]
- Li, Q.; Kim, Y.R.; Vikram, A.; Kumar, S.; Kassan, M.; Gabani, M.; Lee, S.K.; Jacobs, J.S.; Irani, K. P66Shc-Induced MicroRNA-34a Causes Diabetic Endothelial Dysfunction by Downregulating Sirtuin1. Arter. Thromb. Vasc. Biol. 2016, 36, 2394–2403, Erratum in Arter. Thromb. Vasc. Biol. 2025, 45, e563. https://doi.org/10.1161/ATV.0000000000000191. [Google Scholar] [CrossRef] [Scilit] [PubMed]
- Wu, J.; Liang, W.; Tian, Y.; Ma, F.; Huang, W.; Jia, Y.; Jiang, Z.; Wu, H. Inhibition of P53/miR-34a improves diabetic endothelial dysfunction via activation of SIRT1. J. Cell. Mol. Med. 2019, 23, 3538–3548. [Google Scholar] [CrossRef] [Scilit] [PubMed]
- Chen, P.; Chen, F.; Lei, J.; Li, Q.; Zhou, B. Activation of the miR-34a-Mediated SIRT1/mTOR Signaling Pathway by Urolithin A Attenuates D-Galactose-Induced Brain Aging in Mice. Neurotherapeutics 2019, 16, 1269–1282. [Google Scholar] [CrossRef] [Scilit] [PubMed]
- Law, M.; Wang, P.C.; Zhou, Z.Y.; Wang, Y. From Microcirculation to Aging-Related Diseases: A Focus on Endothelial SIRT1. Pharmaceuticals 2024, 17, 1495. [Google Scholar] [CrossRef] [Scilit] [PubMed]
- Yang, K.; Velagapudi, S.; Akhmedov, A.; Kraler, S.; Lapikova-Bryhinska, T.; Schmiady, M.O.; Wu, X.; Geng, L.; Camici, G.G.; Xu, A.; et al. Chronic SIRT1 supplementation in diabetic mice improves endothelial function by suppressing oxidative stress. Cardiovasc. Res. 2023, 119, 2190–2201. [Google Scholar] [CrossRef] [Scilit] [PubMed]
- Dinislam, K.; Khoso, M.A.; Kataev, V.A.; Meshcheryakova, S.; Liu, H.; Liu, L.; Guo, M.; Wang, S.; Lou, H.; Zhang, Y.; et al. SIRT1: The first key to unlocking the mystery of cardiovascular diseases. Front. Pharmacol. 2026, 16, 1668718. [Google Scholar] [CrossRef] [Scilit] [PubMed]
- Zhu, H.; Lin, Y.; Liu, Y. miR-34a increases inflammation and oxidative stress levels in patients with necrotizing enterocolitis by downregulating SIRT1 expression. Mol. Med. Rep. 2021, 24, 664. [Google Scholar] [CrossRef] [Scilit] [PubMed]
- Liang, M.; Shao, A.; Tang, X.; Feng, M.; Wang, J.; Qiu, Y. MiR-34a affects dexmedetomidine-inhibited chronic inflammatory visceral pain by targeting to HDAC2. BMC Anesthesiol. 2019, 19, 131. [Google Scholar] [CrossRef] [Scilit] [PubMed]
- Ambale-Venkatesh, B.; Yang, X.; Wu, C.O.; Liu, K.; Hundley, W.G.; McClelland, R.; Gomes, A.S.; Folsom, A.R.; Shea, S.; Guallar, E.; et al. Cardiovascular Event Prediction by Machine Learning: The Multi-Ethnic Study of Atherosclerosis. Circ. Res. 2017, 121, 1092–1101. [Google Scholar] [CrossRef] [Scilit] [PubMed]
- Biscetti, F.; Rando, M.M.; Nicolazzi, M.A.; Rossini, E.; Santoro, M.; Angelini, F.; Iezzi, R.; Eraso, L.H.; Dimuzio, P.J.; Pitocco, D.; et al. Evaluation of sirtuin 1 as a predictor of cardiovascular outcomes in diabetic patients with limb-threatening ischemia. Sci. Rep. 2024, 14, 26940. [Google Scholar] [CrossRef] [Scilit] [PubMed]
- Li, Y.; Li, D.; Lin, J.; Zhou, L.; Yang, W.; Yin, X.; Xu, C.; Cao, Z.; Wang, Y. Proteomic signatures of type 2 diabetes predict the incidence of coronary heart disease. Cardiovasc. Diabetol. 2025, 24, 120. [Google Scholar] [CrossRef] [Scilit] [PubMed]
- Wilson, P.W.; D’Agostino, R.B.; Levy, D.; Belanger, A.M.; Silbershatz, H.; Kannel, W.B. Prediction of coronary heart disease using risk factor categories. Circulation 1998, 97, 1837–1847. [Google Scholar] [CrossRef] [Scilit] [PubMed]
- Matsudo, S.; Araújo, T.; Matsudo, V.; Andrade, D.; Andrade, E.; de Oliveira, L.; Braggion, G. International Physical Activity Questionnaire (IPAQ): Study of validity and reliability in Brazil. Rev. Bras. Ativ. Fís. Saúde 2001, 6, 5–18. [Google Scholar]
- Jianbing, H.; Xiaotian, L.; Jie, T.; Xueying, C.; Honge, J.; Bo, Z.; Lirong, H.; Lei, Z. The Effect of Allograft Inflammatory Factor-1 on Inflammation, Oxidative Stress, and Autophagy via miR-34a/ATG4B Pathway in Diabetic Kidney Disease. Oxidative Med. Cell. Longev. 2022, 2022, 1668000. [Google Scholar] [CrossRef] [Scilit] [PubMed]
- Okonkwo, U.A.; DiPietro, L.A. Diabetes and Wound Angiogenesis. Int. J. Mol. Sci. 2017, 18, 1419. [Google Scholar] [CrossRef] [Scilit] [PubMed]
- Peczyńska, J.; Odyjewska, E.; Koszykowska, K.; Jamiołkowska-Sztabkowska, M.; Bossowski, A.; Głowińska-Olszewska, B. Cardiovascular risk factors and modern therapeutic strategies in children and adolescents with type 1 diabetes to prevent future diabetic angiopathy in the era of innovative miRNAs biomarkers. Front. Endocrinol. 2025, 16, 1638770. [Google Scholar] [CrossRef] [Scilit] [PubMed]

Disclaimer/Publisher’s Note: The statements, opinions and data contained in all publications are solely those of the individual author(s) and contributor(s) and not of MDPI and/or the editor(s). MDPI and/or the editor(s) disclaim responsibility for any injury to people or property resulting from any ideas, methods, instructions or products referred to in the content. |
© 2026 by the authors. Licensee MDPI, Basel, Switzerland. This article is an open access article distributed under the terms and conditions of the Creative Commons Attribution (CC BY) license.