


Abstract
Circulating micro- and nanoplastics (MNPs) have been linked to ischaemic heart disease, but the clinical evidence rests on bulk, mass-based assays applied to predefined polymer panels in blood obtained during invasive coronary procedures. Whether the same phenomenon can be captured from a routine bedside venipuncture, and what quality control that requires, has not been established. We applied a digestion-filtration protocol coupled to untargeted single-particle confocal Raman microspectroscopy to pre-procedural peripheral venous blood (8.0–10.0 mL per venipuncture) from eight healthy controls and six patients with acute myocardial infarction (AMI). Particles were assigned against the Open Specy reference library at a Pearson correlation threshold of 0.80. After blank subtraction, nine particles were recovered from 147.0 mL of blood: polyethylene (n = 4), polystyrene (n = 3), ethylene–vinyl acetate (EVA, n = 1) and polyurethane (PU, n = 1). Microplastics were detected in four of six AMI patients (66.7%) and two of eight controls (25.0%) (OR 6.00, p = 0.277), with particle densities of 0.093 and 0.043 particles/mL (p = 0.152). Control prevalence closely matched the 31.8% reported for coronary sampling in the reference clinical series, indicating that peripheral blood is not an empty compartment for this measurement. Sub-threshold assignments were characterised point by point across all thirteen samples with complete spectral output: of 126 points returning a polymer below 0.80, 28 also returned a graphite reference, and on every one of those 28, the graphite match ranked higher than the polymer, without exception. We characterise this as carbonaceous procedural background, and it forms the empirical basis of the assignment threshold. No contrast reached significance with the subject as the unit of analysis, and no inference about causality or clinical risk can be drawn from a cohort of this size. The contribution of this work is methodological: it shows that circulating microplastics can be recovered and chemically identified from routine peripheral venous blood drawn before any intervention, that untargeted assignment returns polymers absent from the panels used by current clinical assays, and that single-particle spectroscopy permits blank attribution and background characterisation that mass-based methods cannot provide.
1. Introduction
Global plastic production has made synthetic polymers one of the defining environmental exposures of the present era [1]. Environmental weathering fragments plastics into microplastics (MPs, <5 mm) and nanoplastics (<1 µm), to which humans are continuously exposed through ingestion, dermal contact and inhalation [2]. Once internalised, micro- and nanoplastics (MNPs) can cross mucosal and endothelial barriers and enter the systemic circulation, where they have been associated with oxidative stress and low-grade inflammatory responses [2,3,4].
Leslie et al. first demonstrated that plastic particles are quantifiable in human blood [3], and the vascular system has since emerged as a principal target for MNP accumulation [4]. Liu et al. detected MPs in coronary, carotid and femoral arteries by pyrolysis-gas chromatography/mass spectrometry (Py-GC/MS) [5]; Wu et al. identified MPs in thrombi retrieved during emergency thrombectomy [6]; Marfella et al. reported that patients with polyethylene or polyvinyl chloride in carotid atheromas had a substantially higher risk of major adverse cardiovascular events [7]; and Zhang et al. associated MNPs in myocardial tissue and blood with adverse cardiac outcomes after myocardial infarction [8].
Paolisso et al. have since provided the most comprehensive clinical assessment to date [9]: in 61 patients undergoing invasive coronary angiography, MNPs were detected significantly more often in ST-elevation myocardial infarction (84.2%) than in chronic coronary syndromes (40.0%) or controls (31.8%), polyethylene predominated (97%) and smoking history emerged as the only independent multivariable predictor of MNP detection (OR 5.69, 95% CI 1.33–26.63). That study establishes the clinical association with an authority no pilot cohort can approach. We take it as the reference clinical evidence, position our own results as corroborating it from a different sampling route and state throughout where the two studies agree and what ours adds.
What remains open is not whether circulating MNPs matter, but how they can be measured outside the catheterisation laboratory, and what it takes to measure them reliably. Three specific gaps motivate the present work.
The first gap is sampling route. Blood in the principal clinical series is obtained during invasive procedures, through arterial sheaths, guiding catheters and thrombus-aspiration microcatheters. That route is unavailable for screening, population-level exposure assessment or serial monitoring, and its own contribution to the measured particle burden has not been characterised. If the phenomenon is accessible from a routine venipuncture at the bedside, the population of studiable subjects expands from catheterised patients to anyone who can give a blood sample.
The second gap is targeted versus untargeted identification. The quantitative clinical evidence rests on bulk, mass-based techniques applied to predefined polymer panels; a polymer absent from the panel cannot be returned, however abundant it is. Library-based single-particle assignment places no such restriction on what may be found.
The third gap is quality control. Bulk methods report aggregate polymer mass and cannot attribute an individual particle to a specific procedural blank, nor distinguish a genuine polymer particle from non-polymeric material that a matching algorithm scores as a polymer. In a matrix where the expected yield is a handful of particles per subject, this distinction determines the result.
We therefore applied the digestion-filtration protocol of Sarabia et al. [10], coupled to untargeted single-particle confocal Raman microspectroscopy, to routine pre-procedural peripheral venous blood from patients with AMI and healthy controls. The aims were analytical: to establish whether the measurement is feasible on bedside-accessible material, to characterise the polymers recovered and to document the background against which such a measurement must be read. Clinical inference was not an aim, and the cohort does not support it.
2. Materials and Methods
2.1. Ethics, Participants and Sample Collection
This study was conducted in accordance with the Declaration of Helsinki and approved by the Ethics Committee of the University of Jaén (CIOMGAB_20221121bis) and the Provincial Research Ethics Committee of Jaén (SICEIA-2025-000070). Written informed consent was obtained from all participants. The cohort comprised 8 healthy control volunteers without known cardiovascular disease and 6 patients admitted with AMI to the Intensive Care Unit of the Hospital Universitario de Jaén.
Each venipuncture yielded 8.0–10.0 mL of peripheral whole blood, a routine clinical volume obtained at the bedside with standard phlebotomy equipment. All patient samples reported in the primary analysis were drawn before any percutaneous coronary intervention (PCI). One control subject (C3) donated a larger volume and was therefore processed in three independent analytical runs; two patients additionally provided a post-PCI sample; the additional control runs are recorded in Table 1 and Supplementary Text S1, and the post-PCI samples in Section 3.6. The primary analysis therefore comprises 16 pre-PCI analytical runs from 14 subjects, totalling 93.0 mL of blood in controls and 54.0 mL in AMI patients (Table 1).
Table 1.
Individual characteristics, analytical effort and microplastic particles recovered, after blank subtraction and at an assignment threshold of 0.80. “Runs” is the number of independent analytical runs contributing to each subject; “Volume” is the total blood volume analysed across those runs. Subject C3 donated a larger volume and was processed three times; one of the three runs (10.0 mL) returned no particles, and all three are included in the volume denominator. Two polybutylene terephthalate particles detected in A1 were matched to the filtered-water procedural blank and excluded. † The PU assignment in A4 (0.80) co-occurred with a higher-ranked graphite match (0.87) on the same point, consistent with a pigmented or partially carbonised particle; see Section 2.3 and Section 3.1. ND, not detected.
2.2. Digestion and Filtration
Samples were processed exactly as described in Sarabia et al. [10], the methodological validation of this workflow, to which the reader is referred for the full digestion protocol. In brief, whole blood was digested in alkaline solution with a non-ionic surfactant, followed by 30 min of sonication (40 kHz), filtration through glass-fibre filters (25 mm, 700 nm pore; Whatman, Cytiva, Maidstone, UK), washing, and dehydration with methanol. Filters were mounted on glass Petri dishes for microscopy.
2.3. Confocal Raman Microspectroscopy and Polymer Assignment
Spectra were acquired on a Renishaw Centrus 24QW69 confocal Raman microscope (Renishaw plc, Wotton-under-Edge, UK; 785 nm laser, WiRE 5.3 software), calibrated against the silicon band at 520 cm−1. Candidate particles were located under a 50× long-working-distance objective and interrogated point by point over 700–1800 cm−1. Spectra were min–max normalised, smoothed (5th-order polynomial) and baseline-corrected before matching against the open-source Open Specy reference library [11], using the Open Specy web application (https://www.openanalysis.org/openspecy/; version last updated 7 May 2026). Assignment was untargeted: any material represented in the reference library could be returned, polymeric or not, without a predefined panel.
Retention rule. A particle entered the clinical dataset when a polymer reference reached a Pearson correlation of 0.80 or above and the particle was not matched to a procedural blank. We adopted a threshold of 0.80 on three grounds. (i) The filtered-water procedural blank itself returned an assignment at 0.73 (Supplementary Tables S1 and S2), demonstrating within this dataset that the 0.70–0.79 band admits material generated by reagent background. (ii) Sub-threshold assignments in clinical samples are not randomly distributed but form a characterised background, described in Section 3.1 and quantified in Supplementary Tables S1 and S2b. (iii) The textile-contamination control returned a single assignment at 0.34, which the threshold correctly rejects. Results at a more permissive 0.70 threshold are reported as a sensitivity analysis (Section 3.4).
Non-polymeric competing matches. Where the untargeted search returned a non-polymeric reference (graphite, or a mineral phase) ranked above the polymer on the same point, the particle was retained only if a polymer still reached 0.80, and is flagged as carbonaceous or pigmented in Table 1 and Supplementary Table S1. We did not adopt a rule requiring the polymer to be the top-ranked match, because carbon black and related pigments are resonance enhanced at 785 nm excitation and dominate the Raman response of any particle containing them; such a rule would systematically discard dark and pigmented microplastics, an acknowledged detection bias in Raman-based microplastic work. Reporting these particles with the competing match declared is, in our view, more informative than either silently retaining or silently discarding them.
2.4. Quality Assurance and Quality Control
All processing was performed in a Class II biosafety cleanroom. Glassware and metal instruments were washed with 70% ethanol, rinsed with ultrapure water and autoclaved; working solutions were pre-filtered through glass-fibre filters.
Four control samples were processed alongside the clinical series (Supplementary Text S2 and Table S2). Two procedural blanks were run identically to clinical samples but without blood: the digestion-solution blank was clean, while the filtered-water blank returned two polybutylene terephthalate (PBT) particles (matches 0.95 and 0.73). Two positive controls were also processed: a polymer mixture (recovering polyethylene, EVA and ethylene–vinyl alcohol, confirming that EVA survives the digestion protocol in spectrally identifiable form) and a textile-contamination control prepared from laboratory coat and overall fibres. Applying our pre-specified blank-exclusion rule, the two PBT particles detected in patient A1 were matched to the filtered-water blank and removed from the clinical dataset. No other polymer detected in a clinical sample was present in any blank. Blank-derived removals are itemised in the footnote to Table 1 and per particle in Supplementary Table S1.
2.5. Statistical Analysis
All analyses were performed in Python 3.13 (pandas 3.0, NumPy 2.5, SciPy 1.18, scikit-learn 1.9) from a single documented dataset, available from the corresponding authors on reasonable request. The subject, not the particle, is the unit of analysis for all inferential tests, because particles recovered from the same individual are not independent observations. Categorical comparisons used Fisher’s exact test; chi-square tests were not used, since expected cell counts are far below the values required for the approximation to hold. Continuous comparisons used the Mann–Whitney U test. Quantitative burden is expressed as particles per millilitre of blood analysed, which accounts for differences in the volume processed per subject.
An exploratory principal component analysis (PCA) with agglomerative clustering (Ward linkage) was performed on age, smoking status and individual polymer counts. Clinical group and sex were deliberately excluded from the feature matrix, since their inclusion would render any correspondence between clusters and those labels circular. All subgroup analyses are exploratory, uncorrected for multiple comparisons and hypothesis generating. Significance was set at α = 0.05 and all tests are two-sided.
3. Results
3.1. Analytical Performance and the Carbonaceous Background
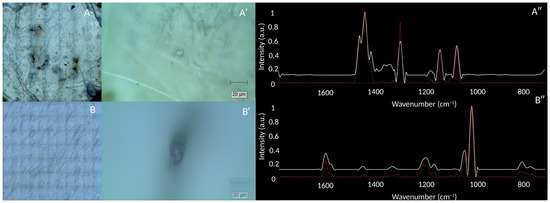
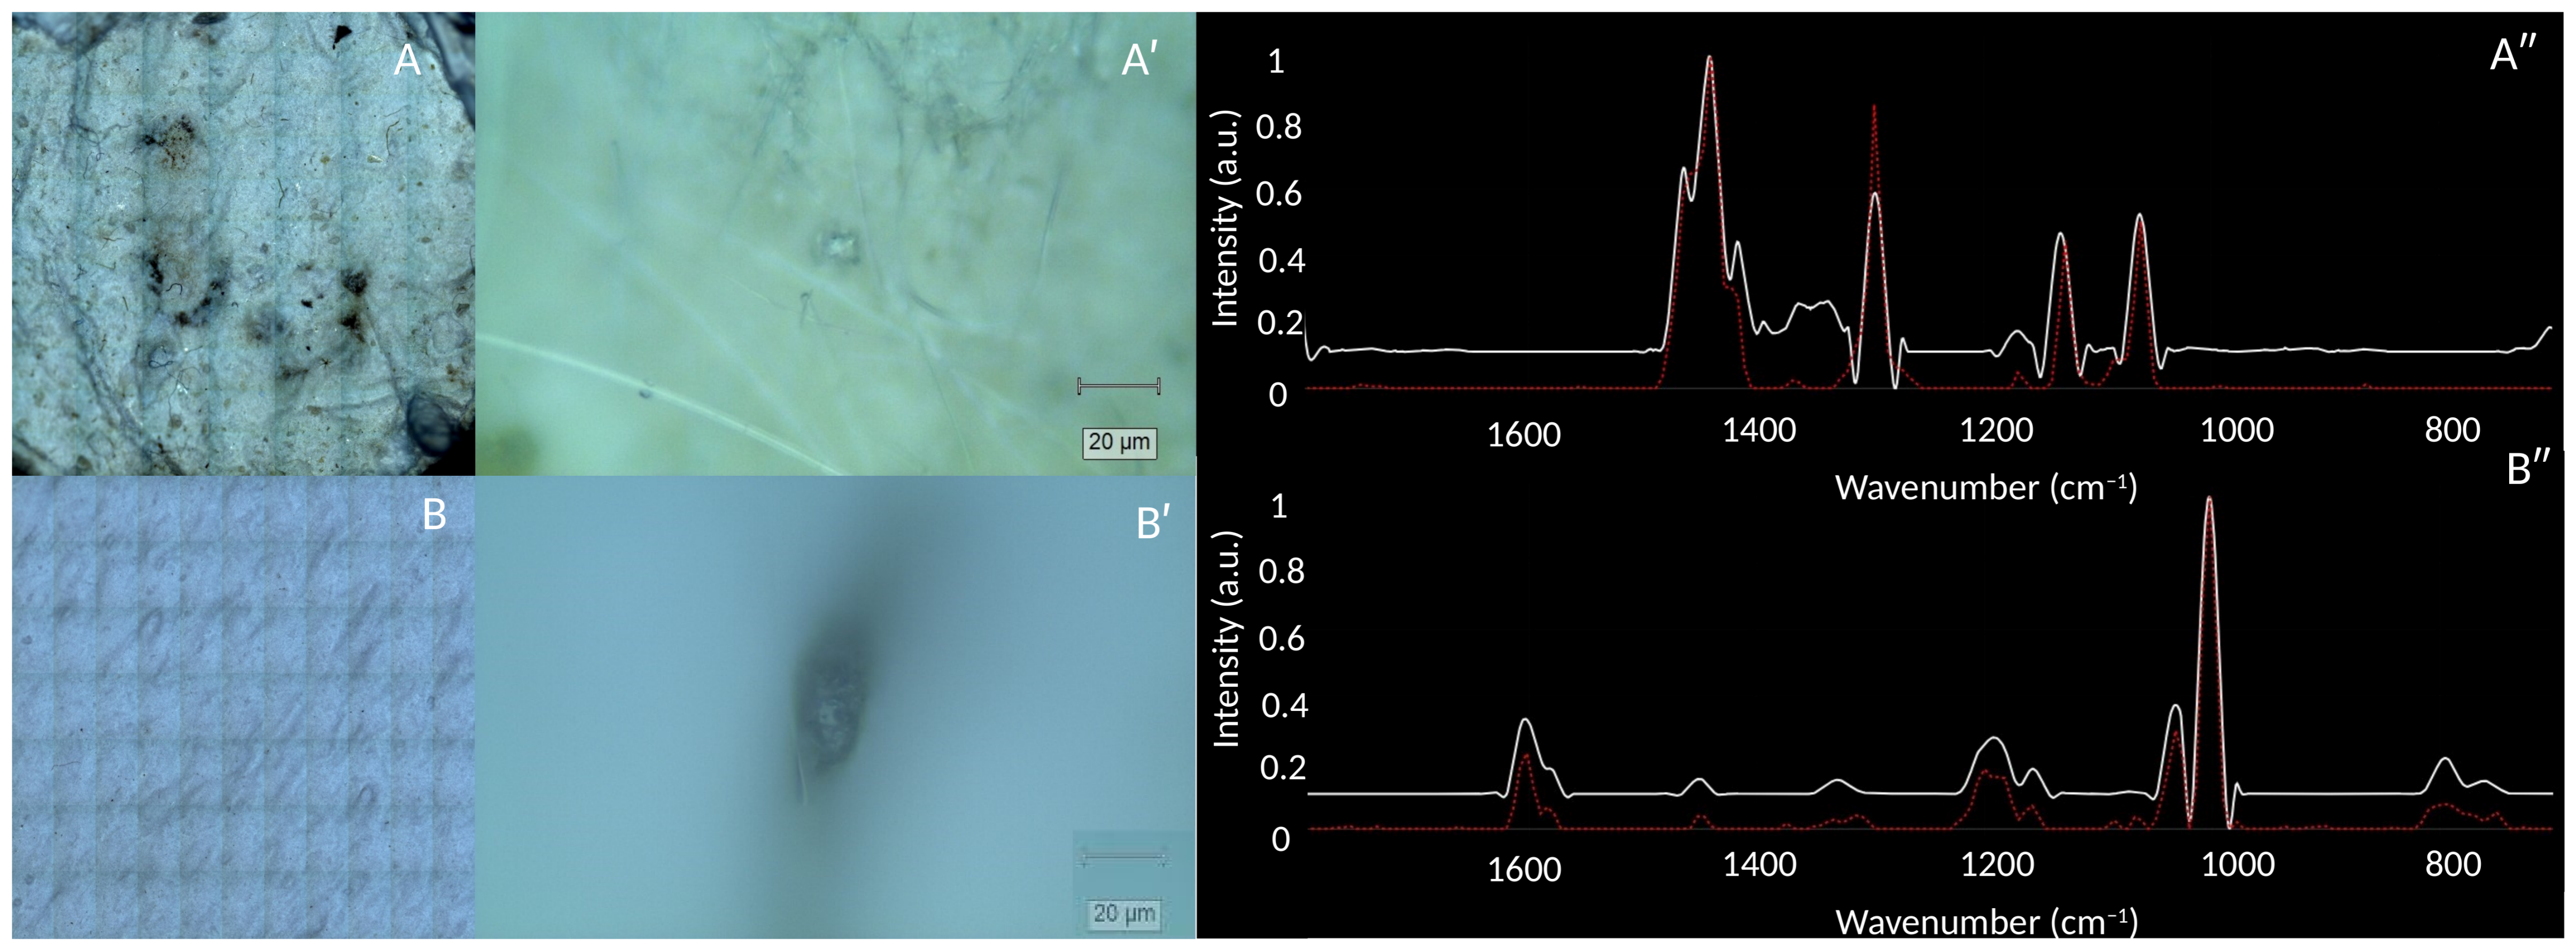
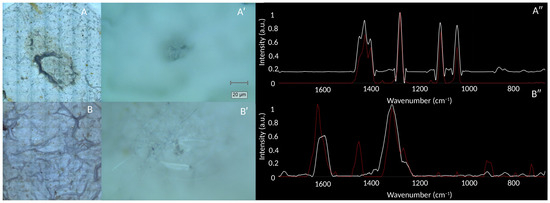
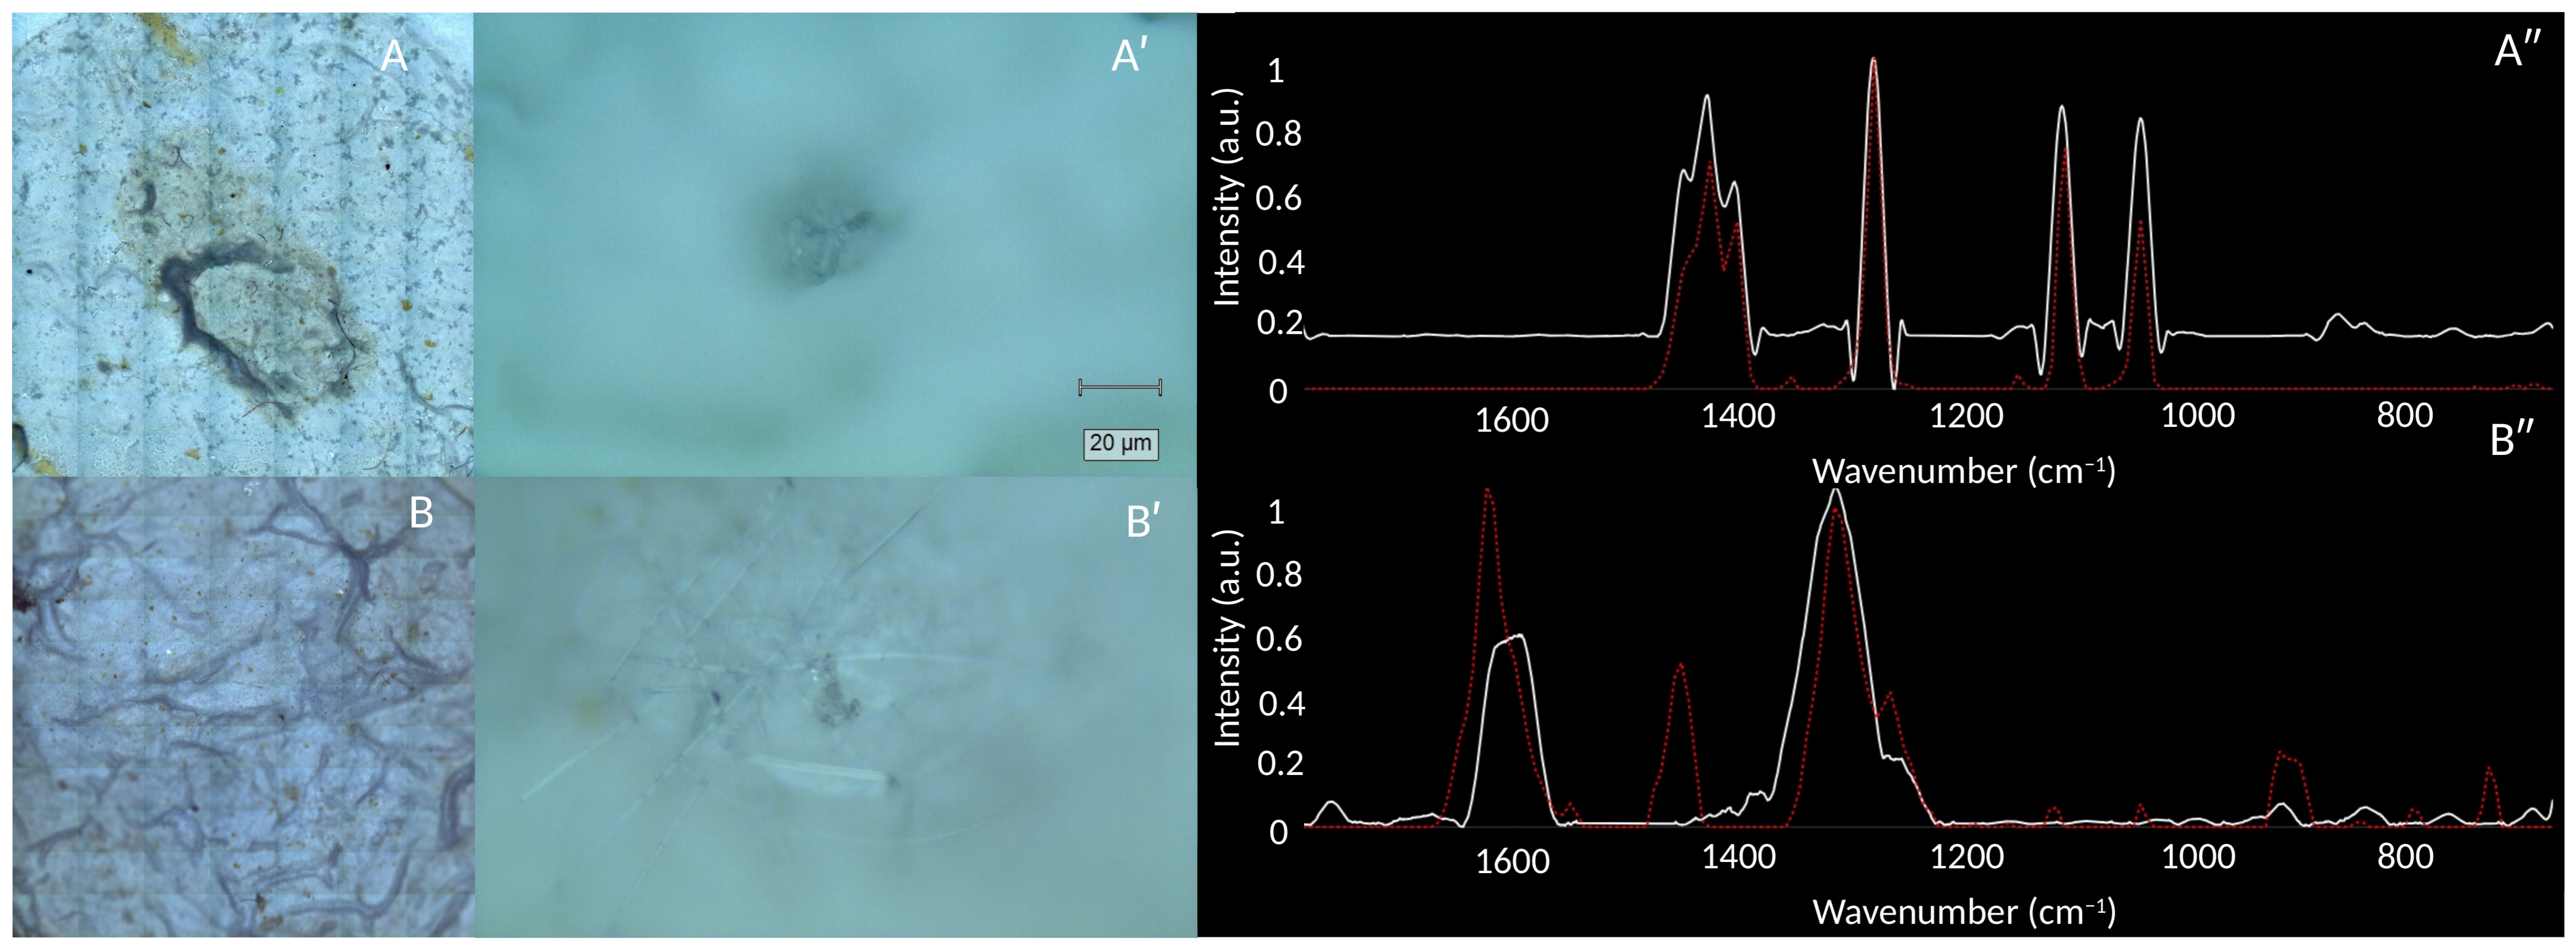
The digestion-filtration protocol removed biogenic organic matter effectively, yielding filter surfaces on which individual particles could be located and interrogated point by point. Representative micrographs and matched spectra are shown in Figure 1 and Figure 2.
Figure 1.
Confocal Raman identification of microplastics in control subjects. (A) Filter micrograph of control C1; (A′) detail of a detected polyethylene particle; (A″) its Raman spectrum (white) compared with the polyethylene reference (red, dotted). (B) Filter micrograph of control C3; (B′) detail of a detected polystyrene particle; (B″) its Raman spectrum compared with the polystyrene reference. Reference spectra from the Open Specy library.
Figure 2.
Confocal Raman identification of microplastics in AMI patients. (A) Filter micrograph of patient A1; (A′) detail of a detected polyethylene particle; (A″) its Raman spectrum (white) compared with the polyethylene reference (red, dotted). (B) Filter micrograph of patient A4; (B′) detail of the detected polyurethane particle; (B″) its Raman spectrum compared with the polyurethane reference. The spectrum in (B″) is dominated by two broad bands near 1590 and 1330 cm−1, the first-order Raman bands of disordered carbon [12], indicating a pigmented or partially carbonised particle; the polymer assignment reached 0.80 while a graphite reference matched the same point at 0.87. The particle is flagged accordingly in Table 1, and the two reference comparisons are shown side by side in Supplementary Figure S1 (see Section 2.3).
Across 16 pre-PCI analytical runs, 11 particles met the 0.80 assignment threshold. Two of these—both PBT, in patient A1—were matched to the filtered-water procedural blank and excluded, leaving 9 particles in the clinical dataset: polyethylene (PE, n = 4), polystyrene (PS, n = 3), ethylene–vinyl acetate (EVA, n = 1) and polyurethane (PU, n = 1). The retained assignments have correlations of 0.80, 0.91, 0.93, 0.93, 0.95, 0.97, 0.97, 0.98 and 0.98; the assignments rejected by the threshold fall at 0.79, 0.75 and 0.71. These figures refer to particles: objects located on the filter and registered as candidate particles in the laboratory record. The sub-threshold assignments described below are individual measurement points recorded while surveying each filter; they were not registered as candidate particles and enter neither the particle counts nor the 0.70 sensitivity analysis. No polypropylene assignment met the threshold.
The most consistent analytical observation in this dataset concerns what lies below the threshold. Weak polymer assignments in the 0.40–0.76 range were returned in nearly every sample with point-by-point output, including every such sample in which no particle met the threshold. These are not randomly distributed. Across the thirteen clinical samples for which the complete point-by-point output was retained, 126 points returned a polymer below 0.80; on 28 of them, the untargeted search simultaneously returned a graphite reference, and on every one of those 28, the graphite match was higher than the polymer—typically 0.68–0.95 for graphite against 0.40–0.76 for the polymer. Not one sub-threshold polymer in this dataset outranked a graphite match returned alongside it. Counting every non-polymeric reference rather than graphite alone, a non-polymeric match outranked the polymer on 36 of the 126 points. The measured spectra in the graphite-ranked cases consist of two broad bands near 1590 and 1330 cm−1 with little structure elsewhere, the characteristic D and G bands of disordered carbon [12]. The pattern is present in both groups—8 of 60 sub-threshold points in controls, 18 of 47 in AMI patients and 2 of 19 in the two post-procedural samples—and is itemised point by point in Supplementary Text S2b and Tables S1 and S2b.
We therefore interpret the sub-threshold band as carbonaceous procedural and environmental background rather than as circulating polymer particles, and this—together with the 0.73 assignment returned by the filtered-water blank—is the empirical basis on which the 0.80 threshold rests. It also characterises the airborne contamination of this workflow: the dominant contaminant in this workflow is not a specific polymer but carbon-rich particulate matter that library matching will score as a polymer if no minimum correlation is imposed.
3.2. Prevalence, Density and Polymer Composition
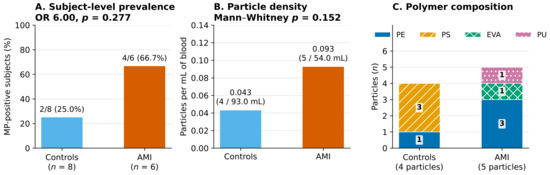
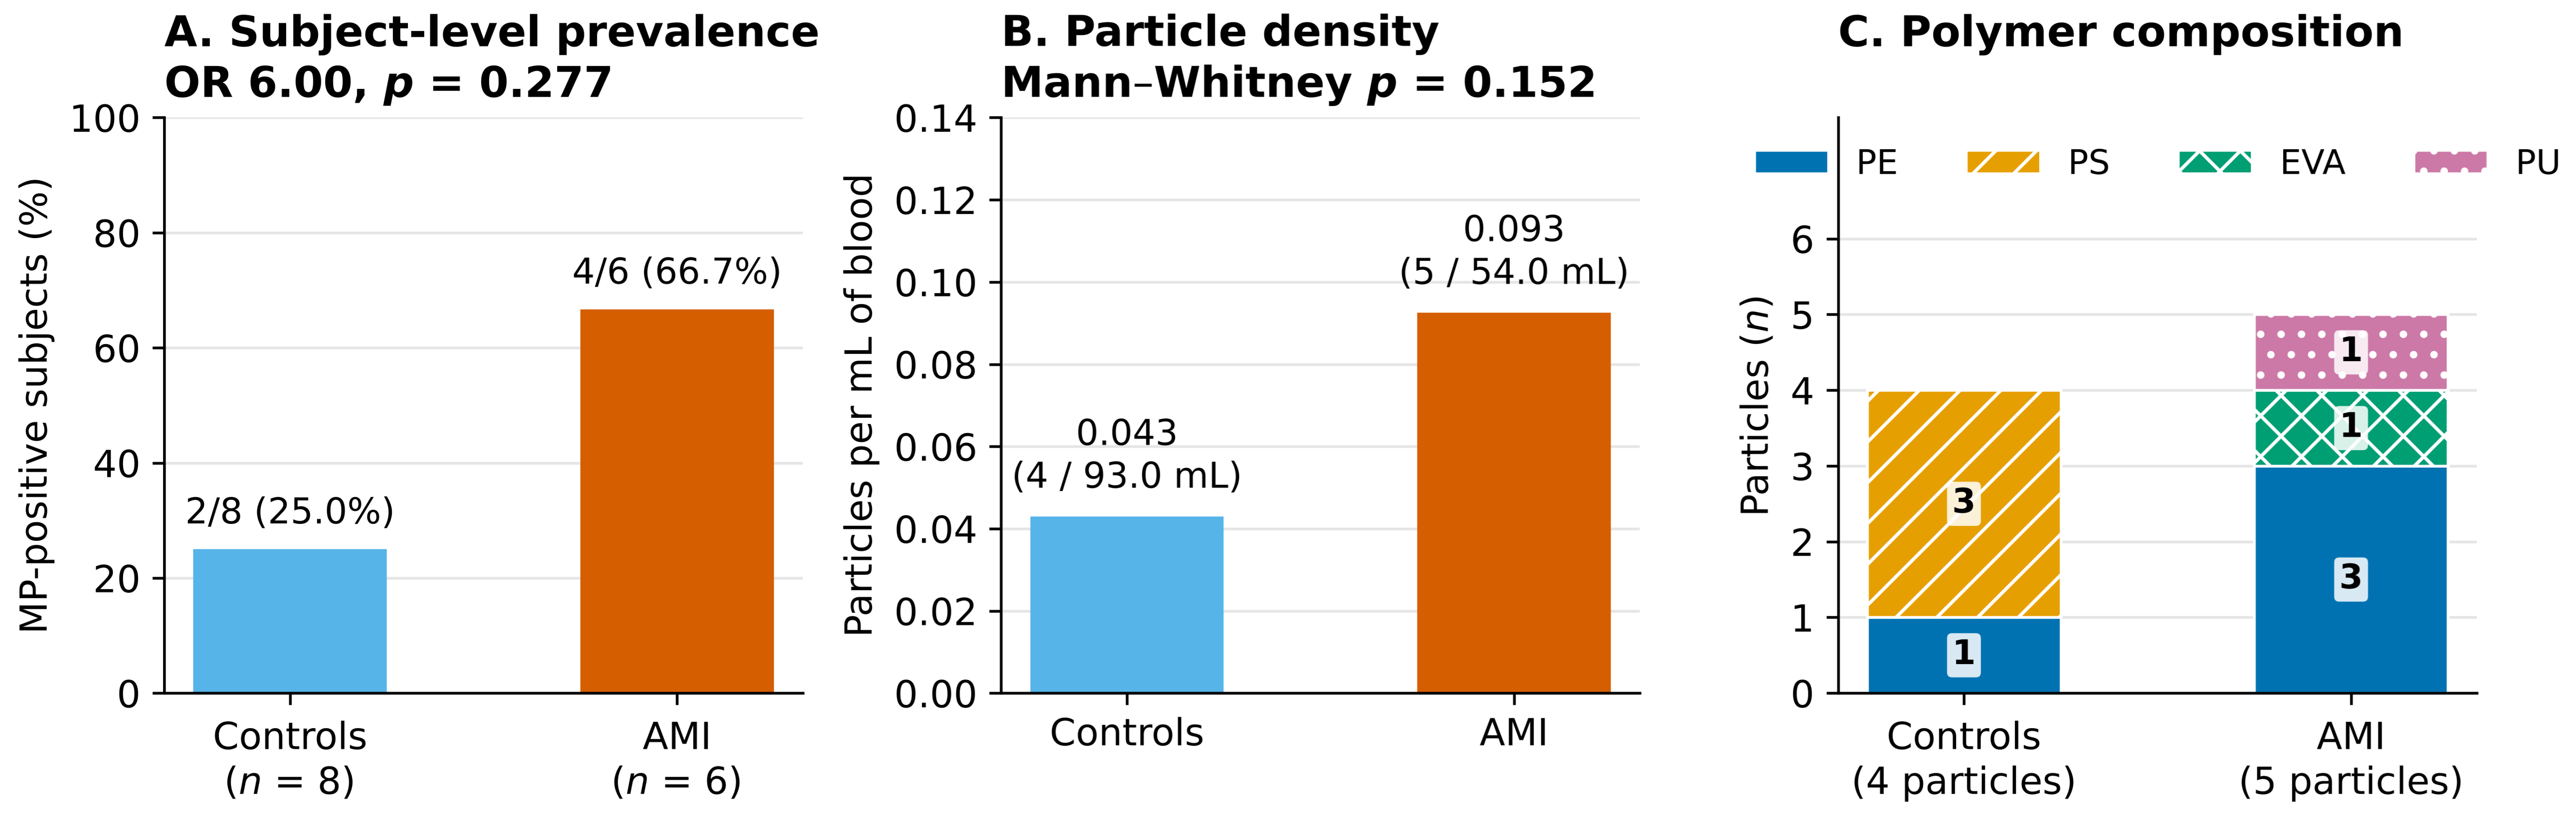
Subject-level characteristics and particle counts are given in Table 1. Microplastics were detected in four of six AMI patients (66.7%) and two of eight controls (25.0%), a difference in the expected direction that did not reach significance in a cohort of this size (OR 6.00; Fisher’s exact p = 0.277). Expressed per unit volume, particle density was 0.093 particles/mL in AMI patients (five particles in 54.0 mL) and 0.043 particles/mL in controls (four particles in 93.0 mL); the per-subject distributions did not differ (Mann–Whitney p = 0.152; Figure 3A,B).
Figure 3.
Prevalence, density and composition of circulating microplastics. (A) Subject-level prevalence; labels give the number of MP-positive subjects over the total, with the percentage. (B) Pooled particle density per millilitre of blood analysed; labels give the density and, in parentheses, the total number of particles over the total volume of blood analysed; groups were compared per subject with the Mann–Whitney U test. (C) Polymer composition by absolute particle count; numbers within the bars are the particle counts for each polymer (PE, polyethylene; PS, polystyrene; EVA, ethylene–vinyl acetate; PU, polyurethane). In (A,B), blue denotes controls and orange AMI patients. Neither prevalence nor density differed significantly between groups.
The control figure is the more informative of the two for present purposes. A prevalence of 25.0% in peripheral venous blood from healthy volunteers is close to the 31.8% reported for control subjects sampled by coronary catheterisation and assayed by Py-GC/MS and laser direct infrared spectroscopy [9]. Peripheral blood obtained by routine venipuncture is therefore not an empty compartment for this measurement, which is the principal feasibility result of this study.
Polymer composition differed qualitatively between groups (Figure 3C). Controls carried PE (n = 1) and PS (n = 3); AMI patients carried PE (n = 3), EVA (n = 1) and PU (n = 1). PS was confined to a single control subject, and EVA and PU each to a single patient. These single-subject observations cannot identify exposure pathways.
No association was found with biological sex (prevalence 4/9 in men vs. 2/5 in women; OR 1.20, p = 1.000) or with age (Spearman rho = −0.122, p = 0.677; Supplementary Text S3 and Figure S2).
3.3. Polymers Outside the Panels Used by Bulk Clinical Assays
Two of the nine recovered particles are polymers that the reference clinical assay does not test for. The Py-GC/MS workflow in [9] interrogates a predefined panel of eleven polymers: PE, PP, PS, ABS, SBR, PMMA, PC, PVC, PET, nylon 6 and nylon 66. Neither ethylene–vinyl acetate nor polyurethane appears in that list. The EVA particle was recovered and identified during the methodological validation of this workflow and has been described there [10]; we report it here in its clinical context. The PU particle is reported here for the first time.
The methodological point stands independently of how much weight either individual particle can bear. A targeted assay returns only what it is configured to seek, and in the case of EVA, the omission is not neutral: under pyrolysis, the ethylene component of EVA would at best be counted towards polyethylene, so a panel-based method would not merely miss the polymer but misattribute it. An untargeted library search places no such constraint on the result, and the same property is what allowed the blank-derived PBT particles to be recognised as PBT and removed, a polymer likewise absent from the eleven-polymer panel.
3.4. Smoking Exposure
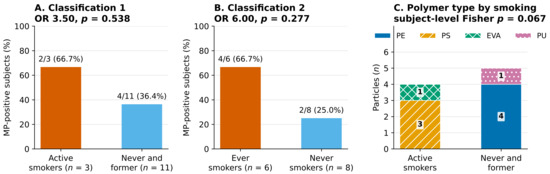
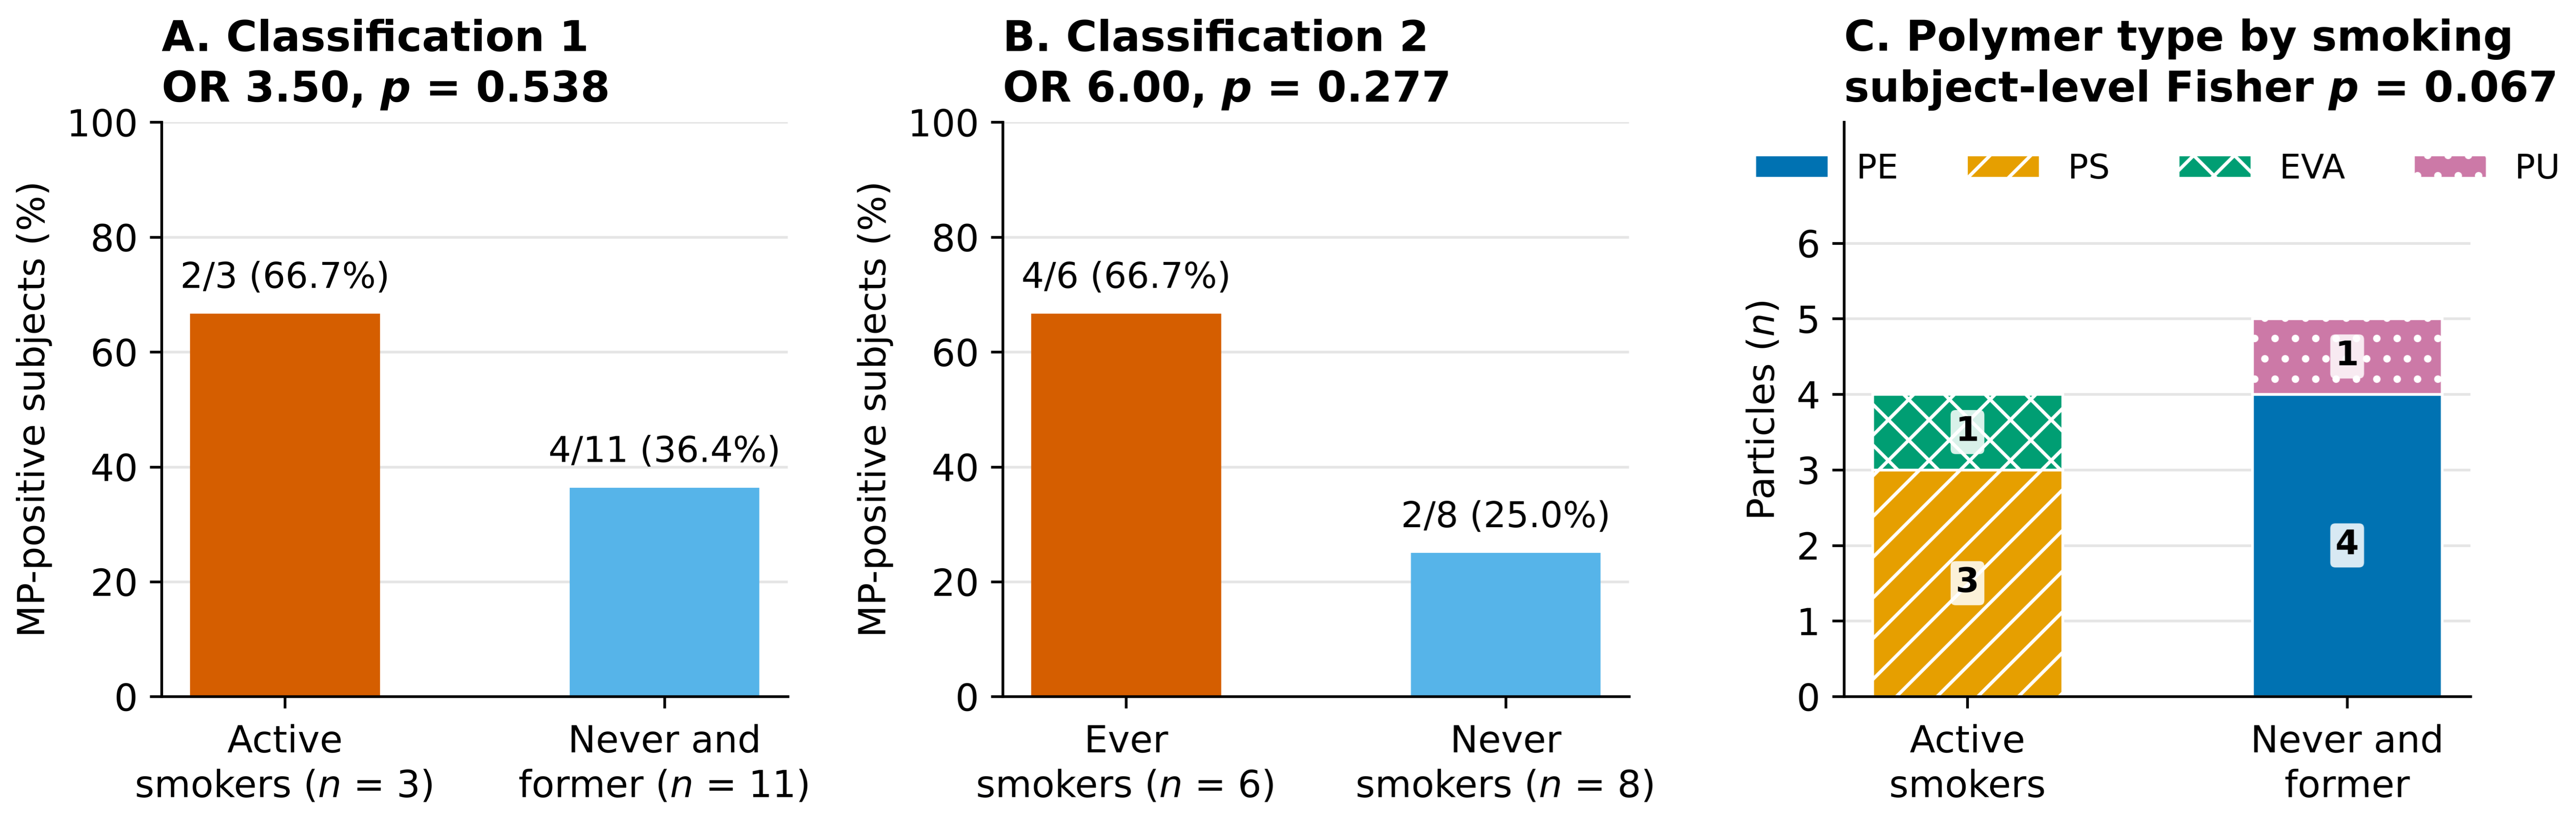
Subjects were stratified under two conventional definitions. Under Classification 1 (active smokers vs. never and former smokers), prevalence was 66.7% (2/3) vs. 36.4% (4/11) (OR 3.50, p = 0.538). Under Classification 2 (any lifetime smoking vs. never smokers), prevalence was 66.7% (4/6) vs. 25.0% (2/8) (OR 6.00, p = 0.277; Figure 4A,B).
Figure 4.
Circulating microplastics by smoking exposure. (A) Classification 1, active smokers versus never and former smokers. (B) Classification 2, any lifetime smoking versus never smokers. (C) Polymer composition by smoking status; the reported p value is the subject-level Fisher exact test, which is the primary analysis. In (A,B), orange denotes active (A) or ever (B) smokers and blue the comparison group; labels give the number of MP-positive subjects over the total, with the percentage. In (C), numbers within the bars are the particle counts for each polymer under Classification 1.
Disaggregating the three strata separately is informative about which definition carries the signal. Active and former smokers showed identical prevalence (2/3 each) and did not differ from one another (OR 1.00, p = 1.000), while each, compared with never smokers (2/8), gave OR 6.00 (p = 0.491 for each pairwise comparison). In this cohort it is lifetime smoking history rather than current smoking that tracks with the presence of circulating microplastics, which is directionally consistent with the multivariable predictor identified in [9], although no contrast here reaches significance and each stratum contains at most three subjects (Table 2).
Table 2.
Circulating microplastics by smoking stratum. Active and former smokers do not differ from each other (OR 1.00, p = 1.000); each compared with never smokers gives OR 6.00 (p = 0.491). Particle density across the three strata does not differ (Kruskal–Wallis p = 0.369).
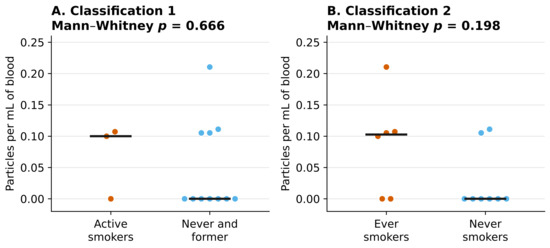
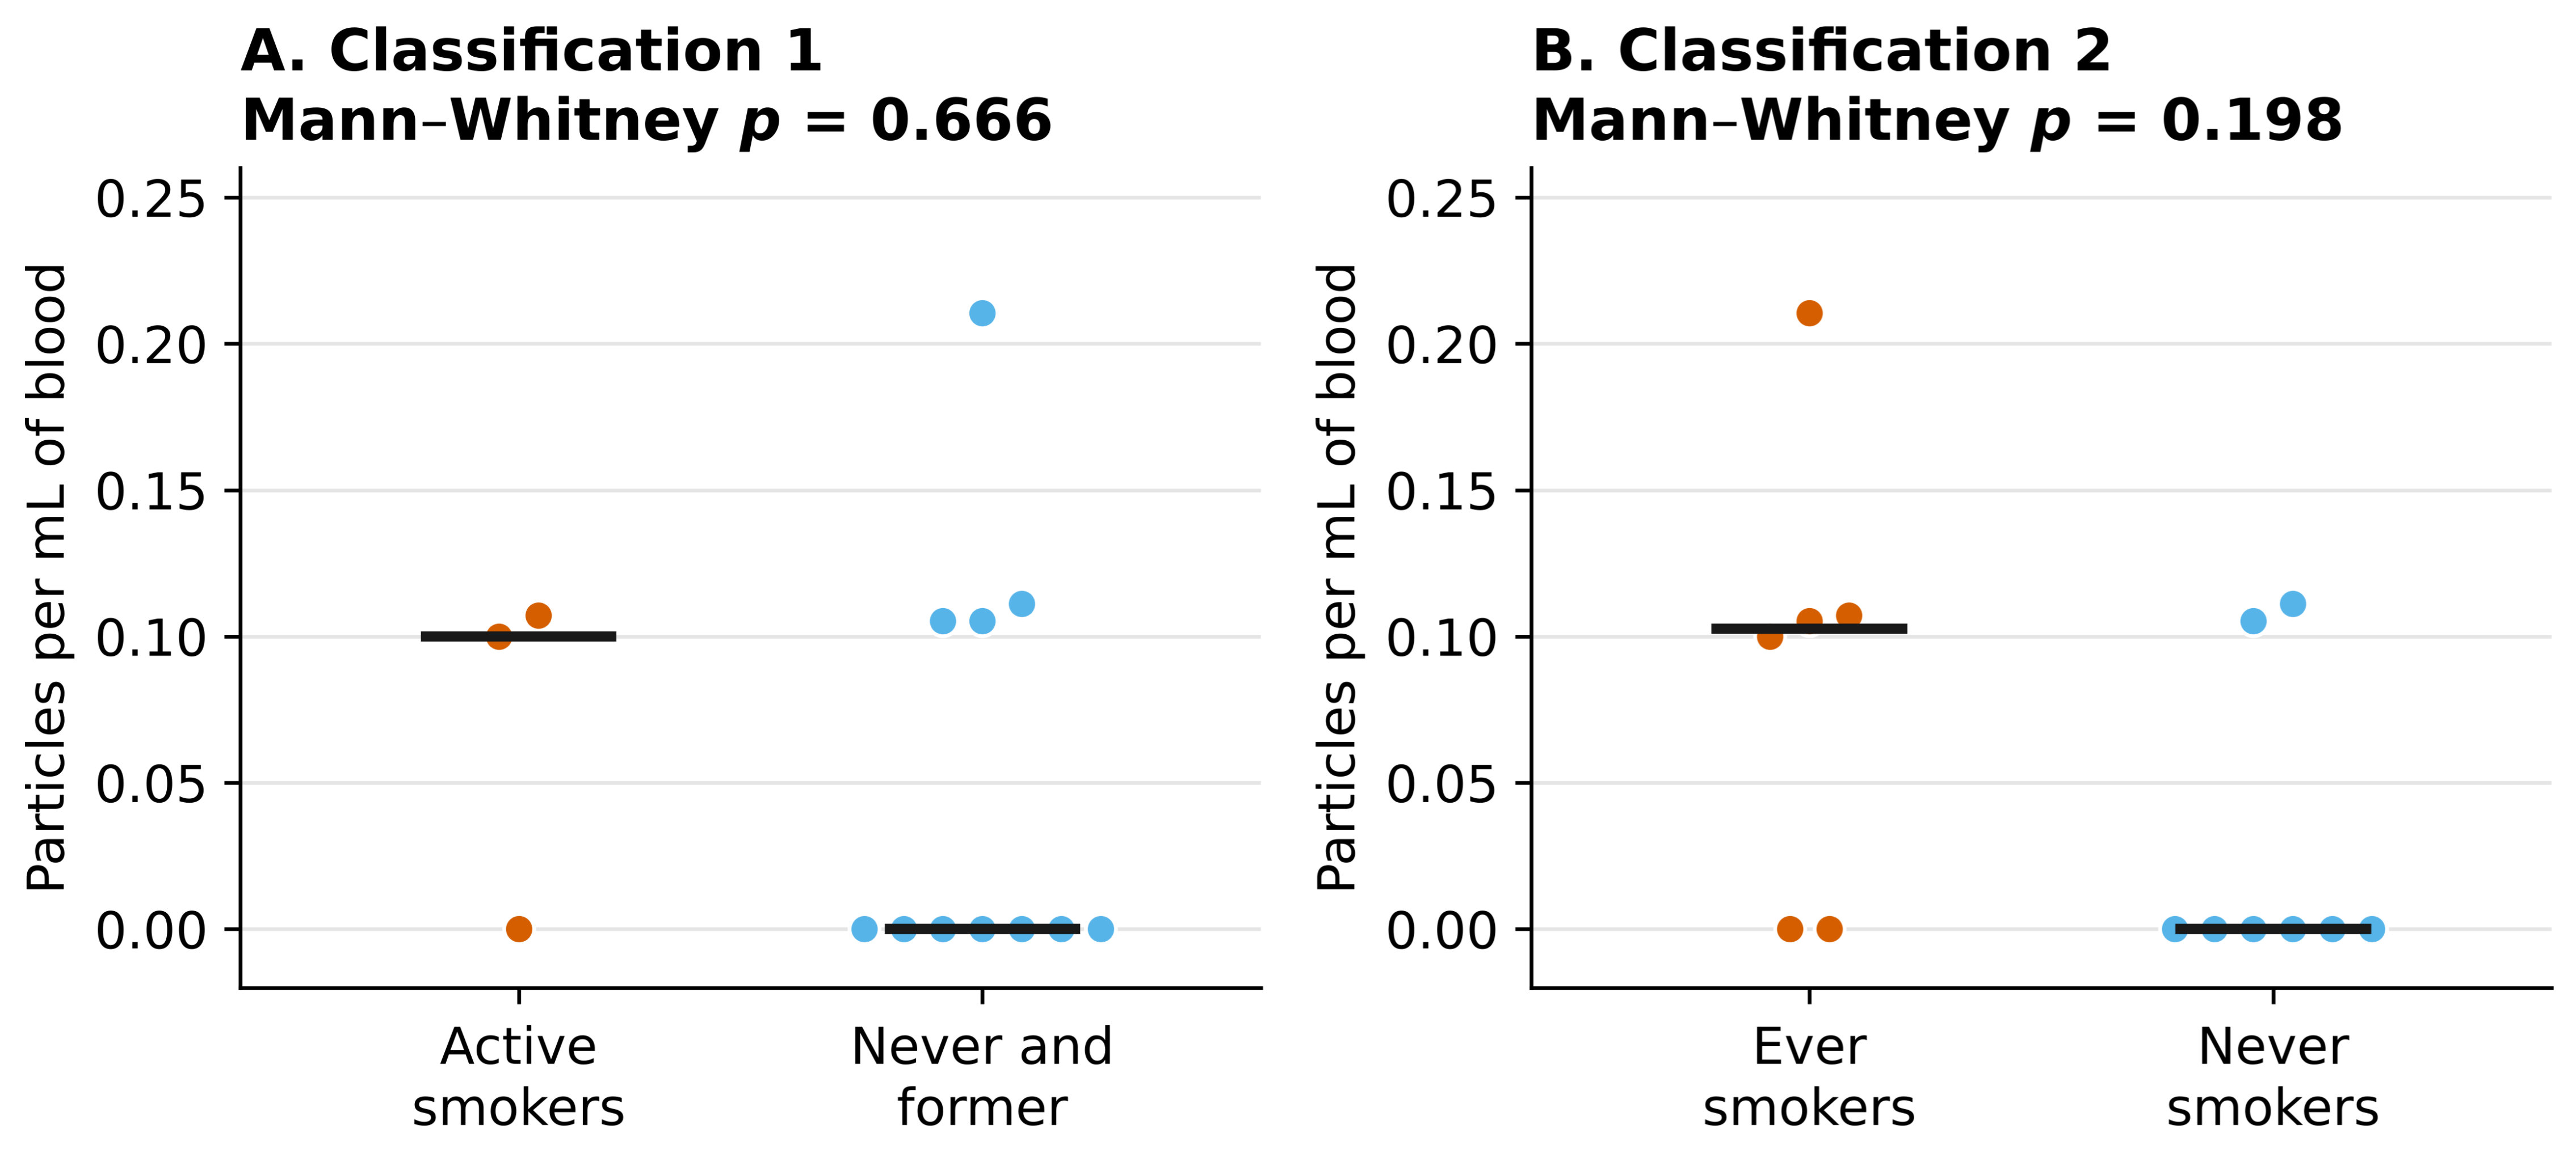
Quantitatively, subjects with any smoking history carried a higher particle density than never smokers (0.094 vs. 0.028 particles/mL; Mann–Whitney p = 0.198), and the active-smoking contrast was not significant (0.084 vs. 0.050 particles/mL, p = 0.666; Figure 5). Neither comparison approaches significance, and both are uncorrected for multiple testing.
Figure 5.
Particle density per subject stratified by smoking exposure, under both classifications. Each point is one subject (orange, active or ever smokers; blue, comparison group); points with equal or nearly equal values are offset horizontally for visibility, and horizontal bars mark group medians. Comparisons are two-sided Mann–Whitney U tests and are uncorrected for multiple comparisons.
Qualitatively, the polymers recovered from the two MP-positive active smokers were PS and EVA, while the four MP-positive never and former smokers carried PE or PU (Figure 4C). With the subject as the unit of analysis, this contrast rests on six individuals and does not reach significance (Fisher’s exact p = 0.067). We report its sensitivity explicitly, because a particle-level analysis of the same contrast violates independence and inflates the apparent evidence (Table 3).
Table 3.
Sensitivity of the smoking-polymer contrast to the unit of analysis, the assignment threshold and the a priori grouping of polymers. The smallest p value is obtained only under the particle-level analysis at the lower threshold, which is the analysis that violates independence.
The last row deserves emphasis. Grouping PS and EVA as tobacco associated and PE as environmental is an a priori assumption, not a result. EVA is a documented hot-melt adhesive in cigarette filter-rod and paper-seam assembly [13], but PS is among the polymers most commonly reported in indoor and outdoor air [9], and no cellulose acetate—the principal constituent of cigarette filters—was assigned in any sample, although we discuss in Section 4 why that non-assignment may reflect our digestion protocol rather than a true absence. When PS is treated as environmental, the contrast disappears.
3.5. Exploratory Multivariate Analysis
We performed an exploratory principal component analysis using only age, smoking status and polymer counts, excluding clinical group and sex from the feature matrix. The first two components explained 50.4% of variance (PC1 30.6%, PC2 19.8%). Agglomerative clustering on this feature set did not recover clinical group (two-cluster solution, p = 1.000; three-cluster solution, p = 0.352), nor sex. The structure that does emerge isolates the two subjects carrying PS or EVA, which restates the polymer data rather than constituting an independent discovery. We report this as a negative result (Supplementary Text S4 and Figure S3).
3.6. Paired Pre- and Post-Procedural Samples
Two patients provided an additional sample after percutaneous coronary intervention, allowing a paired within-subject comparison that was not prespecified (Table 4; Supplementary Text S5 and Table S3).
Table 4.
Paired pre- and post-procedural samples in two AMI patients. In A2, the post-procedural sample yielded a particle that the pre-procedural sample did not; in A3, both samples yielded one PE particle, and one post-procedural sample contained six particles whose spectra did not match any polymer reference above threshold—the highest count of unassigned particles in the series.
In patient A2, the pre-procedural sample contained no assignable particle, while the post-procedural sample contained one polyethylene particle. In patient A3, both samples contained one polyethylene particle, but the post-procedural sample additionally contained six particles whose spectra returned no library match above the assignment threshold—the highest count of unassigned particles anywhere in this series, against a total of two unassigned particles across all sixteen pre-procedural runs combined. With two patients, this is an observation, not a finding, and the post-PCI samples are excluded from all analyses above. We report it because percutaneous coronary intervention introduces catheters, guidewires, balloons, stents and contrast media directly into the arterial circulation, and because the principal clinical series in this field obtain blood through exactly those devices [9]. Whether instrumentation contributes measurable particles to periprocedural blood is, on this evidence, an open question that warrants a properly powered paired study—and one that only pre-procedural peripheral sampling can answer.
4. Discussion
This study shows that individual microplastic particles can be isolated from routine peripheral venous blood, drawn at the bedside before any intervention, and chemically identified by untargeted single-particle confocal Raman microspectroscopy. Within a cohort of 14 subjects, prevalence was higher in AMI patients than in controls in the expected direction but did not reach significance, and no comparison reached significance with the subject as the unit of analysis. The contribution is analytical rather than clinical, and we frame it accordingly.
Relationship to the reference clinical series [9]. The clinical question has been answered, with far greater statistical authority, by a 61-patient series using Py-GC/MS and laser direct infrared spectroscopy on coronary and peripheral blood [9]. We regard that study as the reference clinical evidence, and our results as corroborating it from a different and more accessible sampling route. Our control prevalence (25.0%) is close to theirs (31.8%); our AMI prevalence (66.7%) sits between their chronic coronary syndrome (40.0%) and STEMI (84.2%) figures, as would be expected for a mixed AMI population assayed by an optical technique that cannot resolve particles below approximately 1 µm, while a substantial part of the particle burden reported in blood lies in the submicrometre range [3]. The convergence of the control figures across two laboratories, two sampling routes and two analytical principles is, in our view, the most reassuring single observation in this dataset.
From bedside to bench. Our samples are routine venipunctures of 8–10 mL obtained at the patient’s bedside before any intervention, rather than blood drawn through arterial sheaths, guiding catheters or thrombus-aspiration microcatheters. For screening, population-level exposure assessment or serial monitoring, that difference is the difference between feasible and not: a population cohort cannot be catheterised, and a measurement cannot be repeated every six months through a femoral sheath. The demonstration that the measurement survives the move to bedside-accessible material is what makes the design of such studies possible. Our paired pre-/post-PCI observation (Section 3.6) suggests, on two patients, that the question is not merely logistical: if instrumentation contributes particles, pre-procedural peripheral blood may be the cleaner measure of environmental exposure, and the field would benefit from establishing this directly.
Untargeted versus targeted identification. Two of the nine particles recovered here, EVA and PU, are polymers absent from the eleven-polymer panel used by the reference assay [9]. The EVA particle had been identified previously during methodological validation of this workflow [10]; the PU particle is reported here for the first time. Library-based single-particle assignment is untargeted, and the practical consequence is that the catalogue does not determine the finding. This is a concrete argument for retaining spectroscopic single-particle methods alongside bulk mass-based ones rather than treating them as a lesser substitute.
Particle-level quality control and the carbonaceous background. Because each particle carries its own spectrum, a blank-derived particle can be matched and removed individually: two PBT particles in one patient were traced to a filtered-water blank and excluded, and no other clinical polymer appeared in any blank. Mass-based techniques report aggregate polymer mass and cannot perform this attribution. The same property makes the background visible. Our most consistent analytical observation is that a large share of the weak polymer assignments across this matrix belong to non-polymeric particles: on 36 of 126 sub-threshold points a non-polymeric reference outranked the polymer, and on the 28 of those in which that reference was graphite the spectra are the D and G bands of disordered carbon [12]. A matching algorithm will nonetheless score such particles as polypropylene, low-density polyethylene or polyurethane at 0.42–0.76 if no minimum correlation is imposed. We believe this deserves explicit attention in the field. Studies reporting microplastic counts from complex biological matrices at permissive correlation thresholds may be counting carbon.
The same phenomenon cuts the other way, and we have tried to be even-handed about it. Carbon black is a ubiquitous polymer additive and is resonance enhanced at 785 nm, so a genuinely plastic particle that happens to be pigmented will return a graphite match above its own polymer. The polyurethane particle in patient A4 is exactly this case: a polymer assignment at 0.80 with graphite at 0.87 on the same point. Discarding such particles on a top-ranked-match rule would systematically remove dark and pigmented microplastics from the record—a bias already recognised in Raman-based microplastic work—while retaining them silently would overstate the evidence. We have therefore retained the particle and declared the competing match, and we recommend this practice rather than either alternative.
Smoking. Our data are directionally consistent with the finding that smoking is the strongest correlate of circulating MNPs [9], but our own evidence for this is weak: no contrast reaches significance, and the closest is a qualitative polymer contrast at p = 0.067 resting on six subjects, and a sub-analysis restricted to AMI patients is not interpretable (Supplementary Text S6). We caution against interpreting the PS and EVA recovered from smokers as direct transfer from cigarette materials. Paolisso et al. note that cigarette filters are composed principally of cellulose acetate, which does not match the polymers recovered from blood, and conclude that not all MNPs in smokers originate from filters [9]. No cellulose acetate was assigned in any of our samples, but we are cautious about how much weight that absence can bear. Cellulose acetate is an ester, and ester-containing polymers are the class most vulnerable to alkaline digestion: under KOH at 40–50 °C, polyethylene terephthalate loses measurable mass within 24 h, while polyolefins are essentially unaffected [14]. The distinction matters here: ethylene–vinyl acetate retains a polyolefin backbone and remained identifiable in our positive control, whereas the spectral identity of cellulose acetate rests on its acetyl substituents, so partial deacetylation would leave a material resembling neither cellulose acetate nor cellulose. Our protocol is more aggressive still—KOH at 60 °C for 72 h—and we performed no spike-and-recovery experiment that would establish whether cellulose acetate survives it in spectrally identifiable form. The non-assignment of this polymer therefore cannot be read as evidence of its absence from the circulation. A more parsimonious reading—and the one we now favour—is that smoking acts as a vector for environmental particle exposure through repeated inhalation, hand-to-mouth transfer and smoking-induced impairment of epithelial integrity and mucociliary clearance, rather than as a direct source of specific polymers.
Polymer spectrum. The polymers recovered here (PE, PS, EVA and PU) form a narrower set than those reported in many environmental and biological studies, and polyethylene terephthalate (PET), polyvinyl chloride (PVC) and cellulose acetate were not assigned above the retention threshold in any sample. We read this as the result of three analytical trade-offs rather than as evidence of their absence from the circulation. First, alkaline digestion selects against hydrolysable polymers: ester-containing materials such as PET and cellulose acetate are vulnerable to hydrolysis and deacetylation under KOH [14], which alters the vibrational modes on which library matching depends, as discussed above for cellulose acetate. Second, confocal Raman resolves particles only down to about 1 µm, whereas Py-GC/MS measures aggregate polymer mass including the submicron fraction [3,5], so polymers concentrated in that fraction are under-represented here; in exchange, Raman is non-destructive, requires no thermal decomposition step and assigns each particle against an open library rather than a predefined panel. Third, the 0.80 threshold and particle-level blank subtraction were designed to exclude ambiguous matches and carbonaceous background, and will by the same token exclude some genuine polymer particles that match weakly. Milder digestion protocols, such as enzymatic or oxidative treatment, could widen the recoverable polymer spectrum while retaining single-particle identification, and form part of our validation agenda.
Limitations. The cohort of 14 subjects yields very low statistical power, and no a priori power calculation was possible in the absence of prior effect estimates for this matrix and workflow; the study should be read as generating such estimates rather than testing hypotheses. Clinical confounders—body mass index, diabetes, hypertension, dyslipidaemia, medication, occupational and dietary exposure—were not recorded and cannot be adjusted for, which is a material limitation given that the cohort derives from an agricultural region with plausible occupational exposure. Confocal Raman cannot reliably resolve particles below ~1 µm, so the submicron fraction is systematically missed; Py-GC/MS remains complementary for that range [3,5]. No orthogonal technique was applied to cross-validate polymer assignments, and we regard this, rather than any statistical limitation, as the central analytical weakness of the present work. No limit of detection, limit of quantification or spike-and-recovery experiment was performed, and establishing which polymers survive this protocol in spectrally identifiable form is the first item on our validation agenda. Particle size, morphology and colour were not systematically recorded, and are incorporated into our ongoing protocol. Filters were surveyed manually rather than by automated mapping, which introduces an operator-dependent sampling bias and is why we report no particle-level denominators. Finally, one control subject was analysed in three runs while every other subject was analysed once, so that subject received three times the analytical effort of the rest and had three times as much blood examined. Raw particle counts are therefore not comparable between subjects. Table 1 reports the number of runs and the blood volume analysed for each subject so that this asymmetry is visible, and every quantitative comparison in this study is expressed per millilitre of blood analysed rather than as a raw count.
5. Conclusions
Within the limits of a 14-subject study, we draw the following conclusions, all provisional and analytical rather than clinical:
- Circulating microplastic particles can be recovered from routine peripheral venous blood obtained by standard bedside venipuncture before any intervention, and chemically identified at the level of the individual particle, with traceability to procedural blanks. Prevalence in healthy controls (25.0%) is close to that reported for catheter-derived coronary blood assayed by mass-based techniques (31.8%), indicating that the accessible sampling route retains the measurement.
- Untargeted library assignment returned polyethylene, polystyrene, ethylene–vinyl acetate and polyurethane. The latter two polymers lie outside the eleven-polymer panel used by the principal bulk clinical assay, and in the case of EVA, a pyrolysis-based method would misattribute its ethylene component to polyethylene rather than simply miss it.
- The dominant analytical confounder in this matrix is carbonaceous particulate matter, which library matching scores as a polymer at correlations of 0.40–0.76, while, wherever a graphite reference is returned on the same point, ranking that graphite match higher. Any microplastic count from a complex biological matrix should state its correlation threshold and its treatment of non-polymeric competing matches.
- No contrast between AMI patients and controls, or between smoking strata, reached significance with the subject as the unit of analysis. Any association between circulating microplastics, smoking and myocardial infarction remains a hypothesis for adequately powered study.
- Paired pre- and post-procedural samples in two patients suggest that percutaneous coronary intervention may contribute particles to blood sampled afterwards. If confirmed, this would bear on the interpretation of studies that obtain blood through intravascular devices, and argues for pre-procedural peripheral sampling in exposure assessment.
Supplementary Materials
The following supporting information can be downloaded at: https://www.mdpi.com/article/10.3390/microplastics5040200/s1, Text S1: Per-Sample Processing Record and Raw Spectral Assignments; Table S1: Complete per-sample processing record and raw spectral assignments; Text S2: Quality Assurance and Quality Control; Table S2: Control samples, their purpose and outcome; Text S2b: The Carbonaceous Background; Table S2b: Sub-threshold polymer assignments and their non-polymeric competing matches; Figure S1: Competing polyurethane and graphite reference matches for the particle of patient A4; Text S3: Associations with Biological Sex and Age; Figure S2: Associations of circulating microplastics with biological sex and age; Text S4: Exploratory Multivariate Analysis; Figure S3: Principal component analysis of the cohort excluding clinical group and sex from the feature matrix; Text S5: Paired Pre- and Post-Procedural Samples; Table S3: Paired pre- and post-procedural samples; Text S6: Sub-Analysis Restricted to AMI Patients.
Author Contributions
Conceptualisation, M.d.l.Á.M.A., A.P.-S. and J.N.D.M.; methodology, A.P.-S. and J.N.D.M.; software, J.N.D.M.; validation, A.J.S.R., J.P.C. and D.M.-G.; formal analysis, J.N.D.M. and R.R.F.; investigation, M.d.l.Á.M.A., A.J.S.R., J.P.C., B.M.M. and J.C.F.; resources, M.d.l.Á.M.A., J.C.F., A.P.-S. and J.N.D.M.; data curation, A.J.S.R., J.P.C. and J.N.D.M.; writing—original draft preparation, M.d.l.Á.M.A., A.P.-S. and J.N.D.M.; writing—review and editing, all authors; visualisation, J.N.D.M.; supervision, M.I.T.L., R.R.F., A.P.-S. and J.N.D.M.; project administration, J.N.D.M.; funding acquisition, J.N.D.M. All authors have read and agreed to the published version of the manuscript.
Funding
This research was funded by the Instituto de Estudios Giennenses, 2024 call, project “Presencia de microplásticos y nanoplásticos en suero de pacientes infartados en una población agrícola: estudio piloto en Jaén”.
Institutional Review Board Statement
The study was conducted in accordance with the Declaration of Helsinki and approved by the Ethics Committee of the University of Jaén (CIOMGAB_20221121bis) and the Provincial Research Ethics Committee of Jaén (SICEIA-2025-000070).
Informed Consent Statement
Informed consent was obtained from all subjects involved in the study.
Data Availability Statement
The analysis dataset, the point-by-point spectral record and the raw Raman spectra are available from the corresponding authors on reasonable request.
Acknowledgments
The authors thank all patients and volunteers who took part in this study. During the preparation of this study, the authors used AI-assisted tools for statistical analysis, figure generation and manuscript editing. All analyses reported in this study were subsequently re-derived from the primary dataset and checked against the raw spectroscopic records; the authors have reviewed and edited all output and take full responsibility for the content of this publication.
Conflicts of Interest
The authors declare no conflicts of interest. The funders had no role in the design of the study; in the collection, analyses or interpretation of data; in the writing of the manuscript; or in the decision to publish the results.
References
- Geyer, R.; Jambeck, J.R.; Law, K.L. Production, use, and fate of all plastics ever made. Sci. Adv. 2017, 3, e1700782. [Google Scholar] [CrossRef] [Scilit] [PubMed]
- Zhao, B.; Rehati, P.; Yang, Z.; Cai, C.; Guo, Y.; Li, Y. The potential toxicity of microplastics on human health. Sci. Total Environ. 2024, 912, 168946. [Google Scholar] [CrossRef] [Scilit] [PubMed]
- Leslie, H.A.; van Velzen, M.J.M.; Brandsma, S.H.; Vethaak, A.D.; Garcia-Vallejo, J.J.; Lamoree, M.H. Discovery and quantification of plastic particle pollution in human blood. Environ. Int. 2022, 163, 107199. [Google Scholar] [CrossRef] [Scilit] [PubMed]
- Persiani, E.; Cecchettini, A.; Ceccherini, E.; Gisone, I.; Morales, M.A.; Vozzi, F. Microplastics: A Matter of the Heart (and Vascular System). Biomedicines 2023, 11, 264. [Google Scholar] [CrossRef] [Scilit] [PubMed]
- Liu, S.; Wang, C.; Yang, Y.; Du, Z.; Li, L.; Zhang, M.; Ni, S.; Yue, Z.; Yang, K.; Wang, Y.; et al. Microplastics in three types of human arteries detected by pyrolysis-gas chromatography/mass spectrometry (Py-GC/MS). J. Hazard. Mater. 2024, 469, 133855. [Google Scholar] [CrossRef] [Scilit] [PubMed]
- Wu, D.; Feng, Y.; Wang, R.; Jiang, J.; Guan, Q.; Yang, X.; Wei, H.; Xia, Y.; Luo, Y. Pigment microparticles and microplastics found in human thrombi based on Raman spectral evidence. J. Adv. Res. 2023, 49, 141–150. [Google Scholar] [CrossRef] [Scilit] [PubMed]
- Marfella, R.; Prattichizzo, F.; Sardu, C.; Fulgenzi, G.; Graciotti, L.; Spadoni, T.; D’Onofrio, N.; Scisciola, L.; La Grotta, R.; Frige, C.; et al. Microplastics and Nanoplastics in Atheromas and Cardiovascular Events. N. Engl. J. Med. 2024, 390, 900–910. [Google Scholar] [CrossRef] [Scilit] [PubMed]
- Zhang, Y.; Gao, Q.; Gao, Q.; Xu, M.; Fang, N.; Mu, L.; Han, X.; Yu, H.; Zhang, S.; Li, Y.; et al. Microplastics and nanoplastics increase major adverse cardiac events in patients with myocardial infarction. J. Hazard. Mater. 2025, 489, 137624. [Google Scholar] [CrossRef] [Scilit] [PubMed]
- Paolisso, P.; Scisciola, L.; Belmonte, M.; Scarsini, R.; Galli, V.; Gallinoro, E.; Casenghi, M.; Ausiello, D.; Vincelli, G.; Policastro, P.; et al. Micro- and nano-plastics in the coronary circulation and air pollution exposure in ischaemic heart disease presentation. Eur. Heart J. 2026, ehag447. [Google Scholar] [CrossRef] [Scilit] [PubMed]
- Sarabia, A.J.; Martínez, B.; Martínez, M.d.l.Á.; Rivera, R.; Torres, M.I.; Peñas, A.; Domínguez, J.N. Isolation and characterization of microplastics from human blood samples by confocal RAMAN microscopy. MethodsX 2026, 16, 103841. [Google Scholar] [CrossRef] [Scilit] [PubMed]
- Cowger, W.; Steinmetz, Z.; Gray, A.; Munno, K.; Lynch, J.; Hapich, H.; Primpke, S.; De Frond, H.; Rochman, C.; Herodotou, O. Microplastic Spectral Classification Needs an Open Source Community: Open Specy to the Rescue! Anal. Chem. 2021, 93, 7543–7548. [Google Scholar] [CrossRef] [Scilit] [PubMed]
- Ferrari, A.C.; Robertson, J. Interpretation of Raman spectra of disordered and amorphous carbon. Phys. Rev. B 2000, 61, 14095–14107. [Google Scholar] [CrossRef] [Scilit]
- Coggins, C.R.E.; Jerome, A.M.; Lilly, P.D.; McKinney, W.J.; Oldham, M.J. A comprehensive toxicological evaluation of three adhesives using experimental cigarettes. Inhal. Toxicol. 2013, 25, 6–18. [Google Scholar] [CrossRef] [Scilit] [PubMed]
- Pfeiffer, F.; Fischer, E.K. Various Digestion Protocols Within Microplastic Sample Processing—Evaluating the Resistance of Different Synthetic Polymers and the Efficiency of Biogenic Organic Matter Destruction. Front. Environ. Sci. 2020, 8, 572424. [Google Scholar] [CrossRef] [Scilit]

Disclaimer/Publisher’s Note: The statements, opinions and data contained in all publications are solely those of the individual author(s) and contributor(s) and not of MDPI and/or the editor(s). MDPI and/or the editor(s) disclaim responsibility for any injury to people or property resulting from any ideas, methods, instructions or products referred to in the content. |
© 2026 by the authors. Licensee MDPI, Basel, Switzerland. This article is an open access article distributed under the terms and conditions of the Creative Commons Attribution (CC BY) license.