


Abstract
In recent years, microplastics (MPs) pollution in agricultural soils has increased markedly, largely due to the improper management of plastic mulch films used to improve crop growing conditions. In this context, the present study evaluated the use of biochar (BC) as a soil amendment for mulch-derived MPs-contaminated soils in a radish (Raphanus sativus L.) crop under greenhouse conditions. A pot experiment was established in soils contaminated with MPs (0.5% w/w) and amended with four BC rates (w/w): 0% (Control), 1% (BC1), 3% (BC3), and 5% (BC5). Soil physicochemical indicators were assessed, together with germination, leaf, and radish bulb growth parameters. The experiment was conducted under greenhouse conditions until the radishes reached commercial maturity. Most of the soil’s physicochemical indicators, such as hydrogen potential (pH), electrical conductivity (EC), water holding capacity (WHC), total organic carbon (TOC), organic matter (OM), total nitrogen (TN), ammonium (N–NH4+) and nitrates (N–NO3−), showed significant differences between treatments (p < 0.05), with the exception of the carbon-nitrogen ratio (C/N), which did not vary significantly (p ≥ 0.05). No significant differences were observed among treatments (p ≥ 0.05) for germination indicators. For leaf traits, dry biomass was significantly lower in BC1 than in the other treatments (p < 0.05). For radish bulb traits, fresh weight was significantly higher in BC3 (p < 0.05) compared with the other treatments. Similarly, total plant fresh weight showed significant differences among treatments, with BC3 exhibiting the highest value (p < 0.05). Overall, the BC3 treatment provided the greatest improvement in radish development in MPs-contaminated soil. However, further research involving different types of MPs, BCs, or other crop species is needed to more comprehensively assess the impact of BC on agricultural soils contaminated with MPs.
1. Introduction
Unfortunately, the release of microplastics (MPs) into the environment continues to rise, with the potential to affect both soil properties and plant growth [1]. MPs, commonly defined as persistent plastic particles smaller than 5 mm, encompass a broad range of physicochemical characteristics [2]. Because these properties differ markedly from those of mineral and organic soil constituents, their presence can modify key soil parameters such as bulk density (BD), aggregate stability, hydrogen potential (pH), and electrical conductivity (EC). These changes may, in turn, influence other indicators of soil quality and ecosystem functioning. Multiple pathways contribute to the accumulation of MPs in soils, including mismanaged plastic waste, the application of sewage sludge and treated wastewater, irrigation water, agricultural plastic films, and both organic and mineral fertilizers [3]. One of the most significant sources among these is the use of plastic film mulch. This agricultural input has proven highly effective in regulating soil temperature and moisture, reducing pesticide requirements, preventing erosion, and suppressing weed growth [2,4]. However, inadequate end-of-life management of mulch films can lead to their fragmentation into large quantities of MPs, thereby making a substantial contribution to microplastic contamination in agricultural soils.
Plastic waste can detrimentally affect soil structure, water holding capacity (WHC), and other critical properties, ultimately undermining the sustainable use of agricultural land [4]. Moreover, owing to their low biodegradability, MPs can persist in soils for extended periods, exerting adverse impacts on both physicochemical and biological soil indicators [3,5]. Among the most prevalent MPs in agricultural soils are polyethylene (PE) particles, frequently associated with the use of plastic mulch [6]. In addition to altering soil properties, MPs have been reported to reduce total plant biomass and decrease plant height and root length [7,8]. These effects are likely linked to shifts in rhizosphere microbial communities, which in turn can impair plant growth and development [9].
Biochar (BC) is a porous carbonaceous material produced by the thermochemical conversion of organic matter (OM) under oxygen-limited conditions [10]. Its application as a soil remediation agent has gained increasing prominence in agriculture due to its favorable properties. The physicochemical characteristics of BC, including its three-dimensional, highly porous structure, make it an effective tool for long-term carbon (C) sequestration, as well as for the adsorption and, in some cases, degradation of contaminants [4]. In addition, BC exhibits distinctive chemical, physical, and biological attributes that render it a highly versatile material with multiple environmental and agronomic applications [11]. Its potential as an accessible and strategic resource for sustainable agriculture lies in its capacity to retain substantial amounts of C in soil over extended periods, thereby improving soil fertility, enhancing crop yields, and contributing to climate change mitigation [12]. BC also acts as an efficient reservoir for nutrients and water, further promoting soil fertility and plant growth [3,13]. Moreover, owing to its high C and hydrogen (H) content and absorbent properties, BC has been proposed as a promising strategy to mitigate soil contamination by MPs in agricultural systems [14].
Radish (Raphanus sativus L.) is a root vegetable widely cultivated and consumed worldwide, most commonly eaten raw, particularly in salads. Cultivated varieties exhibit a broad range of skin colors (red, purple, black, yellow, white, and pink), while the inner flesh is typically white [15]. According to Jiang et al. [16], radish is widely used in environmental pollution assessment owing to its well-developed root system. Similarly, Wang et al. [17] report that radish forms a pronounced storage organ and can serve as an indicator species in ecological assessments of seed germination, as well as root and shoot growth.
In this context, the present study aimed to evaluate the effects of applying different concentrations of BC on radish germination and growth, as well as on the properties of soils contaminated with MPs derived from plastic film mulch. Our hypothesis is that applying BC at some of the concentrations used improves both plant and soil characteristics. It is expected that the findings will support the development of strategies to improve the quality and productivity of agricultural soils affected by this type of contamination.
2. Materials and Methods
The experiment was conducted in a tunnel-type greenhouse (4.6 m long × 2.1 m wide × 2.1 m high) covered with a PE film. The greenhouse is located at the National Technological Institute of Mexico (TecNM), Celaya campus, in Celaya, Guanajuato, Mexico (20°32′16.3″ N, 100°48′53.9″ W). Radish plants were grown in soil contaminated with MPs originating from plastic mulch film. BC was incorporated as a soil amendment at four rates (0%, 1%, 3%, and 5% w/w) to evaluate its effects on soil properties, as well as on seed germination, plant growth, and leaf and radish bulb development. Germination indicators were assessed during the first week of the experiment, specifically on days 3 and 7 after sowing. At harvest, soil, leaf, radish bulb, and whole-plant (leaf + bulb) indicators were determined to quantify the response of the radish–soil system to BC application under MPs-contaminated conditions.
2.1. Soil
The experiment was conducted using agricultural soil collected in the municipality of Celaya, Guanajuato, Mexico (20°28′27.0″ N, 100°49′51.2″ W). The history of agricultural management of this soil in recent years has been the cultivation of alfalfa in rotation with barley and corn crops. It has been cultivated and irrigated using common practices. This ensures that the soil meets the conditions of fertile soil. Soil sampling followed the guidelines of NOM-021-RECNAT-2002 [18]. A representative area of 4800 m2 was delineated and subdivided into three sections of 1600 m2 each. Within each section, samples were collected in a zigzag pattern from the arable layer (0–30 cm). Ten subsamples per section were obtained and combined to form one composite sample of approximately 20 kg per section, yielding a total of 60 kg of soil. The soil was transported to the laboratory in plastic bags, air-dried, homogenized, and passed through a 2 mm sieve. Finally, the processed soil was stored at 4 °C until subsequent physicochemical characterization.
2.2. Biochar and Microplastics
The BC used in this study was purchased from P. F. Harris Manufacturing Company, LLC (Cartersville, GA, USA) and was produced by pyrolysis of pine wood, according to the supplier’s specifications. The main reason for choosing a commercial BC, especially one made from pine wood, was its constant availability and controlled purity as a commercial product, which ensures greater consistency and reproducibility in future experiments, unlike other BCs such as those made from agricultural waste that can vary seasonally or by production batch. MPs were generated from agricultural plastic mulch film, a material widely used in crop production and recognized as a significant source of MPs in agricultural soils [19]. The mulch film was obtained from Grupo Los Encinos (Puebla, Mexico), with a thickness of 100 gauge and a silver-on-black color pattern. According to the manufacturer, the black layer suppresses weed growth, whereas the silver layer reflects light and heat, reducing aphid and whitefly activity and enhancing photosynthesis by reflecting solar radiation. For the experiment, the plastic film was cut with scissors into fragments of approximately 1 mm2. Subsequently, the fragments were passed through a 2 mm sieve to ensure the fragment size.
2.3. Characterization of Materials
2.3.1. Physicochemical Characterization of Soil and Biochar
The physicochemical characterization of the soil and BC was performed in triplicate. Soil texture was determined by granulometric analysis using the Bouyoucos hydrometer method [20], obtaining the sand (SND), silt (SLT), and clay (CLY) fractions, expressed as percentages. Texture class was assigned using the U.S. Department of Agriculture (USDA) textural triangle [21]. Soil pH was measured following Thomas et al. [22] in a 1:2.5 (w/v) soil-to-water suspension using a Denver Instrument UB-10 pH/mV meter (Denver, CO, USA). Soil EC was determined according to Hendrickx et al. [23] in a 1:5 (w/v) soil-to-water extract using a Horiba F-74BW digital multimeter (Horiba Ltd., Kyoto, Japan), and values were expressed in dS m−1. WHC was evaluated following Alef and Nannipieri [24] by placing 20 g of dry soil on Whatman No. 2 filter paper (Whatman Inc., Solna, Sweden), adding 100 mL of distilled water, and allowing the system to equilibrate for 24 h. WHC was calculated from the difference in weight between the wet filter with soil and the dry filter (control) and expressed as a percentage. Total organic carbon (TOC) was determined by chemical oxidation with 5% (w/v) potassium dichromate (K2Cr2O7) on 1 g of dry soil, and the resulting concentration was quantified at 600 nm using a Metash UV-5300H spectrophotometer (Shanghai Metash Instruments Ltd, Shanghai, China), following the colorimetric method of Walkley and Black [25]. All spectrophotometric measurements were obtained with the same instrument. OM was estimated by multiplying TOC by the Van Bemmelen factor (1.724) [26]. Total nitrogen (TN) was determined according to Bremner [27] using 0.7 g of dry soil and an MDK-6 Kjeldahl microdigester (Novatech, San Pedro Tlaquepaque, Mexico) for sample digestion; TN was quantified at 660 nm and expressed as a percentage. The carbon-to-nitrogen ratio (C/N) was calculated from TOC and TN values. Ammonium (N–NH4+) and nitrate (N–NO3−) contents were determined by extraction with 0.5 M potassium sulfate (K2SO4) in a 1:5 (w/v) soil-to-extractant ratio, following the procedure described by Conde et al. [28]. Spectrophotometric determinations of N–NH4+ and N–NO3− were carried out at 660 nm and 410 nm, respectively, following Alef and Nannipieri [24], and results were expressed as mg N kg−1 dry soil. Exchangeable cations, including potassium (K+), calcium (Ca2+), magnesium (Mg2+), and sodium (Na+), were quantified after microwave-assisted digestion by inductively coupled plasma (ICP), according to the procedure for determining exchangeable bases in soil via ammonium acetate extraction and ICP–PLASMA analysis; results were expressed as meq 100 g−1 dry soil [29]. Cation exchange capacity (CEC) was determined following the methodology of Cottenie [30] and reported as meq 100 g−1 dry soil. As for the BC, pH and EC were determined using a 1:20 (w/v) BC-to-water suspension [31]; EC values were expressed in dS m−1. The humidity and ash content were determined according to the international standard procedure [32], expressed as a percentage. Organic carbon (OC) and OM were determined by the calcination method [33], expressed as a percentage. Total carbon (TC) and TN were determined by the Dumas combustion method [34], expressed as a percentage. Finally, phosphorus (P), potassium (K) and sulfur (S) were determined by microwave digestion/ICP-OES [35], expressed as a percentage.
2.3.2. Molecular Characterization of Biochar and Microplastics
The functional groups of BC were analyzed by Fourier transform infrared spectroscopy (FTIR) using a Thermo Scientific Nicolet iS10 spectrophotometer (Thermo Fisher Scientific, Inc., Waltham, MA, USA). Translucent potassium bromide (KBr) pellets were prepared, and spectra were acquired in reflectance mode over the range 4000–400 cm−1, with a resolution of 8 cm−1 and 25 scans per sample [36]. In parallel, MPs obtained from plastic mulch were characterized molecularly by attenuated total reflectance FTIR (ATR-FTIR) using the same instrument equipped with a ZnSe ATR unit (Thermo Fisher Scientific, Inc., Waltham, MA, USA). Spectra were recorded in reflectance mode over the range 4000–500 cm−1, with a resolution of 8 cm−1 and 25 scans [37].
2.4. Experimental Design in Greenhouse
The experiment was conducted using a completely randomized design. A MPs concentration of 0.5% (w/w) was selected based on previous studies reporting negative effects on soil quality [38] and on documented levels of MPs in agricultural soils where plastic mulch is used [39]. Four treatments were established with three replicates per treatment, for a total of 36 experimental units: Control (soil without BC), BC1 (soil with 1% w/w BC), BC3 (soil with 3% w/w BC), and BC5 (soil with 5% w/w BC).
Prior to radish sowing, and following the supplier’s recommendations, soil was pre-incubated with BC for seven days. BC was mixed thoroughly with the soil according to each treatment, and distilled water was added to reach field capacity. Each treatment was implemented in pots measuring 12 cm in height, 14 cm in upper diameter, and 10 cm in lower diameter. After seven days of pre-incubation, MPs were incorporated into the soil to achieve a final concentration of 0.5% (w/w) in all treatments. Each pot was filled with 600 g of treated soil and sown with 20 radish seeds (Raphanus sativus L., cv. Champion) purchased from Semillas El Trébol (Cuautitlán, Mexico).
The experiment started on 23 October 2024. Throughout the experimental period, soil moisture was maintained at approximately 30% (w/w) using the gravimetric (weighing) method to meet the water requirements of radish plants. Greenhouse temperature and relative humidity were continuously monitored with a UbiBot WS1 WiFi wireless temperature and humidity logger equipped with an external temperature probe. Harvest was performed once the radishes reached commercial maturity.
2.5. Soil and Plant Analysis
2.5.1. Soil Collection and Characterization
To evaluate the effect of BC on soils contaminated with MPs, soil samples were collected from each treatment immediately after harvest. Samples were air-dried, and physicochemical indicators (pH, EC, WHC, TOC, OM, TN, C/N, N–NH4+, and N–NO3−) were determined following the methodologies described in Section 2.3.1.
2.5.2. Germination Parameters
To assess germination, the number of seedlings emerged in each pot was recorded three and seven days after sowing. Based on these data, germination rate (GR), germination vigor (GV), and germination speed (GS) were calculated using Equations (1)–(3), respectively [40].
2.5.3. Plant Collection and Characterization
Radish plants were harvested once they reached commercial maturity. Bulbs and leaves were carefully rinsed with distilled water to remove adhering soil particles prior to measurement. Bulb length and diameter were determined using an electronic digital caliper (Shanghai Hengliang Measuring Tool Co, Ltd., Shanghai, China), and leaf length was measured with the same instrument. Fresh weights of bulbs and leaves were recorded with a Citizen CX 220 analytical balance (Citizen Pvt. Ltd., Gosheim, Germany). Dry biomass of bulbs and leaves was obtained by drying samples at 65 °C to constant weight in a RIOSSA® HCF-41 oven (RIOSSA, Zapopan, Mexico) [41]. Moisture content was calculated from the difference between fresh and dry weights. Based on these measurements, total plant weight, total dry biomass, and total moisture content (bulbs + leaves) were calculated.
2.6. Statistical Analysis
All experiments in this study were performed in triplicate. Prior to statistical analysis, data normality was evaluated using the Anderson–Darling test (p ≥ 0.05). Subsequently, data were analyzed in Minitab 18 (Minitab, LLC, State College, PA, USA, 2017) and subjected to analysis of variance (ANOVA) to assess treatment effects (p < 0.05). When significant differences were detected, Fisher’s least significant difference (LSD) test (p < 0.05) was applied for pairwise comparison of treatment means. Graphs were generated using OriginPro 9.0 (OriginLab Corporation, Northampton, MA, USA).
3. Results and Discussion
Throughout the experiment, the average temperature in the greenhouse was 19.77 °C, and the average relative humidity was 58.69%. These conditions were found to be optimal for radish growth.
3.1. Soil and Biochar Characterization
The results of the soil characterization used in this experiment are presented in Table 1. The soil exhibited a clay texture (26.76% sand, 51.24% clay, and 22.05% silt) according to the USDA texture triangle, with an BD of 1.26 g cm−3. Castelán-Vega et al. [42] note that this soil texture contributes to low porosity, suggesting that the incorporation of BC could effectively mitigate this issue. In agreement with this, Hazelton & Murphy [43] highlight that soils with a clay texture and an apparent density between 1.2 and 1.4 g cm−3 are susceptible to compaction. Regarding pH and EC, values of 7.11 and 0.23 dS m−1 were recorded, respectively. Both values fall within the optimal range for fertile soils, as outlined by NOM-021-RECNAT-2002 [18]. The pH of 7.11 is considered neutral (6.6–7.3), which is suitable for most crops [43]. Additionally, EC values below 1 dS m−1 are typically associated with negligible salinity effects [18]. The soil’s WHC was 98.14%, and the TOC content was 1.7%, equivalent to 2.99% OM. This OM value is considered average for agricultural soils (1.6–3.5%) according to NOM-021-RECNAT-2002 [18]. TN was measured at 0.21%, and the C/N ratio was 7.99. While the TN value is within the typical range, the C/N ratio is lower than the recommended value for agricultural soils, where the ideal range is between 10 and 12 [43]. Soils with low values for OM are more susceptible to degradation [43], making the incorporation of BC a promising strategy to increase OM and mitigate its gradual loss. Regarding inorganic nitrogen, the values obtained for N–NH4+ and N–NO3− were 15.28 mg N–NH4+ kg−1 dry soil and 36.64 mg N–NO3− kg−1 dry soil, respectively, which are considered adequate for agricultural soils [43]. In terms of exchangeable cations, the values obtained were 23.33 meq 100 g−1 for Ca2+, 5.97 meq 100 g−1 for Mg2+, 1.68 meq 100 g−1 for K+, and 1.26 meq 100 g−1 for Na+. These values fall within the high range for Mg2+, K+, and Na+, and are considered very high for Ca2+ [43]. Finally, the CEC was measured at 32.27 meq 100 g−1, which is classified as high for agricultural soils (25–40 meq 100 g−1). This value is particularly significant, as CEC plays a critical role in regulating soil structural stability, nutrient availability for plant growth, soil pH, and the soil’s response to fertilizers and other soil amendments [43].
Table 1.
Physicochemical characterization of the soil.
The physicochemical characterization of the BC used in the experiment is presented in Table 2. The BC showed a pH of 10.2 and an EC of 8.16 dS m−1, values that were higher than those recorded in the soil. Usha et al. [44] found that the pyrolysis temperature is crucial for determining the pH of BC, reporting values between 6.29 and 8.39 for BC obtained from pine wood at 450 °C and 650 °C, respectively. Brar et al. [45] found a similar pH value (9.9), although their EC value (1.54 dS m−1) was lower than that of our BC. Regarding other physical properties, the moisture and ash content were 8.33% and 10.4%, respectively. This latter value agrees with the 10.1% reported by Bernárdez-Rodas et al. [46] for pine wood BC. The material presented OC values of 52% and OM values of 89.6%. These values are key to improving the amount of organic matter in soil with degradation problems or contamination issues. Among the key chemical indicators are TC and TN, with values of 71.61% and 1.01%, respectively, obtained for each indicator. The TC value is similar to the 71.95% obtained by Bernárdez-Rodas et al. [46] for pine wood BC. The TN levels are higher than those reported by Ahmed et al. [47], who found values between 0.7% and 0.8% for different parts of the pine. Finally, concentrations of P, K and S of 0.2%, 1.43% and 0.07%, respectively, were obtained. These values are within the range (0.01–0.13%) reported by Usha et al. [44] for S in pine wood BC obtained at different temperatures.
Table 2.
Physicochemical characterization of biochar.
3.2. Molecular Characterization of Biochar and Microplastics
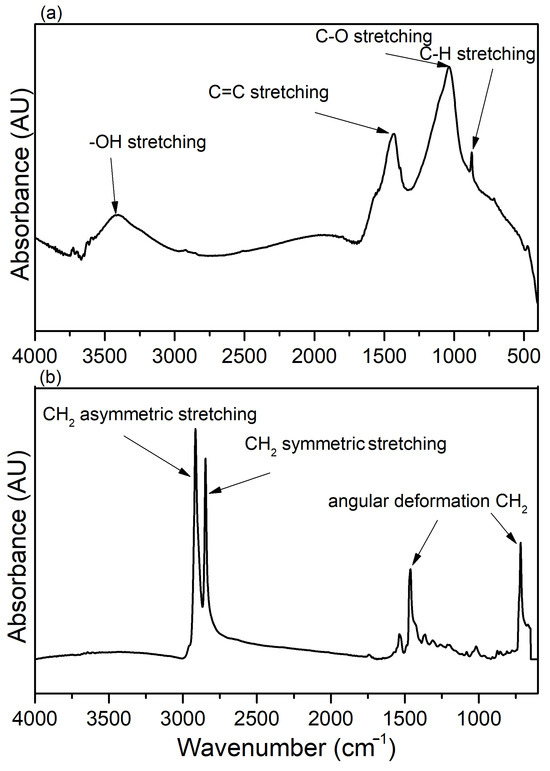
Figure 1a presents the FTIR spectrum of the BC used in the experiment, obtained using a KBr pellet. FTIR spectroscopy provides detailed insights into the functional groups present in the OM of BC. The most prominent peaks are observed at approximately 871 cm−1, 1039 cm−1, 1432 cm−1, and 3411 cm−1, corresponding to aromatic C–H stretching, C–O stretching, aromatic C=C stretching, and −OH stretching, respectively. According to Song et al. [48], the peak near 871 cm−1 may be attributed to an increase in the condensation of organic compounds in BC. The broad band in the 3000–3600 cm−1 range clearly indicates the presence of −OH groups, which may represent both moisture and phenolic groups [48]. Lastly, the peak around 1039 cm−1 is associated with C–O vibrations [48].
Figure 1.
(a) Fourier transform infrared spectroscopy (FTIR) spectrum of the biochar (BC) used in the experiment, acquired using a KBr pellet, and (b) Attenuated total reflectance Fourier transform infrared spectroscopy (ATR-FTIR) spectrum of the plastic mulch used in the experiment to extract microplastics (MPs).
Figure 1b presents the FTIR spectrum of the plastic mulch used in the experiment, obtained via ATR-FTIR analysis. The prominent peaks at 2923 cm−1, 2855 cm−1, 1534 cm−1, 1453 cm−1, and 716 cm−1 are clearly evident. According to Hernández et al. [49], these bands are characteristic of PE. The two most intense peaks, at 2923 cm−1 and 2855 cm−1, correspond to the asymmetric and symmetric stretching vibrations of -CH2, which are typical of plastic polymers. The peaks at 1453 cm−1 and 716 cm−1 indicate angular deformation of -CH2, a feature that is particularly distinctive of PE compared to other polymers [49].
3.3. Soil Parameters After Harvest
The results of the ANOVA for soil indicators across the four treatments are presented in Table 3. The C/N ratio did not show significant differences between treatments (p ≥ 0.05). In contrast, EC, WHC, N-NH4+, and N-NO3− concentrations exhibited significant differences (p < 0.05). Additionally, the remaining soil indicators demonstrated highly significant differences (p < 0.01).
Table 3.
One-way analysis of variance of soil.
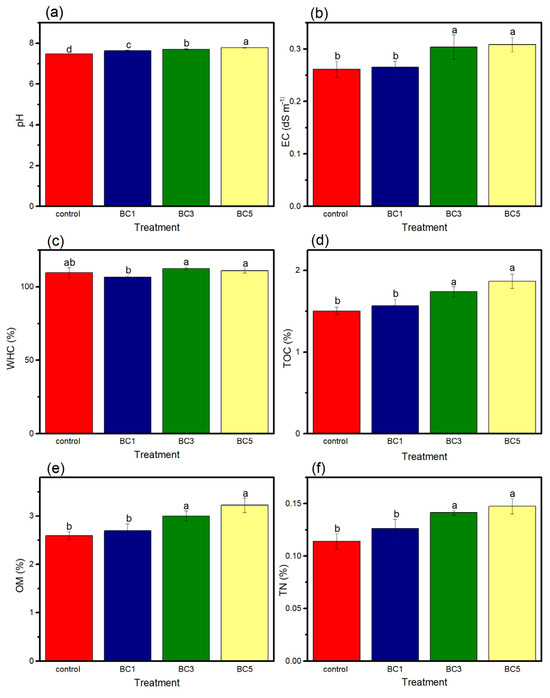
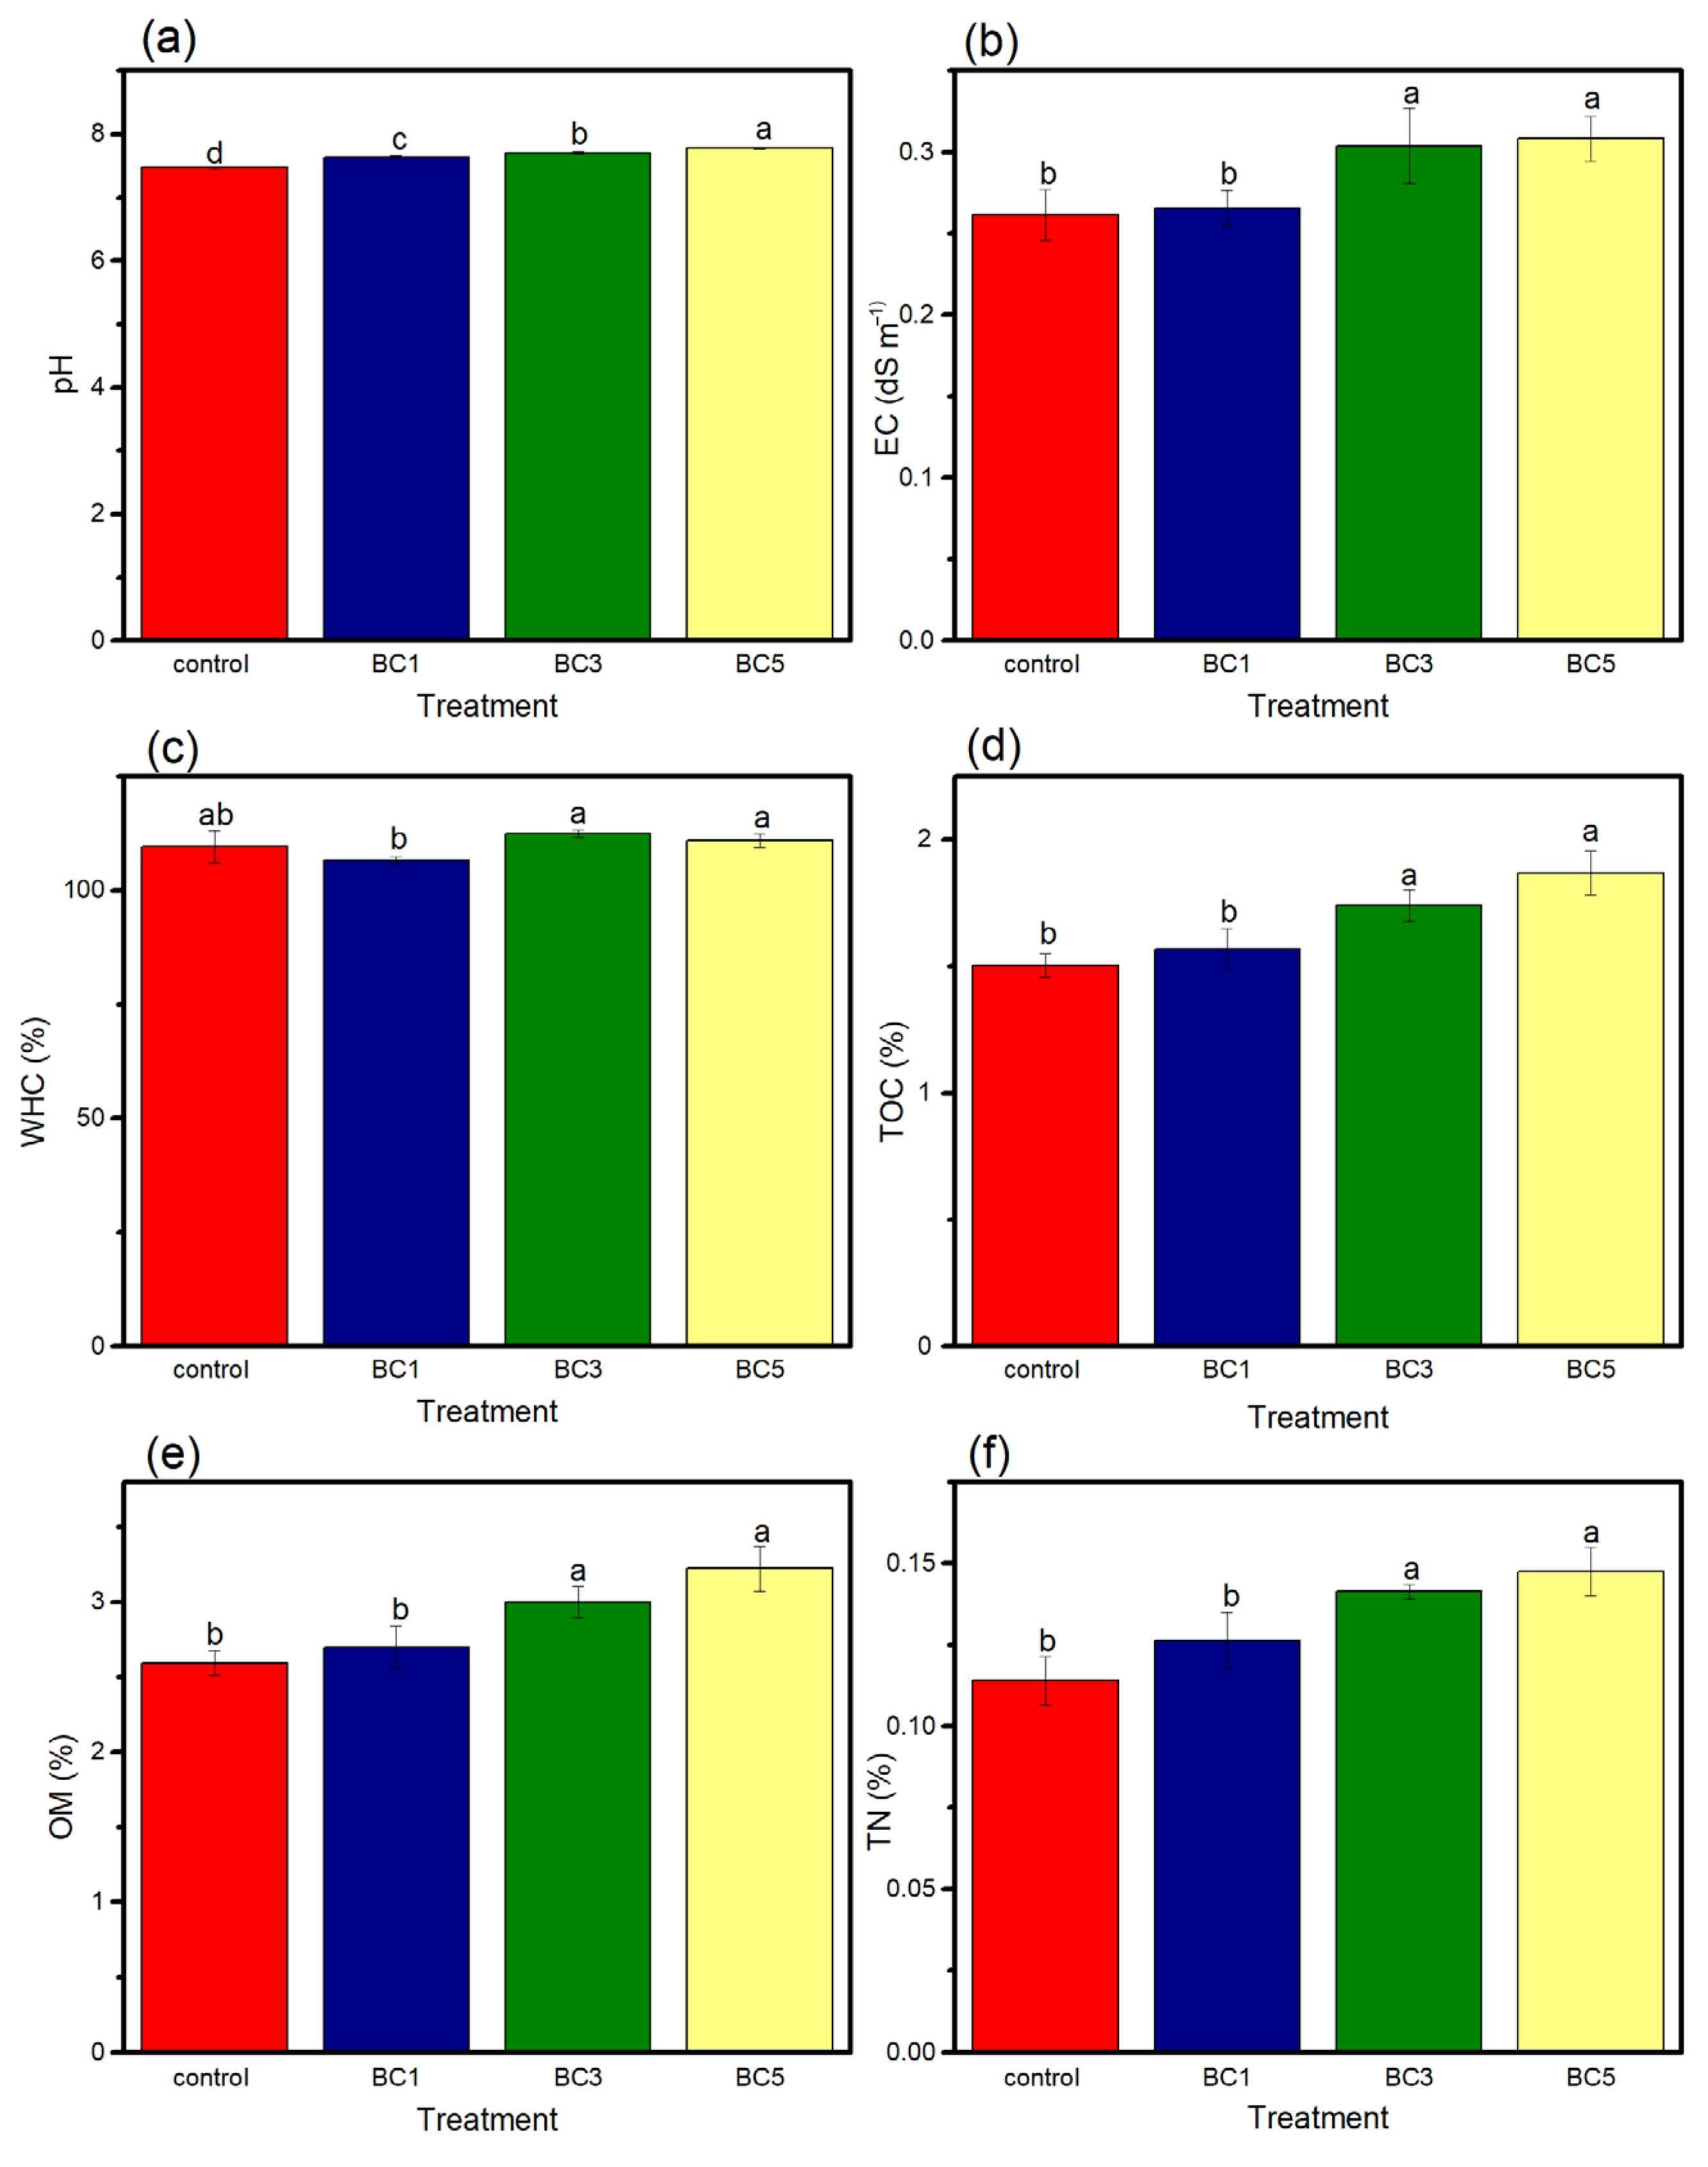
Figure 2 presents the results for each soil indicator following radish harvest. For pH, values ranged from 7.47 to 7.78, exhibiting an upward trend as the concentration of BC increased, with highly significant differences between the four treatments (p < 0.01). This behavior may be closely related to the high pH (10.2) obtained in the characterization of the BC used (Table 2). These findings align with those of Palansooriya et al. [50], who reported a significant increase in soil pH (p < 0.05) when using four different types of BC. The authors attributed this effect to the alkaline nature of the BC used. Similarly, Su et al. [51] observed a significant pH increase when BC was added to soil contaminated with PE (p < 0.05). This effect is likely due to the fact that BC produced at high temperatures contains higher levels of ash and alkaline salts, which contribute to increased soil pH [52]. Additionally, Palansooriya et al. [41] observed a significant increase in soil pH (p < 0.05) in soils contaminated with polystyrene (PS) in lettuce crops. They attributed this effect to the alkaline nature of the BC used (pH 9.1), as the ions Ca2+, Mg2+, K+, and Na+ can remain in the residual ash in the form of oxides or carbonates. These ions can be released into the soil solution, where they exchange with acidic ions, thereby raising the soil pH. Similarly, Xu et al. [53] found that the addition of BC derived from kitchen waste increased soil pH, reaching a value of 7.4 compared to the initial pH of 6.3. This pH increase was attributed to the release of cations such as Na+. Ran et al. [54] also reported an increase in pH in soil contaminated with polypropylene (PP) MPs when BC was added. In their study, soil pH increased from 7.0 to 7.34, with significant differences between treatments (p < 0.05). This change was closely linked to the basic cations present in BC, such as Ca2+, Mg2+, and K+, which can be converted into alkaline substances, such as oxides, hydroxides, and carbonates, during the pyrolysis process [55]. Once these components dissolve in the soil, BC acts as a liming agent, effectively raising the soil pH [56].
Figure 2.
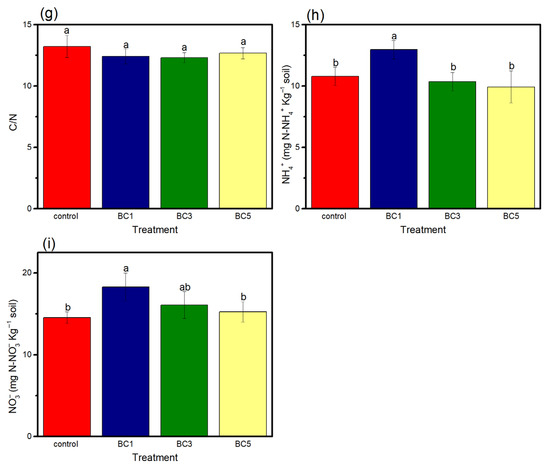
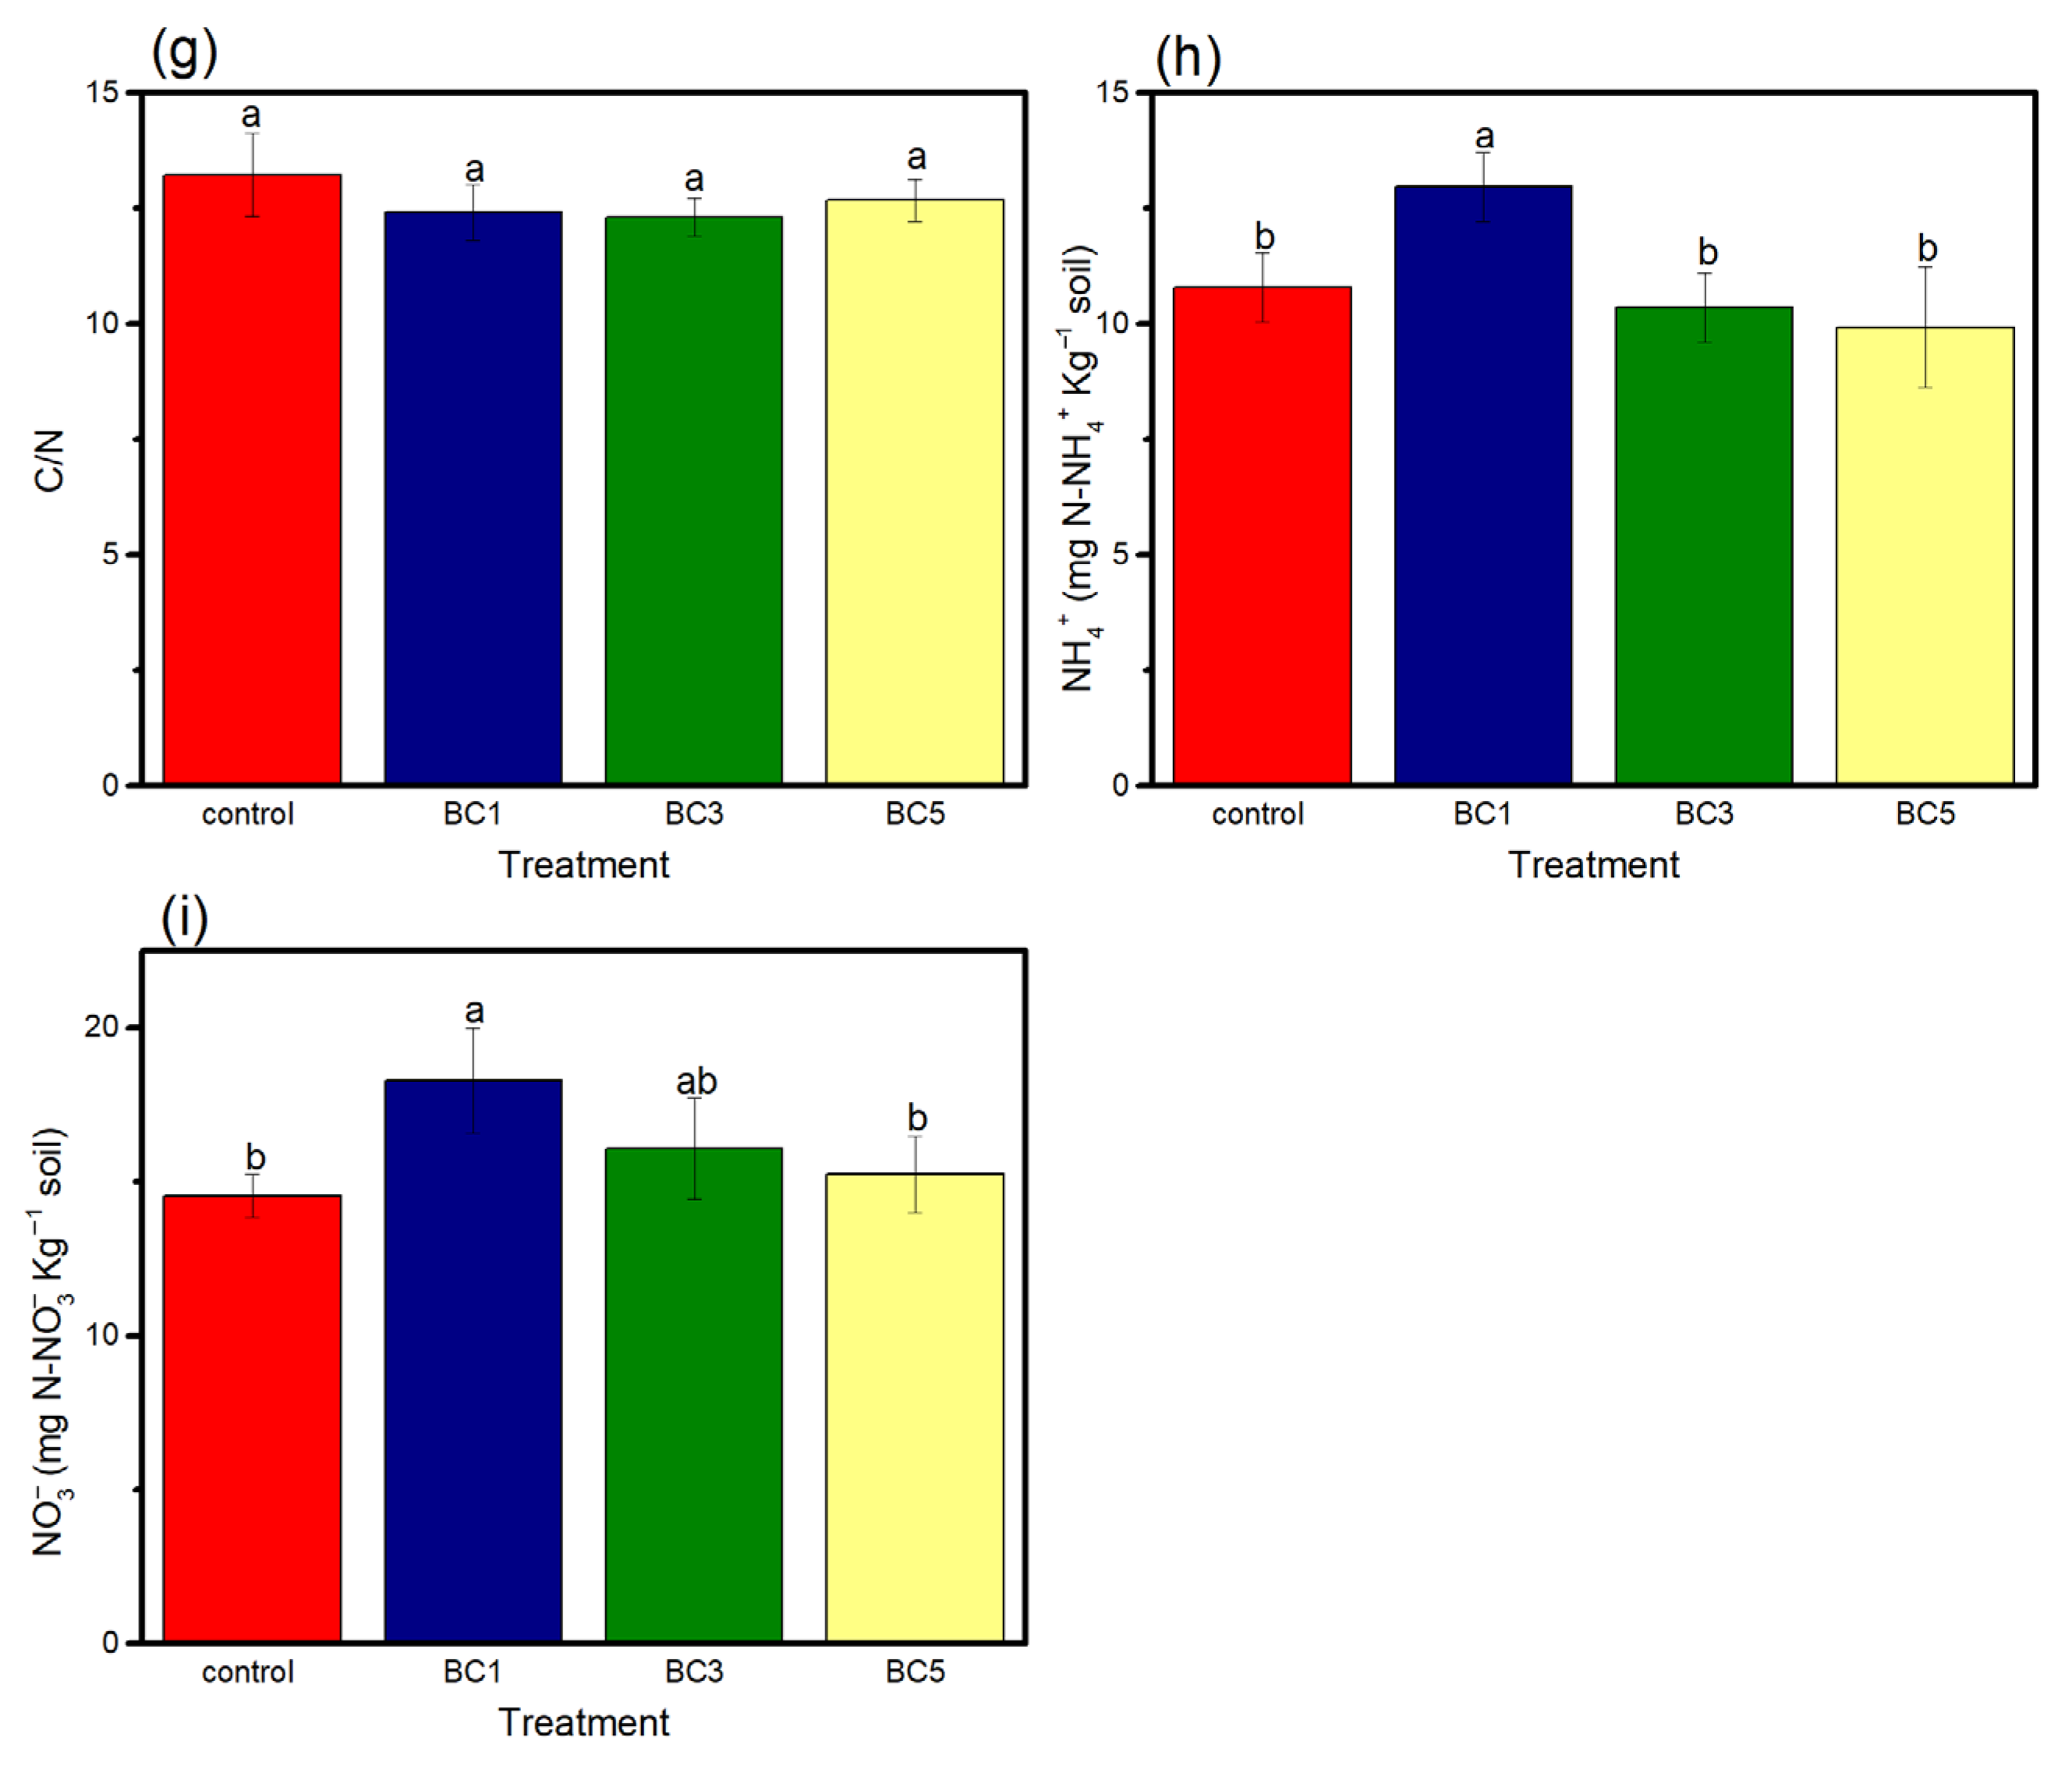
Soil parameters after harvesting radishes grown in soil contaminated with microplastics (MPs) and amended with biochar (BC) at concentrations of 0% (control), 1% (BC1), 3% (BC3) and 5% (BC5). (a) pH: hydrogen potential; (b) EC: electrical conductivity; (c) WHC: water holding capacity; (d) TOC: total organic carbon; (e) OM: organic matter; (f) TN: total nitrogen; (g) C/N: carbon-nitrogen ratio; (h) N-NH4+: ammonium; (i) N-NO3−: nitrates. Identical letters indicate no significant differences between treatments, according to Fisher’s means comparison test (p < 0.05). Vertical bars represent the mean ± standard deviation of three replicates.
Figure 2b demonstrates that EC follows a similar pattern to pH, with an increase in BC concentration corresponding to higher EC values. However, the BC1 treatment exhibited behavior similar to the control, while the BC3 and BC5 treatments showed significant differences (p < 0.05) from the other treatments, with values of 0.304 dS m−1 and 0.308 dS m−1, respectively. This behavior, like the pH, can be explained by the value obtained in the BC characterization (Table 2). This pattern aligns with the findings of Palansooriya et al. [50], who also reported an increase in EC upon incorporating two types of BC into soils, suggesting a comparable trend for this indicator. This increase in EC could be attributed to the fact that soil moisture may have facilitated the mineralization of inherent organic OM, gradually releasing inorganic salts, thereby increasing the EC of the soil [50,57]. It is important to note that while EC increased in all treatments, the values did not reach levels that would compromise soil health, as they remained below 2 dS m−1, the recommended threshold for arable soils according to NOM-021-RECNAT-2002 [18]. Furthermore, Mon and Ueno [55] highlight that an increase in EC is beneficial for soils with initially low EC, as such soils tend to lose nutrients easily due to their limited capacity to retain cations. In contrast, Palansooriya et al. [41] found no significant differences (p ≥ 0.05) between the MPs-only and BC treatments in terms of EC, which could be attributed to variations in the type of BC used in each study.
In terms of WHC, the four treatments exhibited similar values, ranging from 106.6% to 112.4%, with significant differences (p < 0.05) observed only between the BC1 treatment and the BC3 and BC5 treatments, while no significant differences were found compared to the control (Figure 2c). This suggests that BC may enhance the soil’s WHC.
Figure 2d–f show that TOC, OM, and TN followed similar trends, with significant differences (p < 0.05) observed between the BC3 and BC5 treatments in comparison to the control and BC1 treatments. In all three cases, values increased as BC concentration increased, mirroring the pattern seen for pH and EC. Notably, the BC5 treatment exhibited the highest values for both TOC and OM, with 1.87% and 3.22%, respectively, representing a 19.5% increase compared to the control treatment for both indicators. This may be closely related to the high values of C and N in the BC (Table 2), which helps to increase the concentration of these indicators. Similarly, Çığ et al. [58] observed an increase in soil OM following wheat harvest as the concentration of BC increased. In a similar line, Silva et al. [59] reported a linear increase in soil organic C with rising BC concentrations in soil cultivated with common beans under greenhouse conditions. Both studies attribute this effect to the high molecular stability of BC derived through pyrolysis, which, unlike pyrogenic C, inhibits oxidation.
TN followed a similar trend, with the BC5 treatment exhibiting the highest value of 0.14%, reflecting a 21.4% increase compared to the control treatment. In this context, Su et al. [51] found no significant differences (p ≥ 0.05) between PE-contaminated soils amended with BC, although they did observe a higher TN value in the BC-amended soils. In contrast, Palansooriya et al. [41] reported significant differences (p < 0.05) in both TOC and TN when BC was added to soils contaminated with MPs, with values doubling in the BC-amended treatments. Several studies have demonstrated that, due to its porous structure and large surface area, BC has the ability to retain nitrogen (N), thereby increasing its concentration in soil [60].
Among the physicochemical indicators measured, only the C/N ratio did not exhibit significant differences (p ≥ 0.05) between treatments, with values ranging from 12.3 to 13.2. In relation to TOC and the C/N ratio, Latini et al. [61] observed a notable increase in these indicators upon incorporating various types of BC. They attributed the observed changes in the C/N ratio to increased microbial activity, which was enhanced by the addition of BC, providing additional nutrients for soil microorganisms.
Regarding N–NH4+, the BC1 treatment showed a significant difference (p < 0.05) compared to the other treatments, reaching 12.96 mg N kg−1 dry soil, a 16.7% increase over the control treatment. Similarly, Palansooriya et al. [41] reported a significant increase (p < 0.05) in N–NH4+ when BC was added to PS-contaminated soils in lettuce crops. Similarly, N–NO3− followed a comparable trend, with the BC1 treatment showing a higher value of 18.28 mg N kg−1 dry soil, a 20.4% increase compared to the control treatment. Regarding these two indicators, Su et al. [51] found no significant differences (p ≥ 0.05). However, they observed a reduction in N–NH4+ following BC addition, while N–NO3− showed an increase, though this change was not statistically significant (p ≥ 0.05). They suggest that, due to the presence of oxygenated functional groups such as hydroxyl, phenolic hydroxyl, and carboxyl in BC, its addition to soil increases the electron content, which promotes the formation of N–NO3−. In contrast, the study by Ran et al. [54], which is similar to the present work, reported a significant increase (p < 0.05) in both N–NH4+ and N–NO3− concentrations when BC was added to soils used for pepper cultivation. Similarly, Mon & Ueno [55] observed an increase in these two indicators when BC was incorporated into soil at application rates of 10 and 25 t ha−1. The authors attribute these changes to the retention of released N on the BC surface, which enhances N availability in the soil. Finally, in the study by Palansooriya et al. [41], no significant differences (p ≥ 0.05) were observed between the MPs-only treatment and the MPs + BC treatment for these two indicators. This discrepancy may be related to the type of BC used in each experiment, as BC derived from carbohydrates at lower pyrolysis temperatures has been found to reduce inorganic N in soil more effectively than other BC types [55,62]. On the other hand, according to Zhao et al., [63] microplastics change the microbial community and therefore the enzymatic activity related to nitrogen fixation, leading to an effect on these two indicators.
3.4. Germination Parameters
As can be seen in Table 4, with regard to germination indicators, there were no significant differences between treatments for any indicator (p ≥ 0.05).
Table 4.
One-way analysis of variance of radish plant germination variables.
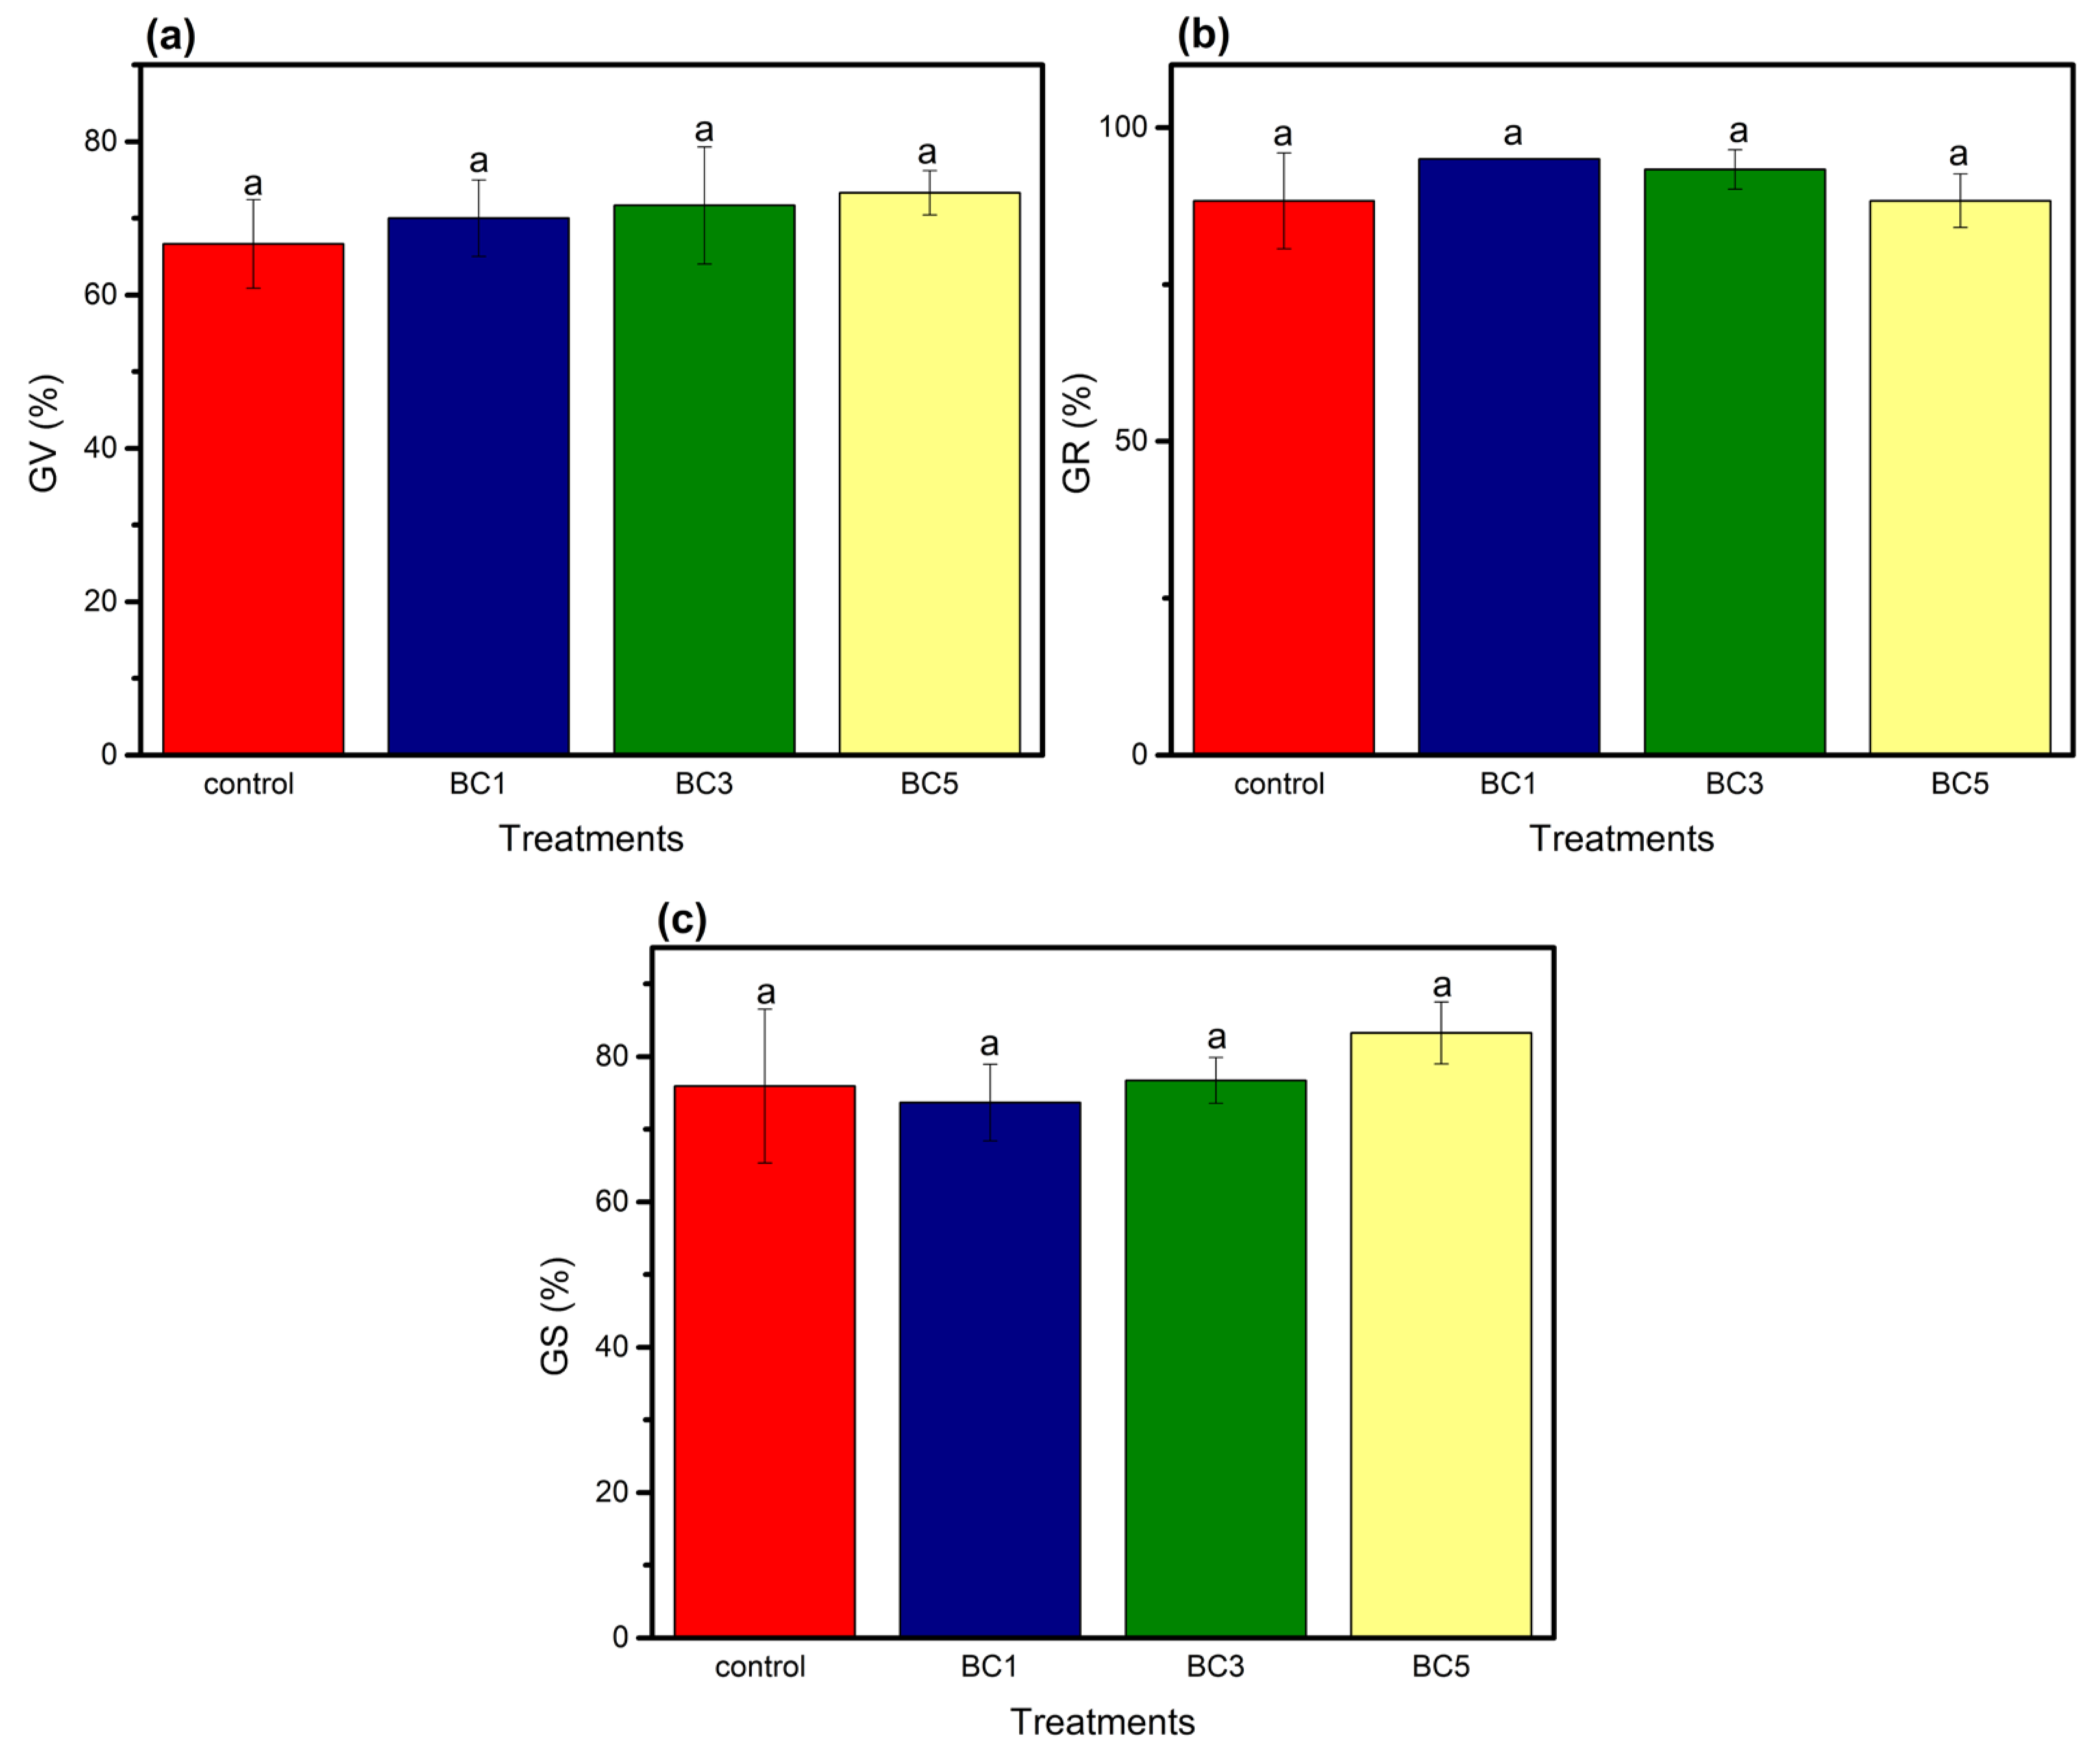
Figure 3 shows that, for germination on day three, GV values were above 65% in all treatments. Although an increase in GV was observed with higher BC concentrations, no significant differences were found between treatments (p ≥ 0.05). Regarding germination on day seven (Figure 3b), GR values exceeded 85% in all treatments, with the highest value in the BC1 treatment; however, again, no significant differences were observed between treatments (p ≥ 0.05). Similarly, Mon & Ueno [55] found no significant differences (p ≥ 0.05) in radish germination on day seven, whether BC was applied alone or in combination with organic and inorganic fertilizers. Additionally, Busch et al. [64] reported that peanut shell BC had no significant effect (p ≥ 0.05) on barley seed germination. In contrast, Solaiman et al. [65] observed differences in wheat seed germination when varying the types and concentrations of BC. Their results showed a general trend of decreased germination as BC concentration increased. According to these authors, the effects on germination depend on the crop type. In contrast, Çığ et al. [58] found that GR increased as BC concentrations increased, with the highest value recorded in the 10% BC treatment. On the other hand, Ao et al., [66], determined that PE-MPs alone do not significantly affect (p ≥ 0.05) the germination rate of radish in different soils, so it can be concluded that radish germination is not easily influenced by external agents to the soil.
Figure 3.
(a) GV: germination vigor; (b) GR: germination rate; (c) GS: germination speed of radish seeds grown in soil contaminated with microplastics (MPs) amended with biochar (BC) at concentrations of 0% (Control), 1% (BC1), 3% (BC3) and 5% (BC5). Identical letters indicate no significant differences between treatments, according to Fisher’s means comparison test (p < 0.05). Vertical bars represent the mean ± standard deviation of three replicates.
Finally, a key parameter related to germination on days three and seven is GS, where the BC5 treatment exhibited the highest value, at 83.32%. However, no significant differences were observed compared to the other treatments (p ≥ 0.05). Nyambo et al. [67] evaluated the effect of different types of BC on radish seed germination, although the specific days of measurement were not reported, and concluded that, unlike the present study, the addition of BC significantly enhanced seed germination (p < 0.05). Similarly, Ali et al. [68] observed that BC concentrations ranging from 0% to 3% positively influenced corn seed germination, with an increase in germination up to a concentration of 2.5%, followed by a decline when the concentration was increased to 3%.
3.5. Leaf Parameters After Harvest
Table 5 presents the analysis of variance for the radish plant indicators. The indicators that did not show significant differences (p ≥ 0.05) between treatments included leaf moisture, bulb length, dry bulb biomass, and dry plant biomass. In contrast, bulb diameter, bulb weight, and total plant weight exhibited highly significant differences between treatments (p < 0.01), while the remaining indicators showed significant differences (p < 0.05).
Table 5.
One-way analysis of variance of radish bulbs, leaf and plant variables.
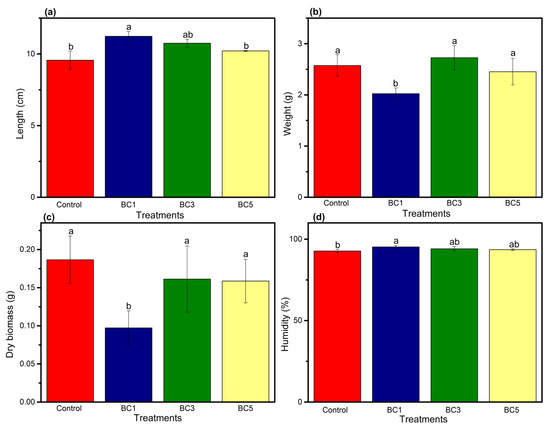
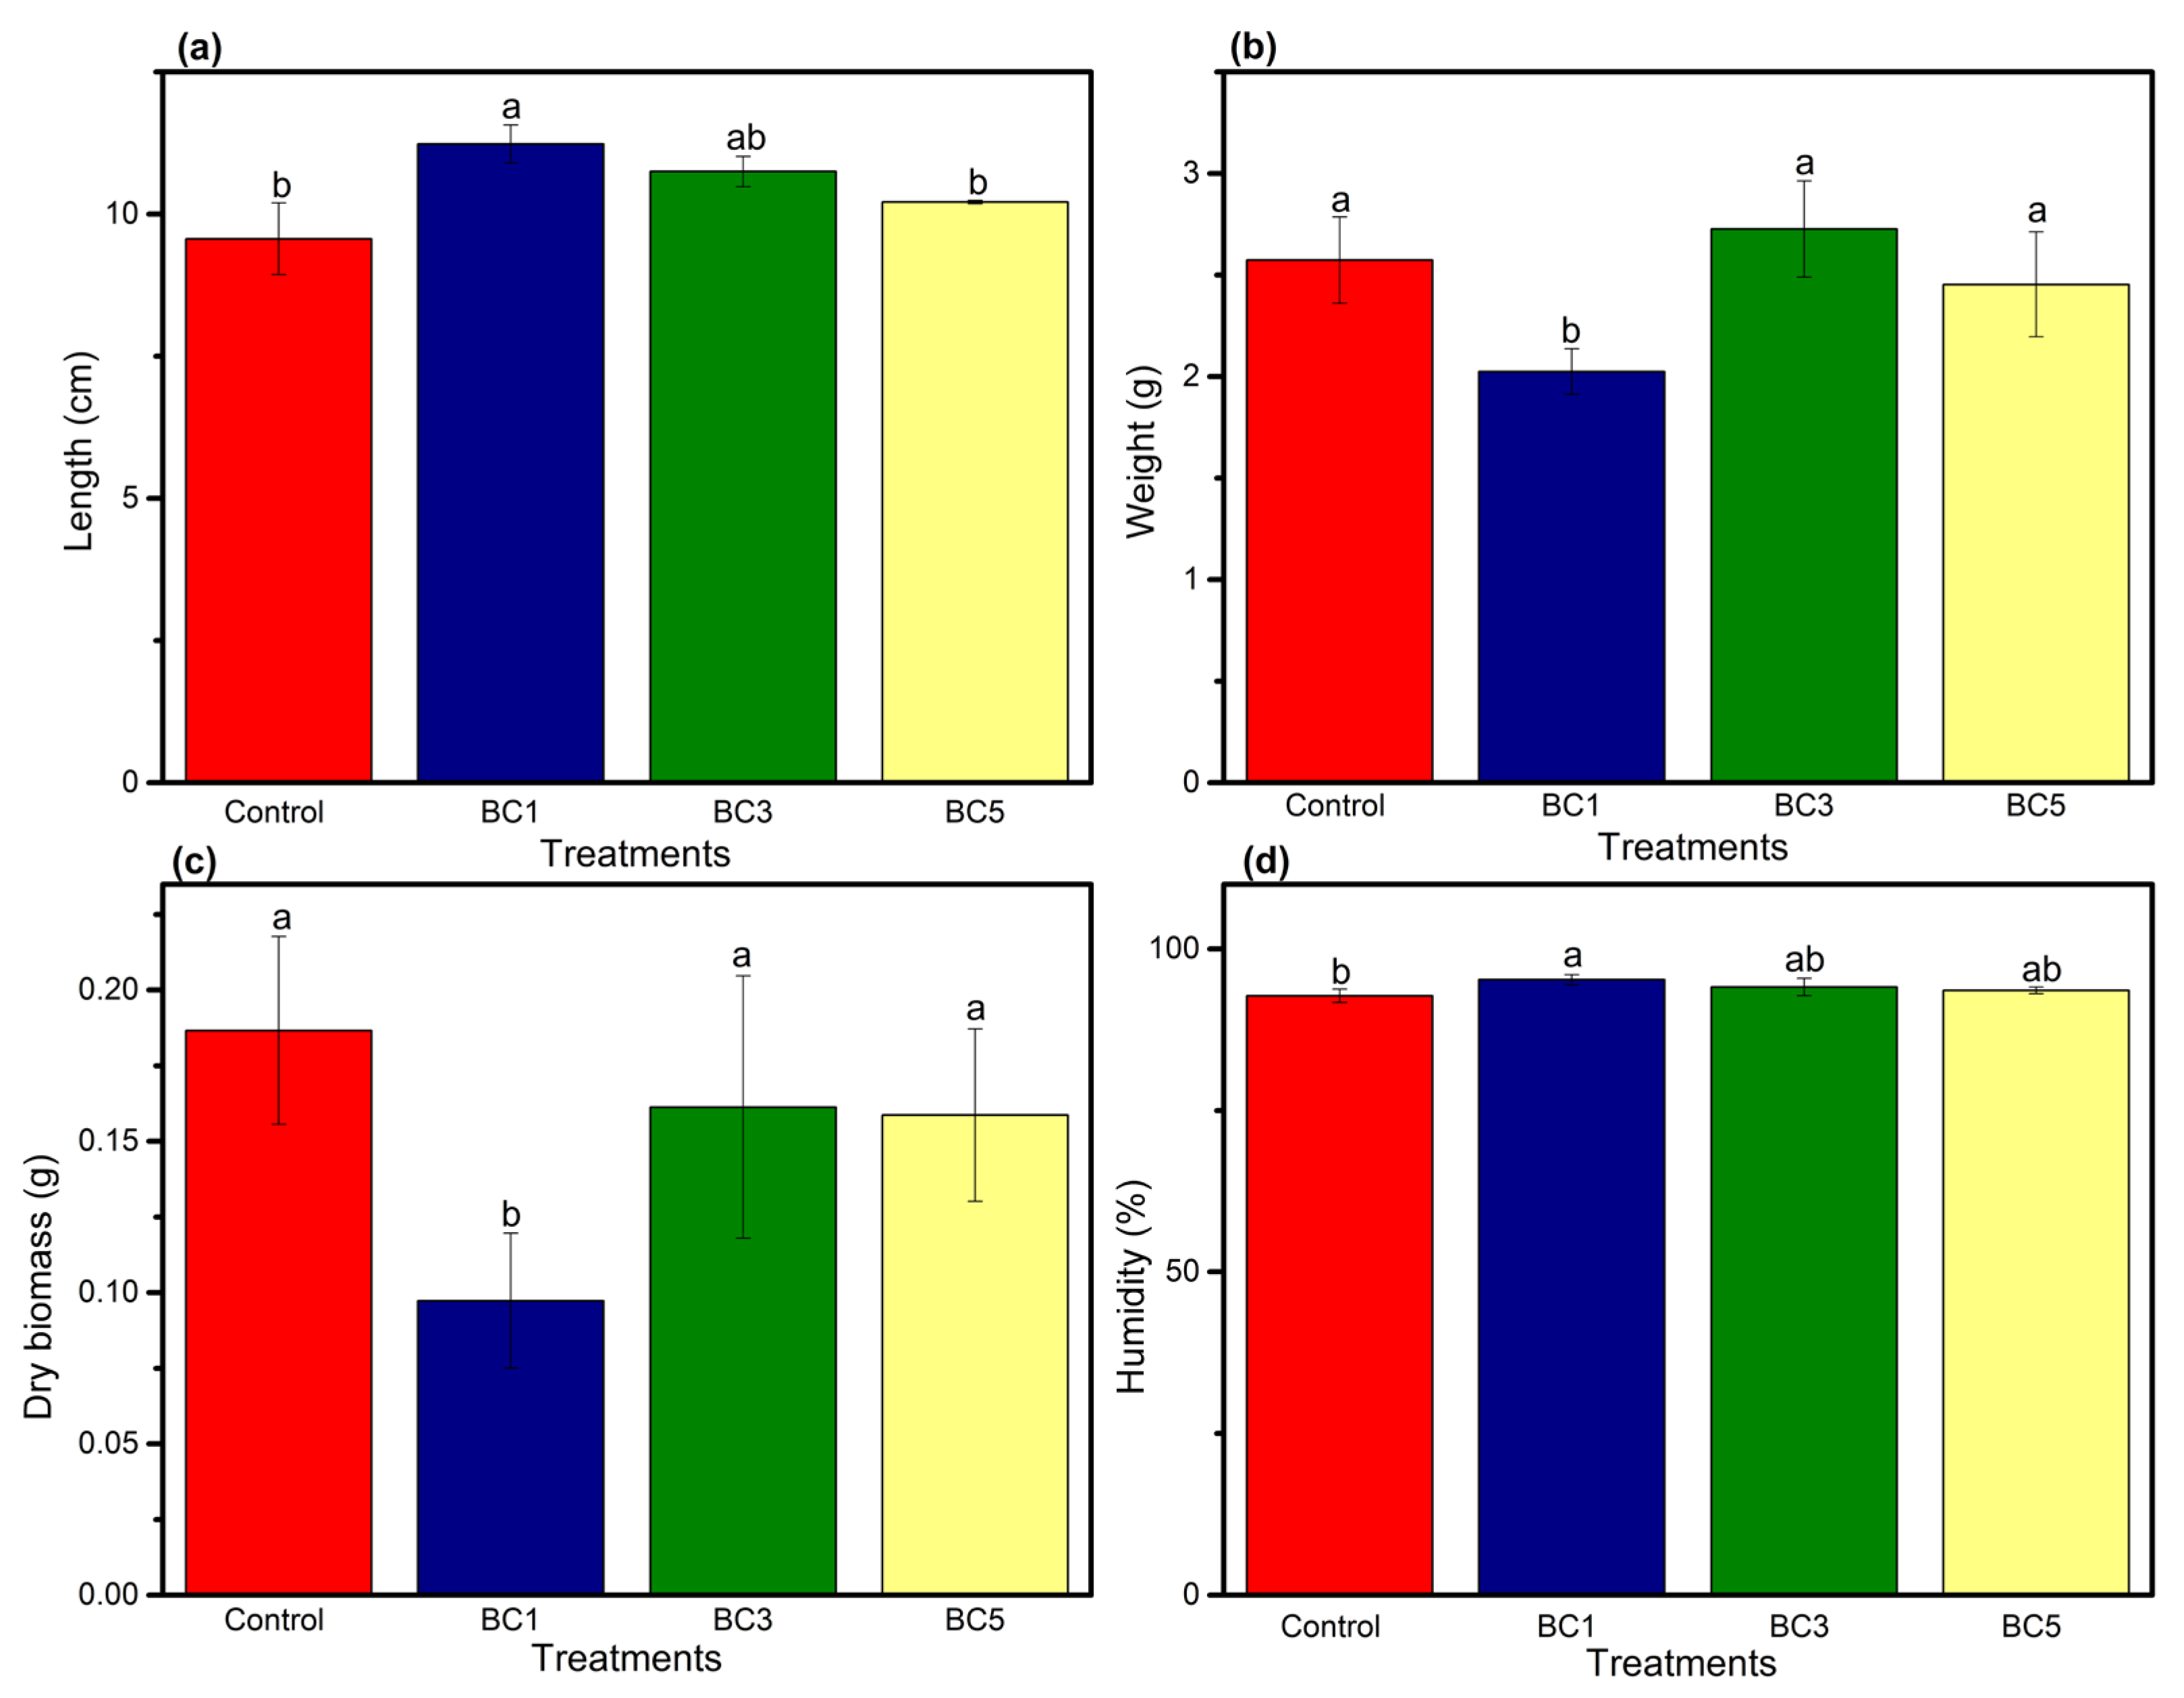
As shown in Figure 4a, the BC1 treatment resulted in the longest leaf length, measuring 9.5 cm, which represents a 14.8% increase compared to the control treatment. This treatment exhibited significant differences (p < 0.05) when compared to both the control and BC5 treatments.
Figure 4.
(a) Length, (b) weight, (c) dry biomass, and (d) moisture content of radish leaves grown in soil contaminated with microplastics (MPs) amended with biochar (BC) at concentrations of 0% (Control), 1% (BC1), 3% (BC3), and 5% (BC5). Identical letters indicate no significant differences between treatments, according to Fisher’s means comparison test (p < 0.05). Vertical bars represent the mean ± standard deviation of three replicates.
In terms of leaf weight and dry biomass (Figure 4b,c), the BC1 treatment showed significant differences (p < 0.05) compared to the other treatments, with values of 2.02 g and 0.09 g for each indicator, respectively. These values represent decreases of 21.4% and 50%, respectively, compared to the control treatment. Regarding leaf moisture, the values were similar across all treatments, ranging from 92.7% to 95.2%. A significant difference (p < 0.05) was observed only between the BC1 treatment and the control, with the BC1 treatment showing a higher moisture content of 95.2%, compared to 92.75% for the control treatment. In a similar study, Palansooriya et al. [41] used PS-contaminated soil in lettuce crops but found no significant differences (p ≥ 0.05) in the number of leaves, plant height, weight, or dry biomass. Conversely, Ran et al. [54] reported that the application of BC to soils contaminated with MPs increased the abundance of beneficial bacteria, particularly enhancing the N and phosphorus (P) metabolic cycles in both soil and plants, thereby promoting the growth of pepper plants in MP-contaminated soils. Additionally, Liu et al. [69] observed that combining plastic film mulching with BC improved C sequestration in the soil, reduced greenhouse gas emissions, and increased maize yield in agricultural soils.
3.6. Post-Harvest Radish Bulb Indicators
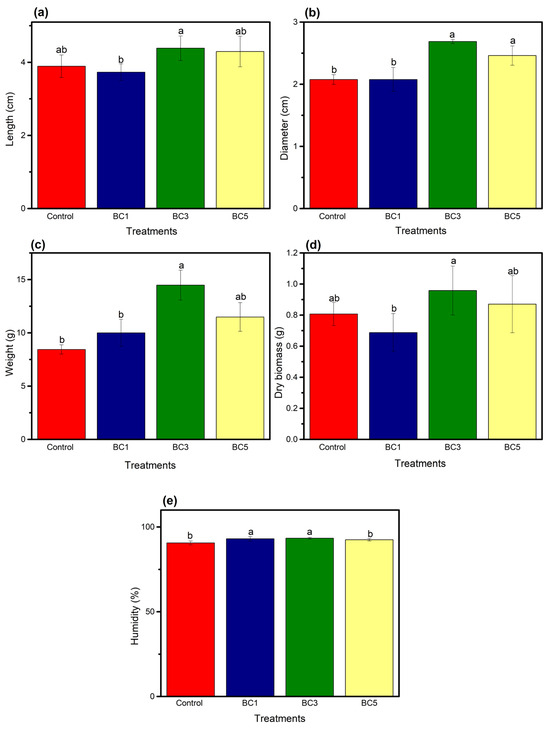
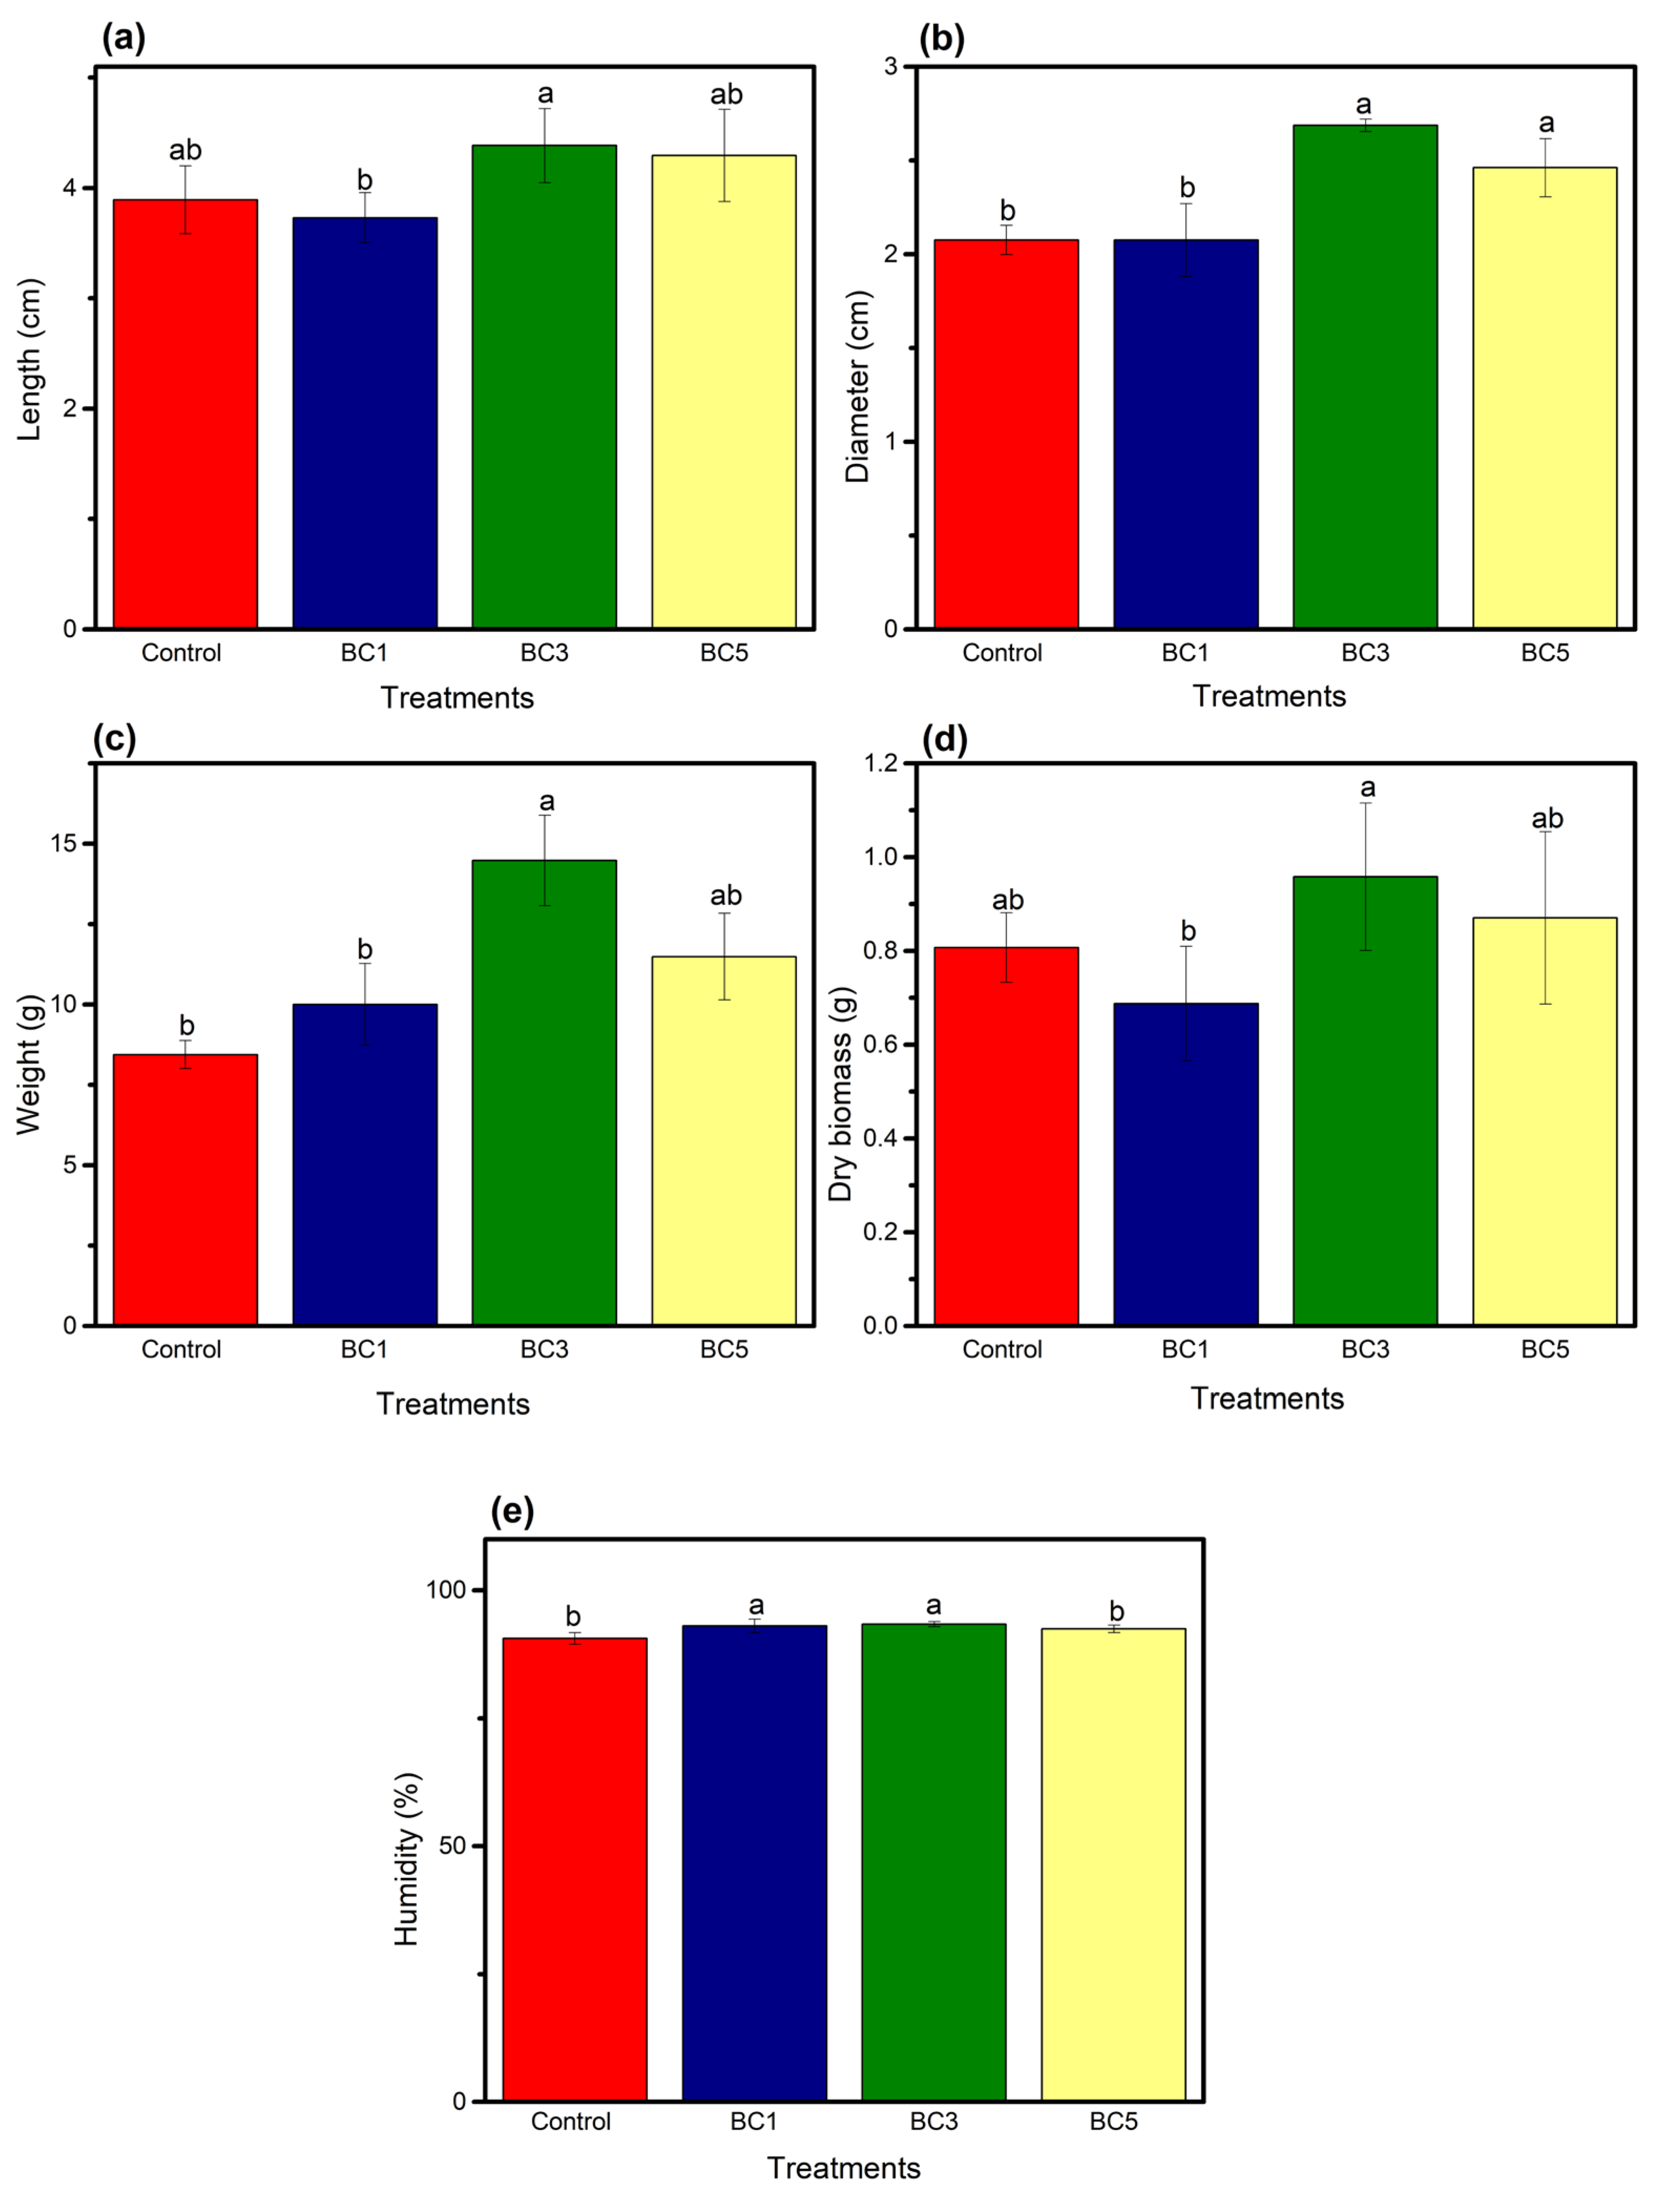
Figure 5 presents the indicators measured in the radish bulb. Regarding bulb length (Figure 5a), the BC3 treatment exhibited the highest value, reaching 4.3 cm, with significant differences (p < 0.05) only when compared to the BC1 treatment. Although no significant differences (p ≥ 0.05) were observed relative to the control, the BC3 treatment showed an 11.3% increase over the control. In this context, Ke et al. [70] and Nyambo et al. [67] reported no significant differences (p ≥ 0.05) in radish bulb length between soils amended with and without BC. In contrast, Adekiya et al. [71] found a significant increase (p < 0.05) in both the length and width of the radish bulb in soils amended with BC compared to the control treatment without BC.
Figure 5.
(a) Length, (b) diameter, (c) weight, (d) dry biomass, and (e) moisture content of radishes grown in soil contaminated with microplastics (MPs) amended with biochar (BC) at concentrations of 0% (Control), 1% (BC1), 3% (BC3), and 5% (BC5). Identical letters indicate no significant differences between treatments, according to Fisher’s means comparison test (p < 0.05). Vertical bars represent the mean ± standard deviation of three replicates.
Regarding bulb diameter and weight (Figure 5b,c), the BC3 treatment again recorded the highest values, with 2.68 cm and 14.47 g, respectively, for each indicator. These values represent a 22.6% increase in diameter and a 41.6% increase in weight compared to the control treatment. In the study by Nyambo et al. [67], although no significant differences (p ≥ 0.05) were found, radishes grown in the presence of BC were generally larger. The authors attribute this observation to improved nutrient availability resulting from the application of BC. Baloch et al. [72] also note that bulb size, including length and width, is influenced by the physicochemical properties of the soil, such as WHC, BD, and porosity, as well as external factors like fertilization and organic OM content. In this context, Adekiya et al. [71] identified a positive correlation between radish bulb length and soil porosity, suggesting that the increased porosity, facilitated by BC, may play a role in the observed enhancement of this trait. Similarly, Tartaglia et al. [73] demonstrated that a 5% BC treatment significantly improved both the number of fruits per tomato plant and the average weight of the tomatoes.
With respect to dry biomass, significant differences (p < 0.05) were found exclusively between the BC1 and BC3 treatments. The BC3 treatment achieved the highest biomass value (0.95 g), marking a 15.7% increase relative to the control and a 28.4% improvement compared to BC1. In a related experiment involving PE-MPs at concentrations of 0.1% and 1% w/w, Wu et al. [74] reported a significant increase (p < 0.05) in dry biomass when BC was incorporated into both MP-contaminated treatments. In a similar vein, Ran et al. [46] observed a marked increase (p < 0.05) in pepper weight when BC was applied to soils contaminated with MPs. Regarding moisture content, values ranged from 90.6% to 93.41%, with significant differences (p < 0.05) between the BC1 and BC3 treatments, compared to both the control and BC5 treatments.
3.7. Plant Parameters After Harvest
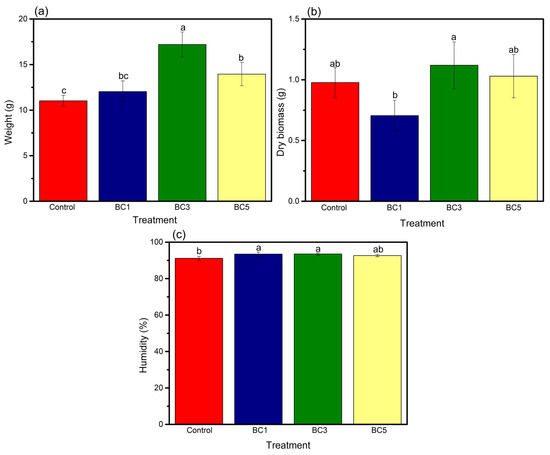
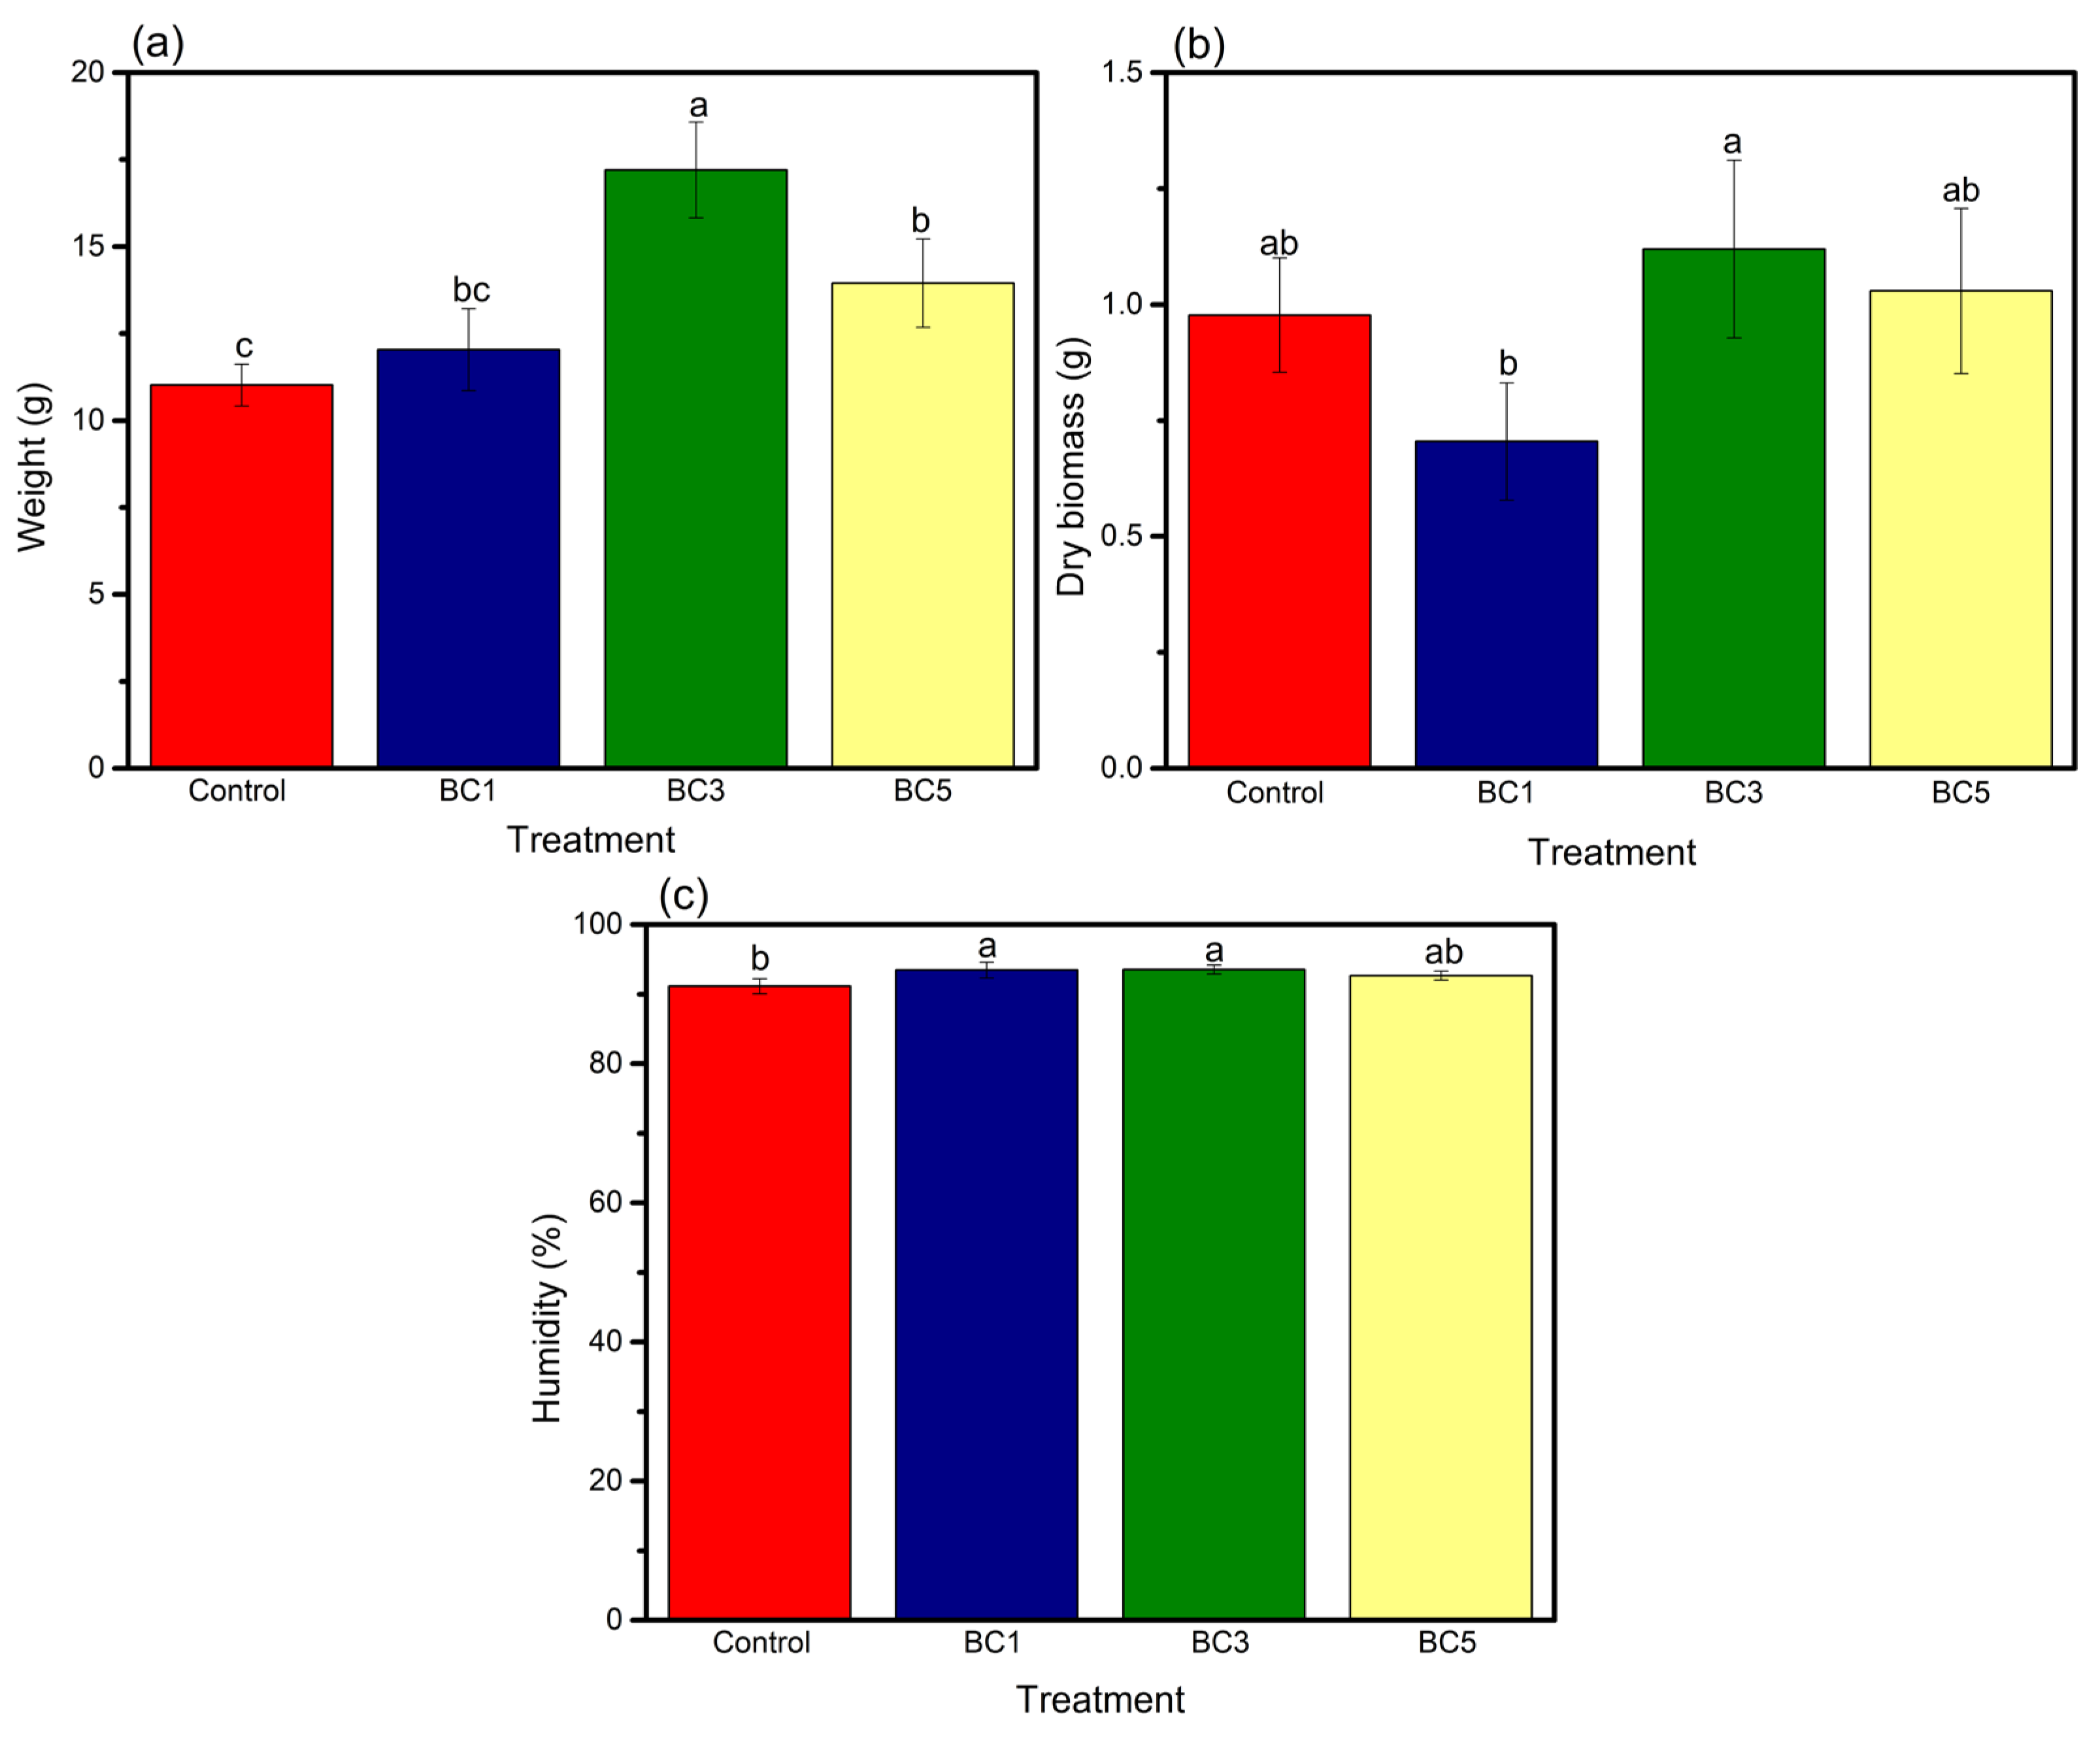
In terms of plant weight (Figure 6a), the BC3 treatment recorded the highest value, 17.2 g, reflecting a 35.9% increase relative to the control. For dry biomass, significant differences were observed only between the BC3 and BC1 treatments, with no notable differences between either of these and the control treatment.
Figure 6.
(a) Weight, (b) dry biomass, and (c) moisture content of radish plants grown in soil contaminated with MPs amended with BC at concentrations of 0% (Control), 1% (BC1), 3% (BC3), and 5% (BC5). Identical letters indicate no significant differences between treatments, according to Fisher’s mean comparison test (p < 0.05). Vertical bars represent the mean ± standard deviation of three replicates.
In a study by Su et al. [51], the application of PE and BC to soybean plants resulted in a significant increase (p < 0.05) in plant weight for the BC treatment. However, during the flowering and harvest stages, above-ground biomass was significantly reduced (p < 0.05) by 5.5% and 11.1%, respectively, in the PE treatment compared to the BC treatment. Similarly, Çığ et al. [58] reported an increase in the fresh weight of wheat plants with 2.5% and 5% BC concentrations, but a decrease was observed at 10% BC compared to the 5% treatment. A comparable trend was observed for dry biomass: treatments with 2.5% and 5% BC showed significant increases (p < 0.05) compared to the control, while the 10% BC treatment resulted in a reduction relative to the lower concentrations. A similar pattern was observed in the present experiment, where the highest BC concentration (5%) led to a decrease in both weight and dry biomass compared to the 3% BC treatment. Finally, for plant humidity, values ranged from 91.1% to 93.5%, with significant differences (p < 0.05) observed only between the BC1 and BC3 treatments compared to the control. According to Zhao et al., [63], the addition of BC to soil contaminated with MPs restored the diversity of the bacterial community, which was beneficial in improving the stability of the soil contaminated with MPs. They also suggest that BC can help plants resist energy deficits induced by MPs stress by increasing glucose metabolism in root systems.
4. Conclusions
The increasing accumulation of plastic materials, particularly MPs, in agricultural soils is a growing environmental concern, as current agricultural practices lead to the widespread presence of this contaminant in fields globally. This study aimed to assess the impact of BC as a soil amendment on both soil properties and radish (Raphanus sativus) plants in soils contaminated with MPs from plastic mulch. The results revealed significant differences (p < 0.05) in all soil indicators, except for the C/N ratio. Specifically, as the BC concentration increased, improvements were observed in soil pH, EC, WHC, TOC, OM, and TN. In contrast, no significant differences (p ≥ 0.05) were observed in germination parameters, indicating that BC had no discernible effect on radish seed germination under the conditions tested. Regarding leaf indicators, the BC1 treatment exhibited lower values for both weight and dry biomass compared to the other treatments. Conversely, in terms of radish bulb indicators, the BC3 treatment demonstrated the highest values, a trend also reflected in the overall plant growth. In conclusion, a 3% (w/w) BC concentration is deemed optimal for enhancing radish production in MPs-contaminated soils. While our study demonstrates the technical feasibility of the remediation strategy, large-scale profitability requires a comprehensive life cycle assessment and the consideration of local and lower-cost biomass sources than pine wood for biomass production. Although this study provides valuable information on the use of BC as an amendment in soils contaminated with MPs, further research with different crops and soil types is also needed to develop more effective strategies for mitigating the adverse impacts of MPs.
Author Contributions
Conceptualization, H.P.-G., M.d.l.L.X.N.-R. and E.C.-B.; methodology, H.P.-G., E.C.-B., M.d.l.L.X.N.-R., F.E.T.-F., A.B.-N., D.Á.-B. and L.G.-C.; software, H.P.-G. and E.C.-B.; validation, H.P.-G., L.G.-C. and E.C.-B.; formal analysis, H.P.-G., A.B.-N. and E.C.-B.; investigation, H.P.-G., M.A.L.-H., F.E.T.-F., D.Á.-B., G.A.S.-M. and M.d.l.L.X.N.-R.; resources, H.P.-G., G.A.S.-M., E.C.-B., M.A.L.-H., D.Á.-B., F.E.T.-F., L.G.-C. and M.d.l.L.X.N.-R.; data curation, H.P.-G., G.A.S.-M. and M.d.l.L.X.N.-R.; writing—original draft preparation, E.C.-B., H.P.-G., and M.d.l.L.X.N.-R.; writing—review and editing, E.C.-B. and M.d.l.L.X.N.-R.; visualization, H.P.-G., G.A.S.-M., F.E.T.-F. and E.C.-B.; supervision, H.P.-G., L.G.-C., E.C.-B., D.Á.-B., M.A.L.-H., G.A.S.-M. and M.d.l.L.X.N.-R.; project administration, E.C.-B. and M.d.l.L.X.N.-R.; funding acquisition, E.C.-B. All authors have read and agreed to the published version of the manuscript.
Funding
This research was funded by The Project of Scientific Research, Technological Developments and Innovation CELA-PYR-2025-22576 and SECIHTI postgraduate scholarship number 814572.
Institutional Review Board Statement
Not applicable.
Informed Consent Statement
Not applicable.
Data Availability Statement
The raw data supporting the conclusions of this article will be made available by the authors on request.
Acknowledgments
Special thanks to the Environmental Biotechnology and Bioprocesses Laboratory of the National Technological Institute of Mexico/Technological Institute of Celaya for making their facilities and equipment available to us for the development of this study.
Conflicts of Interest
The authors declare no conflicts of interest.
Abbreviations
The following abbreviations are used in this manuscript:
| N–NH4+ | Ammonium | BD | bulk density |
| BC | Biochar | ANOVA | analysis of variance |
| C | carbon | C/N | carbon-to-nitrogen ratio |
| CEC | Cation exchange capacity | CLY | clay |
| Ca2+ | calcium | EC | electrical conductivity |
| FTIR | Fourier transform infrared spectroscopy | ATR-FTIR | attenuated total reflectance FTIR |
| GR | germination rate | GS | germination speed |
| GV | germination vigor | H | hydrogen |
| pH | hydrogen potential | ICP | inductively coupled plasma |
| LSD | least significant difference | Mg2+ | magnesium |
| MPs | microplastics | N–NO3− | nitrate |
| N | nitrogen | OM | organic matter |
| K | potassium | P | phosphorus |
| PE | polyethylene | PP | polypropylene |
| K2SO4 | potassium sulfate | SND | sand |
| SLT | silt | Na+ | sodium |
| S | Sulfur | TOC | Total organic carbon |
| TN | Total nitrogen | USDA | U.S. Department of Agriculture |
| WHC | water holding capacity |
References
- Lincmaierová, K.; Botyanszká, L.; Lichner, L.; Toková, L.; Zafeiriou, I.; Bondarev, D.; Horák, J.; Šurda, P. Assessing Microplastic-Induced Changes in Sandy Soil Properties and Crop Growth. AgriEngineering 2023, 5, 1555–1567. [Google Scholar] [CrossRef] [Scilit]
- Fei, Y.; Huang, S.; Zhang, H.; Tong, Y.; Wen, D.; Xia, X.; Wang, H.; Luo, Y.; Barceló, D. Response of Soil Enzyme Activities and Bacterial Communities to the Accumulation of Microplastics in an Acid Cropped Soil. Sci. Total Environ. 2020, 707, 135634. [Google Scholar] [CrossRef] [Scilit] [PubMed]
- Debab, A.; Boudjabi, S.; Chenchouni, H.; Ababsa, N.; Brahimi, A. Effects of Incorporating Biochar on Soil Quality and Barley Yield in Microplastics-Contaminated Soils. Chemosphere 2024, 368, 143760. [Google Scholar] [CrossRef] [Scilit] [PubMed]
- Iamsaard, K.; Khongdee, N.; Rukkhun, R.; Sarin, C.; Klomjek, P.; Umponstira, C. Does the Incorporation of Biochar into Biodegradable Mulch Films Provide Agricultural Soil Benefits? Polymers 2024, 16, 3434. [Google Scholar] [CrossRef] [Scilit]
- Zhou, B.; Wang, J.; Zhang, H.; Shi, H.; Fei, Y.; Huang, S.; Tong, Y.; Wen, D.; Luo, Y.; Barceló, D. Microplastics in Agricultural Soils on the Coastal Plain of Hangzhou Bay, East China: Multiple Sources Other than Plastic Mulching Film. J. Hazard. Mater. 2020, 388, 121814. [Google Scholar] [CrossRef] [Scilit]
- Han, L.; Chen, L.; Li, D.; Ji, Y.; Feng, Y.; Feng, Y.; Yang, Z. Influence of Polyethylene Terephthalate Microplastic and Biochar Co-Existence on Paddy Soil Bacterial Community Structure and Greenhouse Gas Emission. Environ. Pollut. 2022, 292, 118386. [Google Scholar] [CrossRef] [Scilit]
- Qi, Y.; Ossowicki, A.; Yang, X.; Huerta Lwanga, E.; Dini-Andreote, F.; Geissen, V.; Garbeva, P. Effects of Plastic Mulch Film Residues on Wheat Rhizosphere and Soil Properties. J. Hazard. Mater. 2020, 387, 121711. [Google Scholar] [CrossRef] [Scilit]
- Miao, J.; Chen, Y.; Zhang, E.; Yang, Y.; Sun, K.; Gao, B. Effects of Microplastics and Biochar on Soil Cadmium Availability and Wheat Plant Performance. GCB Bioenergy 2023, 15, 1046–1057. [Google Scholar] [CrossRef] [Scilit]
- de Souza Machado, A.A.; Lau, C.W.; Kloas, W.; Bergmann, J.; Bachelier, J.B.; Faltin, E.; Becker, R.; Görlich, A.S.; Rillig, M.C. Microplastics Can Change Soil Properties and Affect Plant Performance. Environ. Sci. Technol. 2019, 53, 6044–6052. [Google Scholar] [CrossRef] [Scilit]
- Shareef, T.M.E.; Zhao, B. Review Paper: The Fundamentals of Biochar as a Soil Amendment Tool and Management in Agriculture Scope: An Overview for Farmers and Gardeners. J. Agric. Chem. Environ. 2016, 6, 38–61. [Google Scholar] [CrossRef]
- Dayoub, E.B.; Tóth, Z.; Soós, G.; Anda, A. Chemical and Physical Properties of Selected Biochar Types and a Few Application Methods in Agriculture. Agronomy 2024, 14, 2540. [Google Scholar] [CrossRef] [Scilit]
- Semida, W.M.; Beheiry, H.R.; Sétamou, M.; Simpson, C.R.; Abd El-Mageed, T.A.; Rady, M.M.; Nelson, S.D. Biochar Implications for Sustainable Agriculture and Environment: A Review. S. Afr. J. Bot. 2019, 127, 333–347. [Google Scholar] [CrossRef] [Scilit]
- Ababsa, N.; Boudjabi, S.; Chenchouni, H. Biochar Amendments Changed Soil Properties and Improved Cereal Crop Growth Under Salt Stress. J. Soil Sci. Plant Nutr. 2023, 23, 4912–4925. [Google Scholar] [CrossRef] [Scilit]
- Niazi, P.; Hekmatullah, Z.; Mohammad, M.U.; Monib, A.W.; Hassand, M.H.; Ozturk, H.; Azizi, A.; Mansoor, M.; Akhundzada, M.S.; Alimyar, O. Biochar as a Fertilizer Replacement for Sustainable Agriculture. J. Res. Appl. Sci. Biotechnol. 2023, 2, 8–18. [Google Scholar] [CrossRef] [Scilit]
- Banihani, S.A. Radish (Raphanus sativus) and Diabetes. Nutrients 2017, 9, 1014. [Google Scholar] [CrossRef] [Scilit]
- Jiang, L.; Liu, Z.; Li, W.; Yang, Y.; Yu, Z.; Fan, J.; Guo, L.; Guo, C.; Fu, W. PVC Inhibits Radish (Raphanus sativus L.) Seedling Growth by Interfering with Plant Hormone Signal Transduction and Phenylpropanoid Biosynthesis. Horticulturae 2025, 11, 896. [Google Scholar] [CrossRef] [Scilit]
- Wang, H.; Li, X.; Ben, H.; Wang, L.; Fan, T.; Xie, X.; Shi, Y.; Li, B.; Chai, A. First Report of Radish Tuber Black Heart Rot Caused by Pectobacterium Parvum in China. Plant Dis. 2025, 109, 1781. [Google Scholar] [CrossRef] [Scilit]
- NOM-021-RECNAT-2000; Que Establece las Especificaciones de Fertilidad, Salinidad y Clasificación de Suelos. Estudios, Muestreo y Análisis. Gobinerno de Mexico: Mexico City, Mexico, 2002. Available online: https://www.ordenjuridico.gob.mx/Documentos/Federal/wo69255.pdf (accessed on 16 February 2026).
- Fang, Y.; Lin, C.; Zhao, J.; Gao, Y.; Jia, X. Dosages of Biodegradable Poly(Butylene Adipate-Co-Terephthalate) Microplastics Affect Soil Microbial Community, Function, and Metabolome in Plant–Soil System. Agronomy 2025, 15, 990. [Google Scholar] [CrossRef] [Scilit]
- Bouyoucos, G.J. Hydrometer Method Improved for Making Particle Size Analyses of Soils1. Agron. J. 1962, 54, 464–465. [Google Scholar] [CrossRef] [Scilit]
- U.S. Department of Agriculture (USDA). Soil Survey Manual; United Department of Agriculture: Washington, DC, USA, 1951. [Google Scholar]
- Thomas, G.W. Soil pH and Soil Acidity. In Methods of Soil Analysis; John Wiley & Sons, Ltd.: Hoboken, NJ, USA, 1996; pp. 475–490. ISBN 978-0-89118-866-7. [Google Scholar]
- Hendrickx, J.M.H.; Borchers, B.; Corwin, D.L.; Lesch, S.M.; Hilgendorf, A.C.; Schlue, J. Inversion of Soil Conductivity Profiles from Electromagnetic Induction Measurements. Soil Sci. Soc. Am. J. 2002, 66, 673–685. [Google Scholar] [CrossRef] [Scilit]
- Alef, K.; Nannipieri, P. Methods in Applied Soil Microbiology and Biochemistry; Academic Press: Cambridge, MA, USA, 1995. [Google Scholar]
- Walkley, A.; Black, I.A. An examination of the Degtjareff method for determining soil organic matter, and a proposed modification of the chromic acid titration method. Soil Sci. 1934, 37, 29. [Google Scholar] [CrossRef] [Scilit]
- Yilmaz, E.; Sönmez, M. The Role of Organic/Bio–Fertilizer Amendment on Aggregate Stability and Organic Carbon Content in Different Aggregate Scales. Soil Tillage Res. 2017, 168, 118–124. [Google Scholar] [CrossRef] [Scilit]
- Bremner, J.M. Nitrogen-Total. In Methods of Soil Analysis; John Wiley & Sons, Ltd.: Hoboken, NJ, USA, 1996; pp. 1085–1121. ISBN 978-0-89118-866-7. [Google Scholar]
- Conde, E.; Cardenas, M.; Ponce-Mendoza, A.; Luna-Guido, M.L.; Cruz-Mondragón, C.; Dendooven, L. The Impacts of Inorganic Nitrogen Application on Mineralization of 14C-Labelled Maize and Glucose, and on Priming Effect in Saline Alkaline Soil. Soil Biol. Biochem. 2005, 37, 681–691. [Google Scholar] [CrossRef] [Scilit]
- Bettinelli, M.; Baroni, U. A Microwave Oven Digestion Method for the Determination of Metals in Sewage Sludges by ICP-AES and GFAAS. Int. J. Environ. Anal. Chem. 1991, 43, 33–40. [Google Scholar] [CrossRef] [Scilit]
- Cottenie, A.; Camerlynck, R.; Verloo, M.; Dhaese, A. Fractionation and determination of trace elements in plants, soils and sediments. Pure Appl. Chem. 1980, 52, 45–53. [Google Scholar] [CrossRef] [Scilit]
- Rajkovich, S.; Enders, A.; Hanley, K.; Hyland, C.; Zimmerman, A.R.; Lehmann, J. Corn Growth and Nitrogen Nutrition after Additions of Biochars with Varying Properties to a Temperate Soil. Biol. Fertil. Soils 2012, 48, 271–284. [Google Scholar] [CrossRef] [Scilit]
- Standard Test Method for Chemical Analysis of Wood Charcoal. Available online: https://store.astm.org/d1762-84r21.html (accessed on 25 January 2026).
- Schulte, E.E.; Hopkins, B.G. Estimation of Soil Organic Matter by Weight Loss-On-Ignition. In Soil Organic Matter: Analysis and Interpretation; John Wiley & Sons, Ltd.: Hoboken, NJ, USA, 1996; pp. 21–31. ISBN 978-0-89118-941-1. [Google Scholar]
- Singh, B.; Camps-Arbestain, M.; Lehmann, J. Biochar: A Guide to Analytical Methods; Csiro Publishing: Clayton, Australia, 2017; ISBN 978-1-4863-0510-0. [Google Scholar]
- Al-Thani, G.; Ibrahim, A.E.; Alomairi, M.; Salman, B.I.; Hegazy, M.M.; Al-Harrasi, A.; El Deeb, S. Toxic Elemental Impurities in Herbal Weight Loss Supplements; A Study Using ICP-OES Microwave-Assisted Digestion. Toxics 2023, 11, 272. [Google Scholar] [CrossRef] [Scilit]
- Pipíška, M.; Krajčíková, E.K.; Hvostik, M.; Frišták, V.; Ďuriška, L.; Černičková, I.; Kaňuchová, M.; Conte, P.; Soja, G. Biochar from Wood Chips and Corn Cobs for Adsorption of Thioflavin T and Erythrosine B. Materials 2022, 15, 1492. [Google Scholar] [CrossRef] [Scilit]
- Campanale, C.; Savino, I.; Massarelli, C.; Uricchio, V.F. Fourier Transform Infrared Spectroscopy to Assess the Degree of Alteration of Artificially Aged and Environmentally Weathered Microplastics. Polymers 2023, 15, 911. [Google Scholar] [CrossRef] [Scilit]
- Patiño-Galván, H.; Bedolla-Rivera, H.I.; Negrete-Rodríguez, M.D.L.L.X.; Herrera-Pérez, A.; Álvarez-Bernal, D.; Lastiri-Hernández, M.A.; Bernardino-Nicanor, A.; González-Cruz, L.; Conde-Barajas, E. Effects of Microplastics from Face Masks on Physicochemical and Biological Properties of Agricultural Soil: Development of Soil Quality Index “SQI”. Appl. Sci. 2025, 15, 2010. [Google Scholar] [CrossRef] [Scilit]
- Kim, S.W.; Liang, Y.; Zhao, T.; Rillig, M.C. Indirect Effects of Microplastic-Contaminated Soils on Adjacent Soil Layers: Vertical Changes in Soil Physical Structure and Water Flow. Front. Environ. Sci. 2021, 9, 681934. [Google Scholar] [CrossRef] [Scilit]
- Roy, R.; Hossain, A.; Sultana, S.; Deb, B.; Ahmod, M.M.; Sarker, T. Microplastics Increase Cadmium Absorption and Impair Nutrient Uptake and Growth in Red Amaranth (Amaranthus tricolor L.) in the Presence of Cadmium and Biochar. BMC Plant Biol. 2024, 24, 608. [Google Scholar] [CrossRef] [Scilit]
- Palansooriya, K.N.; Withana, P.A.; Jeong, Y.; Sang, M.K.; Cho, Y.; Hwang, G.; Chang, S.X.; Ok, Y.S. Contrasting Effects of Food Waste and Its Biochar on Soil Properties and Lettuce Growth in a Microplastic-Contaminated Soil. Appl. Biol. Chem. 2024, 67, 3. [Google Scholar] [CrossRef] [Scilit]
- Castelán-Vega, R.; Tamaríz-Flores, J.V.; Ramírez-García, A.L.; Handal-Silva, A.; García-Suastegui, W.A.; Castelán-Vega, R.; Tamaríz-Flores, J.V.; Ramírez-García, A.L.; Handal-Silva, A.; García-Suastegui, W.A. Susceptibilidad ambiental a la desertificación en la microcuenca del río Azumiatla, Puebla, México. Ecosistemas Recur. Agropecu. 2019, 6, 91–101. [Google Scholar] [CrossRef] [Scilit]
- Hazelton, P.; Murphy, B. Interpreting Soil Test Results: What Do All the Numbers Mean? Csiro Publishing: Clayton, Australia, 2016; ISBN 978-1-4863-0397-7. [Google Scholar]
- Usha, V.C.; Jahromi, H.; Hartmann, D.; Adhikari, S. Evaluation of Loblolly Pine Wood Biochar Properties Derived from the Slow-Pyrolysis Process for the Synergetic Benefit of Carbon Sequestration and Soil Conditioning. J. Anal. Appl. Pyrolysis 2026, 193, 107358. [Google Scholar] [CrossRef] [Scilit]
- Brar, G.S.; Malhotra, K.; Kumar, R.; Lamba, J.; Way, T.R.; Prasad, R.; Adhikari, S. Investigating the Impact of Broiler Litter Application Method and Biochar on Phosphorus Leaching. Water Air Soil Pollut. 2025, 236, 558. [Google Scholar] [CrossRef] [Scilit]
- Bernárdez-Rodas, N.; Rosales, E.; Pazos, M.; González-Prieto, Ó.; Torres, L.O.; Sanromán, M.Á. Three-Dimensional Electrosorption for Pharmaceutical Wastewater Management and Sustainable Biochar Regeneration. Molecules 2025, 30, 1435. [Google Scholar] [CrossRef] [Scilit]
- Ahmed, H.; Elsadek, M.; Lundgren, M.; Öqvist, L.S. Reduction Behavior of Biochar-in-Plant Fines Briquettes for CO2-Reduced Ironmaking. Metals 2025, 15, 973. [Google Scholar] [CrossRef] [Scilit]
- Song, H.; Wang, J.; Garg, A.; Lin, X.; Zheng, Q.; Sharma, S. Potential of Novel Biochars Produced from Invasive Aquatic Species Outside Food Chain in Removing Ammonium Nitrogen: Comparison with Conventional Biochars and Clinoptilolite. Sustainability 2019, 11, 7136. [Google Scholar] [CrossRef] [Scilit]
- Hernandez, E.; Nowack, B.; Mitrano, D.M. Polyester Textiles as a Source of Microplastics from Households: A Mechanistic Study to Understand Microfiber Release During Washing. Environ. Sci. Technol. 2017, 51, 7036–7046. [Google Scholar] [CrossRef] [Scilit]
- Palansooriya, K.N.; Sang, M.K.; Igalavithana, A.D.; Zhang, M.; Hou, D.; Oleszczuk, P.; Sung, J.; Ok, Y.S. Biochar Alters Chemical and Microbial Properties of Microplastic-Contaminated Soil. Environ. Res. 2022, 209, 112807. [Google Scholar] [CrossRef] [Scilit] [PubMed]
- Su, J.; Zhu, Y.; Chen, X.; Lu, X.; Yan, J.; Yan, L.; Zou, W. Biochar Influences Polyethylene Microplastic-Contaminated Soil Properties and Enzyme Activities. Agronomy 2024, 14, 2919. [Google Scholar] [CrossRef] [Scilit]
- Al-Wabel, M.I.; Hussain, Q.; Usman, A.R.A.; Ahmad, M.; Abduljabbar, A.; Sallam, A.S.; Ok, Y.S. Impact of Biochar Properties on Soil Conditions and Agricultural Sustainability: A Review. Land Degrad. Dev. 2018, 29, 2124–2161. [Google Scholar] [CrossRef] [Scilit]
- Xu, C.; Zhao, J.; Yang, W.; He, L.; Wei, W.; Tan, X.; Wang, J.; Lin, A. Evaluation of Biochar Pyrolyzed from Kitchen Waste, Corn Straw, and Peanut Hulls on Immobilization of Pb and Cd in Contaminated Soil. Environ. Pollut. 2020, 261, 114133. [Google Scholar] [CrossRef] [Scilit]
- Ran, T.; Li, J.; Liao, H.; Zhao, Y.; Yang, G.; Long, J. Effects of Biochar Amendment on Bacterial Communities and Their Function Predictions in a Microplastic-Contaminated Capsicum Annuum L. Soil. Environ. Technol. Innov. 2023, 31, 103174. [Google Scholar] [CrossRef] [Scilit]
- Mon, W.W.; Ueno, H. Short-Term Effect of the Combined Application of Rice Husk Biochar and Organic and Inorganic Fertilizers on Radish Growth and Nitrogen Use Efficiency. Plants 2024, 13, 2376. [Google Scholar] [CrossRef] [Scilit]
- Singh, H.; Northup, B.K.; Rice, C.W.; Prasad, P.V.V. Biochar Applications Influence Soil Physical and Chemical Properties, Microbial Diversity, and Crop Productivity: A Meta-Analysis. Biochar 2022, 4, 8. [Google Scholar] [CrossRef] [Scilit]
- Xiao, R.; Wang, P.; Mi, S.; Ali, A.; Liu, X.; Li, Y.; Guan, W.; Li, R.; Zhang, Z. Effects of Crop Straw and Its Derived Biochar on the Mobility and Bioavailability in Cd and Zn in Two Smelter-Contaminated Alkaline Soils. Ecotoxicol. Environ. Saf. 2019, 181, 155–163. [Google Scholar] [CrossRef] [Scilit]
- Çığ, F.; Sönmez, F.; Nadeem, M.A.; Sabagh, A.E. Effect of Biochar and PGPR on the Growth and Nutrients Content of Einkorn Wheat (Triticum monococcum L.) and Post-Harvest Soil Properties. Agronomy 2021, 11, 2418. [Google Scholar] [CrossRef] [Scilit]
- Silva, I.C.B.D.; Basílio, J.J.N.; Fernandes, L.A.; Colen, F.; Sampaio, R.A.; Frazão, L.A. Biochar from Different Residues on Soil Properties and Common Bean Production. Sci. Agric. 2017, 74, 378–382. [Google Scholar] [CrossRef] [Scilit]
- Cui, Y.; Meng, J.; Wang, Q.; Zhang, W.; Cheng, X.; Chen, W. Effects of Straw and Biochar Addition on Soil Nitrogen, Carbon, and Super Rice Yield in Cold Waterlogged Paddy Soils of North China. J. Integr. Agric. 2017, 16, 1064–1074. [Google Scholar] [CrossRef] [Scilit]
- Latini, A.; Bacci, G.; Teodoro, M.; Gattia, D.M.; Bevivino, A.; Trakal, L. The Impact of Soil-Applied Biochars From Different Vegetal Feedstocks on Durum Wheat Plant Performance and Rhizospheric Bacterial Microbiota in Low Metal-Contaminated Soil. Front. Microbiol. 2019, 10, 2694. [Google Scholar] [CrossRef] [Scilit] [PubMed]
- Nguyen, T.T.N.; Xu, C.-Y.; Tahmasbian, I.; Che, R.; Xu, Z.; Zhou, X.; Wallace, H.M.; Bai, S.H. Effects of Biochar on Soil Available Inorganic Nitrogen: A Review and Meta-Analysis. Geoderma 2017, 288, 79–96. [Google Scholar] [CrossRef] [Scilit]
- Zhao, S.; Zhang, Q.; Chen, X.; Huang, Q.; Li, H.; Siddique, K.H.M. Biochar Counteracts the Negative Effects of Microplastics on Physiological and Biochemical Characteristics and Leaf Metabolism in Zea mays L. J. Hazard. Mater. 2025, 496, 139355. [Google Scholar] [CrossRef] [Scilit]
- Busch, D.; Kammann, C.; Grünhage, L.; Müller, C. Simple Biotoxicity Tests for Evaluation of Carbonaceous Soil Additives: Establishment and Reproducibility of Four Test Procedures. J. Environ. Qual. 2012, 41, 1023–1032. [Google Scholar] [CrossRef] [Scilit]
- Solaiman, Z.M.; Murphy, D.V.; Abbott, L.K. Biochars Influence Seed Germination and Early Growth of Seedlings. Plant Soil 2012, 353, 273–287. [Google Scholar] [CrossRef] [Scilit]
- Ao, R.; Liu, Z.; Mu, Y.; Chen, J.; Zhao, X. Degradation of Biodegradable Mulch-Derived Microplastics and Their Effects on Bacterial Communities and Radish Growth in Three Vegetable-Cultivated Purple Soils. Agriculture 2025, 15, 1512. [Google Scholar] [CrossRef] [Scilit]
- Nyambo, P.; Motsi, H.; Chiduza, C.; Malobane, M.E. Biochar Ageing Improves Soil Properties, Growth and Yield of Red Radish (Raphanus sativus) in a Haplic Cambisol. PLoS ONE 2023, 18, e0288709. [Google Scholar] [CrossRef] [Scilit]
- Ali, L.; Xiukang, W.; Naveed, M.; Ashraf, S.; Nadeem, S.M.; Haider, F.U.; Mustafa, A. Impact of Biochar Application on Germination Behavior and Early Growth of Maize Seedlings: Insights from a Growth Room Experiment. Appl. Sci. 2021, 11, 11666. [Google Scholar] [CrossRef] [Scilit]
- Liu, W.; Cao, Z.; Ren, H.; Xi, D. Effects of Microplastics Addition on Soil Available Nitrogen in Farmland Soil. Agronomy 2022, 13, 75. [Google Scholar] [CrossRef] [Scilit]
- Ke, H.; Zhang, Q.; Liu, G. Effects of Wood Biochar Addition on Growth of Cherry Radish (Raphanus sativus L. var. radculus pers). IOP Conf. Ser. Earth Environ. Sci. 2018, 128, 12182. [Google Scholar] [CrossRef] [Scilit]
- Adekiya, A.O.; Agbede, T.M.; Aboyeji, C.M.; Dunsin, O.; Simeon, V.T. Effects of Biochar and Poultry Manure on Soil Characteristics and the Yield of Radish. Sci. Hortic. 2019, 243, 457–463. [Google Scholar] [CrossRef] [Scilit]
- Baloch, P.A.; Uddin, R.; Nizamani, F.K.; Solangi, A.H.; Siddiqui, A.A. Effect of Nitrogen, Phosphorus and Potassium Fertilizers on Growth and Yield Characteristics of Radish (Raphinus sativus L.). Am.-Eurasian J. Agric. Environ. Sci. 2014, 14, 565–569. [Google Scholar]
- Tartaglia, M.; Arena, S.; Scaloni, A.; Marra, M.; Rocco, M. Biochar Administration to San Marzano Tomato Plants Cultivated Under Low-Input Farming Increases Growth, Fruit Yield, and Affects Gene Expression. Front. Plant Sci. 2020, 11, 1281. [Google Scholar] [CrossRef] [Scilit]
- Wu, Q.; Zhou, W.; Chen, D.; Tian, J.; Ao, J. Biochar Mitigates the Negative Effects of Microplastics on Sugarcane Growth by Altering Soil Nutrients and Microbial Community Structure and Function. Plants 2024, 13, 83. [Google Scholar] [CrossRef] [Scilit]

Disclaimer/Publisher’s Note: The statements, opinions and data contained in all publications are solely those of the individual author(s) and contributor(s) and not of MDPI and/or the editor(s). MDPI and/or the editor(s) disclaim responsibility for any injury to people or property resulting from any ideas, methods, instructions or products referred to in the content. |
© 2026 by the authors. Licensee MDPI, Basel, Switzerland. This article is an open access article distributed under the terms and conditions of the Creative Commons Attribution (CC BY) license.