


Abstract
The constant growth of IP data traffic, driven by sustained annual increases surpassing 26%, is pushing current optical transport infrastructures towards their capacity limits. Since the deployment of new fiber cables is economically demanding, ultra-wideband transmission is emerging as a promising cost-effective solution, enabled by multi-band amplifiers and transceivers spanning the entire low-loss window of standard single-mode fibers. In this scenario, an accurate modeling of the frequency-dependent fiber parameters is essential to reliably model optical signal propagation. In particular, the combined impact of attenuation variations with frequency and inter-channel stimulated Raman scattering (SRS) fundamentally shapes the power evolution of wide wavelength division multiplexing (WDM) combs and directly affects nonlinear interference (NLI) generation, as well as the amount of ASE noise. In this work, we review a set of analytical approximations, based on phenomenological approaches, for frequency-dependent attenuation and Raman scattering gain, and analyze their impact on achieving an effective balance between computational efficiency and physical fidelity. Through extensive analyses performed with the open-source software GNPy (version 2.12, Telecom Infra Project) on an optical line system exploring multi-band scenarios spanning C+L+S, C+L+E, and U-to-E transmission, we demonstrate that the proposed approximations reproduce the reference SRS power evolution and NLI profiles with root mean square errors (RMSEs) consistently below 0.03 dB, and down to the 10−3–10−2 dB range for the most accurate configurations. Although the current implementation does not yet provide a direct reduction in computational time, the proposed framework lays the groundwork for future developments toward closed-form or semi-analytical solutions, enabling more efficient modeling and optimization of ultra-wideband optical transmission.
1. Introduction
The growth in demand for IP data traffic is expected to continue steadily, with authoritative mid-term forecasts indicating a compound annual growth rate of 18–27% worldwide over the decade 2023–2033, and even higher values in specific network segments [1]. The deployment of coherent dual-polarization optical technologies in conjunction with wavelength division multiplexed (WDM) systems has become crucial to support the transmission of such volumes of information beyond traditional core and metro networks, for 5G x-haul transport [2], and for inter- and intra-datacenter connectivity. In this context, the evolution of the optical fiber infrastructure is fundamental to maintaining the increasing traffic load while minimizing the need for new deployments, which would require substantial investments in CAPEX due to the high cost of new cable installation [3].
The standard single-mode fiber (SSMF) made of purified glass (ITU-T G.652D fiber) [4] is currently the most deployed fiber variety, since it exhibits low attenuation (below 0.4 dB/km) within the single-mode transmission window and no pronounced water-absorption peaks. This infrastructure covers the U-, L-, C-, S-, E- and O-bands, providing an available spectral window exceeding 50 THz, which represents an attractive solution to increase the overall transmission capacity while maximizing the return on existing CAPEX investments [4,5].
Currently, the C-band is the most widely used by commercial systems, providing 5 THz of the usable transmission bandwidth, while both showing the minimum attenuation of the SSMF and supporting erbium-doped fiber amplification (EDFA). However, C+L multiband solutions are already available [6], supported by Raman amplification and modern EDFAs extended to the L-band, allowing the exploitation of an additional 5 THz bandwidth [7].
In multi-band optical network scenarios, an extension of the classical perturbative physical-layer transmission models [8,9] is necessary to incorporate the frequency dependence of the key fiber parameters, i.e., attenuation, chromatic dispersion and effective area, which influence the strength of nonlinear effects [5,10]. The dominant nonlinear mechanisms are the Kerr effect, responsible for nonlinear interference (NLI) [8,9], and stimulated Raman scattering (SRS), which transfers optical power from higher to lower frequencies by exciting inelastic resonances [11]. SRS is the key phenomenon for inter-band interactions [12], therefore an accurate modeling is essential to find the optimum working point.
Raman scattering arises from the inelastic interaction between the optical field and the vibrational modes of the silica lattice [11,13,14]. In its spontaneous form, individual photons can transfer part of their energy to molecular vibrations, generating scattered light at lower frequencies (Stokes components). Even though each event is weak, in a WDM system, the aggregate effect over long propagation distances leads to spectral power tilt, with high-frequency channels acting as energy donors while low-frequency channels accumulate additional power. At high optical powers the effect becomes relevant, contributing both to nonlinear noise and Raman amplification.
SRS must be studied with respect to both the frequency and the propagation axis z, as the SRS-induced modification of the fiber loss/gain profile vs. z, for each frequency f, significantly affects the amount of NLI noise. Since the approximation of nonlinear propagation impairment as additive Gaussian noise [8] has been shown to hold even for low-dispersion fibers [15], perturbative NLI models can be generalized across the entire U-to-E-band spectrum and partially into the O-band [4,5,8,16,17].
In this work, we focus our analysis on U-to-E-band scenarios supposing propagation on purified-glass standard single-mode fiber—the ITU-T G.652D fiber type—where the perturbative modeling for the NLI is solidly usable.
When transmission is limited along the C-band, SRS can be modeled as a spectral tilt [8,18], with the powers involved in the process decreasing proportionally to the total power. However, this approximation becomes increasingly inaccurate as the transmission bandwidth is expanded [19], and it eventually breaks down completely when the spectral occupation exceeds the SRS efficiency peak, located at roughly 13 THz [5]. For this reason, the set of ordinary differential equations (ODEs) [14,20] representing the SRS mathematical model must be solved numerically with non-negligible computational cost.
Despite the substantial progress made in modeling Raman interactions in optical fibers, accurately predicting the SRS-induced power evolution in wideband WDM transmission remains computationally demanding. Numerical integration of the full set of coupled ODEs provides a high-fidelity representation of the phenomenon [20], but its complexity poses a challenge for real-time optimization, online quality-of-transmission estimation, and large-scale network control. As multi-band systems extend well beyond the C+L-bands and approach the full U-to-E operational window, there is a growing need for simplified, yet reliable, analytical approximations capable of retaining physical accuracy while reducing computational cost.
Several approximation strategies have been proposed in the literature to simplify the modeling of frequency-dependent inter-channel stimulated Raman scattering (ISRS). In particular, linear approximations of the Raman gain spectrum have been shown to provide satisfactory accuracy within the conventional C-band [5,21].
However, as transmission bandwidth extends beyond the C-band into L-, S-, and ultra-wideband regimes, these linear approximations become increasingly inefficient. The spectral variability of both fiber attenuation and Raman gain grows significantly across wide frequency spans, leading to non-negligible modeling errors when linear fits are applied over extended bandwidths.
More sophisticated representations of the Raman gain spectrum based on multi-peak Gaussian or Lorentzian basis functions have also been proposed in the literature, enabling high-fidelity reconstruction of the measured Raman response of silica fibers over wide frequency ranges [22]. These approaches are primarily aimed at accurately reproducing the physical Raman gain profile and are typically validated at the spectral level.
In contrast, in this work we do not focus on proposing new fitting methodologies for the Raman gain spectrum. Instead, we provide a systematic evaluation of how different fitting strategies, i.e., Gaussian and Lorentzian, affect end-to-end system metrics, including nonlinear interference and channel power evolution, across ultra-wideband transmission scenarios along both the frequency and spatial axes.
By replacing the exact Raman gain function with its fitted counterparts within the numerical SRS solver, we assess the resulting power error for a wideband multi-band scenario. This enables us to identify simplified descriptions of Raman interactions that preserve the essential physics while offering substantial reductions in complexity—thus providing a practical and efficient modeling tool for future multiband optical networks.
In addition to the Raman gain spectrum, other fiber parameters, most importantly the frequency-dependent attenuation, also require careful modeling across multi-band spectral usage. The attenuation profile departs significantly from a flat behavior outside the C-band due to the fundamental limits given by Rayleigh scattering and infrared absorption [14,23,24,25], as well as resonances due to residual water contamination. So, this work also considers simplified representations of the loss coefficient based on phenomenological approaches [26] either through parametric fitting of physics phenomena or by exploiting novel Taylor series expansions around suitable reference frequencies. These approximations offer a novel additional opportunity to reduce the overall computational burden while preserving the essential features required for accurate multi-band transmission analysis.
In the present study, the numerical solver operates by directly reading the fitted representations of the Raman gain and attenuation profiles, and therefore no immediate reduction in computational time is achieved with respect to the reference modeling based on measurements. The reduction in computational complexity should instead be regarded as a prospective benefit, to be realized in future work by explicitly embedding the proposed approximations within the differential equations governing power evolution. This approach opens the possibility of deriving closed-form or semi-analytical solutions, which could significantly accelerate system-level simulations and network optimization procedures in ultra-wideband transmission scenarios. The results show that the most accurate configurations achieve root mean square errors (RMSEs) in the – dB range for both power and NLI profiles, while fully approximated models remain below approximately dB even in U-to-E-band transmission. In particular, piecewise linear fitting of the attenuation profile combined with Lorentzian decomposition of the Raman gain coefficient provides the best overall performance across all bandwidth scenarios. The error values are fully comparable with those reported in previous studies for C-band and C+L-band transmission, where modeling inaccuracies typically fall within the to dB range [21].
The remainder of this paper is organized as follows. In Section 2, we introduce the frequency-dependent single-mode fiber model adopted in this work, detailing the analytical description of the loss coefficient, effective area and Raman gain efficiency, and we present the proposed phenomenological approximations for and based on piecewise linear and Taylor series fitting for attenuation and Gaussian/Lorentzian decompositions for the Raman gain. The numerical SRS solver, the considered multi-band transmission scenarios, and the error metrics used for validation, including RMSE on both power and NLI profiles, are also described. Section 3 reports the assessment of fiber propagation effect obtained by the open-source software GNPy [27,28,29] for C+L+S, C+L+E, and ultra-wideband U-to-E transmission, comparing the different approximation strategies against the fully physical reference model in terms of power evolution and NLI accuracy. In Section 4, these results are critically discussed, highlighting the trade-offs between model complexity and accuracy and identifying the most effective combinations of attenuation and Raman gain approximations for wideband QoT estimation. Finally, Section 5 concludes the paper by summarizing the main findings and outlining how the proposed modeling framework can support efficient physical-layer design, performance evaluation and network planning in future multiband optical networks.
2. Materials and Methods
In the following subsections, the main fiber parameters are presented, particularly highlighting their frequency dependence during optical propagation in a generic wideband transmission scenario.
The analysis assumes transmission over an SSMF having frequency-dependent spectral characteristics, i.e., attenuation, chromatic dispersion, effective area and Raman gain efficiency. The frequency bounds of each band composing the entire transmission scenario are presented in Table 1.
Table 1.
Frequency bounds of each band composing the entire transmission scenario.
2.1. Loss Coefficient Function
The fiber loss coefficient models the power loss that affects the propagation of optical signals. It is obtained as the sum of different contributions deriving from the fiber composition and the manufacturing process, i.e., Rayleigh scattering, violet and infrared absorption, OH-ion absorption and phosphorous absorption in the fiber core. According to [26], the loss coefficient function vs. wavelength can be expressed in logarithmic units (dB/km) by modeling each phenomenological component as follows:
where:
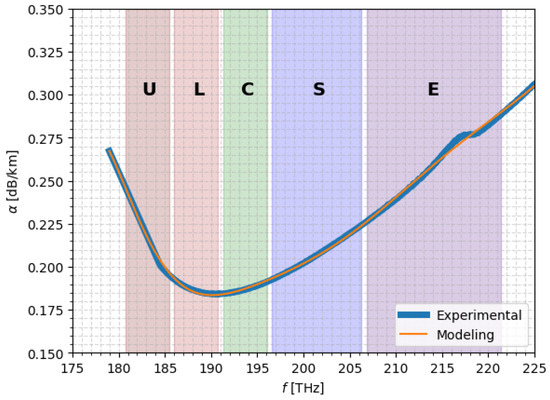
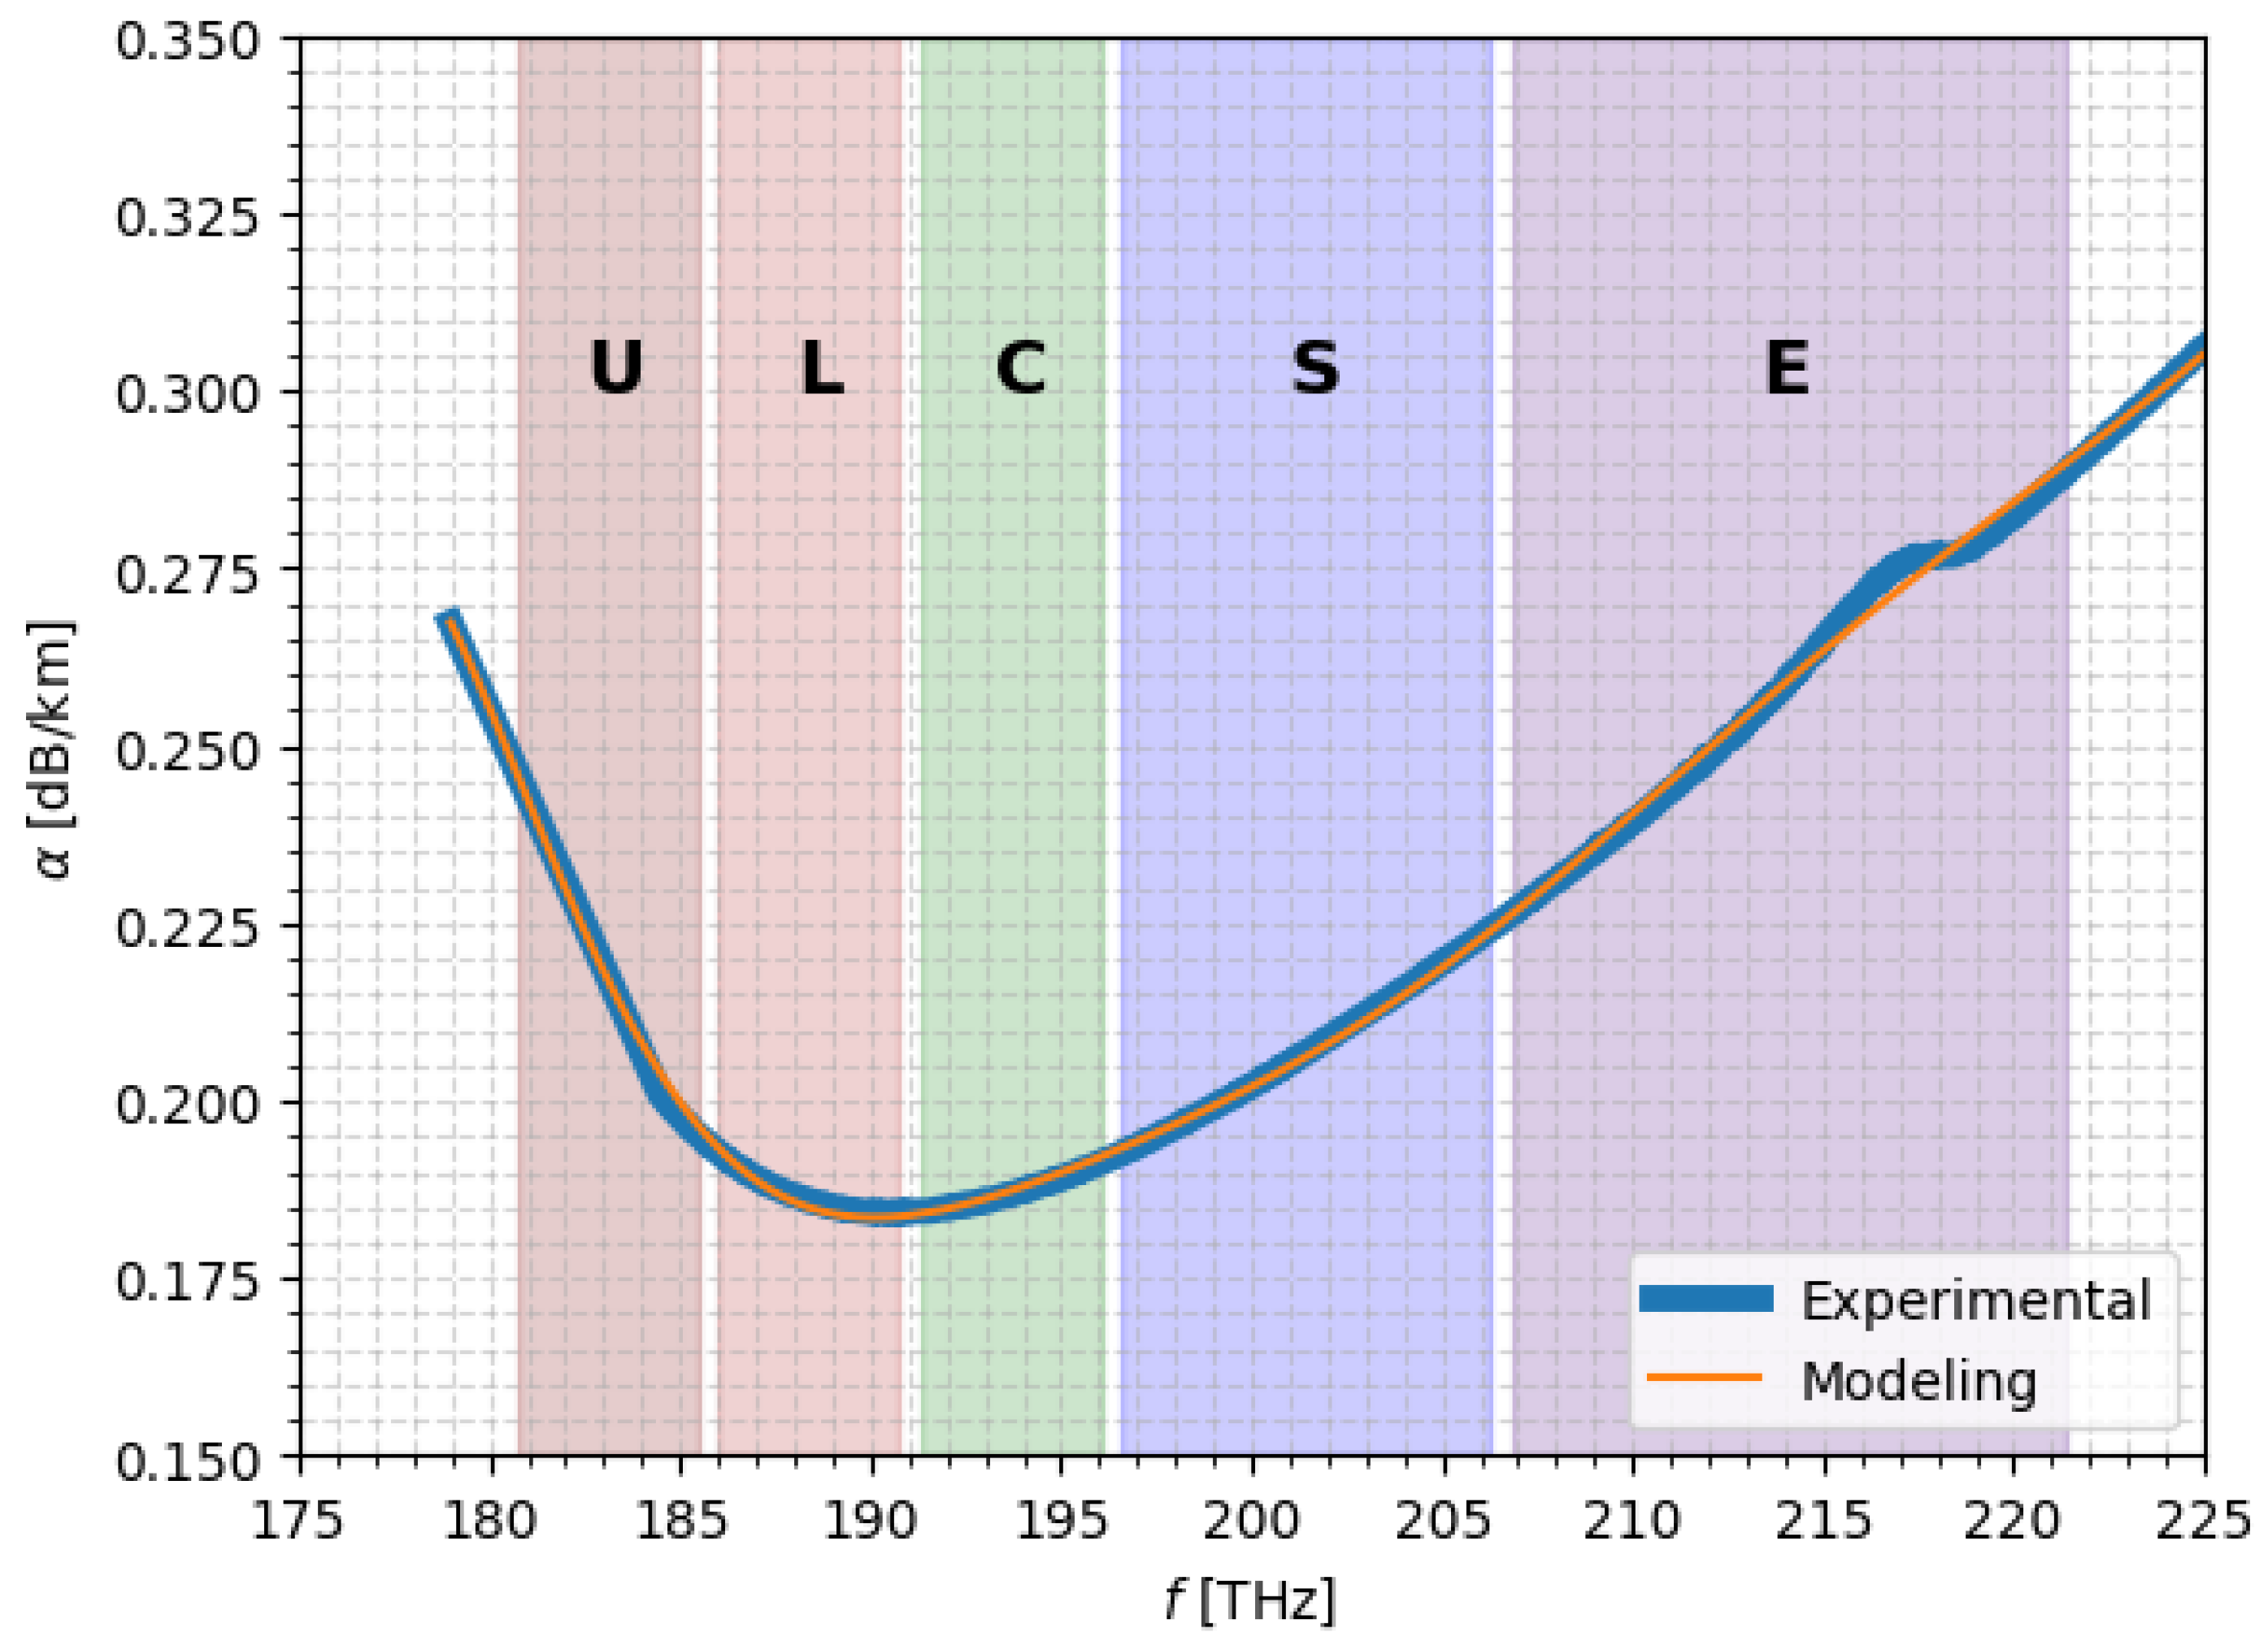
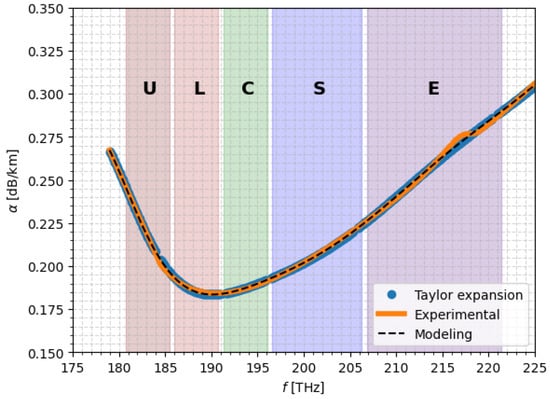
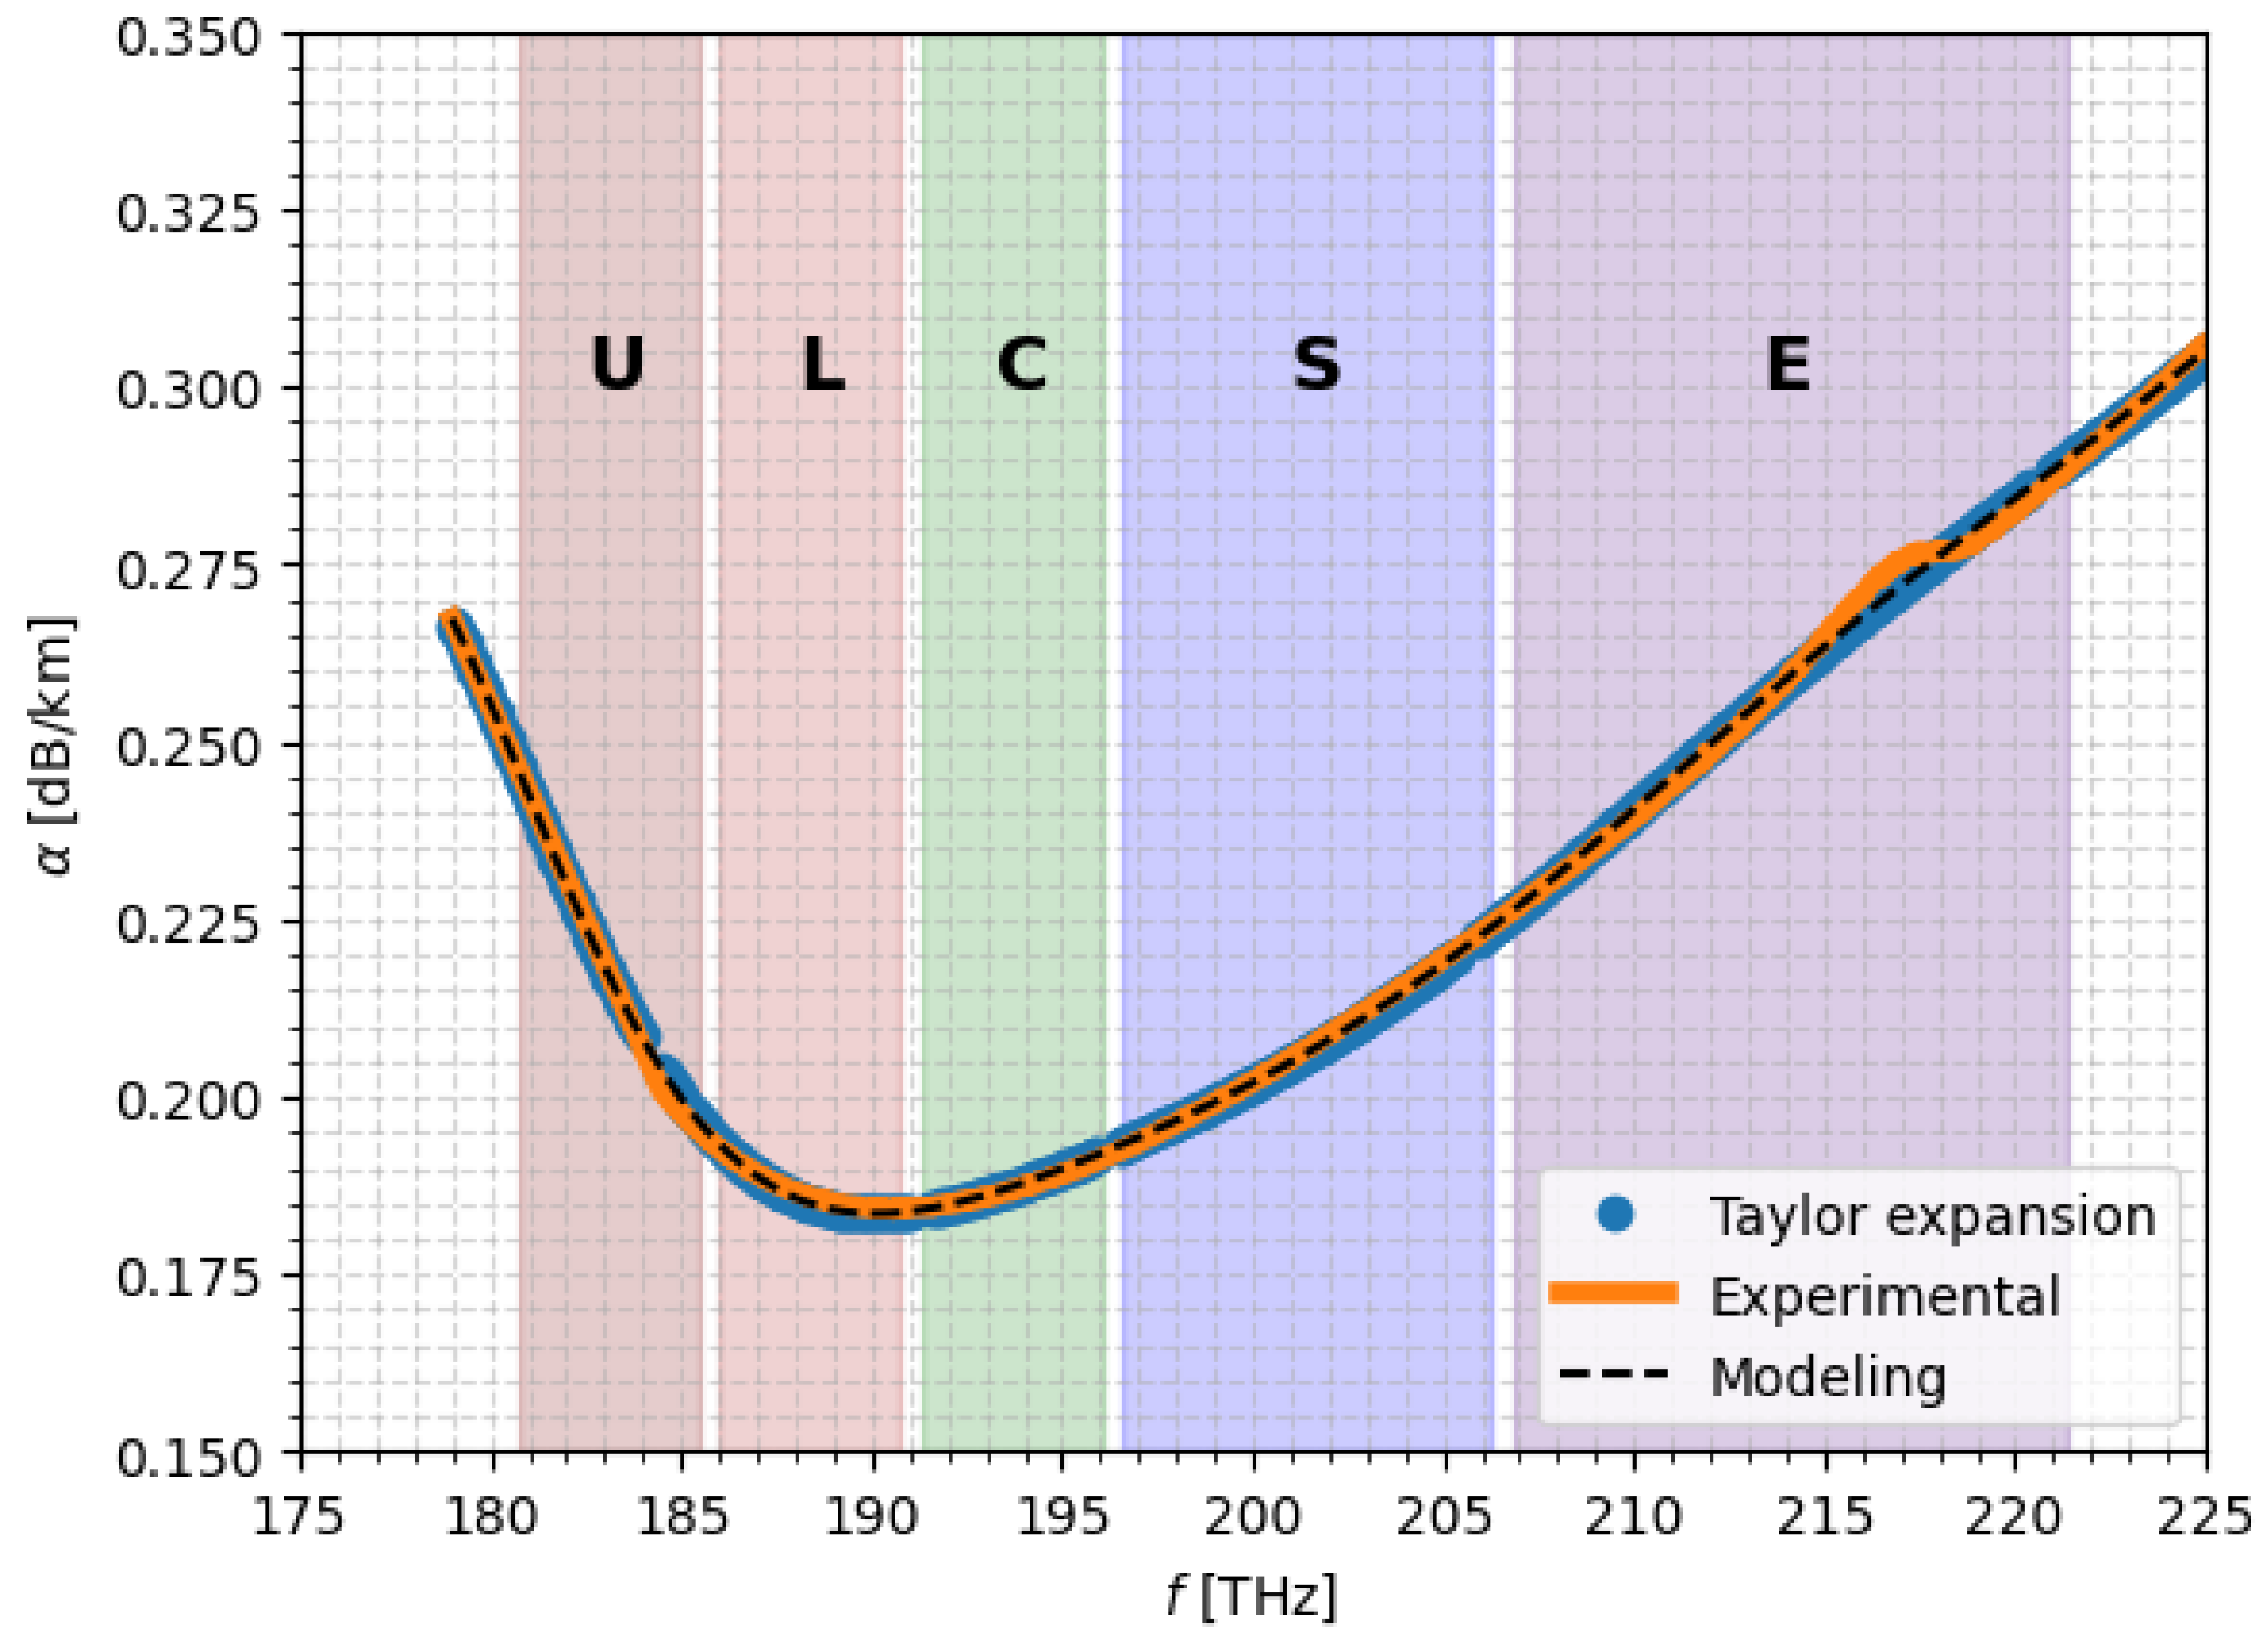
The parameters A, B, , , adopted in this work, namely dB μm4/km, dB/km, dB/km, , dB/km are taken from [30], where they are obtained through a dedicated fitting procedure applied to experimentally measured attenuation data. Figure 1 shows the comparison between the measured loss-coefficient samples and the corresponding fitted attenuation curve.
Figure 1.
SSMF wideband loss coefficient profile, [30].
2.2. Loss Coefficients Approximations
The full analytical expression of the loss coefficient , reported in Equation (1), accurately accounts for all physical contributions to fiber attenuation. However, its direct use in numerical simulations can be computationally expensive. To reduce this overhead while preserving the essential spectral behavior, two novel simplified approximations are adopted in this work: a piecewise linear fitting of the loss profile and a Taylor series expansion of the analytical components. Both methods allow for efficient evaluation of in wideband propagation simulations.
2.2.1. Piecewise Linear Approximation
In the first approach, the measured attenuation profile is reconstructed using a set of linear segments. Let denote a set of sampling points of the loss coefficient. The piecewise linear approximation is defined as
This representation can be interpreted as a sum of independent linear segments, each active over a different wavelength interval. In this work, segments are used. The segment boundaries (breakpoints) are chosen as uniformly spaced points between the minimum and maximum frequencies of the dataset:
where each segment covers the interval , and a local linear fit is performed within each segment. Despite its simplicity, it closely matches the measured attenuation profile and is particularly suitable for simulations that require frequent evaluation of , such as wideband GN-model calculations.
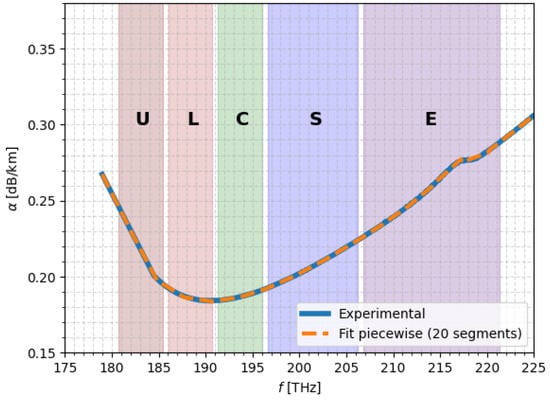
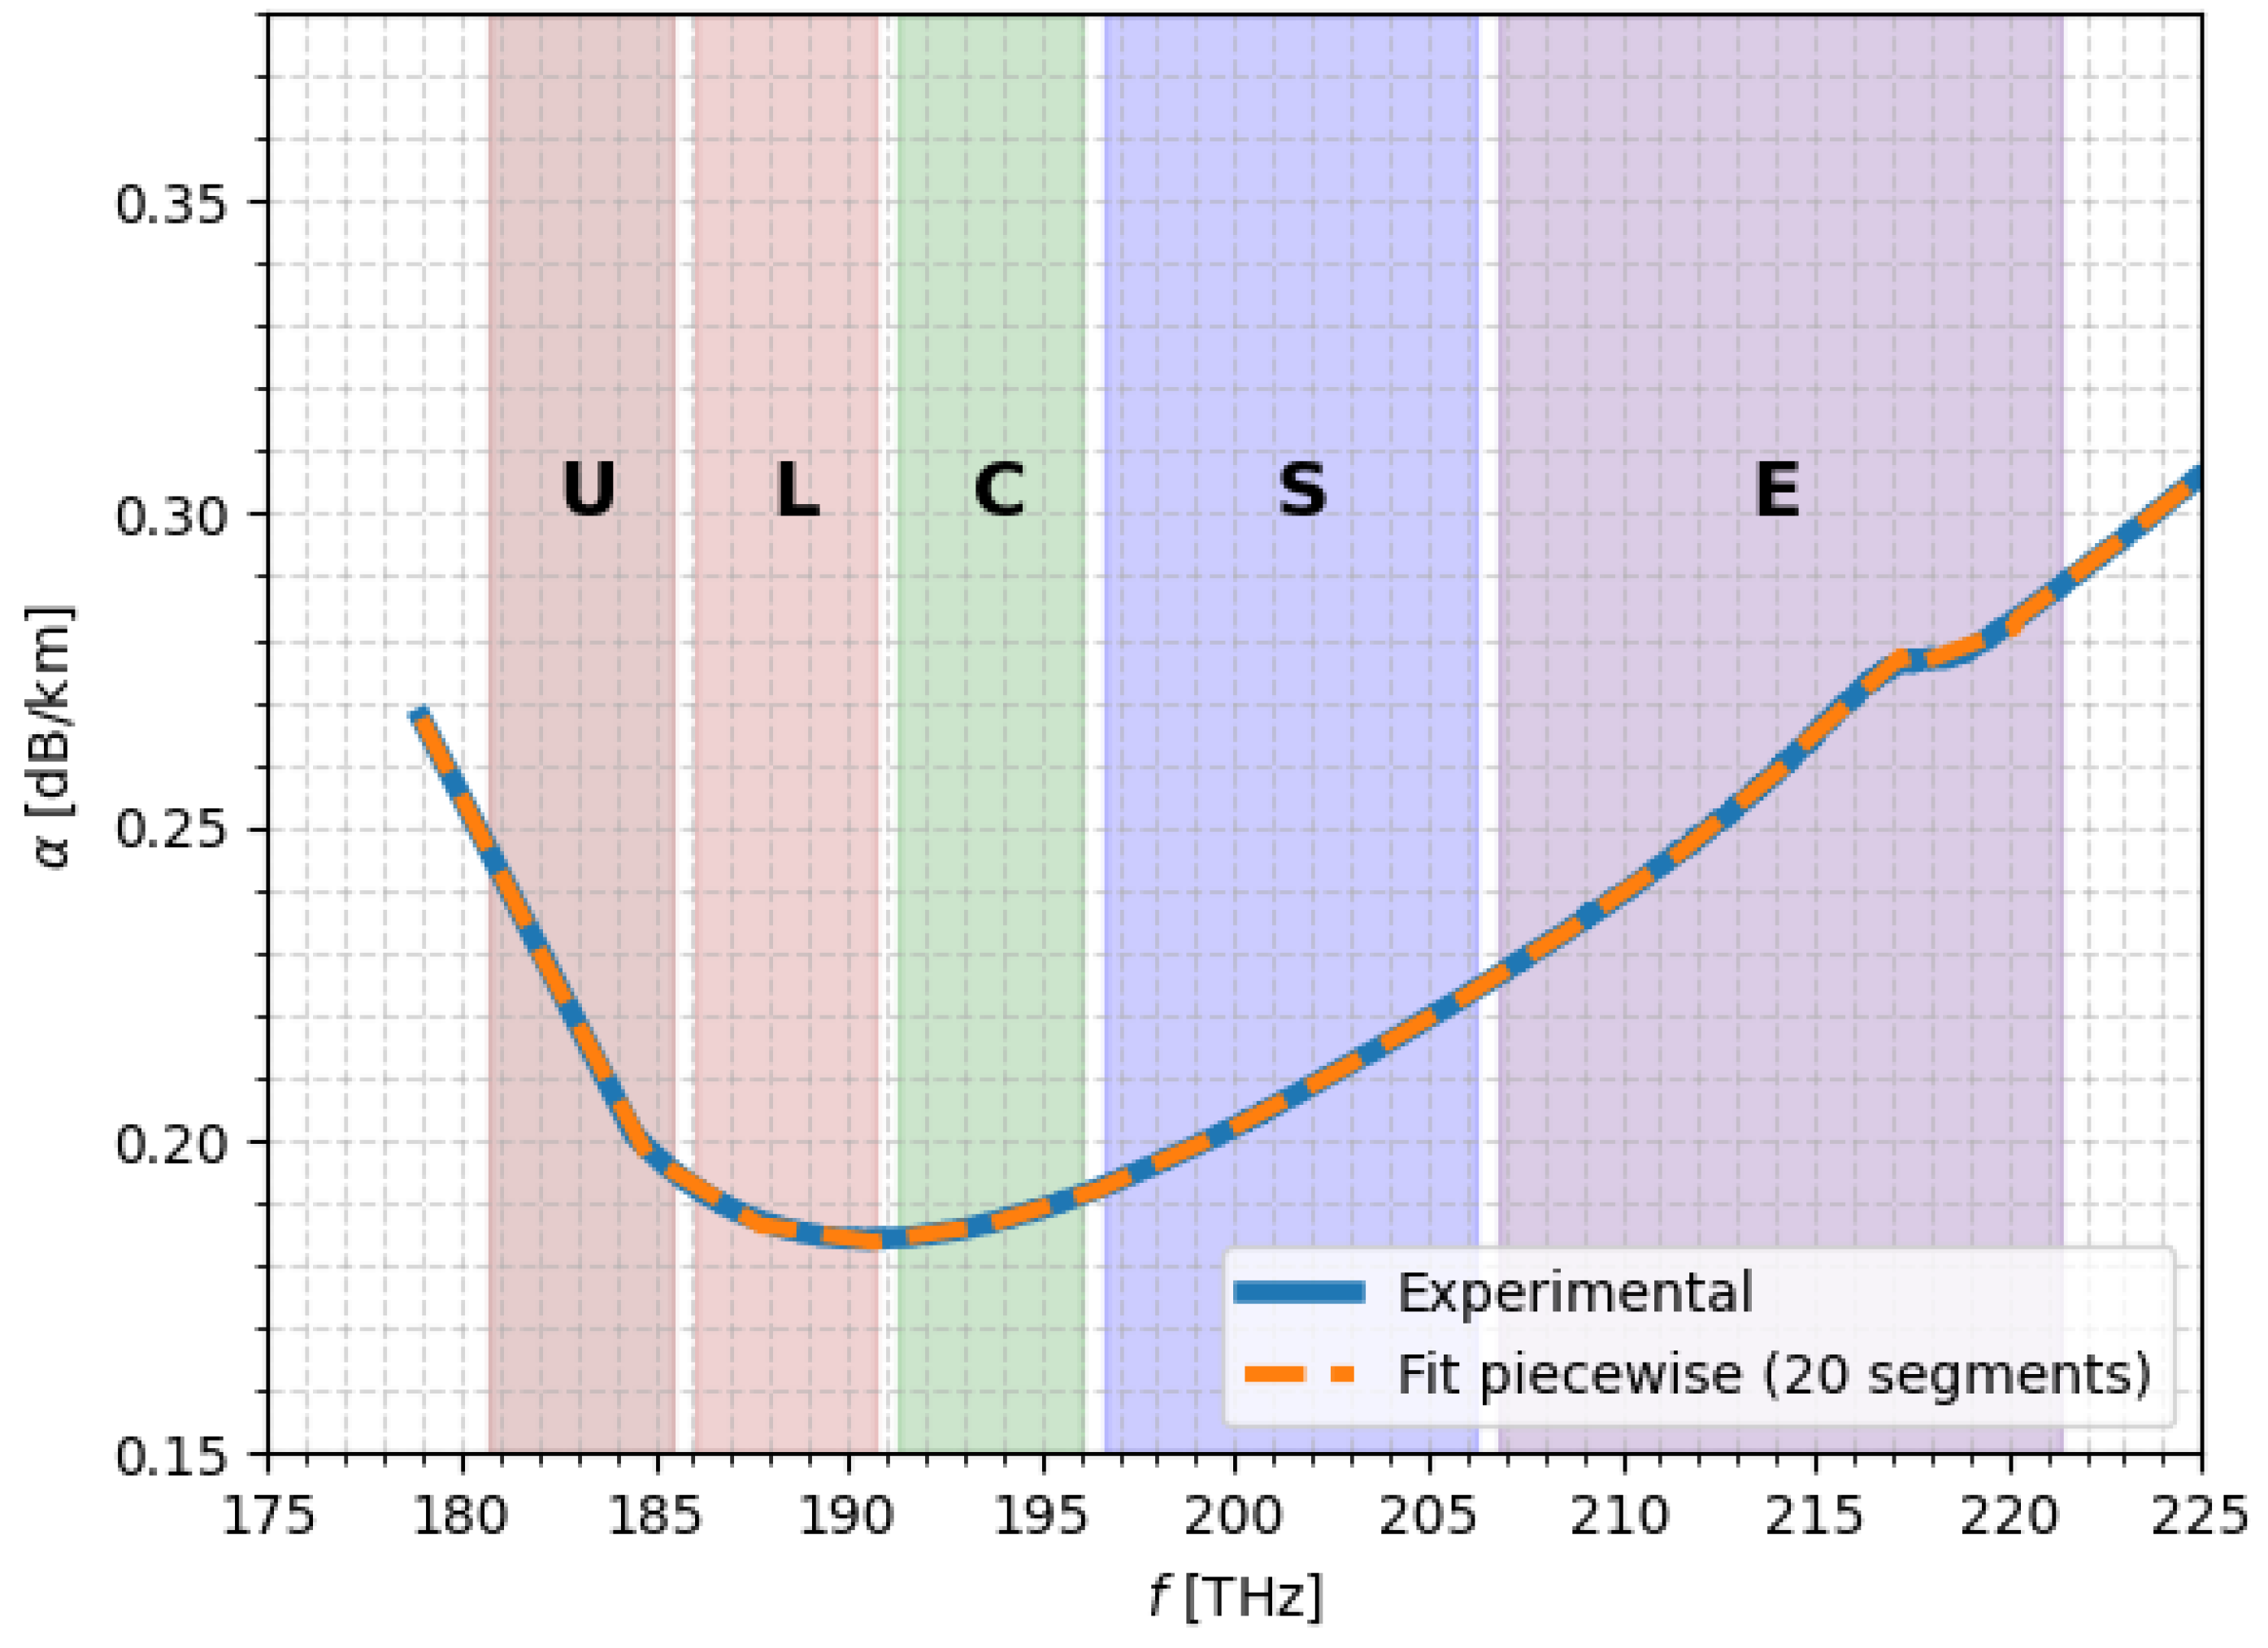
Figure 2 shows the agreement between the measured attenuation and the profile obtained via the piecewise linear approximation.
Figure 2.
SSMF attenuation profile obtained using the piecewise linear approximation.
To determine an appropriate number of segments for the piecewise linear approximation of , a sensitivity analysis was conducted by varying the number of segments between 5 and 21 and computing the corresponding RMSE and MAE values, reported in Table 2.
Table 2.
Number of segments and corresponding RMSE and MAE.
As expected, increasing the number of segments systematically reduces the fitting error. However, the improvement is not linear. A rapid error reduction is observed when increasing the number of segments from 5 to approximately 10, where the RMSE decreases by nearly one order of magnitude. Beyond 15 segments, the reduction becomes progressively marginal, indicating a saturation behavior.
In particular, increasing the segmentation from 18 to 20 segments reduces the RMSE from to dB/km, corresponding to a relative improvement below 5%. Further increasing to 21 segments provides only a limited additional reduction. This demonstrates that beyond approximately 18–20 segments, the gain in accuracy becomes negligible compared to the increase in model complexity.
Therefore, 20 segments were selected as a balanced trade-off between approximation accuracy and structural simplicity, ensuring sub- dB/km RMSE while avoiding unnecessary model over-parameterization.
2.2.2. Taylor Series Approximation
The second approach approximates each analytical component of the attenuation model by expanding it in a Taylor series around a reference wavelength , typically chosen near the center of the operating band. For a generic contribution (e.g., Rayleigh scattering, UV absorption, IR absorption), we have
where only the first two or three terms are retained depending on the smoothness of the function. In practice, retaining up to the second-order term provides a good compromise between accuracy and computational efficiency for typical SSMF attenuation profiles.
The overall Taylor series approximation of the total loss coefficient is then
where the index k spans all physical contributions included in the full model. This produces a smooth analytical approximation (Figure 3) that is computationally lightweight and especially convenient when is evaluated inside integrals or differential equations.
Figure 3.
SSMF attenuation profile obtained through the Taylor series expansion of the analytical components in Equation (1).
In this work, the Taylor series approximation is truncated at second order, which provides sufficient accuracy over the considered wavelength range, as the higher-order terms contribute negligibly to the overall attenuation profile. The reference wavelength adopted is THz, because it is close to the center of the transmission bandwidth.
2.3. Effective Area
The effective area is the parameter governing the strength of nonlinear interactions in optical fibers [14], as it quantifies the spatial confinement of the propagating mode. It is directly related to the nonlinear coefficient through Equation (2),
where denotes the nonlinear refractive index of silica and the wavelength associated with the optical frequency f. A smaller effective area leads to higher optical field intensities, thereby enhancing Kerr-induced effects as well as Raman interactions.
Typically, in SSMF, is not constant across the transmission bandwidth and exhibits a slow frequency dependence, which becomes particularly non-negligible in wide-band transmission regimes.
If the modal profile can be approximated by a Gaussian function with radius , can be computed as , with , where a represents the fiber core radius and V is the normalized frequency, which can be expressed with Equation (3). In the case of a minor relative index step at the core-cladding interface, , where and represent the core and the cladding radius, respectively. In this work a and are assumed to be equal to μm and m2/W, as for common SSMF, while the cladding refractive index and the refractive index difference with respect to the core are fixed at 1.45 and 0.31%.
2.4. Raman Gain Efficiency
The SRS is the principal nonlinear effect arising during multi-band transmission [31]. It originates from the inelastic interaction between the propagating electromagnetic field and the fiber’s dielectric medium. During Raman scattering, light incident on a medium is converted to a lower frequency. The energy difference of the signals at the two different frequencies determines the frequency shift and the Raman gain curve [11,13,14]. The Raman gain coefficient, , quantifies the coupling between the higher frequency () and lower frequency () channels, which are referred to as pump and Stokes waves, respectively, and whose frequency shift is equal to . The power evolution of a signal propagating at frequency in the presence of SRS can be expressed through Equation (4) [21],
where the following apply:
- is the frequency-dependent attenuation coefficient.
- is the optical power of the Stokes signal at position z.
- is the optical power of the j-th channel.
- is the frequency-dependent fiber attenuation.
- and are the frequencies of the Stokes and interacting channels.
- is the Raman gain coefficient for the frequency shift .
Given a reference pump at the frequency , the whole Raman gain coefficient [30] can be modeled with Equation (5)
where the following apply:
- accounts for the polarization alignment factor between pump and Stokes waves.
- is the Raman gain coefficient at the reference frequency.
- is the effective mode-overlap area between pump and Stokes waves at the given frequency.
The reference Raman gain is defined as
where is the Raman gain coefficient in terms of mode intensity, and is the effective area overlap between the pump and the Stokes wave.
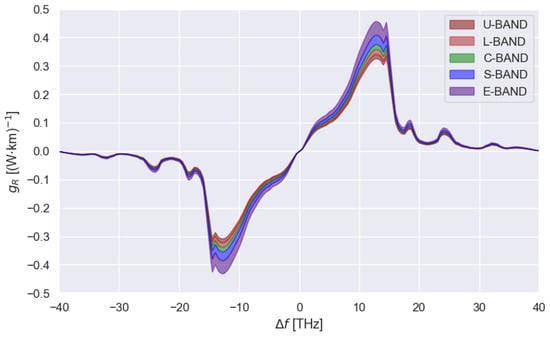
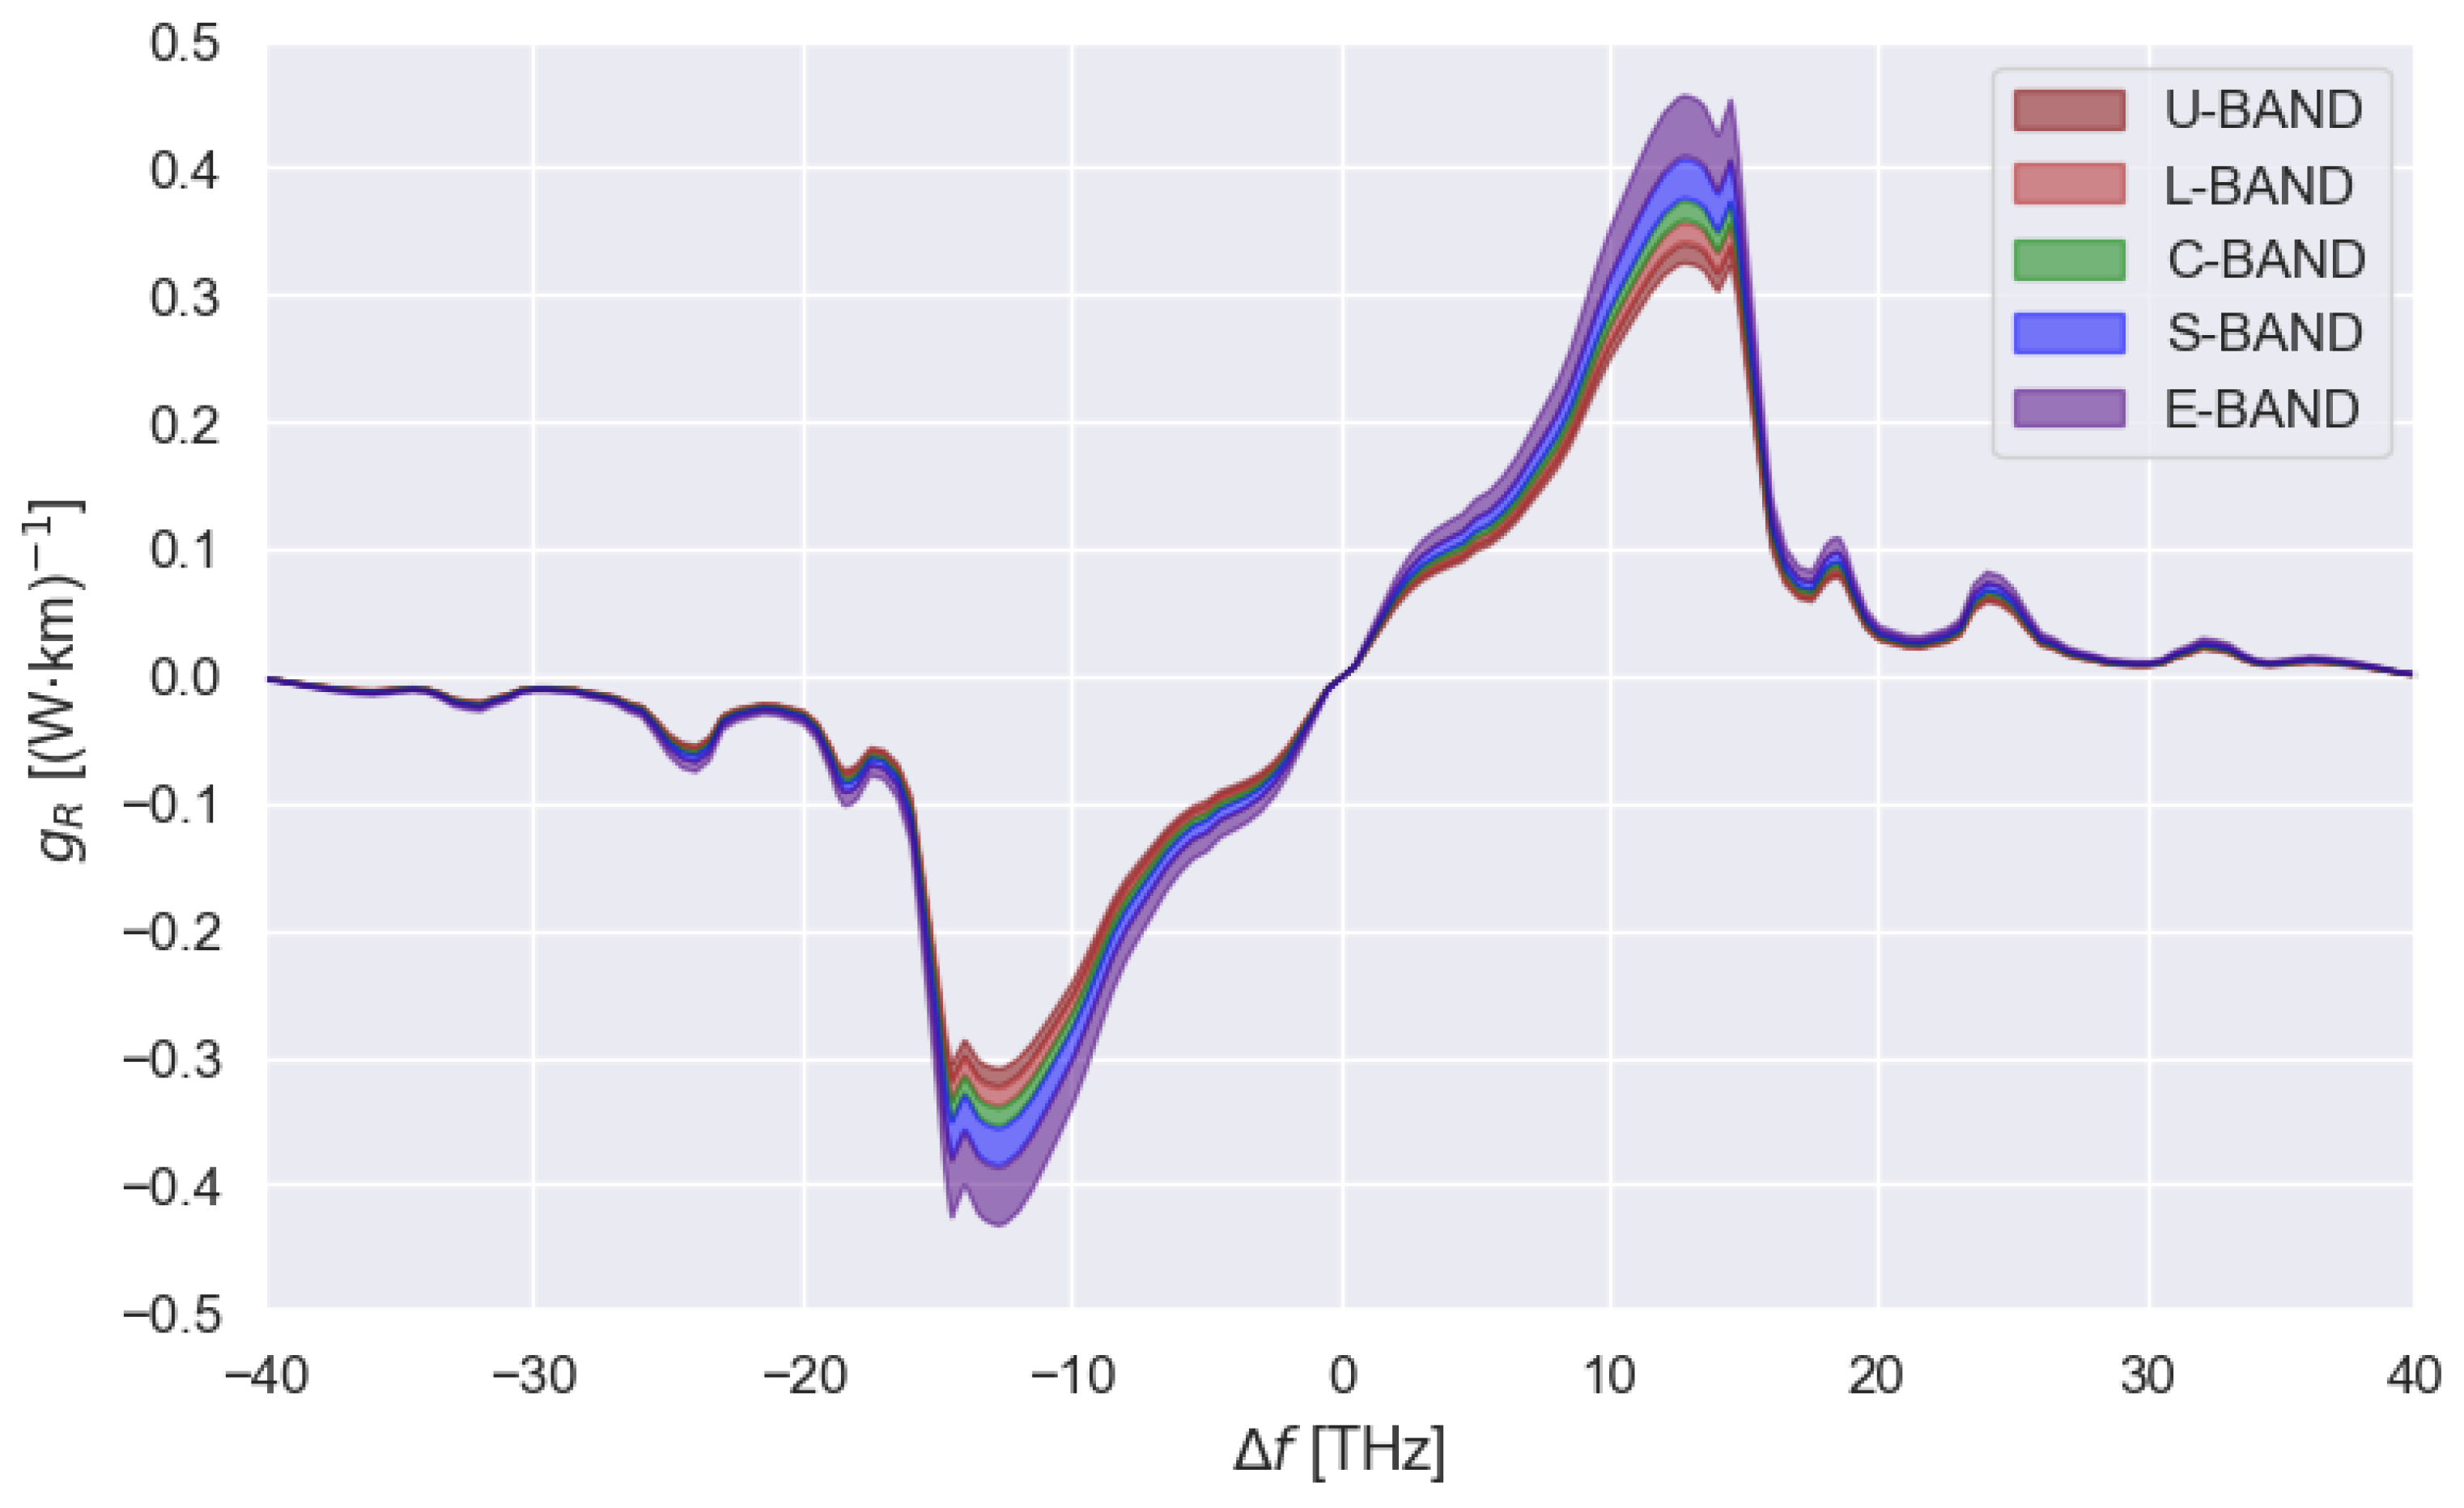
In this work, the fused silica Raman gain coefficient curve reported in Figure 4 is used, with a reference frequency of 206.185 THz [30].
Figure 4.
SSMF Raman gain coefficient profile for each frequency of the considered wideband scenario [30].
2.5. Raman Gain Approximations and Fitting Strategies
The Raman gain coefficient is characterized by a broadband and highly asymmetric spectral profile, as shown in Figure 4, with a main peak around 13 THz and a slowly decaying tail extending beyond 20 THz. The choice of a proper, accurate, and computationally efficient representation is fundamental when solving the SRS equations because it directly influences the inter-channel power transfer in wideband WDM systems.
In this work, several approximation strategies for are investigated, aiming to reduce numerical complexity while preserving physical fidelity. By exploiting analytical fits, the measured spectrum is approximated using parametric functions, i.e., combinations of Gaussian and Lorentzian profiles [22]. The accuracy of the result depends on the number of parameters and on the fitting bandwidth, making it possible to choose the suitable compromise between complexity and precision. Each approximation is incorporated in the SRS solver [28] and combined with the different approximations of to investigate the resulting power evolution across frequencies and space, and the error with respect to the reference model.
Two families of fitting functions are considered:
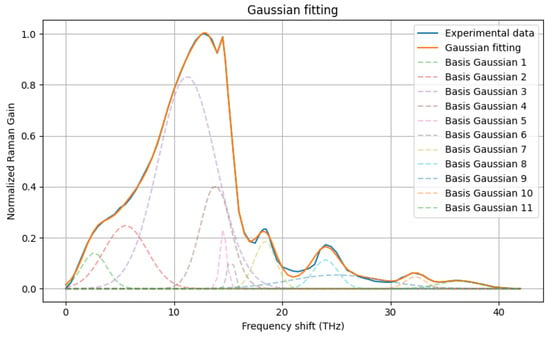
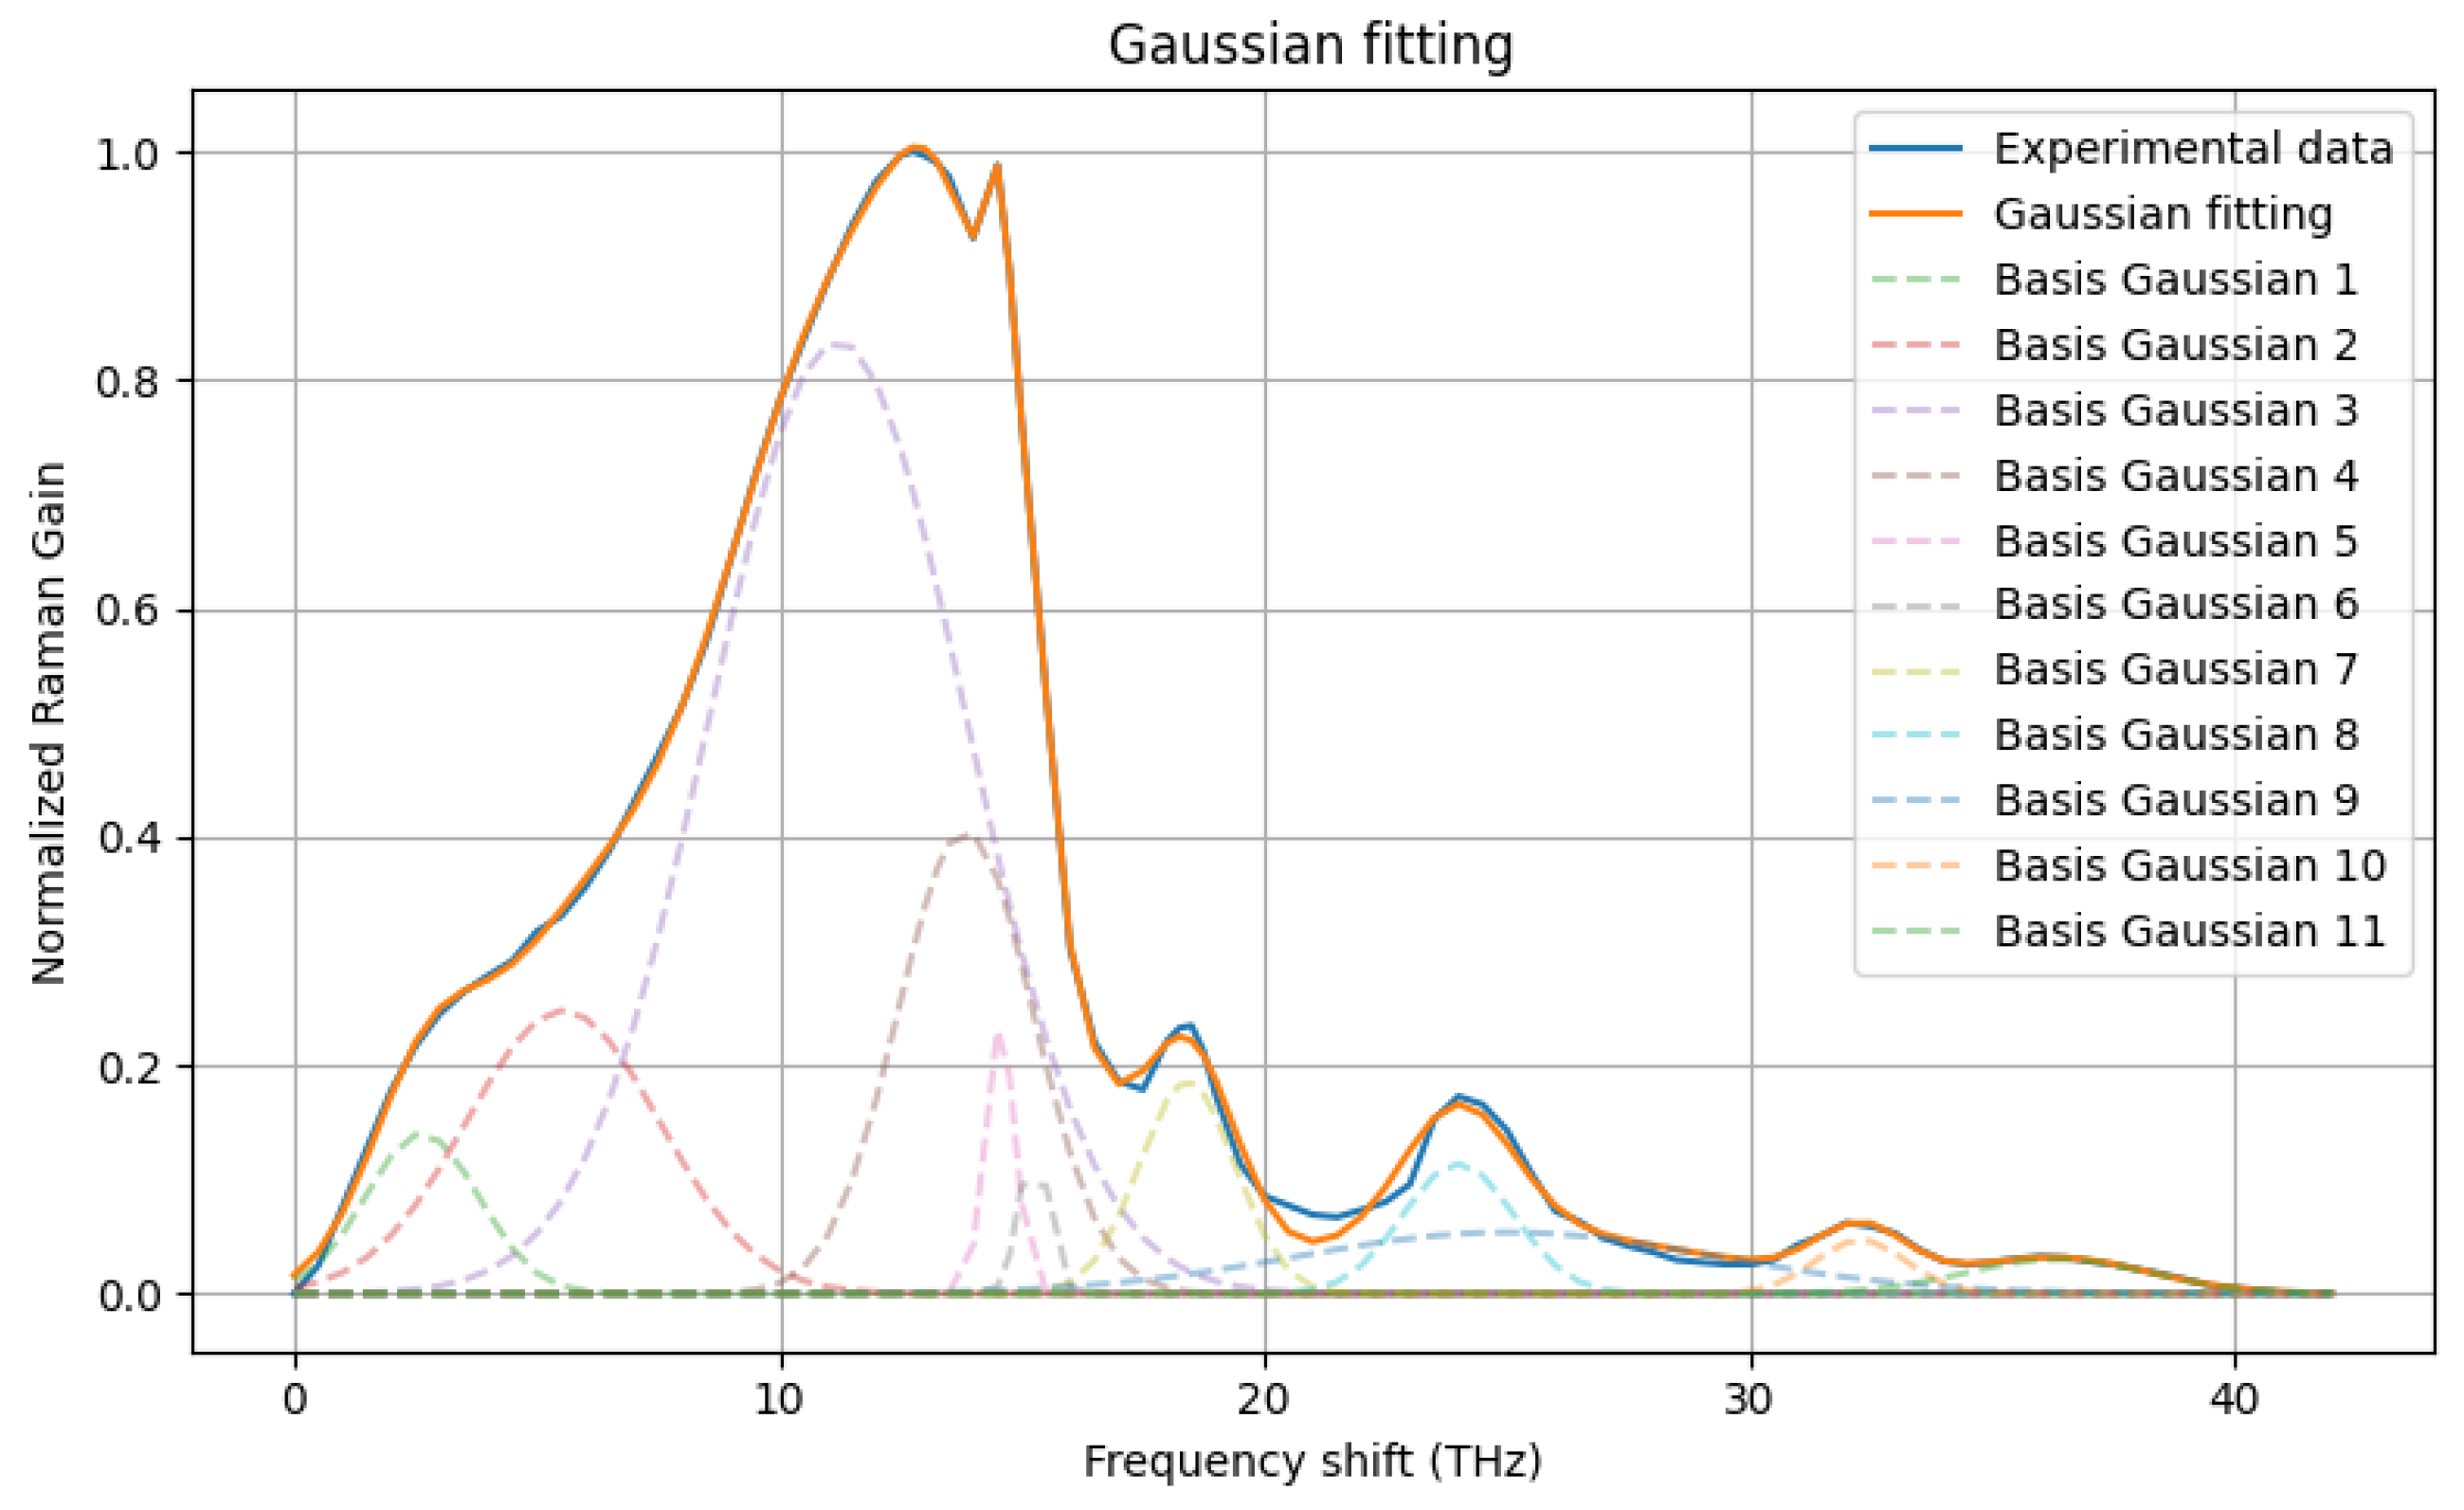
- Gaussian decompositionThe Raman gain profile is approximated as the sum of a set of Gaussian functions,where the set of parameters is obtained through least squares procedure.Figure 5 illustrates the fitting result obtained using a set of eleven Gaussian basis functions, whose parameters are shown in Table 3. The ratio between the area of the fitted curve and that of the reference Raman gain profile differs by only 0.07%, confirming the ability of Gaussian components to accurately reproduce both the main peak and the extended spectral tail.
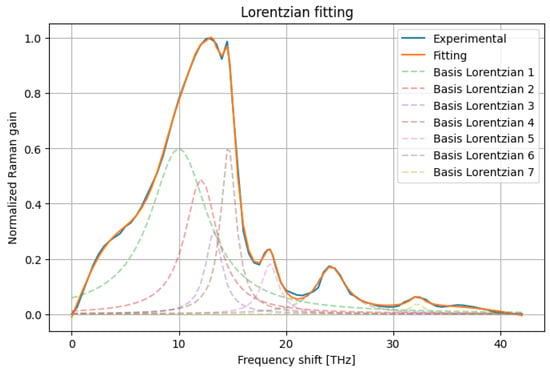
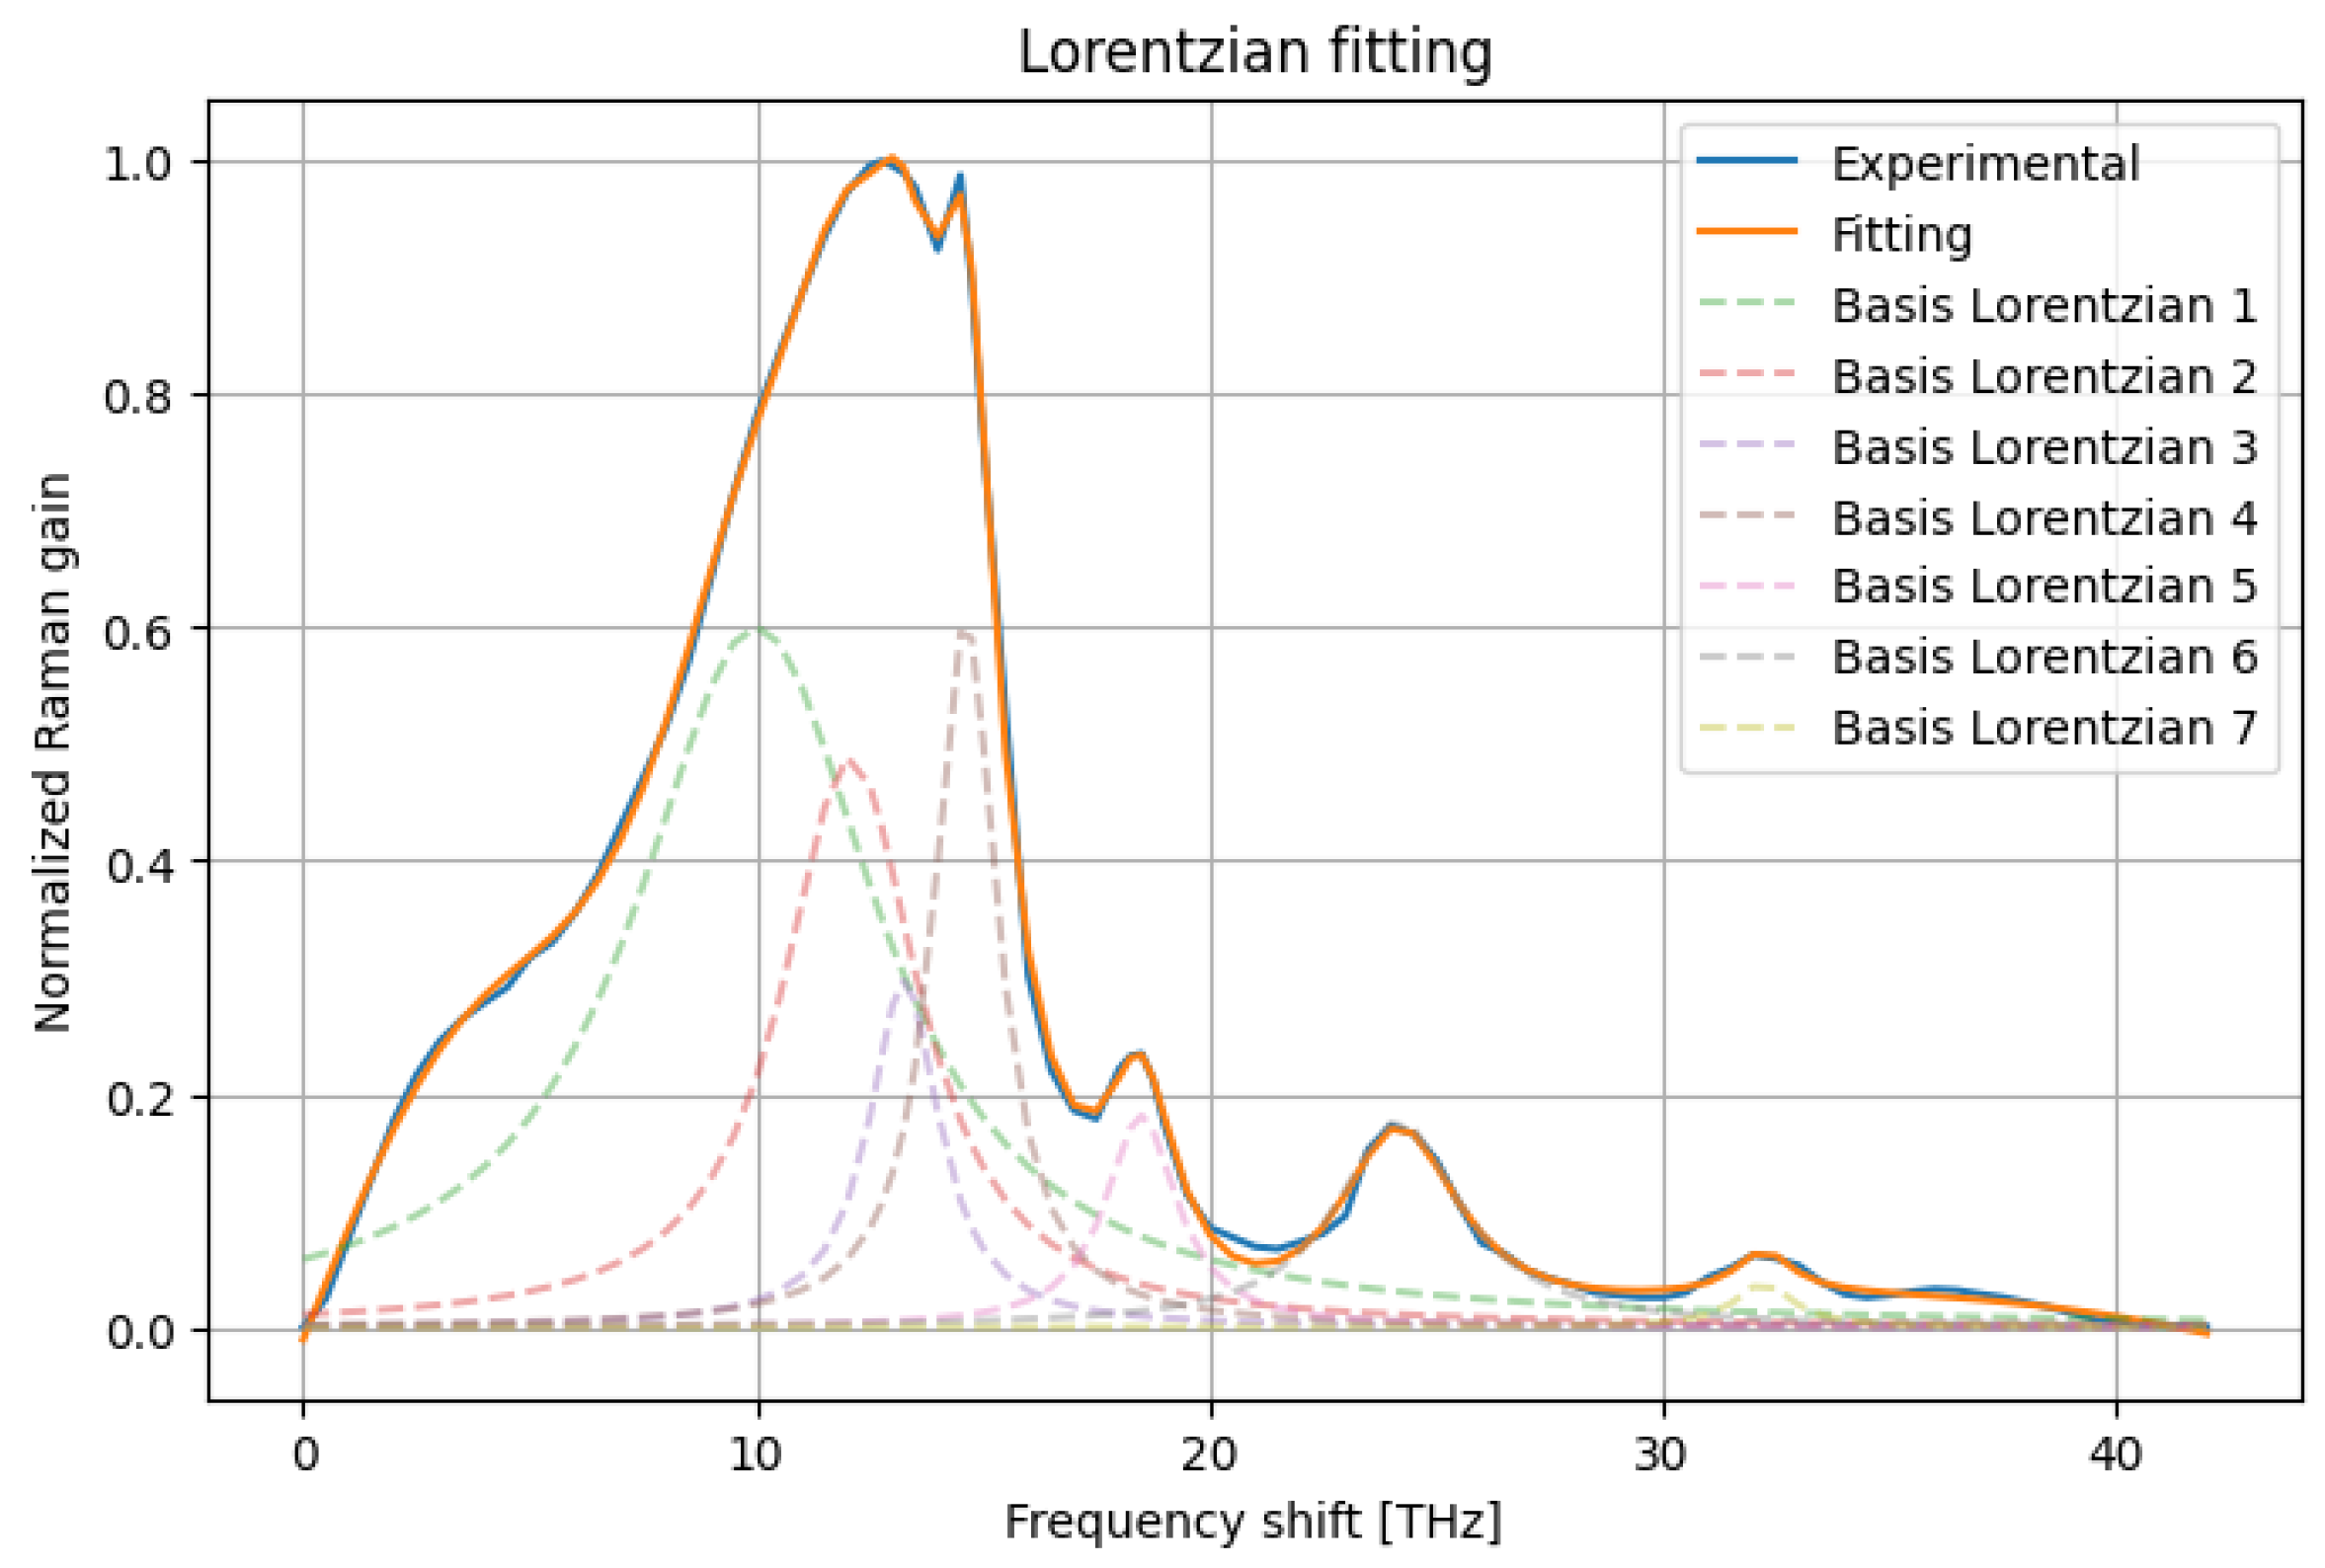
- Lorentzian decompositionThe Raman gain profile is approximated as the sum of a set of Lorentzian functions:where again the set of parameters (, ), representing the peak position and the full width at half maximum, respectively, is obtained through the same least-squares fitting procedure used for the Gaussian decomposition.Figure 6 shows the Lorentzian-based fitting obtained with nine components (see Table 4). The resulting approximation closely matches the reference Raman gain curve, with an area deviation of only %, demonstrating that Lorentzian bases also provide a flexible and accurate analytical representation of both the peak region and the long spectral tail.
Figure 5.
SSMF Normalized Raman gain coefficient profile approximated through Gaussian decomposition.
Table 3.
Sets of parameters describing the eleven Gaussian basis functions.
Figure 6.
SSMF Normalized Raman gain coefficient profile approximated through Lorentzian decomposition.
Table 4.
Sets of parameters (, ) describing the nine Lorentzian basis functions.
2.6. Numerical SRS Solver
The propagation of optical power along the fiber is numerically solved using a first-order differential equation that models stimulated Raman scattering (SRS) in the presence of fiber attenuation. For a single channel i, the governing equation is given by
where the following apply:
- is the power of the i-th channel at position z.
- is the corresponding attenuation coefficient.
- is the Raman coefficient representing power transfer from channel j to channel i.
- represents the Raman gain induced on channel i by all other channels.
To solve Equation (6) numerically, the fiber is discretized into N segments of length , such that for . The explicit Euler method is applied to advance the solution along the fiber:
where accounts for lumped losses occurring at discrete positions along the fiber.
The Euler method is conditionally stable. To avoid divergence or negative power values, the step size must satisfy
where is an estimate of the maximum power in channel j along the fiber. In the simulations presented here, a step size of m is used.
The initial condition is set as , representing the launch power of each channel. No feedback is applied at the fiber end, and the solution is computed only along the physical fiber span.
The Raman coefficient matrix in Equation (7) can be obtained from experimental measurements or analytical decompositions, which are directly incorporated into the solver without modifying the numerical scheme. Similarly, the attenuation coefficients can be computed using either the full physical loss model or one of its simplified representations.
This numerical framework provides a unified approach to compare different models of Raman gain and fiber attenuation, allowing a consistent evaluation of their impact on the evolution of optical power along the fiber span.
2.7. Simulation Setup
To assess the errors induced by different analytical approximations on both the received power evolution and the nonlinear interference (NLI), multi-band optical transmission systems have been analyzed using the open-source tool GNPy [27,29]. As a reference scenario, both the fiber loss profile and the stimulated Raman scattering (SRS) interaction are derived from experimental data. The same analyses are then repeated by feeding GNPy with the corresponding analytical approximations of loss and Raman gain, allowing a consistent comparison under identical transmission conditions.
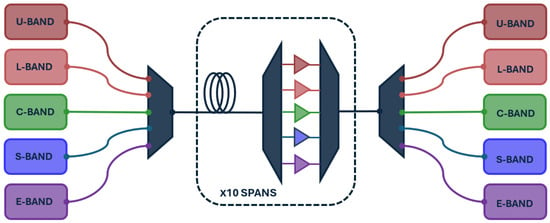
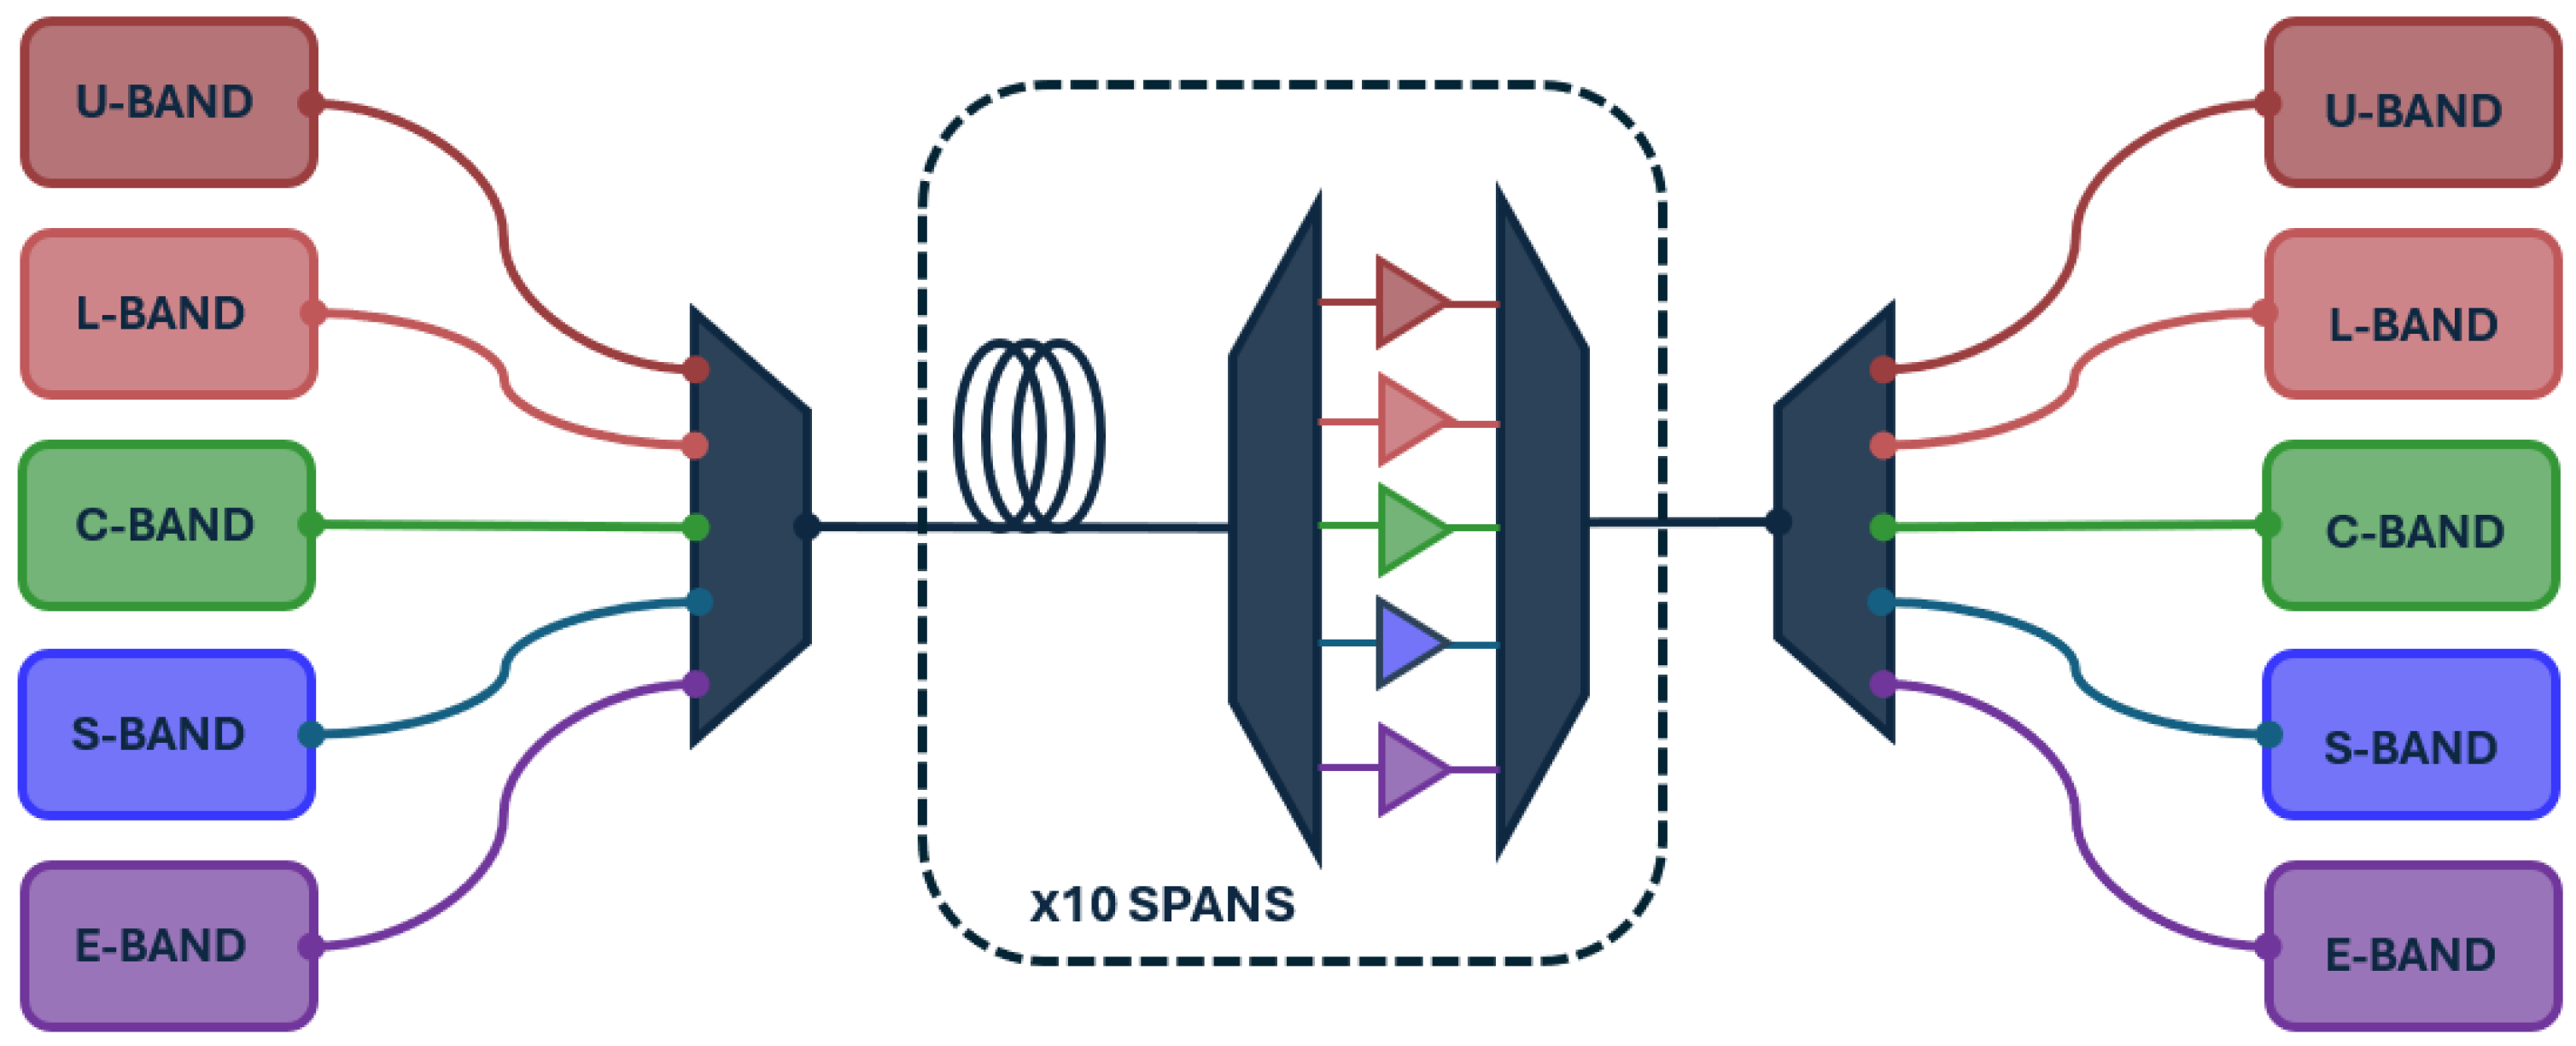
The numerical analysis considers a multi-band WDM transmission system composed of 10 identical fiber spans, each 70 km long. The setup in Figure 7 includes five spectral bands—U, L, C, S, and E—populated with uniformly spaced WDM channels. Each channel carries an independent 400 G signal using dual-polarization 16-QAM at 64 GBaud, with a fixed 75 GHz channel spacing across all bands.
Figure 7.
Scheme of the implemented optical line system architecture.
At the transmitter side, optical multiplexers are employed to combine all channels across the five bands and launch the resulting signal into the fiber link. At the end of each span, the channels are demultiplexed and amplified using band-specific optical amplifiers, whose assumed values of noise figure NF are reported in Table 5, thereby compensating for span losses independently within each spectral band. At the receiver side, optical demultiplexers route each wavelength to its dedicated coherent receiver chain.
Table 5.
Optical amplifier noise figure values used in the considered wideband scenario.
The span length of 70 km corresponds to a standard design in terrestrial fiber networks, balancing signal attenuation, amplifier spacing, and nonlinear impairments. The number of spans was sufficient to accumulate nonlinear effects and stimulated Raman scattering (SRS) while still allowing tractable numerical simulations.
It is worth noting that the spectral discretization described above refers exclusively to the WDM channel grid and is independent of the spatial discretization adopted in the numerical propagation, which is defined by a longitudinal step size as detailed in Section 2.6.
Table 6 summarizes the adopted frequency grid, explicitly reporting the channel spacing and the number of WDM channels per band.
Table 6.
Frequency bounds and bandwidth of each band composing the entire transmission scenario.
2.8. Launch Power Optimization
The optical line controller (OLC) determines the operating points of each amplifier in order to optimize the GSNR of the optical line system (OLS). In particular, the optimization strategy is based on enforcing a maximized and spectrally uniform GSNR distribution within each transmission band. Accordingly, the launch power profile is selected to simultaneously maximize the average per-band GSNR while maintaining sufficient flatness both within each band and across the entire transmitted spectrum.
This optimization approach does not require additional hardware, as the optimal launch powers are achieved by adjusting the gain (or output power) and tilt settings of each optical amplifier. Consequently, the total number of optimization variables is twice the number of bands, , in the considered multi-band scenario, corresponding to the gain–tilt pair of each amplifier. The objective function to be maximized is defined as
where denotes the average GSNR of the n-th band, is the GSNR standard deviation within the n-th band, and represents the standard deviation across the set of all per-band average GSNR values.
The resulting optimization problem is solved using a stochastic heuristic method based on an evolutionary approach, specifically the covariance matrix adaptation evolution strategy (CMA-ES), as in [30].
2.9. Validation Metrics and Error Definition
In order to quantify the accuracy of the proposed approximations of and , the error profiles on both the power and the nonlinear interference (NLI) profiles have been computed according to Equations (9) and (10), respectively,
where and represent, respectively, the reference and the approximated power profile, while and represent the reference and the approximated NLI profiles.
Due to the limitations in representing error profiles that depend on both frequency and distance along the link, an aggregated metric, the Root Mean Square Error (RMSE), has also been computed to provide a single summary value of the approximation accuracy for both the power and the NLI. The implemented formulas are
where and represent the total numbers of frequency and space points along the link.
Although the RMSE does not capture all local variations of the errors across frequency and space, it offers a useful averaged measure to assess the overall quality of the power and NLI profiles across different transmission scenarios.
3. Results
To validate the results of the proposed approximations introduced in the previous sections, Equation (7) has been solved using the experimentally measured fiber attenuation and Raman gain coefficients . This provides a reference two-dimensional power profile in the frequency–distance domain, against which all the approximated models are compared. The following different transmission scenarios have been investigated considering an injected input power computed according to Section 2.8:
- L+C+S-band;
- L+C+E-band;
- U+L+C+S+E-band.
This choice aims at focusing the analysis on extended and ultra-wideband configurations, as simplified and well-established approximation models for C-band and C+L-band transmission have already been extensively studied in the literature and were introduced in Section 1. Then the reference profile has been compared with all the solutions obtained, considering the following different combinations of the approximations of and :
- Case 1: Piecewise linear approximation of , experimental .
- Case 2: Taylor expansion of , experimental .
- Case 3: Experimental , gaussian fitting of .
- Case 4: Experimental , lorentzian fitting of .
- Case 5: Piecewise linear approximation of , gaussian fitting of .
- Case 6: Piecewise linear approximation of , lorentzian fitting of .
- Case 7: Taylor expansion of , gaussian fitting of .
- Case 8: Taylor expansion of , lorentzian fitting of .
The RMSE of the power profiles has been computed and reported in Table 7.
Table 7.
RMSE of the power profiles computed in the different transmission scenarios expressed in dB.
The RMSE of the NLI profiles has also been computed and reported in Table 8.
Table 8.
RMSE of the nonlinear interference (NLI) profiles computed in the different transmission scenarios expressed in dB.
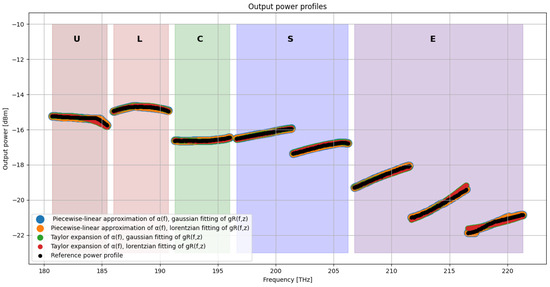
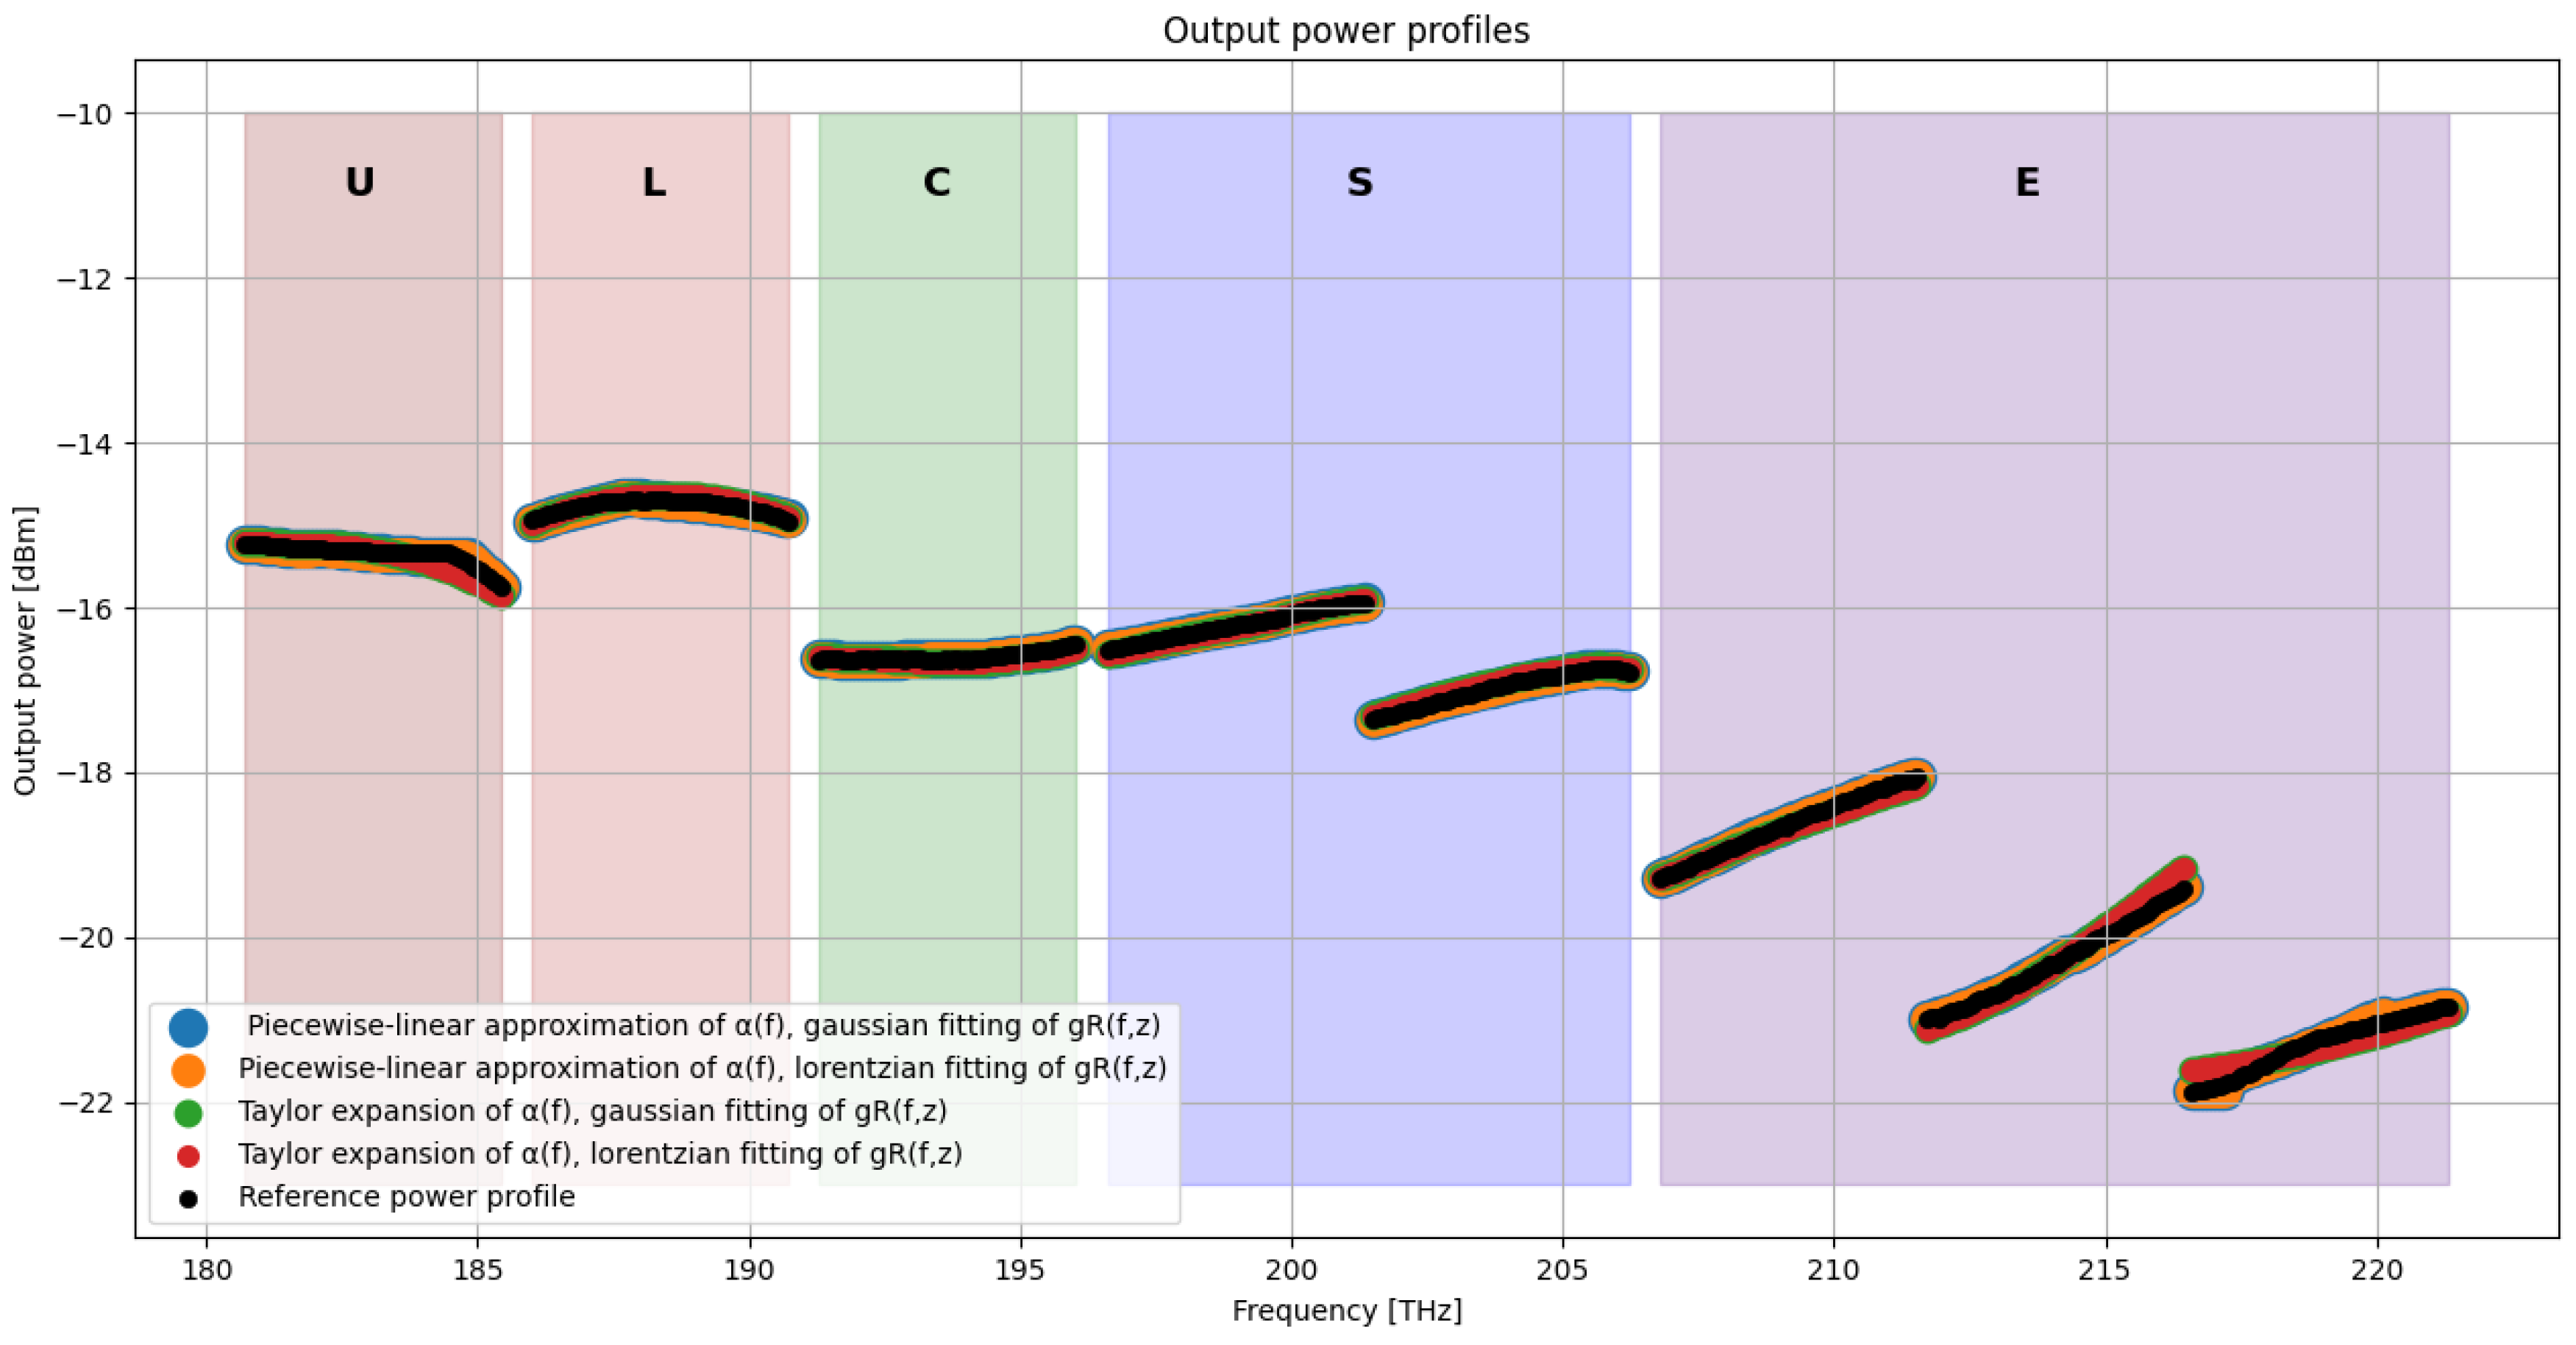
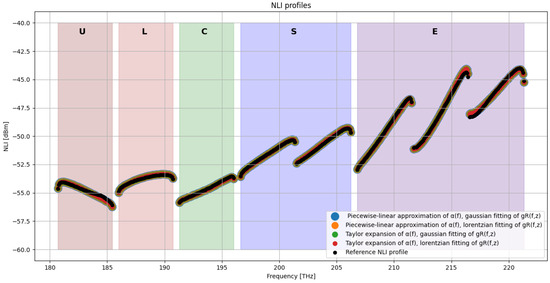
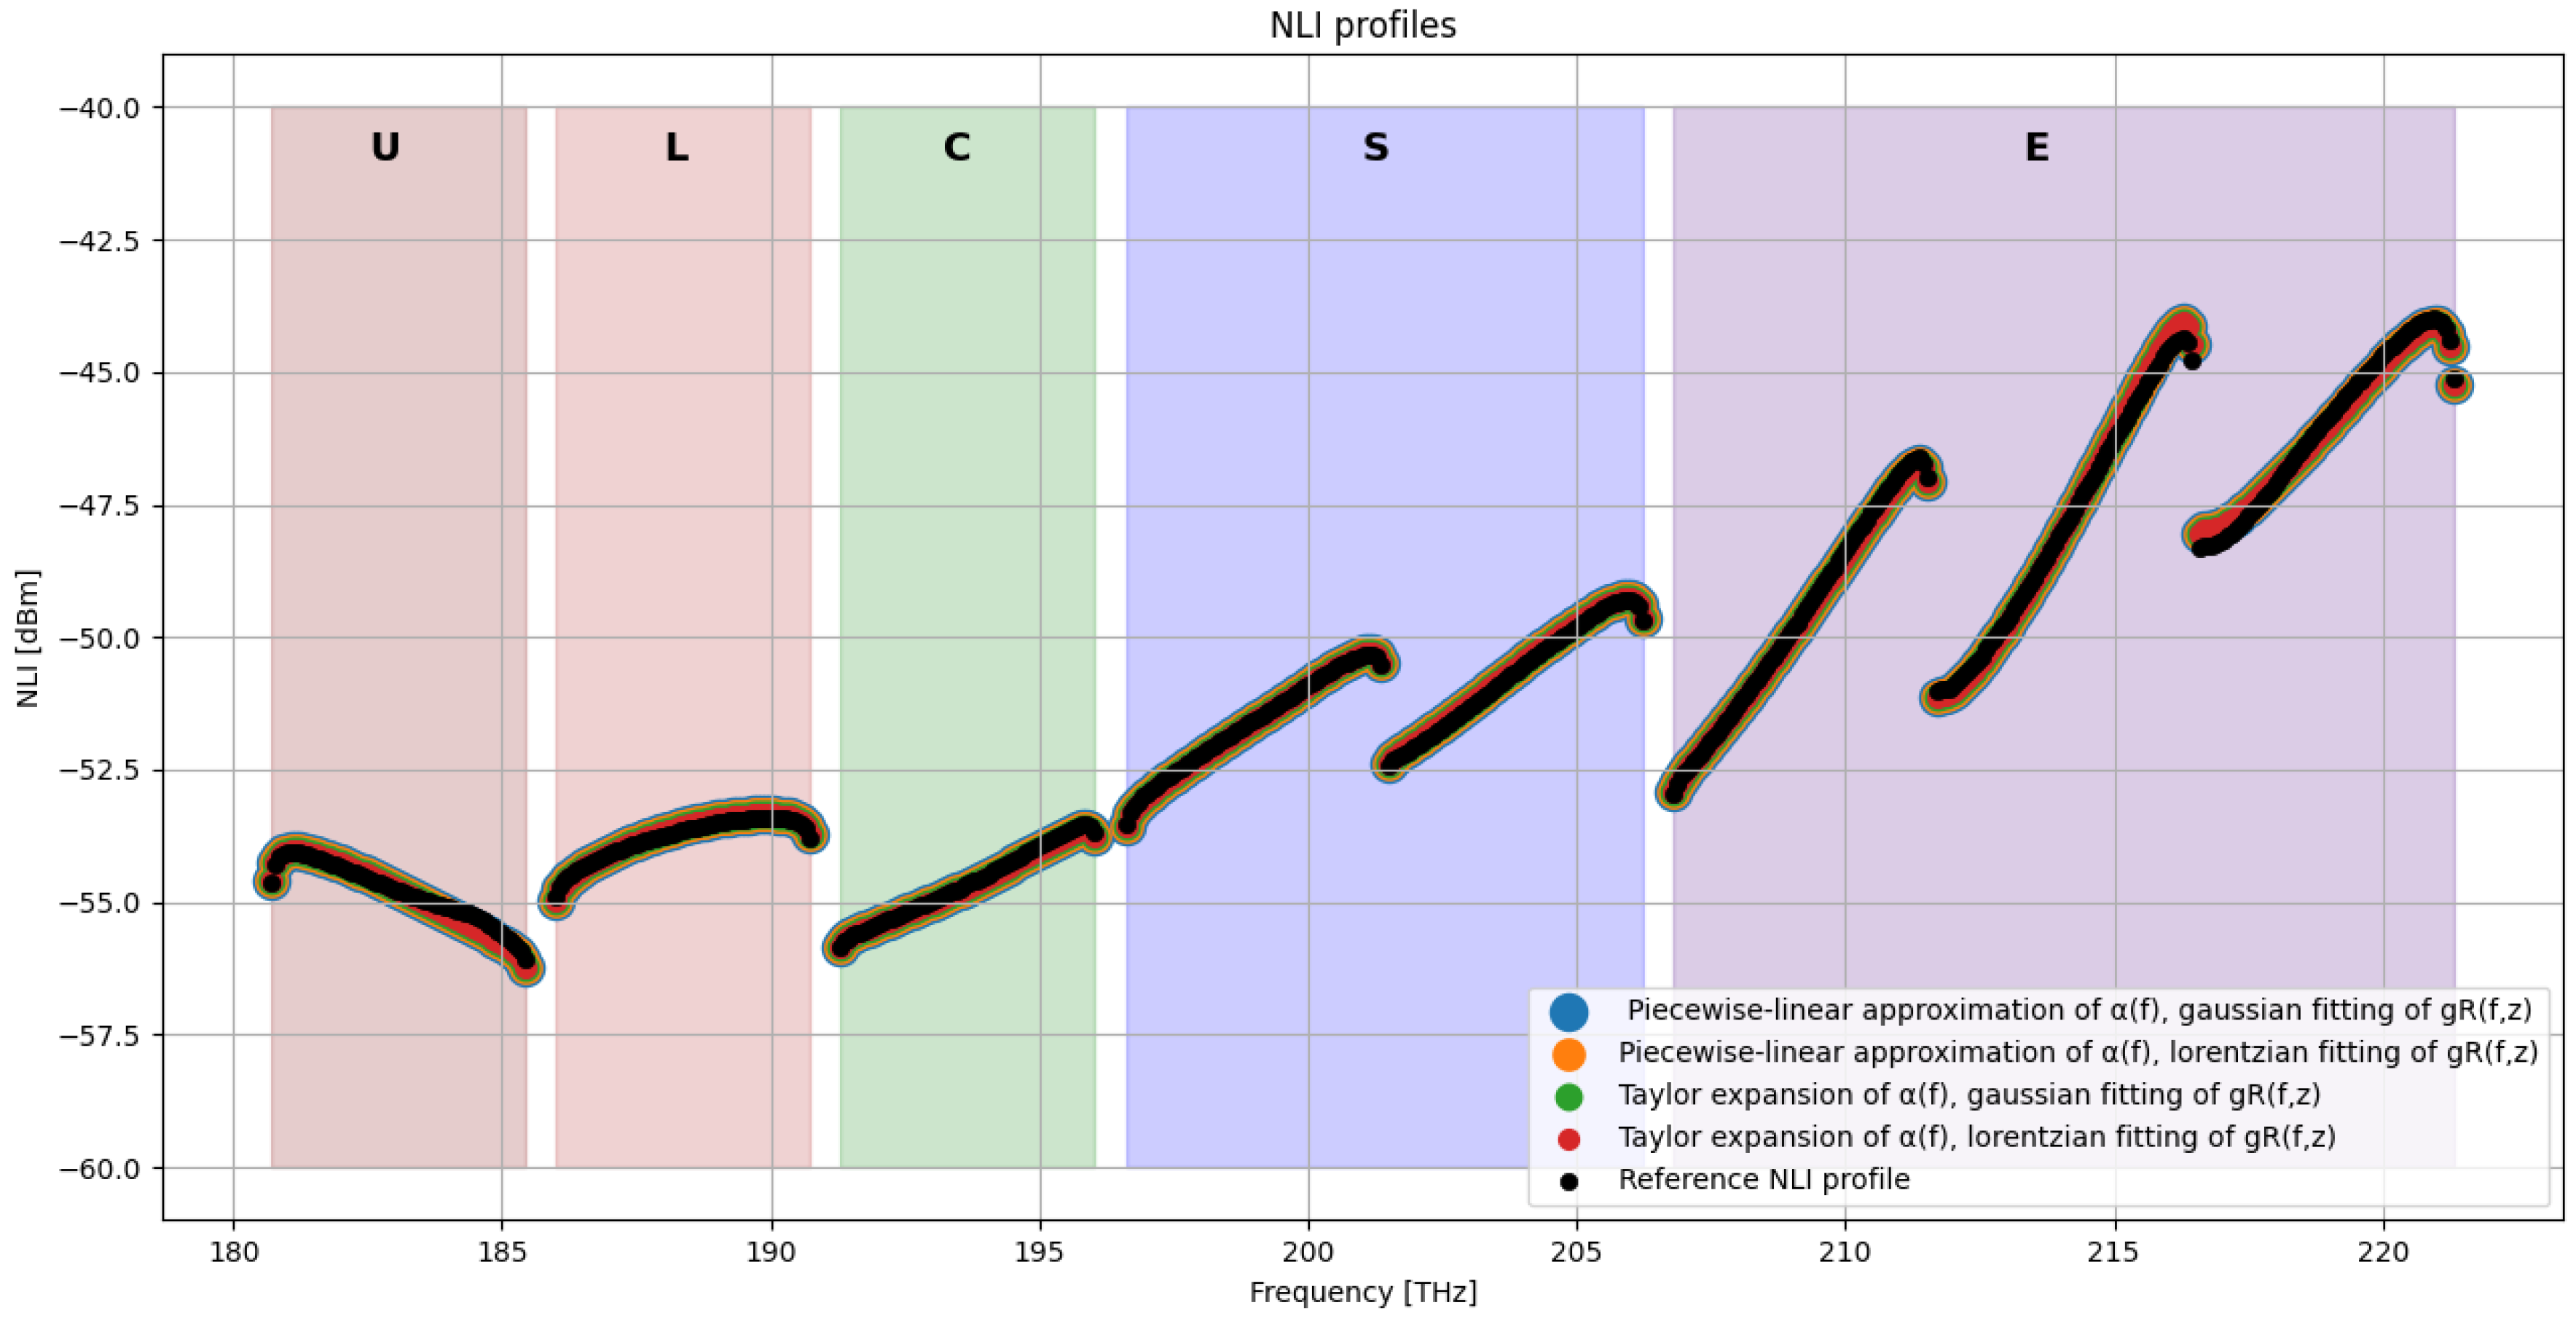
To complement the RMSE-based analysis, Figure 8 and Figure 9 illustrate, respectively, the output signal power and the frequency-dependent nonlinear interference (NLI) power at the end of the transmission system before final signal amplification for the fully approximated cases (Case 5–Case 8), which combine simplified representations of both and . These results provide a direct comparison between the most approximated models and the fully physical reference solution, highlighting how the different representations of and influence the final system-level performance.
Figure 8.
Output power [dBm] at the end of the transmission system in the U-L-C-S-E-band scenario.
Figure 9.
Output NLI [dBm] at the end of the transmission system in the U-L-C-S-E-band scenario.
In both figures, each curve corresponds to one of the approximation cases. The NLI spectra allow quantifying how inaccuracies in the modeling propagate to the nonlinear domain, while the output power profiles show the cumulative effect of Raman interactions and attenuation along the span. The visual comparison enables identifying regions of the spectrum that are more sensitive to modeling errors, and evaluating whether some approximations introduce systematic deviations or only small perturbations with respect to the reference profile.
Beyond the scalar RMSE indicators, it is instructive to observe how the approximation errors distribute over the frequency–distance plane. The following heatmaps provide a qualitative representation of the deviation from the reference solution for the fully approximated models in the U-, L-, C-, S- and E-band transmission scenarios. Although such plots do not allow for fine-grained quantitative comparison, they offer valuable insight into the spatial and spectral patterns of the modeling inaccuracies, making explicit where each approximation tends to accumulate error along the span.
The execution time of the propagation and NLI computation routines was measured for the different approximation cases under identical simulation settings, considering only the physical-layer propagation block.
The average measured runtimes expressed in seconds are reported in Table 9.
Table 9.
Simulation runtime expressed in seconds.
4. Discussion
The comparison between the approximated models and the fully physical reference solution highlights the impact of the different decomposition and fitting strategies for both and on the accuracy of the predicted power evolution and the resulting NLI generation across all transmission bandwidths.
Overall, the results indicate that the piecewise linear representation of the attenuation profile (Cases 1, 5, and 6) systematically outperforms the Taylor series-based approximation (Cases 2, 7, and 8). Quantitatively, piecewise linear fitting yields power RMSE values below dB across all scenarios, whereas Taylor-based approximations exhibit errors up to approximately dB in ultra-wideband conditions. This confirms that local linearization is more effective in capturing the frequency-dependent behavior of over ultra-wideband spectra, particularly in the presence of strong spectral curvature outside the C-band.
Regarding the Raman gain coefficient, the Lorentzian fitting strategy (Cases 4, 6, and 8) consistently achieves slightly lower RMSE values than the Gaussian fitting (Cases 3, 5, and 7). Specifically, NLI RMSE values fall in the dB range for Lorentzian fits, compared to dB for Gaussian fits. This behavior is consistent with the intrinsic asymmetry and long spectral tails of the experimentally measured Raman gain profile, which are more accurately reproduced by a Lorentzian model. In contrast, Gaussian functions decay more rapidly away from the peak, leading to an underestimation of long-range inter-channel Raman coupling and, consequently, to less accurate modeling of power transfer across wide spectral separations. This interpretation is further supported by the area-overlap analysis performed earlier, where the Lorentzian decomposition yielded a closer match to the measured gain distribution.
Among all tested configurations, Case 4, combining the experimental attenuation profile with a Lorentzian representation of , provides the highest overall accuracy for both SRS-induced power evolution and NLI estimation across all bandwidth scenarios, with RMSE values consistently in the – dB range.
When extending the transmission bandwidth from L+C+S to L+C+E and ultimately to the U+L+C+S+E scenario, a consistent trend emerges across all approximation strategies. Both power and NLI RMSE values increase, and the system becomes progressively more sensitive to the adopted modeling assumptions. This behavior reflects the increasing spectral complexity of both and and the stronger Raman coupling between widely separated channels in ultra-wideband systems.
The dominant source of modeling error is associated with the approximation of the attenuation coefficient , which directly affects the power evolution and, in turn, propagates into the NLI estimation. Approaches relying on Taylor expansion of exhibit the largest degradation in accuracy, particularly over the widest spectral spans.
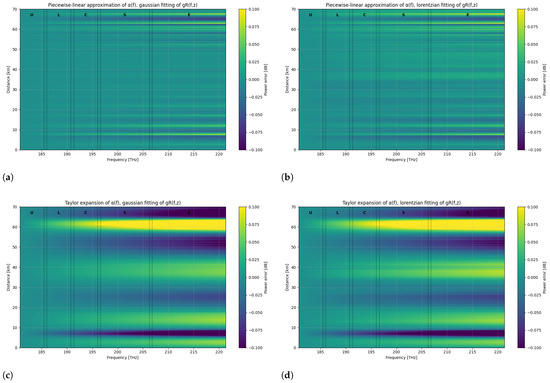
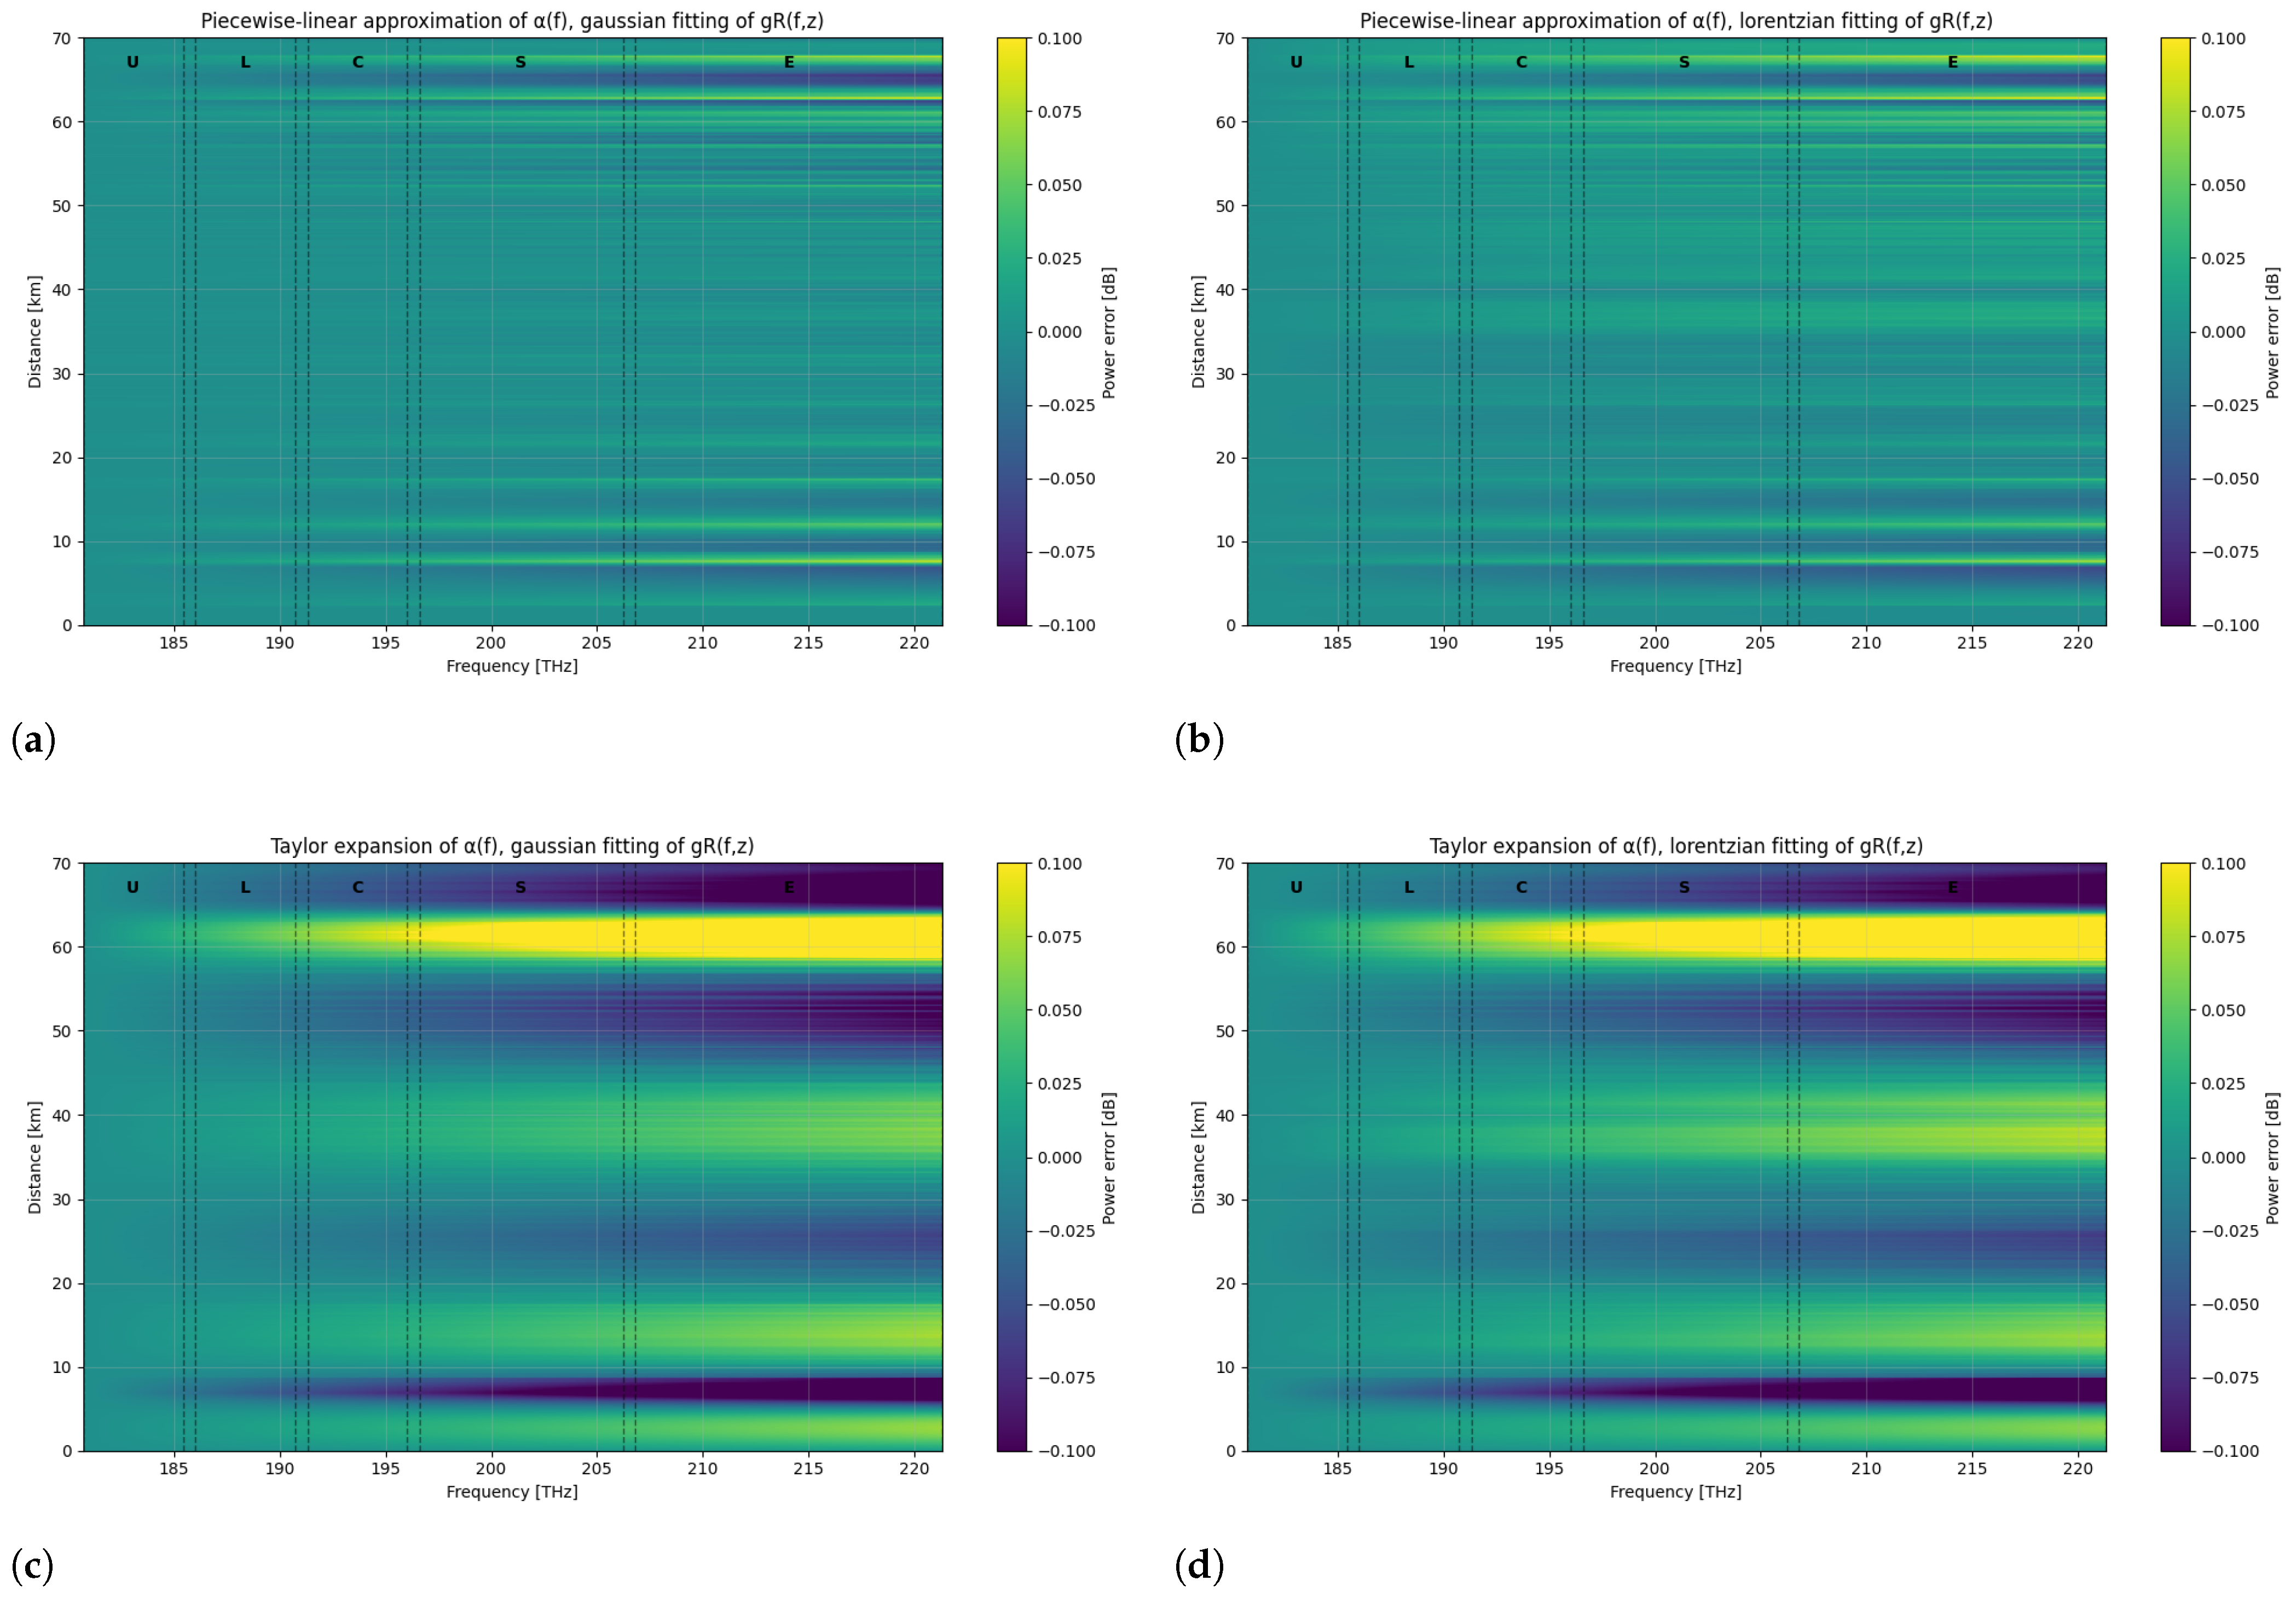
The spatial and spectral distributions of the modeling errors are further illustrated by the heatmaps in Figure 10, which confirm that the deviations remain smooth and bounded across both frequency and distance. In all cases, the absolute errors remain well below 0.1 dB, fully consistent with the RMSE values reported in Table 7 and Table 8, demonstrating that the solver retains high accuracy even under aggressive approximation schemes.
Figure 10.
Heatmaps of the power error [dB] along the line in the U–L–C–S–E-band transmission scenario for the following: (a) piecewise linear approximation of with Gaussian fitting of ; (b) piecewise linear approximation of with Lorentzian fitting of ; (c) Taylor expansion of with Gaussian fitting of ; (d) Taylor expansion of with Lorentzian fitting of .
In the cases based on piecewise linear attenuation (Figure 10a,b), the error remains uniformly distributed along the fiber span, with only mild oscillatory patterns that do not grow with distance. The deviations are primarily localized near the spectral edges (U- and E-bands), where the attenuation profile exhibits stronger curvature. However, no progressive error accumulation along z is observed, indicating that the local linear approximation of preserves the power evolution stability across the entire propagation length.
In contrast, for the Taylor series-based attenuation (Figure 10c,d), a clear spatial accumulation of error is visible. The error magnitude gradually increases with propagation distance, particularly in the outer spectral regions (S- and E-bands). This behavior can be attributed to the polynomial nature of the Taylor expansion, which introduces a systematic bias when extrapolated over a wide frequency span. Since the attenuation coefficient directly affects the exponential power decay, even small spectral inaccuracies accumulate monotonically along z, resulting in larger deviations at the end of the span.
From a spectral perspective, the largest errors consistently appear at the edges of the ultra-wideband spectrum (U- and E-bands), in regions where the attenuation curvature is strongest, and where Raman-induced power transfer is more pronounced due to larger inter-channel frequency separations.
This confirms that the dominant source of modeling inaccuracy is associated with the representation of , rather than with the Raman gain fitting, as already suggested by the RMSE results in Table 6 and Table 7.
Furthermore, the error patterns remain smooth and structured, with no localized instability or divergence along the span. This indicates that the numerical SRS solver remains stable even when simplified analytical models are used, and that the observed deviations are systematic modeling effects rather than numerical artifacts.
Both the NLI and the output power profiles exhibit an excellent overlap across all approximation models. NLI generation is primarily governed by the spectral structure of the transmitted signal and by the power evolution along the link, rather than by the fine details of the Raman and attenuation approximations. This confirms that the proposed attenuation and Raman gain approximations preserve the physical power evolution along the link and introduce only minor deviations in the computed nonlinear interference. Overall, the numerical results demonstrate the robustness of the proposed approximations and their suitability for wideband optical fiber modeling.
Beyond the individual accuracy assessment of each approximation, the comparison of Cases 1–8 enables a broader evaluation of the trade-off between modeling accuracy and structural complexity.
In this context, accuracy is quantified through the RMSE on both power and NLI profiles, while complexity is evaluated in terms of parametric dimensionality and analytical structure of the adopted approximations.
The results show three distinct regimes:
- High-accuracy configurations (e.g., Case 4), combining experimental attenuation with Lorentzian Raman fitting, achieve RMSE values in the – dB range, at the cost of maintaining part of the experimentally derived attenuation profile.
- Fully approximated configurations with piecewise linear attenuation (Cases 5–6) provide slightly higher RMSE values (around dB) while maintaining a fully analytical representation of both and . These configurations represent the most balanced trade-off between structural simplicity and physical accuracy.
- Taylor-based attenuation models (Cases 2, 7, 8) exhibit the highest RMSE values, particularly in ultra-wideband scenarios, indicating that polynomial expansions are less robust when applied over extended spectral ranges.
Therefore, if maximum accuracy is required, Case 4 represents the optimal choice. If instead a fully analytical and structurally simple model is desired—for example, to enable future semi-analytical formulations—Case 6 (piecewise linear + Lorentzian ) provides the best compromise between accuracy and complexity.
Finally, the computational time analysis (Table 9) confirms that the different attenuation and Raman representations do not significantly affect the overall execution time in the present implementation.
This behavior is explained by the architecture of the solver. Both the experimental profiles and the fitted approximations are pre-computed offline and stored in JSON format. During the simulation, the solver reads the corresponding parameter values from structured data files in the same manner for all configurations. Consequently, the cost of profile evaluation is comparable across cases.
The dominant computational burden instead arises from the explicit integration of the coupled SRS equations. Since this term largely outweighs the cost of reading or evaluating and , replacing experimental data with analytical approximations does not yield noticeable runtime differences.
5. Conclusions and Future Work
In this work, a systematic evaluation of simplified analytical models for the frequency-dependent attenuation and Raman gain coefficients in ultra-wideband optical transmission systems has been presented. Different combinations of approximations have been tested and compared against a fully physical reference model to quantify their accuracy and impact on both channel power evolution and nonlinear interference estimation.
The study validates all the proposed approaches, showing that the most accurate configurations achieve RMSE values below 0.03 dB across all bandwidth scenarios, and down to the dB range when combining piecewise linear fitting of with Lorentzian decomposition of . This combination consistently provides the best performance in both power and NLI estimation, particularly when extending transmission from the C+L-bands to the full U-to-E spectrum.
Importantly, the error levels are consistent with those reported in previous C-band and C+L-band approximation studies, where typical deviations lie within the to dB range [21]. This confirms that extending the modeling framework to ultra-wideband transmission does not compromise accuracy.
Notably, this work introduces a systematic assessment of phenomenological fitting strategies for the fiber attenuation profile in ultra-wideband, SRS-aware transmission modeling, which represents a novel contribution beyond existing Raman-focused approximation studies.
Overall, the presented framework provides practical guidelines for selecting appropriate attenuation and Raman gain approximations based on the targeted operational bandwidth and accuracy requirements. While the current implementation does not yet achieve a direct reduction in computational time, since the numerical solver directly reads the fitted profiles, a significant decrease in computational complexity is expected in future work. In particular, embedding these approximations directly into the governing differential equations may enable closed-form or semi-analytical solutions, paving the way for faster system-level simulations, real-time optimization, and scalable network planning in ultra-wideband optical infrastructures.
Author Contributions
Conceptualization, G.M.R. and V.C.; methodology, G.M.R. and V.C.; software, G.M.R.; validation, G.M.R.; formal analysis, G.M.R.; investigation, G.M.R.; resources, V.C.; data curation, G.M.R.; writing—original draft preparation, G.M.R.; writing—review and editing, G.M.R. and V.C.; visualization, G.M.R.; supervision, V.C.; project administration, V.C.; funding acquisition, V.C. All authors have read and agreed to the published version of the manuscript.
Funding
This research was funded by the European Union’s Horizon Europe research and innovation programme under Grant Agreement No. 101189545 (Project SENSEI).
Data Availability Statement
Data and software used to obatin the presented results are openly available at https://github.com/Telecominfraproject/oopt-gnpy (accessed on 5 February 2026).
Conflicts of Interest
The authors declare no conflicts of interest.
Abbreviations
The following abbreviations are used in this manuscript:
| EDFA | Erbium-Doped Fiber Amplifier |
| GN | Gaussian Noise |
| GVD | Group Velocity Dispersion |
| ISRS | Inter-Channel Stimulated Raman Scattering |
| MAE | Maximum Absolute Error |
| NLI | Nonlinear Interference |
| NF | Noise Figure |
| ODE | Ordinary Differential Equations |
| OLC | Optical Line Controller |
| OLS | Optical Line System |
| PSD | Power Spectral Density |
| QoT | Quality of Transmission |
| RMSE | Root Mean Square Error |
| SRS | Stimulated Raman Scattering |
| SSMF | Standard Single-Mode Fiber |
| WDM | Wavelength Division Multiplexing |
References
- Available online: https://www.kgpco.com/userfiles/nokia_global_network_traffic_report_en.pdf (accessed on 5 February 2026).
- Al-Falahy, N.; Alani, O.Y. Technologies for 5G networks: Challenges and opportunities. It Prof. 2017, 19, 12–20. [Google Scholar] [CrossRef] [Scilit]
- Lopez, V.; Zhu, B.; Moniz, D.; Costa, N.; Pedro, J.; Xu, X.; Kumpera, A.; Dardis, L.; Rahn, J.; Sanders, S. Optimized design and challenges for C&L band optical line systems. J. Light. Technol. 2020, 38, 1080–1091. [Google Scholar] [CrossRef] [Scilit]
- Ferrari, A.; Napoli, A.; Fischer, J.K.; Costa, N.; D’Amico, A.; Pedro, J.; Forysiak, W.; Pincemin, E.; Lord, A.; Stavdas, A.; et al. Assessment on the achievable throughput of multi-band ITU-T G. 652. D fiber transmission systems. J. Light. Technol. 2020, 38, 4279–4291. [Google Scholar]
- de Moura, U.C.; Timmers, M.; Neto, L.A.; da Silva, E.P.; Piels, M.; Hu, H.; Van Den Borne, D.; Koonen, A.M.J. A Multi-Band Programmable Gain Raman Amplifier for S+C+L-Band Transmission Systems. arXiv 2020, arXiv:2006.12280. [Google Scholar]
- Cantono, M.; Schmogrow, R.; Newland, M.; Vusirikala, V.; Hofmeister, T. Opportunities and challenges of C+ L transmission systems. J. Light. Technol. 2020, 38, 1050–1060. [Google Scholar]
- Rapp, L.; Eiselt, M. Optical amplifiers for multi–band optical transmission systems. J. Light. Technol. 2021, 40, 1579–1589. [Google Scholar] [CrossRef] [Scilit]
- Semrau, D.; Killey, R.I.; Bayvel, P. The Gaussian Noise Model in the Presence of Inter-Channel Stimulated Raman Scattering. J. Light. Technol. 2018, 36, 3046–3055. [Google Scholar] [CrossRef] [Scilit]
- Dar, R.; Feder, M.; Mecozzi, A.; Shtaif, M. Accumulation of nonlinear interference noise in fiber-optic systems. Opt. Express 2014, 22, 14199–14211. [Google Scholar] [CrossRef] [Scilit]
- Khare, P.; Costa, N.; Ruiz, M.; Napoli, A.; Comellas, J.; Pedro, J.; Velasco, L. Simulation and modelling of C+L+S multiband optical transmission for the OCATA time domain digital twin. Sensors 2025, 25, 1948. [Google Scholar] [CrossRef] [Scilit]
- Stolen, R.H.; Gordon, J.P.; Tomlinson, W.; Haus, H.A. Raman response function of silica-core fibers. J. Opt. Soc. Am. B 1989, 6, 1159–1166. [Google Scholar] [CrossRef] [Scilit]
- D’Amico, A.; London, E.; Virgillito, E.; Napoli, A.; Curri, V. Inter-band GSNR degradations and leading impairments in C+L band 400G transmission. In Proceedings of the 2021 International Conference on Optical Network Design and Modeling (ONDM); IEEE: New York, NY, USA, 2021; pp. 1–3. [Google Scholar]
- Stolen, R.H.; Ippen, E.P. Raman gain in glass optical waveguides. Appl. Phys. Lett. 1973, 22, 276–278. [Google Scholar] [CrossRef] [Scilit]
- Agrawal, G.P. Nonlinear Fiber Optics, 6th ed.; Academic Press: Amsterdam, The Netherlands, 2019. [Google Scholar]
- Nespola, A.; Straullu, S.; Carena, A.; Bosco, G.; Cigliutti, R.; Curri, V.; Poggiolini, P.; Hirano, M.; Yamamoto, Y.; Sasaki, T.; et al. GN-model validation over seven fiber types in uncompensated PM-16QAM Nyquist-WDM links. IEEE Photonics Technol. Lett. 2013, 26, 206–209. [Google Scholar] [CrossRef] [Scilit]
- Dar, R.; Feder, M.; Mecozzi, A.; Shtaif, M. Inter-channel nonlinear interference noise in WDM systems: Modeling and mitigation. J. Light. Technol. 2015, 33, 1044–1053. [Google Scholar] [CrossRef] [Scilit]
- Roberts, I.; Kahn, J.M.; Harley, J.; Boertjes, D. Channel power optimization of WDM systems following Gaussian noise nonlinearity model in presence of stimulated Raman scattering. J. Light. Technol. 2017, 35, 5237–5249. [Google Scholar] [CrossRef] [Scilit]
- Chraplyvy, A.R. Limitations on lightwave communications imposed by optical-fiber nonlinearities. J. Light. Technol. 2002, 8, 1548–1557. [Google Scholar] [CrossRef] [Scilit]
- Souza, A.; Costa, N.; Pedro, J.; Pires, J. Comparison of fast quality of transmission estimation methods for C+L+S optical systems. J. Opt. Commun. Netw. 2023, 15, F1–F12. [Google Scholar] [CrossRef] [Scilit]
- Tariq, S.; Palais, J.C. A computer model of non-dispersion-limited stimulated Raman scattering in optical fiber multiple-channel communications. J. Light. Technol. 2002, 11, 1914–1924. [Google Scholar] [CrossRef] [Scilit]
- Zischler, L.A.; Lasagni, C.; Serena, P.; Bononi, A.; Sciullo, G.D.; Shaji, D.A.; Mecozzi, A.; Antonelli, C. Closed-Form Expression for the Power Profile in Wideband Systems With Inter-Channel Stimulated Raman Scattering. J. Light. Technol. 2026, 44, 115–124. [Google Scholar] [CrossRef] [Scilit]
- Hollenbeck, D.; Cantrell, C.D. Multiple-vibrational-mode model for fiber-optic Raman gain spectrum and response function. J. Opt. Soc. Am. B 2002, 19, 2886–2892. [Google Scholar] [CrossRef] [Scilit]
- Marcuse, D. Theory of Dielectric Optical Waveguides, 2nd ed.; Academic Press: Boston, MA, USA, 1991. [Google Scholar]
- Kao, K.C.; Hockham, G.A. Dielectric-fibre surface waveguides for optical frequencies. Proc. Inst. Electr. Eng. 1966, 113, 1151–1158. [Google Scholar] [CrossRef] [Scilit]
- Keck, D.B.; Maurer, R.D.; Schultz, P.C. On the ultimate lower limit of attenuation in glass optical waveguides. Appl. Phys. Lett. 1970, 17, 423–425. [Google Scholar] [CrossRef] [Scilit]
- Walker, S. Rapid modeling and estimation of total spectral loss in optical fibers. J. Light. Technol. 1986, 4, 1125–1131. [Google Scholar] [CrossRef] [Scilit]
- Curri, V. GNPy model of the physical layer for open and disaggregated optical networking. J. Opt. Commun. Netw. 2022, 14, C92–C104. [Google Scholar] [CrossRef] [Scilit]
- Available online: https://gnpy.readthedocs.io/en/master/ (accessed on 5 February 2026).
- Available online: https://github.com/Telecominfraproject/oopt-gnpy (accessed on 5 February 2026).
- D’Amico, A.; Borraccini, G.; Curri, V. Introducing the perturbative solution of the inter-channel stimulated Raman scattering in single-mode optical fibers. arXiv 2023, arXiv:2304.11756. [Google Scholar]
- Bromage, J. Raman amplification for fiber communications systems. J. Light. Technol. 2004, 22, 79. [Google Scholar] [CrossRef] [Scilit]

Disclaimer/Publisher’s Note: The statements, opinions and data contained in all publications are solely those of the individual author(s) and contributor(s) and not of MDPI and/or the editor(s). MDPI and/or the editor(s) disclaim responsibility for any injury to people or property resulting from any ideas, methods, instructions or products referred to in the content. |
© 2026 by the authors. Licensee MDPI, Basel, Switzerland. This article is an open access article distributed under the terms and conditions of the Creative Commons Attribution (CC BY) license.