


Abstract
Synergistic utilization of industrial solid wastes can improve mechanical and durability properties while reducing CO2 emissions and waste generation from the cement and mining industries. In the first phase, a quaternary clinker-free binder comprising ground granulated blast furnace slag, red mud, steel slag, and phosphogypsum was developed using a D-optimal mixture design approach. Quadratic response surface models were established to predict 7- and 28-day compressive strengths and optimize binder proportions. The optimal mixture, containing 50 wt.% ground granulated blast furnace slag and 20 wt.% each of red mud and steel slag, achieved compressive strengths of 3.45 and 4.47 MPa at 7 and 28 days, respectively. In the second phase, the optimized binder was combined with river sand (Group I) and coal gangue powder (Group II) as fine aggregates to produce backfill materials. Fresh, mechanical, durability, and microstructural properties were evaluated. At 28 days, Groups I and II achieved compressive strengths of 16.1 and 4.14 MPa, respectively. Group I showed the best overall performance balance at 82 % slurry concentration and a B/A ratio of 1:8. Even at ultimate B/A ratios (1:10 and 1:12), 28-day strengths of 5.30 and 4.12 MPa, respectively, satisfied CLSM strength requirements. Group II exhibited the best overall balance at 74 % slurry concentration and a B/A ratio of 1:6 achieving C3–C4 strength levels and S2 settling grades; however, none of the Group II mixtures met the setting time criterion, requiring further optimization.
1. Introduction
The construction industry is a major consumer of natural resources and a significant contributor to environmental degradation. Cement, being the most widely utilized material in the world, plays a significant role in environmental degradation as it relies heavily on the consumption of raw materials and energy-intensive processes, making it responsible for about 5 %–8 % of all man-made CO2 emissions [1,2]. On the other hand, the simultaneous rise in population, urbanization, and economic development and enhanced community living standards have significantly accelerated the generation of industrial solid waste globally, leading to substantial environmental concerns [3]. Some of the major industrial solid waste types which are available in huge amount include red mud (RM), ground granulated blast furnace slag (GGBFS), steel slag (SS), and phosphogypsum (PG) resulting from various industrial processes [4]. Worldwide, 380 million tons of GGBFS, 180–270 million tons of SS, 100–280 million tons of PG, and roughly 120 million tons of RM are generated annually [5,6]. Stockpiles of these wastes are typically stored in dams or indiscriminately disposed of, either on land or in the adjacent sea, resulting in occupation of terrestrial land and contamination of marine ecosystems leading to soil and groundwater pollution [7]. During alumina refining, approximately 1.5 t–2.5 t of RM is generated per tonne of alumina produced. GGBFS is obtained from iron production, whereas SS is generated during subsequent steelmaking operations [8]. PG is produced as a by-product of the wet-process conversion of phosphate rock into phosphoric acid, generating approximately 4 t–6 t of PG per tonne of phosphoric acid [9].
Synergy theory is currently a prominent area of research in both recycling of solid waste and the formulation of cementitious materials [10]. Primarily, synergy arises from the complementary interactions of chemical elements found in various waste materials [11]. Previous studies have reported that combining solid wastes rich in Ca-, Si-, Al-, Na-, and S-bearing oxides can produce complementary chemical interactions that promote the formation of cementitious products [12]. Based on these considerations, GGBFS, RM, SS, and PG were selected for binder preparation because of their potentially complementary chemical and mineralogical characteristics. RM contains alkaline constituents that may provide an alkaline environment for promoting GGBFS dissolution, while GGBFS serves as the principal calcium-, silicon-, and aluminum-bearing precursor. The mineralogical composition of SS resembles that of Portland cement, suggesting potential hydraulic activity [13]. However, its relatively low early-age hydration activity, partly associated with the slowly reacting C2S phase, may limit its initial contribution to strength development [14]. Previous studies have suggested that alkaline species from RM and sulfate ions from PG may promote SS reactivity through alkaline and sulfate activation [15]. RM may also stimulate the reaction of silicon- and aluminum-bearing species and promote calcium silicate hydration production [16]. Furthermore, PG, primarily composed of calcium sulfate dihydrate (CaSO4·2H2O), provides sulfate that may facilitate ettringite formation through reactions with available calcium- and aluminum-bearing species [17]. However, most of the solid-waste-based clinker-free cementitious composites exhibit insufficient mechanical strength for structural concrete applications [18]. Low-strength applications, such as mine backfill and controlled low-strength material (CLSM) applications, may therefore provide more suitable uses because their required compressive strengths are generally lower, typically within approximately 1.0–8.3 MPa [19]. In addition, replacing conventional cement can be economically relevant for backfill production, in which cement may represent a substantial proportion of the total material cost (typically 60 %–75 %) [19].
Backfill materials consist of either uncemented or cemented geomaterials such as tailings, sands, or waste rocks [20]. They are widely employed in various mining sectors to enhance ore body recovery and ensure the stability of mining voids [21]. Mine backfilling generally involves preparing a slurry by mixing tailings, cementitious binders, and water at the surface, followed by transportation to underground voids through gravity or pumping systems [22]. Upon hardening, these materials reduce surface subsidence, ensure a safe working environment, and convert waste into a valuable resource. In addition to underground mine filling, controlled low-strength material (CLSM) represents another important application of flowable backfill materials. CLSM is a self-compacting cementitious material commonly used as an alternative to conventional compacted soil for applications such as trench backfilling, conduit bedding, pavement bases and structural filling [23]. Unlike underground mine-filling materials, CLSM is designed to flow into and fill spaces without requiring mechanical compaction. Therefore, its suitability is primarily governed by flowability and controlled compressive strength. According to ACI 229R guidelines, CLSM generally requires a minimum flow of 200 mm and a 28-day compressive strength not exceeding 8.3 MPa. Depending on the intended application, CLSM with compressive strengths below 1.5 MPa is generally considered excavatable, whereas strengths between 1.5 and 8.3 MPa are associated with non-excavatable applications [24,25]. Despite their different engineering functions, the use of ordinary Portland cement (OPC)-based binders in both underground mine-filling materials and CLSM can contribute significantly to material costs and environmental impacts. In particular, cemented paste backfill (CPB) can account for as much as 20 % of total mining expenses, with approximately 75 % of its cost attributed to cement procurement [20].
Considerable research has been undertaken on the formulation of low-clinker and clinker-free binders [26,27,28], derived from industrial solid wastes [29,30,31,32,33,34]. However, most previous studies investigated these materials in binary [35,36] or ternary systems [37,38,39,40], while studies combining PG, GGBFS, RM and SS in a single binder system remain comparatively limited. Furthermore, these industrial by-products have been explored in different binder formulations, including low-clinker binders incorporating Portland cement [41], and geopolymer systems [12]. A separate study also reported the development of a clinker-free backfill material using GGBFS, phosphogypsum, and carbide slag [38]. Building on these approaches, the present study introduces a distinct binder system by incorporating PG instead of FGD gypsum, introducing SS into the PG-RM-GGBFS system, and eliminating both Portland cement and external alkaline activation. Therefore, the current study addresses this research gap by developing a four-component clinker-free binder and evaluating its potential for backfill applications. Additionally, the four-component binder was selected to increase their combined utilization while drawing on their complementary chemical functions as calcium–aluminosilicate, alkaline, hydraulic, and sulfate-bearing constituents, respectively [42,43]. Such substitution may contribute to lower cement-related CO2 emissions, reduced material costs, and improved solid-waste management. The binder composition was investigated using D-optimal mixture design. The 7- and 28-day compressive strengths were used as the optimization responses. The strength-optimized binder was subsequently evaluated in two backfill systems (Group I and Group II). Fresh-state performance was assessed through flowability and setting time, while compressive strength, settling ratio, shrinkage, water resistance, and porosity were examined to evaluate mechanical performance, dimensional stability, and durability-related behavior. XRD, TG-DTG, and SEM analyses were also conducted to provide qualitative insight into hydration products and microstructural development. The results demonstrate that the developed four-component solid-waste binder has potential for further development as a clinker-free backfill material within the investigated design space.
2. Materials and Methods
2.1. Raw Materials
PG, GGBFS, RM and SS were purchased from Tianze Environmental Protection Technology Co., Ltd. in Zhengzhou, Henan Province, China, and were used as received without additional washing, drying, grinding, sieving, or chemical treatment. The materials were stored in sealed containers under laboratory conditions until use. Table 1 and Figure 1 and Figure 2 present the oxide composition, mineral components, and particle size gradation of the binder constituents, respectively. Similarly, the particle size gradation of fine aggregates river sand (RS) and coal gangue power (CGP) are shown in Figure 3. Based on the oxide composition of the binder constituents from Table 1 the alkalinity coefficient of GGBFS powder was determined as: M0 = (CaO % + MgO %)/(SiO2 % + Al2O3 %) = 1.18 > 1, implies the alkaline nature of the slag. Mc = (Al2O3 %)/(SiO2 %) = 0.51 > 0.25, implies the slag as highly reactive while, K = (CaO + MgO + Al2O3)/(SiO2 + MnO + TiO2) = 2.23 > 1.23 implies the superior nature of the slag which typically exhibit good hydraulic properties. The reactive nature of the SS can be evaluated based on the basicity index = CaO %/SiO2 = 0.32 < 1.8, making the SS with low basicity. Figure 1 shows the XRD patterns for the binder constituents which consists mainly calcite, cancrinite, gibbsite, hematite, katotite, muscovite, gypsum, and quartz. The particle size gradation of the binder constituents indicates median particle diameters (D50) of 0.38 µm for RM, 110.7 µm for SS, 8.6 µm for GGBFS, and 14.7 µm for PG. The fine aggregates, RS and CGP, exhibit D50 values of 677 µm and 9.78 µm, respectively, as shown in Figure 3.
Table 1.
Oxide composition of binder constituents (LOI: loss on ignition).
Figure 1.
XRD patterns of the binder components: PG, GGBFS, RM and SS.
Figure 2.
Particle size gradation of binder components: (a) volume fraction; (b) cumulative volume.
Figure 3.
Particle size gradation of fine aggregate: (a) volume fraction; (b) cumulative volume.
2.2. Specimen Preparation and Testing Procedure
2.2.1. Clinker-Free Binder
To evaluate the various relationships between the components of independent variables and dependent variable responses, design of experiments (DOE) plays a significant role [44,45,46]. Mixture design, a subset of DOE, is a mathematical and statistical approach used to analyze the relationships between a set of independent variables and one or more dependent responses [47]. In contrast to conventional experimental design methods, mixture design constrains the input variables so that their total equals unity. Additionally, the response obtained in such designs is not influenced by the overall quantity of the mixture, but is governed solely by the relative proportions of its constituent [48]. Furthermore, the D-optimal mixture design is a widely used iterative approach that minimizes the covariance matrix of the estimated model parameters for a specified formulation [49]. This approach facilitates the identification of the optimal mixture composition, and thus, provides an efficient means of optimizing the synthesis process [50,51]. Design Expert 13.0 is used in this study to process data for experimental design, model development and optimization for CFB constituents. As presented in Table 2, all component proportions are expressed as mass percentages relative to the total binder mass. PG was fixed at 10 wt.%, while GGBFS, RM, and SS were varied within the ranges of 40–60 wt.%, 10–20 wt.%, and 20–40 wt.%, respectively. These constraints were established based on preliminary single-factor experiments to identify composition ranges that provided adequate workability and compressive strength. The preliminary results indicated that increasing RM and SS contents beyond the selected limits adversely affected compressive strength; therefore, the adopted ranges were considered suitable for the mixture design. PG was fixed at 10 wt.% of the binder, equivalent to 2 wt.% of total dry solids (binder and fine aggregate), to reduce the number of variables in the mixture design. This selection was also supported by previous studies reporting that moderate PG contents promote sulfate-related hydration and strength development, whereas excessive PG may adversely affect volume stability [41]. The compressive strengths (Y) were selected as the response variables at 7 and 28 days.
Table 2.
Component constraints and response used in the D-optimal mixture design.
Table 3 shows mixture proportions of the CFB obtained using D-optimal mixture design. The binder-to-aggregate (B/A) mass ratio was maintained at 1:4, where the total binder consisted of PG, GGBFS, RM, and SS, and coal gangue powder (CGP) was used as the fine aggregate. The water-to-binder (W/B) mass ratio was fixed at 0.35, with the mixing water calculated relative to the total binder mass. Accordingly, the specimens used for compressive-strength testing consisted of the four-component binder, CGP, and water at the specified proportions. The binder constituents were thoroughly mixed with CGP and water to prepare the fresh slurry, which was subsequently cast into 2-inch cubic molds. After 48 h, the specimens were demolded and transferred to a controlled curing chamber maintained at 20 °C ± 2 °C and 95 % ± 2 % relative humidity for further curing. Compressive strength was measured at 7 and 28 days in accordance with the standard test method for compressive strength of hydraulic cement mortars [52]. For each experimental run (each independently prepared batch), three cubic specimens were tested at each curing age. The mean and standard deviation (SD) were calculated separately for each batch based on the three specimen measurements. Additionally, 95 % confidence intervals (CIs) were calculated separately for each batch using (n = 3, df = 2), representing within-batch specimen variability. The corresponding confidence intervals are provided in Appendix A. A quadratic model based on standard polynomial expressions of varying orders was employed to represent the mixture variables [53].
Table 3.
Training dataset and mixture proportions of the CFB.
The experimental program consisted of 16 runs, including 6 design points for model development, 5 runs for assessing lack of fit, and 5 replicate runs as shown in Table 3. The replicate runs corresponded to five nominally identical mixture compositions (CFB3/CFB10, CFB4/CFB16, CFB5/CFB7, CFB6/CFB11, and CFB12/CFB13), which were prepared as separate batches to evaluate batch-to-batch reproducibility. In addition to the 16-run D-optimal experimental program, six additional verification experiments were conducted using the same nominal mixture compositions as selected runs from the training dataset (CFB3, CFB4, CFB8, CFB11, CFB12, and CFB14). These mixtures were independently prepared and tested, and their experimental results were excluded from model development and regression analysis. The verification experiments were used exclusively to evaluate the predictive performance of the developed models by comparing the predicted and experimentally measured compressive strengths.
2.2.2. CFB Based Backfill Material
- Mix design
In the second phase of this study, the CFB obtained in the first phase was utilized as main binding agent along with two different types of fine aggregates, RS and CGP. Two different types of material, namely Group I and Group II were formulated as shown in Table 4.
Table 4.
Mixing ratios for Group I and Group II materials.
Group I consisted of the optimized CFB as the binder and river sand (RS) as the fine aggregate, whereas Group II comprised the same CFB with coal gangue powder (CGP) as the fine aggregate. Two separate investigations were conducted to evaluate the effects of slurry concentration and binder-to-aggregate (B/A) ratio. In the first investigation, the B/A ratio was maintained at 1:4 by mass, while the slurry concentration was varied. Accordingly, slurry concentrations of 78 %, 80 %, 82 %, and 84 % were investigated for Group I, whereas values of 70 %, 72 %, 74 %, and 76 % were examined for Group II. Different slurry-concentration ranges were adopted because the two fine aggregates exhibited different water requirements. In the second investigation, the influence of the B/A ratio was evaluated by varying it from 1:6 to 1:12 (1:6, 1:8, 1:10, and 1:12), while maintaining the slurry concentration at 84 % for Group I and 76 % for Group II.
- 2.
- Fresh Properties
Setting times of the freshly prepared backfill material samples were determined using the Manual Vicat needle apparatus as per ASTM standard specification [54,55]. Periodic penetration tests using a Vicat apparatus with a 1 mm needle applied to the prepared paste were performed. The initial setting time was defined as the interval between the first contact of cement and water and the moment when the needle penetration reached 25 mm. The final setting time was taken as the duration from initial contact until the needle no longer showed any visible penetration on the paste surface.
The fluidity of the backfill material was assessed using the slump flow method as per ASTM D6103/D6103M [56]. The test procedure consists of filling the round mold with backfill material and using a steel tamping rod to compact the material by performing two rounds of ramming, approximately 15 times each. After the ramming process was completed, the surface of the material was leveled. Following a 10 s interval, the mold was lifted vertically at a constant rate, and the spread diameter was measured in three directions, and the arithmetic mean of these measurements was reported as the flowability value.
- 3.
- Durability Properties
The durability of the backfill material was assessed in terms of water resistance, porosity, and settling ratio using established analytical methods [38]. The specimens used for the water resistance test were the same as those prepared for evaluating the compressive strength of the backfill material. After 28 days of standard curing, the specimens were oven-dried until no significant change in weight was observed. The water resistance characteristics were quantified using the softening coefficient (k), determined based on Equation (1), where f represents the compressive strength in the cured state and F is the compressive strength in the dry state.
The porosity of the backfill material was determined using the volume ratio of the free water within the sample. After curing under water for 28 days, the initial mass of the sample (m1) was measured. Following a drying period in an oven until no further mass change occurred, the final mass (m2) was recorded. represents the density of water and Vs is the volume of the samples. Porosity (α) was then expressed using Equation (2).
The settling ratio was defined as the ratio of the reduced volume to the original volume after the material settled due to its weight or pressure. A freshly mixed backfill slurry was placed in a 500 mL beaker, and its initial mass m1 was recorded. The sample was then maintained under standard curing conditions for 28 days, after which its final mass (m2) was recorded. The density of water at 25 °C (ρ1 = 0.99705 g/cm3) was used to calculate the equivalent volume reduction. The settling ratio (β) was then expressed using Equation (3).
- 4.
- Micro Structural Properties
Micro-structural analysis was carried out in Zhong ke bai ce testing lab at Zhengzhou Henan, China. The ARLAdvant X Inttelipower TM3600, Thermo fisher, Waltham, MA, USA equipment for XRF analysis was used for the determination of elemental and oxide composition of the binding materials. Samples representing the highest compressive strength were selected from each (Group I and Group II) for XRD, TGA-DTG and SEM analysis. In order to determine the resulting hydration products of the material. Instrument model Bruker D8 ADVANCE Family (Bruker AXS GmbH, Karlsruhe, Germany) with a maximum power of 3 kW, Cu target with scanning ranges from 5 to 120 theta, energy resolution of 3800 eV and an accuracy with a minimum step size of 0.0001 degrees was utilized for XRD analysis. To obtain insights into the composition and the thermal behavior of the materials, TGA simultaneously integrated with DTG analysis was carried out for both groups of materials. The temperature range was set from 0 to 900 degree °C, and the testing environment was set as inert nitrogen. To better understand surface morphology, microstructure, and hydration products, SEM provides much higher magnification allowing for the observation of surface features at the nanoscale. For both groups of materials, the SEM analysis was carried out on the same sample composition as that used for XRD analysis.
3. Results and Discussions
3.1. Clinker-Free Binder Optimization
The Results and discussion section begin with the development and evaluation of quadratic Scheffé models for predicting the 7- and 28-day compressive strengths of the CFB mixtures. The training strength data were fitted to polynomial models, and the resulting predictions were assessed using verification experiments. The statistical significance and adequacy of the models were evaluated using ANOVA and relevant model-performance indicators. The selected models were then used to interpret the effects of the mixture–component proportions on compressive strength at both curing ages. The general form of the quadratic Scheffé model is presented in Equation (4).
where E(Y) is the predicted response, q is the number of variable mixture components, and Xi and Xj represent the mixture variables used in the model. The coefficients βi and βij are the linear and binary interaction coefficients, respectively. Since PG was fixed at 10 %, the three variable components (GGBFS, RM, and SS) were represented by the pseudocomponents B, C, and D, respectively.
3.1.1. Model Development
The compressive-strength results obtained from the D-optimal mixture design and additional verification experiments are presented in Table 5a and b, respectively. From Table 5a, it can be observed that the CFB4 composition achieved the highest compressive strength, reaching 3.45 MPa and 4.47 MPa at 7 and 28 days, respectively. This was followed by CFB13, which exhibited slightly lower values of 3.44 MPa and 4.45 MPa while CFB6 resulted in the lowest compressive strength at both 7 and 28 days of curing age. The differences between the highest and lowest compressive strengths were 1.50 MPa at 7 days and 1.95 MPa at 28 days. To distinguish the apparent variability due to the small difference in strength between the competing mixtures, confidence interval analysis was carried out showing considerable overlap among confidence intervals for several higher-strength mixtures, indicating that their small differences in mean strength cannot be confidently distinguished from within-batch specimen variability. For details, see Appendix A.
Table 5.
(a) Training data and (b) verification results for the 7- and 28-day compressive-strength models.
The training data presented were subjected to ANOVA analysis to evaluate the statistical significance and adequacy of the models, and regression Equations (5) and (6) were developed to predict CS 7 and CS 28, respectively.
Since PG was fixed at 10 %, the remaining binder components (GGBFS, RM, and SS) were transformed into pseudocomponents based on their specified lower limits. The available proportion for transformation was 20 %, calculated from the total binder percentage minus the sum of the lower component limits. The transformation and inverse transformation relationships are given in Equations (7)–(9).
where XGGBFS, XRM and XSS represent the actual component proportions expressed in wt.%, of GGBFS, RM, and SS, respectively, while B, C, and D represent their corresponding pseudocomponent values. A worked prediction example of the transformation equations is given in Appendix B.
The developed models were evaluated by comparing the experimental and predicted compressive strengths of the training and verification datasets against the perfect prediction lines (1:1), as shown in Figure 4. The high coefficients of determination (R2 ≥ 0.93 for CS 7 and R2 ≥ 0.96 for CS 28), together with the low RMSE and SEP values, indicate good agreement between the experimental and predicted results, confirming the satisfactory predictive performance of the developed models. Furthermore, the low RMSE and SEP values presented in Table 5b demonstrate the satisfactory predictive performance of the models when evaluated against the verification experiments. Overall, these results indicate good agreement between the predicted and experimental compressive strengths, supporting the adequacy and predictive capability of the developed models [45].
Figure 4.
Comparison between experimental and model-predicted values. (a) CS 7 and (b) CS 28.
3.1.2. Analysis of Variance (ANOVA)
Variance and diagnostic analyses were conducted to assess the significance and predictive accuracy of the models and various models’ terms. The model terms include p-value, lack of fit p-value, adjusted R2 and predicted R2 as shown in Table 6.
Table 6.
Fitted model values for 7- and 28-day compressive strengths of the CFB.
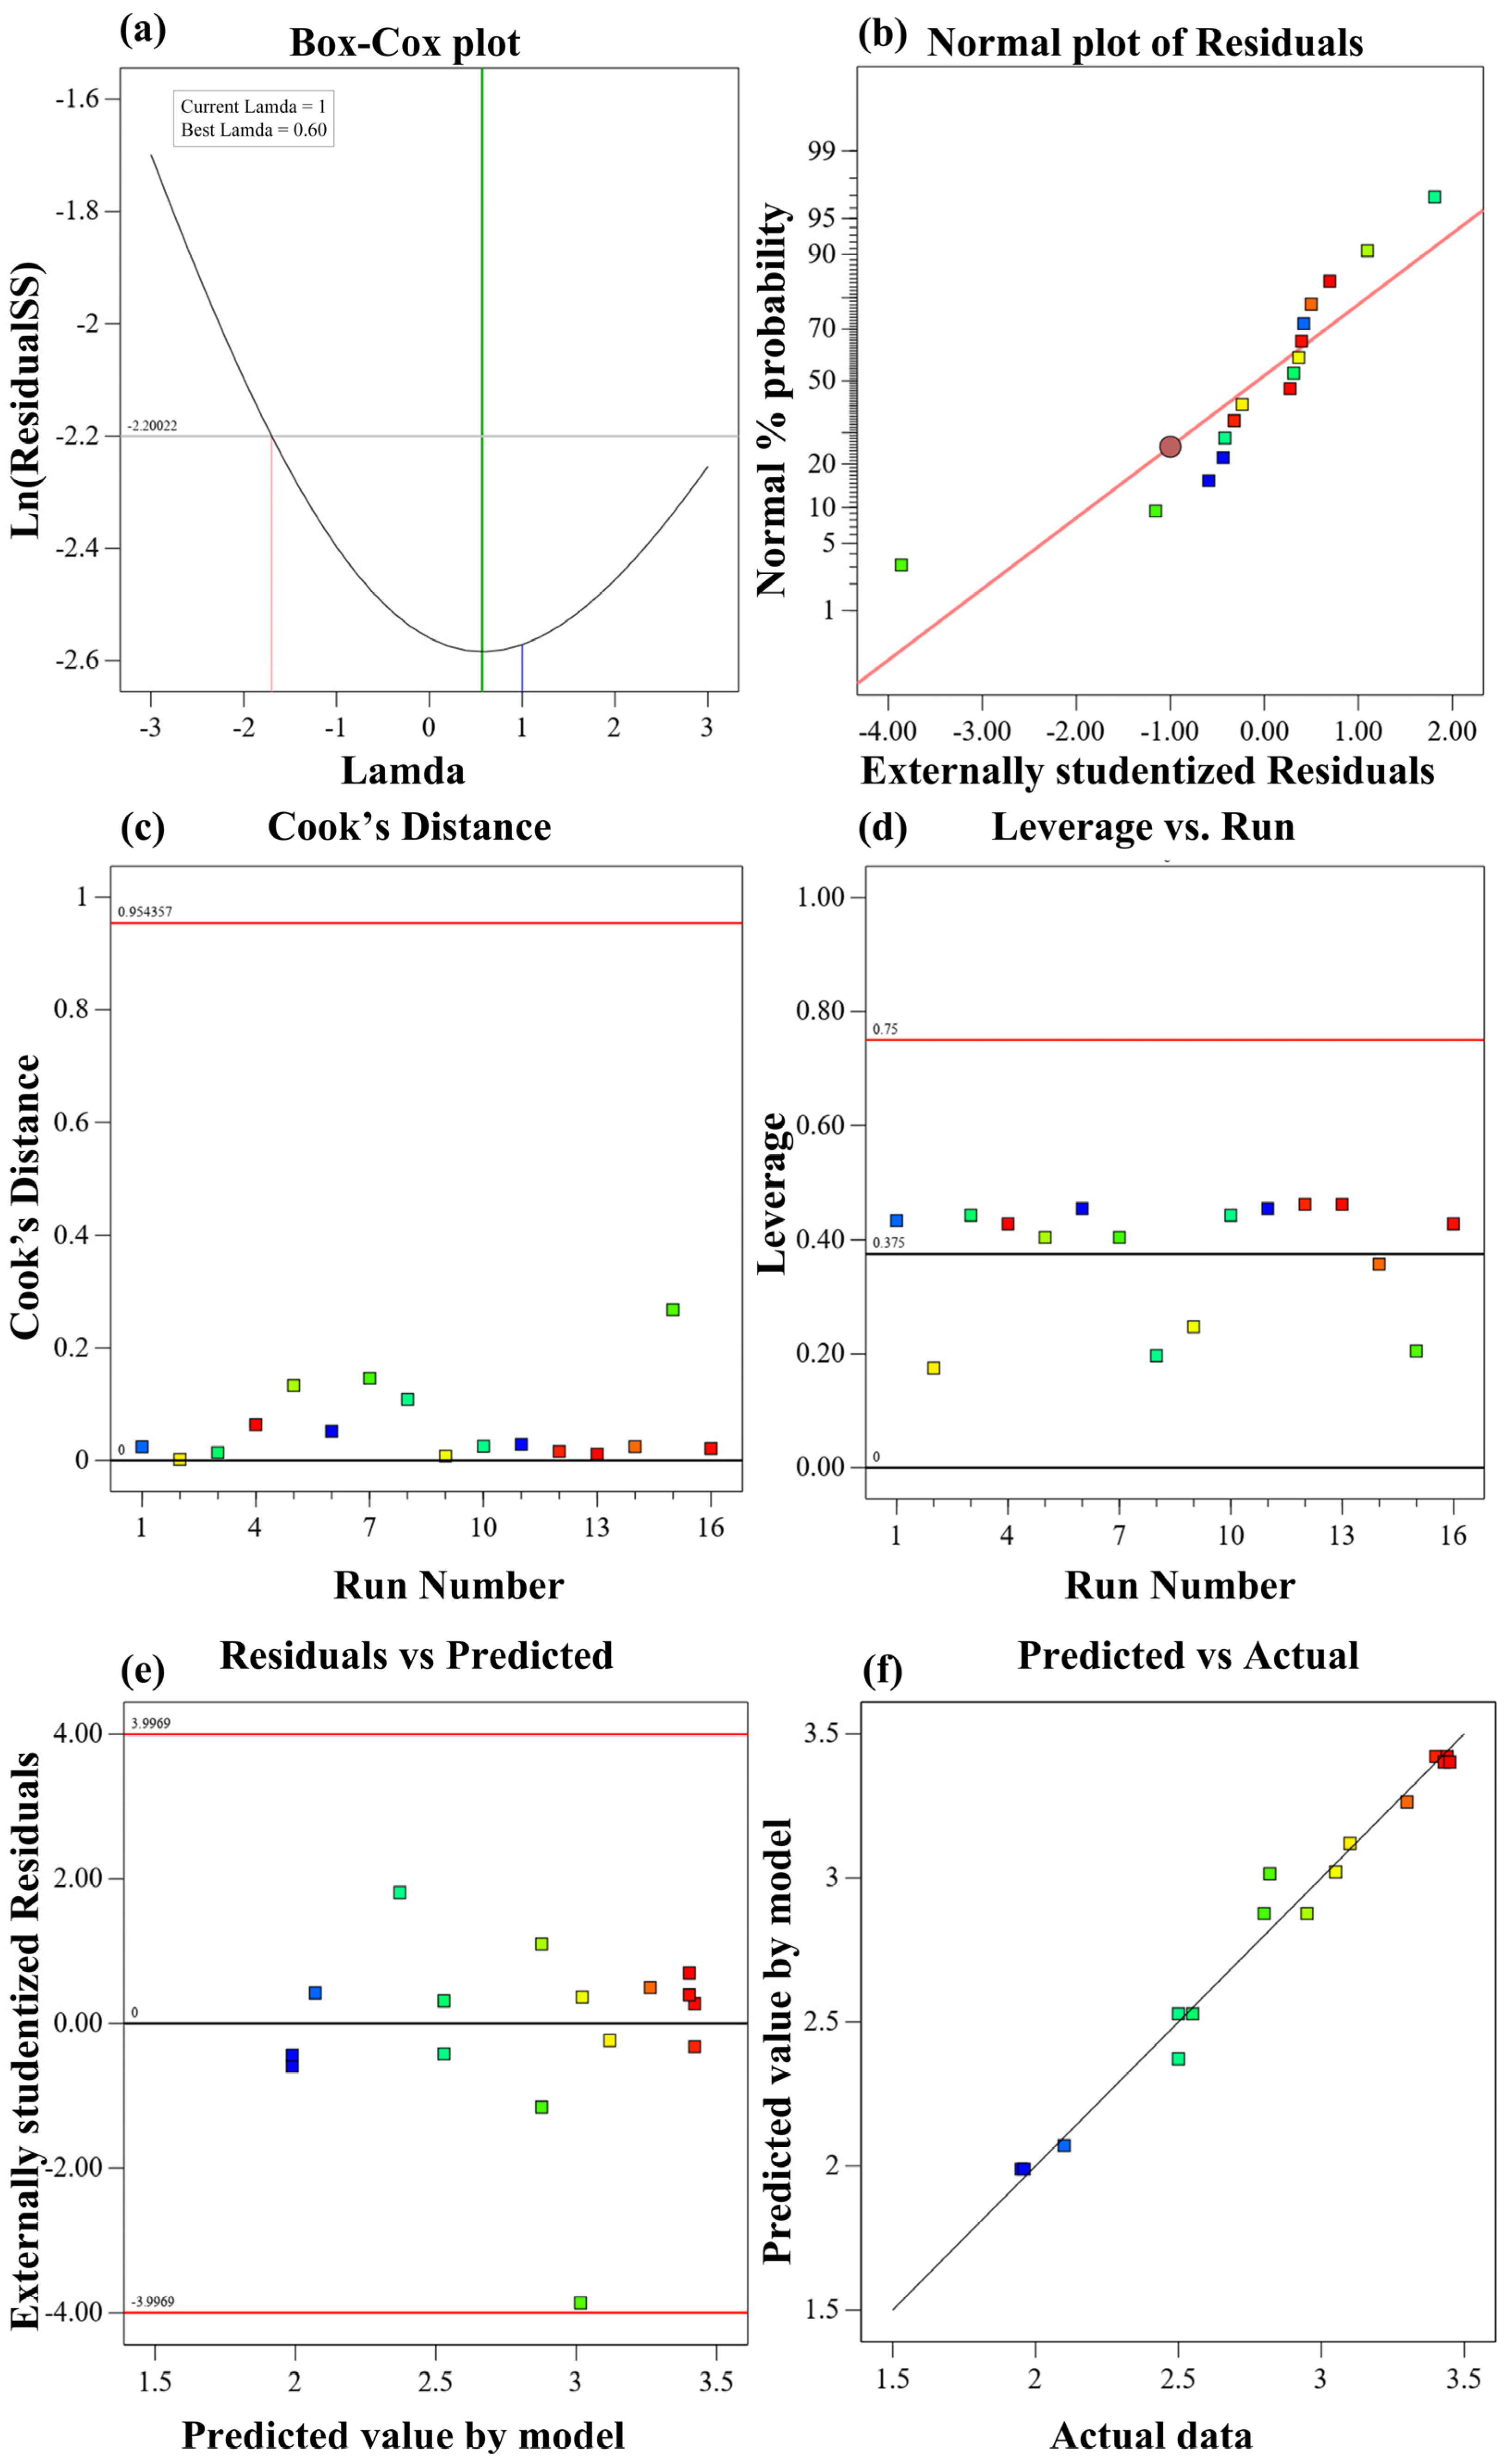
The significance of a model is generally assessed based on high F-values, higher adjusted and predicted R2 values and p-values lower than 0.05 [57]. Based on the findings reported in Table 6, the linear models were statistically significant for both the 7- and 28-day CSs (p < 0.0001). However, adding the quadratic terms produced a statistically significant improvement for the 7-day (p < 0.0150) and 28-day (p < 0.0162) responses. The quadratic models also increased the adjusted R2 values from 0.94 to 0.97 and from 0.94 to 0.97 for the 7- and 28-day strengths, respectively. Additionally, the lack of fit was also non-significant for both 7- and 28-day CSs. In contrast, the additional special cubic and cubic terms were not statistically significant (p > 0.05) and did not improve the predicted R2. Therefore, the quadratic models were selected as the best compromise between model complexity and predictive performance as indicated by the close agreement between the adjusted and predicted R2 values. Although, the lack of fit p-value for CS 7 (0.0588) and CS 28 (0.612)) were not significant but closer to the lower limit of 0.05, an additional comprehensive residual diagnostic analyses, were performed and are presented in (Appendix D and Appendix E), providing further evidence supporting the adequacy models.
3.1.3. ANOVA Results for Clinker-Free Binder
ANOVA results for CS 7 and CS 28 are illustrated in Table 7. The interaction terms (BC, BD, and CD) were all statistically significant (p < 0.05), indicating that the interactions among the CFB constituents significantly influenced the compressive strength. The coefficients of determination (R2) and adjusted R2 values were 0.98 and 0.97 for the 7-day CS and 0.97 and 0.96 for the 28-day CS, respectively, demonstrating that the models explained most of the variability in the experimental data. The differences between the R2 and adjusted R2 values were less than 0.2, indicating good model agreement.
Table 7.
ANOVA results for CS 7 and CS 28 of the CFB.
The coefficients of variation were 3.09 % and 3.23 % for the 7- and 28-day CSs, respectively, confirming good experimental precision and reliability [45]. In addition, the Adeq Precision values of 25.75 and 25.38 exceeded the minimum recommended value of 4, indicating an adequate signal-to-noise ratio. The statistical indicators demonstrate that the quadratic models possess satisfactory predictive capability and were therefore considered suitable for prediction and optimization within the investigated design space [58].
3.1.4. Effects of Mixture Constituents on CFB Compressive Strength
Contour plots along with their corresponding 3D response surfaces derived from the D-optimal mixture design for CS 7 and CS 28 are presented in Figure 5a,b and Figure 5c,d, respectively. The red points in the response-surface plots indicate the locations of the experimental runs, while the color gradient represents the predicted compressive-strength levels. The blue region corresponds to the lowest strength, followed by the green and orange regions, whereas the red region represents the highest strength. For both the 7- and 28-day responses, compressive strength generally increased as the GGBFS mass increased from 40 to 60 %, indicating that GGBFS was the principal strength-contributing component within the investigated design space. This trend may be attributed to the chemical composition and predominantly amorphous structure of GGBFS. Its relatively high contents of CaO, SiO2, and Al2O3 provide reactive calcium-aluminosilicate species that may contribute to the formation of strength-bearing hydration products. RM may support the reaction environment through its Na2O and K2O contents, which can promote the dissolution of reactive phases in GGBFS. In addition, PG acts as a sulfate-bearing constituent because of its high SO3 content and gypsum-dominated mineralogy. The sulfate supplied by PG may interact with available calcium- and aluminum-bearing species and contribute to the formation of sulfate-containing hydration products [17,59].
Figure 5.
(a): 2D-contours. (b): 3D-response surface for 7 days CS. (c): 2D-contours. (d): 3D-response surface for the 28-day CS of CFB.
The response surfaces showed that RM and SS affected compressive strength differently. Within the investigated range, increasing RM toward its upper mass limit of 20 % was generally more favorable for strength development than increasing SS toward its upper limit of 40 %. This difference may be associated with the alkaline and aluminum-bearing contribution of RM, which may enhance the reaction of GGBFS. Previous studies have reported that RM commonly exhibits a relatively low SiO2/Al2O3 ratio typically below 2, indicating a lower proportion of silica relative to alumina [60], although the excessive replacement of GGBFS with RM may reduce the availability of reactive silica required for the formation of strength-bearing calcium-silicate and calcium-aluminosilicate hydrate products [61].
Moreover, RM should not be considered completely inert because its alkaline constituents may support precursor dissolution within the binder system. In contrast, increasing the SS fraction produced a less favorable strength response because it reduced the relative proportions of the more reactive GGBFS and RM components. This compositional effect is also reflected in the comparison between CFB4 and CFB6. CFB4, containing 10 % PG, 50 % GGBFS, 20 % RM, and 20 % SS, achieved the highest compressive strengths of 3.45 and 4.47 MPa at 7 and 28 days, respectively. In contrast, CFB6, containing 10 % PG, 40 % GGBFS, 10 % RM, and 40 % SS, exhibited the lowest strengths of 1.95 and 2.52 MPa, respectively. Furthermore, the low basicity index of SS 0.32, (derived from Table 1) indicates that its contribution to the alkaline reaction environment was likely limited. Previous studies have reported that steel slag may contain hydraulic phases such as C2S and C3S; however, their hydration is generally slower and depends on mineralogical composition [62]. Nevertheless, its contribution to the overall binder performance should therefore be considered in terms of its combined interaction with the other components rather than as an independently established strength-enhancing constituent. Therefore, the lower strength observed at higher SS contents may be attributed to dilution of the more reactive GGBFS fraction, the low basicity of SS, and the slower reaction of its crystalline phases. Considering these composition-dependent effects, the optimized mixture represents the most desirable binder composition within the constraints investigated in this study. Accordingly, the developed models and predicted optimum should be considered applicable within the investigated composition ranges, and their extension beyond these limits requires further experimental validation.
3.1.5. Mixture Optimization
The optimization criteria were established based on the response surface analysis and the intended objective of developing a clinker-free binder with favorable mechanical performance and increased industrial waste utilization. The response surface results (see Figure 5) indicated that increasing SS content generally reduced the predicted compressive strength within the investigated design space. Accordingly, SS was assigned the goal of minimization, whereas RM was assigned the goal of maximization because increasing its proportion toward the investigated upper limit was generally favorable for strength development and promoted greater waste utilization. GGBFS was maintained within its investigated range (40 %–60 %), while the compressive strengths at 7 and 28 days were both set to be maximized to account for early- and later-age strength development as shown in Table 8. Additionally, all five optimization criteria were assigned an equal importance level of 3, indicating that no individual criterion was given preferential importance in the desirability-based optimization. Thus, the optimization sought a balance among the selected compositional and mechanical objectives within the investigated design constraints. Optimization results produced an optimal binder composition of 10 wt.% PG, 50 wt.% GGBFS, 20 wt.% RM, and 20 wt.% SS. The predicted 7- and 28-day CSs of the optimized binder were 3.40 and 4.41 MPa, respectively.
Table 8.
Criteria for CFB optimization.
To further distinguish the overall optimized formulation from the formulation providing the highest predicted compressive strength, an additional numerical optimization was performed by considering only the 7- and 28-day compressive strengths as maximization objectives while retaining the original component constraints. As presented in Table 9, the strength-only optimization yielded a binder composition of 10 % PG, 60 % GGBFS, 10 % RM, and 20 % SS, with predicted compressive strengths of 3.42 and 4.43 MPa at 7 and 28 days, respectively. Compared with the original multi-objective optimum (10 % PG, 50 % GGBFS, 20 % RM, and 20 % SS), the strength-only formulation exhibited marginally higher predicted strengths, with differences of less than 1 % at both curing ages. However, the original multi-objective formulation incorporated twice the RM content while maintaining comparable predicted compressive strength. This comparison demonstrates that the selected optimization objectives influenced the resulting binder composition and that the original formulation provided a favorable balance between mechanical performance and industrial waste utilization.
Table 9.
Comparison of multi-objective and strength-only optimization results.
The parameter optimization was further investigated in the multi-objective optimization by utilizing the desirability function, which combines all objectives and converts them into a single optimization function [63]. This can be written mathematically using Equation (10) according to [63,64].
where “D” is the overall desirability function, “di” represents the desirability value of each individual response from d1 to dn and n denotes the number of responses being optimized. Since the equation is based on the multiplication of responses, the overall desirability becomes zero if any individual response has a desirability value of zero. The desirability value increases as the factors and responses approach the target criteria listed in Table 8. Figure 6a–c shows the optimization results for CS 7 and CS 28 along with the desirability plot.
Figure 6.
(a): Desirability plot (b): CS 7 and (c): CS 28 after optimization of CFB.
The desirability plot indicates the optimal region, where all factors and responses meet the defined criteria according to Table 8. Under equal importance (q = 3), a maximum desirability of approximately 0.984 was achieved with an optimum blend comprising 10 wt.% PG, 50 wt.% GGBFS, 20 wt.% RM, and 20 wt.% SS as shown in Table 10. Additionally, to assess the sensitivity of the optimum to desirability, six additional analyses were performed by varying the importance of RM, SS, and compressive strength individually from 3 to 1 and 5. The optimum remained unchanged across all scenarios, yielding 10 wt.% PG, 50 wt.% GGBFS, 20 wt.% RM, and 20 wt.% SS, with predicted 7- and 28-day strengths of 3.40 and 4.40 MPa, respectively. Desirability values ranged from 0.980 to 0.993 (Appendix C), indicating robustness to the tested importance variations. However, the optimum remains conditional on the fixed PG content (10 wt.%) and investigated composition ranges.
Table 10.
Optimal mix proportion of the clinker-free binder constituents.
3.2. CFB-Based Backfill Material
3.2.1. Fluidity
Mine backfill operations relies heavily on the transportability of fresh backfill. Poor flowability of the backfill material not only hampers pumping efficiency but also increases the risk of pipeline blockage [65]. Fluidity results for Group I and Group II are illustrated in Figure 7.
Figure 7.
Effect of slurry concentration and B/A ratio on the flow of Group I and Group II materials.
The fluidity of the backfill material showed a decreasing trend with increasing slurry concentration for both material groups. For Group I, fluidity decreased from 226 mm at a slurry concentration of 78 % to 171 mm at 84 %, corresponding to a reduction of 24.34 %. Similar reduction trend in fluidity has been observed in Group II. For example, fluidity decreased from 233 mm at slurry concentration of 70 % to 146 mm at concentration of 76 %, corresponding to a reduction of 37.34 %. This trend may be attributed to the increased solids concentration and reduced water availability for particle lubrication, which restrict particle movement. In addition, increased binder content relative to aggregate can enhance particle bonding and mixture cohesion, further reducing fluidity [66].
In contrast, as the B/A ratio decreased from 1/6 to 1/12, the fluidity increased. For Group I, fluidity increased from 188 mm to 232 mm, representing an increase of 23.40 %, while for Group II, it increased from 153 mm to 221 mm, showing an increase of 44.44 %. At a higher B/A ratio, such as 1/6, the higher volume of binder content with respect to aggregate produces a more cohesive and less flowable mixture. In contrast, at a lower B/A ratio, such as 1/12, the lower volume of binder content with respect to aggregate decrease cohesion between the binder and aggregate particles, resulting in increased flowability [67].
Different flowability criteria were applied to the two material groups because they were intended for different applications. Group I material were developed as potential controlled low-strength materials (CLSM), for which a minimum flowability of 200 mm was adopted based on ACI 229R [68]. Group II mixtures were developed as potential mine-filling materials, for which a flowability range of 150 mm–250 mm was adopted as the laboratory criterion for evaluating potential pumpability [69]. Within the investigated conditions, all Group I mixtures met the adopted criterion except those with a slurry concentration of 84 % (171 mm) and a B/A ratio of 1:6 (188 mm). Similarly, all Group II mixtures met the adopted criterion except the mixture with a slurry concentration of 76 % (146 mm). These results provide an initial indication of placement-related performance; however, actual pumping performance and field applicability require further verification.
3.2.2. Setting Time
During the process of backfilling, either excessively rapid or delayed setting can adversely affect construction activities at the work site [70]. The initial and final setting time (IST and FST) results for Group I and Group II material are illustrated in Figure 8. It was observed that high slurry concentration reduced both the IST and FST. At lower concentration of 78 %, the IST and FST were 11.27 h and 16.45 h for Group I. Moving from 78 % (lower) to 84 % (higher) for Group I, the IST and FST decreased to 7.56 h and 13.37 h, representing reductions of 32.9 % and 18.7 %, respectively. The IST and FST for Group II at slurry concentration of 70 %, were 12.25 h and 16.73 h, respectively. Similarly, moving from 70 % (lower) to 76 % (higher), the IST and FST decreased to 8.47 h and 14.7 h, corresponding to reductions of 30.9 % and 12.1 %, respectively. This decrease in IST and FST with increment in slurry concentration might be attributed to the reduction in the water-to-solids ratio (slurry concentration) which resulted in reduction in setting time [71]. The similar trend of findings was reported in the literature [72].
Figure 8.
Effect of slurry concentration and B/A ratio on the setting time of Group I and Group II materials.
In contrast, decreasing the B/A ratio from 1/6 to 1/12 has extended both the IST and FST. For Group I material, the IST increases from 9.66 h to 11.48 h and FST from 13.37 h to 15.96 h, representing an increment of 18.8 % and 19.4 %, respectively. A similar increasing trend of 21.9 % and 8.9 % has been exhibited by Group II materials in terms of IST and FST, as expected. This effect of prolonging setting time with increase in B/A ratio might be attributed to the lower binder, relative to aggregate, which reduces the availability of reactive binder constituents’ content available for hydration, delaying the formation of the hydration products and extending both the initial and final setting times [59].
The acceptable setting time of backfill materials depends on their intended application, distinguished between early-strength CLSM, with a hardening-time requirement of 3 h–5 h, and general-purpose CLSM, for which a range of 12 h–36 h was reported [73]. Accordingly, a hardening-time range of 12 h–36 h was adopted in this study for Group I mixtures. In contrast, mine paste backfilling commonly requires substantially shorter setting times, with an initial setting time of approximately 3 h–4 h and a final setting time of approximately 4 h–5 h [74]. Based on these adopted criteria, Group I mixtures generally exhibited setting behavior that satisfied the criteria for general-purpose CLSM applications. However, Group II mixtures did not satisfy the rapid-setting criterion adopted for mine filling. Increasing the slurry concentration within the tested range reduced both the initial and final setting times, but it also decreased flowability as observed in Section 3.2.1. Although a slurry concentration above 76 % may further shorten the setting time, this could result in inadequate flow performance. Therefore, further mixture optimization, including adjustment of slurry concentration, binder content, and suitable accelerating agents, is required to balance setting time and flowability before Group II mixtures can be considered for mine-filling applications.
It should be noted that Group I and Group II mixtures were proportioned separately to achieve suitable workability and performances for their respective potential applications. Although the binder composition was identical, their B/A and W/B ratios and aggregate particle-size distributions differed substantially. Consequently, the differences in fresh-state properties between the two groups may reflect the combined effects of aggregate characteristics, particle grading, water demand and mixture proportions rather than aggregate type alone.
3.2.3. Water Resistance
Low-strength materials used for backfill application are usually of porous nature and contain microcracks, making them vulnerable to water and corrosive fluid penetration [75]. This infiltration can accelerate material deterioration and reduce durability [76]. The water resistance values, in terms of the strength retention ratio k, which serves as a quantitative measure of a material’s ability to maintain its structural integrity [77], for Group I and Group II are shown in Figure 9.
Figure 9.
Effect of slurry concentration and B/A ratio on the strength retention capacity of Group I and Group II materials.
Both material groups showed a distinct trend, where increasing the slurry concentration and decreasing the B/A ratio improved the strength retention capacity of the backfill material. For Group I, k value increased from 0.68 at slurry concentration of 78 % to 0.92 at 84 %, representing a 35.3 % increase. Similarly, for Group II, it increased from 0.62 at 70 % to 0.82 at 76 %, corresponding to a 32.3 % increase. This behavior can be attributed to the reduction in water content at higher slurry concentrations, which produces an effect similar to lowering the w/c ratio. A lower water content reduces capillary pore formation and promotes a denser microstructure, thereby improving resistance to water penetration [78]. Furthermore, the higher solids concentration may promote denser particle packing and reduce the volume of water-filled spaces, thereby contributing to an improved resistance to water penetration [77].
In contrast, reducing the B/A ratio from 1/6 to 1/12 decreased the strength retention capacity of both groups. For Group I, the coefficient decreased from 0.82 at 1/6 to 0.69 at 1/12, showing a 15.9 % reduction. Similarly, for Group II, it decreased from 0.78 at 1/6 to 0.62 at 1/12, representing a 20.5 % reduction. This decline can be attributed to the reduced amount of cementitious material available at lower B/A ratios. At a higher binder content, the cementitious material can more effectively fill the voids between aggregate particles, forming a denser matrix and limiting water penetration pathways [79]. In addition, the differences in strength retention between the two groups may reflect the combined influence of aggregate characteristics and mixture proportions, including B/A and W/B ratios, which affect particle packing and pore structure.
Based on the adopted classification which relies on the coefficient of weakening, wherein high stability is indicated by k ≥ 0.75, moderate stability falls within the range of 0.2 < k < 0.75, and low stability is defined by k ≤ 0.2 [80]. Accordingly, the mixtures with higher slurry concentrations and binder contents generally exhibited high water stability. In contrast, some mixtures with lower slurry concentrations or reduced binder proportions, such as those with a B/A ratio closer to 1/12, exhibited only moderate stability. Therefore, water resistance performance should be evaluated for each mixture individually rather than generalized for an entire material group.
3.2.4. Porosity Analysis
The relationship of slurry concentration and B/A ratio with the porosity of the backfill materials is shown in Figure 10. It is evident that porosity decreases with an increase in slurry concentration. For Group I, porosity decreased from 0.31 at slurry concentration of 78 % to 0.19 at 84 %, representing a 38.7 % reduction. Similarly, for Group II, porosity decreased from 0.39 at slurry concentration of 70 % to 0.29 at 76 %, corresponding to a 25.6 % reduction. This indicates that lower concentration causes excessive water in the mix and tends to fill the spaces between binder particles and aggregate, resulting in the formation of capillary pores [81]. As a result, the backfill particles become more dispersed, reducing the effectiveness of pore filling and leading to higher overall porosity [73].
Figure 10.
Effect of slurry concentration and B/A ratio on porosity of Group I and Group II materials.
On the other hand, the decrease in B/A ratio from 1/6 to 1/12 results in high porosity. For Group I, porosity increased from 0.25 at a B/A ratio of 1/6 to 0.31 at 1/12, showing a 24.0 % increase. For Group II, it increased from 0.28 at a B/A ratio of 1/6 to 0.38 at 1/12, representing a 35.7 % increase. When the B/A ratio decreases, less cementitious material is available for hydration, resulting in fewer hydration products and higher porosity [82]. Thus, at the higher B/A ratio of 1/6, the larger binder content promotes pore filling and microstructural densification, whereas at a low ratio of 1/12, the higher aggregate proportion leaves more unfilled pores, resulting in a more porous and less compact matrix.
The lower porosity observed in Group I may partly be associated with the more favorable particle-size distribution (PSD) of river sand (RS). A well-graded PSD improves particle packing by allowing smaller particles to fill the voids between larger sand grains, thereby reducing pore spaces and enhancing the compactness of the backfill matrix [83]. In Group I, the wider PSD of RS may have promoted more efficient packing, with coarser sand particles forming the main aggregate skeleton and finer particles filling the remaining voids [84]. In contrast, the gap-graded PSD of CGP, as shown in (Figure 3a), may have resulted in less efficient packing and a greater volume of unfilled voids in Group II. However, the observed porosity differences may also reflect the combined effects of aggregate characteristics, particle-size distribution, water demand, and mixture proportions. In particular, the separately adjusted B/A and W/B ratios may have influenced particle packing and pore formation alongside the inherent characteristics of the two aggregates.
3.2.5. Settling Ratio
During wet backfilling in underground mines, backfill slurries are transported directly to the stope or pipelines; the solid particles may settle under their own weight [85]. Predicting the final settled volume of backfill is important for estimating its behavior and volume requirements in underground stopes [86]. In cemented paste backfill and CLSM, settlement is primarily associated with the self-weight of the fresh mixture, while reduction in volume due to chemical shrinkage has a relatively limited influence during the initial settling stage. The settling ratios of Group I and Group II mixtures are presented in Figure 11.
Figure 11.
Effects of slurry concentration and B/A ratio on the settling ratio of Group I and Group II materials.
Slurry concentration had a marked influence on the settling ratio, which decreased with increasing slurry concentration. For Group I, the settling ratio decreased from 16 % at a slurry concentration of 78 % to 8.25 % at 84 %, representing a 48.4 % reduction. Similarly, for Group II, it decreased from 11.4 % at 70 % to 4.9 % at 76 %, corresponding to a 57 % reduction. This reduction can be attributed to the higher solids content and lower water content at increased slurry concentrations. The finer cementitious particles can fill the voids between aggregate particles, improving particle packing and mixture cohesion, thereby reducing water separation and limiting the gravitational settlement of solid particles [38]. Furthermore, higher slurry concentrations promote hydration-product formation, which binds part of the available water and may further reduce water separation [87]. Conversely, lower slurry concentrations contain a greater proportion of free water, which can facilitate water separation and particle settlement [88].
On other hand, the settling behavior shows an inverse relationship with the B/A ratio. As the B/A ratio decreased from 1/6 to 1/12, the settling ratio increased. For Group I, it increased from 7.9 % to 14.5 %, showing an 83.5 % increase, while for Group II, it increased from 5.6 % to 9.5 %, representing a 69.6 % increase. With the decrease in B/A ratio, the viscosity of the filling slurry reduces, rendering the slurry less resistant to flow, consequently contributing to more settlement [89]. Moreover, it also causes reduction in cementitious material which declines the cohesiveness of the filling slurry, thereby increasing the probability of settlement [38,90]. In addition, the differences in settling behavior between the two groups may also be associated with their combined particle-size distributions (PSD) and water requirements. The well-graded PSD of the binder–RS mixture in Group I may promote more efficient particle packing, whereas the gap-graded PSD of the binder–CGP mixture in Group II may result in less efficient packing. Furthermore, Group II required a higher water proportion to achieve suitable mixture consistency, which may influence slurry cohesion and particle settlement. These factors, together with the differences in B/A and W/B ratios, may have contributed to the observed differences in settling behavior.
These results demonstrate that the settling behavior of the backfill mixtures was strongly influenced by slurry concentration and the B/A ratio. Lower settling ratios were generally obtained at higher slurry concentrations and lower aggregate contents relative to binder. These findings highlight the importance of mixture proportioning in controlling settlement and maintaining the stability of the placed backfill. Although shrinkage is not generally the sole acceptance criterion for CLSM, it should be considered alongside flowability, compressive strength, setting behavior, and the requirements of the intended application [91]. For Group II, the settling-ratio results were evaluated with reference to the classification criteria specified in JC/T 2478–2018 [92]. Based on the corresponding thresholds, the mixtures with slurry concentrations of 74 % and 76 %, as well as the mixture with a B/A ratio of 1:6, corresponded to the S2 grade. Similarly, the mixtures with B/A ratios of 1:8 and 1:10 corresponded to the S3 grade. However, the mixtures with slurry concentrations of 70 % and 72 %, and a B/A ratio of 1:12, exceeded the upper S3 threshold of 9 % [92].
3.2.6. Compressive Strength
The CS results of Group I and Group II materials at 7 and 28 days of curing ages are illustrated in Figure 12. The CS increased with increase in slurry concentration, while it decreased as the B/A ratio decreased from 1/6 to 1/12, showing a similar trend for both material groups as observed in strength retention and porosity evaluation in Section 3.2.3 and Section 3.2.4. The CS of Group I at a slurry concentration of 78 %, it increased from 6.69 MPa at 7 days to 10.37 MPa at 28 days, corresponding to an increase of 55.0 %. At an 84 % slurry concentration, it increased from 12.88 to 16.10 MPa, representing an increase of 25.0 %. Similarly, for Group II, at a slurry concentration of 70 %, it increased from 1.20 MPa at 7 days to 2.48 MPa at 28 days, corresponding to an increase of 106.7 %. At a 76 % slurry concentration, it increased from 2.10 to 4.14 MPa, representing an increase of 97.1 %. This improvement in compressive strength may be attributed to the increased solids concentration and reduced water content, which promote closer particle contact and reduce the formation of capillary pores. These effects may contribute to a denser and more cohesive matrix, thereby improving compressive strength [38].
Figure 12.
Effects of slurry concentration and binder-to-aggregate ratio on 7- and 28-day Group I and Group II materials.
In contrast, when reducing the B/A ratio from 1/6 to 1/12, a decreasing trend in CS has been exhibited by both groups. For Group I, moving from 1/6 to 1/12 B/A ratio, CS decreased from 6.66 MPa to 3.26 MPa for 7 days, and from 9.92 MPa to 4.12 MPa for 28 days, showing a reduction of 51.1 % and 58.5 %, respectively. Similarly, for Group II, when moving from a 1/6 to a 1/12 B/A ratio, CS decreased from 2.11 MPa to 0.88 MPa for 7 days, and from 4.10 MPa to 2.1 MPa for 28 days, showing a reduction of 58.3 % and 48.8 %, respectively. As the binder content increases, it fills the void spaces more completely within the mixture, resulting in improved strength. However, at lower B/A ratios, the reduced binder content relative to aggregate provides less binding material to coat and connect the aggregate particles. This can result in a less continuous binding matrix and less effective filling of interparticle voids, consequently reducing compressive strength [71]. Comparatively, there is a clear difference in terms of strength gain. Group I material has a maximum 28-day strength of 16.1 MPa and 9.92 MPa at a slurry concentration of 84 % and a B/A ratio of 1/6, respectively, while the Group II material has a maximum 28-day strength of 4.14 MPa and 4.1 MPa at a slurry concentration of 76 % and a B/A ratio of 1/6, respectively.
The higher compressive strengths obtained for Group I are consistent with its lower porosity and higher strength retention ratios observed in Section 3.2.3 and Section 3.2.4. The combined PSD of the binder–RS mixture may have promoted more effective particle packing and a denser matrix, whereas the binder–CGP mixture, together with its higher water requirement, may have resulted in less efficient packing and greater pore formation. This is consistent with the higher porosity and lower strength retention ratios observed in Group II. Nevertheless, these differences should be interpreted in the context of the separately adjusted B/A and W/B ratios, which may also have influenced matrix density and strength development.
The 28-day compressive strengths of Group I ranged from 4.12 to 16.10 MPa. The mixtures with B/A ratios of 1:10 and 1:12 achieved strengths of 5.30 and 4.12 MPa, respectively, falling below the 8.3 MPa upper strength limit specified in the broad CLSM definition of ACI 229R [68], whereas the remaining mixtures exceeded 8.3 MPa. Nevertheless, these results demonstrate the ability of the developed binder to maintain considerable strength even at reduced binder contents. The mechanical-strength requirements of mine-backfill materials vary according to their intended applications. According to JC/T 2478–2018 [92], the 28-day compressive strength of mine backfill is classified into six grades: C0.5, C1, C2, C3, C4, and C5. Based on the results presented in Figure 12, the Group II mixtures with a slurry concentration of 76 % and a B/A ratio of 1:6 corresponded to the C4 strength level. Similarly, the mixtures with a slurry concentration of 74 % and a B/A ratio of 1:8 corresponded to the C3 strength level. The remaining mixtures corresponded to the C2 strength level based on their measured 28-day compressive strengths. These comparisons provide a reference for evaluating the strength performance of the developed materials; however, their suitability for specific applications should also be assessed considering flowability, setting behavior, volume stability, and other relevant performance requirements [93].
3.2.7. X-Ray Diffraction Analysis (XRD)
The mixtures demonstrating highest compressive strength at the 28 days of curing age from Group I (CFB-S-84) and Group II (CFB-C-76) were selected for XRD analysis as illustrated in Figure 13. The diffraction patterns revealed several crystalline phases, including quartz, C2S, calcite, ettringite, illite, albite, and kaolinite. Among these, ettringite represents a sulfate-bearing hydration product, while the detected C2S may correspond to residual dicalcium silicate originating from SS. A broad diffuse feature was observed in the 2θ range of 20°–35°, particularly in the Group I specimen. This feature may be associated with amorphous or poorly crystalline phases, including unreacted glassy GGBFS and calcium–silicate or calcium–aluminosilicate hydrate gels [94]. Because C–S–H-type gels possess a poorly crystalline structure, they could not be identified or quantified directly from the XRD patterns.
Figure 13.
XRD patterns for 28-day-cured samples of Group I and Group II materials.
GGBFS constituted 50 wt.% of the CFB and contained 40.19 wt.% CaO, 27.80 wt.% SiO2, and 13.80 wt.% Al2O3, making it a major potential source of calcium, silicon, and aluminum for hydration-product formation. Under sufficiently alkaline conditions, dissolution of the glassy GGBFS phase may release calcium-, silicon-, and aluminum-bearing species that participate in the formation of C–S–H- and C–A–S–H-type gels [95]. RM contained 7.40 wt.% Na2O and 1.88 wt.% K2O and may therefore have contributed to the alkaline reaction environment. Nevertheless, the magnitude and persistence of this contribution could not be determined because pore-solution pH and dissolved-ion concentrations were not measured. RM may also provide aluminum-bearing species that participate in reactions involving calcium and silicate phases [96]. Similarly, PG contained 48.48 wt.% SO3 and acted as a sulfate-bearing component. Sulfate released from PG may react with available calcium- and aluminum-bearing species from GGBFS, RM, and SS, thereby promoting ettringite formation. A similar mechanism was observed in a previous study [83]. The higher 28-day compressive strength observed for Group I may be associated with the differences in the overall reaction and microstructural development of the two mixtures. However, the relative contributions of individual binder components and the quantities of amorphous hydration products could not be established from the qualitative XRD analysis. Although the raw-material XRF results provide information on the initial oxide compositions, they do not quantify the reaction products formed during hardening. The lower strength observed in Group II may also be associated with its less effective combined particle-size distribution, higher water requirement, and separately adjusted mixture proportions, which may have influenced particle packing, pore formation, and matrix density [97]. Since XRD analysis was limited to the selected high-strength mixture from each group, the identified phases and proposed reaction mechanisms should be interpreted in the context of these specific formulations rather than as evidence of the individual effects of the binder components.
3.2.8. Thermogravimetric Analysis (TGA-DTG)
The thermal behavior of Group I (CFB-S-84) and Group II (CFB-C-76) were examined using TGA-DTG analysis as shown in Figure 14. Both mixtures exhibited different mass-loss profiles over the investigated temperature range, reflecting differences in their constituent materials and thermal decomposition behavior. The minor peaks observed occurring between room temperature and approximately 60 °C, are attributed to the evaporation of adsorbed water or loosely bound water [98].
Figure 14.
TG and DTG curves for Group I and Group II material at 28 days of curing age.
Further mass loss between approximately 100 °C and 400 °C may be associated with the dehydration of hydrated phases. For instance, ettringite undergoes dehydration at relatively low temperatures, generally around 100 °C–150 °C, while C–S–H-type phases exhibit gradual water loss over a broader temperature range [99]. For instance, ettringite (Ca6Al2(SO4)3(OH)12·26H2O) typically releases molecular water within the temperature range of 110 °C to 140 °C. Similarly, calcium silicate hydrate (C–S–H) primarily loses water at around 120 °C [100]. However, these thermal events may overlap, making it difficult to distinguish the individual contributions of different hydrated phases using TG–DTG analysis alone. The Group I specimen exhibited gradual mass loss extending to approximately 600 °C, followed by additional thermal events at higher temperatures. The mass-loss observed around 630 °C may involve overlapping thermal transformations of calcium-bearing phases and carbonate-containing compounds. The additional mass loss observed at higher temperatures, particularly around 850 °C, may be associated with the decomposition of calcium carbonate, consistent with the identification of calcite in the XRD analysis [101]. Nevertheless, the individual contributions of these phases cannot be quantitatively distinguished from the TG-DTG curves.
Group II exhibited a pronounced thermal event within approximately at 400 °C and 600 °C, where it loses a significant amount of weight (3.14 %). This feature may be associated with the dehydroxylation of kaolinite or other clay-bearing phases originating from CGP, provided that the presence of kaolinite was confirmed by the XRD analysis. The corresponding mass loss may therefore include contributions from unreacted CGP and should not be interpreted solely as hydration-product decomposition. The thermal events observed above approximately 630 °C might be associated with the decomposition of carbonate-bearing phases. In particular, the high-temperature feature near 850 °C in Group I may be attributed to the decarbonation of calcite or other calcium carbonate phases [101].
Over the investigated temperature range, the total mass losses of Group I and Group II were 7.24 % and 3.48 %, respectively, indicating an approximately 108 % greater mass loss for Group I. However, these values represent the combined contributions of physically bound water, dehydration of hydrated phases, dehydroxylation of clay minerals, and decomposition of carbonate-bearing phases. Consequently, the total mass loss cannot be considered a direct quantitative measure of the hydration degree or the amount of individual hydration products. The higher mass loss of Group I, together with its higher compressive strength and lower measured porosity, is consistent with the differences in the thermal and microstructural characteristics of the two mixtures. Nevertheless, the relative quantities of individual hydration products and their specific contributions to strength development cannot be established from TG–DTG analysis alone.
3.2.9. Scanning Electron Microscopy (SEM)
The SEM micrographs of Group I (CFB-S-84) and Group II (CFB-C-76) are presented in Figure 15 and Figure 16, respectively. In Group I, the micrographs revealed relatively compact regions containing gel-like products with honeycomb- or sponge-like morphologies. These morphologies resemble those commonly reported for C–S–H-type hydration products [102,103]. Previous studies have reported that the morphology of C–S–H may evolve with hydration time and the available space for growth, changing from flake-like structures at early ages to more honeycomb- or sponge-like structures at later stages [102,103]. Such morphologies contain interconnected pores that may facilitate moisture and ion transport within the matrix and contribute to continued microstructural development [104]. This interpretation is supported by the identification of ettringite in the XRD analysis of the selected Group I mixture. The coexistence of gel-like regions and needle-shaped crystals suggests the development of a hydrated binding matrix. However, the identification of individual hydration products based on SEM morphology alone remains tentative.
Figure 15.
SEM images of Group I samples at 28 days of curing age.
Figure 16.
SEM images of Group II material at 28 days of curing age.
In contrast, as seen in Figure 16, Group II exhibited a more heterogeneous microstructure, characterized by visible voids, agglomerated CGP particles, and apparent interfacial regions between the particles and surrounding matrix. Gel-like products were observed locally around some particles, while several CGP particles appeared to have limited bonding with the surrounding matrix. These morphological features suggest a less continuous binding matrix compared with Group I. The presence of visible voids, particle agglomeration, and interfacial gaps may have contributed to the lower compressive strength of Group II [105,106].
Overall, the relatively compact and continuous-looking matrix observed in Group I is consistent with its higher 28-day compressive strength and lower measured porosity, whereas the more heterogeneous microstructure of Group II agrees with its comparatively lower mechanical performance. The more effective combined PSD of the binder–RS mixture may have promoted denser particle packing, whereas the binder–CGP mixture, with its higher water requirement and lower slurry concentration, may have contributed to greater pore formation and less compact interfacial regions. The separately adjusted W/B ratios may also have influenced the observed microstructural differences. Nevertheless, these observations represent qualitative morphological evidence rather than definitive identification of individual hydration products or their formation mechanisms. Furthermore, since SEM analysis was limited to the selected mixtures from each group, the observed differences cannot establish the individual contributions of the binder components.
4. Summary and Conclusions
This study investigated the development and application of a clinker-free binder (CFB) based on industrial solid wastes. In Phase 1, GGBFS, RM, SS, and PG were used as binder constituents, and a D-optimal mixture design was employed for mixture optimization and the development and verification of predictive models for compressive strength at 7 and 28 days. In Phase 2, the developed CFB was used as the binding agent, with RS and CGP as fine aggregates to produce Group I (CLSM) and Group II (mine-filling) materials, respectively. The resulting mixtures were experimentally evaluated in terms of fresh properties, setting behavior, compressive strength, water resistance, settling behavior, and microstructural characteristics. Based on the experimental findings, the following conclusions can be drawn:
The quadratic models identified a strength-optimized binder containing 10 wt.% PG, 50 wt.% GGBFS, 20 wt.% RM, and 20 wt.% SS, with statistically significant model performance (p < 0.05) and good agreement between adjusted and predicted R2 values.
- XRD, TG–DTG, and SEM provided qualitative evidence of phase composition and microstructural development. Ettringite was identified by XRD, while SEM revealed morphologies consistent with C-S-H-type products and ettringite. However, individual hydration products and their contributions to strength were not quantified.
- For Group I, considering the combined performance of the evaluated properties, a slurry concentration of 82 % at a fixed B/A ratio of 1:4 provided the best overall compromise in the slurry-concentration series. In the separate B/A-ratio series, with slurry concentration fixed at 84 %, a B/A ratio of 1:8 offered the most favorable overall balance. Both selected mixtures exceeded the 8.3 MPa ACI 229R reference limit. However, the ultra-low B/A ratios of 1:10 and 1:12 achieved strengths of 5.30 and 4.12 MPa, respectively, falling below this limit and indicating their potential for CLSM applications.
- For Group II, a slurry concentration of 74 % at a fixed B/A ratio of 1:4 provided the best overall compromise among the evaluated properties, corresponding to the C3 strength level and S2 settling-ratio grade. In the separate B/A-ratio series, with slurry concentration fixed at 76 %, a B/A ratio of 1:6 exhibited the most favorable overall balance, corresponding to the C4 strength level and S2 settling-ratio grade. However, none of the investigated mixtures satisfied the adopted setting time criterion, indicating the need for further optimization before practical application.
- Since slurry concentration and B/A ratio were investigated separately, the proposed mixture combinations should be regarded as laboratory-scale candidate formulations. The longer setting time observed for the selected Group II formulation indicates the need for further optimization to meet the adopted mine-filling criterion. Furthermore, fine-particle release and chemical leaching were not quantitatively assessed, and further environmental safety investigations are required. Economic performance and carbon-emission reductions were also not quantified in this study. Further research involving combined optimization of mixture parameters, long-term durability assessment, pumping performance, and pilot-scale and field-scale validation is necessary to establish the practical applicability of the developed materials.
Author Contributions
P.Z.: Writing—review and editing, Validation, Conceptualization, Supervision. I.K.: Writing—original draft, Methodology, Investigation, Formal analysis Software, Data curation. L.W.: Supervision. D.Z.: Validation. A.J.: Supervision, review and editing. M.A.M.: review and editing. M.F.A.: review and editing. M.I.U.: review and editing. A.H.: review and editing. All authors have read and agreed to the published version of the manuscript.
Funding
This work was supported by grants from financial support from the Key Project of the National Development and Reform Commission of China (Grants Number: 202203001); Horizontal research projects (20230352A; 20230934A; 20240315A; 20250344A; 20241052A).
Data Availability Statement
Data is contained within the article.
Conflicts of Interest
The authors declare no conflicts of interest.
Abbreviations
The following abbreviations are used in this manuscript:
| GGBFS | Ground granulated blast furnace slag |
| SS | Steel slag |
| PG | Phosphogypsum |
| RM | Red mud |
| CFB | Clinker-free binder |
| CGP | Coal gangue powder |
| RS | River sand |
| CLSM | Controlled low-strength material |
| IST | Initial setting time |
| FST | Final setting time |
Appendix A
Table A1.
Batch-specific mean compressive strength, standard deviation, and 95 % confidence intervals for model-development and model-verification specimens.
Appendix B
Worked prediction example:
- Step 1. Calculation of the pseudocomponents:
The optimized binder composition was 10 wt.% PG, 50 wt.% GGBFS, 20 wt.% RM, and 20 wt.% SS. The pseudocomponents were calculated using Equations (7)–(9):
B = (XGGBFS − 40)/20 = (50 − 40)/20 = 0.50
C = (XRM − 10)/20 = (20 − 10)/20 = 0.50
D = (XSS − 20)/20 = (20 − 20)/20 = 0
Therefore, B = 0.50, C = 0.50, and D = 0.
- Step 2. Calculation of predicted 7-day compressive strength
Substituting the pseudocomponent values into Equation (5) from the manuscript:
Y7d = 3.42155(0.50) + 4.57079(0.50) + 1.98945(0) − 2.37412(0.50 × 0.50) + 0.684778(0.50 × 0) − 3.00605(0.50 × 0)
Y7d = 3.40063 MPa
- Step 3. Calculation of predicted 28-day compressive strength
Substituting the pseudocomponent values into Equation (6) from the manuscript:
Y28d = 4.42631(0.50) + 5.91737(0.50) + 2.57525(0) − 3.06384(0.50 × 0.50) + 0.887742(0.50 × 0) − 3.88472(0.50 × 0)
Y28d = 4.40287 MPa.
The calculated 7- and 28-day compressive strengths of 3.40063 and 4.40287 MPa, respectively, confirm the consistency and reproducibility of the proposed pseudocomponent transformation and quadratic Scheffé models.
Appendix C
Table A2.
Sensitivity analysis of the optimized binder composition to variations in the importance levels of the optimization criteria.
The optimized binder composition remained unchanged across all seven sensitivity scenarios, consisting of 10 wt.% PG, 50 wt.% GGBFS, 20 wt.% RM, and 20 wt.% SS. The predicted compressive strengths also remained constant at 3.40063 MPa and 4.40287 MPa for 7 and 28 days, respectively. Desirability ranged from 0.980 to 0.993.
Appendix D
Figure A1.
Residual diagnostic plots for the regression model developed to predict 7-day compressive strength: (a) Box–Cox plot for power transformations, (b) normal probability plot of residuals, (c) Cook’s distance, (d) leverage versus run order, (e) externally studentized residuals versus predicted values, and (f) predicted versus experimental values.
Appendix E
Figure A2.
Residual diagnostic plots for the regression model developed to predict 28-day compressive strength: (a) Box–Cox plot for power transformations, (b) normal probability plot of residuals, (c) Cook’s distance, (d) leverage versus run order, (e) externally studentized residuals versus predicted values, and (f) predicted versus experimental values.
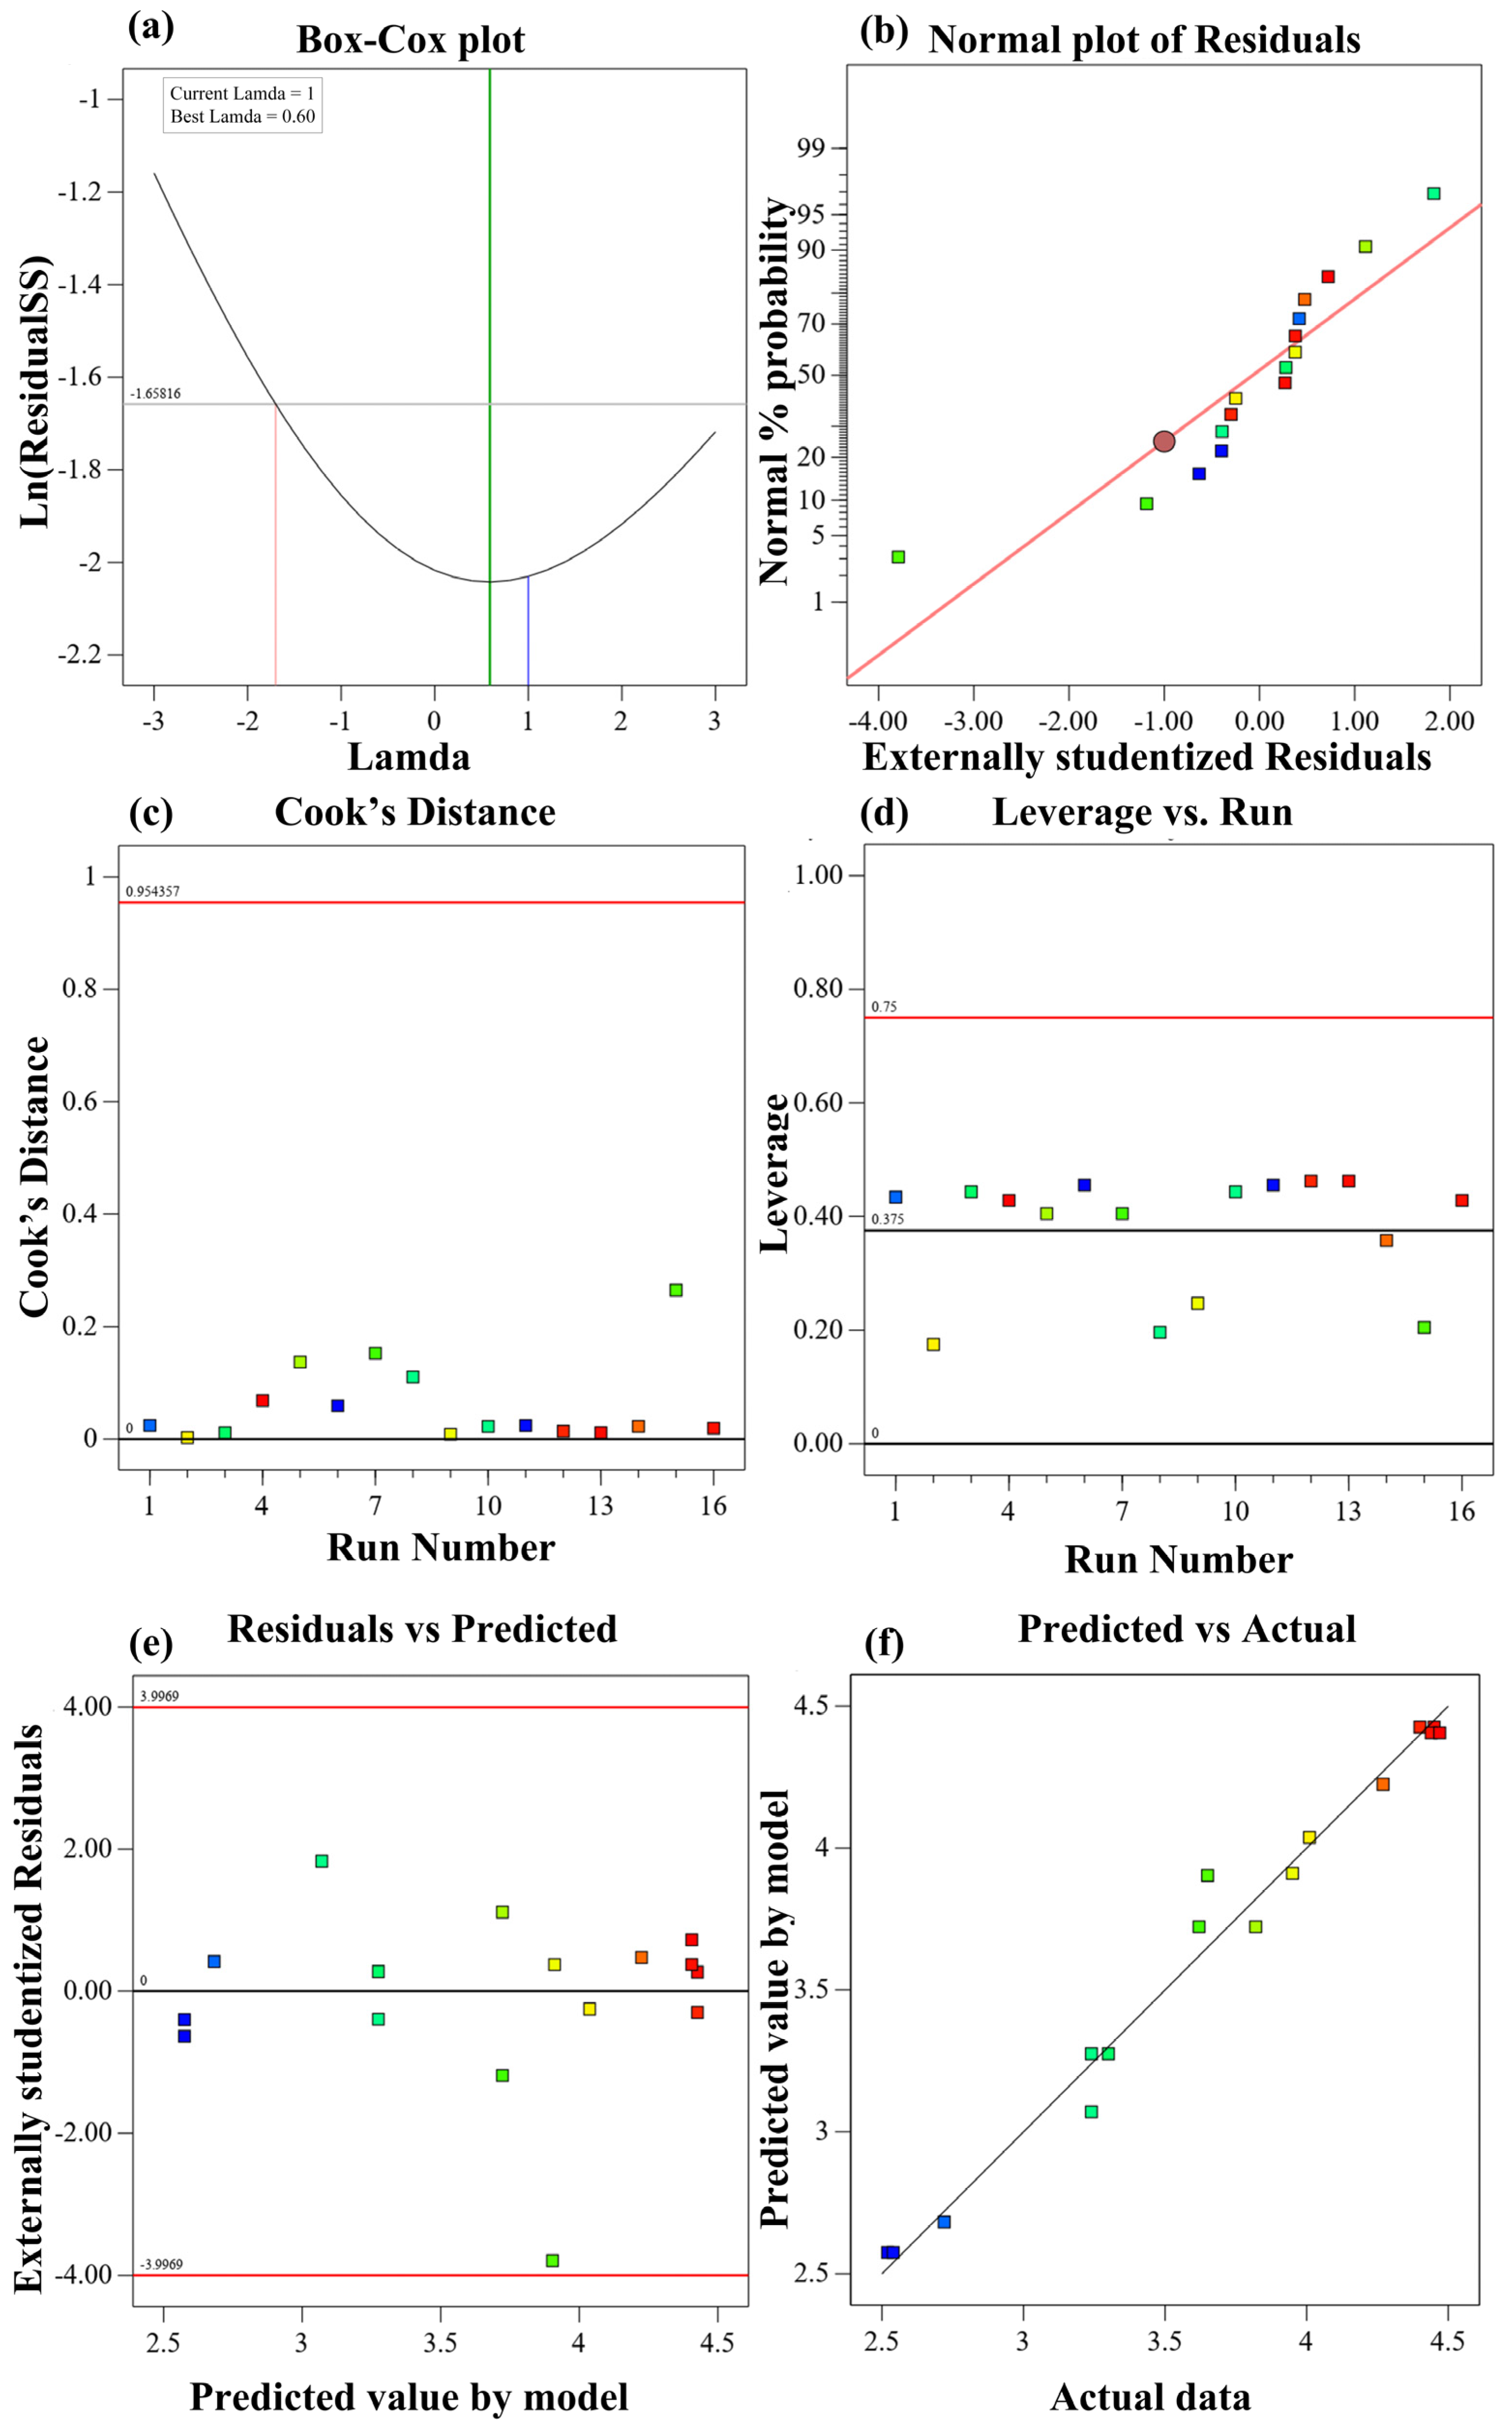
The adequacy of the developed quadratic regression models for predicting 7-day and 28-day compressive strengths was evaluated using Box–Cox transformation analysis, normal probability plots of residuals, Cook’s distance, leverage, residuals versus predicted values, and predicted versus experimental values (Appendix D and Appendix E).
The Box–Cox analysis indicated an optimum lambda (λ) value of approximately 0.60 for both models. However, the current lambda value of 1 was within the acceptable confidence region, indicating that transformation of the response variables was not necessary.
The normal probability plots showed that most externally studentized residuals followed the reference line reasonably well, suggesting that the residual distributions were approximately normal. Nevertheless, one observation exhibited a noticeable deviation from the reference line in both models. The residuals versus predicted values plots further demonstrated that the residuals were generally scattered around zero without a pronounced systematic pattern or apparent funnel-shaped distribution. This suggests that no substantial systematic relationship between the residuals and predicted values was evident, supporting the assumptions of model linearity and approximately constant residual variance.
The influence of individual observations was further examined using Cook’s distance and leverage diagnostics. All Cook’s distance values remained below reference limit of 0.954, while the leverage values were below the reference limit of 0.75 for both models. These findings suggest that no experimental observation exerted excessive overall influence according to Cook’s distance. Nevertheless, the observation associated with Run 15 showed a relatively large negative externally studentized residual in both models, indicating a potential deviation from the overall residual distribution.
The predicted versus experimental plots demonstrated that the predicted compressive strength values were generally distributed close to the 1:1 reference line for both models. This agreement indicates a reasonable correspondence between the experimental measurements and the values estimated by the developed regression equations, supporting their ability to describe the observed compressive strength responses within the investigated experimental design space.
Overall, the combined findings from the Box–Cox analysis, lack-of-fit tests, residual distribution patterns, and influence diagnostics supported the adequacy of the developed quadratic regression models for both 7-day and 28-day compressive strengths. Although an isolated observation exhibited an unusually large negative residual and exceeded the reference limit, the remaining diagnostic results did not indicate widespread systematic residual patterns or excessive overall influence. Accordingly, both models were retained, with the observed diagnostic deviation acknowledged.
References
- Mohamad, N.; Muthusamy, K.; Embong, R.; Kusbiantoro, A.; Hashim, M.H. Environmental impact of cement production and Solutions: A review. Mater. Today Proc. 2022, 48, 741–746. [Google Scholar] [CrossRef] [Scilit]
- Suhendro, B. Toward Green Concrete for Better Sustainable Environment. Procedia Eng. 2014, 95, 305–320. [Google Scholar] [CrossRef] [Scilit]
- Shekdar, A.V. Sustainable solid waste management: An integrated approach for Asian countries. Waste Manag. 2009, 29, 1438–1448. [Google Scholar] [CrossRef] [Scilit] [PubMed]
- Siddique, R. Utilization of Industrial By-products in Concrete. Procedia Eng. 2014, 95, 335–347. [Google Scholar] [CrossRef] [Scilit]
- Silveira, N.C.G.; Martins, M.L.F.; Bezerra, A.C.S.; Araújo, F.G.S. Red Mud from the Aluminium Industry: Production, Characteristics, and Alternative Applications in Construction Materials—A Review. Sustainability 2021, 13, 12741. [Google Scholar] [CrossRef] [Scilit]
- Ober, J.A. Iron and Steel Slag. Available online: https://pubs.usgs.gov/periodicals/mcs2021/mcs2021-iron-steel-slag.pdf (accessed on 22 September 2023).
- Shi, C. Steel slag—Its production, processing, characteristics, and cementitious properties. J. Mater. Civ. Eng. 2004, 16, 230–236. [Google Scholar] [CrossRef] [Scilit]
- World Steel Association. Steel Statistical Yearbook; Concise Version; World Steel Association: Brussels, Belgium, 2020; p. 42. [Google Scholar]
- Wu, F.; Ren, Y.; Qu, G.; Liu, S.; Chen, B.; Liu, X.; Zhao, C.; Li, J. Utilization path of bulk industrial solid waste: A review on the multi-directional resource utilization path of phosphogypsum. J. Environ. Manag. 2022, 313, 114957. [Google Scholar] [CrossRef] [Scilit] [PubMed]
- Hao, X.; Liu, X.; Zhang, Z.; Zhang, W.; Lu, Y.; Wang, Y.; Yang, T. In-depth insight into the cementitious synergistic effect of steel slag and red mud on the properties of composite cementitious materials. J. Build. Eng. 2022, 52, 104449. [Google Scholar] [CrossRef] [Scilit]
- Duan, S.; Liao, H.; Cheng, F.; Song, H.; Yang, H. Investigation into the synergistic effects in hydrated gelling systems containing fly ash, desulfurization gypsum and steel slag. Constr. Build. Mater. 2018, 187, 1113–1120. [Google Scholar] [CrossRef] [Scilit]
- Zhang, J.; Li, S.; Li, Z. Investigation the synergistic effects in quaternary binder containing red mud, blast furnace slag, steel slag and flue gas desulfurization gypsum based on artificial neural networks. J. Clean. Prod. 2020, 273, 122972. [Google Scholar] [CrossRef] [Scilit]
- Xiao, B.; Wen, Z.; Miao, S.; Gao, Q. Utilization of steel slag for cemented tailings backfill: Hydration, strength, pore structure, and cost analysis. Case Stud. Constr. Mater. 2021, 15, e00621. [Google Scholar] [CrossRef] [Scilit]
- Wang, Q.; Yan, P. Hydration properties of basic oxygen furnace steel slag. Constr. Build. Mater. 2010, 24, 1134–1140. [Google Scholar] [CrossRef] [Scilit]
- Xu, Y.-T.; Yang, B.; Liu, X.-M.; Gao, S.; Li, D.-S.; Mukiza, E.; Li, H.-J. Investigation of the medium calcium based non-burnt brick made by red mud and fly ash: Durability and hydration characteristics. Int. J. Miner. Metall. Mater. 2019, 26, 983–991. [Google Scholar] [CrossRef] [Scilit]
- Li, Y.; Liu, X.; Li, Z.; Ren, Y.; Wang, Y.; Zhang, W. Preparation, characterization and application of red mud, fly ash and desulfurized gypsum based eco-friendly road base materials. J. Clean. Prod. 2021, 284, 124777. [Google Scholar] [CrossRef] [Scilit]
- Lin, C.; Liu, Z.; Gao, Y.; Li, Z.; Zhang, J.; Niu, H. Study on the effect and mechanism of cement-based material retarder on red mud-based hybrid alkali activated cement. J. Build. Eng. 2023, 70, 106353. [Google Scholar] [CrossRef] [Scilit]
- Cui, X.; Ni, W.; Ren, C. Hydration behavior of cementitious materials with all solid waste based of steel slag and blast furnace slag. Rev. Fac. Ing. 2016, 31, 172–181. [Google Scholar] [CrossRef] [Scilit]
- Li, J.; Yilmaz, E.; Cao, S. Influence of industrial solid waste as filling material on mechanical and microstructural characteristics of cementitious backfills. Constr. Build. Mater. 2021, 299, 124288. [Google Scholar] [CrossRef] [Scilit]
- Bull, A.J.; Fall, M. Curing temperature dependency of the release of arsenic from cemented paste backfill made with Portland cement. J. Environ. Manag. 2020, 269, 110772. [Google Scholar] [CrossRef] [Scilit] [PubMed]
- Qi, C.; Fourie, A. Cemented paste backfill for mineral tailings management: Review and future perspectives. Miner. Eng. 2019, 144, 106025. [Google Scholar] [CrossRef] [Scilit]
- Edraki, M.; Baumgartl, T.; Manlapig, E.; Bradshaw, D.; Franks, D.M.; Moran, C.J. Designing mine tailings for better environmental, social and economic outcomes: A review of alternative approaches. J. Clean. Prod. 2014, 84, 411–420. [Google Scholar] [CrossRef] [Scilit]
- Taha, R.A.; Alnuaimi, A.S.; Al-Jabri, K.S.; Al-Harthy, A.S. Evaluation of controlled low strength materials containing industrial by-products. Build. Environ. 2007, 42, 3366–3372. [Google Scholar] [CrossRef] [Scilit]
- ACI 229R-99; Controlled Low-Strength Materials. American Concrete Institute: Farmington Hills, MI, USA, 1999.
- Alizadeh, V.; Helwany, S.; Ghorbanpoor, A.; Oliva, M. Rapid-construction technique for bridge abutments using controlled low-strength materials. J. Perform. Constr. Facil. 2014, 28, 149–156. [Google Scholar] [CrossRef] [Scilit]
- Jan, A.; Ferrari, L.; Neves, R.; Franzoni, E.; de Brito, J. Durability and rheological properties of concrete with recycled fine and coarse aggregates and LC3. Constr. Build. Mater. 2025, 498, 143993. [Google Scholar] [CrossRef] [Scilit]
- Jan, A.; Ferrari, L.; Mikanovic, N.; Ben-Haha, M.; Franzoni, E. LC3-Based Concrete with High Recycled Sand Content: Unveiling its Mechanical and Durability Potential. In Concrete and Circular Economy; Springer: Cham, Switzerland, 2026; pp. 117–133. [Google Scholar]
- Jan, A.; Ferrari, L.; Mikanovic, N.; Ben-Haha, M.; Franzoni, E. Evaluating the Performance of Low-Carbon Mortars for Sustainable Construction. In Proceedings of RILEM Spring Convention and Conference 2024; Springer: Cham, Switzerland, 2025; pp. 375–383. [Google Scholar]
- Ren, C.; Wang, W.; Li, G. Preparation of high-performance cementitious materials from industrial solid waste. Constr. Build. Mater. 2017, 152, 39–47. [Google Scholar] [CrossRef] [Scilit]
- Sun, C.; Zhang, J.; Yan, C.; Yin, L.; Wang, X.; Liu, S. Hydration characteristics of low carbon cementitious materials with multiple solid wastes. Constr. Build. Mater. 2022, 322, 126366. [Google Scholar] [CrossRef] [Scilit]
- Yang, P.; Liu, L.; Suo, Y.; Qu, H.; Xie, G.; Zhang, C.; Deng, S.; Lv, Y. Investigating the synergistic effects of magnesia-coal slag based solid waste cementitious materials and its basic characteristics as a backfill material. Sci. Total Environ. 2023, 880, 163209. [Google Scholar] [CrossRef] [Scilit] [PubMed]
- Shi, Y.; Li, Y.; Wang, H. Eco-friendly solid waste-based cementitious material containing a large amount of phosphogypsum: Performance optimization, micro-mechanisms, and environmental properties. J. Clean. Prod. 2024, 471, 143335. [Google Scholar] [CrossRef] [Scilit]
- Deng, Y.; Wang, X.; Zhou, B.; Xu, X.; Chen, L. Systematic assessment of a multi–solid waste cementitious material: Feasibility and environmental impact. Constr. Build. Mater. 2024, 428, 136323. [Google Scholar] [CrossRef] [Scilit]
- Nguyen, N.T.T.; Ngo, T.V.; Nguyen, K.K.; Vu, V.Q.; Xia, Y.; Tran, M.Q.; Dang, H.T.; Matos, J.; Dang, S.N. Effects of Fly Ash and Graphene Oxide in Cement Mortar Considering the Local Recycled Material Context. Appl. Sci. 2024, 14, 6140. [Google Scholar] [CrossRef] [Scilit]
- Liang, X.; Dong, H.; Li, Z.; Liu, C.; Zhang, S.; Ye, G. Characterization, pretreatment, and valorization of wood biomass fly ash in a binary cement-free binder. Dev. Built Environ. 2025, 23, 100700. [Google Scholar] [CrossRef] [Scilit]
- Liang, X.; Ye, G. A Novel Clinker-Free Binary Paste with Biomass Fly Ash and Slag. Spec. Publ. 2024, 362, 499–506. [Google Scholar] [CrossRef] [Scilit]
- Yang, J.; Zeng, J.; He, X.; Zhang, Y.; Su, Y.; Tan, H. Sustainable clinker-free solid waste binder produced from wet-ground granulated blast-furnace slag, phosphogypsum and carbide slag. Constr. Build. Mater. 2022, 330, 127218. [Google Scholar] [CrossRef] [Scilit]
- He, X.; Li, W.; Yang, J.; Su, Y.; Zhang, Y.; Zeng, J.; Dai, F.; Tan, H. Multi-solid waste collaborative production of clinker-free cemented iron tailings backfill material with ultra-low binder-tailing ratio. Constr. Build. Mater. 2023, 367, 130271. [Google Scholar] [CrossRef] [Scilit]
- Xu, D.; Liu, J.; Du, H.; Ma, B.; Tang, C.; Ni, W.; Yan, X.; Zhang, H. Performance optimization and carbon reduction effect of solid waste-based cementitious materials from iron and steel metallurgical slags and ammonia-soda residue. Chem. Eng. J. Adv. 2024, 17, 100584. [Google Scholar] [CrossRef] [Scilit]
- Jia, R.; Ran, B.; Lv, T.; Yu, Y.; Hu, X.; Xu, L. Synergistic effect of waste concrete powder and traditional SCMs in preparing clinker-free cement: Hydration and microstructure evolution. Constr. Build. Mater. 2025, 491, 142798. [Google Scholar] [CrossRef] [Scilit]
- Ma, F.; Chen, L.; Lin, Z.; Liu, Z.; Zhang, W.; Guo, R. Microstructure and Key Properties of Phosphogypsum-Red Mud-Slag Composite Cementitious Materials. Materials 2022, 15, 6096. [Google Scholar] [CrossRef] [Scilit] [PubMed]
- Occhicone, A.; Vukčević, M.; Bosković, I.; Ferone, C. Red mud-blast furnace slag-based alkali-activated materials. Sustainability 2021, 13, 11298. [Google Scholar] [CrossRef] [Scilit]
- Gong, K.; White, C.E. Impact of chemical variability of ground granulated blast-furnace slag on the phase formation in alkali-activated slag pastes. Cem. Concr. Res. 2016, 89, 310–319. [Google Scholar] [CrossRef] [Scilit]
- Varanda, C.; Portugal, I.; Ribeiro, J.; Silva, A.M.; Silva, C.M. Optimization of bitumen formulations using mixture design of experiments (MDOE). Constr. Build. Mater. 2017, 156, 611–620. [Google Scholar] [CrossRef] [Scilit]
- Venkatesan, M.; Zaib, Q.; Shah, I.H.; Park, H.S. Optimum utilization of waste foundry sand and fly ash for geopolymer concrete synthesis using D-optimal mixture design of experiments. Resour. Conserv. Recycl. 2019, 148, 114–123. [Google Scholar] [CrossRef] [Scilit]
- Tran, V.H.; Tran, M. Mechanical properties and structural behavior of optimized fly ash-based geopolymer concrete: Experimental and numerical investigation. Case Stud. Constr. Mater. 2026, 24, e06012. [Google Scholar] [CrossRef] [Scilit]
- Dahmoune, F.; Remini, H.; Dairi, S.; Aoun, O.; Moussi, K.; Bouaoudia-Madi, N.; Adjeroud, N.; Kadri, N.; Lefsih, K.; Boughani, L. Ultrasound assisted extraction of phenolic compounds from P. lentiscus L. leaves: Comparative study of artificial neural network (ANN) versus degree of experiment for prediction ability of phenolic compounds recovery. Ind. Crops Prod. 2015, 77, 251–261. [Google Scholar] [CrossRef] [Scilit]
- Cornell, J.A. Experiments with Mixtures: Designs, Models, and the Analysis of Mixture Data; Wiley-Interscience: Hoboken, NJ, USA, 1843; Volume 255. [Google Scholar]
- Myers, R.H.; Montgomery, D.C.; Anderson-Cook, C.M. Response Surface Methodology: Process and Product Optimization Using Designed Experiments; John Wiley & Sons: Hoboken, NJ, USA, 2016. [Google Scholar]
- Baek, J.W.; Choi, A.E.S.; Park, H.S. Solidification/stabilization of ASR fly ash using Thiomer material: Optimization of compressive strength and heavy metals leaching. Waste Manag. 2017, 70, 139–148. [Google Scholar] [CrossRef] [Scilit] [PubMed]
- Pattanaik, A.; Rayasam, V. Analysis of reverse cationic iron ore fines flotation using RSM-D-optimal design–an approach towards sustainability. Adv. Powder Technol. 2018, 29, 3404–3414. [Google Scholar] [CrossRef] [Scilit]
- ASTM C109/C109M-21; Standard Method of Test for Compressive Strength of Hydraulic Cement Mortar (Using 50-mm or 2-in. Cube Specimens). American Society for Testing Materials: West Conshohocken, PA, USA, 2024.
- Anderson, M.J.; Whitcomb, P.J.; Bezener, M.A. Formulation Simplified: Finding the Sweet Spot Through Design and Analysis of Experiments with Mixtures; Productivity Press: Oxfordshire, UK, 2018. [Google Scholar]
- ASTM C 191-04; Standard Method of Test for Time of Setting of Hydraulic Cement by Vicat Needle. American Society for Testing and Materials: West Conshohocken, PA, USA, 2004.
- AASHTO T 131-2005; Standard Method of Test for Time of Setting of Hydraulic Cement by Vicat Needle. American Association of State Highway and Transportation Officials: Washington, DC, USA, 2005.
- ASTM D6103/D6103M-17; Standard Test Method for Flow Consistency of Controlled Low Strength Material (CLSM). American Society for Testing Materials: West Conshohocken, PA, USA, 2021.
- Liu, Y.; Wu, K.; Zheng, Y.; Lu, H.; Liu, W.; Zhang, H.; Sun, Y. Optimization of mechanical properties and microstructure of marine soft soil solidified with industrial waste using the D-Optimal method. J. Build. Eng. 2025, 99, 111566. [Google Scholar] [CrossRef] [Scilit]
- Li, X.; Ouyang, J.; Xu, Y.; Chen, M.; Song, X.; Yong, Q.; Yu, S. Optimization of culture conditions for production of yeast biomass using bamboo wastewater by response surface methodology. Bioresour. Technol. 2009, 100, 3613–3617. [Google Scholar] [CrossRef] [Scilit] [PubMed]
- Wang, Y.; Liu, X.; Tang, B.; Li, Y.; Zhang, W.; Xue, Y. Effect of Ca/(Si+Al) on red mud based eco-friendly revetment block: Microstructure, durability and environmental performance. Constr. Build. Mater. 2021, 304, 124618. [Google Scholar] [CrossRef] [Scilit]
- Liu, X.; Long, Y.; Wu, Q.; Yu, Z.; Shen, X. Preparation and performance of AACM with red mud and GGBFS: Effectiveness of alkali activator. Mater. Struct. 2023, 56, 88. [Google Scholar] [CrossRef] [Scilit]
- De Silva, P.; Sagoe-Crenstil, K.; Sirivivatnanon, V. Kinetics of geopolymerization: Role of Al2O3 and SiO2. Cem. Concr. Res. 2007, 37, 512–518. [Google Scholar] [CrossRef] [Scilit]
- Thomas, J.J.; Ghazizadeh, S.; Masoero, E. Kinetic mechanisms and activation energies for hydration of standard and highly reactive forms of β-dicalcium silicate (C2S). Cem. Concr. Res. 2017, 100, 322–328. [Google Scholar] [CrossRef] [Scilit]
- Anderson, M.J.; Whitcomb, P.J. RSM Simplified: Optimizing Processes Using Response Surface Methods for Design of Experiments; Productivity Press: Oxfordshire, UK, 2016. [Google Scholar]
- Myers, R.H.; Montgomery, D.C. Response Surface Methodology. IIE Trans. 1996, 28, 1031–1032. [Google Scholar] [CrossRef] [Scilit]
- Fall, M.; Benzaazoua, M.; Saa, E. Mix proportioning of underground cemented tailings backfill. Tunn. Undergr. Space Technol. 2008, 23, 80–90. [Google Scholar] [CrossRef] [Scilit]
- Behera, S.K.; Mishra, D.P.; Singh, P.; Mishra, K.; Mandal, S.K.; Ghosh, C.N.; Kumar, R.; Mandal, P.K. Utilization of mill tailings, fly ash and slag as mine paste backfill material: Review and future perspective. Constr. Build. Mater. 2021, 309, 125120. [Google Scholar] [CrossRef] [Scilit]
- Du, K.; Liu, M.; Zhou, J.; Khandelwal, M. Investigating the Slurry Fluidity and Strength Characteristics of Cemented Backfill and Strength Prediction Models by Developing Hybrid GA-SVR and PSO-SVR. Min. Metall. Explor. 2022, 39, 433–452. [Google Scholar] [CrossRef] [Scilit]
- Rajendran, N. Controlled Low Strength Materials (CLSM), Reported by ACI COMMITTEE 229; Savannah River Site (SRS): Aiken, SC, USA, 1997.
- Landriault, D.; Verburg, R.; Cincilla, W.; Welch, D. Paste technology for underground backfill and surface tailings disposal applications. In Short Course Notes, Canadian Institute of Mining and Metallurgy; Technical Workshop œ April; Canadian Institute of Mining and Metallergy: Westmount, QB, Canada, 1997. [Google Scholar]
- Feng, G.; Ding, Y.; Zhu, H.; Bai, J. Experimental research on a superhigh-water packing material for mining and its micromorphology. J. China Univ. Min. Technol. 2010, 39, 813–814. [Google Scholar]
- Dave, N.; Misra, A.K.; Srivastava, A.; Kaushik, S. Setting time and standard consistency of quaternary binders: The influence of cementitious material addition and mixing. Int. J. Sustain. Built Environ. 2017, 6, 30–36. [Google Scholar] [CrossRef] [Scilit]
- Khadka, S.D.; Okuyucu, O.; Jayawickrama, P.W.; Senadheera, S. Controlled low strength materials (CLSM) activated with alkaline solution: Flowability, setting time and microstructural characteristics. Case Stud. Constr. Mater. 2023, 18, e01892. [Google Scholar] [CrossRef] [Scilit]
- Kuo, W.-T.; Wang, H.-Y.; Shu, C.-Y.; Su, D.-S. Engineering properties of controlled low-strength materials containing waste oyster shells. Constr. Build. Mater. 2013, 46, 128–133. [Google Scholar] [CrossRef] [Scilit]
- Zhang, F.; Liu, J.; Ni, H.; Li, W.; Liu, Y. Development of coal mine filling paste with certain early strength and its flow characteristics. Geofluids 2021, 2021, 6699426. [Google Scholar] [CrossRef] [Scilit]
- Muhammad, N.Z.; Keyvanfar, A.; Majid, M.Z.A.; Shafaghat, A.; Mirza, J. Waterproof performance of concrete: A critical review on implemented approaches. Constr. Build. Mater. 2015, 101, 80–90. [Google Scholar] [CrossRef] [Scilit]
- Rath, S.; Sakai, Y. Evaluation of the water penetration depth in mortar using water indicator and hyperspectral imaging. Constr. Build. Mater. 2023, 380, 131269. [Google Scholar] [CrossRef] [Scilit]
- Zhang, X.; Li, G.; Niu, M.; Song, Z. Effect of calcium aluminate cement on water resistance and high-temperature resistance of magnesium-potassium phosphate cement. Constr. Build. Mater. 2018, 175, 768–776. [Google Scholar] [CrossRef] [Scilit]
- Yurtdas, I.; Peng, H.; Burlion, N.; Skoczylas, F. Influences of water by cement ratio on mechanical properties of mortars submitted to drying. Cem. Concr. Res. 2006, 36, 1286–1293. [Google Scholar] [CrossRef] [Scilit]
- Hu, J.; Ren, Q.; Jiang, Q.; Gao, R.; Zhang, L.; Luo, Z. Strength characteristics and the reaction mechanism of stone powder cement tailings backfill. Adv. Mater. Sci. Eng. 2018, 2018, 8651239. [Google Scholar] [CrossRef] [Scilit]
- Yongchun, G.; Qiang, X.; Jiangquan, W. Experimental study on engineering criterion of water-physical property of red beds rock. Hydrogeol. Eng. Geol. 2008, 5, 71–74. [Google Scholar]
- Cook, R.A.; Hover, K.C. Mercury porosimetry of hardened cement pastes. Cem. Concr. Res. 1999, 29, 933–943. [Google Scholar] [CrossRef] [Scilit]
- Xu, W.; Lo, Y.T.; Ouyang, D.; Memon, S.A.; Xing, F.; Wang, W.; Yuan, X. Effect of rice husk ash fineness on porosity and hydration reaction of blended cement paste. Constr. Build. Mater. 2015, 89, 90–101. [Google Scholar] [CrossRef] [Scilit]
- Von Konow, T. Aggregate grain size distribution—A major influence on many properties of lime mortars for restoration. In EUROMAT 2003, Symposium P2—Materials and Conservation of Cultural Heritage; EPFL: Lausanne, Switzerland, 2003. [Google Scholar]
- Zheng, K.; Liu, Y.; Huang, W.; Zhou, J.; Cui, D. Reverse filling cementitious materials based on dense packing: The concept and application. Powder Technol. 2020, 359, 152–160. [Google Scholar] [CrossRef] [Scilit]
- Deng, D.; Gao, Y.; Yao, Z.; Yang, Y. Study on settling property of cement-classified tailings filling slurry. Chin. J. Undergr. Space Eng. 2009, 4, 803–807. [Google Scholar]
- Qin, J.; Zheng, J.; Li, L. An analytical solution to estimate the settlement of tailings or backfill slurry by considering the sedimentation and consolidation. Int. J. Min. Sci. Technol. 2021, 31, 463–471. [Google Scholar] [CrossRef] [Scilit]
- Mneina, A.; Soliman, A.; Ahmed, A.; El Naggar, M. Engineering properties of controlled low-strength materials containing treated oil sand waste. Constr. Build. Mater. 2018, 159, 277–285. [Google Scholar] [CrossRef] [Scilit]
- Holt, E.; Leivo, M. Cracking risks associated with early age shrinkage. Cem. Concr. Compos. 2004, 26, 521–530. [Google Scholar] [CrossRef] [Scilit]
- Chen, G.; Yao, N.; Ye, Y.; Fu, F.; Hu, N.; Zhang, Z. Study on the settlement and delamination mechanism and acoustic emission characteristics of mixed aggregate cemented backfill. Constr. Build. Mater. 2023, 408, 133635. [Google Scholar] [CrossRef] [Scilit]
- Katz, A.; Kovler, K. Utilization of industrial by-products for the production of controlled low strength materials (CLSM). Waste Manag. 2004, 24, 501–512. [Google Scholar] [CrossRef] [Scilit] [PubMed]
- Lee, N.K.; Kim, H.K.; Park, I.S.; Lee, H.K. Alkali-activated, cementless, controlled low-strength materials (CLSM) utilizing industrial by-products. Constr. Build. Mater. 2013, 49, 738–746. [Google Scholar] [CrossRef] [Scilit]
- JC/T 2478-2018; Tailings Sand Concrete for Mining Blanket Filling. China’s Ministry of Industry and Information Technology: Beijing, China, 2018.
- Qiu, J.; Luan, X.; Cheng, K.; Guan, X.; Yang, M.; Xiao, Z. Study on the modification effect and mechanism of tailings powder on coal gangue-based mining cementitious filling material. Environ. Sci. Pollut. Res. 2023, 30, 46038–46057. [Google Scholar] [CrossRef] [Scilit] [PubMed]
- Shi, Y.; Zhang, Z.; Sang, Z.; Zhao, Q. Microstructure and composition of red mud-fly ash-based geopolymers incorporating carbide slag. Front. Mater. 2020, 7, 563233. [Google Scholar] [CrossRef] [Scilit]
- Puertas, F.; González-Fonteboa, B.; González-Taboada, I.; Alonso, M.; Torres-Carrasco, M.; Rojo, G.; Martínez-Abella, F. Alkali-activated slag concrete: Fresh and hardened behaviour. Cem. Concr. Compos. 2018, 85, 22–31. [Google Scholar] [CrossRef] [Scilit]
- Choo, H.; Lim, S.; Lee, W.; Lee, C. Compressive strength of one-part alkali activated fly ash using red mud as alkali supplier. Constr. Build. Mater. 2016, 125, 21–28. [Google Scholar] [CrossRef] [Scilit]
- Zhang, T.; Wen, Q.; Gao, S.; Tang, J. Comparative study on mechanical and environmental properties of coal gangue sand concrete. Constr. Build. Mater. 2023, 400, 132646. [Google Scholar] [CrossRef] [Scilit]
- Moussadik, A.; Saadi, M.; Diouri, A. Chemical, mineralogical and thermal characterization of a composite alkali-activated binder based on coal gangue and fly ash. Mater. Today Proc. 2022, 58, 1452–1458. [Google Scholar] [CrossRef] [Scilit]
- Deboucha, W.; Leklou, N.; Khelidj, A.; Oudjit, M.N. Hydration development of mineral additives blended cement using thermogravimetric analysis (TGA): Methodology of calculating the degree of hydration. Constr. Build. Mater. 2017, 146, 687–701. [Google Scholar] [CrossRef] [Scilit]
- Scrivener, K.; Snellings, R.; Lothenbach, B. A Practical Guide to Microstructural Analysis of Cementitious Material; CRC Press: Boca Raton, FL, USA, 2018. [Google Scholar]
- Gameiro, A.; Silva, A.S.; Faria, P.; Grilo, J.; Branco, T.; Veiga, R.; Velosa, A. Physical and chemical assessment of lime–metakaolin mortars: Influence of binder: Aggregate ratio. Cem. Concr. Compos. 2014, 45, 264–271. [Google Scholar] [CrossRef] [Scilit]
- Bellmann, F.; Scherer, G.W. Analysis of CSH growth rates in supersaturated conditions. Cem. Concr. Res. 2018, 103, 236–244. [Google Scholar] [CrossRef] [Scilit]
- Maldonado, F.; Fox, A.G. Microstructure, Composition and Crystallography of Aalbrog Lion Brand Danish White Cement. Master’s Thesis, Naval Postgraduate School, Monterey, CA, USA, 1997. [Google Scholar]
- Zhang, Z.; Scherer, G.W.; Bauer, A. Morphology of cementitious material during early hydration. Cem. Concr. Res. 2018, 107, 85–100. [Google Scholar] [CrossRef] [Scilit]
- Xu, B.; Liu, Q.; Ai, B.; Ding, S.; Frost, R.L. Thermal decomposition of selected coal gangue. J. Therm. Anal. Calorim. 2018, 131, 1413–1422. [Google Scholar] [CrossRef] [Scilit]
- Van Ngo, T.; Thi Thu Nguyen, N.; Le, B.H.; Tran, M.Q.; Hoang, V.H.; Tran, B.H. Development of Green Ultra High Performance Concrete with low cement content using mineral powders and nano-silica extracted from rice husk ash. Case Stud. Constr. Mater. 2025, 23, e05537. [Google Scholar] [CrossRef] [Scilit]
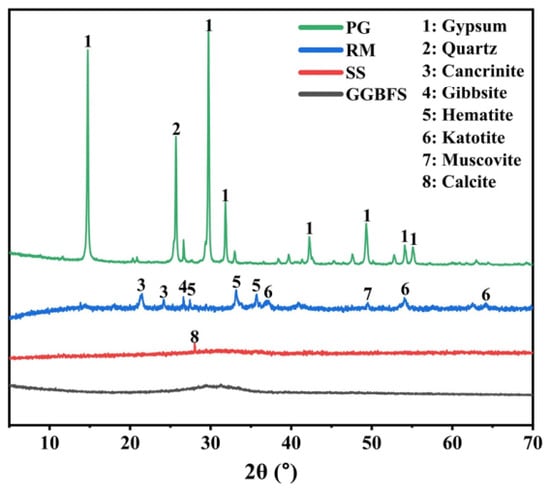
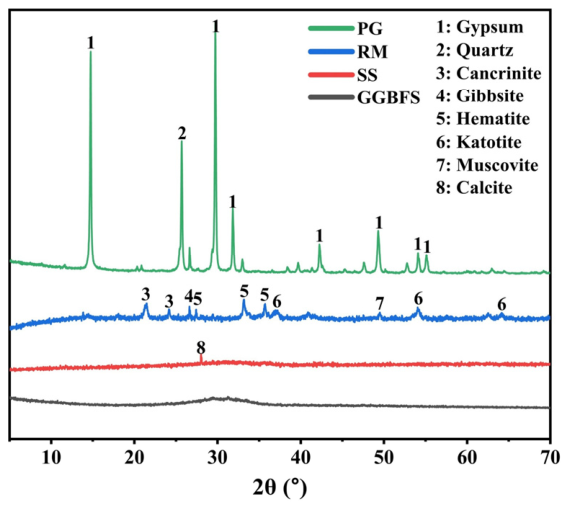
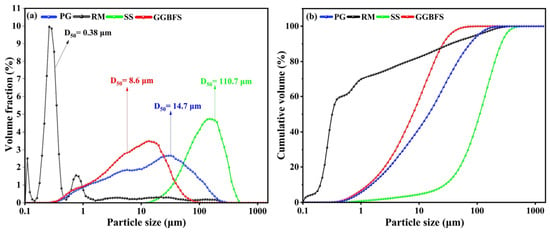
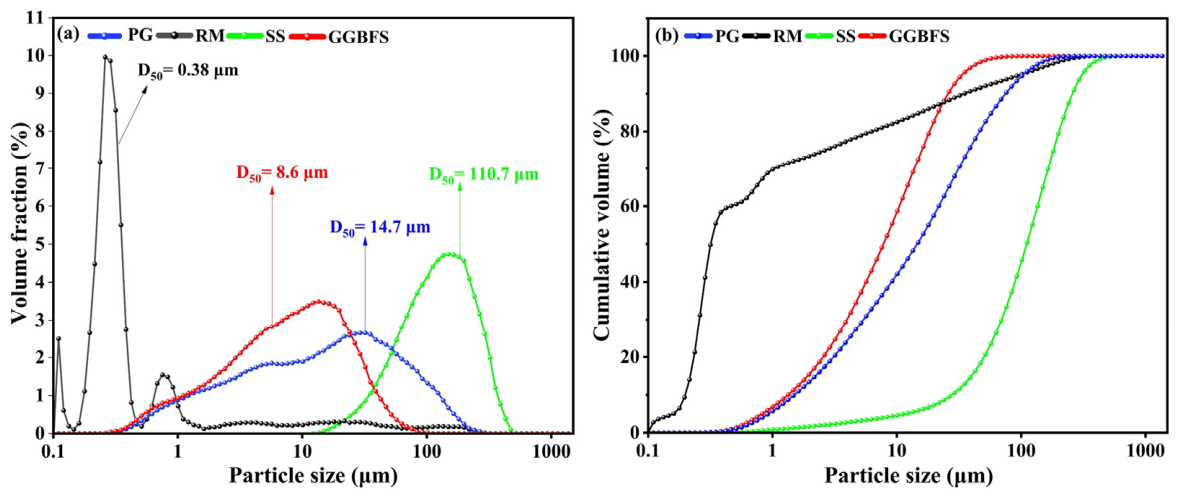
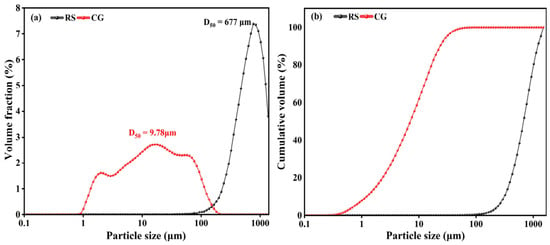
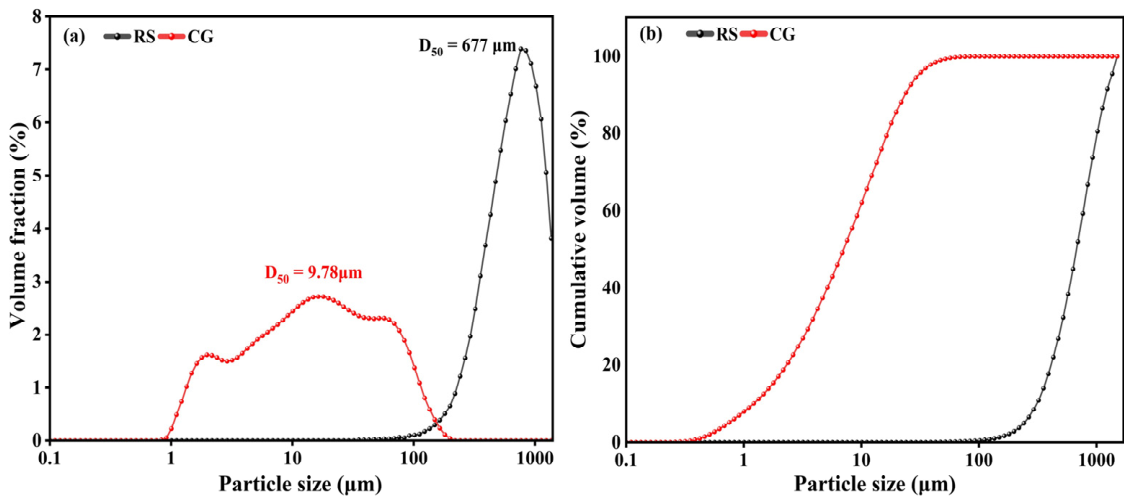
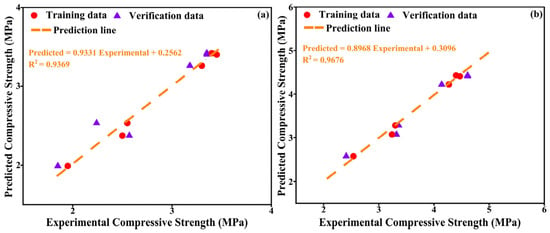
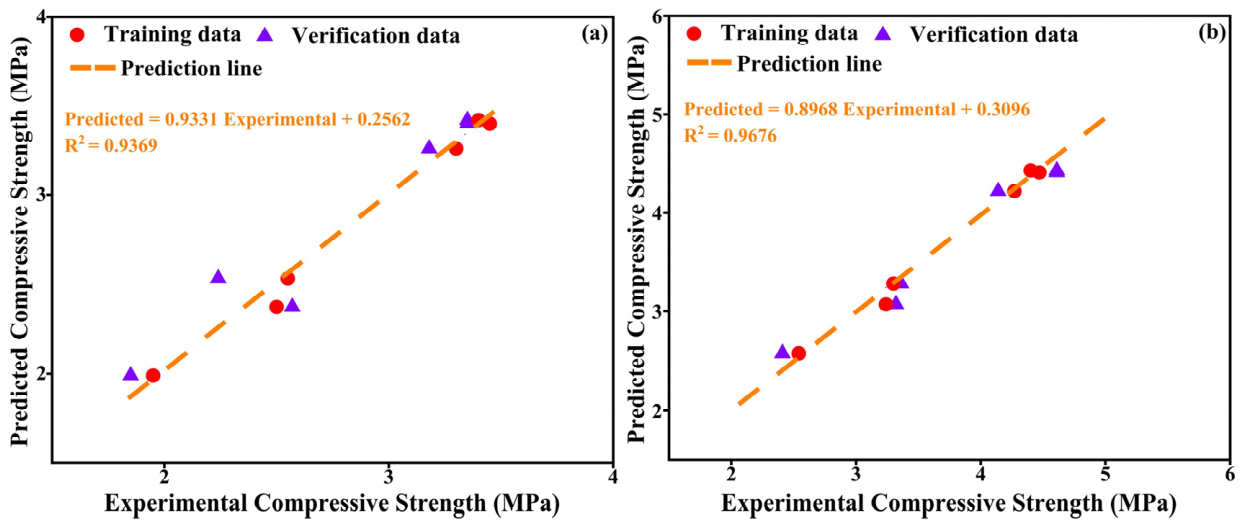
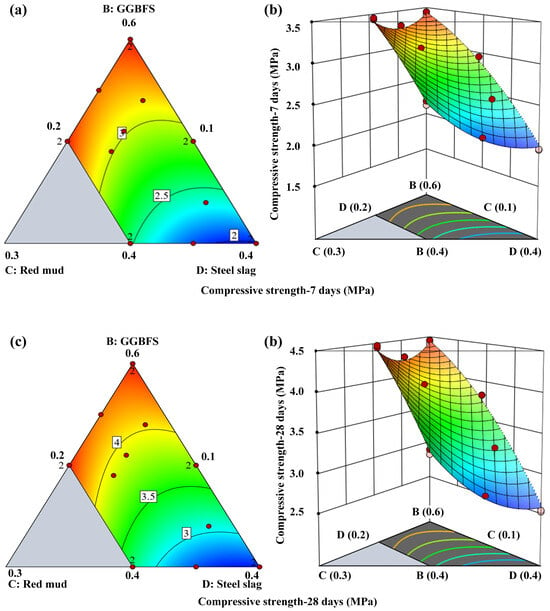
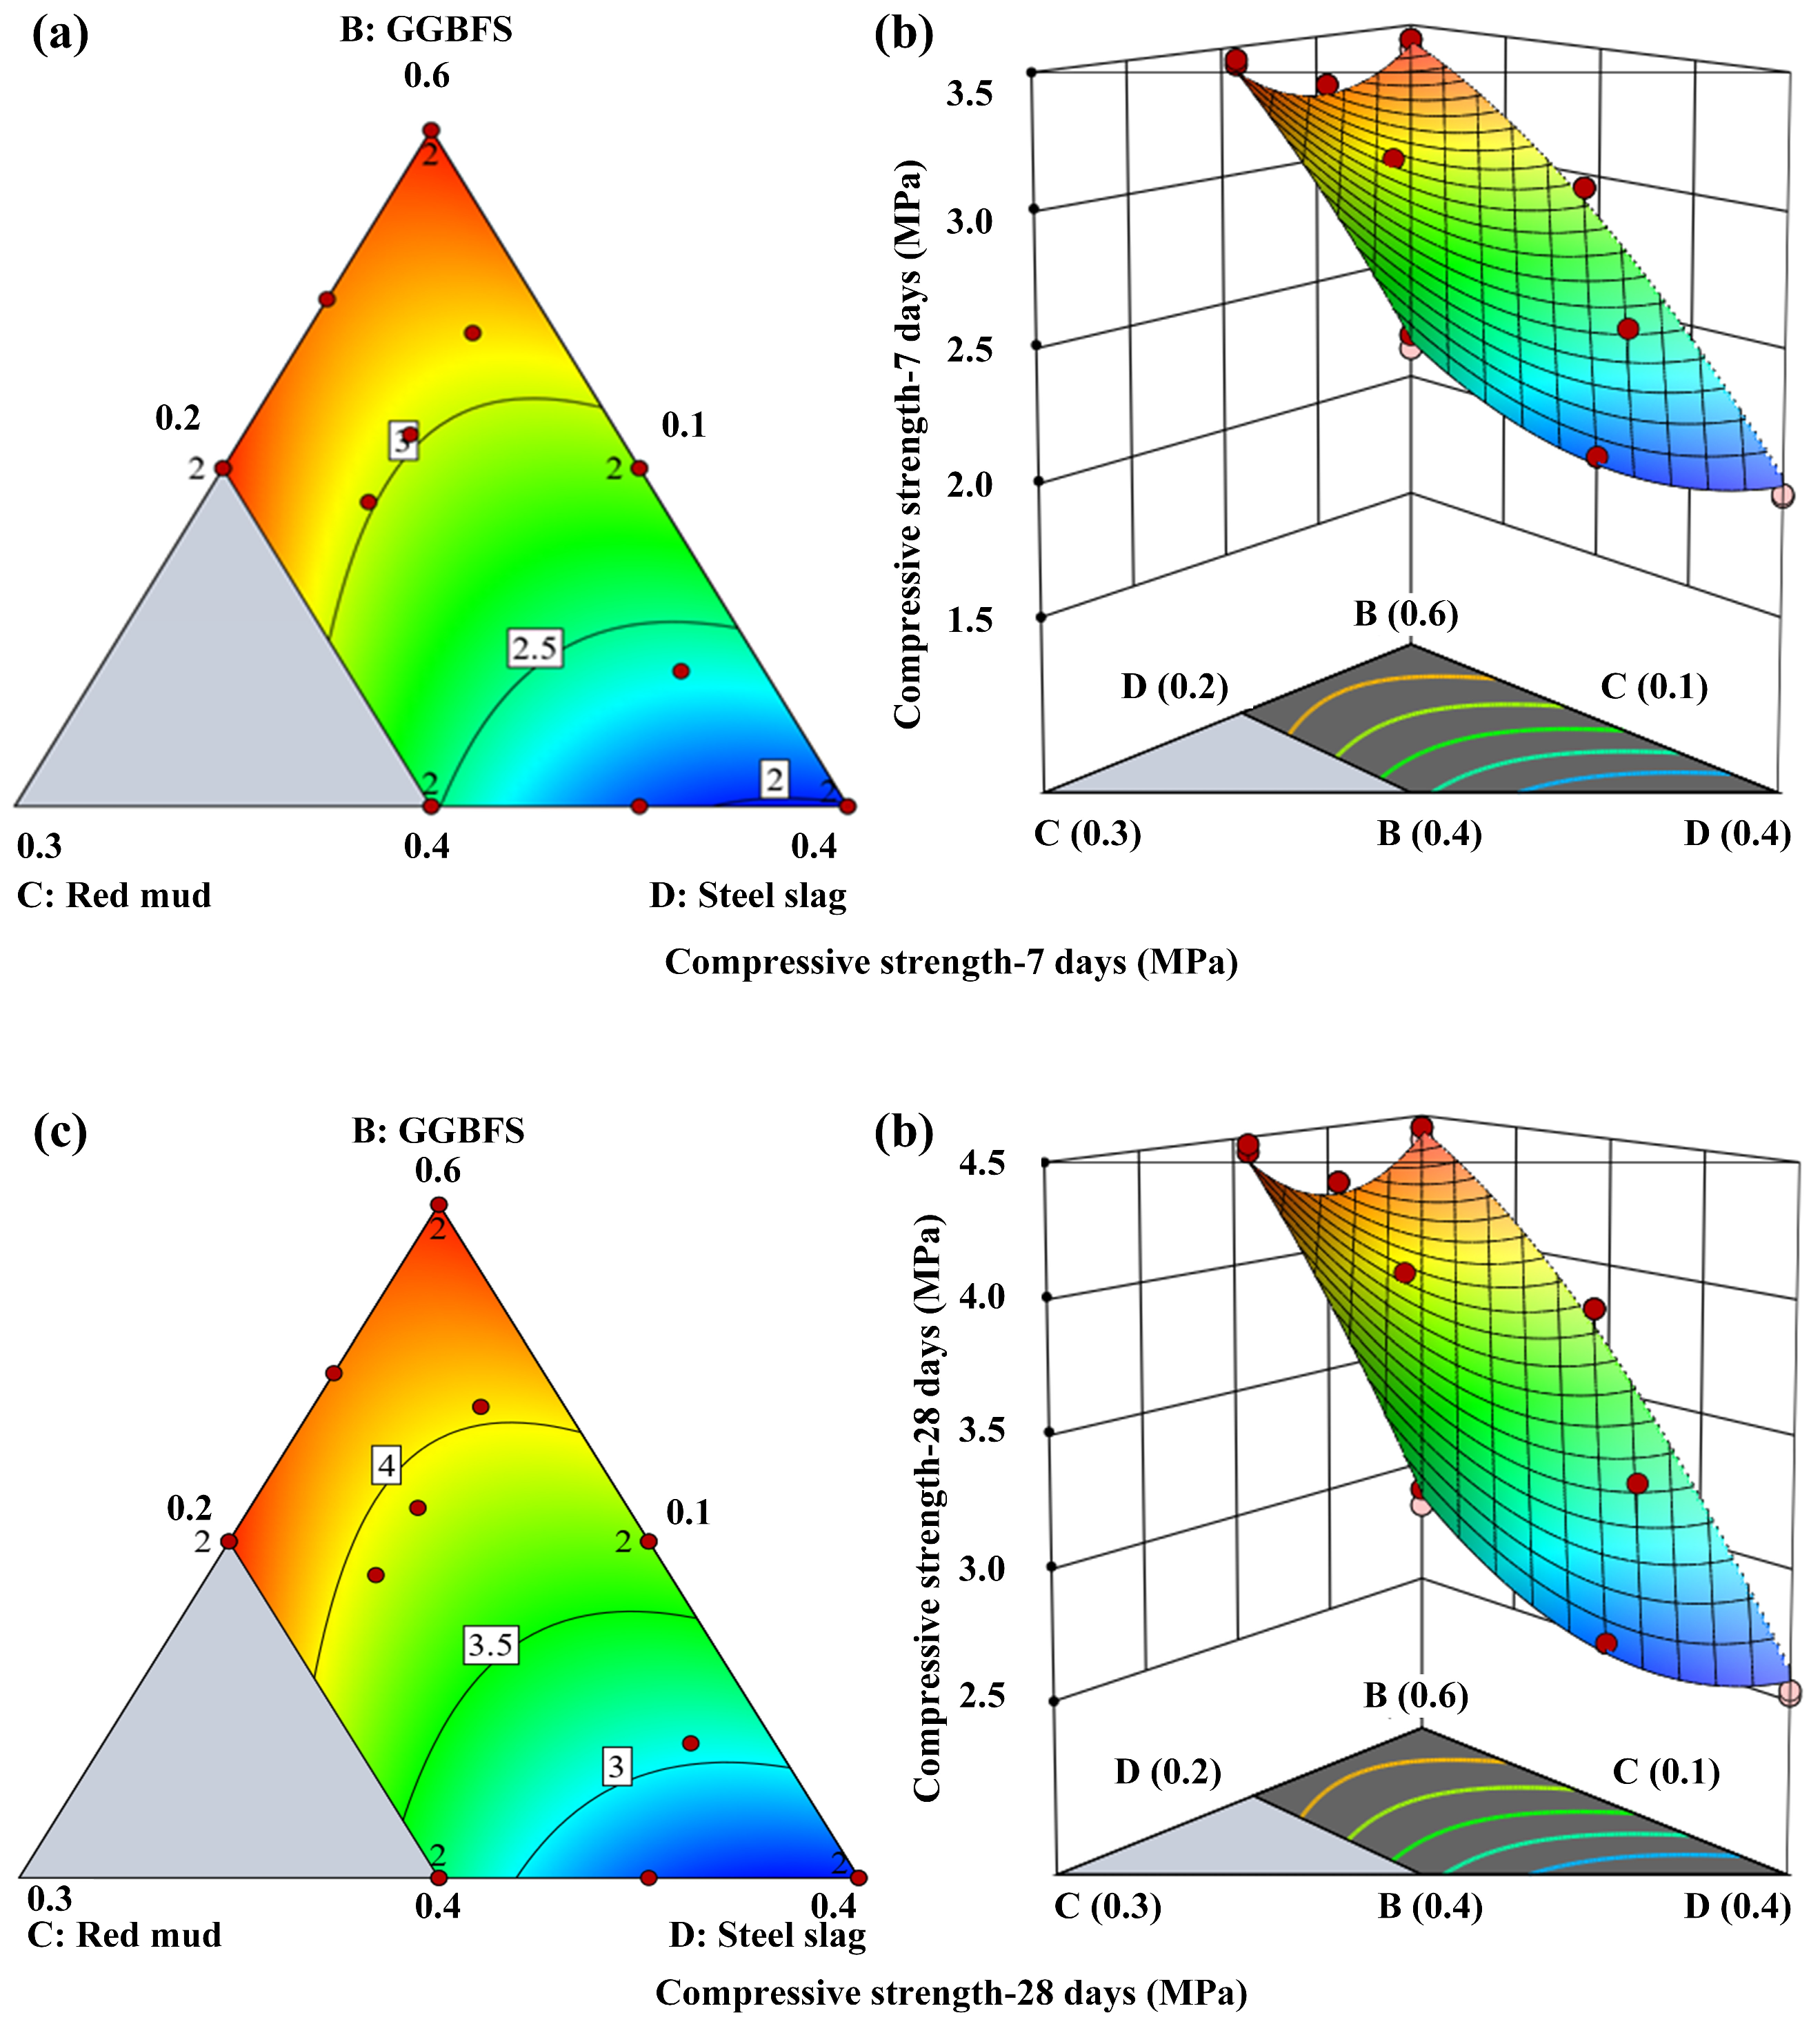
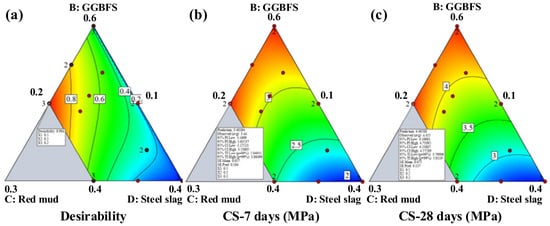
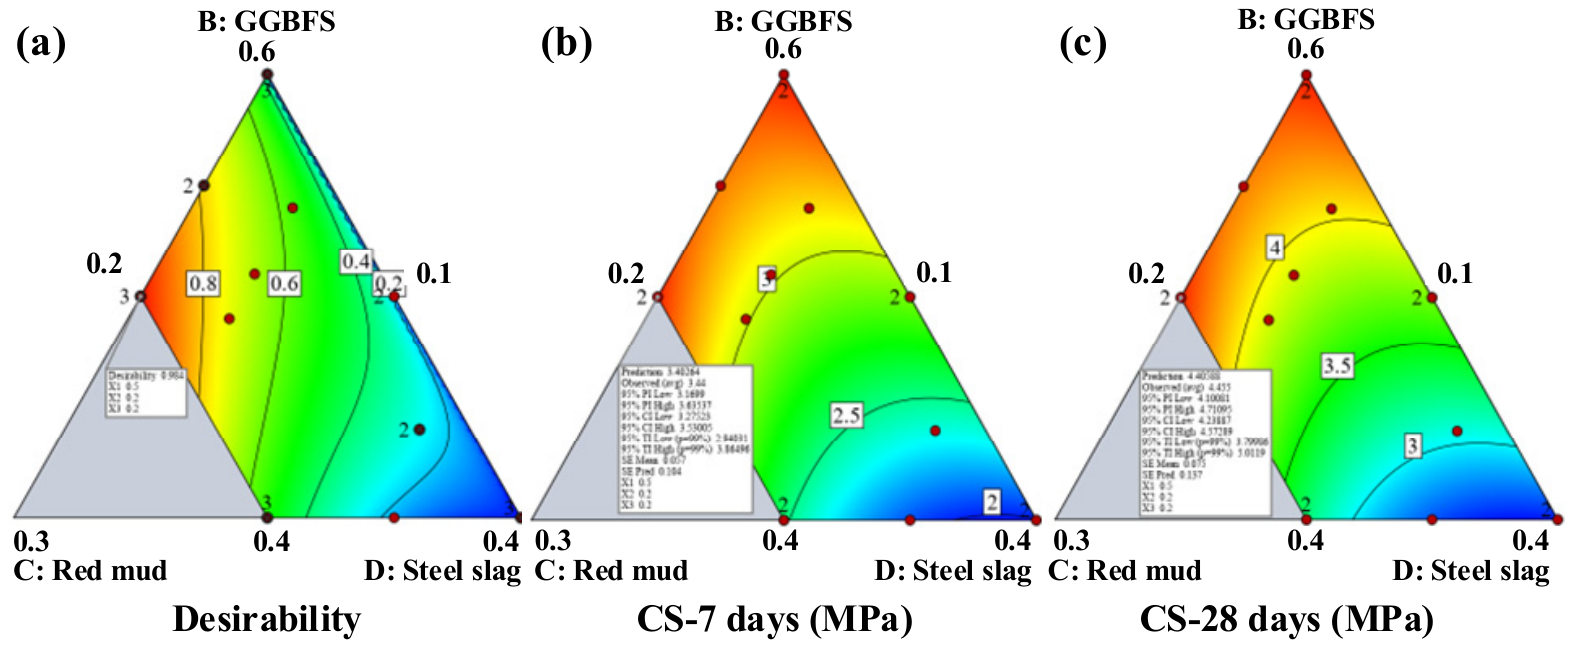
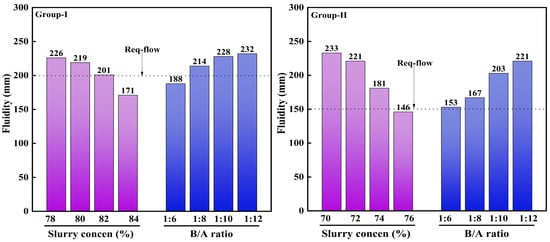
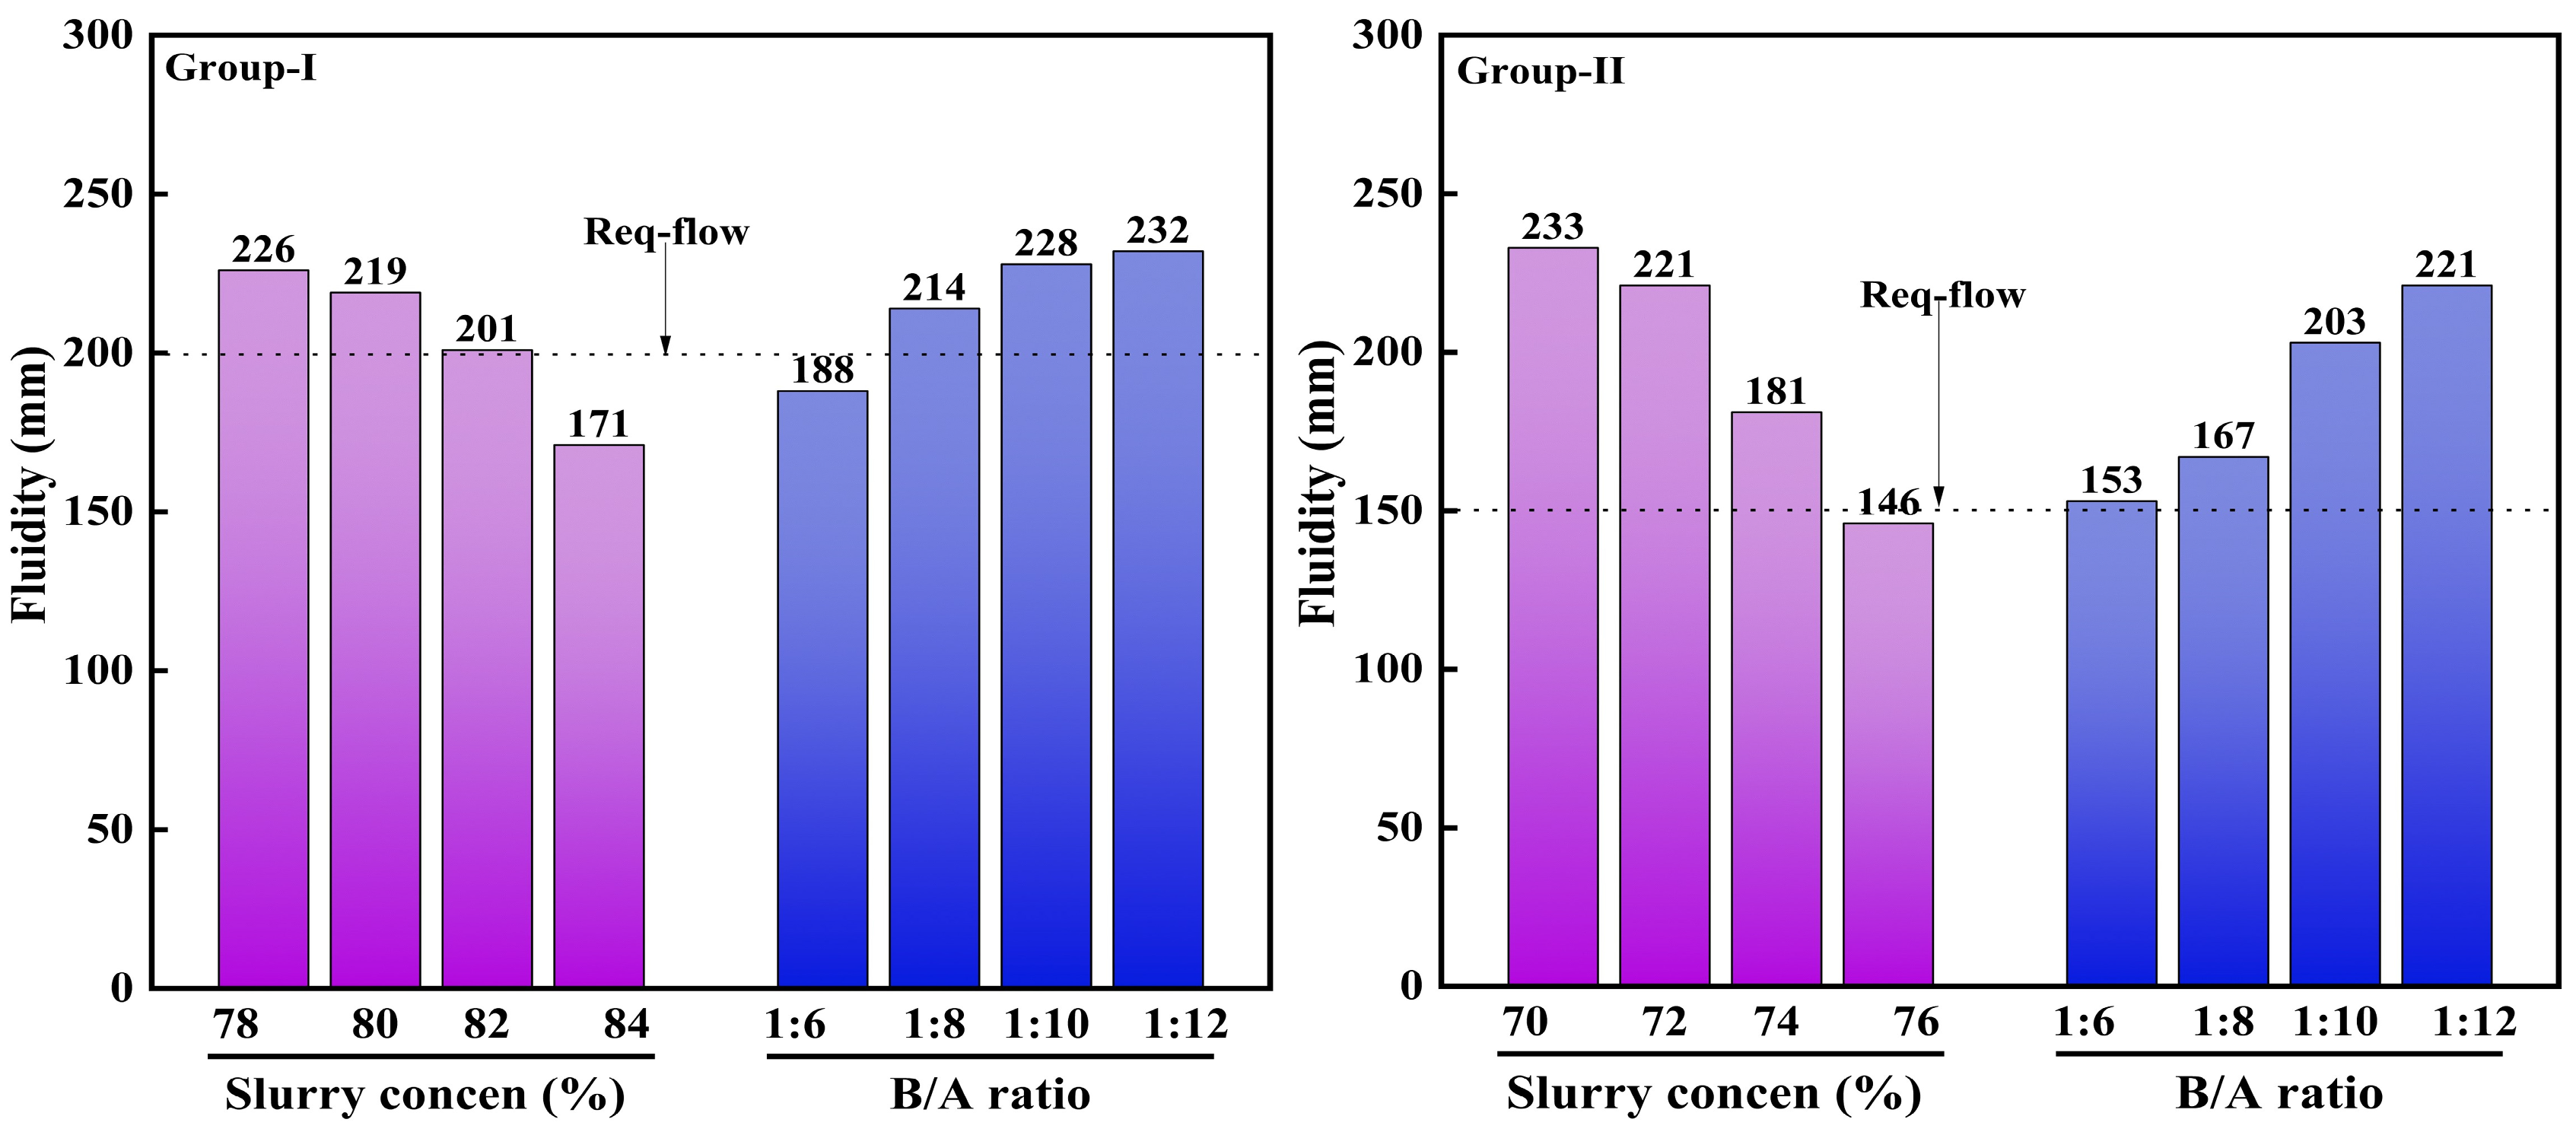
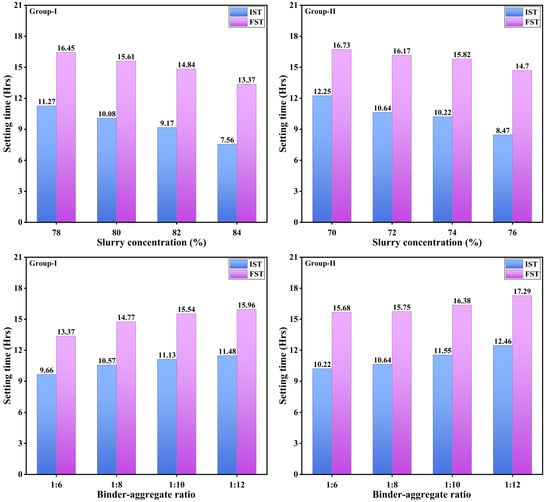
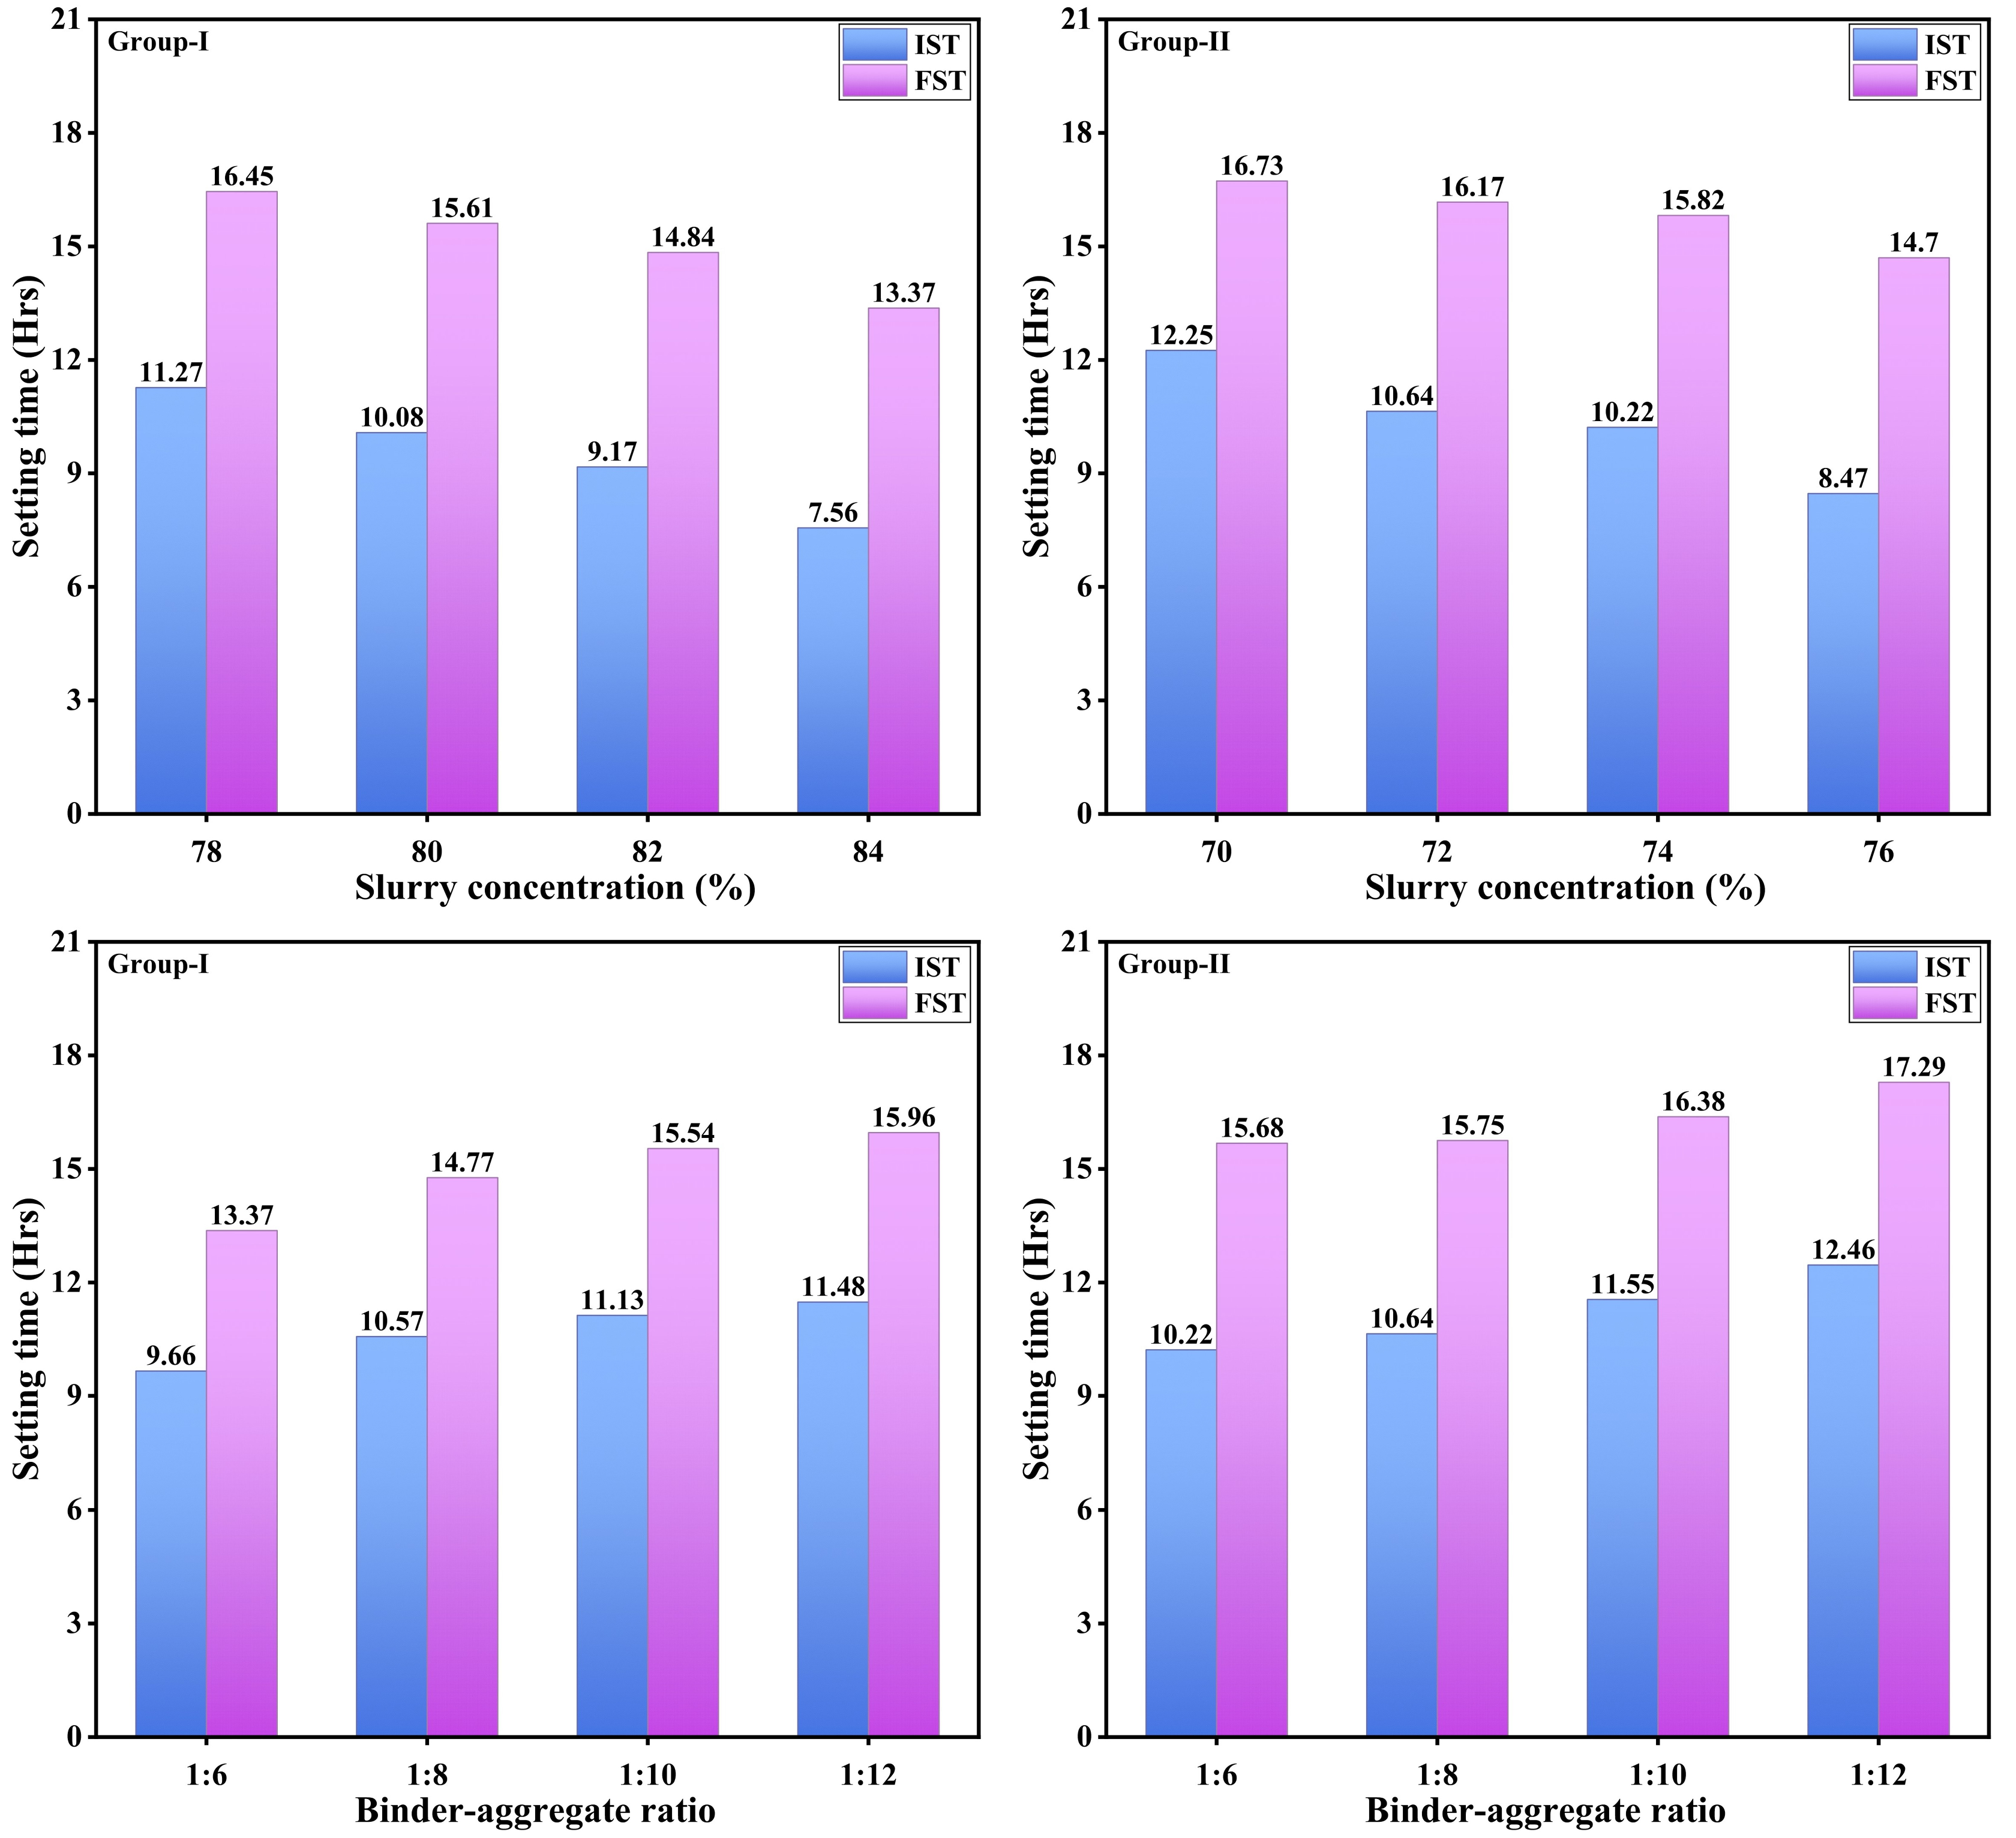
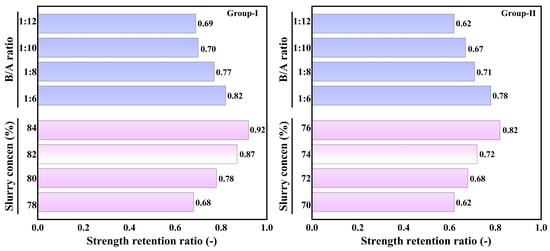
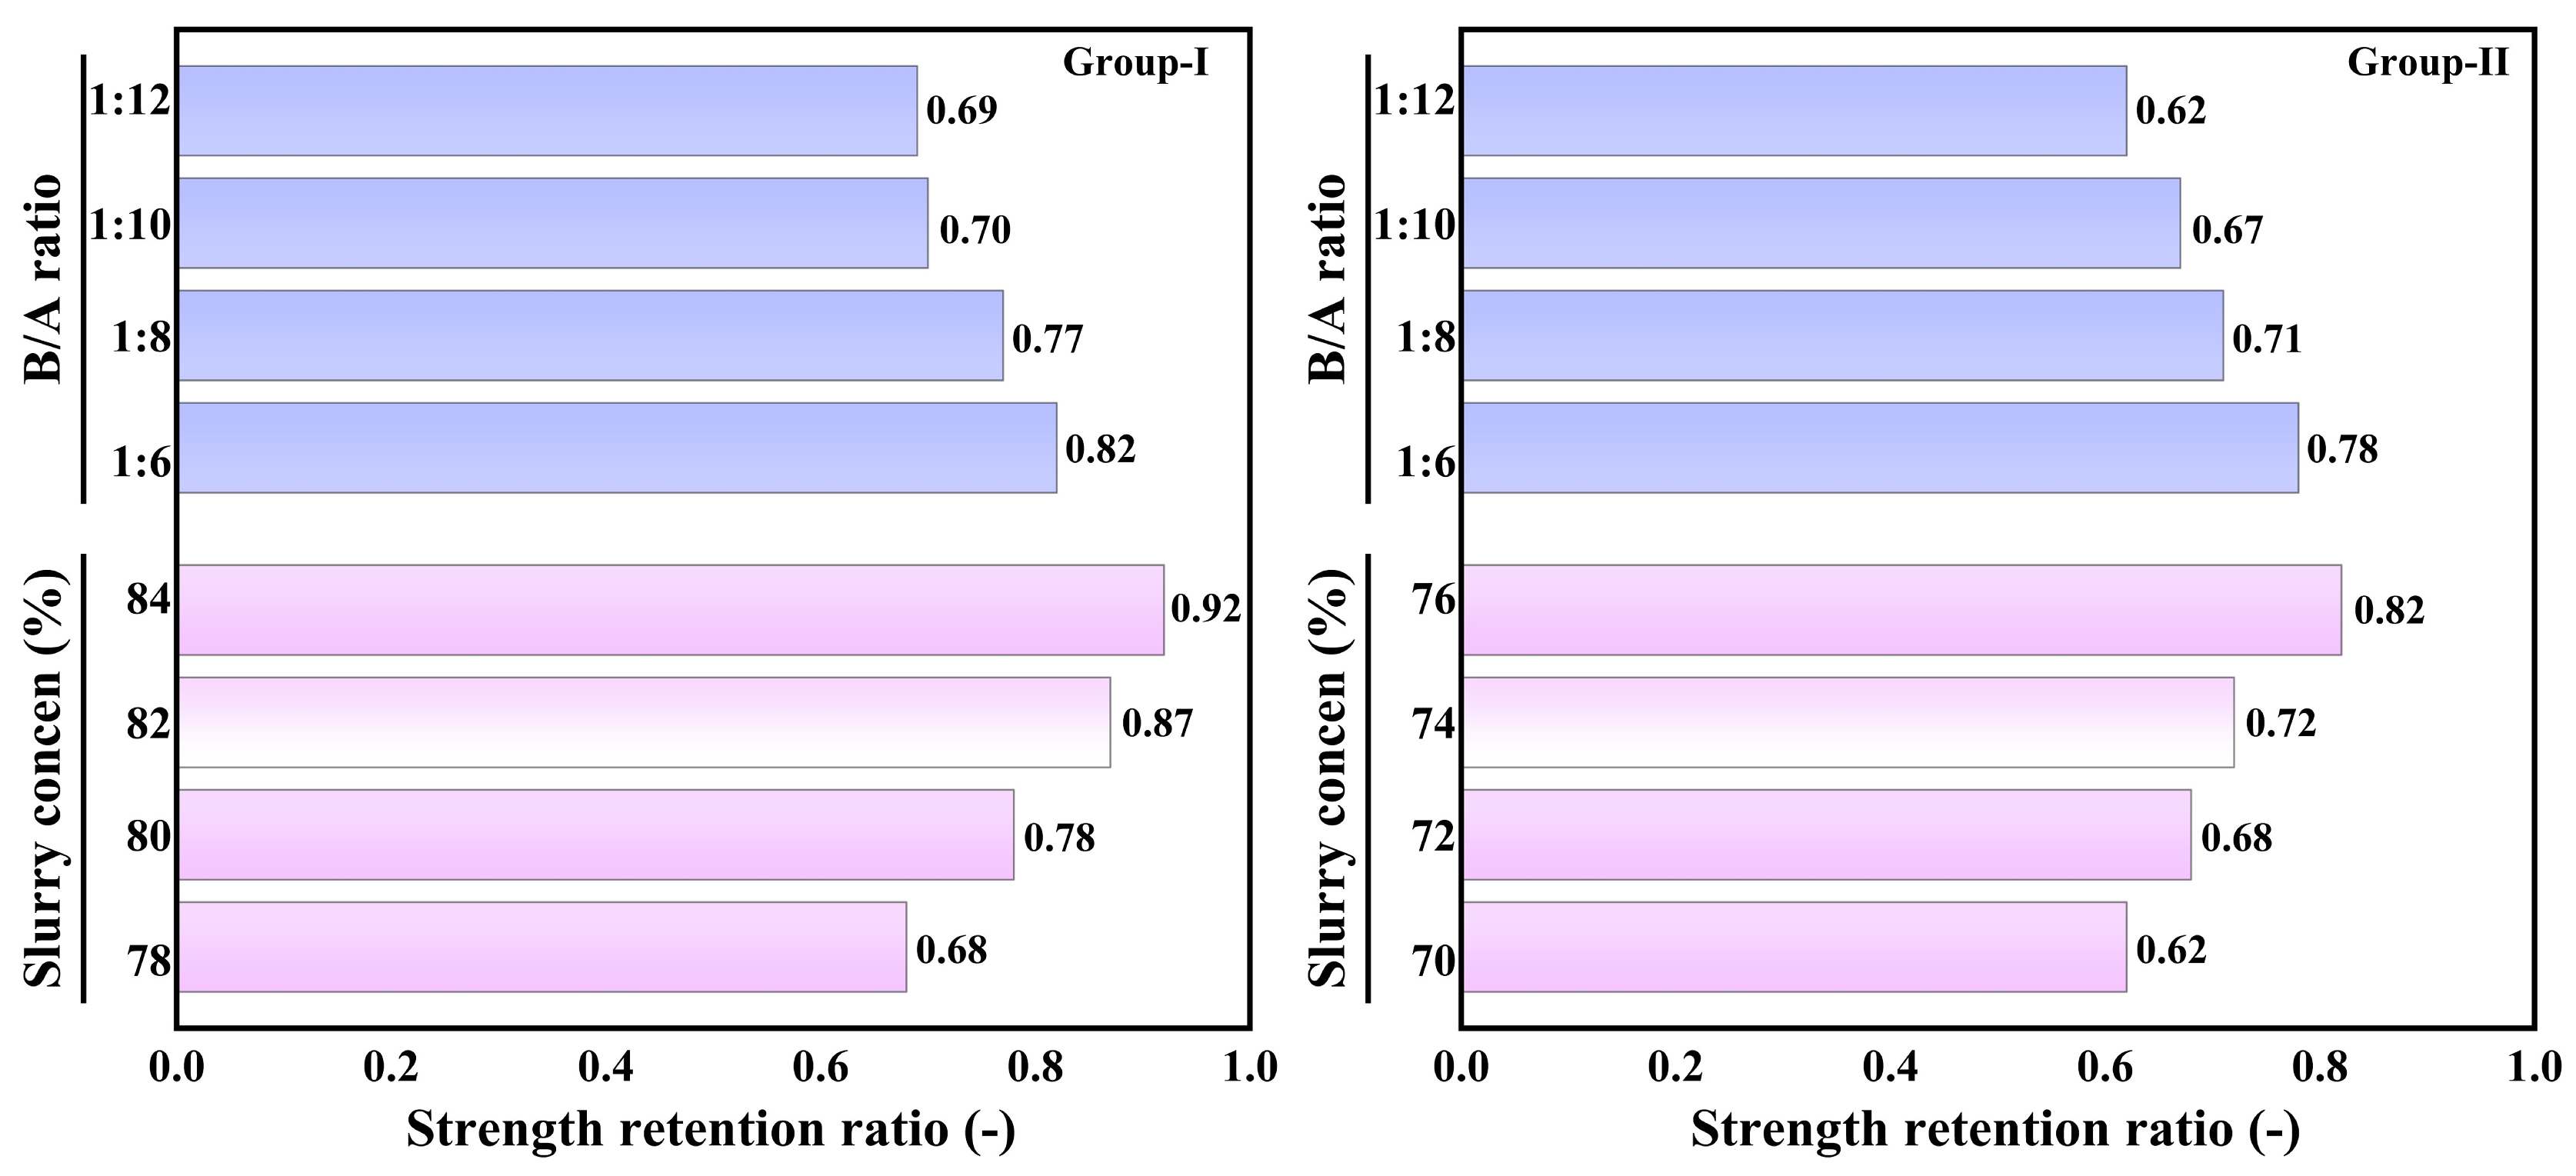
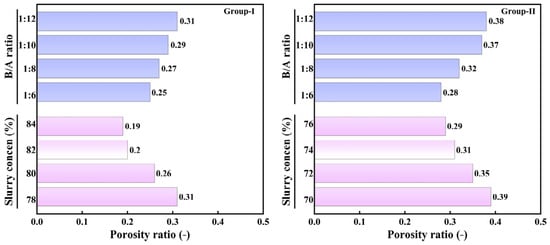
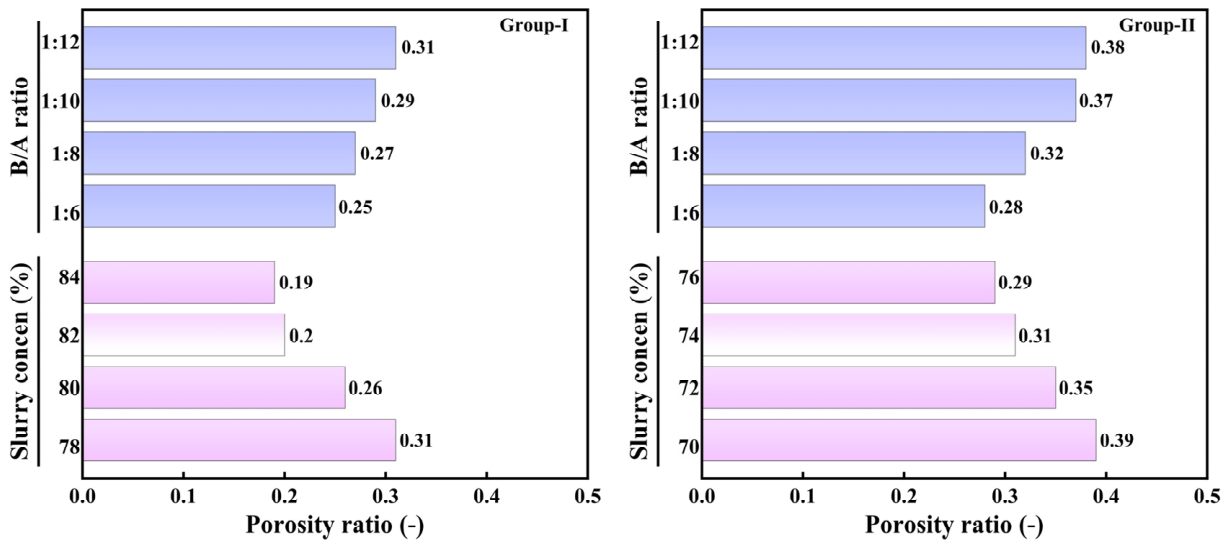
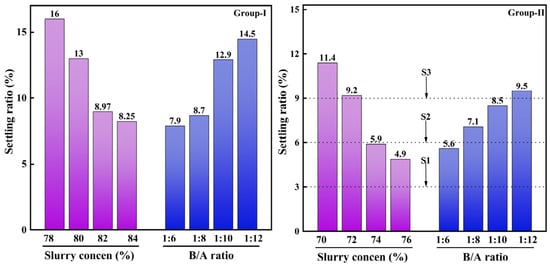
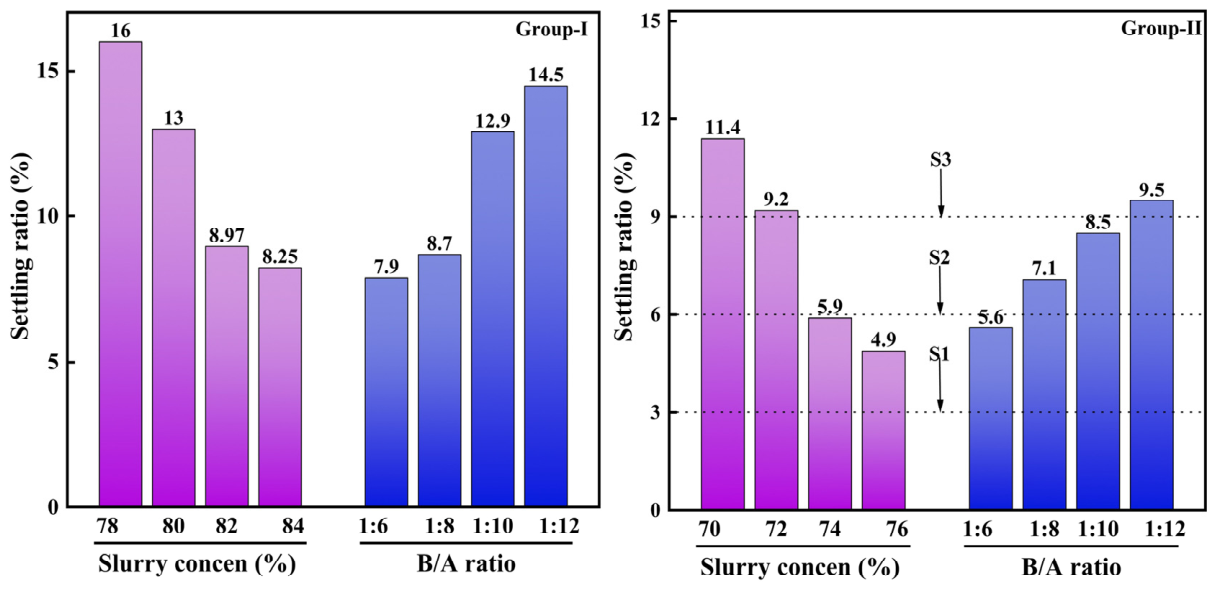
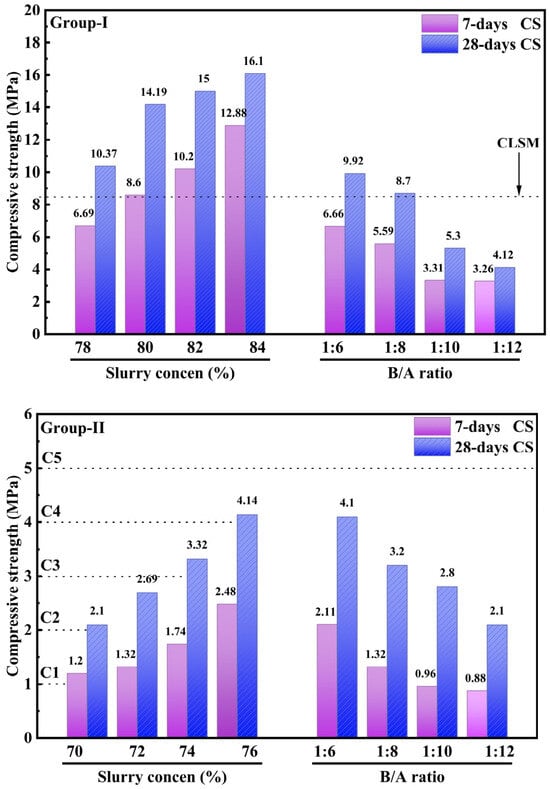
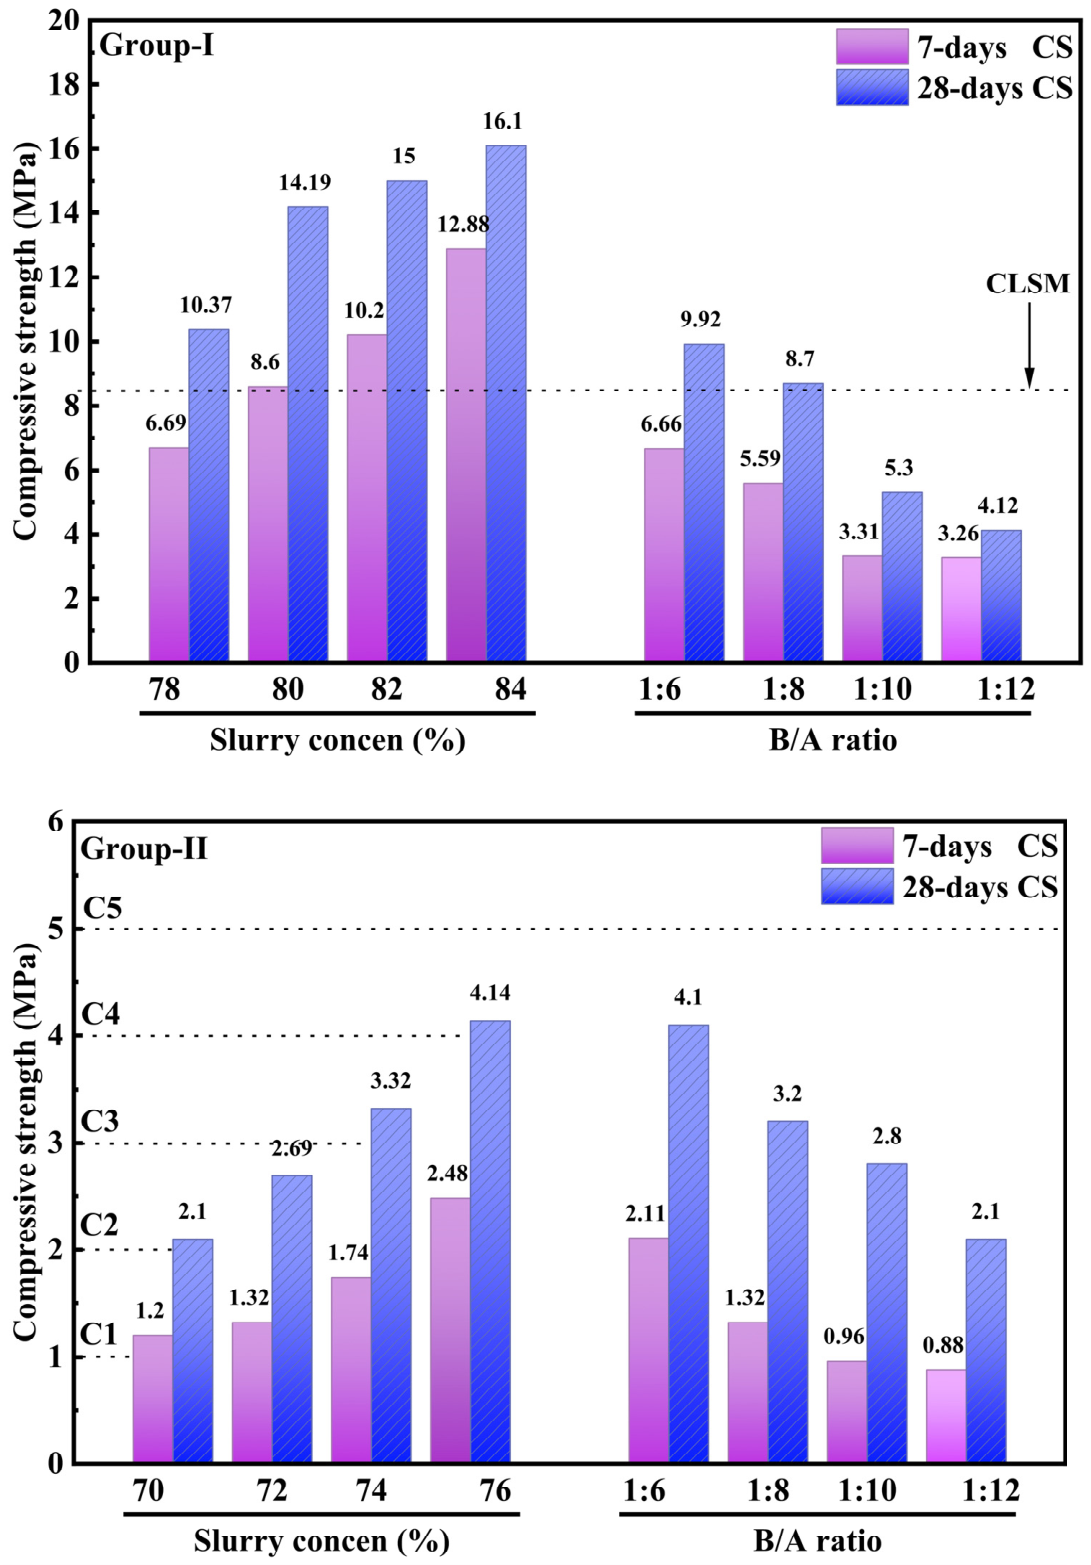
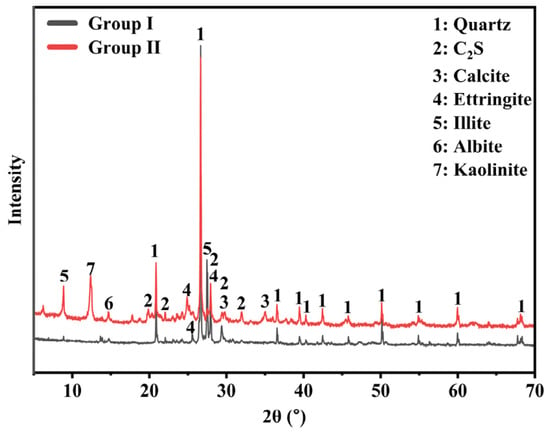
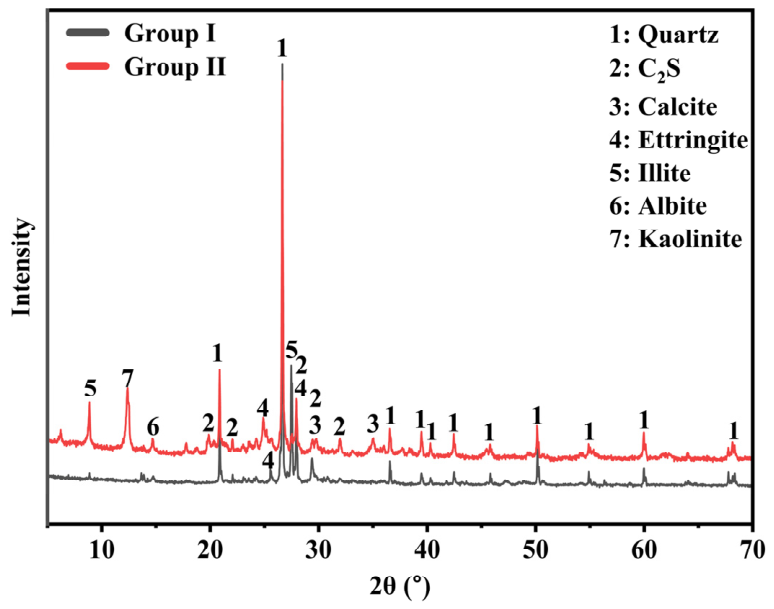
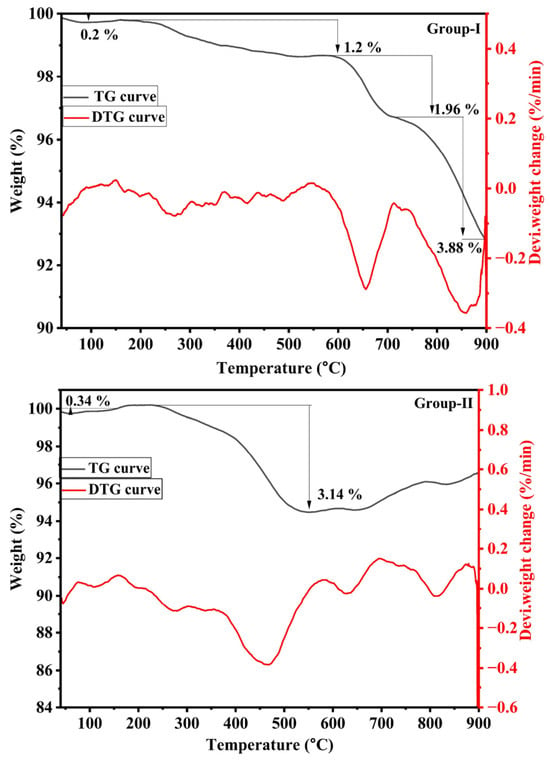
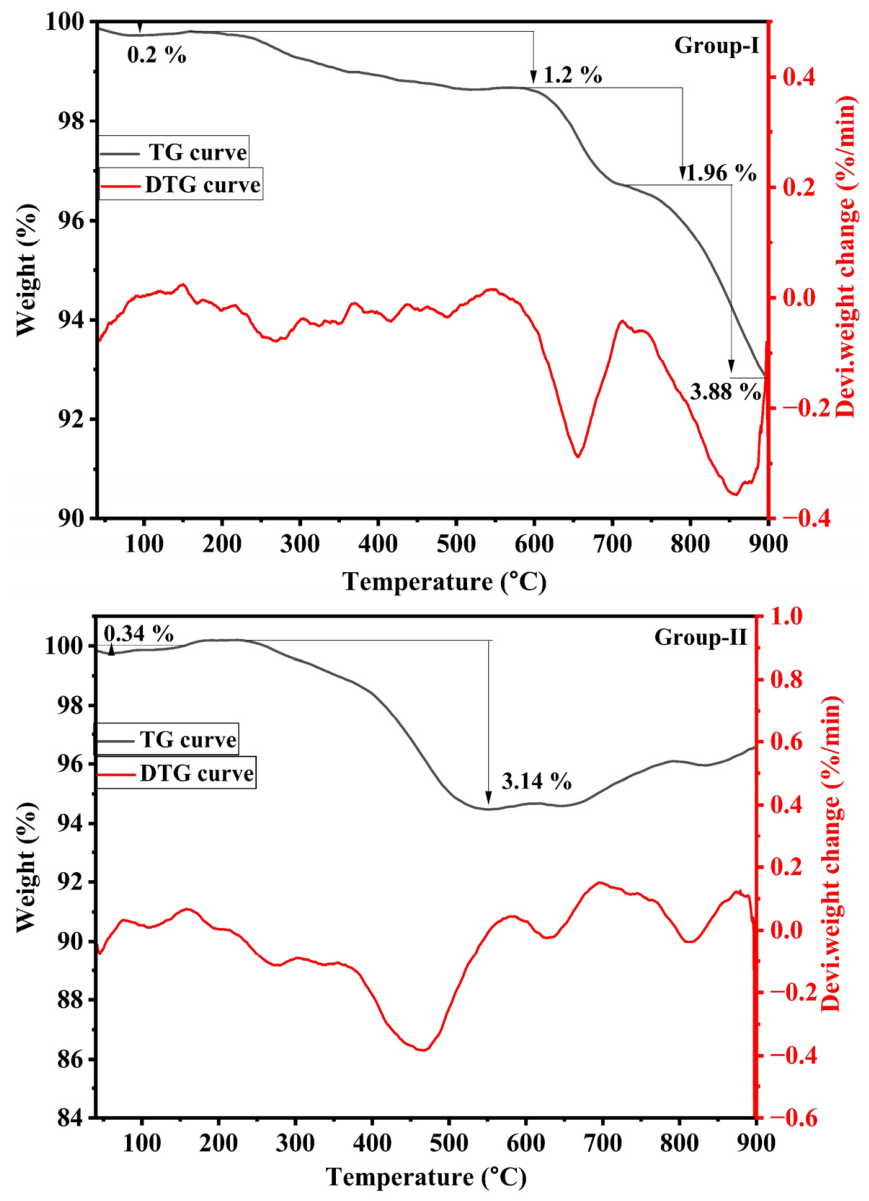
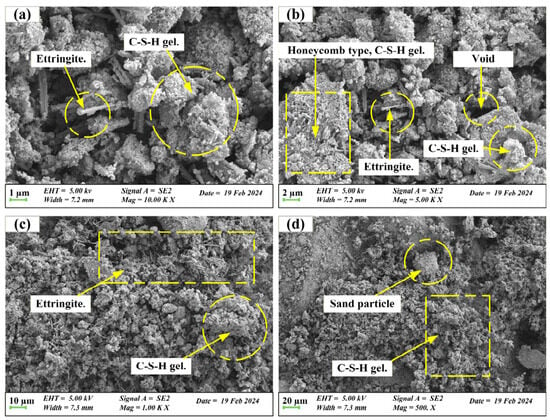
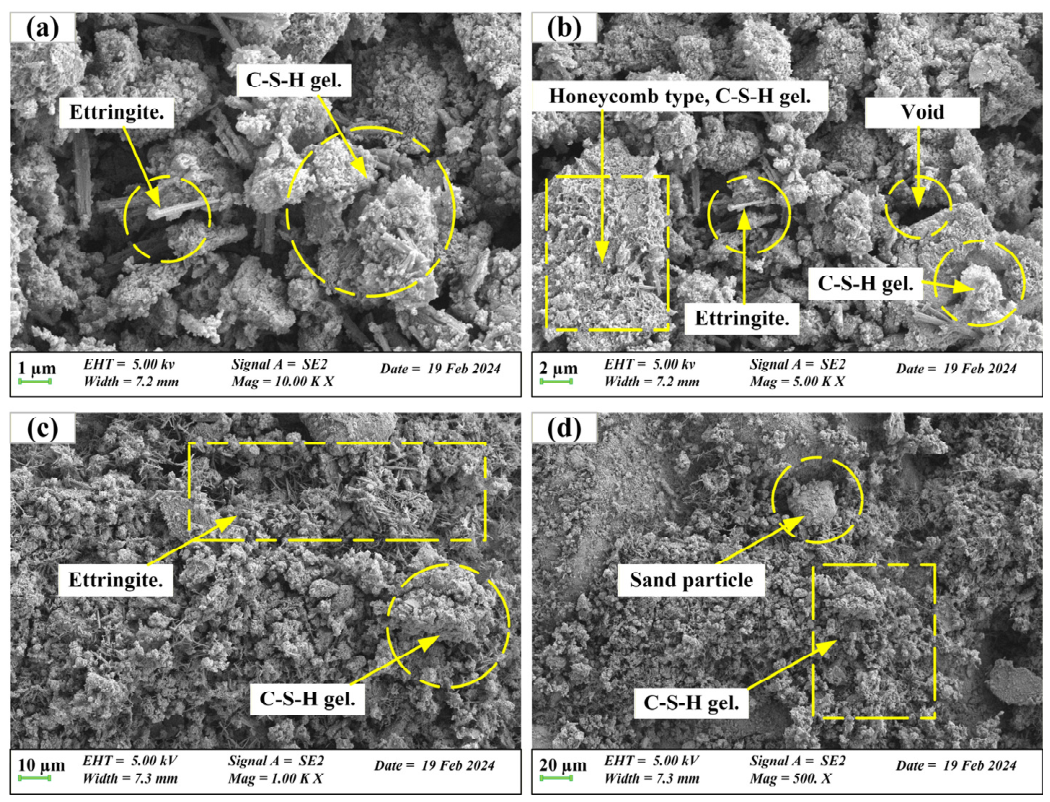
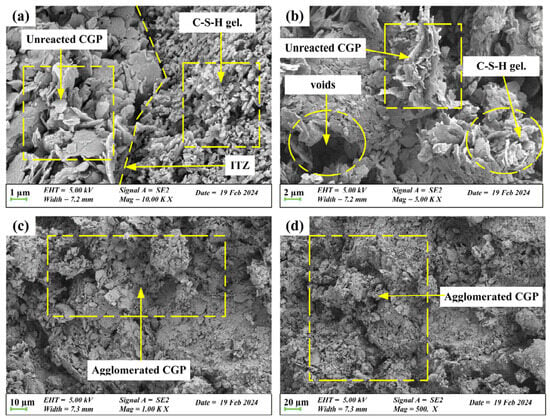
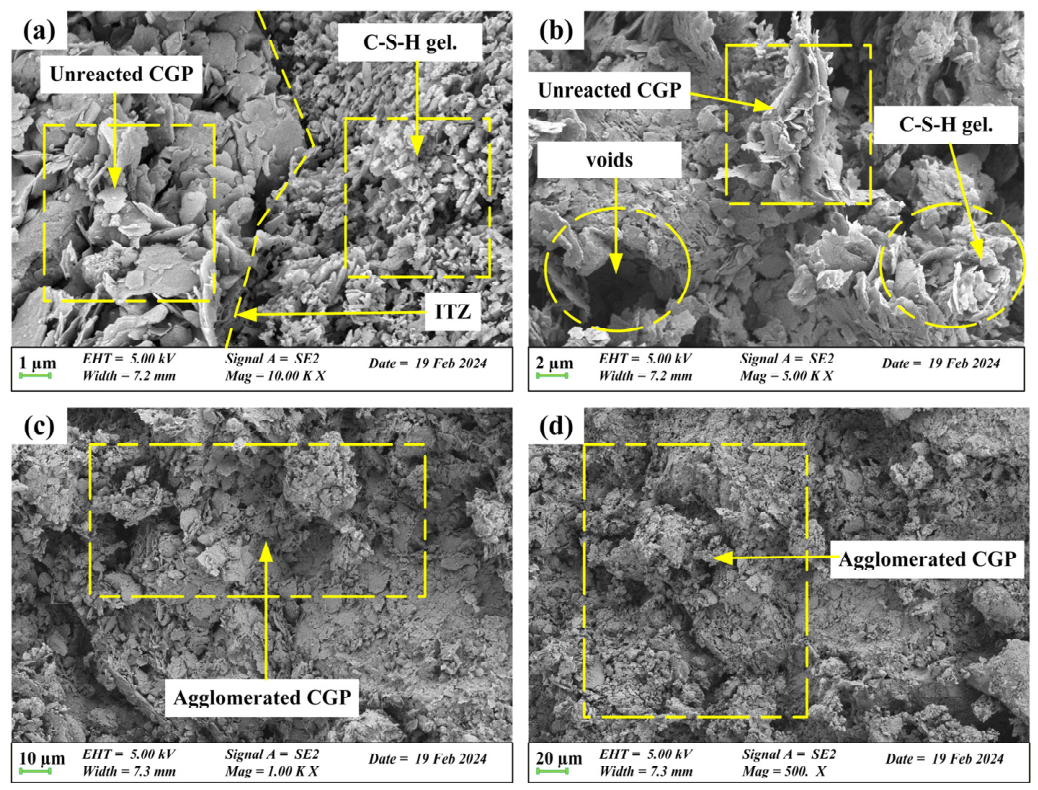

Disclaimer/Publisher’s Note: The statements, opinions and data contained in all publications are solely those of the individual author(s) and contributor(s) and not of MDPI and/or the editor(s). MDPI and/or the editor(s) disclaim responsibility for any injury to people or property resulting from any ideas, methods, instructions or products referred to in the content. |
© 2026 by the authors. Licensee MDPI, Basel, Switzerland. This article is an open access article distributed under the terms and conditions of the Creative Commons Attribution (CC BY) license.