


Abstract
Transmission line monitoring is undergoing a significant transformation driven by the increasing demand for enhanced grid utilization, Dynamic Line Rating (DLR), and cost-effective monitoring solutions. However, the large-scale deployment of physical monitoring devices remains constrained by installation and maintenance time and costs. This paper presents the development and validation of an artificial neural network (ANN)-based Digital Twin (DT) framework for conductor temperature monitoring through virtual sensing. The investigated approach is part of a multi-layer Digital Twin architecture that integrates data preparation, virtual sensing, and DLR applications into a unified monitoring concept. The research was conducted within the Horizon Europe TwinEU project using datasets collected from three power system operators operating overhead lines at voltage levels between 132 kV and 400 kV. The developed ANN models applied weather observations and SCADA-derived loading data as inputs, while conductor temperature measurements obtained from physical sensors served as training and validation targets. To enhance robustness and generalization, different data-splitting methodologies, normalization techniques, and site-specific hyperparameter optimization strategies were investigated using a Bayesian optimization framework. The results demonstrate that ANN-based virtual sensors can reproduce conductor temperature measurements with high accuracy, achieving RMSE values of 0.791–1.087 °C, when sufficient high-quality training data are available. The study also highlights the importance of local weather measurements and seasonally representative datasets for reliable model performance. The findings confirm that DT technologies can partially substitute physical monitoring assets without significant loss of accuracy, reducing monitoring complexity and operational costs. The proposed approach offers a practical pathway toward scalable transmission line monitoring and provides a foundation for future applications in DLR, ampacity calculation, market-oriented grid operation, and asset management.
1. Introduction
Electric power systems are operated by system operators (SOs) under increasingly demanding conditions [1]. While reliability and continuity of supply remain the primary operational objectives, a significant proportion of existing network assets, particularly overhead line infrastructure, has been in service for several decades. Overhead lines constitute the most extensive component of the transmission and distribution network, yet their operation is still largely based on conservative engineering principles and static operating limits [2]. At the same time, emerging developments, including the rapid deployment of renewable energy sources (RESs), the expansion of artificial intelligence (AI) data centers, and the increasing penetration of electric vehicle (EV) fast-charging infrastructure, are creating unprecedented requirements for network flexibility [3,4,5]. These trends result in highly dynamic power-flow patterns, with demand ramps ranging from several hundred kilowatts to tens of megawatts within seconds to minutes, requiring more adaptive operational constraints than traditional approaches can provide.
The thermal capability of overhead lines has historically been determined using static line rating (SLR) methodologies based on conservative steady-state assumptions [6]. Although this approach ensures a high level of operational security, it often underutilizes the conductors’ available transmission capacity [7]. Simultaneously, under adverse environmental conditions, particularly during hot summer periods, actual thermal limits may be exceeded, leading to excessive conductor sag and potential clearance violations [8]. Consequently, conventional thermal rating methods not only leave significant transmission capacity reserves untapped but may also fail to accurately represent real operating risks. These limitations have stimulated growing interest in dynamic line rating (DLR) technologies that continuously assess the thermal state of conductors and provide more realistic estimates of permissible power transfer capacity [9].
In recent years, line monitoring systems have become increasingly widespread among system operators [10,11]. However, the successful deployment of such systems requires comprehensive technical, economic, and regulatory preparation [8]. The implementation process typically begins with a network-wide assessment to identify bottleneck lines where additional transmission capacity can generate the greatest operational value [11]. This is followed by detailed critical span analyses to determine the representative spans that must be instrumented to ensure reliable monitoring of conductor temperature, sag, and clearance. Once the required number of monitoring locations has been established, the procurement and integration of hardware and software components can proceed. Beyond physical monitoring devices, digital twin technologies are emerging as cost-effective alternatives that complement or partially replace conventional sensor-based solutions [12]. The performance of these systems depends not only on the quality of field measurements but also on the accuracy of algorithms used for ampacity and clearance calculations, particularly when forecasting future transmission capacity.
Although DLR technologies have demonstrated substantial technical potential, their adoption among system operators has remained largely limited to pilot and demonstration projects. To accelerate large-scale deployment, the European Union-funded TwinEU project has developed a digital twin-based DLR solution that offers both economic and technical advantages [13]. The present study focuses on evaluating a neural network-based virtual sensing methodology developed within the project, examining the performance metrics required to assess its accuracy and suitability for operational applications. In contrast to existing approaches that primarily investigate virtual sensing for individual lines or sites, the proposed methodology is applied consistently across datasets from three different system operators, with site-specific models developed and optimized using the same methodological framework. The scientific contribution of this research lies in the systematic investigation of data-splitting methodologies, normalization techniques, and site-specific hyperparameter optimization for ANN-based conductor temperature virtual sensing, providing insight into the factors affecting model accuracy and generalization.
The remainder of the manuscript is organized as follows: Section 2 describes the identified gap in the field of line monitoring systems, Section 3 presents the concept of digital twins, Section 4 presents the developed ANN-based virtual sensing methodology, Section 5 presents the obtained results, and Section 6 discusses the main findings of the study. The methodological development, analysis, validation, and interpretation presented in these sections reflect the collaborative contributions of the authors, as detailed in the Author Contributions statement.
2. The Identified Gap—Limitations in Line Monitoring Systems
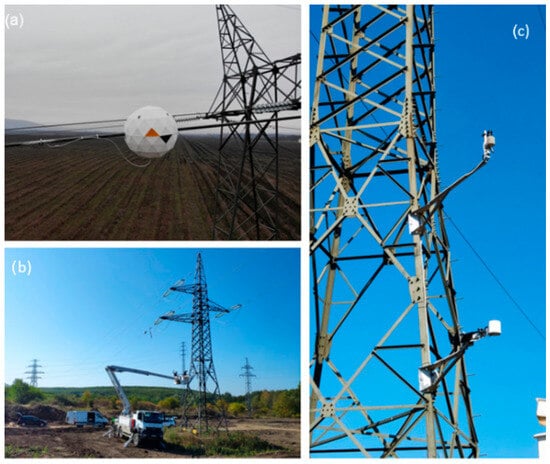
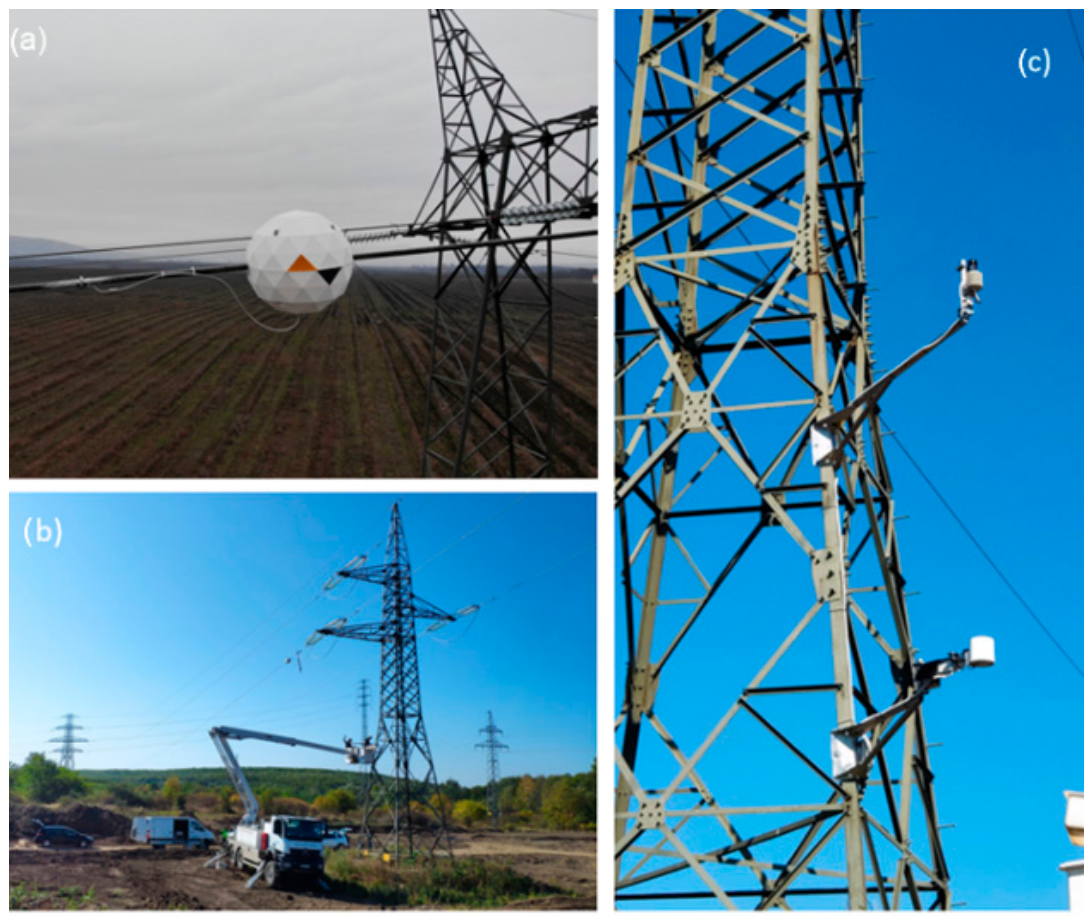
Despite the increasing maturity of DLR technologies, several challenges continue to hinder widespread implementation [8]. One of the most significant technical issues is determining the optimal number and placement of monitoring devices when field and technical data are lacking. Reliable operation requires identifying thermally critical spans [14,15]; however, local environmental factors, including terrain characteristics and microclimatic conditions, often create hot spots that conventional planning approaches cannot accurately predict. Furthermore, clearance assessment must consider not only conductor-to-ground distances but also clearances to vegetation, structures, and other objects located beneath or adjacent to the line [16,17]. As a result, system operators often face uncertainty regarding the representativeness of measurements obtained from a limited number of sensor locations. This challenge is compounded by the need to balance monitoring coverage with project cost, since installing physical sensors on every tension section (Figure 1) may render projects economically unattractive.
Figure 1.
Installation of dynamic line rating equipment in the Hungarian distribution and transmission system: (a) line monitoring sensor, (b) weather station, (c) weather station.
Virtual sensing technologies have emerged as promising alternatives that can reduce monitoring costs [17,18]. However, purely model-based approaches are highly sensitive to uncertainties in weather inputs and conductor characteristics, including aging effects, thereby significantly influencing prediction accuracy. Practical experience from large-scale research and demonstration projects has revealed notable discrepancies between calculated and measured conductor temperatures [19]. These differences often originate from inaccuracies in meteorological data and limitations of conventional thermal models, including the IEEE and CIGRE standards [6,20]. Since conductor temperature directly determines ampacity calculations, such inaccuracies can significantly affect the reliability of DLR systems. In addition, accurate ampacity assessment requires consideration of conductor thermal inertia, introducing further complexity into operational decision-making and dispatching practices. The deployment of DLR platforms also raises broader organizational challenges related to interoperability and coordination between transmission and distribution system operators, particularly within harmonized regional and national network management frameworks.
Beyond technical considerations, economic factors represent perhaps the most significant obstacle to large-scale DLR implementation [16]. System operators must balance investment costs, operational expenditures, monitoring reliability, and long-term scalability when selecting an appropriate monitoring strategy [21]. Conventional conductor-mounted sensors remain the most widely adopted solution due to their proven reliability and extensive operational experience. Nevertheless, large-scale deployment across extensive overhead line networks requires substantial capital investment and ongoing maintenance. Furthermore, continuing developments in communication technologies and cybersecurity requirements may increase lifecycle costs through recurring hardware upgrades and software modifications.
To address these limitations, several alternative sensing concepts and business models have recently emerged [22]. Simplified physical sensors that measure a limited set of critical parameters offer lower installation costs, easier maintenance, and compatibility with live-line maintenance techniques. These characteristics make them particularly attractive for distributed monitoring architectures requiring broad network coverage. Service-based business models, including sensor rental schemes, further reduce initial investment costs by replacing capital expenditure with annual service fees. Such approaches facilitate technology evaluation and enable faster adaptation to evolving technological standards [22]. However, their adoption remains constrained in many regions because regulatory frameworks and funding mechanisms continue to favor conventional capital investment projects.
Among the available alternatives, virtual sensing technologies offer the greatest potential for scalability and cost reduction. Weather-based virtual sensors can estimate conductor temperatures without extensive field instrumentation; however, their performance remains highly dependent on the quality of meteorological data. A more promising approach involves sensor-based virtual sensing, in which machine learning models are trained on locally measured weather parameters and limited physical measurements to replace the most expensive components of DLR systems, namely, conductor-mounted monitoring devices. These solutions deliver significant economic benefits by reducing capital expenditure, improving scalability, and lowering maintenance requirements. Nevertheless, their practical value ultimately depends on achieving sufficient accuracy and reliability under varying operating conditions.
3. Digital Twins—The Concept for Line Monitoring
The future deployment of DLR systems is likely to rely on optimized combinations of physical and virtual sensing technologies. Such hybrid approaches can balance cost efficiency with the monitoring reliability required for critical power line infrastructure. This raised the idea of applying digital twins to line-monitoring concepts to build such a hybrid system. A digital twin is a virtual representation of a physical asset, process, or system that continuously integrates real-world data to support monitoring, analysis, prediction, and decision-making throughout its lifecycle [23,24]. In the context of overhead power line monitoring, the digital twin concept developed in this work aims to provide comprehensive support for the deployment, operation, and optimization of line monitoring systems.
The first level of the framework focuses on the preparatory phase, where the digital twin assists in determining optimal sensor locations, estimating the number of monitoring devices required, and supporting the design of an efficient measurement infrastructure. This enables utilities to establish cost-effective monitoring schemes while maintaining sufficient coverage of critical network assets [17].
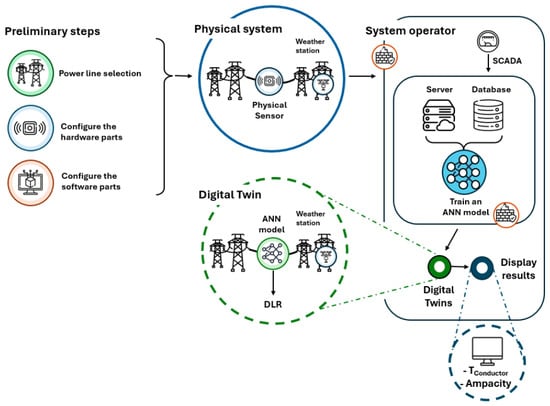
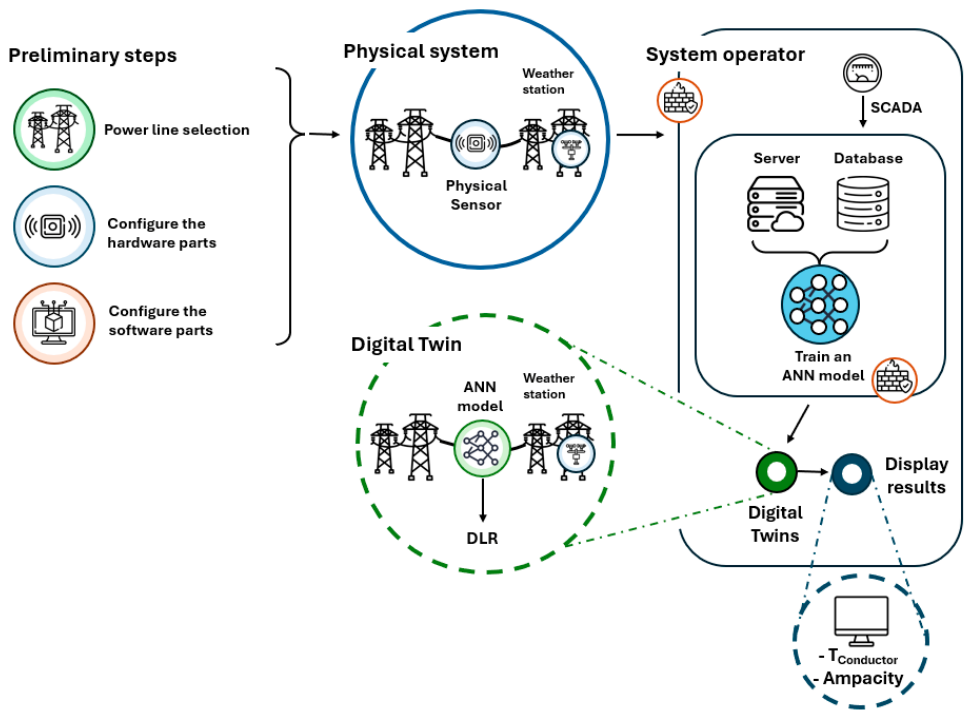
The second level of the concept addresses the development of virtual sensors capable of estimating the thermal state of conductors. Unlike conventional approaches that rely primarily on meteorological data, the proposed virtual sensors integrate weather information with real conductor temperature measurement data and artificial intelligence techniques (Figure 2) [8]. By combining heterogeneous data sources, the model can provide more accurate and robust estimations of conductor temperature and related operational parameters. In this sense, the thermal model itself can be interpreted as a digital twin embedded within the broader digital twin architecture, creating a hierarchical “digital twin within a digital twin” concept.
Figure 2.
Schematic structure of the power line monitoring DT applied in the project.
The third level focuses on the practical utilization of digital twin outputs in transmission system operation and planning. The estimated thermal state of conductors is transformed into actionable operational indicators, including dynamic line rating calculations and conductor sag estimations. These outputs can support both real-time control room decision-making and day-ahead operational planning, enabling more efficient utilization of existing grid infrastructure while maintaining system security. The concept has evolved through continuous research and development, building on previous studies and pilot projects in which the necessary hardware and IT infrastructure were successfully implemented [16].
This paper focuses on the virtual sensor concept and its validation across various physical assets and utility IT environments. The objective is to develop a fine-tuned, optimized algorithm that operates reliably across diverse deployment conditions. Achieving this goal requires extensive data collection, model evaluation, and the development of a high-level interoperability framework. Through standardized data exchange, open interfaces, and secure sharing of data and models, the TwinEU Horizon project provides the foundation for large-scale AI-enabled simulations and coordinated operational decision-making across multiple stakeholders in the European energy sector [13].
4. Models and Methods
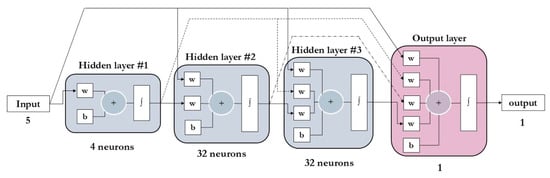
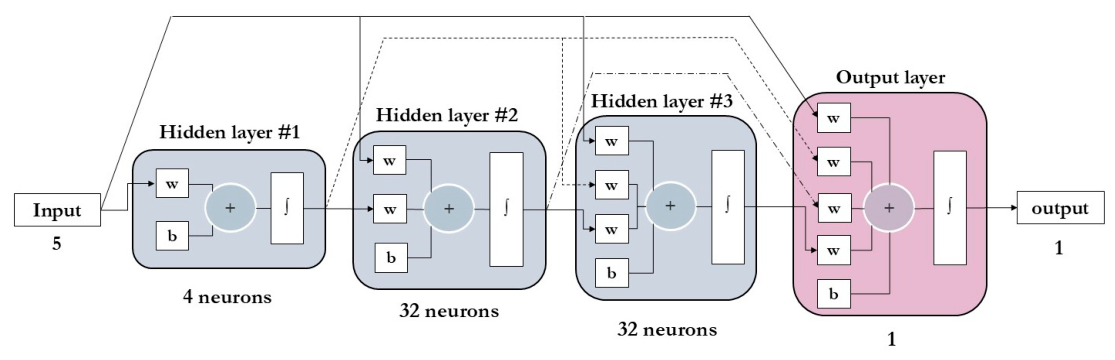
The concept of applying digital twins to conductor temperature monitoring relies on using physical sensor measurements to develop a model-based solution [8]. After installing physical monitoring devices, a digital twin model is created from data collected by these sensors. For this purpose, an artificial neural network (ANN) model is employed as a virtual sensor (Figure 3). To develop and train the ANN model, three types of input data are required. Since conductor temperature primarily depends on environmental conditions and line loading, these parameters constitute the model’s main inputs [8]. Weather data are collected locally from weather stations installed directly on transmission towers (if such a dataset is not available, the weather agency dataset is used), while line loading values are provided by the SCADA system. In the proposed method, time-lagged features were not included as input parameters.
Figure 3.
An Artificial Neural Network structure applied as a virtual sensor.
In addition, measured conductor temperature data are required for training purposes. The ANN, which operates using a learning process analogous to that of the human brain, learns the relationships among these input parameters from the training dataset [25,26]. In general, a minimum training period of 6 to 12 months is required to achieve accurate model performance; however, a more detailed analysis of this requirement is presented in the following sections.
4.1. Prior Work for Virtual Sensors
The research presented in this paper builds upon a series of investigations conducted within the FLEXITRANSTORE, FARCROSS, and TwinEU projects. Early studies focused on the feasibility of applying artificial neural networks (ANNs) to estimate conductor thermal conditions and support Dynamic Line Rating (DLR) applications. This work was further extended within the FARCROSS project [19], where ANN-based virtual sensors were investigated on multiple transmission lines and under different operating conditions. Several monitoring technologies based on different measurement principles were evaluated as potential data sources for ANN training. The results showed that directly measured conductor temperature provides a more reliable training dataset than temperature values indirectly derived from conductor sag measurements [8]. The earlier studies also identified the relevant meteorological input parameters and demonstrated the importance of incorporating line-loading data obtained from the SCADA system. These investigations confirmed that ANN-based virtual sensors can reproduce conductor-temperature measurements with promising accuracy and can be applied across different monitoring technologies and transmission lines.
However, several questions remain open. First, the available datasets were affected by seasonal variability and did not provide continuous one-year training data at all investigated locations. Since conductor thermal behavior is strongly influenced by annual weather cycles, the effect of training-data duration and seasonal coverage on model robustness could not be fully evaluated. Second, the previously implemented models relied on a general-purpose ANN architecture that provided satisfactory performance across different sites but was not systematically optimized for individual monitoring locations [8]. Consequently, the potential benefit of site-specific hyperparameter optimization remains unexplored.
The present work addresses these limitations using substantially longer-term monitoring datasets and a systematic ANN optimization procedure. Models trained with six- and twelve-month datasets are compared, with particular attention given to their performance outside the training period. In addition, the study investigates the influence of local weather-data availability and quality, as well as the performance of optimized models for transmission lines with different characteristics and voltage levels. Accordingly, the novelty of this work is not the introduction of the ANN-based virtual sensor concept itself, but its systematic assessment under different data-availability and operating conditions. By combining longer-term datasets, site-specific ANN optimization, and an assessment of the influence of local meteorological data, the study provides a more comprehensive evaluation of the factors determining virtual-sensor performance. These results support the further development of ANN-based virtual sensors as digital-twin components for overhead-line monitoring and DLR applications.
4.2. Data Available for DT Development
The development and validation of the proposed ANN-based digital twin solution were supported by datasets collected from three overhead transmission lines operated by three different system operators within the TwinEU project. The selected test sites span voltage levels from 132 kV to 400 kV, providing a broad basis for evaluating the approach under different network conditions.
A comprehensive dataset was available for digital twin development. This included technical information on the monitored power lines, including conductor types and properties, cross-sectional drawings, line routes, and design parameters. In addition, operational and environmental data were collected from line monitoring sensors, SCADA systems, and weather data sources, as summarized in Table 1.
Table 1.
Demonstration power lines and equipment used in the evaluation.
The sensor infrastructure deployed across all investigated lines consisted of contact-based conductor-temperature monitoring devices. Two temperature sensors were installed on each power line, providing the measured conductor temperature data required for ANN model training and validation. These measurements served as reference values for developing the virtual sensor; accordingly, quantities characterizing the measurement accuracy for the sensors, which will be used later for the validation of the neural network outputs, are described here. The “A” type of line monitoring sensor measurement range is −25 °C to +180 °C with a resolution of 0.05 °C and accuracy of ±1.5 °C. In the case of the “B” type of line monitoring sensor, the measurement range is −40 °C to +125 °C with a resolution of 0.5 °C and maximum deviation of ±1 °C. None of the line monitoring sensors are calibrated for the temperature measurement; however, the measurement uncertainty is determined according to IEC 60751 standard [27].
Weather information was available from different sources, depending on the location being monitored. For two of the power lines (E and M), meteorological data were collected directly at the same span as the conductor temperature sensors, ensuring highly representative local weather measurements. For the third power line (A), no field weather station data was available. In this case, the required meteorological information was obtained from a national weather agency. In these cases, for the training and evaluation of the digital twins, the closest weather points to the sensors were used. One aim of the research project was to investigate whether neural network-based virtual sensors can generally be used without training them with local environmental data or whether it is even possible to replace virtual sensors between two independent lines without losing significant accuracy. Therefore, the different weather data types served as a good basis for that part of the research.
Together with line-loading data from the SCADA system, these datasets provided the environmental and operational inputs required to develop and assess the ANN-based digital twin. From the different data sources, the parameters described in Table 2 were collected. It should be noted that relative humidity was excluded from the model inputs, as it became clear in the early stages of development that it had negligible effects on model accuracy.
Table 2.
Data collected at the different demonstration power lines.
The line configuration in the three different demonstration lines is summarized in Table 3, while the ambient conditions are presented in Table 4 for the used power lines.
Table 3.
Properties of the power lines involved in the project.
Table 4.
Range for the input and output data for the power lines involved.
4.3. Data Preparation and Splitting Methods
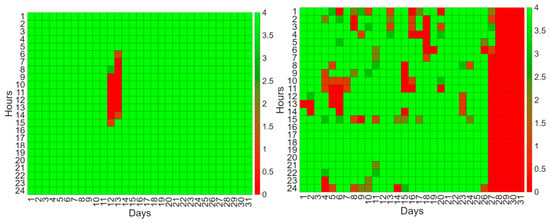
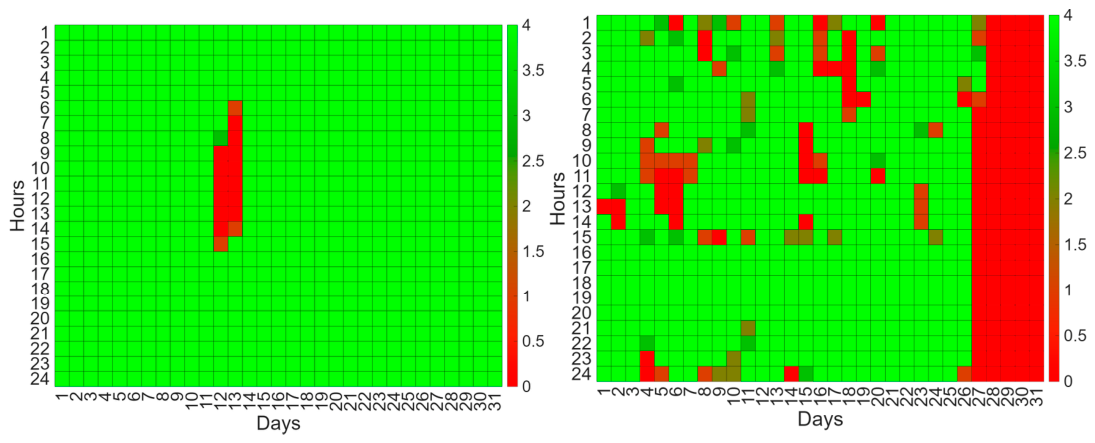
Following data collection from the participating system operators, the first step in the data preparation process was to harmonize the datasets to ensure that a common ANN training methodology could be applied across all investigated systems. Prior to neural network training, a preliminary assessment of data quantity was performed across all available data sources [28]. Since the performance of ANN models strongly depends on both the quantity and quality of the available data, this constituted an essential step in the digital twin development process. The results of this assessment provided feedback to the system operators regarding data availability and quality, while also supporting the selection of appropriate training, validation, and testing dataset partitions. A sample outcome of the data quantity assessment for two different months is presented in Figure 4. Green cells denote those hours in the month where all the data necessary for the ANN training are available, while red cells indicate those periods where at least one parameter is missing.
Figure 4.
Sample result of data quantity check from different months.
The development of the digital twin focused on implementing ANN-based virtual sensors that reproduce the measurements of the physical sensors deployed within the monitoring system. These ANN models were developed in MATLAB R2025b, and their outputs, which represent the conductors’ thermal state, serve as key inputs to the ampacity calculation module. Before model development, missing and invalid records were removed from the datasets to ensure data consistency and reliability. The resulting database contained approximately 1.5 years of measurements and served as the basis for model training and evaluation.
To maintain the required independence between model development and performance assessment, the available data were split into training, validation, and test subsets [29]. This partitioning strategy ensures that model performance is evaluated using previously unseen data and prevents optimization procedures from introducing bias into the final results. In addition, the adopted data preparation framework enabled a systematic investigation of the influence of training data volume on model accuracy.
For this purpose, two training dataset configurations were considered, corresponding to approximately 6 months and 12 months of available measurements. Furthermore, three data-splitting strategies were evaluated to identify the most suitable approach for ANN generalization under strongly seasonal operating conditions. The weekday split assigns five days to the training dataset, with one day to validation and one to testing, thereby preserving seasonal characteristics while maintaining dataset independence. This resulted in a 70–15–15% split between the training, validation, and testing sets, respectively. The seasonal split distributes data proportionally within each season by randomizing daily data blocks, ensuring representative coverage of winter, spring, summer, and autumn in all subsets. In this case 70% of data was chosen for training, and 15-15% for validation and testing. Finally, the time-series split partitions the data chronologically, reflecting real-world deployment conditions, although with more limited representation of seasonal variability. In the time-series case, 80% of the data was used for training, while the remaining 10% was allocated to validation and 10% to testing. In all cases, the training, validation, and testing datasets were kept strictly separate, with no samples shared between the subsets. This separation ensures that the validation and testing data remain independent of the model training process, enabling an unbiased assessment of model performance and generalization. All splitting strategies were applied to the datasets of the investigated system operators, resulting in multiple candidate ANN models whose performance and generalization capabilities were subsequently compared during the optimization phase.
4.4. Data Normalization and DT Optimization
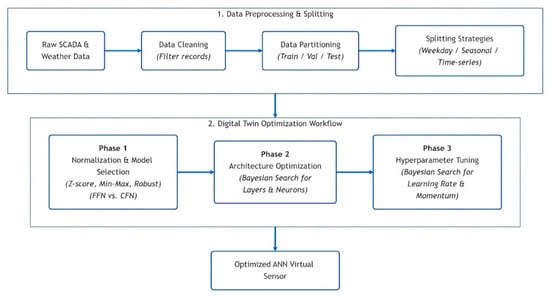
An important stage of digital twin development was the normalization of the input data used for ANN training. The implemented virtual sensors rely on multiple input sources, including weather observations and SCADA measurements, which exhibit significantly different numerical ranges and magnitudes. Without appropriate preprocessing, these differences can negatively affect the learning process and lead to biased model behavior. Therefore, input data normalization was incorporated as a fundamental element of the model development workflow [30]. The overall optimization workflow is presented in Figure 5.
Figure 5.
Block diagram of the digital twin optimization framework.
Several normalization techniques were evaluated to assess their suitability for predicting conductor temperature. The methods investigated included Z-score (Equation (1)) standardization, Min–Max scaling (Equation (2)), and robust normalization based on the median and interquartile range (Equation (3)) [31].
where Xnorm,i is the normalized value of the ith sample; Xi is the original value of the ith sample; μ is the mean (average) of the dataset; σ is the standard deviation of the dataset; i is the index of the observation/sample; Xmin is the minimum value in the dataset; Xmax is the maximum value in the dataset; Q1(X) is the 25th percentile (first quartile); Q2(X) is the median; Q3(X) is the 75th percentile (third quartile); and Q3(X) − Q1(X) is the interquartile range.
Since the effectiveness of a normalization technique depends on both the dataset’s statistical properties and the neural network’s structure, the optimal normalization approach was determined for each model as part of the overall optimization procedure [32]. Consequently, data normalization was treated not only as a preprocessing step but also as an integral component of digital twin optimization.
In addition to data preprocessing, the accuracy and reliability of the ANN-based virtual sensors are strongly influenced by the selected network architecture and training methodology [25]. To systematically optimize these aspects while maintaining computational efficiency, a three-phase Bayesian optimization framework was developed. The first optimization phase focused on identifying the optimal combination of normalization method and neural network type within a fixed reference architecture [33]. In this step the best-performing normalization method was chosen for every measurement point, selecting the better-performing model type. The model types included were the feed-forward network and the cascade-forward network. To ensure an unbiased assessment, all candidate configurations were evaluated exclusively using the validation dataset, thereby preserving the independence of the test dataset.
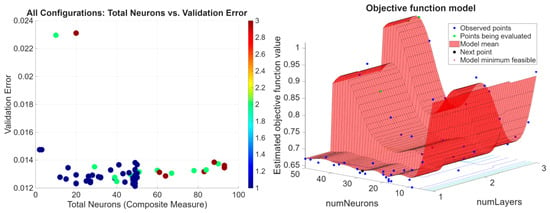
After selecting the network type and normalization strategy, the second phase focused on the neural network architecture. A model for every dataset was trained using the normalization method and network type selected in the first phase. In this phase the models were trained over and over again with different architectures, based on the rules of Bayesian optimization, and they were tested on the validation set. This way the best-performing architecture for every dataset can be selected [34]. Since the neural network’s structural characteristics largely determine its ability to capture complex nonlinear relationships among environmental conditions, line loading, and conductor temperature, this phase primarily focused on improving predictive accuracy.
The third optimization phase focused on training-related hyperparameters. In this phase the model architecture selected in the second phase was further optimized through the modification of the hyperparameters. Bayesian optimization was employed to determine optimal parameter values, such as the learning rate and momentum, to improve training efficiency and convergence behavior (Figure 6). Through this approach, both the network structure and the training process were systematically adapted to the characteristics of the available datasets.
Figure 6.
Different ANN configurations and optimization of the momentum and learning rate.
One representative example after the optimization of the network parameters is provided in Table 5. The table summarizes the network layer structure, training algorithm, learning rate, and momentum for a selected configuration. These parameters illustrate the type and level of model optimization performed.
Table 5.
An example of an optimized network architecture.
The complete digital twin optimization procedure was performed for each investigated transmission grid and each previously defined data-splitting strategy. The results showed that, although the weekday split achieved the highest performance according to conventional evaluation metrics, the seasonal split provided superior generalization capability due to its more representative coverage of seasonal operating conditions. As a result, the seasonal split was selected as the final methodology for digital twin development, while the results from all splitting approaches were retained for comparison and benchmarking.
5. Results
After the collection, cleaning, harmonization, and preparation of the available datasets, the digital twin development process reached the evaluation stage. The following section presents the evaluation framework used to verify the feasibility of the proposed ANN-based digital twin concept and to assess the performance of the developed virtual sensors by comparing their conductor temperature estimates with measurements from the physical monitoring sensors installed on the transmission lines.
5.1. Evaluation Framework
The evaluation of the developed digital twin solution is critical, especially as it is used in safety-critical power system applications where prediction errors may directly influence operational decisions. Since different performance metrics emphasize different aspects of model behavior, a comprehensive and application-oriented evaluation framework was established for the ANN assessment. The investigated problem is a regression task in which conductor temperature is estimated from line load and meteorological parameters; therefore, the evaluation methodology focuses exclusively on regression-oriented performance indicators and reliability measures.
The first component of the evaluation framework assesses prediction accuracy using residual errors between predicted and measured temperatures. Mean Absolute Error (MAE) was selected as a measure of average prediction accuracy because it provides an intuitive interpretation of the typical error magnitude while preserving the physical unit of the target variable (Equation (4)).
where n is the total number of observations; i is the index of the observation; ŷpredicted is the predicted value; and ytrue is the actual value.
To better capture the influence of large prediction deviations, Root Mean Squared Error (RMSE) was also investigated (Equation (5)), as its squared-error formulation places greater emphasis on infrequent but potentially critical errors [35].
In addition, the coefficient of determination (R2) was used to quantify the ANN models’ ability to explain the variability in observed conductor temperatures (Equation (6)) [32]. Together, these metrics provide comprehensive information regarding model accuracy, prediction quality, and overall explanatory power.
While accuracy metrics are essential, they do not fully characterize a model’s suitability for operational deployment in power system environments. For this reason, the evaluation framework also incorporates reliability-oriented indicators designed to assess model robustness and trustworthiness. This aspect is particularly important because conductor temperature prediction supports DLR calculation, where inaccurate estimates may result in either unnecessary operational constraints or increased safety risks. Furthermore, the measured reference temperatures used for training and validation are themselves affected by sensor inaccuracies, communication failures, and other sources of uncertainty, which complicates the assessment of model reliability.
To address these challenges, reliability was evaluated through an outlier-based analysis. The primary metric used for this purpose was the 95th percentile (P95) of the absolute prediction error distribution (Equation (7)), which provides insight into the level of error that is exceeded in only a small fraction of operating conditions. This measure quantifies prediction confidence and highlights the model’s behavior under less typical circumstances.
In addition, the outlier percentage was introduced to measure the proportion of predictions exceeding the predefined project accuracy threshold of ±2 °C (Equation (8)), which was chosen based on utility requirements and operational considerations. By explicitly tracking the occurrence of large prediction errors, this metric complements conventional accuracy measures and reflects the practical reliability of the ANN models. Consequently, the proposed evaluation framework combines statistical accuracy assessment with robustness analysis, providing a comprehensive basis for selecting ANN models suitable for deployment in digital twin-based dynamic line rating applications.
5.2. Performance of the DTs
Based on the evaluation framework and ANN optimization methodology described in the previous sections, a comprehensive set of digital twin models was developed and assessed for the transmission line monitoring applications investigated. The following section presents the results, focusing on the accuracy, robustness, and generalization capabilities of the optimized ANN-based virtual sensors compared with the measurements from the physical conductor temperature sensors. Table 6 presents key metrics for investigating the different models.
Table 6.
Results of the ANN models with the chosen metrics.
The comparative analysis of the developed conductor temperature prediction models highlights the critical importance of local measurement quality and meteorological data availability for achieving accurate and reliable predictions. Significant differences were observed among the investigated transmission systems, represented here as SOs “A”, “M” and “E”, demonstrating that improvements in data quality directly translate into enhanced model performance.
For the final evaluation, the seasonal split validation strategy was selected despite the slightly better mathematical performance achieved by the weekday split approach. The seasonal split was considered the most representative and unbiased evaluation framework because both the training and test datasets contain samples from all seasons, ensuring that models are assessed across a broad range of environmental and operational conditions. This approach better reflects real-world deployment scenarios, where conductor temperature prediction models must remain robust year-round, regardless of seasonal weather variations or changes in system operating conditions.
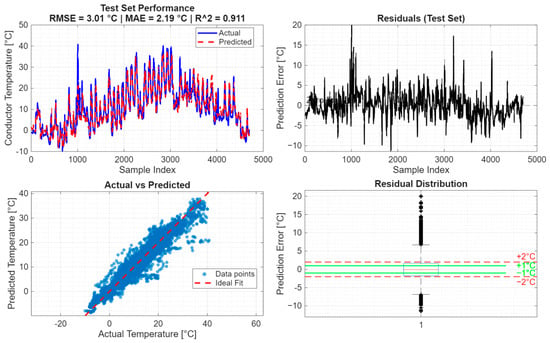
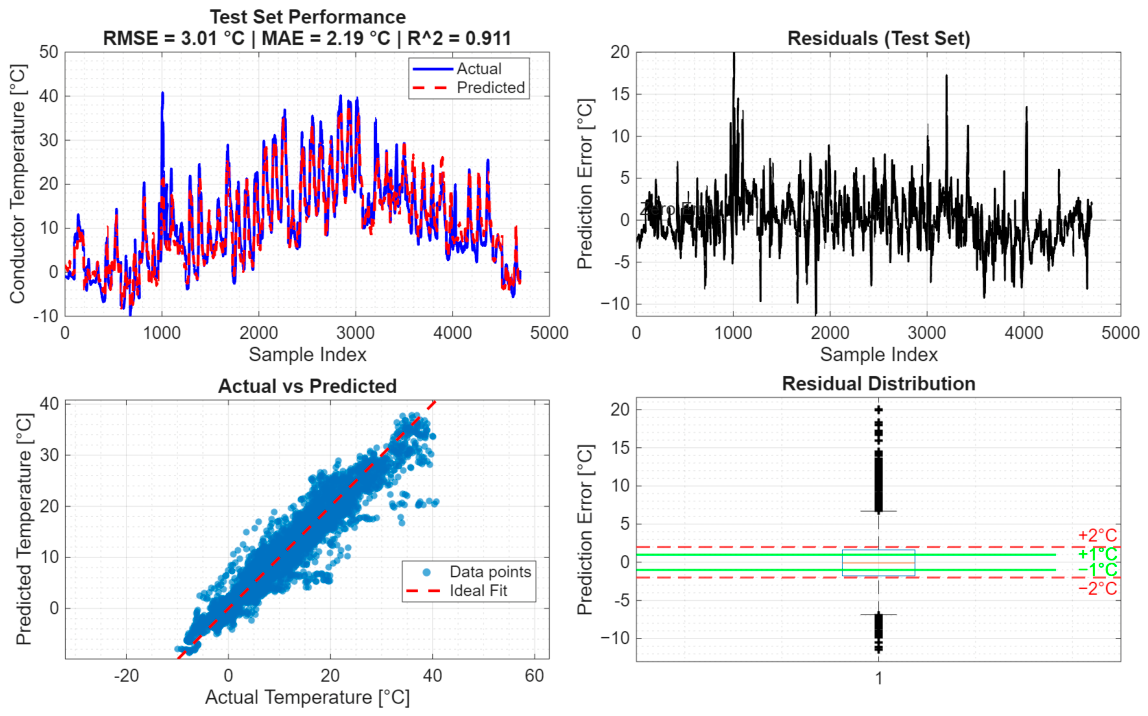
The results obtained for SO “A” (Figure 7) were the least accurate among the investigated systems. This outcome was largely attributed to the absence of locally measured meteorological data, which significantly limited the models’ ability to capture the tendency of conductor temperature. While the optimization process and advanced neural network architectures significantly improved performance over the initial baseline models, prediction uncertainty remained relatively high. The best-performing power line “A” model (Feedforward Neural Network) achieved an RMSE of 1.899 °C and an MAE of 1.385 °C, while approximately one quarter of all predictions exceeded the target error range of ±2 °C.
Figure 7.
Results of ANN model on power line A1 with 6 months of seasonal split training.
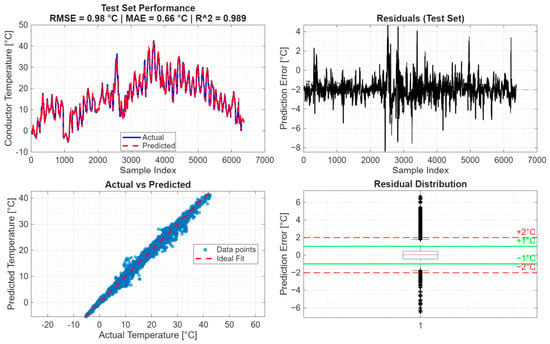
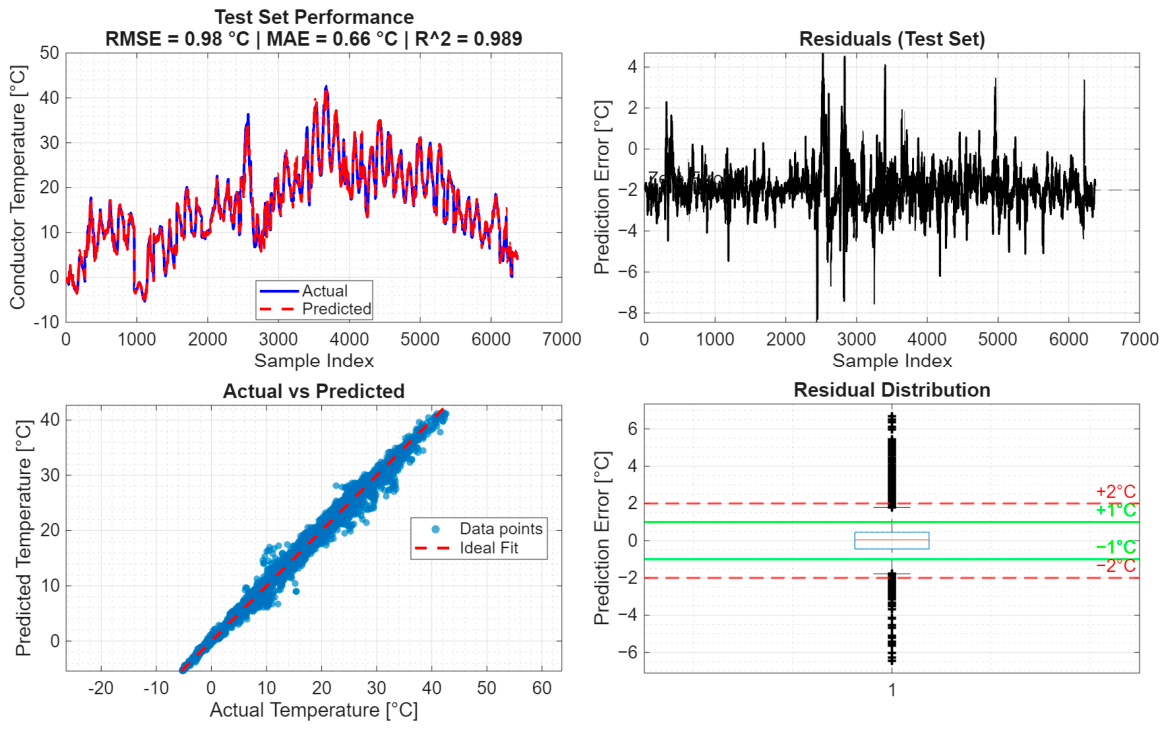
A substantial improvement was observed for SO “M” (Figure 8), where high-resolution local weather measurements were available. The developed models achieved RMSE values close to 1 °C and MAE values below 0.8 °C, representing a significant enhancement in both accuracy and reliability compared to SO “A”. Outlier percentages remained below 7%, while P95 values around 2 °C confirmed the stability of the predictions. The results also indicated that increasing the training duration allowed for improved model performance in one of the cases regarding SO “M”, suggesting that in that case, the additional data enabled better generalization capabilities.
Figure 8.
Results of the ANN model on power line M1 with 6 months of seasonal split training.
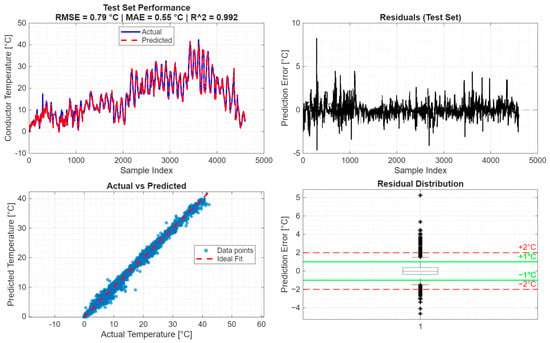
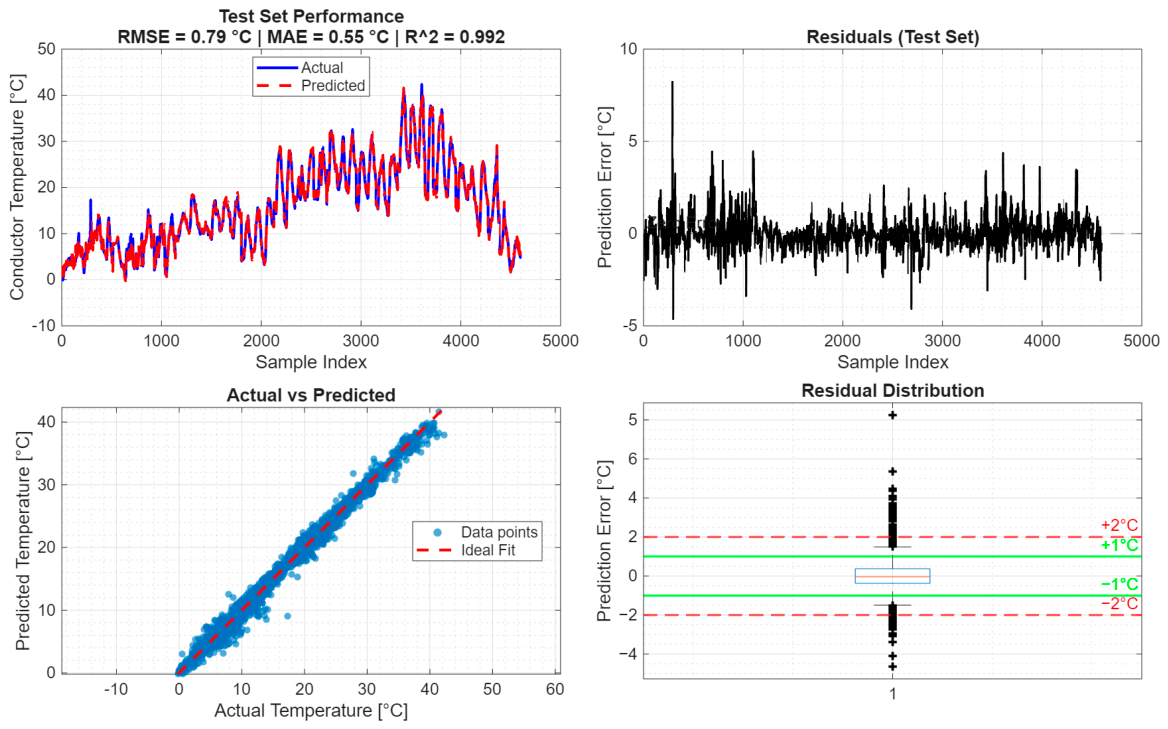
The best overall performance was achieved by SO “E” (Figure 9). Despite lower overall data availability, the high quality of the available measurements enabled the models to predict the measured conductor temperature values accurately. The final models achieved RMSE values close to 0.8 °C and MAE values of 0.55 °C, while outlier percentages remained near 3%. These results indicate that approximately 97% of predictions were within ±2 °C of the measured conductor temperature. The high accuracy of the models was further demonstrated by their R2 values, which exceeded 0.99. Furthermore, in the case of SO “E”, the longer training period only improved the results for one of the models.
Figure 9.
Results of the ANN model on power line E1 with 6 months of seasonal split training.
Overall, the results demonstrate that neural network-based conductor temperature prediction is strongly dependent on the quality of the available input data. The comparison of SO “A”, “M” and “E” clearly shows that high-quality local meteorological measurements are the primary factor enabling highly accurate and dependable conductor temperature estimation. While the weekday split approach consistently produced the lowest prediction errors, the seasonal split was ultimately preferred because it provides a more representative assessment of long-term operational performance under varying environmental conditions.
6. Discussion
After presenting the results, this section discusses their interpretation, the practical outputs and applications of the developed digital twin, the methods used to assess model performance, and the key limitations and considerations for deploying and operating such ANN-based digital twin solutions.
6.1. Interpretation of the Results
The results demonstrate that the proposed ANN-based digital twin approach can reproduce conductor temperature measurements with high accuracy under the operating conditions investigated. The primary objective of the digital twin concept was not to completely replace physical monitoring systems, but rather to reduce the number of field devices required while maintaining monitoring performance comparable to that of conventional sensor-based solutions. The results indicate that, provided sufficient quantities of high-quality training data are available, the accuracy of the virtual sensors can achieve a level suitable for temperature monitoring. This finding represents an important step toward more efficient and cost-effective overhead line monitoring solutions.
A further significant outcome is the demonstration that virtual sensors can accurately estimate conductor temperature using both weather observations and operational loading data. The achieved performance was observed across different voltage levels and sensor technologies, suggesting that the underlying methodology is largely independent of the specific network configuration or monitoring equipment used. This supports the wider applicability of ANN-based digital twins in transmission line monitoring systems.
At the same time, the results clearly indicate that successful model development depends strongly on data quality and availability. The training process requires sufficiently long, representative, and reliable datasets, and not all available measurements are necessarily suitable for ANN training. This phenomenon was extremely noticeable in the case of SO A, as in that case no local weather measurements were available. The results show that the lack of local weather measurements results in the models performing worse and renders them unable to reach the desired accuracy. While the results for SO A did not meet the desired accuracy, they provided useful insights into the importance of local weather measurements. Accordingly, the research question of whether virtual sensors should be trained with local parameters or whether virtual sensors can be trained with generalized data sets for independent power lines without losing accuracy is also answered. To reach the desired accuracy, the importance of local training data is unquestionable, including the operation conditions and conductor parameters, too.
The differences in model accuracy may be related to several factors, including seasonal variations, measurement characteristics, and differences between the investigated transmission lines. Although the same ANN training and optimization methodology was applied across all cases, the datasets and resulting optimized models differed. Furthermore, differences in conductor dimensions may influence the thermal response, with typical thermal time constants being comparable to the sampling interval used in this study. Seasonal differences may also affect the results. However, the optimization was primarily focused on achieving adequate performance during late spring and summer (for cases E1 and M1), which represent the most critical periods for DLR operation. The individual contributions of these factors, including potential concept drift and ANN training variability, were not investigated separately because the models (E1 and M1) met the predefined accuracy requirements. The results are consistent with the initial hypothesis of the project that the availability and quality of local weather data have a significant influence on model accuracy. It should be noted, however, that the use of limited weather data was an intentionally designed test case and should not be interpreted as representative of the data normally available to or used by the respective system operator (SO) under real operating conditions.
From a practical perspective, the results suggest that a portion of the physical sensor infrastructure can be substituted by virtual sensors without significant degradation in accuracy. This may reduce installation costs (CAPEX) or operational costs (OPEX) as well as maintenance requirements, carbon footprint, and operational complexity for utilities [22]. Moreover, because physical sensors are primarily required during the model training period, which is typically less than 1.5 years, new business models may emerge, such as sensor rental concepts supporting circular-economy principles and continuous technological renewal. Nevertheless, it is important to emphasize that the complete replacement of physical monitoring devices is neither the objective of the digital twin concept nor a recommended strategy for transmission system operators. Physical sensors remain indispensable for model training, validation, and the long-term reliability of the monitoring system.
6.2. Application of the Results
Tracking conductor temperature is a key capability for transmission system operators; however, the ultimate objective is to determine transmission capacity to enhance the utilization of existing infrastructure. Conventional Dynamic Line Rating (DLR) methods, such as the CIGRE and IEEE models, are indirect approaches for calculating conductor ampacity. These methods utilize weather parameters, including ambient temperature, solar radiation, wind speed, and wind direction, as input variables. The thermal balance of the phase conductors is determined by considering the effects of these environmental factors and Joule heating from the current flowing through them. By incorporating the conductor’s technical parameters, the allowable current corresponding to the maximum operating temperature (MOT), which defines the conductor rating, can be calculated.
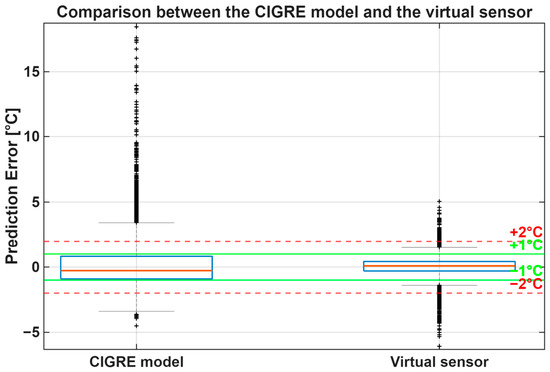
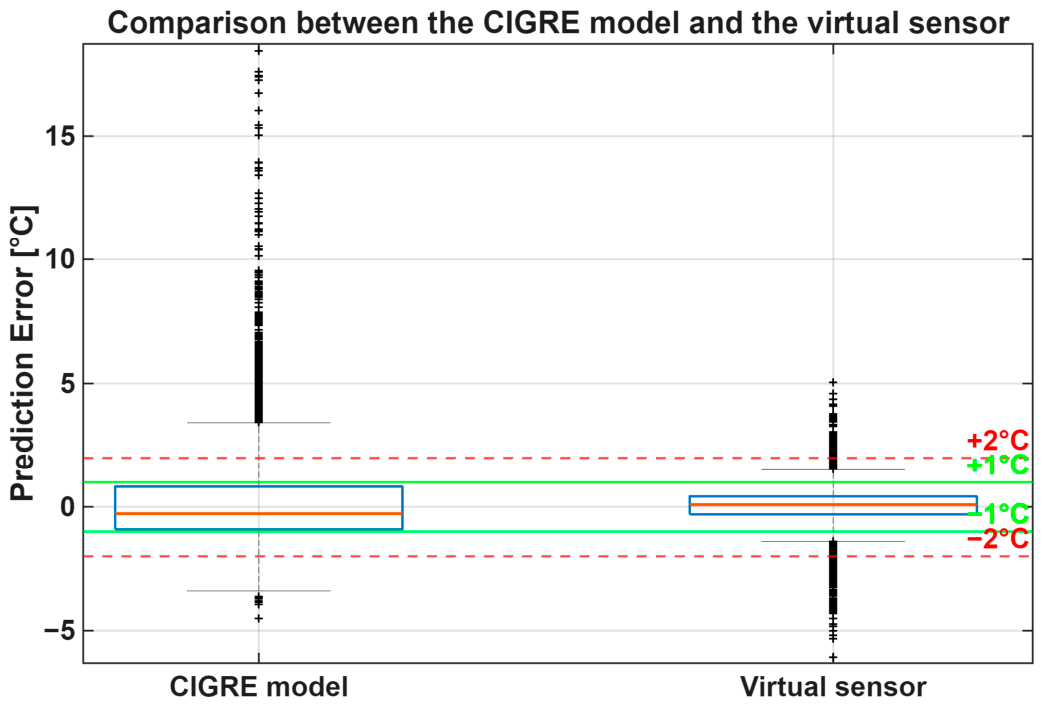
However, these conventional models involve simplifications and neglect physical phenomena such as the heating effect of corona discharge and the evaporative cooling effect of precipitation [16]. Consequently, the accuracy of their output may be limited. To further investigate this aspect, the performance of the conventional CIGRE model was compared directly with that of the developed ANN-based virtual sensor using the same test dataset. In this comparison, the conductor temperature calculated using the CIGRE thermal model was evaluated against the measured conductor temperature, and the resulting errors were compared with those obtained from the virtual sensor. Figure 10 presents the corresponding error distributions as boxplots. This comparison provides a direct baseline evaluation on the same test data and allows the relative prediction errors of the conventional thermal model and the proposed virtual sensing approach to be assessed under identical conditions.
Figure 10.
Distribution of conductor temperature prediction errors for the CIGRE thermal model and an example ANN-based virtual sensor on the same test dataset.
To address the limitations associated with conventional thermal models, a direct ampacity calculation method has been developed based on conductor temperature measurements. In this approach, the ANN-based digital twin’s estimated conductor temperature serves as an input parameter. A significant advantage of direct ampacity calculation is that it inherently accounts for conductors’ thermal inertia. This characteristic provides a more practical solution for everyday operation, as dispatchers can rely on a less variable parameter when considering transmission capacity constraints. Moreover, the DT-provided ampacity can be used for market co-optimization, which can also affect electricity prices in a dedicated region.
The application of digital twins for overhead line monitoring provides several benefits. It enables deployment of a broader virtual monitoring network to assess conductor thermal distribution and supports more accurate ampacity calculations. Consequently, digital-twin-based conductor temperature estimation contributes directly to the uprating of electricity grids and to the enhanced utilization of existing transmission infrastructure.
6.3. Limitations of the DT
Although the developed digital twin demonstrated robust performance, including satisfactory operation on extended evaluation datasets, it is important to recognize the inherent limitations of the proposed approach. The accuracy of conductor temperature estimation remains highly dependent on the input parameters used during model training. Consequently, not only the quantity but also the quality of the available data plays a critical role in determining model performance. Without proper data validation and quality assurance procedures, the use of inaccurate or incomplete datasets may introduce significant uncertainty into the predictions.
Another limitation is that the ANN model may occasionally produce anomalous outputs that deviate from the expected temperature values. In certain cases, these prediction errors can reach several degrees Celsius, with deviations approaching the ±5 °C range. For this reason, the results should preferably be interpreted as time series rather than isolated individual values, as temporal filtering and trend analysis can effectively reduce the influence of occasional outliers. Nevertheless, as the results show, both the frequency and magnitude of such outliers remain low in well-trained models and therefore do not significantly affect the overall applicability of the digital twin.
Furthermore, the presented concept should not be interpreted as a justification for completely replacing the physical monitoring infrastructure with virtual sensors. This consideration becomes even more important in the context of climate change, which is increasing the frequency and severity of extreme weather events. Under such conditions, the ANN model may encounter operating scenarios or combinations of input variables that were underrepresented or entirely absent in the training dataset. Therefore, it is strongly recommended that a sufficient number of physical monitoring devices remain deployed within the network. These sensors provide reference measurements for continuous model validation and, when necessary, enable recalibration and retraining of the digital twin to maintain long-term accuracy and reliability.
7. Conclusions
Power line monitoring represents an emerging technological paradigm in which scalability and cost remain significant barriers to widespread deployment. Although virtual sensing solutions are already available on the market, many existing approaches rely primarily on weather-based models and therefore do not adequately account for the actual physical behavior, condition, and aging of transmission assets. To address this gap, this study investigated a multi-layer Digital Twin framework for overhead line monitoring. Within this architecture, the first layer focuses on data preparation, the second layer consists of ANN-based virtual sensors, and the third layer utilizes the obtained thermal information for Dynamic Line Rating (DLR) and ampacity calculations.
The main objective of this work was to further develop the second layer of the framework by creating and evaluating ANN-based virtual sensors to estimate conductor temperature from weather observations and SCADA-derived loading data. By training the models on measurements from physical conductor temperature sensors, the developed digital twin can better reflect the actual operating state of both the transmission line and its environment. The proposed methodology was validated within the Horizon Europe TwinEU project using datasets obtained from three system operators, covering different voltage levels, climatic conditions, and monitoring infrastructures.
Following data harmonization, filtering, and preliminary quality assessment, several data splitting and normalization approaches were investigated to account for seasonal effects and improve model robustness. Furthermore, network architectures and training hyperparameters were systematically optimized to address a key limitation identified in previous studies. The developed evaluation framework enabled a comprehensive assessment of model performance through metrics related to average accuracy, maximum deviation, and outlier behavior.
The results demonstrate that ANN-based virtual sensors can reproduce conductor temperature measurements with high accuracy when sufficient quantities of high-quality data are available. Across the investigated cases, the proposed methodology achieved RMSE values ranging from 0.791 °C to 1.087 °C and MAE values ranging from 0.549 °C to 0.755 °C, considering the cases where the data quality and quantity were sufficient. These results demonstrate the proposed method’s ability to accurately reproduce measured conductor temperatures. The acquired results, together with the systematic evaluation of data splitting, normalization, and site-specific hyperparameter optimization, demonstrate the scientific contribution and novelty of the proposed methodology. The differences in model accuracy may result from several factors, including seasonal variations, conductor characteristics, measurement conditions, and ANN training variability. The required accuracy was achieved only for models using high-quality local weather data, consistent with the project’s initial hypothesis that representative local meteorological information plays an important role in model accuracy. The findings also highlight the importance of representative local weather data, as the lack of site-specific meteorological measurements significantly impacts prediction accuracy. The lack of high-quality data and site-specific weather measurements limits the model performance, preventing the models from achieving the desired prediction accuracy. It should be emphasized, however, that the cases with limited weather data were intentionally included in the study for comparison and do not represent the data normally available to or used by the respective system operators under real operating conditions.
Overall, the study supports the concept that a portion of the physical monitoring infrastructure can be complemented or replaced by virtual sensors without substantial loss of performance. This creates opportunities not only to reduce deployment and maintenance costs but also to simplify monitoring architectures and enable new business models. At the same time, the results indicate that complete replacement of physical monitoring devices is neither necessary nor recommended. Instead, a balanced combination of physical and virtual sensing technologies offers the most promising pathway toward cost-effective, scalable, and reliable transmission line monitoring systems. The presented results can support utilities in selecting the most appropriate monitoring strategy for their networks while providing a foundation for future applications in ampacity calculation, market-oriented operation, and asset management.
Author Contributions
Conceptualization, D.S. and L.R.; methodology, D.S., L.R., and M.M.; software, M.M.; validation, D.S. and L.R.; formal analysis, M.M.; investigation, D.S., L.R., and M.M.; resources, D.S., L.R., and M.M.; data curation, M.M.; writing—original draft preparation, D.S., L.R., and M.M.; writing—review and editing, B.N.; visualization, M.M.; supervision, B.N.; project administration, L.R.; funding acquisition, B.N. All authors have read and agreed to the published version of the manuscript.
Funding
This research was funded by the TwinEU project of the European Union’s Horizon 2020 research and innovation program under grant agreement No. 101136119.
Data Availability Statement
The datasets presented in this article are not readily available because the data are part of an ongoing study and due to limitations of sharing sensitive data from different 3rd party partners working together, who contributed to sharing aggregated results, but did not contribute to sharing raw data. Requests to access the datasets should be directed to the corresponding author (D.S.).
Acknowledgments
This work has been developed in the High Voltage Laboratory of Budapest University of Technology and Economics within the framework of the TwinEU GA project No. 101136119, funded by Horizon Europe. The strategic goal is to create a Pan-European digital twin that unites the competencies of grid and market operators, technology providers, and research centers. This collective effort will ensure resilient, secure, and efficient energy operation across Europe. The authors used Microsoft Copilot 2.20260925.58.0 (a large language model, LLM) solely for grammar checking, language refinement, and formatting improvements to the original manuscript. All scientific content, analyses, interpretations, and conclusions were developed and verified by the authors.
Conflicts of Interest
Author Bálint Németh was employed by the company Future 4 Sustainable Transport and Energy Research Institute Ltd. The remaining authors declare that the research was conducted in the absence of any commercial or financial relationships that could be construed as a potential conflict of interest. The funders had no role in the design of the study; in the collection, analyses, or interpretation of data; in the writing of the manuscript; or in the decision to publish the results.
References
- Papailiou, K.O.; Ford, G.L. Overhead Transmission Line Asset Sustainment Investment. In Power System Assets: Investment, Management, Methods and Practices; Springer International Publishing: Cham, Switzerland, 2022; pp. 273–285. [Google Scholar]
- Douglass, D.A.; Grant, I.; Jardini, J.A.; Kluge, R.O.; Traynor, P.; Davis, C.; Gentle, J.P.; Nguyen, H.-M.; Chisholm, W.A.; Xu, C.; et al. A review of dynamic thermal line rating methods with forecasting. IEEE Trans. Power Deliv. 2019, 34, 2100–2109. [Google Scholar] [CrossRef] [Scilit]
- Xu, B.; Ulbig, A.; Andersson, G. Impacts of dynamic line rating on power dispatch performance and grid integration of renewable energy sources. In IEEE PES ISGT Europe 2013; IEEE: New York, NY, USA, 2013; pp. 1–5. [Google Scholar]
- Acharige, S.S.; Haque, M.E.; Arif, M.T.; Hosseinzadeh, N.; Hasan, K.N.; Oo, A.M.T. Review of electric vehicle charging technologies, standards, architectures, and converter configurations. IEEE Access 2023, 11, 41218–41255. [Google Scholar] [CrossRef] [Scilit]
- Chen, X.; Wang, X.; Colacelli, A.; Lee, M.; Xie, L. Electricity demand and grid impacts of AI data centers: Challenges and prospects. arXiv 2025, arXiv:2509.07218. [Google Scholar]
- Iglesias, J.; Watt, G.; Douglass, D.; Morgan, V.; Stephen, R.; Bertinat, M.; Muftic, D.; Puffer, R.; Guery, D.; Nguyen, H.M.; et al. Guide for Thermal Rating Calculations of Overhead Lines; CIGRE: Paris, France, 2014. [Google Scholar]
- Erdinç, F.G.; Erdinc, O.; Yumurtacı, R.; Catalao, J.P. A comprehensive overview of dynamic line rating combined with other flexibility options from an operational point of view. Energies 2020, 13, 6563. [Google Scholar] [CrossRef] [Scilit]
- Rácz, L. A Complex Approach for Reliable Dynamic Line Rating Systems. Ph.D. Thesis, Budapest University of Technology and Economics, Budapest, Hungary, 2023. [Google Scholar]
- Abas, N.H.; Ab Kadir, M.Z.A.; Azis, N.; Jasni, J.; Ab Aziz, N.F.; Khurshid, Z.M. Optimizing grid with dynamic line rating of conductors: A comprehensive review. IEEE Access 2024, 12, 9738–9756. [Google Scholar] [CrossRef] [Scilit]
- Estanqueiro, A.I.; Algarvio, H.; Couto, A.; Michiorri, A.; Salas, S.; Pudjianto, D.; Hägglund, P.; Dobschinski, J.; Bolgaryn, R.; Kanefendt, T.; et al. Dynamic Line Rating Models and Their Potential for a Cost-Effective Transition to Carbon-Neutral Power Systems. Wiley Interdiscip. Rev. Energy Environ. 2025, 14, e70002. [Google Scholar] [CrossRef] [Scilit]
- Lawal, O.A.; Teh, J. Dynamic line rating forecasting algorithm for a secure power system network. Expert Syst. With Appl. 2023, 219, 119635. [Google Scholar] [CrossRef] [Scilit]
- Toth, J.C.; Marmillo, J.; Biedenbach, G. Development of a digital twin for the determination of transmission line conductor asset health. In The International Symposium on High Voltage Engineering; Springer International Publishing: Cham, Switzerland, 2019; pp. 917–925. [Google Scholar]
- TwinEU Consortium. TwinEU: Developing a Concept of a Pan-European Digital Twin of the Electricity System. Available online: https://twineu.net/ (accessed on 31 July 2026).
- Matus, M.; Saez, D.; Favley, M.; Suazo-Martinez, C.; Moya, J.; Jimenez-Estevez, G.; Palma-Behnke, R.; Olguin, G.; Jorquera, P. Identification of critical spans for monitoring systems in dynamic thermal rating. IEEE Trans. Power Deliv. 2012, 27, 1002–1009. [Google Scholar] [CrossRef] [Scilit]
- Teh, J.; Cotton, I. Critical span identification model for dynamic thermal rating system placement. IET Gener. Transm. Distrib. 2015, 9, 2644–2652. [Google Scholar] [CrossRef] [Scilit]
- Szabó, D. Dinamikus Távvezeték Terhelhetőség Rendszerszintű Fejlesztése: DLR-Központú Modellezési Eljáráson Alapuló Távvezeték-Menedzsment Rendszer Kidolgozása [System-Level Development of Dynamic Line Rating: Development of a Line Management System Based on a DLR-Centered Modeling Approach]. Ph.D. Thesis, Budapest University of Technology and Economics, Budapest, Hungary, 2024. [Google Scholar]
- Jakobsen, S.H.; Åsheim, T.; Utvik, K.; Taxt, H. Dynamic line rating in HV distribution grid–experiences and initial hosting capacity analysis. In CIRED 2024 Vienna Workshop; IET: London, UK, 2024; Volume 2024, pp. 937–940. [Google Scholar]
- Helgeby, M. Introducing Virtual Neurons for DLR Monitoring. Heimdall Power. 2022. Available online: https://www.heimdallpower.com/news/introducing-virtual-sensors (accessed on 22 September 2026).
- European Commission. FAcilitating Regional CROSS-Border Electricity Transmission Through Innovation (FARCROSS), Grant Agreement No. 864274. CORDIS. 2025. Available online: https://cordis.europa.eu/project/id/864274 (accessed on 22 September 2026).
- IEEE Std 738-2012; IEEE Standard for Calculating the Current-Temperature Relationship of Bare Overhead Conductors. IEEE: Piscataway, NJ, USA, 2013.
- Dupin, R.; Michiorri, A.; Kariniotakis, G. Dynamic line rating day-ahead forecasts—Cost benefit based selection of the optimal quantile. In CIRED Workshop 2016; IET: London, UK, 2016; pp. 1–4. [Google Scholar]
- Rácz, L.; Szabó, D.; Göcsei, G.; Németh, B. Cost-effective strategies for enhancing DSO flexibility: Exploring sensor rental and virtual sensors in DLR systems. In 28th International Conference and Exhibition on Electricity Distribution (CIRED 2025); IET: London, UK, 2025; Volume 2025, pp. 1972–1976. [Google Scholar]
- Crespi, N.; Drobot, A.T.; Minerva, R. The digital twin: What and why? In The Digital Twin; Springer International Publishing: Cham, Switzerland, 2023; pp. 3–20. [Google Scholar]
- Tao, F.; Xiao, B.; Qi, Q.; Cheng, J.; Ji, P. Digital twin modeling. J. Manuf. Syst. 2022, 64, 372–389. [Google Scholar] [CrossRef] [Scilit]
- Kubat, M. Neural networks: A comprehensive foundation by Simon Haykin, Macmillan, 1994. In The Knowledge Engineering Review; Cambridge University Press: Cambridge, UK, 1999; Volume 13, pp. 409–412. ISBN 0-02-352781-7. [Google Scholar]
- Altrichter, M.; Horváth, G. Neural Networks; Hungarian Edition Panem Könyvkiadó Kft.: Budapest, Hungary, 2006; 432p, ISBN 10 9-635454-64-3. (In Hungarian) [Google Scholar]
- IEC 60751:200; Industrial Platinum Resistance Thermometers and Platinum Temperature Sensors. IEC: Geneva, Switzerland. Available online: https://webstore.iec.ch/publication/3400 (accessed on 22 September 2026).
- Nawi, N.M.; Atomi, W.H.; Rehman, M.Z. The effect of data pre-processing on optimized training of artificial neural networks. Procedia Technol. 2013, 11, 32–39. [Google Scholar] [CrossRef] [Scilit]
- Reitermanova, Z. Data splitting. In WDS; Matfyzpress: Prague, Czech Republic, 2010; Volume 10, pp. 31–36. [Google Scholar]
- Cabello-Solorzano, K.; Ortigosa de Araujo, I.; Peña, M.; Correia, L.; Tallón-Ballesteros, A.J. The impact of data normalization on the accuracy of machine learning algorithms: A comparative analysis. In International Conference on Soft Computing Models in Industrial and Environmental Applications; Springer Nature: Cham, Switzerland, 2023; pp. 344–353. [Google Scholar]
- Ali, P.J.M.; Faraj, R.H.; Koya, E.; Ali, P.J.M.; Faraj, R.H. Data normalization and standardization: A technical report. Mach. Learn. Tech. Rep. 2014, 1, 1–6. [Google Scholar]
- Han, J.; Micheline, K. Data Mining: Concepts and Techniques; Morgan Kaufmann: San Francisco, CA, USA, 2006. [Google Scholar]
- Zulfiqar, M.; Gamage, K.A.A.; Kamran, M.; Rasheed, M.B. Hyperparameter Optimization of Bayesian Neural Network Using Bayesian Optimization and Intelligent Feature Engineering for Load Forecasting. Sensors 2022, 22, 4446. [Google Scholar] [CrossRef] [Scilit] [PubMed]
- Sultana, N.; Hossain, S.M.Z.; Almuhaini, S.H.; Düştegör, D. Bayesian Optimization Algorithm-Based Statistical and Machine Learning Approaches for Forecasting Short-Term Electricity Demand. Energies 2022, 15, 3425. [Google Scholar] [CrossRef] [Scilit]
- Chai, T.; Draxler, R.R. Root mean square error (RMSE) or mean absolute error (MAE)?—Arguments against avoiding RMSE in the literature. Geosci. Model Dev. 2014, 7, 1247–1250. [Google Scholar] [CrossRef] [Scilit]
- Sazlı, M.H. A brief review of feed-forward neural networks. Commun. Fac. Sci. Univ. Ank. Ser. A2-A3 Phys. Sci. Eng. 2006, 50, 11–17. [Google Scholar] [CrossRef] [Scilit]

Disclaimer/Publisher’s Note: The statements, opinions and data contained in all publications are solely those of the individual author(s) and contributor(s) and not of MDPI and/or the editor(s). MDPI and/or the editor(s) disclaim responsibility for any injury to people or property resulting from any ideas, methods, instructions or products referred to in the content. |
© 2026 by the authors. Licensee MDPI, Basel, Switzerland. This article is an open access article distributed under the terms and conditions of the Creative Commons Attribution (CC BY) license.