


Abstract
Detecting tool wear in CNC milling is a central challenge for data analytics and sensor integration in Industry 4.0, as gradual degradation increases the risk of tool breakage and downtime and often leads manufacturers to replace tools early and inefficiently. This contribution reviews existing tool wear detection approaches, including machine control data and additional sensors, and addresses the resulting need for effective data reduction and interpretation. An experimental setup on a CNC milling machine collected OPC-UA data and vibration signals, processed via a KNIME-based pipeline. Results show that, in the investigated proof-of-concept experiments, simple aggregated indicators (e.g., power consumption) allow a clear distinction between new-tool and end-of-life (EoL) states under stable process conditions. However, when cutting parameters vary, the evaluated conventional machine-learning classifiers do not achieve satisfactory discrimination. This limitation is associated with parameter-induced signal overlap, the limited training dataset, and the deliberately simple time-domain features used in this study. The study is therefore intended as an exploratory proof-of-concept rather than a comprehensive validation of continuous tool wear progression. Finally, the contribution highlights the potential of generative AI for data preprocessing, showing that large language models can efficiently clean, structure, and interpret raw manufacturing data, reducing engineering effort and improving accessibility of data analytics. The findings provide a feasibility baseline for future studies addressing intermediate wear states, richer feature extraction, and broader industrial validation.
1. Introduction
Tool wear detection has been a focus topic of machine data analysis for many years. When, e.g., a CNC mill is used to cut steel, the tool deteriorates over time; this wear inherently manifests as progressive cutting edge rounding (an increased edge radius at the microscopic contact zone) accompanied by an overall loss in tool diameter due to flank wear [1]. To a certain extent, the drive (spindle and axles) makes up for this by applying more torque to achieve the same tool rotation speed and cutting velocity. Over time, this tool deterioration leads to quality losses on the part (e.g., surface quality) and increases the risk of a tool break, which in turn might cause either destruction of the current part or, if detected, at least an unplanned downtime to replace the tool [2]. One standard operating principle to overcome this risk is the exchange of tools after a certain tool lifetime. To be on the safe side, these often reflect some safety margin, meaning the tool is exchanged before it is really worn down. Thus, detecting tool wear has been a hot topic for several years in the machining community [3]. Sensor concepts as well as control data pipelines have been applied to create enough raw data with which to detect tool wear. With the rise of Industry 4.0 and factory digitalization, data abundance can become a problem—too many single signals or data points make it harder to derive a clear picture. This contribution presents an exploratory proof-of-concept use case focused on the discrimination of clearly distinct tool conditions, specifically new and end-of-life (EoL) tools, using aggregated machine and sensor data. The study further investigates how this discrimination is affected by variations in cutting parameters and whether generative AI can support the associated data-preprocessing tasks.
While sensor-based monitoring and machine learning algorithms for tool condition monitoring have been widely researched, significant research gaps remain regarding their practical implementation in small and medium-sized enterprises (SMEs). Existing solutions often demand deep expertise in specialized data science frameworks (e.g., Python) or advanced signal processing, creating high entry barriers for manufacturing domain engineers. Furthermore, the integration of low-code workflow environments with emerging generative AI (GenAI) tools for automated data preprocessing remains insufficiently explored. This study addresses this research gap by evaluating an end-to-end data pipeline that combines standard OPC-UA machine telemetry, low-code processing platforms (KNIME), and Large Language Models (LLMs) to democratize tool wear preprocessing and detection in smart manufacturing environments.
2. State of the Art
This contribution seeks to review a concrete use case of data analytics for CNC and sensory data fusion to detect machine tool wear and tear. Thus, two topics are relevant when looking at the state of the art—data analytics for machining and the detection of tool wear and tear. As the first is a very broad topic, only an overview will be given to introduce the reader to the overall topic.
2.1. Data Analytics for CNC Milling
Initial research on data analytics for the improvement of CNC milling goes back to the 1980s [4], especially with the second wave of AI and the introduction of back-propagation as a learning technique for artificial neural networks [5], which were applied to sensor data integration [6,7], optimizing and adapting CNC programs [8], or parameter suggestion [9] early on.
With the rise of Industry 4.0 in the early 2010s [10], data analytics for CNC milling optimization once again became a central topic as more and more data became available. With ubiquitous computing, continuous and broadband networking, as well as more and more easy to adopt sensors [11], big data technologies suddenly became necessary and were adopted widely. Applications ranged from the prediction of process results [12] to the optimization of process parameters [13] or even advanced control strategies [14].
With the third wave of artificial intelligence and the introduction of generative AI [15], again new tools and methods became available for CNC milling optimization. While straightforward approaches such as Mukherjee et al. suggest the use of large language models for trouble shooting and worker assistance [16] and Okuno et al. used the same technological basis for the generation of G Code for CNC mills [17], more complex approaches are looking into combining digital twins (DT) with generative AI to enhance process autonomy [18], efficiency, and reliability [19]. Furthermore, recent advancements have demonstrated that integrating digital twins with generative AI can unearth the complex physical connections between high-frequency vibration signals and progressive tool wear, thereby significantly enhancing predictive condition monitoring [20].
Recent advancements have demonstrated the potential of repurposing LLMs for general time series analysis, such as the Time-LLM framework and GPT4TS, which reprogram pre-trained language models for numerical forecasting [21,22]. Comprehensive surveys indicate that while techniques like direct prompting and time series quantization are emerging, their application remains heavily focused on domains like finance and weather [23]. In industrial manufacturing environments, however, the use of LLMs for structured numerical time series preparation remains comparatively underexplored. Existing research has mainly addressed operator assistance, industrial dialogue systems, code generation, or broader GenAI-enabled digital-twin applications [16,17,18]. The present study therefore focuses specifically on the preprocessing stage of industrial sensor data, where raw machine telemetry must first be cleaned, structured, filtered, and aggregated before downstream classification.
2.2. Tool Wear Analysis
Tool wear analysis and detection has been a hot topic for the machining community for many years. In most classical cases, tool wear is initially tested or estimated, and subsequent runs will lead to tool exchange after counting this initial estimate. Thus, efficiency gains are suspected when tools are not used to the end of their life cycle but instead exchanged after said fixed number of runs to avoid tool breakage and subsequent part damage [24]. Methods for tool wear detection typically fall into three categories.
- (1)
- Deduction of information based on motor data, e.g., from the spindle and/or the drives: Motor voltage, speed, etc. can be derived directly from the machine control (often CNC), and modern machines are often equipped with data-connectors such as OPC-UA [25,26]. Thus, reading and analyzing these data depicts a natural first step.
- (2)
- Optical detection: Sharp new tools have a very different look from used ones at the end of their lifetime. Rounded edges, abrasive wear, material adhesion of the part being machined, etc. can be detected via cameras and, e.g., classified. Due to the use of coolant and lubricants as well as the speed requirements, such solutions often incur high efforts and cost [27,28,29,30].
- (3)
- Additional sensors: The most common sensors to detect tool wear are either vibration sensors or acoustic sensors. As the tool deteriorates, friction increases, thus also increasing vibration and noise. Such sensors often provide data at very high frequency that require postprocessing [31,32,33].
2.3. Interim Conclusion for State of the Art
Hypothesis 1.
As most modern CNC mills offer the possibility to extract data via OPC-UA and tool wear is directly linked to the basic machine data such as spindle power, building a simple classifier to detect worn tools should be easily achievable. This hypothesis is grounded in fundamental cutting mechanics; as flank wear progresses, the contact friction between the tool and the workpiece increases, which directly translates into a mathematically higher torque requirement and consequently elevated electrical power consumption at the spindle [1].
Hypothesis 2.
Ease of data analysis for domain experts. Classical data science heavily depends on programming languages such as Python and its attached libraries. To facilitate rapid deployment and maximize workflow efficiency in daily production environments, tools with lower technological entry barriers such as Low-Code/No-Code platforms provide noticeable relief in data analysis.
The following contribution seeks to test these two hypotheses in the light of a concrete use case—the detection and classification of tool wear in an example case from the model factory of the TH Köln University of Applied Sciences. Firstly, the experimental setup will be introduced. This encompasses the machine, basic setup, as well as sensors, etc. Secondly, the data analysis pipeline will be introduced. In Section 4, the results from the experiments conducted will be discussed, with a focus on the clarity and significance of the classification algorithm. Finally, the applicability of generative AI on the use case will be presented and discussed as an interesting way to reduce classical data analytics efforts in manufacturing engineering.
3. Experimental Setup
This chapter presents different approaches to measuring tool wear in CNC milling. The first part focuses on process-generated signals. In the initial experiments, only signals already available from the CNC machine were considered, primarily electrical current and power data from the machine’s drive axes. In the second phase of the experiments, an additional sensor was introduced to measure vibration signals on the different axes of the CNC mill.
The second part presents two approaches for analyzing these signals. First, the signals are examined using a conventional data analysis pipeline implemented in KNIME and following a step-by-step KDD-style process [34]. Second, different large language models are used to perform the same analysis task in order to explore whether prompt-based analysis could become a useful tool for manufacturing engineers in the future.
3.1. Basic Machine Setup
To ensure comparability within each experimental series, the boundary conditions and nominal cutting parameters were kept constant for the corresponding baseline experiments. The experiments were conducted on a DMG Mori (DMG MORI AG, Bielefeld, Germany) three-axis milling machine equipped with a standard Siemens control system. This control system already included an integrated OPC UA server. To acquire data from the CNC machine, a Raspberry Pi 5 (Raspberry Pi Ltd., Cambridge, UK) running a Node-RED script was used to automatically collect OPC UA machine data from the control system once per second. The data were then transferred to a local time series database (influx). For initial visual analysis, a Grafana-based dashboard was used. This technology stack was selected to support low-cost local acquisition, storage, and visualization of machine data.
It should be noted that the internal measurement uncertainty and calibration traceability of the Siemens CNC controller’s current and power sensors are not specified by the manufacturer. However, for the purpose of this proof-of-concept, these signals are treated as relative baselines to detect macroscopic wear-induced deviations rather than traceably calibrated metrological quantities.
For the physical machining process, solid carbide (VHM) end mills with a diameter of 10 mm and 4 flutes were utilized with a 35° helix angle. The experiments focused on conventional peripheral milling (side milling) of a square workpiece made of C45E + N steel. To represent the end-of-life (EoL) state, three VHM end mills of the same type from August Rüggeberg GmbH & Co. KG (PFERD Tools, Marienheide, Germany) were used in the manufacturer-defined wear condition. The corresponding flank-wear (VB) values were reported as 142.6 µm, 153.2 µm, and 164.9 µm, respectively. No independent VB measurement using microscopy or a comparable metrological instrument was performed in this study; the manufacturer-provided wear-state information was therefore used as the reference for tool condition.
For vibration measurement, a GED SensorNode (GED mbH, Ruppichteroth, Germany) was installed close to the spindle underneath the machine enclosure as a retrofit sensor. The sensor records acceleration in three axes (X, Y, Z). The nominal measurement range is ±16 g with a resolution of 0.73 mg/digit in the default configuration. No formal sensor uncertainty specification was available for the experimental setup; the signal was therefore used as an empirical vibration indicator rather than as a traceably calibrated metrological quantity. The nominal sampling rate of the sensor is 1000 Hz, while an effective sampling rate of approximately 400 Hz was obtained during the experiments. The acceleration data were acquired digitally within the SensorNode and transmitted via Bluetooth Low Energy (BLE) to a BLED112 USB dongle (Silicon Laboratories Inc., Austin, TX, USA) connected to a Windows computer. GED SensorHost v2.4.8 was used for live visualization and CSV export. The resulting files were subsequently processed for analysis.
The cutting parameters applied during these operations are detailed in Table 1.
Table 1.
Overview of the cutting parameters.
In a second step, a vibration sensor was added to the spindle drive to measure vibrations in all 3 axes (X, Y, Z). Due to the high-frequency nature of vibration, the query rate for this sensor was much higher than for the data-heavy messages from OPC-UA. Even though OPC-UA depicts a standardized way of machine communication, the exact messages are not standardized. A glimpse into this can be deducted from Figure 1.
Figure 1.
Raw data coming from the CNC (lines prefixed with '#' represent InfluxDB CSV metadata headers).
Data formats, e.g., regarding date and time, are not automatically readable; also, columns need to be cleared and sometimes data formats adapted. To achieve this data preparation stage before starting analysis and modeling, an analysis pipeline was necessary.
3.2. Data Analysis Pipeline
Different software platforms are available for data analysis. While most professional data scientists prefer Python and its wide range of libraries, manufacturing engineers, as typical “domain-expert engineers”, often prefer to work with visual, drag-and-drop environments that might limit the analysis options, but at the same time provide more robustness as they are less error-prone in handling. Several platforms are available, such as KNIME, RapidMiner, Alteryx, or Palantir. Due to the wide adoption of KNIME in German universities and its open access model, this platform was chosen.
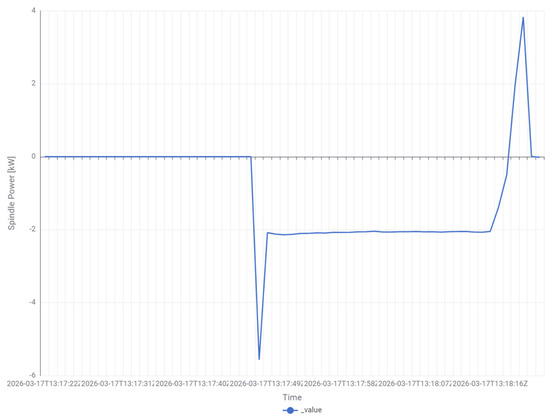
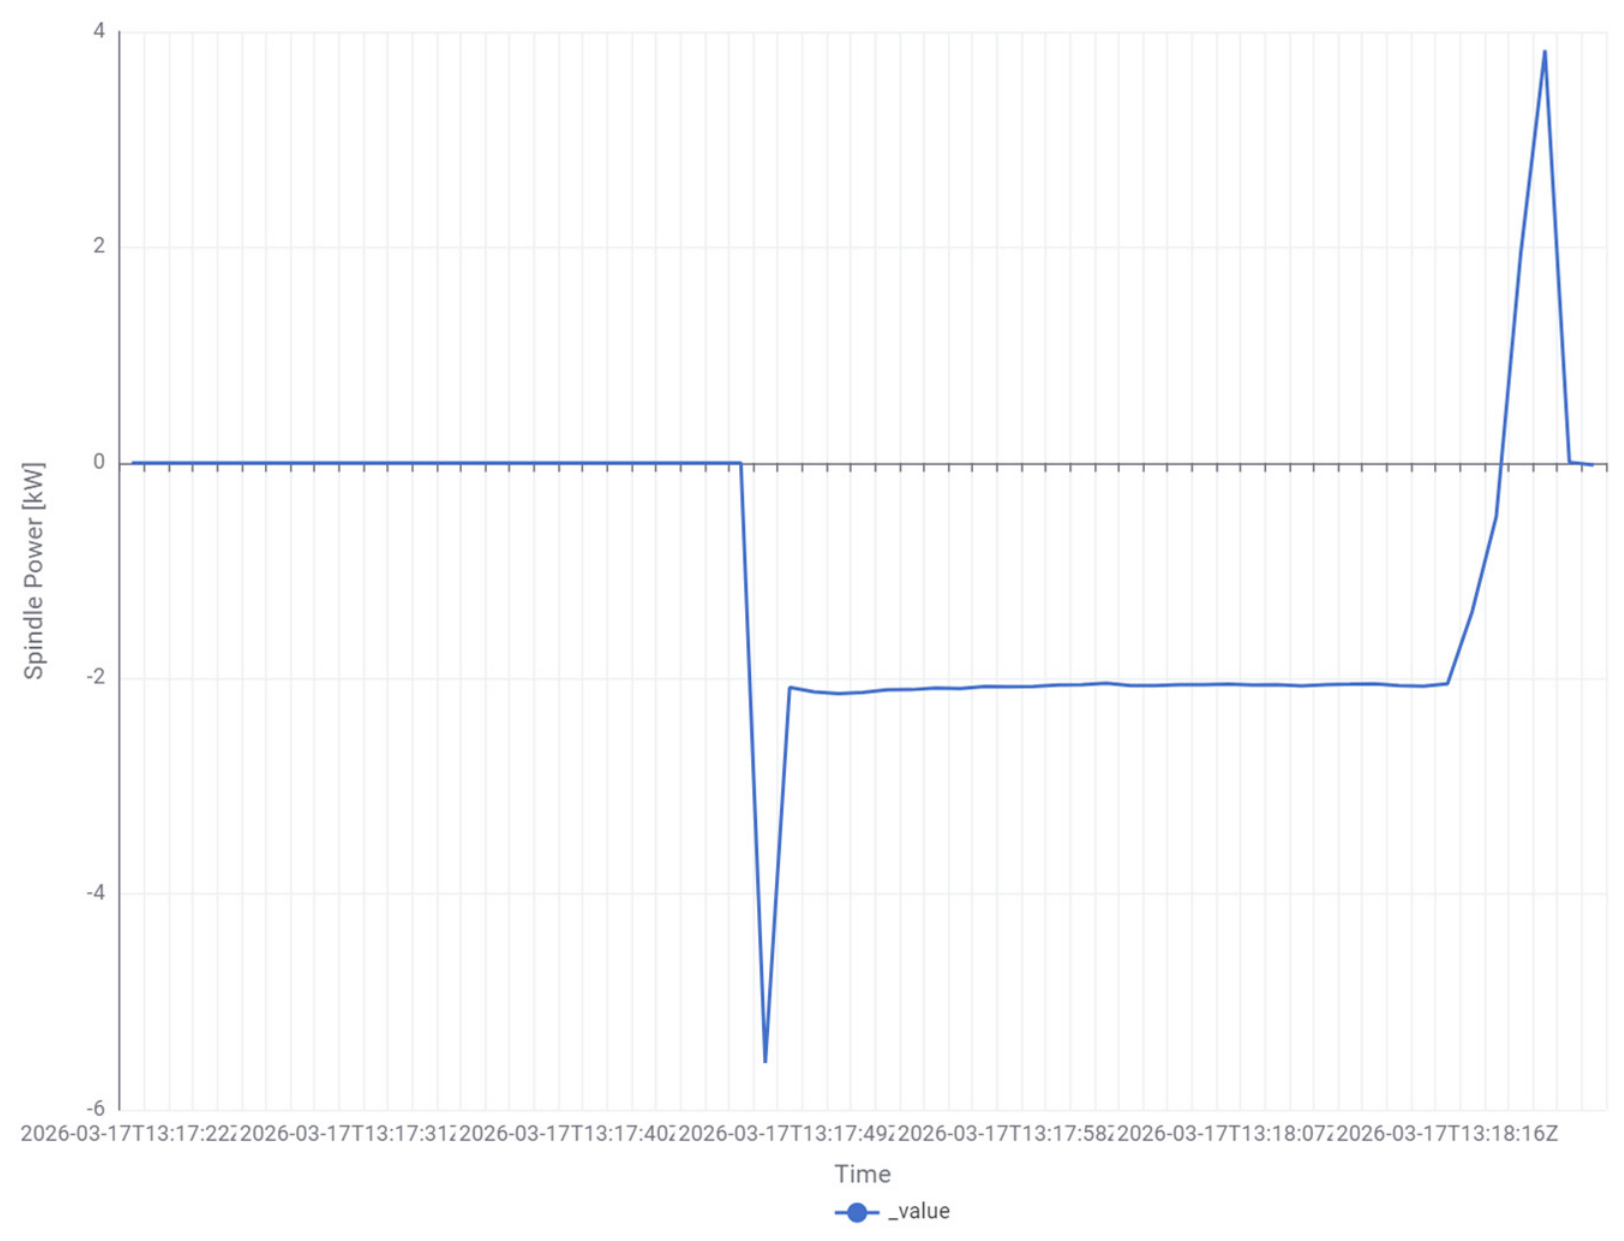
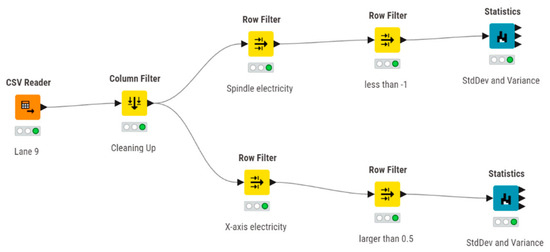
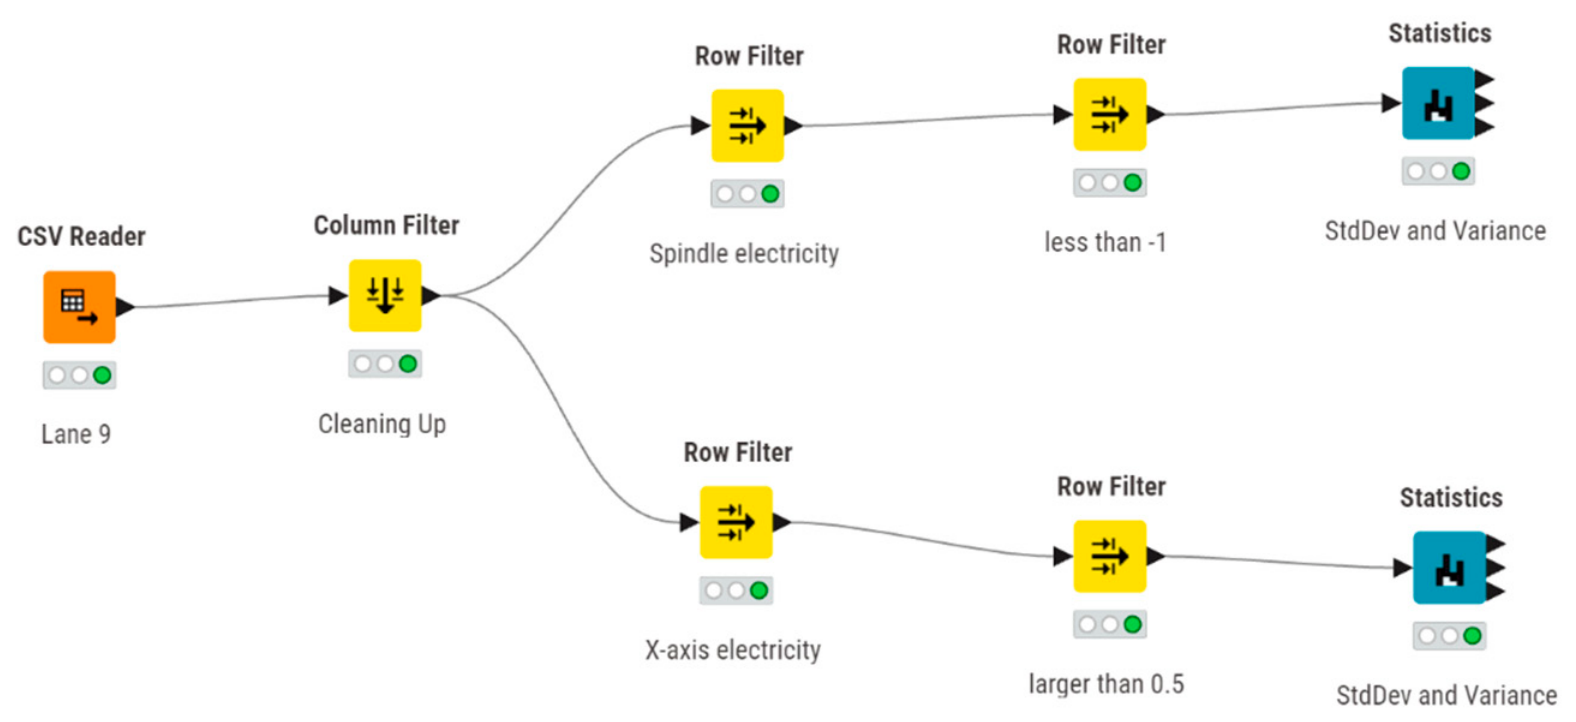
An initial glimpse into the raw time series data (Figure 2) made clear that as the data covered a whole cutting program, significant idle time existed before and after direct contact with the workpiece. Therefore, a data analysis pipeline was required to filter out these idle phases, clean empty columns, and split the datasets for the different drives (e.g., the spindle and the x-axis).
Figure 2.
Visual overview of spindle motor power in raw format.
In a second step, the whole time series of one cut was condensed statistically to convey only the average power consumed as well as the minimum, maximum, and the standard deviation of the data points during the measurement period. The entire data flow is depicted in Figure 3.
Figure 3.
The data analysis pipeline for OPC-UA data.
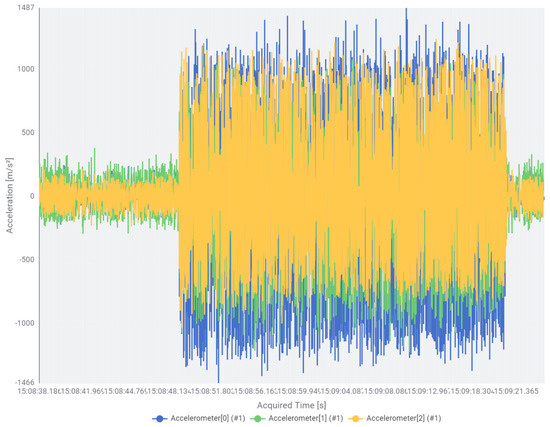
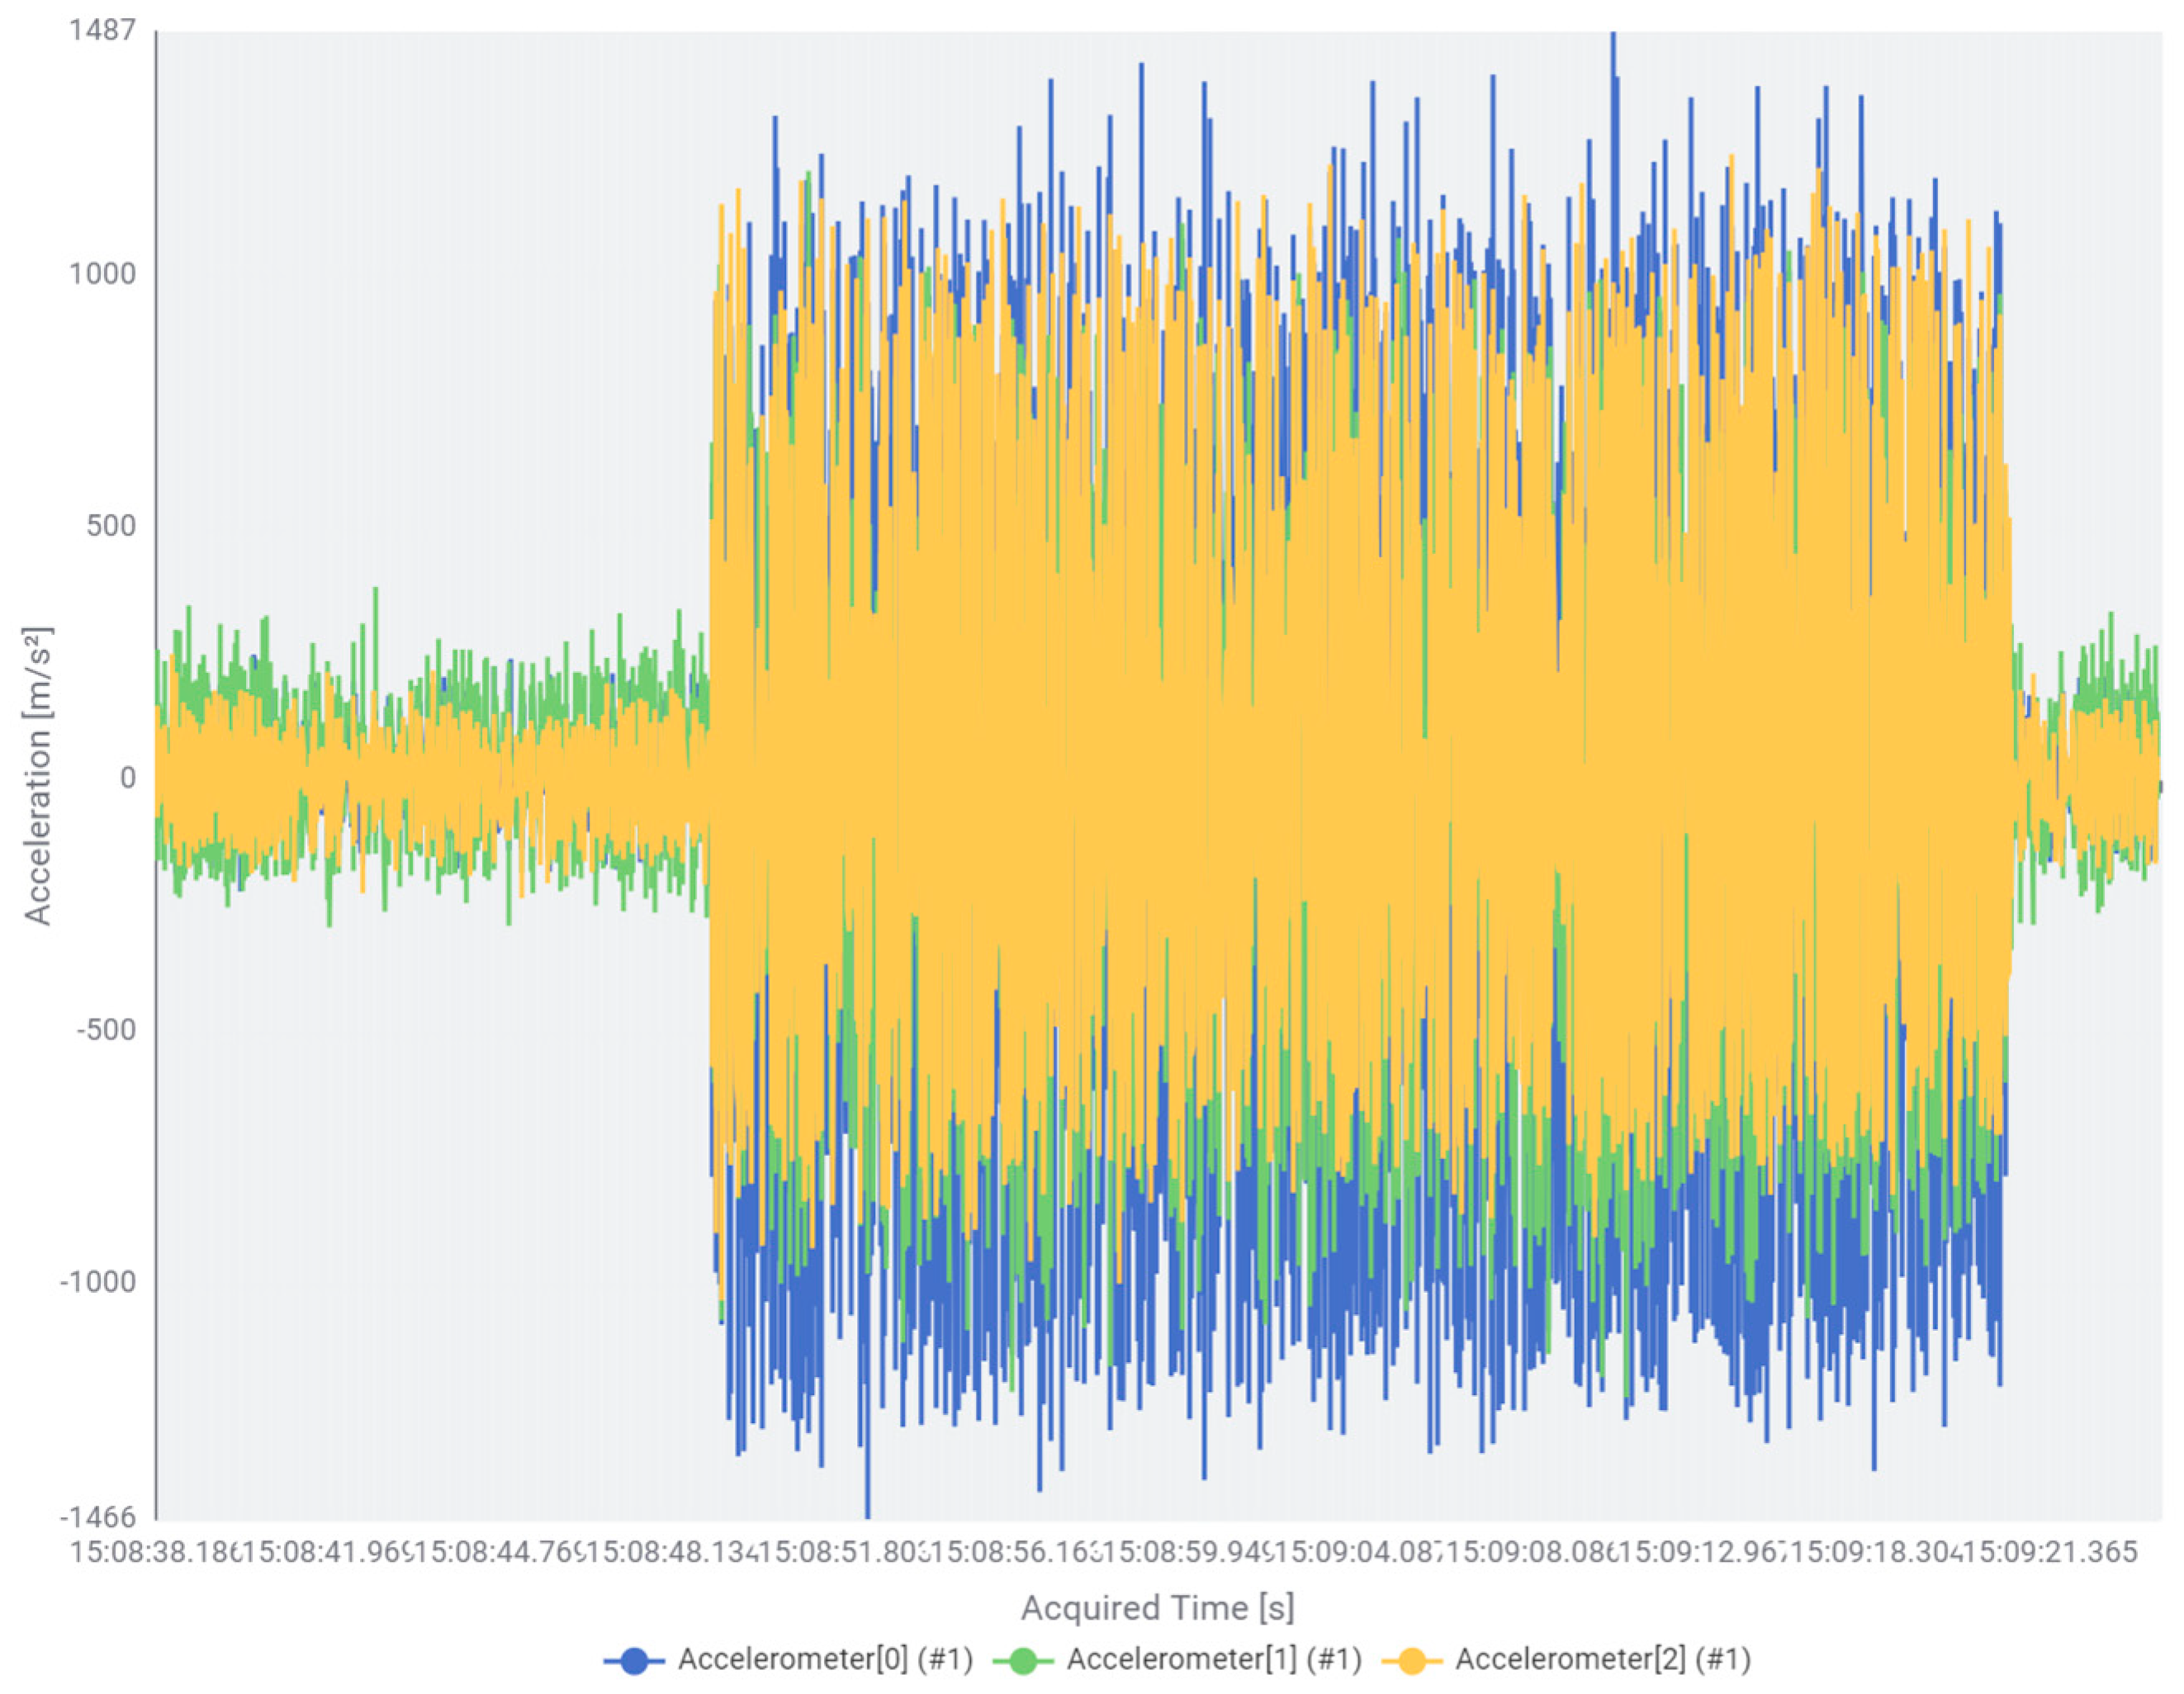
When looking at the initial, unfiltered vibration data (Figure 4), a similar pattern emerged. Firstly, the idle time before and after the direct contact with the workpiece needed to be filtered out. As visible in Figure 4, the initial segment (seconds 0–39) represents the idle movement of the milling head before engagement, while the effective material cutting interval clearly starts at approximately second 39, marked by a sharp rise in amplitude. Secondly, as vibration in this case is symmetrical around a zero line, the absolute values were calculated.
Figure 4.
The raw vibration data (Note: The y-axis values represent raw digital sensor output in mg, not absolute m/s2, ‘#1’ denotes the hardware SensorNode identifier).
Finally, as these data were sampled at a much higher frequency, a moving average was calculated. While from a rigorous signal processing perspective, pure time-domain moving averages risk attenuating critical high-frequency features (such as tooth passage frequencies), this approach was deliberately selected for this initial study. The primary objective was to prioritize workflow simplicity and evaluate the diagnostic boundaries of using the most basic, easily accessible mathematical nodes for manufacturing engineers without formal signal processing expertise.
The entire data pipeline is presented in Figure 5. Within this KNIME workflow, three specific “Math Formula” nodes were implemented to process the raw sensor data. The first node calculates the absolute value of the signal. The second node applies a DC-offset filter to eliminate static baseline shifts. The third node computes the Euclidean magnitude of the three-axis vibration vector, condensing the spatial data into a single metric defined as .
Figure 5.
The data-analysis pipeline for vibration sensor data.
Following these preprocessing steps, the data were condensed statistically to convey only the average vibration as well as the minimum, maximum, and the standard deviation of the data points during the measurement period. The same data pipeline was used consistently for all 33 data sets. Specifically, these datasets consist of 3 baseline measurements (comparing new versus worn tools under fixed parameters) and 30 parameter-varied experiments (representing 10 different parameter combinations across 3 wear states). All raw datasets remain publicly accessible in our associated Sciebo repository.
4. Results
As outlined in the methodology, the overall evaluation is based on a total of 33 datasets, which consist of 3 baseline measurements under fixed parameters (detailed in Section 4.1) and 30 parameter-varied experiments (detailed in Section 4.2).
4.1. Fixed Process Parameters
Table 2 presents the consolidated data. For three sets of cuts with a new tool as well as cuts with a used tool ending its end-of-life, the electricity data was gathered via OPC-UA. For the motor current of the spindle as well as the drive in the X-axis, the average value as well as the standard deviation were consolidated from the raw data. This was matched with vibration data coming out of an additional sensor in all three axes (AccX, AccY, AccZ). As depicted in the previous chapter, the data were consolidated to one average value per experiment.
Table 2.
Process parameters and consolidated sensor data.
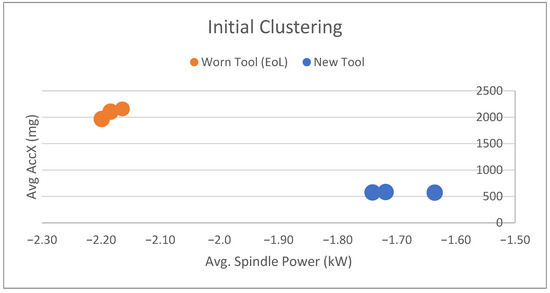
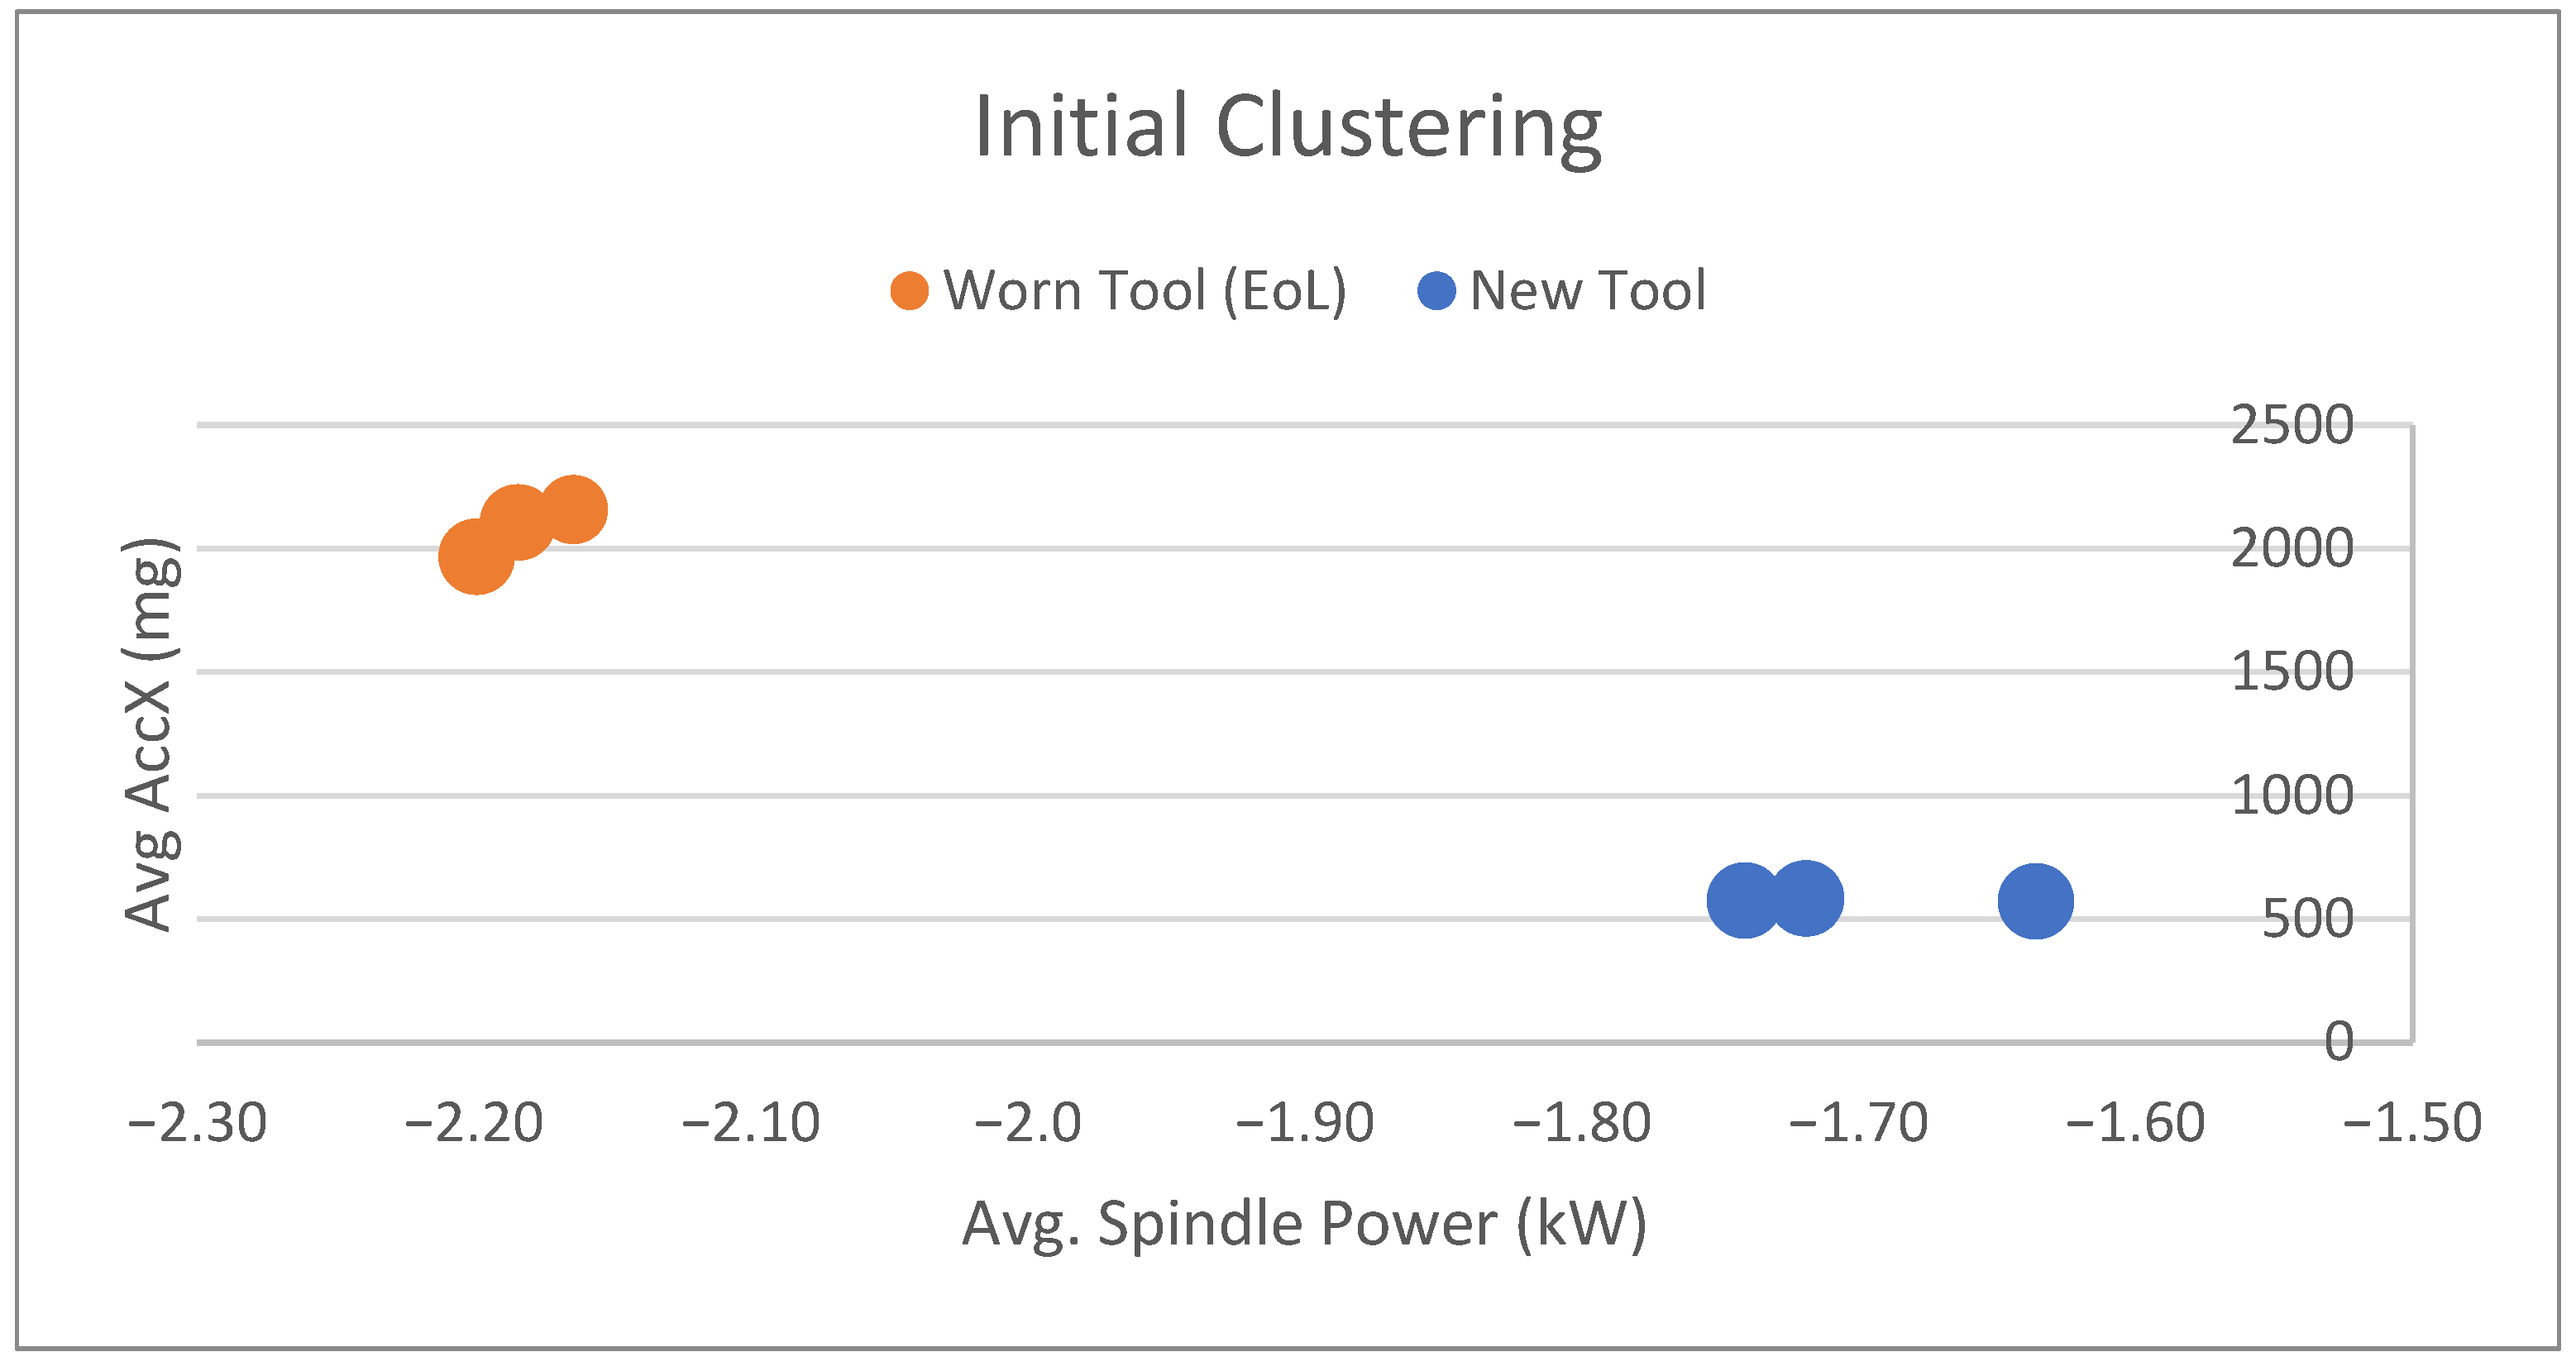
Figure 6 Simply clustering the data points reveals their stark contrast. Data points in blue represent cuts with a new tool, while orange points represent cuts with tools at their end-of-life (EoL). The x-axis shows the Average Spindle Power (kW), and the y-axis shows the Average Vibration in the X-direction ().
Figure 6.
Clustering of consolidated process and vibration data for new-tool and end-of-life (EoL) states under fixed cutting parameters. The x-axis shows the Average Spindle Power (kW), and the y-axis shows the Average Vibration in the X-direction (mg).
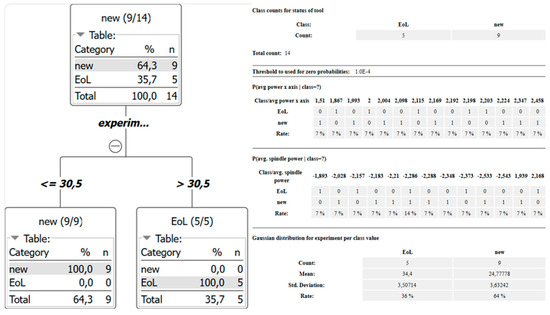
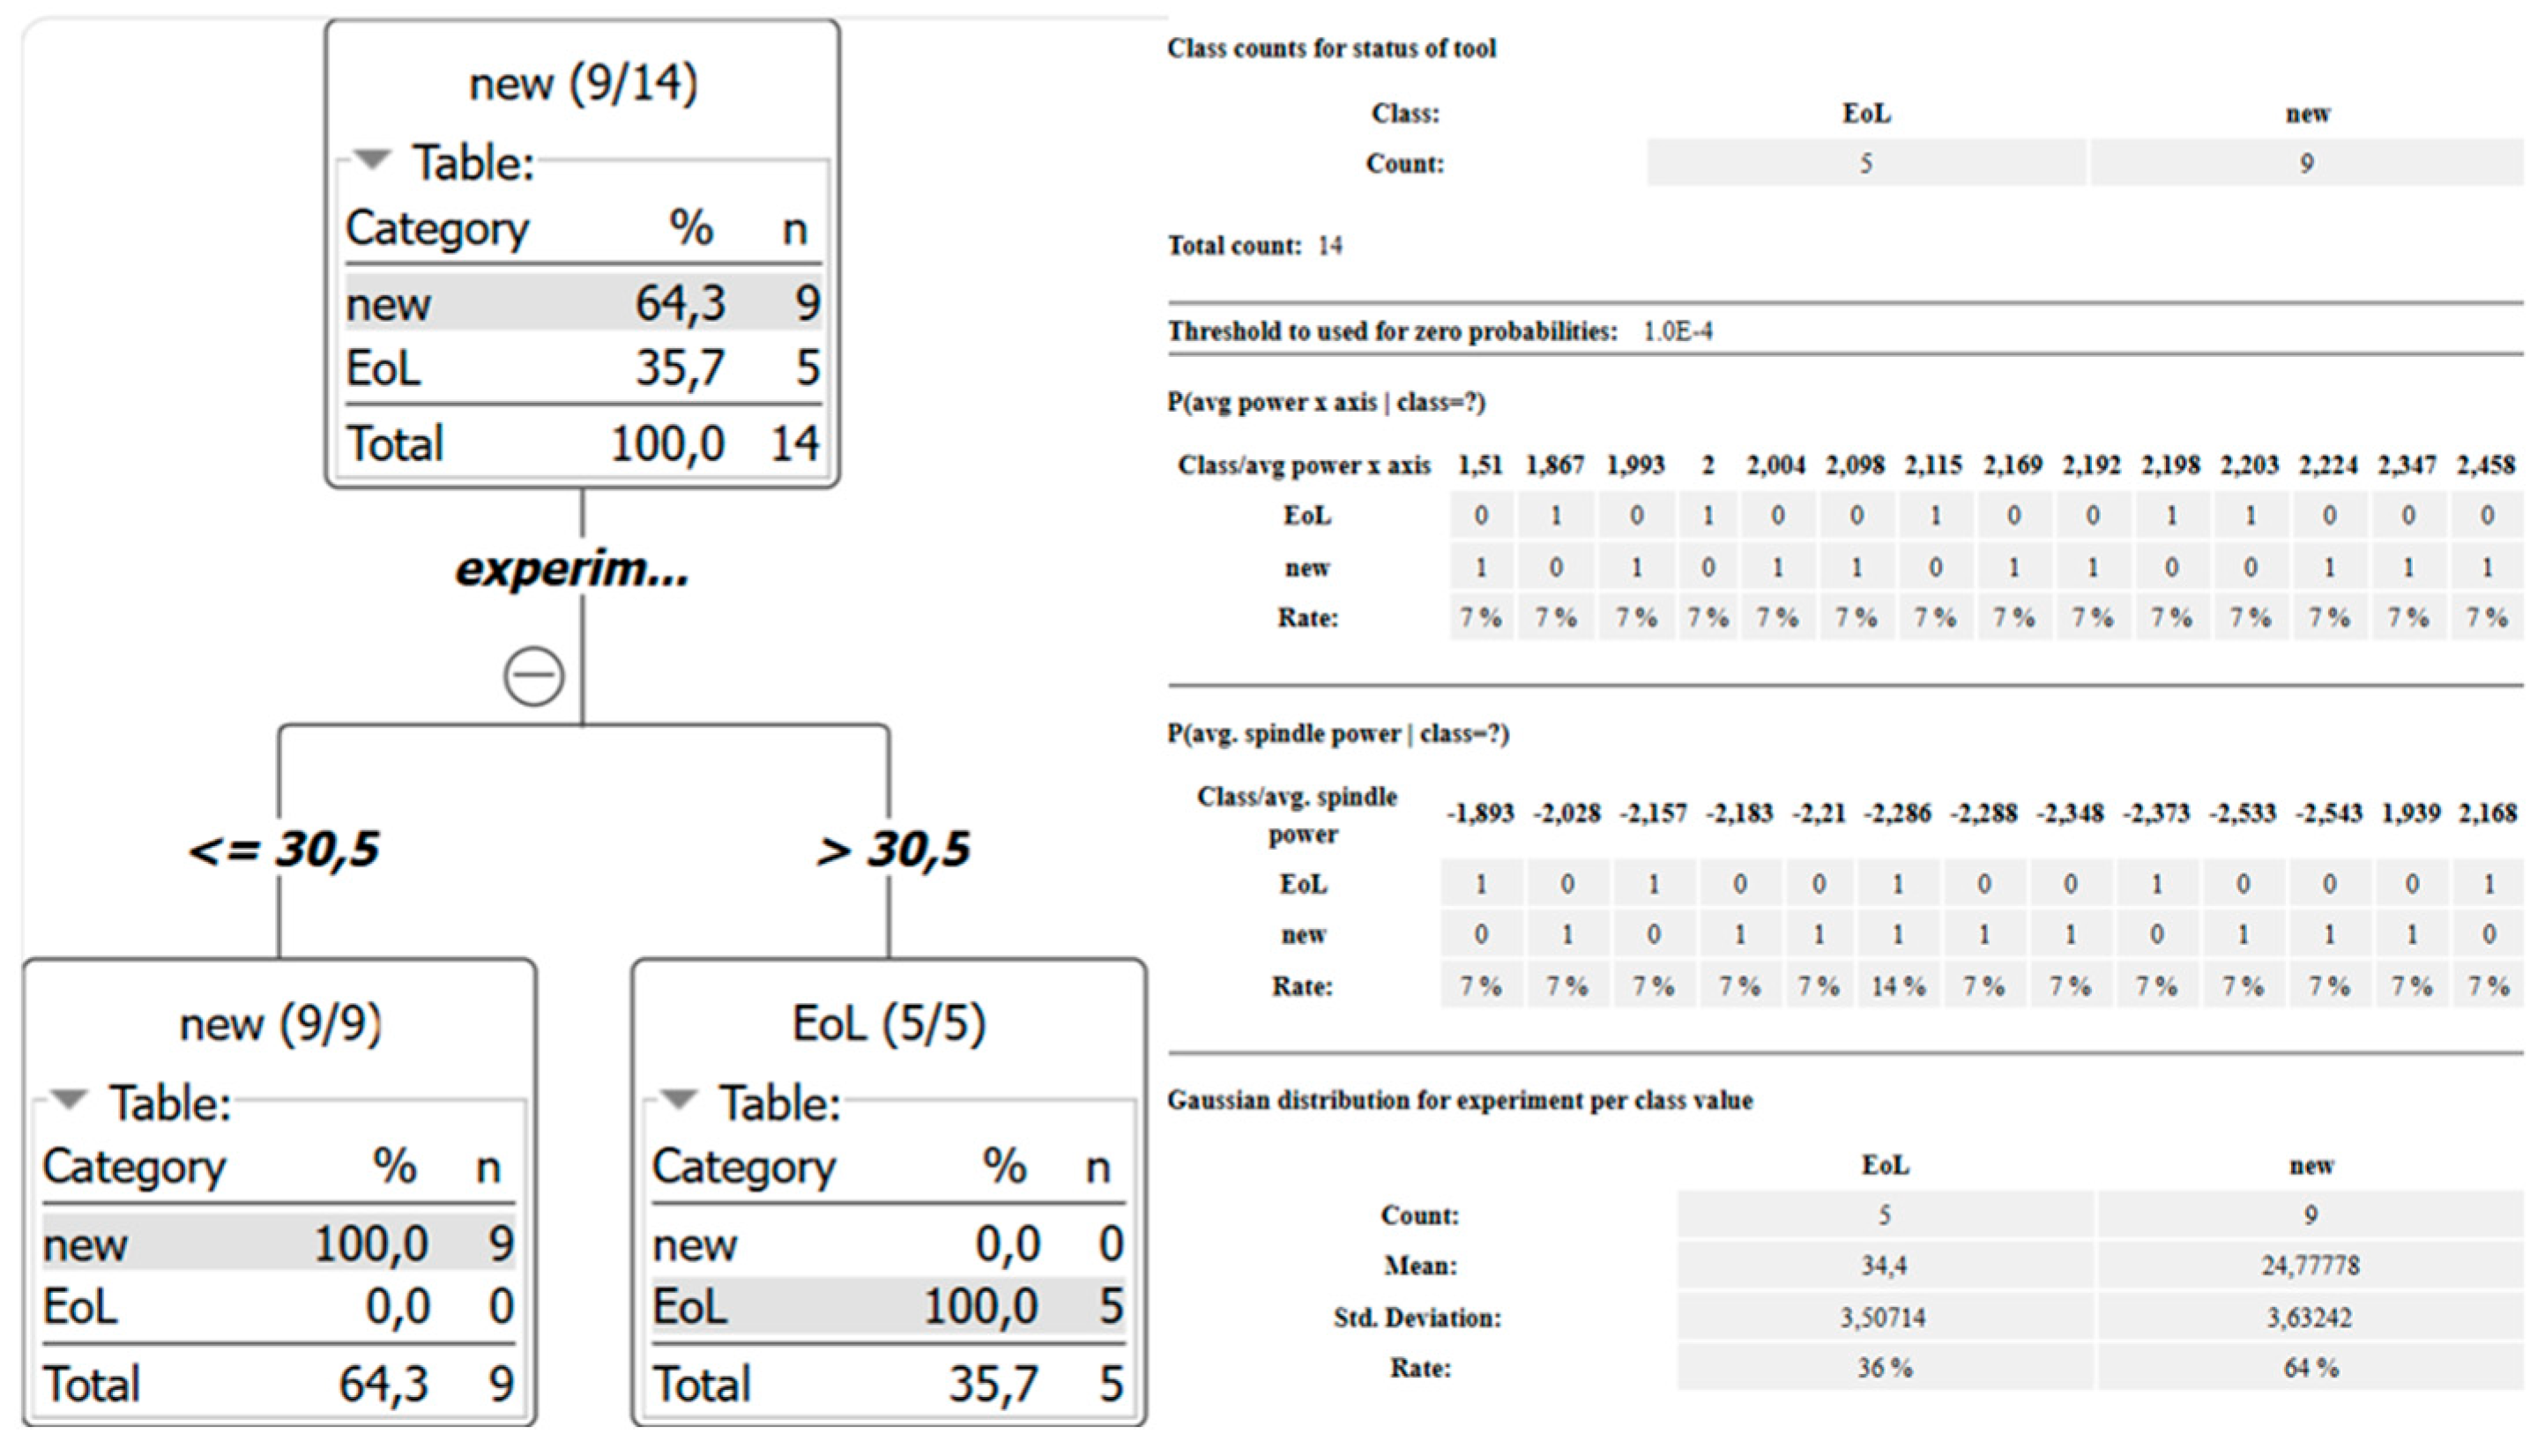
The strong separation indicates that simple classification algorithms are sufficient for the investigated fixed-parameter case. When asked to create a simple decision tree in the same KNIME software (version 5.2.0, KNIME AG, Zurich, Switzerland) described above, just defining a threshold value appeared enough for a class distinction; the same is true for, e.g., a Naïve Bayes classifier (see Figure 7).
Figure 7.
Example classification results under fixed cutting parameters using a decision tree (left) and Naïve Bayes classifier (right).
As can be deduced from this first set of experiments—if the cutting parameters are stable and well known, classifying used and new tools is straightforward. Most of the effort is expended on processing and aggregating the raw data, as formats such as OPC-UA do not solve data format inconsistency issues completely.
It should be noted that while three wear states were produced during experiments, the core analysis in this initial feasibility study deliberately focused on the binary distinction between extreme states (new tool vs. end-of-life/EoL). This binary boundary approach was intentionally selected to first establish the baseline physical sensitivity and signal-to-noise ratio of standard OPC-UA drive metrics. The moderate wear stage represents a complex, non-linear transitional regime where signal fluctuations are more subtle. The present study therefore does not claim to provide continuous or multi-class tool-wear tracking. Such progression-aware classification represents an important direction for future work and requires additional intermediate-wear experiments as well as richer feature extraction.
4.2. Process Parameter Variation
In a second attempt, the cutting parameters were varied to introduce more randomness and test the robustness of the classification results. Parameters were varied along a “healthy” corridor so as not to damage the machine or tools. The overall variance is presented in Table 3. Due to technical constraints, only OPC-UA data regarding the electrical power could be measured in this instance.
Table 3.
Process parameter variations.
Cuts were conducted with each parameter variation with three tools—one new, one at the end of its lifecycle, and one in between. The same data aggregation pipelines were again used as depicted above. For each of the 30 cutting experiments, more than 400 raw data points were recorded. These measurements were subsequently aggregated into statistical features such as average spindle power for each experiment. Detailed experimental data and evaluation metrics are provided in the Supplementary Materials (Table S1). A total of 20 samples representing the new-tool and EoL states (10 samples per class) were selected for the binary classification task. A 60–40 split was intentionally selected over a conventional 80–20 ratio due to the limited size of the representative parameter variation dataset (N = 20). Given the limited sample size, the resulting precision and recall values should be interpreted descriptively rather than as statistically robust performance estimates.
Neither a Naïve Bayes classifier, a k-nearest neighbor algorithm, nor a decision tree produced a satisfying result to distinguish between new and used tools at the end of their lifetime, as depicted in Table 4. Surprisingly, all three produced the same number of correct and incorrect estimations.
Table 4.
Algorithm performance comparison.
The observed classification performance should be interpreted in light of the limited dataset size and the deliberately simple feature representation used in this study. Only 20 representative samples from the parameter-varied experiments were available for the binary classification task, and the features were restricted to aggregated time-domain statistics such as mean values and standard deviations. Under changing cutting conditions, these features do not sufficiently separate the effects of tool wear from those caused by process-parameter variation. The evaluated classifiers therefore did not achieve satisfactory discrimination in the present experimental configuration. This finding should not be interpreted as evidence of an inherent limitation of classical machine-learning algorithms; rather, it highlights the need for larger datasets and richer feature engineering when operating conditions vary.
Based on the observed distributions, the sub-groups overlap substantially, as shown in Table 5.
Table 5.
Comparison of sensor values across extreme wear states.
To summarize: While the aggregated power features provided sufficient separation between the tested new-tool and EoL states under stable process conditions, the evaluated classifiers did not achieve satisfactory performance when cutting parameters were varied. The observed degradation in classification quality is likely related to the combination of parameter-induced signal overlap, the limited number of training samples, and the deliberately simple time-domain feature representation used in this study. Consequently, the present results identify limitations of the investigated feature set and dataset rather than an inherent deficiency of classical machine-learning methods. This finding highlights the need for larger datasets and richer feature engineering when tool-wear classification is performed under variable operating conditions. For this reason, we investigate generative AI tools as complementary support for data cleaning, structuring, and interpretation rather than as replacements for numerical classification algorithms.
5. Using GenAI to Preprocess Data
In this study, LLMs are investigated as complementary preprocessing and interpretation tools rather than as validated replacements for numerical classifiers. Their ability to clean, structure, and aggregate manufacturing data was evaluated quantitatively against the deterministic KNIME workflow, whereas reliable LLM-based classification of tool-wear states under variable process conditions remains outside the scope of the present study.
Large Language Models (LLMs) depict a modern group of Generative Artificial Intelligence (GenAI) that focuses mainly on language interpretation and generation. Most applications in the domain of manufacturing technology have arisen in the area of chatbots and knowledge systems, sometimes augmented by retrieval systems (so-called “RAG pipelines”). These autoregressive language models have also shown great potential in supporting software development, especially coding.
As the preceding chapter has shown, a lot of time and effort for manufacturing process engineers still must be spent on data cleaning, structuring, and aggregation. Thus, we decided to research the applicability of different LLMs as support tools for said initial data preparation. As an initial start, we selected major vendors in the Western Hemisphere, namely Microsoft, Google, Anthropic, and OpenAI, all using their free models.
While some models were not able at all to handle the amount of raw data due to restrictions, e.g., regarding Tokens, especially especially Antigravity (based on Gemini 3.1 Pro, Google LLC., Mountain View, CA, USA) as well as Claude Sonnet Free (Anthropic PBC, San Francisco, CA, USA) were perfectly able to handle the raw data to clean, structure, and aggregate it. The results matched our own data analysis within normal statistical margins.
5.1. Physics-Constrained Prompt Schema
To reduce unconstrained model behavior and address the specific requirements of industrial time series preprocessing, the LLM workflow was structured around a physics-constrained prompt schema. Rather than relying on the generic conversational capabilities of the LLM, the data-preparation tasks were governed by explicit physical and methodological rules. The schema incorporates the following four constraint categories along with a defined result-checking logic.
- ○
- Input Constraints: The LLM is required to explicitly acknowledge the machine ID, tool state labels, cutting parameters, and measurement units before initiating any processing steps.
- ○
- Processing Constraints: The prompt strictly prohibits the modification of raw measurements. The LLM must retain original units, strictly distinguish between measured and calculated values, and report missing or anomalous data points explicitly instead of interpolating them autonomously.
- ○
- Physical Plausibility Constraints: Domain-specific physical rules are embedded into the prompt. For instance, increased spindle load must be evaluated consistently with the given cutting parameters. Changes in power consumption must be considered jointly with feed rate and cutting depth, and the LLM is instructed not to draw definitive tool-wear conclusions from a single isolated sensor value.
- ○
- Verification and Result-Checking Logic: To ensure reliability, the LLM is mandated to expose intermediate calculation steps. This enables a direct comparison of the LLM’s aggregated outputs with the deterministic results from the KNIME workflow, flagging any numerical deviations that exceed predefined thresholds.
An overview of the results is presented in Table 6:
Table 6.
Practical deployment characteristics of evaluated LLM platforms.
The objective of evaluating different LLM platforms was not to benchmark commercial products, but to assess the practical feasibility of prompt-based preprocessing workflows in industrial environments. Consequently, the focus of this study lies on the capability of the models to clean, structure, aggregate, and interpret manufacturing datasets with minimal programming effort rather than on model-specific performance differences. The platform comparison therefore serves as an illustrative example of current implementation constraints encountered by manufacturing engineers during practical deployment.
To address the requirement for a cohesive system integration, the proposed methodology adopts a synergistic cross-validation architecture rather than operating two isolated pipelines. In this collaborative setup, the LLM and KNIME fulfill complementary roles. The LLM acts as a semantic planning layer by proposing a conceptual sequence of preprocessing steps based on the dataset structure and the analysis objective. These proposed steps are then implemented and validated within the deterministic KNIME workflow. Finally, to ensure data integrity, the numerical outputs from the deterministic KNIME workflow are systematically cross-validated against the LLM’s own aggregation results. This architecture ensures that the flexibility of generative AI is effectively grounded by the reliability of a deterministic rule engine, providing a complementary planning-and-validation workflow loop before any downstream classification is performed.
For example, during the preprocessing phase, the LLM correctly identified the need to compute the Euclidean magnitude of the triaxial vibration data and proposed the use of a ‘Math Formula’ node (defined as ). This semantic proposal was subsequently configured in the KNIME workflow, where the deterministic execution yielded a 0% numerical deviation compared to the LLM’s own aggregated output, successfully validating the synergistic planning-and-execution loop.
To systematically verify the accuracy of the LLM-based data preprocessing, a quantitative cross-validation was performed. The statistical metrics (e.g., average spindle power, total energy consumption, and peak power) extracted by the LLM pipelines were compared against the ground-truth calculations generated by the deterministic KNIME workflow. Table 7 illustrates this comparison for a representative parameter setup (Measurement 7: = 5.0 , = 4.0 , 100% velocity) across the tested AI platforms.
Table 7.
Quantitative cross-validation of LLM preprocessing versus KNIME baseline for Measurement 7.
For the investigated preprocessing tasks, the numerical deviations observed between the LLM outputs and the KNIME baselines remained below 1% in the evaluated cases. This quantitative verification indicates that the evaluated models were capable of reproducing the investigated basic numerical aggregation and data-structuring tasks with high numerical fidelity.
Overall, the integration of LLMs for data preprocessing represents a significant shift from traditional code-heavy data science towards accessible, prompt-based engineering. The core scientific value lies in the democratization of industrial data pipelines. By enabling domain-expert engineers to clean, align, and extract statistical features from high-frequency time series using natural language, the technological entry barrier for implementing condition monitoring in SMEs is substantially lowered.
5.2. Quantitative Workflow Comparison
To substantiate this claim of lowered technological entry barriers, a quantitative methodological comparison was conducted. Table 8 contrasts the conventional deterministic approaches (Python 3.11 with pandas scripting and KNIME-only) with the LLM-based and synergistic workflows. The comparison evaluates execution runtime, numerical error rate against the ground truth, and manual implementation workload for the representative preprocessing task of aggregating the raw experimental data into final statistical features. Python and KNIME execution times were benchmarked on a standard engineering workstation (Intel Core Ultra 5, 32 GB RAM), while LLM generation times represent observed wall-clock times during the respective tests.
Table 8.
Quantitative comparison of preprocessing workflows for the investigated feature-aggregation task.
While traditional Python scripts offer the fastest execution time for aggregating raw data, they require specific programming syntax knowledge. Although LLMs can automatically generate such Python scripts, deploying them still requires domain engineers to manage software dependencies, configure execution environments, and debug potential syntax hallucinations—which maintains a technical barrier. The LLM-only approach shifts the workload entirely to natural language prompts, eliminating programming effort, though at the cost of higher latency (API generation time) and minor numerical rounding deviations. For the investigated preprocessing task, the synergistic LLM + KNIME approach combines prompt-based semantic planning with the deterministic execution of the KNIME workflow, while maintaining 0% numerical deviation in the evaluated case.
For the investigated preprocessing task, the workflow demonstrates the potential of generative AI as a complementary enabler for low-code data preprocessing in smart manufacturing without requiring Python programming.
6. Discussion
This contribution depicts a very concrete example of using PLC data via OPC UA for cutting process optimization, in this case tool wear detection. Several findings emerged from this experiment that may be relevant beyond the specific use case.
Hypothesis 1—Building simple classifiers. This hypothesis builds on two major pillars: the availability of data through standard connectors (connectivity) and the aggregation of large amounts of data into simple KPIs (data abundance vs. aggregation). Both will be discussed shortly.
Connectivity—While standard data formats such as OPC UA and MQTT have made data transfer easier, the structure of complex telegrams still makes it necessary to invest time and resources into cleaning, structuring, formatting, and editing raw data. A substantial share of data-science effort is typically devoted to data preparation, including cleaning, formatting, and integration. When it comes to interpreting nodes, aligning S.I. units, or bringing together data sets from, e.g., different sensors, a lot of manual effort is still required.
Data abundance vs. aggregation—Several use cases in CNC machining, with tool wear detection being one of the easier and clearer ones, are actually quite simple when it comes to the algorithmic decision side. In the present setup, OPC-UA machine data were acquired once per second, whereas the vibration sensor provided substantially higher-frequency measurements. This difference in data density further increases the need for appropriate preprocessing and aggregation. The indication of tool wear itself could be based on some highly aggregated datasets with low algorithmic complexity. This only holds true when most of the boundary conditions such as cutting process parameters, material, etc., are stable and known.
Hypothesis 2—Ease of data analysis for domain experts. This hypothesis builds on the usability of Low-Code/No-Code platforms for the actual use case. In addition to this, an outlook was given on the future role of generative AI to provide even faster, easier data analysis. Both will be discussed shortly.
Low-Code/No-Code—Modern languages such as Python offer a wide variety of libraries and functions to facilitate data preparation and analysis. On the other hand, this adds to the requirements of manufacturing engineers. Low-Code or No-Code platforms offer a quick and more easily accessible option to process data while still offering enough capabilities for most basic data analytics projects. Low technological entry barriers have to be balanced against limited functionality, but for the presented use case offered enough functionality and sufficient results.
The role of GenAI—In other areas of manufacturing engineering such as knowledge representation, reasoning, or image recognition, generative AI already plays a major role in current research. Beyond classical LLM applications for text generation or understanding speech, GenAI-assisted workflows may automate parts of the substantial effort currently required for data preparation. As we have clearly seen, current models are already able to clean, sort, and structure data to a certain extent.
Outlook. Over the last fifteen years, gathering raw data from CNC-controlled machines and additional sensors has become ever easier, shifting the focus towards rapid process integration and drastically emphasizing new skills in the area of data analytics and machine learning. The study depicted in this contribution clearly shows that while connectivity has been standardized to a certain extent, raw data formatting and proprietary structures still create efforts for cleaning, formatting, and structuring data before models can be applied. Once this is achieved, tasks such as cutting tool wear prediction can be solved by domain experts alone. Thus, domain-expert development and No-Code/Low-Code tools become increasingly important for manufacturing engineers to rapidly deploy analytical models. Large Language Models and generative AI provide an interesting addition to data structuring and modeling, as prompt-based pipelines show the potential to drastically reduce manual efforts. In the opinion of the authors, this area will be one of the most important focus areas for future research. When applying LLMs to data analytics in an industrial environment, several questions will have to be answered.
Robustness and hallucination: LLMs tend to hallucinate, thus producing results that sound plausible yet are not based on real information [35]. From other application areas such as chatbots, mitigation strategies to reduce the risk connected to LLM hallucination are already known [36]. However, their applicability and effectiveness in an industrial area remains to be researched.
Efficiency: Most LLMs and complex systems are cloud-based and are paid for based on consumption. Thus, reducing efficiency in LLM usage is currently a hot topic in software engineering [37,38]. CNC machines produce raw data in a few milliseconds, thus providing a very large base of raw data with probably limited information content. Thus, more research into efficiency is needed when applying LLM pipelines in industrial manufacturing.
Transitional and Moderate Tool Wear Classification: A systematic experimental study of transitional and moderate wear states is required to extend the present proof-of-concept toward continuous tool-life monitoring. Future work should therefore combine systematically characterized intermediate-wear states with richer time- and frequency-domain features.
Frequency-Domain Signal Processing (FFT): Transitioning from basic time-domain moving averages to Fast Fourier Transform (FFT) analysis. Integrating FFT nodes into the low-code pipeline will prevent the attenuation of critical milling frequencies and uncover deeper mechanical wear signatures hidden in the high-frequency vibration spectrum.
Data Privacy and Intellectual Property (IP) Protection: A critical barrier to cloud-based LLM adoption in manufacturing is the risk of uploading proprietary telemetry data to external third-party servers. Future deployments must prioritize on-premises solutions. The utilization of open-source models (such as Llama 3 or Mistral) running locally on edge servers via frameworks like Ollama will be essential to support IP protection by keeping sensitive production data strictly within the corporate network.
7. Conclusions
This study investigated low-code data analytics and generative AI integration for tool wear detection in CNC milling. Based on empirical experiments across fixed and varied cutting parameters, the key conclusions are as follows.
- Feasibility of Standard PLC/OPC-UA Signals: In the investigated proof-of-concept experiments, aggregated machine signals, such as spindle power and axis currents, showed sufficient physical sensitivity to distinguish between the tested new-tool and end-of-life (EoL) states under stable process conditions using basic classification algorithms. The results should not be interpreted as a comprehensive validation of tool-wear progression monitoring, since intermediate wear states were not systematically classified. Extending the approach to transitional and moderate wear regimes requires additional experiments and richer feature representations.
- Limitations under Process Variation: Under varying cutting parameters, the evaluated classical classifiers did not achieve satisfactory performance. The observed limitation is attributable to the combination of parameter-induced signal overlap, the limited dataset size, and the deliberately simple time-domain feature representation used in this proof-of-concept study. These results indicate a need for larger datasets and richer feature engineering rather than demonstrating an inherent limitation of classical machine-learning methods. Furthermore, this study utilized relatively clean datasets; future work must evaluate the robustness of both the LLM preprocessing workflows and the downstream classification algorithms against real-world industrial noise, such as missing OPC-UA packets or sensor transmission artifacts.
- Empirical Value of Generative AI in Preprocessing: Large Language Models (LLMs) offer significant potential in democratizing data preprocessing for domain-expert engineers. Prompt-based LLM pipelines can clean, align, and aggregate raw manufacturing time series data with high numerical fidelity, potentially lowering the technological entry barrier for data-driven decision-making in SMEs. The study does not establish that LLMs can reliably replace dedicated classification algorithms for tool-wear detection under variable operating conditions.
- On-Premises Deployment for IP Protection: Transitioning GenAI workflows into real-world industrial environments requires mitigating IP risks associated with cloud uploads. Deploying open-source models (e.g., Llama 3) on local edge infrastructure via frameworks such as Ollama can support data privacy by keeping sensitive production data within the corporate network, while retaining the benefits of AI-assisted data engineering.
- Methodological Expansion (FFT): While simple time-domain moving averages serve as an accessible entry point for low-code analytics, future industrial implementations must integrate frequency-domain analysis (FFT) to overcome signal masking and accurately track continuous, multi-class tool degradation.
Overall, the study demonstrates that the principal challenge in industrial tool wear analytics is no longer data acquisition, but the efficient transformation of raw machine telemetry into actionable engineering knowledge. Low-code analytics and generative AI therefore represent complementary technologies that can significantly accelerate the adoption of data-driven manufacturing in SMEs.
Supplementary Materials
The following supporting information can be downloaded at: https://www.mdpi.com/article/10.3390/metrology6030065/s1, Table S1: Detailed experimental data and evaluation metrics (manuscript-supplementary.xlsx).
Author Contributions
Conceptualization, E.P. and D.K.-K.; methodology, M.v.S. and P.P.; software, P.P.; validation, M.v.S. and P.P.; formal analysis, E.P. and P.P.; investigation, Y.D.; resources, E.P.; data curation, P.P.; writing—original draft preparation, E.P.; writing—review and editing, D.K.-K.; visualization, E.P.; project administration, E.P.; funding acquisition, E.P. All authors have read and agreed to the published version of the manuscript.
Funding
This research received no external funding.
Data Availability Statement
Data are available in a publicly accessible repository. The data presented in this study are openly available at https://th-koeln.sciebo.de/s/dQYa4okAix5kwx8 (accessed on 31 August 2026).
Conflicts of Interest
The authors declare no conflicts of interest.
Abbreviations
The following abbreviations are used in this manuscript:
| CNC | Computer Numerical Control |
| GenAI | Generative Artificial Intelligence |
| KNIME | Software for Data Analytics (brand name) |
| KDD | Knowledge Discovery in Databases |
| LLM | Large Language Model |
| Node-RED | Software for IoT (brand name) |
| OPC-UA | OPC Unified Architecture |
| PLC | Programmable Logic Control |
| RAG | Retrieval Augmented Generation |
References
- Altintas, Y.; Ber, A.A. Manufacturing automation: Metal cutting mechanics, machine tool vibrations, and CNC design. Appl. Mech. Rev. 2001, 54, B84. [Google Scholar] [CrossRef] [Scilit]
- Uhlmann, E.; Geisert, C.; Hohwieler, E. Monitoring of slowly progressing deterioration of computer numerical control machine axes. Proc. Inst. Mech. Eng. Part B J. Eng. Manuf. 2008, 222, 1213–1219. [Google Scholar] [CrossRef] [Scilit]
- Chuangwen, X.; Jianming, D.; Yuzhen, C.; Huaiyuan, L.; Zhicheng, S.; Jing, X. The relationships between cutting parameters, tool wear, cutting force and vibration. Adv. Mech. Eng. 2018, 10, 1687814017750434. [Google Scholar] [CrossRef] [Scilit]
- Akhtar, Z.B. Artificial intelligence (AI) within manufacturing: An investigative exploration for opportunities, challenges, future directions. Metaverse 2024, 5, 2731. [Google Scholar] [CrossRef] [Scilit]
- Rumelhart, D.E.; Hinton, G.E.; Williams, R.J. Learning representations by back-propagating errors. Nature 1986, 323, 533–536. [Google Scholar] [CrossRef] [Scilit]
- Rangwala, S.; Dornfeld, D. Sensor integration using neural networks for intelligent machining. J. Eng. Ind. 1990, 112, 219–228. [Google Scholar] [CrossRef] [Scilit]
- Rangwala, S.S.; Dornfeld, D.A. Learning and optimization of machining operations using computing abilities of neural networks. IEEE Trans. Syst. Man Cybern. 1989, 19, 299–314. [Google Scholar] [CrossRef] [Scilit]
- Preiss, K.; Kaplansky, E. Automated part programming for CNC milling by artificial intelligence techniques. J. Manuf. Syst. 1985, 4, 51–63. [Google Scholar] [CrossRef] [Scilit]
- Chryssolouris, G.; Guillot, M. A comparison of statistical and AI approaches to the selection of process parameters in intelligent machining. J. Manuf. Sci. Eng. 1990, 112, 122–131. [Google Scholar] [CrossRef] [Scilit]
- Lasi, H.; Fettke, P.; Kemper, H.G.; Feld, T.; Hoffmann, M. Industry 4.0. Bus. Inf. Syst. Eng. 2014, 6, 239–242. [Google Scholar] [CrossRef] [Scilit]
- Suleiman, Z.; Shaikholla, S.; Dikhanbayeva, D.; Shehab, E.; Turkyilmaz, A. Industry 4.0: Clustering of concepts and characteristics. Cogent Eng. 2022, 9, 2034264. [Google Scholar] [CrossRef] [Scilit]
- Serin, G.; Sener, B.; Gudelek, M.U.; Ozbayoglu, A.M.; Unver, H.O. Deep multi-layer perceptron based prediction of energy efficiency and surface quality for milling in the era of sustainability and big data. Procedia Manuf. 2020, 51, 1166–1177. [Google Scholar] [CrossRef] [Scilit]
- Ji, W.; Yin, S.; Wang, L. A big data analytics based machining optimisation approach. J. Intell. Manuf. 2019, 30, 1483–1495. [Google Scholar] [CrossRef] [Scilit]
- Chang, W.-Y.; Wu, S.-J. Big data analysis of a mini three-axis CNC machine tool based on the tuning operation of controller parameters. Int. J. Adv. Manuf. Technol. 2018, 99, 1077–1083. [Google Scholar] [CrossRef] [Scilit]
- Rasheed, K.; Zaland, A.; Saad, S.; Ammad, S.; Rostami, A. History of AI. In AI in Material Science; CRC Press: Boca Raton, FL, USA, 2024; pp. 15–46. [Google Scholar]
- Mukherjee, A.; Karande, A.; Häfner, P.; Poonia, M.D.; Kimmig, A.; Kreuzwieser, S.; Vlas, R.; Klar, M.; Sykora, T.; Grethler, M. A LLM-based voice user interface for voice dialogues between user and industrial machines. Procedia CIRP 2025, 134, 378–383. [Google Scholar] [CrossRef] [Scilit]
- Morano Okuno, H.R. Exploring Prompt Engineering for Generating G-Code to Program CNC Milling Machines. In International Congress on Information and Communication Technology; Springer Nature: Singapore, 2025. [Google Scholar]
- Xu, Q.; Zhou, G.; Zhang, C.; Chang, F.; Cao, Y.; Zhao, D. Generative AI and digital twin integrated intelligent process planning: A conceptual framework. Research Square 2023. [Google Scholar] [CrossRef] [Scilit] [PubMed]
- Campean, E.; Pop, G. CNC Milling Optimization via Intelligent Algorithms: An AI-Based Methodology. Machines 2026, 14, 89. [Google Scholar] [CrossRef] [Scilit]
- Liu, H.; Zhang, D.; Geng, D. Effects of self-excited vibration on tool wear behaviors in cutting of Inconel 718 superalloy. Tribol. Int. 2026, 217, 111613. [Google Scholar] [CrossRef] [Scilit]
- Jin, M.; Wang, S.; Ma, L.; Chu, Z.; Zhang, J.Y.; Shi, X.; Chen, P.-Y.; Liang, Y.; Li, Y.-F.; Pan, S. Time-LLM: Time Series Forecasting by Reprogramming Large Language Models. arXiv 2024. [Google Scholar] [CrossRef] [Scilit]
- Zhou, T.; Niu, P.; Wang, X.; Sun, L.; Jin, R. One fits all: Power general time series analysis by pretrained lm. arXiv 2023. [Google Scholar] [CrossRef] [Scilit]
- Zhang, X.; Chowdhury, R.R.; Gupta, R.K.; Shang, J. Large Language Models for Time Series: A Survey. In Proceedings of the Thirty-Third International Joint Conference on Artificial Intelligence, Jeju Island, Republic of Korea, 3–9 August 2024. [Google Scholar] [CrossRef] [Scilit]
- Kasiviswanathan, S.; Gnanasekaran, S.; Thangamuthu, M.; Rakkiyannan, J. Machine-learning-and internet-of-things-driven techniques for monitoring tool wear in machining process: A comprehensive review. J. Sens. Actuator Netw. 2024, 13, 53. [Google Scholar] [CrossRef] [Scilit]
- Hill, J.; Prickett, P.; Grosvenor, R.; Hankins, G. CNC spindle signal investigation for the prediction of cutting tool health. In Proceedings of the 4th European Conference of the Prognostics and Health Management Society, Utrecht, The Netherlands, 3–6 July 2018; Volume 4. No. 1. [Google Scholar] [CrossRef] [Scilit]
- Demetgul, M.; Darji, A.R.; Tansel, I.N.; Puchta, A.; Fleischer, J.; Stork, W. Sensorless tool wear estimation by using the artificial intelligence (AI) tools from the currents of motors generating linear motions. Int. J. Adv. Manuf. Technol. 2025, 136, 4335–4353. [Google Scholar] [CrossRef] [Scilit]
- Jurkovic, J.; Korosec, M.; Kopac, J. New approach in tool wear measuring technique using CCD vision system. Int. J. Mach. Tools Manuf. 2005, 45, 1023–1030. [Google Scholar] [CrossRef] [Scilit]
- Pfeifer, T.; Wiegers, L. Reliable tool wear monitoring by optimized image and illumination control in machine vision. Measurement 2000, 28, 209–218. [Google Scholar] [CrossRef] [Scilit]
- Xiang, J.; Stöbener, D.; Stemmer, S.; Langenhorst, L.; Sölter, J.; Karpuschewski, B.; Fischer, A. Robot-assisted optical measurement method for the wear analysis of cutting tools. Wear 2025, 584, 206369. [Google Scholar] [CrossRef] [Scilit]
- Lanzetta, M. A new flexible high-resolution vision sensor for tool condition monitoring. J. Mater. Process. Technol. 2001, 119, 73–82. [Google Scholar] [CrossRef] [Scilit]
- Wszołek, G.; Czop, P.; Słoniewski, J.; Dogrusoz, H. Vibration monitoring of CNC machinery using MEMS sensors. J. Vibroengineering 2020, 22, 735–750. [Google Scholar] [CrossRef] [Scilit]
- Zhang, P.; Gao, D.; Lu, Y.; Ma, Z.; Wang, X.; Song, X. Cutting tool wear monitoring based on a smart toolholder with embedded force and vibration sensors and an improved residual network. Measurement 2022, 199, 111520. [Google Scholar] [CrossRef] [Scilit]
- Xie, Z.; Li, J.; Lu, Y. An integrated wireless vibration sensing tool holder for milling tool condition monitoring. Int. J. Adv. Manuf. Technol. 2018, 95, 2885–2896. [Google Scholar] [CrossRef] [Scilit]
- Fernández, A.; García, S.; Galar, M.; Prati, R.C.; Krawczyk, B.; Herrera, F. Introduction to KDD and Data science. In Learning from Imbalanced Data Sets; Springer International Publishing: Cham, Switzerland, 2018; pp. 1–17. [Google Scholar]
- Huang, L.; Yu, W.; Ma, W.; Zhong, W.; Feng, Z.; Wang, H.; Chen, Q.; Peng, W.; Feng, X.; Qin, B.; et al. A survey on hallucination in large language models: Principles, taxonomy, challenges, and open questions. ACM Trans. Inf. Syst. 2025, 43, 1–55. [Google Scholar] [CrossRef] [Scilit]
- Tonmoy, S.M.; Zaman, S.M.; Jain, V.; Rani, A.; Rawte, V.; Chadha, A.; Das, A. A comprehensive survey of hallucination mitigation techniques in large language models. arXiv 2024, arXiv:2401.01313. [Google Scholar]
- Coignion, T.; Quinton, C.; Rouvoy, R. When Faster Isn’t Greener: The Hidden Costs of LLM-Based Code Optimization. In Proceedings of the ASE’25-40th International Conference on Automated Software Engineering, Seoul, Republic of Korea, 16–20 November 2025. [Google Scholar]
- Cheng, J.; Liu, F.; Wu, C.; Zhang, L. Adaptivellm: A framework for selecting optimal cost-efficient llm for code-generation based on cot length. In Proceedings of the 16th International Conference on Internetware, Trondheim, Norway, 20–22 June 2025. [Google Scholar]





Disclaimer/Publisher’s Note: The statements, opinions and data contained in all publications are solely those of the individual author(s) and contributor(s) and not of MDPI and/or the editor(s). MDPI and/or the editor(s) disclaim responsibility for any injury to people or property resulting from any ideas, methods, instructions or products referred to in the content. |
© 2026 by the authors. Licensee MDPI, Basel, Switzerland. This article is an open access article distributed under the terms and conditions of the Creative Commons Attribution (CC BY) license.