


Abstract
Understanding COVID-19 transitions towards endemicity is vital by examining center-specific data within provincial and national contexts. This retrospective study aimed to enhance public health management and understanding of COVID-19 dynamics using data from Atma Jaya Catholic University of Indonesia (AJCUI) and open-source databases from Jakarta and Indonesia’s official websites from July 2020 to December 2022. Trends across data sources were compared, and correlations between positivity rates at AJCUI and Jakarta/Indonesia were assessed using linear regression. A total of 8,354,809 positive samples were analyzed nationally, showing similar trends and peaks of positivity rates across databases, with positive correlations between AJCUI–Jakarta (β = 1.154; p < 0.001; 95% CI = 0.86–1.45) alongside AJCUI–Indonesia (β = 1.262; p < 0.001; 95% CI = 0.74–1.79). Mobility restriction policies substantially reduced the positivity rate within the study period. Further analysis of AJCUI showed that higher proportions of low Ct value (≤30) were associated with increased contemporaneous positivity at AJCUI (β = 0.442; p < 0.001) and Jakarta (β = 0.319; p < 0.001), although inadequately reflected in Indonesia (β = 0.039; p = 0.589). This study highlights the potential of incorporating Ct value distributions as epidemiological indicators within surveillance systems. These findings support the importance of comprehensive laboratory data recording to better characterize COVID-19 transmission patterns across different surveillance levels, alerting policymakers to establish efficient policies.
1. Introduction
In December 2019, a novel coronavirus-caused outbreak emerged in Wuhan, Hubei Province, China, and was initially named 2019 novel coronavirus (2019-nCoV) [1]. In response to its rapid spread, on 26 March 2020, the World Health Organization (WHO) declared a coronavirus disease 2019 (COVID-19) pandemic [2]. Accordingly, the WHO published six ranked strategies for governments to implement during the epidemic: expand, train, and deploy healthcare workers; implement systems to identify suspected patients; increase production and availability of tests; identify facilities that can be transformed into COVID-19 health centers; develop plans to quarantine cases; and refocus government efforts on eradicating the virus [3]. In the beginning of the pandemic, it was crucial to mitigate the peak of the epidemic. The early implementation of strict control measures was believed to help reduce the cases, delay the peak, and lessen strain on healthcare systems. Thus, many countries rapidly implemented strategies to curb the global epidemic.
At the beginning of the COVID-19 pandemic, testing, tracing, and treatment were the preferred methods to control the spread of the disease, including in Indonesia [4]. However, the widespread nature of the disease complicates the task of tracing the contacts of confirmed cases. A different approach to an early warning in the health system should be in place to allow healthcare personnel and other sides to take cautious measures. This could reduce the number of casualties experienced during the emergence of the Delta variant of Severe Acute Respiratory Syndrome Coronavirus 2 (SARS-CoV-2).
Indonesia is the fourth-most-populous nation in the world, with more than fifteen thousand islands [5]. Consequently, it is anticipated to suffer from the pandemic significantly longer than less populous nations. In Indonesia, the first two confirmed cases of COVID-19 infection were reported on 2 March 2020 [6]. However, as of 2 April 2020, there were already 1790 confirmed cases with 170 deaths and 112 recoveries. Indonesia experienced the first to third waves of COVID-19 over the course of nearly three years [7]. Through the Large-Scale Social Restrictions (LSSRs) and the Community Activities Restrictions Enforcement (CARE) policies, the government has implemented relatively moderate policies to control the pandemic [8].
This study is among the few comprehensive academic peer-reviewed articles that describe COVID-19 fluctuation across multiple surveillance levels, including institutional, provincial, and national datasets. The trends and peaks of disease activity were assessed using data from a reference laboratory (AJCUI), alongside surveillance data from Jakarta and Indonesia, while accounting for contextual policy responses. The insights from this study are intended to support improved understanding of COVID-19 dynamics and may inform public health preparedness for future pandemics of a similar nature. The primary objective is to assess COVID-19 trends from mid-2020 to 2022 and explore associations between reported policy measures, positivity rates, and viral load indicators over time. The data from the COVID-19 laboratory at Atma Jaya Catholic University of Indonesia (AJCUI) serves as a sentinel laboratory dataset, providing valuable insight into longitudinal laboratory-based indicators that are analyzed alongside provincial and national data to offer a comparative perspective across different levels of surveillance. Furthermore, this study explores utilizing cycle threshold (Ct) values obtained from laboratories as a potential early-warning system, which could provide valuable insights for managing and mitigating future waves of the pandemic. This study is particularly relevant to the increase in COVID-19 cases in many Southeast Asian countries during mid-2025 [9], and highlights the importance of strengthening surveillance systems to improve preparedness for potential future resurgences.
2. Materials and Methods
2.1. Study Design and Setting
As of 20 June 2022, the National Institute of Health Research and Development (NIHRD), The Ministry of Health of the Republic of Indonesia, had registered 936 COVID-19 Examination Laboratories in Indonesia, including 141 laboratories in Jakarta, and 21 of those testing facilities are located in North Jakarta which is responsible for serving a 146.66 km2 area in Jakarta [10]. The AJCUI COVID-19 laboratory in North Jakarta was amongst the first established reference laboratories, beginning operations on 16 July 2020, under Enhanced Biosafety Level 2 (BSL2) standards, with trained personnel. Every six months, the NIHRD conducts an External Quality Monitoring Validation Test to ensure each COVID-19 laboratory service is operating accurately and effectively, thus the results from the laboratory can be certified valid. This study used a retrospective observational design based on routinely collected laboratory data. Samples tested at AJCUI were obtained from a range of testing contexts, including hospital-based testing (e.g., emergency and inpatient settings), as well as non-clinical screening (e.g., travel-related testing and contact tracing). These heterogenous sources indicated low selection bias in AJCUI data, although the settings might still limit the population representativeness.
2.2. Data Sources
Data extraction and collection were performed monthly from July 2020 to December 2022, spanning 30 months. Additional data on daily tested and positive samples from Jakarta and Indonesia were retrieved from the official websites: Jakarta Tanggap COVID-19 [11] and Indonesia COVID-19 Dashboard [12], and the WHO COVID-19 Dashboard for Indonesia [13], respectively. Furthermore, policy details (Table S1) are obtained from the Cabinet Secretariat of the Republic of Indonesia’s website according to the executed decree [14]. Additional vaccination data for Jakarta were obtained from the Ministry of Health Vaccination website [15]. Data on SARS-CoV-2 variants in Indonesia were retrieved from Global Initiative on Sharing All Influenza Data (GISAID), Submission Tracker Global [16]. Furthermore, we utilized the database of the gender and age of the specimens tested for COVID-19 at the AJCUI laboratory for further analysis, in addition to regional and national databases. All data were made anonymous in accordance with ethical guidelines, and all the clinical data prior to the diagnosis were not collected to ensure the blind testing. Samples from the AJCUI laboratory with incomplete key variables (e.g., Ct values or test results) were excluded from the analysis, while regional and national data were analyzed using available reported data.
2.3. Study Variables
The study variables included the number of tested and positive samples, Ct values of positive specimens, and demographic data (age and gender). Other identifying data were detached during the data extraction as required by the Institutional Review Board. Additional variables included the COVID-19 positivity rate at AJCUI, daily COVID-19 testing data from Jakarta and Indonesia, policy changes, vaccination rates in Jakarta, and SARS-CoV-2 variant distributions in Indonesia.
2.4. Data Collection
All the required data were extracted from AJCUI laboratory records. A total of 76,762 COVID-19 testing results were obtained from the AJCUI. Our laboratory has recorded not only the qualitative results of administered specimens but also documented the Ct value data of the positively tested specimens generated from Reverse Transcription-quantitative Polymerase Chain Reaction (RT-qPCR) since August 2020. Data on daily COVID-19 testing, vaccination rates, and SARS-CoV-2 variants were retrieved from official websites. There were 12,768,605 data from Jakarta and 106,648,851 data on Indonesia’s COVID-19 cases obtained from the Jakarta government-specific website for COVID-19.
2.5. Statistical Analysis
All data were stored in Microsoft Excel version 2018 (Microsoft Corporation, Redmond, WA, USA), then analyzed and visualized using GraphPad Prism 9.1.1 (GraphPad Software, La Jolla, CA, USA). Data analysis was carried out by comparing the COVID-19 positivity rate of retrospective specimens received by AJCUI with the data from Jakarta and Indonesia, from July 2020 to December 2022. The age data from AJCUI was divided into seven groups: 0–10 years, 11–20 years, 21–30 years, 31–40 years, 41–50 years, 51–60 years, and more than 60 years old. The observation of the trend of genders getting tested for COVID-19 was done with bar graphs. Simple linear regression was performed on the Ct value analysis in AJCUI to assess contemporaneous associations between the fluctuation of COVID-19 cases in both AJCUI and Jakarta. The data was calculated and analyzed using the slope of regression (β), p-value, the 95% confidence intervals (95% CIs), and coefficient of determination (R2). The slope, either in positive or negative results, indicates the direction and extent of change in the outcome variable per unit change in the predictor variable. The correlation is deemed statistically significant when the p-value is <0.05. Model performance was evaluated using R2, and the results were interpreted in the context of observed temporal trends. No lagged analyses were performed, and no potential confounding factors were applied. Therefore, the results reflect ecological, contemporaneous correlations and should not be interpreted as prediction or causality. Data presentation was harmonized using average COVID-19 positivity percentages for descriptive comparison and made into explanatory graphs. Within the period of data extraction, the AJCUI COVID-19 laboratory detects SARS-CoV-2 based on RT-qPCR with differing detection kits that detect at least three to four targeted genes, including the housekeeping gene for the analysis control (ORF1ab, RdRp (part of ORF1ab), N, and E genes). The timeline of application of each kit is depicted in Figure S1. Despite the variation in detection kits, the principal of the amplification process is similar between kits, and each kit was officially distributed by certified local suppliers, approved and monitored by the Ministry of Health, thus their applicability is controlled nationally and the results are comparable. The readout would be considered positive when at least two genes showed values below the assay threshold according to the protocol of each kit. Further analysis was done to see the correlation between datasets by grouping positive Ct value results from AJCUI into high-intensity infection (≤30) and middle-to-low-intensity infection (>30). This categorization was determined based on our repeated investigation that demonstrated consistent interpretation; the positive results proved convincing when the Ct values were below 30, while Ct values higher than 30 showed greater variability and often required repeat testing. The overall procedure of this study is provided in Figure S2.
3. Results
3.1. AJCUI–Jakarta–Indonesian Data Reveals a Similar Trend of COVID-19 Prevalence
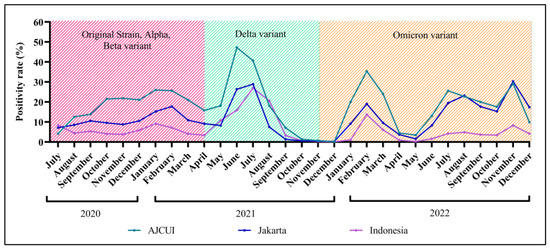
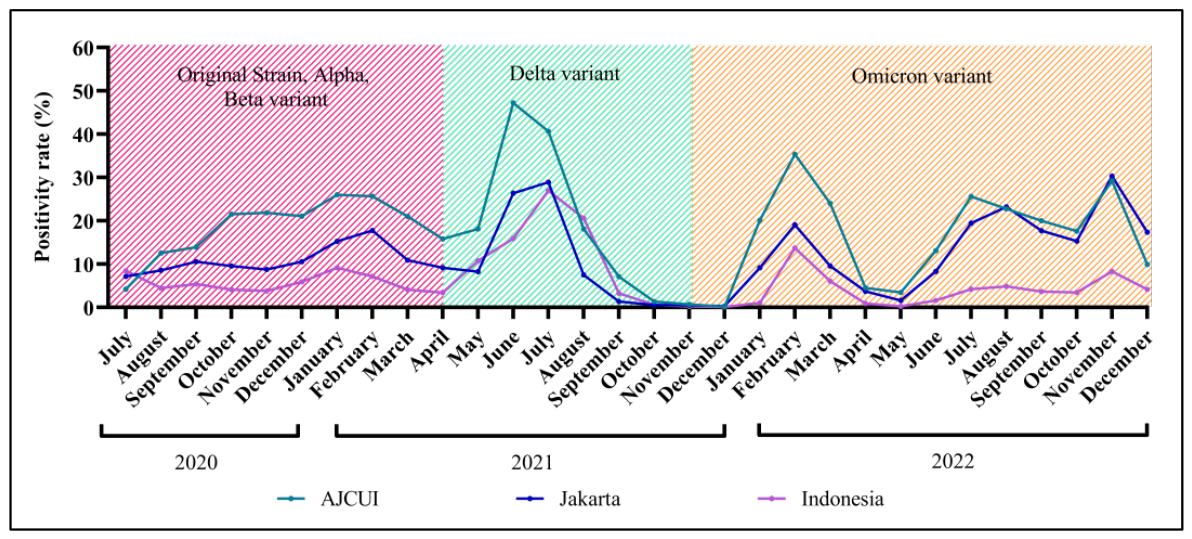
A total of 119,494,218 samples were tested across all test centers in Indonesia, with 8,354,809 of them showing positive results. A few occasions of a sudden increase in COVID-19 cases were observed. Monthly percentages of COVID-19-positive cases based on AJCUI data from July 2020 to October 2022 were higher compared to both Jakarta and Indonesia’s data (Figure 1; Table S2). In this instance, this study observed data from the AJCUI, which may reflect trends in Jakarta and potentially in Indonesia, as it shows a similar pattern of COVID-19 cases. The 30-month data revealed three waves of pandemic dominated by different SARS-CoV-2 variants (Figure 1). Alpha and Beta variants dominate the first wave. The second wave was dominated by the Delta variant, of which the positivity rate reached its peak in June 2021 for AJCUI and in July 2021 for Jakarta and Indonesia. The third wave, dominated by the Omicron variant, resulted in three peaks of cases in February, July–August, and November 2022 for AJCUI and Jakarta; the peak of national data only occurred in November 2022. From July 2020 to May 2022, the positivity rates for Jakarta and Indonesia were comparable. However, from June to December 2022, Jakarta and AJCUI data tend to resemble each other.
Figure 1.
Dynamics prevalence of COVID-19 from July 2020 to December 2022 obtained from three databases. The trend of COVID-19 is displayed for 30 months based on the prevalence data from AJCUI, Jakarta (Jakarta Tanggap COVID-19 [11]), and Indonesia (Indonesia COVID-19 Dashboard [12]). The shaded areas within the graph represent an approximation of the dominant SARS-CoV-2 variants. The red, green, and orange colors correspond to the origin strain—Alpha-Beta, Delta, and Omicron variants, respectively.
The testing and positivity rate dynamics across all three datasets generally exhibited a similar trend in July 2021. A total of 40, 29, and 27 out of 100 of those tested were positive for COVID-19 in AJCUI, Jakarta, and Indonesia, respectively. However, between June and November of 2022, AJCUI and Jakarta had a significantly higher positivity rate compared to the national data (Figure 1; Table S2). This was due to an increase in the number of positive cases as the testing rate decreased. In addition, between December 2021 and April 2022, there was an abrupt increase in the frequency of tests (Figure S3). This phenomenon was the consequence of travel regulations that required negative PCR testing.
3.2. Testing and Positive Cases Dominated by the High-Mobility Age Groups
The age data were obtained solely from the AJCUI COVID-19 laboratory, which was a majority paid service. Samples were retrieved from the emergency department, inpatients, and drive-thru swab services for travel or tracing purposes. Accordingly, it can be concluded that people of younger ages (20–50s) with higher mobility dominated the age pool. The percentages for each age group were as follows: 21–30 (29.27%); 31–40 (22.30%); 41–50 (16.55%); and 21–50 (68.11%). The higher proportion of particular age groups being tested was in line with the positivity prevalence being higher in those age groups (Table 1). This trend occurred consistently for the data series collected from July 2020 to November 2022. The percentage of positive cases in the AJCUI COVID-19 laboratory was categorized according to the age groups as follows: 1–10 (3.17%); 11–20 (5.63%); 21–30 (26.51%); 31–40 (22.80%); 41–50 (16.91%); 51–60 (12.42%); and >60 (12.49%) (Table 1). The age group between 21 and 30 has the greatest positivity rate, considering that the percentage of swab samples received by the hospital was dominated by this age group.
Table 1.
The number of samples tested and the positive case percentage in each age group from AJCUI data.
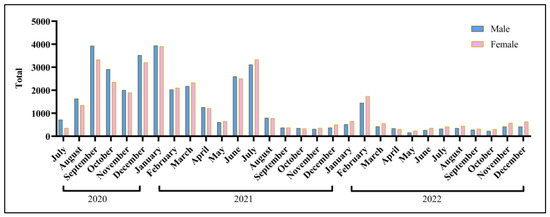
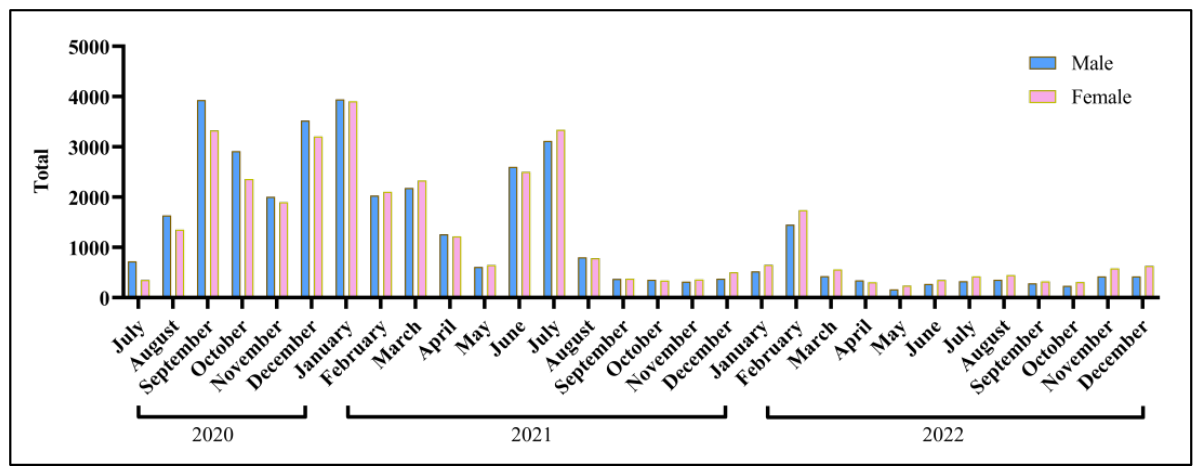
The percentage of men and women who underwent self-testing at the AJCUI laboratory in total was similar: 50.3% and 49.7%, respectively (Figure 2). Out of 17,840 positive samples, men account for 50.58% and women for 49.42%. The data on age and gender correlations with both testing and positivity rates are exclusive to the AJCUI laboratory and cannot represent Jakarta or Indonesia due to the lack of publicly linked data sources.
Figure 2.
The proportion of the total number of gender stratification. The data from the AJCUI COVID-19 laboratory on samples provided for the period from July 2020 to December 2022.
3.3. Policies Enforced Effectively Reduced the Positivity Rate
During the pandemic era of COVID-19, the Indonesian government developed policies based on factors such as positive cases, death rate, provincial healthcare capacity, and weekly restriction-level evaluation. The policies were also made according to the WHO’s standards on the severity of a pandemic situation, which is determined by the level of transmission and the capacity to respond to that level of transmission. Table S1 provides detailed information on policies implemented since the beginning of the pandemic, including their release and implementation dates, in Indonesia.
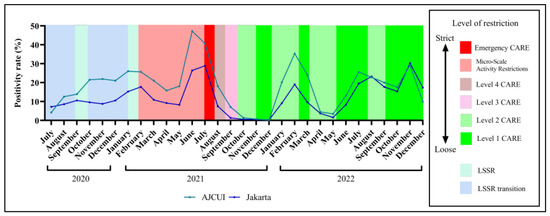
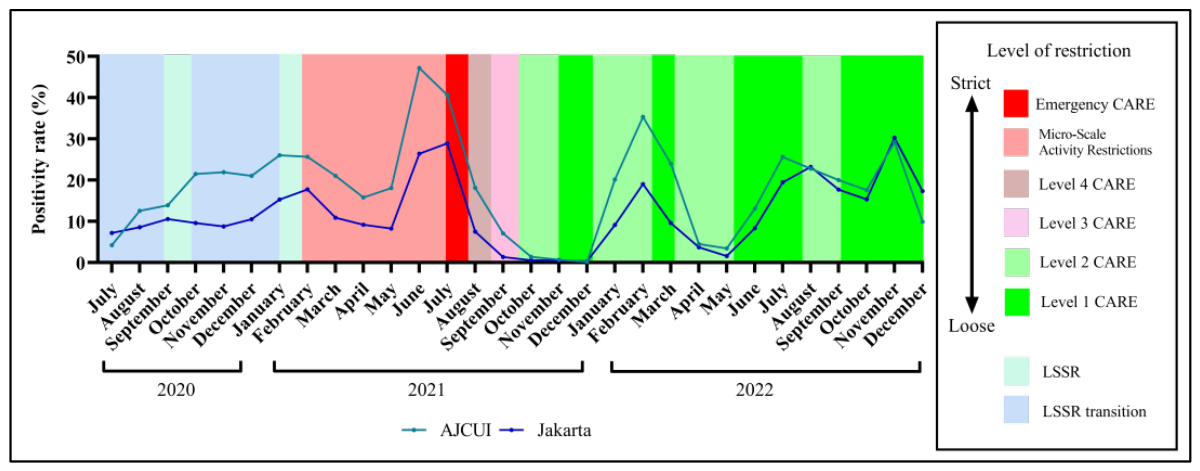
The Indonesian government implemented stricter policies when the positivity rate was high and relaxed them when it decreased. These changes immediately affected the positivity rate. Figure 3 highlights the Jakarta policies in effect. During the implementation of LSSR and Micro-Scale Activity Restriction, the positivity rates of COVID-19 in both AJCUI and Jakarta were quite steady but still manageable. However, the sudden increase in positive COVID-19 cases from June to July 2021 prompted the Jakarta government to implement CARE, starting with Emergency CARE.
Figure 3.
The periodic adjustment of policy enforcement according to the COVID-19 positivity rate. The two overlaying lines represent the fluctuation of confirmed COVID-19 cases detected by RT-qPCR at the AJCUI COVID-19 laboratory (light blue line) and the data from Jakarta (dark blue line) extracted for the period from July 2020 to December 2022. LSSR: Large-Scale Social Restrictions; CARE: Community Activities Restriction Enforcement.
3.4. Higher Viral Load Corresponds to a Greater Proportion of Positive Cases and Vice Versa
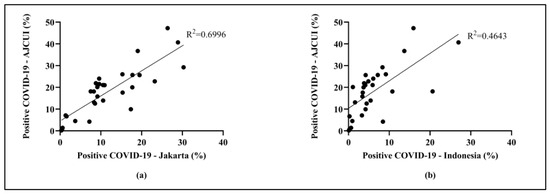
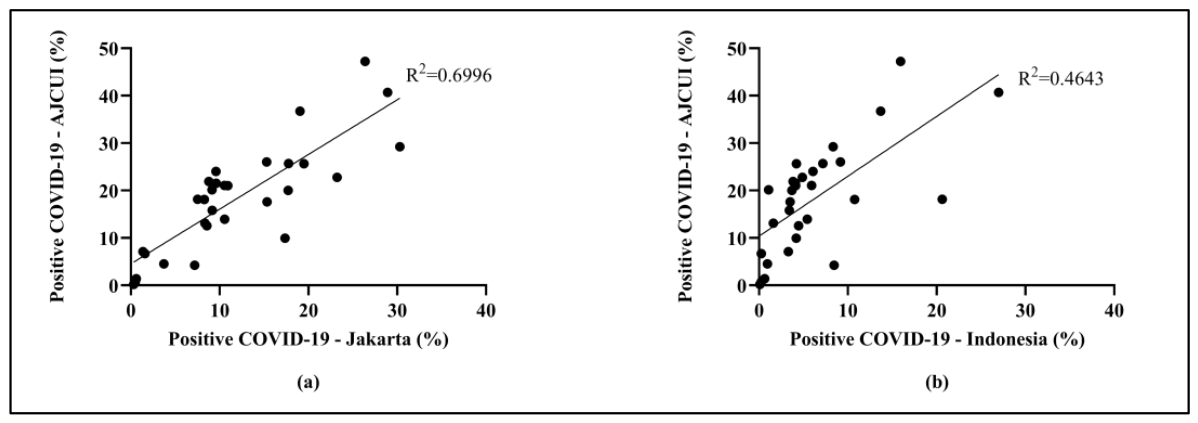
Based on the rendered data from three sources, comparable trends of positivity percentage and testing-to-positive-case ratio were observed. The analysis further evaluated the correlation between the COVID-19 positivity rates at AJCUI and Jakarta. Figure 4a displays a significant positive correlation between the cases in AJCUI and those in Jakarta (β = 1.154; p < 0.001; 95% CI = 0.86–1.45). A similar pattern was also observed within the AJCUI and Indonesia data (β = 1.262; p < 0.001; 95% CI = 0.74–1.79), as displayed in Figure 4b, although the comparison indicated the tendency of AJCUI to show a stronger association with Jakarta cases than to national cases, as shown by the R2 values of 70% and 46%, respectively. Nonetheless, it is plausible to conclude that the trend of COVID-19 cases in AJCUI shows a similar pattern to those reported in Jakarta and, to a lesser extent, throughout Indonesia. The high correlation with Jakarta is most likely due to the fact that the AJCUI COVID-19 laboratory is a part of Jakarta. At the end of 2022, as depicted in Figure 1, Jakarta data increasingly resembled AJCUI data. From this perspective, an increased positivity rate in the laboratory test may reflect changes in the number of cases in the community. Moreover, as Jakarta is a major urban center with high testing capacity and a substantial burden of COVID-19 cases, trends observed in this region may contribute to patterns seen at the national level. While this ecological analysis does not quantify regional contributions to national trends, the consistency of the association suggests that these findings could be a useful population-level indicator. These findings provide a rationale for further studies using time-series of lagged approaches to evaluate potential complementary indicators in epidemiological surveillance.
Figure 4.
A linear positive correlation of COVID-19 confirmed cases between AJCUI and Jakarta; AJCUI and Indonesia. The dots represent the fitted average positive percentage of COVID-19 from (a) AJCUI and Jakarta data and (b) AJCUI and Indonesian data for each represented period from July 2020 to December 2022.
While a positive correlation was observed between AJCUI and Jakarta positivity rates, the current study further investigated whether the Ct value, which represents viral load, may contribute to the positivity rates for AJCUI and Jakarta. Figure S4 displays the correlation between the Ct value in AJCUI and the increase and decrease in the proportion of positive AJCUI cases. When the proportion of Ct value ≤ 30 was more prevalent, COVID-19-positive cases tended to rise. The proportion of positive COVID-19 similarly tends to decline while the proportion of Ct value > 30 was more prevalent. This occurrence was evident between November 2021 and May 2022. Although the number of positive cases was low, the proportion of Ct values was rising, which was observed alongside subsequent increases in positive cases.
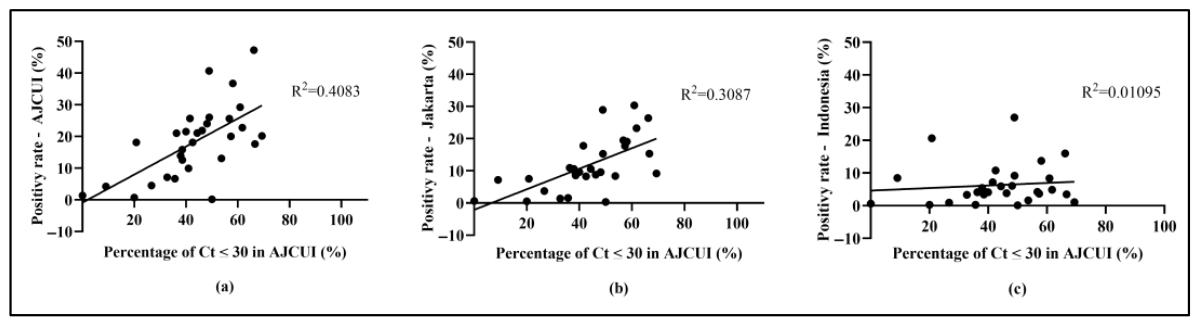
To further analyze the percentage of positive cases with a Ct value greater than 30 and less than 30, a correlation analysis was performed, as demonstrated in Figure 5. The Ct value ≤ 30 in AJCUI is positively correlated with the increase in positive percentage (β = 0.442; p < 0.001), and vice versa (Figure 5a and Figure S5). Furthermore, as previously mentioned in Figure 4, the AJCUI–Jakarta and AJCUI–Indonesia data presented a similar trend. Consequently, this study analyzed the Ct value ≤ 30 proportion of AJCUI concerning the Jakarta and Indonesian positivity rates. It demonstrated a similar result of a positive correlation with AJCUI and Jakarta (β = 0.319; p < 0.001, Figure 5b). It is possible that the same trend occurred due to the even distribution of testing coverage in Jakarta. However, AJCUI data may not accurately reflect the positivity rate of Indonesia (β = 0.039; p = 0.589, Figure 5c) because of the geographical situation, disparity of COVID-19 public information, and uneven testing coverage. The inverse correlation was seen when plotting the Ct > 30 from AJCUI data to Jakarta and Indonesia’s positivity rate (Figure S5). From this correlation, a similar pattern was observed across AJCUI, Jakarta, and Indonesia, where higher proportions of Ct ≤ 30 corresponded to higher positivity rates, whereas Ct > 30 dominated when the positivity rate was low.
Figure 5.
Correlation of positivity rate and high viral intensity (Ct ≤ 30). The dots represent the appropriate positivity rates of (a) AJCUI, (b) Jakarta and (c) Indonesian data to the percentage of confirmed COVID-19 case data from the AJCUI laboratory with the Ct ≤ 30 during the 30-month study period.
3.5. Vaccination Contribution to COVID-19
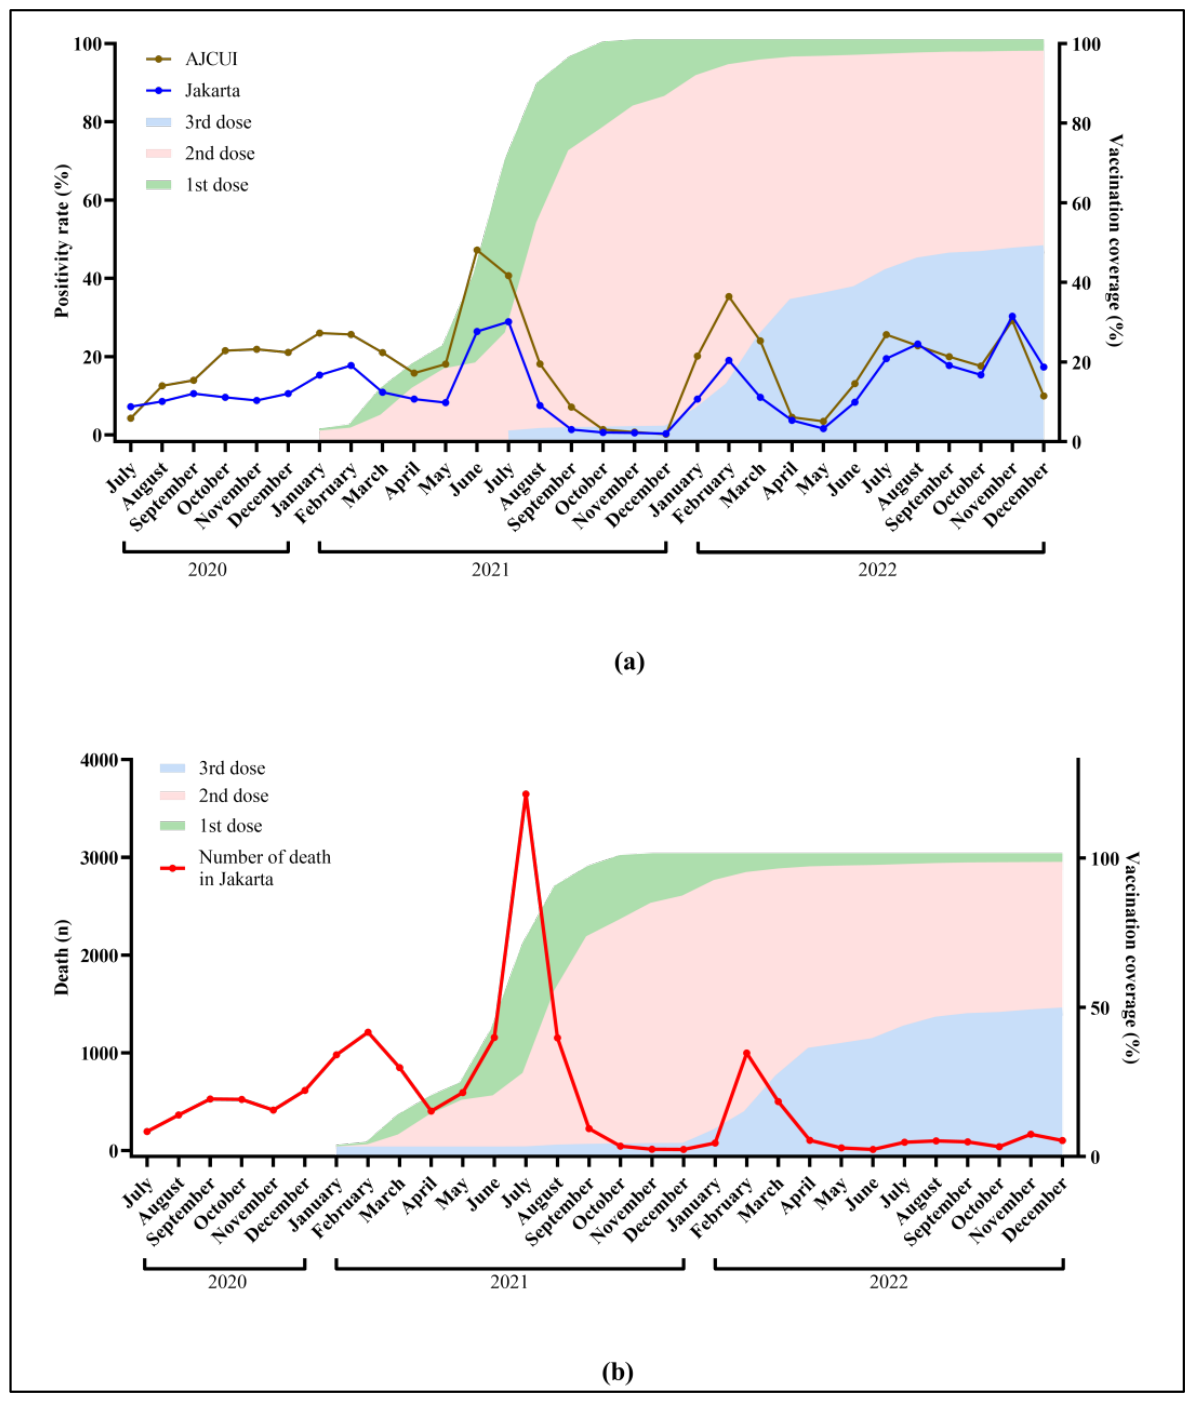
The vaccination coverage for the first two doses increased rapidly after the administration of the vaccine (Figure 6). It might be because vaccination of both doses was mandatory and monitored through the PeduliLindungi application. Meanwhile, the coverage of the third-dose (booster) vaccination increased very slowly at the beginning of its administration, as shown in the light blue shaded area of Figure 6. It gradually increased only after it was mandated for individuals who were traveling since the beginning of 2022. The most widely distributed vaccines in Indonesia are the Sinovac/CoronaVac vaccines, which are mostly used for the first and second doses.
Figure 6.
Vaccination, positivity rate, and death incidences. Coverage of the first (green shaded area), second (pink shaded area), and third (light blue shaded area) doses of Jakarta COVID-19 vaccination [15] in (a) correlation with the positivity rate of AJCUI (gold line) and Jakarta (blue line) during the 30-month study period; (b) in correlation with the number of deaths (red line) in Jakarta [11] during the 30-month study period.
The trend between vaccine coverage and the occurrence of COVID-19 positivity rates and death cases was further analyzed to observe the role of vaccines in reducing the severity of infection caused by the virus and its variants. Figure 6a demonstrates that vaccination coverage does not alleviate the emergence of the case positivity peak whenever a new virus variant emerges. Viruses that mutate into new variants and subvariants can infect both vaccinated and unvaccinated COVID-19-infected individuals. Despite the coverage of the first, second, and third vaccine doses, the AJCUI and Jakarta positivity rate patterns are similarly fluctuating in response to the emergence of new variants. Nonetheless, patterns in Figure 6 show that second and third vaccine doses did help in reducing the intensity of COVID-19 infections in some timeframes, noticably from July to December 2021 and February to April 2022. This demonstrates the importance of mandatory vaccination to the decline in COVID-19 burden and uplifting public health conditions. Figure 6b depicts that the Delta variant resulted in the highest mortality rate during the second wave to strike Jakarta in mid-2021.
4. Discussion
Based on the analysis, AJCUI had higher monthly percentages of COVID-19-positive cases than both Jakarta and Indonesia. Those could be explained by some factors. First, at the time, the testing at commercial laboratories was individually paid and not affordable for all, whereas Jakarta’s and Indonesia’s data include both commercial laboratories and free testing in government healthcare diagnostic laboratories [17]. Second, uneven testing coverage across Indonesia occurred due to the unavailability of COVID-19 diagnostic centers from limited BSL-2 facilities and reagents [18]. These factors were the primary concerns in the early period of COVID-19. The testing performed in major cities, such as Jakarta, will differ from that of other cities. The third factor is affected by people’s self-awareness. Individuals who came directly to the laboratory for testing were quite aware and expected to have a higher probability of being positive due to their symptoms or past exposure to confirmed cases. Despite the difference in positivity rate across these three datasets, the positivity rate follows a similar trend in terms of its dynamics. Indonesia, as well as the majority of other countries, experienced a surge in COVID-19-positive cases caused by the evolving SARS-CoV-2 variants [19]. The first wave was dominated by Alpha and Beta variants, while the second wave was dominated by the Delta variant [20]. The Delta variant has been shown to have a higher transmission rate than the previous variants, even in fully vaccinated people [21,22,23]. Originating from India, whose first case was found in October 2020, this strain was transmitted with a high growth rate in various countries worldwide [24]. A retrospective study from West Bengal State, India, also reported similar peaks of COVID-19 as Jakarta data, with the highest peak around May–June 2021 [25], around the time the Delta variant spread widely. The third wave, dominated by the Omicron variant, caused two peaks in cases as a result of the BA.4 and BA.5 subvariants in February 2022 and the XBB subvariants [26].
During the rise in COVID-19 testing, molecular detection, particularly RT-qPCR, is one of the most sought-after methods. Its high specificity for detecting the virus considered it the standard method [27]. Over time, the initially high cost of RT-qPCR testing gradually decreased, making it affordable to the public. In addition, the development of molecular test kits and the expansion of testing facilities have contributed to lowering prices significantly [28]. It could be assumed that this accounts for the increase in specimens tested in Jakarta and Indonesian laboratories after October 2021 as the government initiated efforts to increase the testing rate for contact tracing, as presented in Figure S3 [29].
The third wave, which occurred during the domination of the Omicron variant (Figure 1), was indicated by a spike in examinations and positive cases, observed from December 2021 to March 2022. In Indonesia, the first case of Omicron was reported in early December 2021 and further infected a growing number of people [30]. It might be due to the fact that individuals began to travel more frequently for vacation, both domestically and internationally. Prior to their trip and following their arrival, they are mandated for COVID-19 testing. In addition, many individuals underwent testing whenever they exhibited symptoms of COVID-19, presumably out of concern that another wave with similarly severe symptoms would emerge, as was the case with Delta [31,32].
Based on the current analysis, adults of productive age and higher mobility dominated the COVID-19 testing in the AJCUI. They are typically more conscious of being swabbed for security purposes than children. Consequently, the older group would dominate the age pool. Similar data were presented during the first wave of the pandemic in Italy; older adults were less likely to be tested for SARS-CoV-2 infection compared to younger individuals [33]. In addition, during the surge of COVID-19, several companies in Jakarta required their employees to submit negative PCR swab results before working from the office. Therefore, individuals within the productive age range of 21–50 years old frequently undergo COVID-19 testing [34,35]. From the beginning of the pandemic, the Indonesian government has declared some essential sectors, such as healthcare-related services and manufacturers, convenience stores, and financial or banking sectors, to continuously operate to support the public’s needs during the pandemic. Similar policies, although to varying degrees, were implemented in other nations [36,37,38]. Considering the productive age groups comprised the sector’s workforce, it is reasonable to assume that they were naturally subjected to the highest testing. From these findings, it can also be concluded that higher mobility increases the risk of virus exposure. A previous study has suggested that individuals between the ages of 15 and 24 have a higher risk of contracting COVID-19 than other older age groups, while the incidence of positive cases is higher among those aged 10 to 24 than among those aged 65 and older [39].
Another specific analysis, based on AJCUI data, also revealed that males had a slightly higher percentage of COVID-19 self-testing and positive results compared to females. Men are more likely to get infected and/or check themselves more regularly than women since they have frequent contact with infected individuals due to their traditionally higher mobility in Indonesia [40,41]. However, another study also observed that women tend to show more responsible attitudes toward COVID-19 than men, who presented a careless attitude toward complying with preventative measures such as frequent handwashing, face mask usage, and stay-at-home directives [42].
The Indonesian government has released and reformed several policies to reduce the positivity rate of COVID-19, starting with LSSR. The LSSR is a provincial restriction regulation that temporarily closes most public areas, except essential sectors, until COVID-19 cases can be managed in the available health facilities [43]. Following LSSR, the government established CARE regulations for each region. Level 4 CARE was applied when the transmission was dispersed, and response capacity was insufficient. Level 3 was implemented when community outreach had limited response capacity. Level 2 was for low incidence, while Level 1 was employed for very low transmission and ample healthcare facilities, and Level 0 was used in a situation with no local transmission [44]. The success of LSSR and CARE was measured by health protocol implementation and policy-changing factors. A national survey in 2020 demonstrated the effectiveness of strict LSSRs to contain the SARS-CoV-2 pandemic in Jakarta. However, the implementation was still lower in other provinces [45]. In response to loosening up restrictions and maintaining economic standing despite LSSR’s mobility restrictions, the CARE policy, a coordinated central government-controlled policy, was successfully implemented in Jakarta, becoming a model city for CARE implementation [46]. A case study of university students in three Indonesian cities revealed varied frequency of health protocols and practices. Proper face mask usage was the most common health protocol, while limiting mobilization and maintaining distance was the most violated [47].
Indonesia initially implemented LSSR during the early SARS-CoV-2 transmissions due to the unpredictability of viral spread [48]. However, it subsequently transitioned to Micro-Scale Activity Restriction and Emergency CARE in response to the high number of COVID-19 cases [49,50]. This increase may have been driven by the Delta variant, which is considered to be twice as contagious as previous variants [21,22,23]. Subsequently, on 26 July 2021, as a result of strict Emergency CARE regulations, the number of confirmed COVID-19 cases declined, thus CARE Levels 4 and 3 were implemented [51,52]. A month later, the CARE implementation was loosened, signifying global recovery. Along with the stated vaccination program, the two least stringent restrictions, CARE Levels 2 and 1, were implemented when positive cases increased and decreased, respectively [52]. Overall, the government’s initiative to shift policy from a relatively lenient to a strict one has an impact in curbing infection rates in Jakarta. The lockdown during Emergency to Level 3 CARE particularly led to near-zero positive cases, implying that appropriate policies can be implemented based on correct infection data. This outcome was comparable to the trajectory in Pune, an urban city of India, which reported a decrease in COVID-19 patients following a strict lockdown [53].
In consideration of the public health emergency caused by COVID-19, the Secretary of Health and Human Services approved an emergency-use authorization of the CDC 2019-Novel Coronavirus Real-Time RT-PCR Diagnostic Panel on 4 February 2020. The Food and Drug Administration issued immediate guidance on 29 February 2020, to facilitate the expansion of available tests and testing facilities. Since then, diagnostic testing has improved globally, including the interpretation of the SARS-CoV-2 test by incorporating the Ct value [54,55]. Generally, Ct value analysis revealed that the AJCUI–Jakarta and AJCUI–Indonesia data showed a positive correlation. Further analysis revealed a significant positive correlation between AJCUI (Ct ≤ 30) and Jakarta data, while the positive correlation in AJCUI–Indonesia is not significant. Similarly, analysis for Ct values over 30 reported a significant inverse correlation between AJCUI–Jakarta, while AJCUI–Indonesian data remained nonsignificant. Although these findings examine associations and do not evaluate predictive relationships, the consistency of the observed patterns is notable. Previous studies have suggested that Ct value distributions may be utilized as an epidemiological early-warning indicator [56,57,58]. In this context, our findings support the potential relevance of Ct-based metrics such as early-warning or complementary surveillance signals, particularly in high-testing settings such as Jakarta.
Indonesia began vaccinations against COVID-19 on 14 January 2021. The second dose was administered mostly a month later. Subsequently, the third dose started to be distributed on 17 July 2021. The distribution and administration of COVID-19 vaccines in Indonesia vary according to the level of COVID-19 transmission. Jakarta in particular is one of the prioritized provinces due to the high level of transmission. Therefore, AJCUI’s data were analyzed in the context of Jakarta to allow comparison with provincial-level trends [59,60]. Both the Sinovac/CoronaVac were considered to be less effective (50% efficacy) than those manufactured by Pfizer (95% efficacy), Moderna (94% efficacy), and AstraZeneca (70% efficacy) [61]. In the case of COVID-19, vaccines are not intended to prevent infection; rather, they alleviate the severity of the infection, thus lessening the mortality rate. A study in Iraq has shown that vaccination status and manufacturer type reduce severe symptoms or the prognosis of patients, hospitalization rate, and death rate, particularly for those with full vaccination [62]. These conditions align with Jakarta’s condition after half of its residence were receiving the third dose in 2022. Furthermore, although SARS-CoV-2 keeps on mutating to evade the immune system or herd immunity, asymptomatic cases become more common for vaccinated people. Therefore, survivability is expected to increase. Several studies indicate that vaccines can make infected individuals less contagious [63,64]. Although the third vaccine was being distributed, uptake was extremely slow, and hence the lesser mortality peak associated with the Omicron variety occurred once again. This was due to the virus continuing to mutate, and it was possible that the vaccinated population had not yet been affected or had a lower mortality rate, as reported by numerous studies [65,66,67]. Overall, the duration of vaccination administration is correlated with the number of deaths in consideration of the virus variant.
As of May 2025, coronavirus continued to exist globally, with the latest variant, NB.1.8.1, responsible for over 10% of cases by mid-May. The number of COVID-19 cases has been reported as increasing in several Southeast Asian countries, including Thailand and Singapore [9]. This study highlights the importance of comprehensive data analysis in strengthening epidemiological surveillance. By thoroughly understanding these patterns, various parties can enhance their preparedness for and response to potential health crises, ensuring that they are better equipped to address unprecedented challenges that may threaten public health and safety. While this study did not include data from multiple laboratories or provinces due to access limitations, it provides detailed insights from a single reference laboratory integrated with provincial and national datasets. This approach may offer a useful framework for future studies exploring similar surveillance strategies in other settings.
5. Conclusions
During the 30 months of the global pandemic, data from the AJCUI COVID-19 laboratory showed trends in COVID-19 positivity that were broadly similar to those observed in Jakarta, both overall and when stratified by Ct-based intensity. While overall positivity at AJCUI was positively correlated with national data, analyses based on infection intensity did not show consistent associations at the Indonesian level, indicating that AJCUI data may better reflect provincial rather than national patterns. The government policies applied in Jakarta and Indonesia are consistent with WHO guidelines and were associated with reductions in reported cases over time. In addition, our study also highlights the value of integrating the Ct value distributions to better characterize patterns within positive cases. The observed positive correlation between AJCUI–Jakarta trends, despite the emergence of new variants and ongoing vaccination efforts, suggests that Ct-based metrics may offer additional insight into population-level transmission dynamics. Although this study does not assess predictive relationships, the findings support further investigation into the use of Ct value patterns as complementary surveillance indicators. With additional validation, such metrics may contribute to improved public health monitoring and response strategies. Integrating laboratory data with broader surveillance systems could help inform timely and appropriate interventions during future outbreaks or resurgences of the disease until the pandemic state transitions to an endemic state.
Supplementary Materials
The following supporting information can be downloaded at: https://www.mdpi.com/article/10.3390/covid6050086/s1, Table S1: Government policies during the COVID-19 pandemic in Indonesia; Table S2: The number of samples, positive cases and positivity extracted from AJCUI, Jakarta and Indonesia; Figure S1: Platform timeline for COVID-19 detection via RT-qPCR; Figure S2: Methodological details about the COVID-19 retrospective study with 30 months of data from June 2020 to December 2022; Figure S3: The trend of testing and positivity rate of COVID-19; Figure S4: Ct value dynamics regarding positive cases; Figure S5: Correlation of positivity rate and low viral intensity (Ct > 30).
Author Contributions
Conceptualization: S.A. and M.M.M.K.; Data curation: M.M.M.K., T.A.W., H.K., S.J., S.S.S., V. and J.W.W.; Formal analysis: M.M.M.K., T.A.W., H.K., S.J., I.M. and S.A.; Funding acquisition: None; Investigation: M.M.M.K., T.A.W., H.K., S.J., S.S.S., V., J.W.W., E.T. and A.D.K.T.; Methodology: M.M.M.K., T.A.W., H.K., S.J. and S.A.; Project administration: M.M.M.K. and S.A.; Resources: M.M.M.K., S.S.S., V., J.W.W., E.T. and S.A.; Software: M.M.M.K., T.A.W., H.K., S.J., I.M. and S.A.; Supervision: S.A. and M.M.M.K.; Validation: M.M.M.K. and S.A.; Visualization: M.M.M.K., T.A.W., H.K. and S.J.; Writing—original draft: T.A.W., H.K., S.J. and M.M.M.K.; Writing–review and editing: All authors. All authors have read and agreed to the published version of the manuscript.
Funding
This research received no external funding.
Institutional Review Board Statement
This study has been approved by the Institutional Review Board of the School of Medicine and Health Sciences, the AJCUI, under the registry number (32/11/KEP-FKIKUAJ/2022, on 30 November 2022).
Informed Consent Statement
Patient consent was waived by the Institutional Review Board of the School of Medicine and Health Sciences, the AJCUI, due to the retrospective nature of this study.
Data Availability Statement
The original contributions presented in this study are included in the article and Supplementary Materials. Further inquiries can be directed to the corresponding author.
Acknowledgments
The authors would like to thank the distinguished head of faculty members for their support during the COVID-19 laboratory AJCUI operation: Felicia Kurniawan, Yuda Turana, Stefanus Lembar, Sheella R. Bororing, Lilis, and Debora Yuliawati. The authors appreciate the help from our former COVID-19 laboratory staff Isadora G. Sahusilawane dentistry, Linawati Hananta, and Meiliyana Wijaya. Also, to our Atma Jaya Academic Hospital. The authors would also like to acknowledge all the participating healthcare personnel and volunteers for contributing to specimen processing and our COVID-19 laboratory technicians: Sri Handayani, Muhammad Yashir, Ariska V. Marantika, Ida Afiyah, Fitriani Nurhasanah, and Linda Widyawati. We would like to express our appreciation for Anastasia Hengestu’s assistance at the end of the research period.
Conflicts of Interest
The authors declare no conflicts of interest.
Abbreviations
The following abbreviations are used in this manuscript:
| nCoV | Novel Coronavirus |
| WHO | World Health Organization |
| COVID-19 | Coronavirus Disease 2019 |
| SARS-CoV-2 | Severe Acute Respiratory Syndrome Coronavirus 2 |
| LSSR | Large-Scale Social Restrictions |
| CARE | Community Activities Restrictions Enforcement |
| AJCUI | Atma Jaya Catholic University of Indonesia |
| Ct | Cycle Threshold |
| NIHRD | National Institute of Health Research and Development |
| BSL-2 | Bio-Safety Laboratory Level 2 |
| RT-qPCR | Reverse Transcription-quantitative Polymerase Chain Reaction |
| CI | Confidence Interval |
References
- Hui, D.S.; Azhar, E.I.; Madani, T.A.; Ntoumi, F.; Kock, R.; Dar, O.; Ippolito, G.; Mchugh, T.D.; Memish, Z.A.; Drosten, C.; et al. The Continuing 2019-NCoV Epidemic Threat of Novel Coronaviruses to Global Health—The Latest 2019 Novel Coronavirus Outbreak in Wuhan, China. Int. J. Infect. Dis. 2020, 91, 264–266. [Google Scholar] [CrossRef] [PubMed]
- Blanc, H.; Rothier Bautzer, E.; Vellut, N.; Tran, V.T. Spread of Awareness of COVID-19 between December 2019 and March 2020 in France. Sci. Rep. 2024, 14, 6850. [Google Scholar] [CrossRef] [Scilit]
- World Health Organization (WHO). Critical Preparedness, Readiness and Response Actions for COVID-19. Available online: https://www.who.int/publications/i/item/critical-preparedness-readiness-and-response-actions-for-covid-19 (accessed on 16 March 2023).
- World Health Organization (WHO). Contact Tracing and Quarantine in the Context of the Omicron SARS-CoV-2 Variant: Interim Guidance, 17 February 2022. Available online: https://iris.who.int/handle/10665/351949 (accessed on 15 March 2023).
- World Bank Group. Indonesia. Available online: https://www.worldbank.org/ext/en/country/indonesia (accessed on 14 May 2026).
- Setiadi, W.; Rozi, I.E.; Safari, D.; Daningrat, W.O.D.; Johar, E.; Yohan, B.; Yudhaputri, F.A.; Lestari, K.D.; Oktavianthi, S.; Myint, K.S.A.; et al. Prevalence and Epidemiological Characteristics of COVID-19 After One Year of Pandemic in Jakarta and Neighbouring Areas, Indonesia: A Single Center Study. PLoS ONE 2022, 17, e0268241. [Google Scholar] [CrossRef] [Scilit] [PubMed]
- Worldometer. Worldometer’s COVID-19 Data of Indonesia. Available online: https://www.worldometers.info/coronavirus/country/indonesia/ (accessed on 15 March 2023).
- Health Crisis Information. PPKM and PSBB as Steps to Adapt Behavior in the Midst of the Pandemic: PPKM dan PSBB Sebagai Langkah Adaptasi Perilaku di Tengah Pandemi. Available online: https://pusatkrisis.kemkes.go.id/ppkm-dan-psbb-sebagai-langkah-adaptasi-perilaku-di-tengah-pandemi (accessed on 15 March 2023).
- World Health Organization (WHO). COVID-19—Global Situation. Available online: https://www.who.int/emergencies/disease-outbreak-news/item/2025-DON572 (accessed on 2 June 2025).
- The Ministry of Health of the Republic of Indonesia. Performance Report of the Directorate of Health Service Quality Directorate General of Health Services: Laporan Kinerja Direktorat Mutu Pelayanan Kesehatan Direktorat Jenderal Pelayanan Kesehatan. Available online: https://keslan.kemkes.go.id/lakip_files/direktorat_mutu_akreditasi_pelayanan_kesehatan_lakip_2022.pdf (accessed on 14 May 2026).
- Jakarta Government. Jakarta Responds to COVID-19: Jakarta Tanggap COVID-19. Available online: https://corona.jakarta.go.id/id (accessed on 1 January 2023).
- The Ministry of Health of the Republic of Indonesia. Indonesia COVID-19 Dashboard. Available online: https://infeksiemerging.kemkes.go.id/dashboard/covid-19 (accessed on 1 January 2023).
- World Health Organization (WHO). WHO COVID-19 Dashboard for Indonesia. Available online: https://covid19.who.int/region/searo/country/id (accessed on 1 January 2023).
- Cabinet Secretariat of the Republic of Indonesia. Cabinet Secretariat of the Republic of Indonesia’s Website. Available online: https://setkab.go.id/ (accessed on 1 January 2023).
- The Ministry of Health of the Republic of Indonesia. National COVID-19 Vaccination: Vaksinasi COVID-19 Nasional. Available online: https://vaksin.kemkes.go.id/#/vaccines (accessed on 1 March 2023).
- COVID-19 Research and Innovation Consortium (Ristek/BRIN). Phylodynamics of Pandemic Coronavirus in Indonesia. Available online: https://gisaid.org/phylodynamics/indonesia/ (accessed on 24 March 2023).
- Hasibuan, L. Check, These Are the Requirements for Free PCR Swabs at Health Centers: Cek, Ini Syarat Swab PCR Gratis di Puskesmas. Available online: https://www.cnbcindonesia.com/tech/20210705141334-37-258367/cek-ini-syarat-swab-pcr-gratis-di-puskesmas (accessed on 15 March 2023).
- Rosana, F.C. BPOM Inaugurates Biohazard Lab to Support Corona Virus Specimen Testing: BPOM Resmi-kan Lab Biohazard Dukung Tes Spesimen Virus Corona. Available online: https://bisnis.tempo.co/read/1344472/bpom-resmikan-lab-biohazard-dukung-tes-spesimen-virus-corona (accessed on 1 March 2023).
- Thakur, V.; Bhola, S.; Thakur, P.; Patel, S.K.S.; Kulshrestha, S.; Ratho, R.K.; Kumar, P. Waves and Variants of SARS-CoV-2: Understanding the Causes and Effect of the COVID-19 Catastrophe. Infection 2022, 50, 309–325. [Google Scholar] [CrossRef] [Scilit]
- Cahyani, I.; Putro, E.W.; Ridwanuloh, A.M.; Wibowo, S.; Hariyatun, H.; Syahputra, G.; Akbariani, G.; Utomo, A.R.; Ilyas, M.; Loose, M.; et al. Genome Profiling of SARS-CoV-2 in Indonesia, ASEAN and the Neighbouring East Asian Countries: Features, Challenges and Achievements. Viruses 2022, 14, 778. [Google Scholar] [CrossRef] [Scilit]
- Shiehzadegan, S.; Alaghemand, N.; Fox, M.; Venketaraman, V. Analysis of the Delta Variant B.1.617.2 COVID-19. Clin. Pract. 2021, 11, 778–784. [Google Scholar] [CrossRef] [Scilit]
- Dyer, O. COVID-19: Delta Infections Threaten Herd Immunity Vaccine Strategy. BMJ 2021, 374, n1933. [Google Scholar] [CrossRef] [Scilit]
- Hassanpour, S.H.; Nikbakht, J. A Comprehensive Review on COVID-19. Zahedan J. Res. Med. Sci. 2021, 23, e109853. [Google Scholar] [CrossRef] [Scilit]
- Rashedi, R.; Samieefar, N.; Akhlaghdoust, M.; Mashhadi, M.; Darzi, P.; Rezaei, N. Delta Variant: The New Challenge of COVID-19 Pandemic, an Overview of Epidemiological, Clinical, and Immune Characteristics. Acta Biomed. 2022, 93, e2022179. [Google Scholar] [CrossRef]
- Thakur, I.; Chatterjee, A.; Ghosh, A.K.; Chatterjee, S.S.; Saha, S.; Panja, T.; Dan, U. A Comparative Study between First Three Waves of COVID-19 Pandemic with Respect to Risk Factors, Initial Clinic-Demographic Profile, Severity and Outcome. J. Fam. Med. Prim. Care 2024, 13, 2455–2461. [Google Scholar] [CrossRef] [Scilit] [PubMed]
- Dhawan, M.; Saied, A.R.A.; Bin Emran, T.; Choudhary, O.P. Emergence of Omicron Variant’s Sublineages BA.4 and BA.5: Risks Assessment and Possible Countermeasures. New Microbes New Infect. 2022, 48, 100997. [Google Scholar] [CrossRef] [Scilit]
- Skittrall, J.P.; Wilson, M.; Smielewska, A.A.; Parmar, S.; Fortune, M.D.; Sparkes, D.; Curran, M.D.; Zhang, H.; Jalal, H. Specificity and Positive Predictive Value of SARS-CoV-2 Nucleic Acid Amplification Testing in a Low-Prevalence Setting. Clin. Microbiol. Infect. 2021, 27, 469.e9–469.e15. [Google Scholar] [CrossRef] [Scilit]
- Idris, M. The Irony of PCR Test Prices: Previously Paid IDR 2.5 Million, Now Only IDR 275 Thousand: Ironi Harga Tes PCR: Dulu Bayar Rp 2,5 Juta, Kini Cuma Rp 275 Ribu. Available online: https://money.kompas.com/read/2021/11/14/133809726/ironi-harga-tes-pcr-dulu-bayar-rp-25-juta-kini-cuma-rp-275-ribu?page=all (accessed on 13 March 2023).
- Bestari, N.P. Tok! Java-Bali Covid PCR Price Drops to IDR 275,000: Tok! Harga PCR Covid Jawa-Bali Turun Jadi Rp 275 Ribu. Available online: https://www.cnbcindonesia.com/tech/20211027160220-37-286979/tok-harga-pcr-covid-jawa-bali-turun-jadi-rp-275-ribu (accessed on 1 March 2023).
- Widyawati. Omicron Local Transmission Case Detected In Jakarta: Kasus Transmisi Lokal Omicron Terdeteksi di Jakarta. Available online: https://kemkes.go.id/id/kasus-transmisi-lokal-omicron-terdeteksi-di-jakarta (accessed on 15 March 2023).
- Gallagher, J. Omicron Covid Indicated to be Milder, But Still Concerned About Burdening Health Services and Overwhelming Hospitals: Covid Omicron Terindikasi Lebih Ringan, Namun Tetap Dikhawatirkan Membebani Layanan Kesehatan dan Membuat Rumah Sakit Kewalahan. Available online: https://www.bbc.com/indonesia/dunia-59751944 (accessed on 16 March 2023).
- Syahputra, E. Remember! These are the Conditions for Boarding a Plane during the Christmas Holidays, Is PCR Mandatory?: Ingat! Ini Syarat Naik Pesawat Saat Libur Nataru, Wajib PCR? Available online: https://www.cnbcindonesia.com/news/20211212112836-4-298584/ingat-ini-syarat-naik-pesawat-saat-libur-nataru-wajib-pcr (accessed on 18 January 2025).
- Trevisan, C.; Pedone, C.; Maggi, S.; Noale, M.; di Bari, M.; Sojic, A.; Molinaro, S.; Giacomelli, A.; Bianchi, F.; Tavio, M.; et al. Accessibility to SARS-CoV-2 Swab Test during the COVID-19 Pandemic: Did Age Make the Difference? Health Policy 2021, 125, 1580–1586. [Google Scholar] [CrossRef] [Scilit] [PubMed]
- Haryono, A. Starting Work, Companies are Required to Data Their Employees and Conduct PCR Swab Tests: Mulai Masuk Kerja, Perusahaan Wajib Data Karyawan dan Lakukan Swab PCR. Available online: https://daerah.sindonews.com/read/436576/704/mulai-masuk-kerja-perusahaan-wajib-data-karyawan-dan-lakukan-swab-pcr-1621897558 (accessed on 17 February 2023).
- Hidayat, F. Routine Swab Tests, The Way Companies Ensure Employees are Free of COVID-19: Rutin Swab Test, Cara Perusahaan Memastikan Karyawan Bebas COVID-19. Available online: https://www.beritasatu.com/nusantara/817285/rutin-swab-test-cara-perusahaan-memastikan-karyawan-bebas-covid-19 (accessed on 17 February 2023).
- Kim, Y.K.; Yoon, W.C.; Lee, J.; Poncelet, J.L.; Dolcemascolo, G.; Sohn, H.G. A Strategic Response Map for Cascading Pandemics: Lessons Learned from the Response to COVID-19 in the Republic of Korea. Prog. Disaster Sci. 2022, 13, 100214. [Google Scholar] [CrossRef] [Scilit]
- Djalante, R.; Nurhidayah, L.; Van Minh, H.; Phuong, N.T.N.; Mahendradhata, Y.; Trias, A.; Lassa, J.; Miller, M.A. COVID-19 and ASEAN Responses: Comparative Policy Analysis. Prog. Disaster Sci. 2020, 8, 100129. [Google Scholar] [CrossRef] [Scilit]
- Vallejo, B.M.; Ong, R.A.C. Policy Responses and Government Science Advice for the COVID 19 Pandemic in the Philippines: January to April 2020. Prog. Disaster Sci. 2020, 7, 100115. [Google Scholar] [CrossRef] [Scilit]
- Schneiderman, M.; Rumain, B.; Kaganovskiy, L.; Geliebter, A. Incidence and Relative Risk of COVID-19 in Adolescents and Youth Compared with Older Adults in 19 US States, Fall 2020. JAMA Netw. Open 2022, 5, e2222126. [Google Scholar] [CrossRef] [Scilit]
- Chan, H.F.; Moon, J.W.; Savage, D.A.; Skali, A.; Torgler, B.; Whyte, S. Can Psychological Traits Explain Mobility Behavior during the COVID-19 Pandemic? Soc. Psychol. Pers. Sci. 2021, 12, 1018–1029. [Google Scholar] [CrossRef] [Scilit]
- Caselli, F.; Grigoli, F.; Sandri, D.; Spilimbergo, A. Mobility Under the COVID-19 Pandemic: Asymmetric Effects Across Gender and Age. IMF Econ. Rev. 2022, 70, 105–138. [Google Scholar] [CrossRef] [Scilit]
- Bwire, G.M. Coronavirus: Why Men are More Vulnerable to COVID-19 than Women? SN Compr. Clin. Med. 2020, 2, 874–876. [Google Scholar] [CrossRef] [Scilit]
- Mashabi, S.; Galih, B. 6 Months of the COVID-19 Pandemic: Notes on PSBB and Implementation of Health Protocols: 6 Bulan Pandemi COVID-19: Catatan Tentang PSBB Dan Penerapan Protokol Kesehatan. Available online: https://nasional.kompas.com/read/2020/09/03/09002161/6-bulan-pandemi-covid-19-catatan-tentang-psbb-dan-penerapan-protokol (accessed on 2 February 2023).
- The Coordinating Ministry for Economic Affairs. Understanding the PPKM Levels: Mengenal Tingkatan Level PPKM. Available online: https://ekon.go.id/publikasi/kata-data/detail/3168/mengenal-tingkatan-level-ppkm (accessed on 2 February 2023).
- Saiful Mujani Research and Consulting. COVID-19 Outbreak: Attitudes on Policies and Economic Conditions of Citizens: Wabah COVID-19: Sikap Atas Kebijakan Dan Kondisi Ekonomi Warga. Available online: https://saifulmujani.com/wabah-covid-19-sikap-atas-kebijakan-dan-kondisi-ekonomi-warga/ (accessed on 2 February 2023).
- Prayitno, A.; Sutrisno, E. Policy of KODIM 0501 Central Jakarta for Handling of the COVID-19 Pandemic in Central Jakarta. Daengku J. Humanit. Soc. Sci. Innov. 2022, 2, 171–180. [Google Scholar] [CrossRef] [Scilit]
- Daniel, D.; Kurniawan, A.; Pinawati, A.R.I.; Thohira, M.C.; Annaduzzaman, M. The COVID-19 Health Protocol among University Students: Case Studies in Three Cities in Indonesia. Int. J. Environ. Res. Public Health 2022, 19, 10630. [Google Scholar] [CrossRef] [Scilit]
- Jakarta Governor. Regulation of the Governor of the Special Capital Region of Jakarta Number 33 Year 2020 Concerning PSBB: Peraturan Gubernur Daerah Khusus Ibukota Jakarta Nomor 33 Tahun 2020 Tentang PSBB. Available online: https://jdih.jakarta.go.id/dokumen/detail/2310/peraturan-gubernur-nomor-33-tahun-2020-tentang-pelaksanaan-pembatasan-sosial-berskala-besar-dalam-penanganan-corona-virus-disease-2019-covid-19-di-provinsi-daerah-khusus-ibukota-jakartaproduk-hukum-aktual (accessed on 1 February 2023).
- The Ministry of Home Affairs of the Republic of Indonesia. Instruction of the Minister of Home Affairs Number 32 Year 2021 concerning the Implementation of Level 3, Level 2, and Level 1 Community Activity Restrictions and Optimizing the Corona Virus Disease 2019 Handling Posts at the Village and Sub-District Level: Instruksi Menteri Dalam Negeri Nomor 32 Tahun 2021 tentang Pemberlakuan Pembatasan Kegiatan Masyarakat Level 3, Level 2 dan Level 1 serta Mengoptimalkan Posko Penanganan Corona Virus Disease 2019 di Tingkat Desa dan Kelurahan untuk Pengendalian Penyebaran Corona Virus Disease 2019. Available online: https://jdih.kemendagri.go.id/dokumen/view?id=484 (accessed on 2 February 2023).
- The Ministry of Home Affairs of the Republic of Indonesia. Instruction of the Minister of Home Affairs Number 15 Year 2021 Concerning the Implementation of Emergency Community Activity Restrictions for Corona Virus Disease 2019 in Java and Bali Regions: Instruksi Menteri Dalam Negeri Nomor 15 Tahun 2021 Tentang Pemberlakuan Pembatasan Kegiatan Masyarakat Darurat Corona Virus Disease 2019 di Wilayah Jawa dan Bali. Available online: https://jdih.kemendagri.go.id/dokumen/view?id=467 (accessed on 2 February 2023).
- The Ministry of Home Affairs of the Republic of Indonesia. Instruction of the Minister of Home Affairs Number 24 Year 2021 Concerning the Implementation of Level 4 and Level 3 COVID-19 Community Activity Restrictions in the Java and Bali Regions: Instruksi Menteri Dalam Negeri Nomor 24 Tahun 2021 Tentang Pemberlakuan Pembatasan Kegiatan Masyarakat Level 4 dan Level 3 Corona Virus Disease 2019 di Wilayah Jawa dan Bali. Available online: https://jdih.kemendagri.go.id/dokumen/view?id=476 (accessed on 2 February 2023).
- The Ministry of Home Affairs of the Republic of Indonesia. Instruction of the Minister of Home Affairs Number 26 Year 2021 Concerning the Implementation of Level 3, Level 2, and Level 1 Community Activity Restrictions and Optimizing the Corona Virus Disease 2019 Handling Posts at the Village and Sub-District Level: Instruksi Menteri Dalam Negeri Nomor 26 Tahun 2021 tentang Pemberlakuan Pembatasan Kegiatan Masyarakat Level 3, Level 2 dan Level 1 serta Mengoptimalkan Posko Penanganan Corona Virus Disease 2019 di Tingkat Desa dan Kelurahan untuk Pengendalian Penyebaran Corona Virus Disease 2019. Available online: https://ppidutama.kalselprov.go.id/?p=3845 (accessed on 2 February 2023).
- Mave, V.; Shaikh, A.; Monteiro, J.M.; Bogam, P.; Pujari, B.S.; Gupte, N. Association of National and Regional Lockdowns with COVID-19 Infection Rates in Pune, India. Sci. Rep. 2022, 12, 10446. [Google Scholar] [CrossRef] [Scilit] [PubMed]
- Ward, S.; Lindsley, A.; Courter, J.; Assa’ad, A. Clinical Testing for COVID-19. J. Allergy Clin. Immunol. 2020, 146, 23–34. [Google Scholar] [CrossRef] [Scilit] [PubMed]
- Tom, M.R.; Mina, M.J. To Interpret the SARS-CoV-2 Test, Consider the Cycle Threshold Value. Clin. Infect. Dis. 2020, 71, 2252–2254. [Google Scholar] [CrossRef] [Scilit]
- Tso, C.F.; Garikipati, A.; Green-Saxena, A.; Mao, Q.; Das, R. Correlation of Population SARS-CoV-2 Cycle Threshold Values to Local Disease Dynamics: Exploratory Observational Study. JMIR Public Health Surveill. 2021, 7, e28265. [Google Scholar] [CrossRef] [Scilit] [PubMed]
- Walker, A.S.; Pritchard, E.; House, T.; Robotham, J.V.; Birrell, P.J.; Bell, I.; Bell, J.I.; Newton, J.N.; Farrar, J.; Diamond, I.; et al. Ct Threshold Values, a Proxy for Viral Load in Community SARS-CoV-2 Cases, Demonstrate Wide Variation across Populations and over Time. eLife 2021, 10, e64683. [Google Scholar] [CrossRef] [Scilit]
- Hay, J.A.; Kennedy-Shaffer, L.; Kanjilal, S.; Lennon, N.J.; Gabriel, S.B.; Lipsitch, M.; Mina, M.J. Estimating Epidemiologic Dynamics from Cross-Sectional Viral Load Distributions. Science 2021, 373, eabh0635. [Google Scholar] [CrossRef] [Scilit]
- The Indonesian Food and Drug Authority. Indonesian President Becomes the First Recipient of COVID-19 Vaccine, Vaccination Officially Begins: Presiden RI Menjadi Penerima Pertama Suntikan, Vaksinasi COVID-19 Resmi Dimulai. Available online: http://www.pom.go.id/berita/presiden-ri-menjadi-penerima-pertama-suntikan-vaksinasi-covid-19-resmi-dimulai (accessed on 24 March 2023).
- Rini, R.A.P. DKI Jakarta As the First Province to Reach 100 Percent First Dose COVID-19 Vaccination Coverage: DKI Jakarta Provinsi Pertama Cakupan Vaksinasi COVID-19 Dosis Pertama Capai 100 Persen. Available online: https://www.tribunnews.com/corona/2021/08/13/dki-jakarta-provinsi-pertama-cakupan-vaksinasi-covid-19-dosis-pertama-capai-100-persen (accessed on 24 March 2023).
- McCarthy, N. How Effective Are the COVID-19 Vaccines? Available online: https://www.statista.com/chart/23510/estimated-effectiveness-of-covid-19-vaccine-candidates/ (accessed on 17 February 2023).
- Al-Obaidi, A.H.; Ibrahim, M.M.; Al-Qaseer, A.H.A.M. Effectiveness of COVID-19 Vaccination in Reducing Severity among SARS-CoV-2 Infected Patients: A Prospective Study from Iraq. Health Sci. Rep. 2026, 9, e71768. [Google Scholar] [CrossRef] [Scilit]
- Mallapaty, S. Can COVID Vaccines Stop Transmission? Scientists Race to Find Answers. Available online: https://www.nature.com/articles/d41586-021-00450-z (accessed on 5 February 2023).
- Levine-Tiefenbrun, M.; Yelin, I.; Katz, R.; Herzel, E.; Golan, Z.; Schreiber, L.; Wolf, T.; Nadler, V.; Ben-Tov, A.; Kuint, J.; et al. Initial Report of Decreased SARS-CoV-2 Viral Load after Inoculation with the BNT162b2 Vaccine. Nat. Med. 2021, 27, 790–792. [Google Scholar] [CrossRef] [Scilit]
- Noh, J.Y.; Jeong, H.W.; Shin, E.C. SARS-CoV-2 Mutations, Vaccines, and Immunity: Implication of Variants of Concern. Signal Transduct. Target. Ther. 2021, 6, 203. [Google Scholar] [CrossRef] [Scilit]
- SeyedAlinaghi, S.; Mirzapour, P.; Dadras, O.; Pashaei, Z.; Karimi, A.; MohsseniPour, M.; Soleymanzadeh, M.; Barzegary, A.; Afsahi, A.M.; Vahedi, F.; et al. Characterization of SARS-CoV-2 Different Variants and Related Morbidity and Mortality: A Systematic Review. Eur. J. Med. Res. 2021, 26, 51. [Google Scholar] [CrossRef] [Scilit]
- Hafiz, I.; Illian, D.N.; Meila, O.; Utomo, A.R.H.; Susilowati, A.; Susetya, I.E.; Desrita, D.; Siregar, G.A.; Basyuni, M. Effectiveness and Efficacy of Vaccine on Mutated SARS-CoV-2 Virus and Post Vaccination Surveillance: A Narrative Review. Vaccines 2022, 10, 82. [Google Scholar] [CrossRef] [Scilit]

Disclaimer/Publisher’s Note: The statements, opinions and data contained in all publications are solely those of the individual author(s) and contributor(s) and not of MDPI and/or the editor(s). MDPI and/or the editor(s) disclaim responsibility for any injury to people or property resulting from any ideas, methods, instructions or products referred to in the content. |
© 2026 by the authors. Licensee MDPI, Basel, Switzerland. This article is an open access article distributed under the terms and conditions of the Creative Commons Attribution (CC BY) license.