
Article

Nephrinuria as an Early Biomarker of Renal Injury in Hypertensive Patients After COVID-19: A Comparative Study


by
Gulomjon Kholov
1,*,
Nilufar Akhmedova
1,*,
Ulugbek Ochilov
2,3,*,
Sukhrob Nurulloyev
1,
Sitora Mukhammadiyeva
1,
Nozima Djuraeva
1,
Otabek Fayzulloyev
2,
Abdugappor Insopov
4,
Sanobar Rakhmonova
1,
Mehriniso Ochilova
2,
Rajab Bobokalonov
2,
Akmal Djumaev
2,
Zulfiya Abulova
2,
Dildora Otajonova
5,
Mokhibegim Nematova
2,
Nigina Shukurova
2,
Navbakhor Nazarova
2,
Dildora Komilova
6,
Mehinbonu Nurmukhammedova
2 and
Dilfuza Rakhmonova
2
1
Department of Nephrology and Hemodialysis, Bukhara State Medical Institute, Bukhara 200100, Uzbekistan
2
Interfaculty Department of Foreign Languages, Bukhara State University, Bukhara 200100, Uzbekistan
3
History and Foreign Languages Department, Asia International University, Bukhara 200100, Uzbekistan
4
The Latest History of Uzbekistan, National University of Uzbekistan, Tashkent 100174, Uzbekistan
5
Interfaculty Department of Foreign Languages, Chirchik State Pedagogical University, Chirchik 702100, Uzbekistan
6
Department of Western Languages, Tashkent State University of Oriental Studies, Tashkent 100174, Uzbekistan
*
Authors to whom correspondence should be addressed.
COVID 2026, 6(5), 87; https://doi.org/10.3390/covid6050087
Submission received: 30 April 2026 / Revised: 15 May 2026 / Accepted: 19 May 2026 / Published: 20 May 2026
(This article belongs to the Special Issue Long COVID: Pathophysiology, Symptoms, Treatment, and Management)

Abstract

Background: Hypertension is one of the most prevalent comorbidities in patients with COVID-19 and a major contributor to chronic kidney disease (CKD). Traditional kidney injury markers, including creatinine, estimated glomerular filtration rate (eGFR) and microalbuminuria, reflect renal injury only after substantial nephron loss has already occurred. Urinary podocyte proteins, such as nephrin (nephrinuria), have been suggested as early markers of glomerular barrier dysfunction; however, their clinical behavior and diagnostic value in hypertensive patients with previous SARS-CoV-2 infection are unknown. Aim: To assess urinary nephrinuria, microalbuminuria, transforming growth factor β1 (TGF-β1), aldosterone, vascular endothelial growth factor A (VEGF-A) and renal hemodynamics across different stages of hypertension in patients with and without a history of COVID-19 and to assess the response to conventional antihypertensive and nephroprotective treatment. Methods: In a prospective comparative cohort study, 120 patients (aged 30–60 years) with stage I–III essential hypertension were stratified by COVID-19 history into a post-COVID-19 group (n = 60) and a non-COVID-19 group (n = 60); within each group, 20 patients were assigned to each hypertension stage. Comparisons were performed between the post-COVID-19 and non-COVID-19 subgroups at the same hypertension stage. Serum creatinine, cystatin-C, aldosterone, TGF-β1 and VEGF-A, urinary microalbumin and nephrin and intrarenal Doppler hemodynamics were measured at baseline and after six months of guideline-based treatment. Results: Nephrinuria was markedly increased in post-COVID-19 patients in all stages of hypertension, including stage I, where serum creatinine, cystatin-C and eGFR were within the normal range (126.5 ± 9.1 vs. 91.9 ± 8.3 pg/mL, p < 0.01). Nephrinuria was strongly correlated with renal functional reserve (r = −0.824, p < 0.001), eGFR (r = −0.797, p < 0.001), microalbuminuria (r = 0.758, p < 0.001), aldosterone (r = 0.613, p < 0.001) and VEGF-A (r = 0.589, p < 0.001). Antihypertensive and nephroprotective treatment for six months decreased nephrinuria, blood pressure and TGF-β1, with more limited effects in stage III disease. Conclusions: Nephrinuria was found to be an early marker of renal involvement in COVID-19, occurring before microalbuminuria and conventional functional markers and with a greater relative difference than these markers in stage I disease, suggesting podocyte injury as an early and potentially reversible mechanism of post-COVID renal involvement in hypertensive patients. Nephrinuria seems to be a potential biomarker for early renal surveillance in this population and its prognostic role for incident CKD needs to be validated in longitudinal outcome studies.

1. Introduction

Five years after the emergence of SARS-CoV-2, post-acute COVID-19 is still a major clinical and public health concern. Long-term multi-organ symptoms, collectively known as long COVID or post-acute sequelae of SARS-CoV-2 infection (PASC), have been reported in a considerable proportion of patients, with cardiovascular, respiratory, neurological and renal symptoms being the most common [1,2,3,4]. Hypertension is both a common pre-existing condition and a frequent complication reported after COVID-19 and is now recognized as a major contributor to post-acute organ dysfunction [5,6].
Hypertension is the most common comorbidity among patients admitted with COVID-19, with 10–34% of patients in early case series and over 50% of patients with severe COVID-19 [7,8]. The overlap of SARS-CoV-2 entry via angiotensin-converting enzyme 2 (ACE2) and renin–angiotensin–aldosterone system (RAAS) dysfunction offers a mechanistic explanation for the accelerated end-organ damage in the presence of both. ACE2 receptors are highly expressed not only on the lung epithelium but also on proximal tubular cells and podocytes of the kidney, making the kidney a key target organ for SARS-CoV-2 infection [9,10].
Renal complications of COVID-19 include acute kidney injury during the acute phase of the disease and subclinical glomerular and tubular dysfunction for months after the acute phase [11,12]. This risk is further enhanced in patients with hypertension, as the renal parenchyma is already damaged by pressure-induced injury and the viral cytopathic effect, cytokine-induced inflammation, oxidative stress and microvascular thrombosis further damage the kidney [13,14]. However, post-COVID renal monitoring in hypertensive patients still relies predominantly on serum creatinine, estimated glomerular filtration rate (eGFR) and microalbuminuria, which are markers that only change after significant damage has occurred.
The field of molecular nephrology has progressed from generalised endothelial dysfunction to podocyte dysfunction as the initial event in proteinuric renal disease. A highly specialised intercellular junction (slit diaphragm) of podocyte foot processes is responsible for selective glomerular filtration, mediated by a transmembrane protein, nephrin [15]. Disruption of the actin cytoskeleton, foot-process effacement and shedding of nephrin into the urine (nephrinuria) occur prior to microalbuminuria in a variety of animal models and have been shown to occur in early human glomerular disease [16,17]. Therefore, nephrinuria may provide an early biological indicator of podocyte injury at the time when the course of disease can be modified.
Although there is a wealth of data on the pathophysiology of long COVID and hypertensive nephropathy, the question of whether SARS-CoV-2 causes persistent podocyte dysfunction in hypertensive patients and whether that footprint can be detected by nephrinuria before microalbuminuria has not been sufficiently explored. Available post-COVID renal cohorts have mostly relied on creatinine-based measures and the few studies that reported urinary podocyte proteins did not categorise them according to the stage of hypertension or compare them with age-, sex- and hypertension stage-matched non-COVID controls. Specifically, there is no information about the parallel evolution of nephrinuria, TGF-β1, aldosterone and intrarenal hemodynamics in patients with COVID-19 on top of essential hypertension.
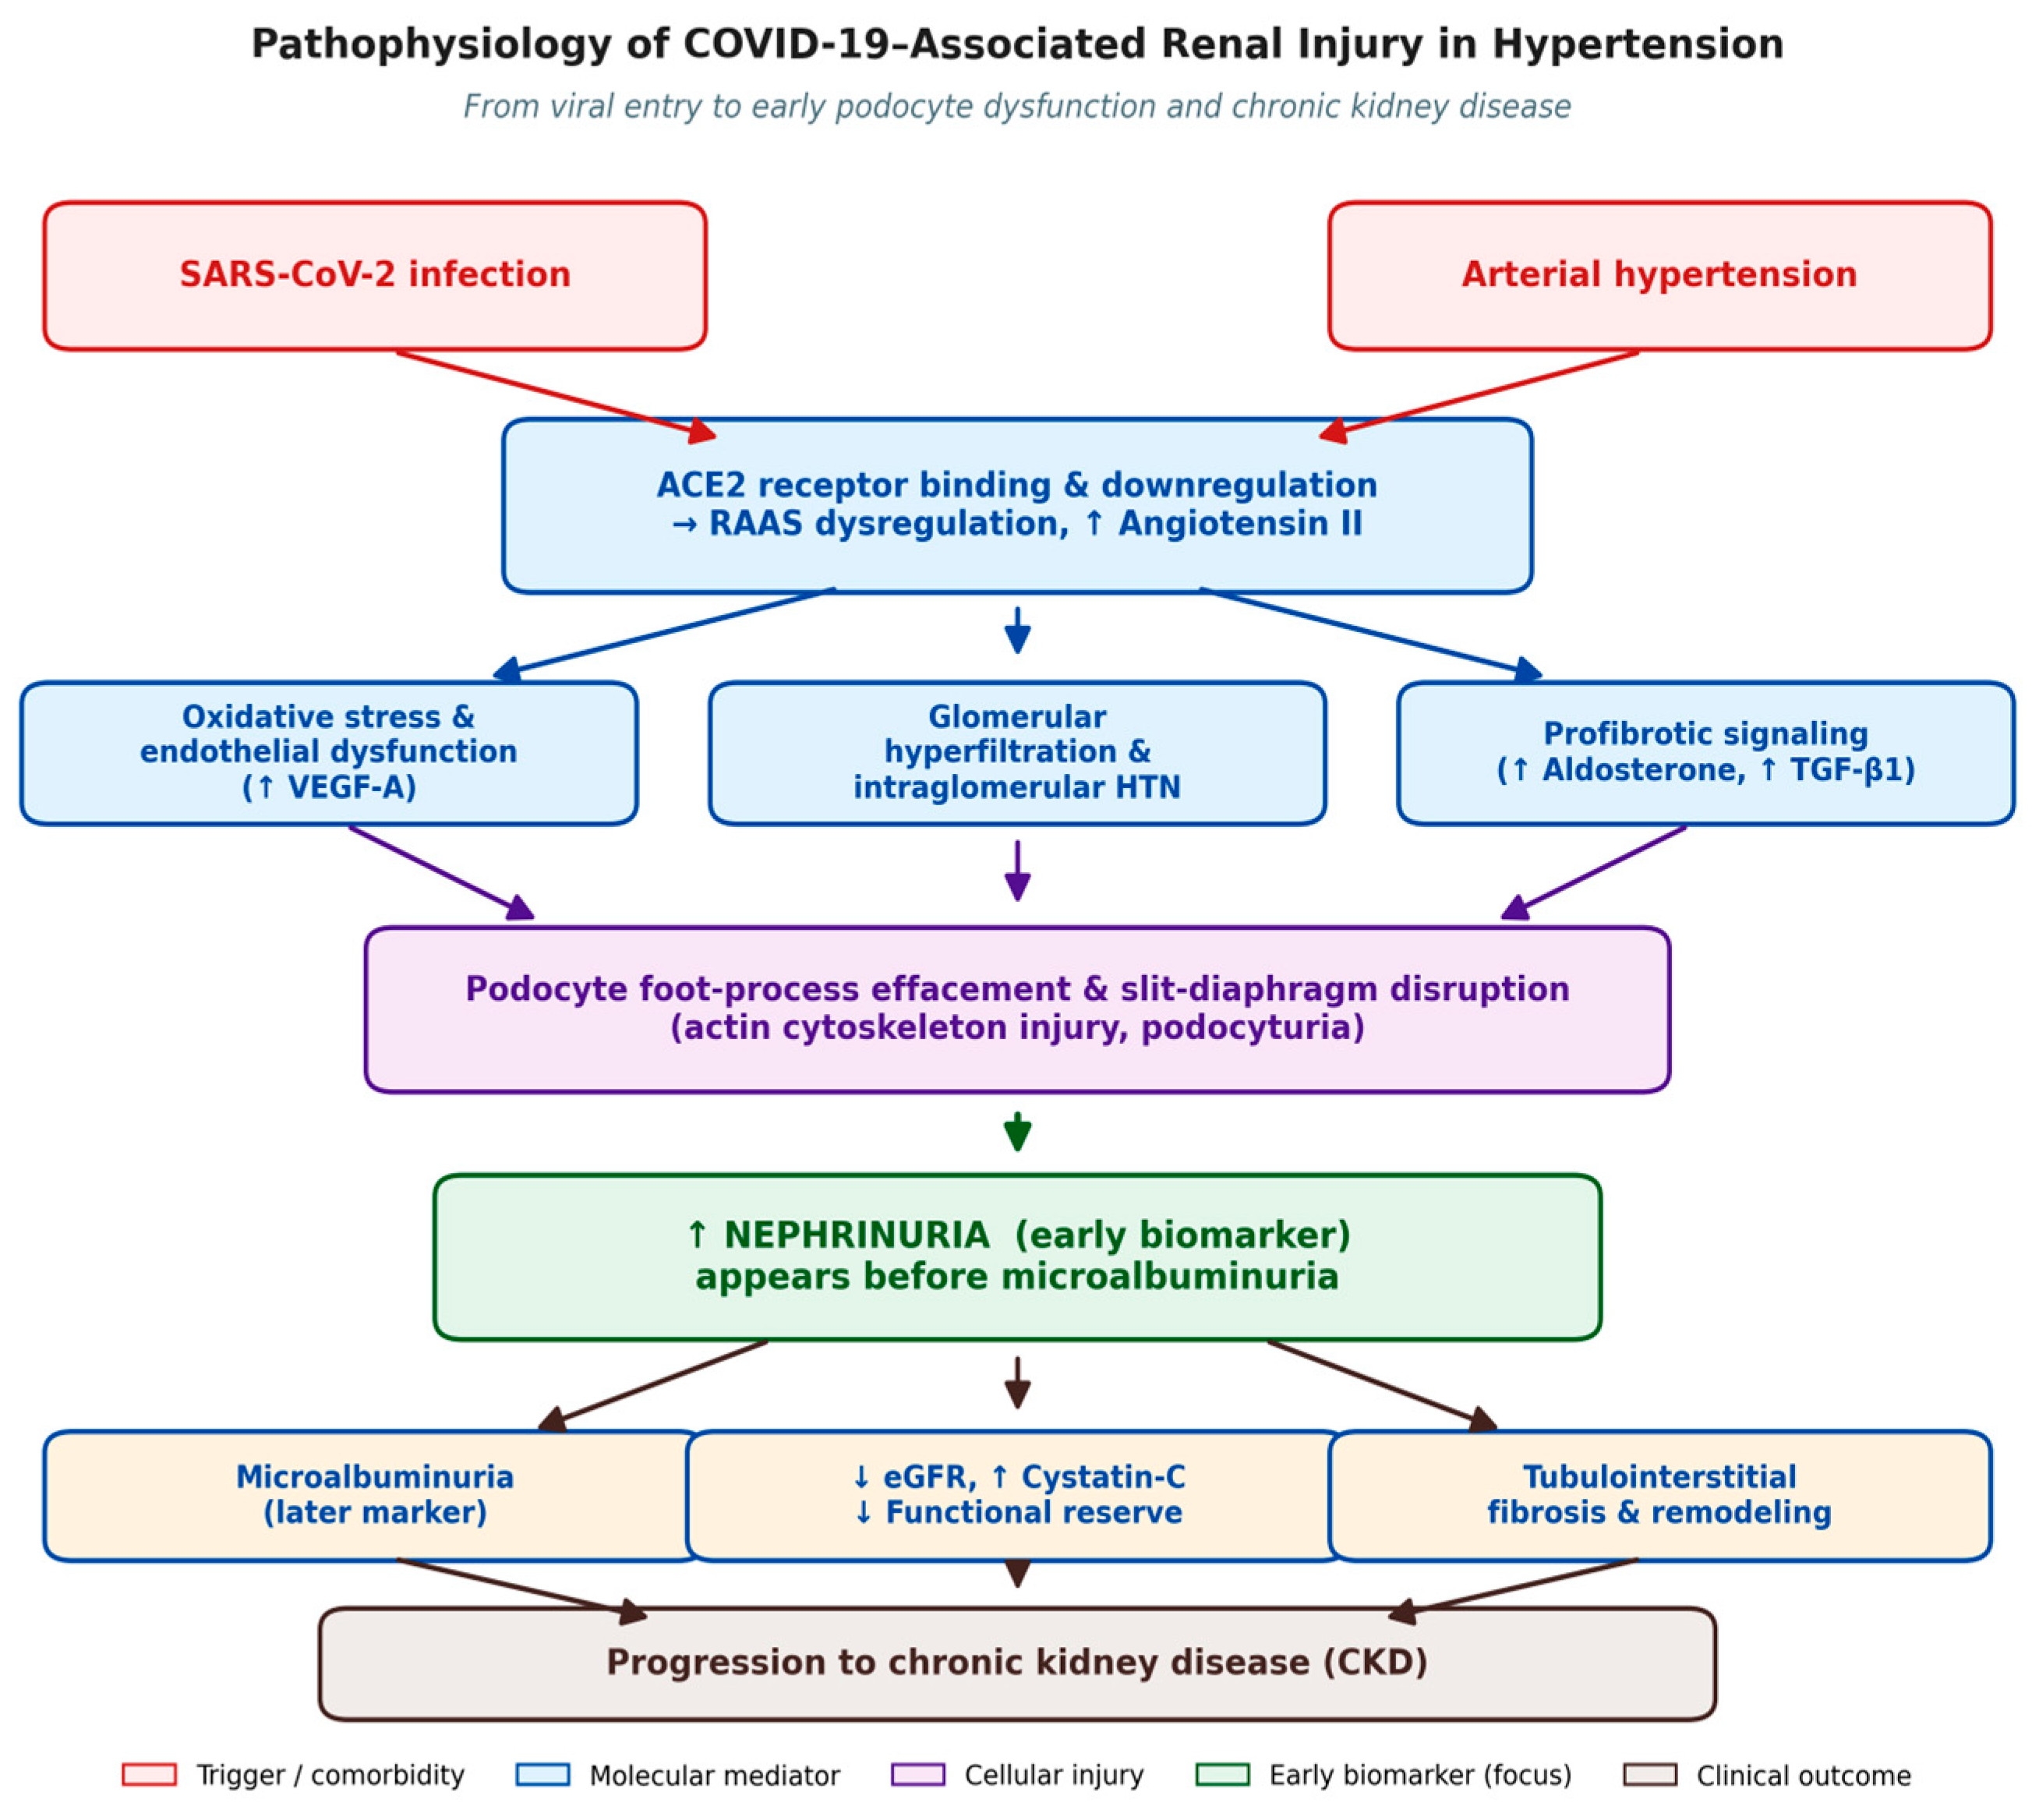
This study fills this gap by conducting a prospective comparative study of nephrinuria, conventional markers of renal function, profibrotic and vasoactive factors and Doppler-derived intrarenal hemodynamics in 120 patients with stage I-III essential hypertension, with and without COVID-19 infection. The aim of this study was to assess whether nephrinuria precedes microalbuminuria, whether it is related to the degree of profibrotic and endothelial activation and whether it responds to conventional antihypertensive and nephroprotective treatment. The proposed pathophysiological mechanism of SARS-CoV-2 infection, RAAS dysregulation, podocyte injury, and early nephrinuria in hypertensive patients following COVID-19 is shown in Figure 1.

2. Materials and Methods

2.1. Study Design and Setting

This was a single-center prospective comparative cohort study at the Department of Internal Medicine, Bukhara State Medical Institute, in collaboration with regional medical centers in Bukhara and Navoiy regions, Uzbekistan. Bukhara State Medical Institute is the main academic medical institution in the Bukhara region and a tertiary referral center for over 1.9 million people living in Bukhara and neighboring regions, with clinical departments providing routine care, postgraduate training and clinical research for the adult population of the region. The aim of the study was to assess early renal biomarkers and intrarenal hemodynamics in hypertensive patients with and without a history of COVID-19 and to assess the response to six months of standard antihypertensive and nephroprotective treatment.

2.2. Participants

We recruited 120 adult patients (30–60 years old) with established essential hypertension at enrollment (stage I–III, ESC/ESH classification) and divided them into two main groups of 60 patients each: a post-COVID-19 group (PCR-confirmed SARS-CoV-2 infection at least three months before enrollment, with full clinical recovery) and a non-COVID-19 group with no history of COVID-19 and negative SARS-CoV-2 serology at enrollment. Each group was further stratified into three subgroups (I, II and III) of 20 patients each, based on hypertension stage. The stages of hypertension were classified based on office blood pressure according to the ESC/ESH classification: stage I, systolic 140–159 and/or diastolic 90–99 mmHg; stage II, systolic 160–179 and/or diastolic 100–109 mmHg; stage III, systolic ≥ 180 and/or diastolic ≥ 110 mmHg. Since all patients were on antihypertensive therapy at the time of enrolment, the stage assignment combined the highest untreated office blood pressure documented in the medical records with the target-organ damage findings, as recommended in the ESC/ESH guideline.
The inclusion criteria were as follows: (i) aged 30–60 years; (ii) diagnosed with essential hypertension; (iii) for the post-COVID group, a history of PCR-confirmed SARS-CoV-2 infection at least 3 months before the study and recovery; and (iv) informed consent.
The exclusion criteria were as follows: (i) type 1 or type 2 diabetes; (ii) chronic heart failure NYHA class III–IV; (iii) primary glomerular disease, polycystic kidney disease or known structural urinary tract abnormality; (iv) active malignancy or systemic inflammatory or autoimmune disease; (v) pregnancy; and (vi) active SARS-CoV-2 infection at the time of enrolment. Patients with a documented history of diabetes mellitus or current use of glucose-lowering medication or who had a fasting plasma glucose ≥ 7.0 mmol/L on the day of enrolment were excluded from screening for diabetes mellitus. Glycated hemoglobin (HbA1c) was not used to confirm absence of diabetes, which is acknowledged in the Limitations.

2.3. Clinical and Laboratory Assessment

A standardized medical examination was performed on all participants, including anthropometric measurements, three consecutive office blood pressure measurements (average) and a medical history. Blood and first-morning urine samples were obtained on the day of the examination. Serum biochemistry (creatinine, cystatin-C, fasting glucose and total cholesterol) was determined on a Mindray BA-88A semi-automatic biochemical analyzer (Shenzhen Mindray Bio-Medical Electronics Co., Ltd., Shenzhen, China) using the manufacturer’s ready-to-use clinical chemistry reagents. The estimated glomerular filtration rate (eGFR) was determined from serum cystatin-C using the CKD-EPI equation and expressed as mL/min/1.73 m2.
Urinary microalbumin was measured by a photometric method (benzethonium chloride denaturation) at 430 nm. Urinary nephrin (nephrinuria) was determined by an enzyme-linked immunosorbent assay (ELISA) using a commercial human nephrin sandwich ELISA kit (Cusabio Biotech Co., Ltd., Wuhan, China; catalog series CSB-E16608h) and expressed in pg/mL. The nephrinuria was measured using a commercial sandwich ELISA kit for human nephrin (Cusabio Biotech Co., Ltd., Wuhan, China; catalog series CSB-E16608h) on a microplate spectrophotometer at 450 nm, following the manufacturer’s instructions. The manufacturer’s stated detection range for the assay is approximately 15.6–1000 pg/mL and the minimum detectable concentration is <3.9 pg/mL; all samples in both groups were well above the minimum detectable concentration and within the linear range of the assay, so the results are reported in pg/mL rather than ng/mL. Currently, there is no widely accepted clinical reference interval for urinary nephrin in healthy adults; published cross-sectional studies in non-diabetic, normotensive populations have reported levels that are broadly similar to those measured in our non-COVID-19 stage I group, which we therefore used as the internal comparator rather than an external normal range [16,17]. Serum aldosterone, TGF-β1 and VEGF-A concentrations were measured by ELISA using commercial sandwich ELISA kits from Cusabio Biotech (Wuhan, China) for aldosterone and TGF-β1 and from R&D Systems (Minneapolis, MN, USA) for VEGF-A, according to the manufacturers’ instructions. Renal functional reserve (RFR) was measured as the percentage change in cystatin-C-based eGFR after an oral protein load compared to baseline.

2.4. Imaging and Hemodynamic Assessment

All participants had transthoracic echocardiography performed according to the current guidelines, including left ventricular end-diastolic and end-systolic diameters, ejection fraction, posterior wall thickness, interventricular septal thickness and left ventricular myocardial mass. Pulsed-wave Doppler of the mitral inflow was used to assess diastolic function. Intra-renal Doppler was performed with color and pulsed-wave Doppler of the main, segmental and interlobar arteries, measuring peak systolic velocity (Vps), end-diastolic velocity (Vd), resistive index (RI) and pulsatility index (PI).

2.5. Treatment Protocol and Follow-Up

All patients were treated with antihypertensive therapy in accordance with the 2023 ESH Guidelines for the management of arterial hypertension and the KDIGO 2021 Clinical Practice Guideline for the management of blood pressure in chronic kidney disease, tailored to the stage of hypertension and other comorbidities, including first-line antihypertensive therapy with angiotensin-converting enzyme inhibitors or angiotensin receptor blockers for nephroprotection and calcium channel blockers and/or thiazide-like diuretics, as needed. Treatment was initiated and titrated by the treating internist, with single-drug therapy considered in stage I and combination therapy (initially a renin–angiotensin system blocker plus a dihydropyridine calcium channel blocker or thiazide-like diuretic) used in stages II and III, with the aim of achieving an office blood pressure of <140/90 mmHg in all participants. Biomarkers and Doppler were repeated six months later.

2.6. Statistical Analysis

Continuous variables are presented as mean ± standard deviation (M ± SD). For the key biomarker comparisons, between-group mean differences and 95% confidence intervals (CIs) were computed. The unpaired Student’s t-test was used to compare between groups and the paired Student’s t-test was used to compare pre- and post-treatment values. Linear relationships between continuous variables were evaluated using Pearson’s correlation coefficient and the magnitude of correlations was interpreted as weak (|r| < 0.3), moderate (0.3 ≤ |r| < 0.6) or strong (|r| ≥ 0.6). A two-sided p-value of <0.05 was considered statistically significant. Formal correction for multiple testing was not performed, as the comparisons across hypertension stages were exploratory and the number of subjects in each cell was small (n = 20). Data were analysed using Microsoft Excel 2013 (Microsoft Corporation, Redmond, WA, USA) with the statistical add-in.

2.7. Ethics

The study protocol was reviewed and approved by the local ethics committee at the Bukhara State Medical Institute and was in line with the Declaration of Helsinki. Written informed consent was obtained from all participants.

3. Results

3.1. Baseline Characteristics

A total of 120 patients were enrolled and divided into six subgroups (n = 20 in each group). The baseline characteristics are shown in Table 1. The mean age, sex ratio and body mass index were similar between the post-COVID-19 and non-COVID-19 groups. As expected, based on disease severity, the mean office systolic and diastolic blood pressures were higher with increasing hypertension stage and were higher in the post-COVID subgroups but the differences between the groups within each stage were not statistically significant (p > 0.05). There were no significant differences in fasting blood glucose and total cholesterol levels.

3.2. Comparison of Renal Biomarkers Between Groups

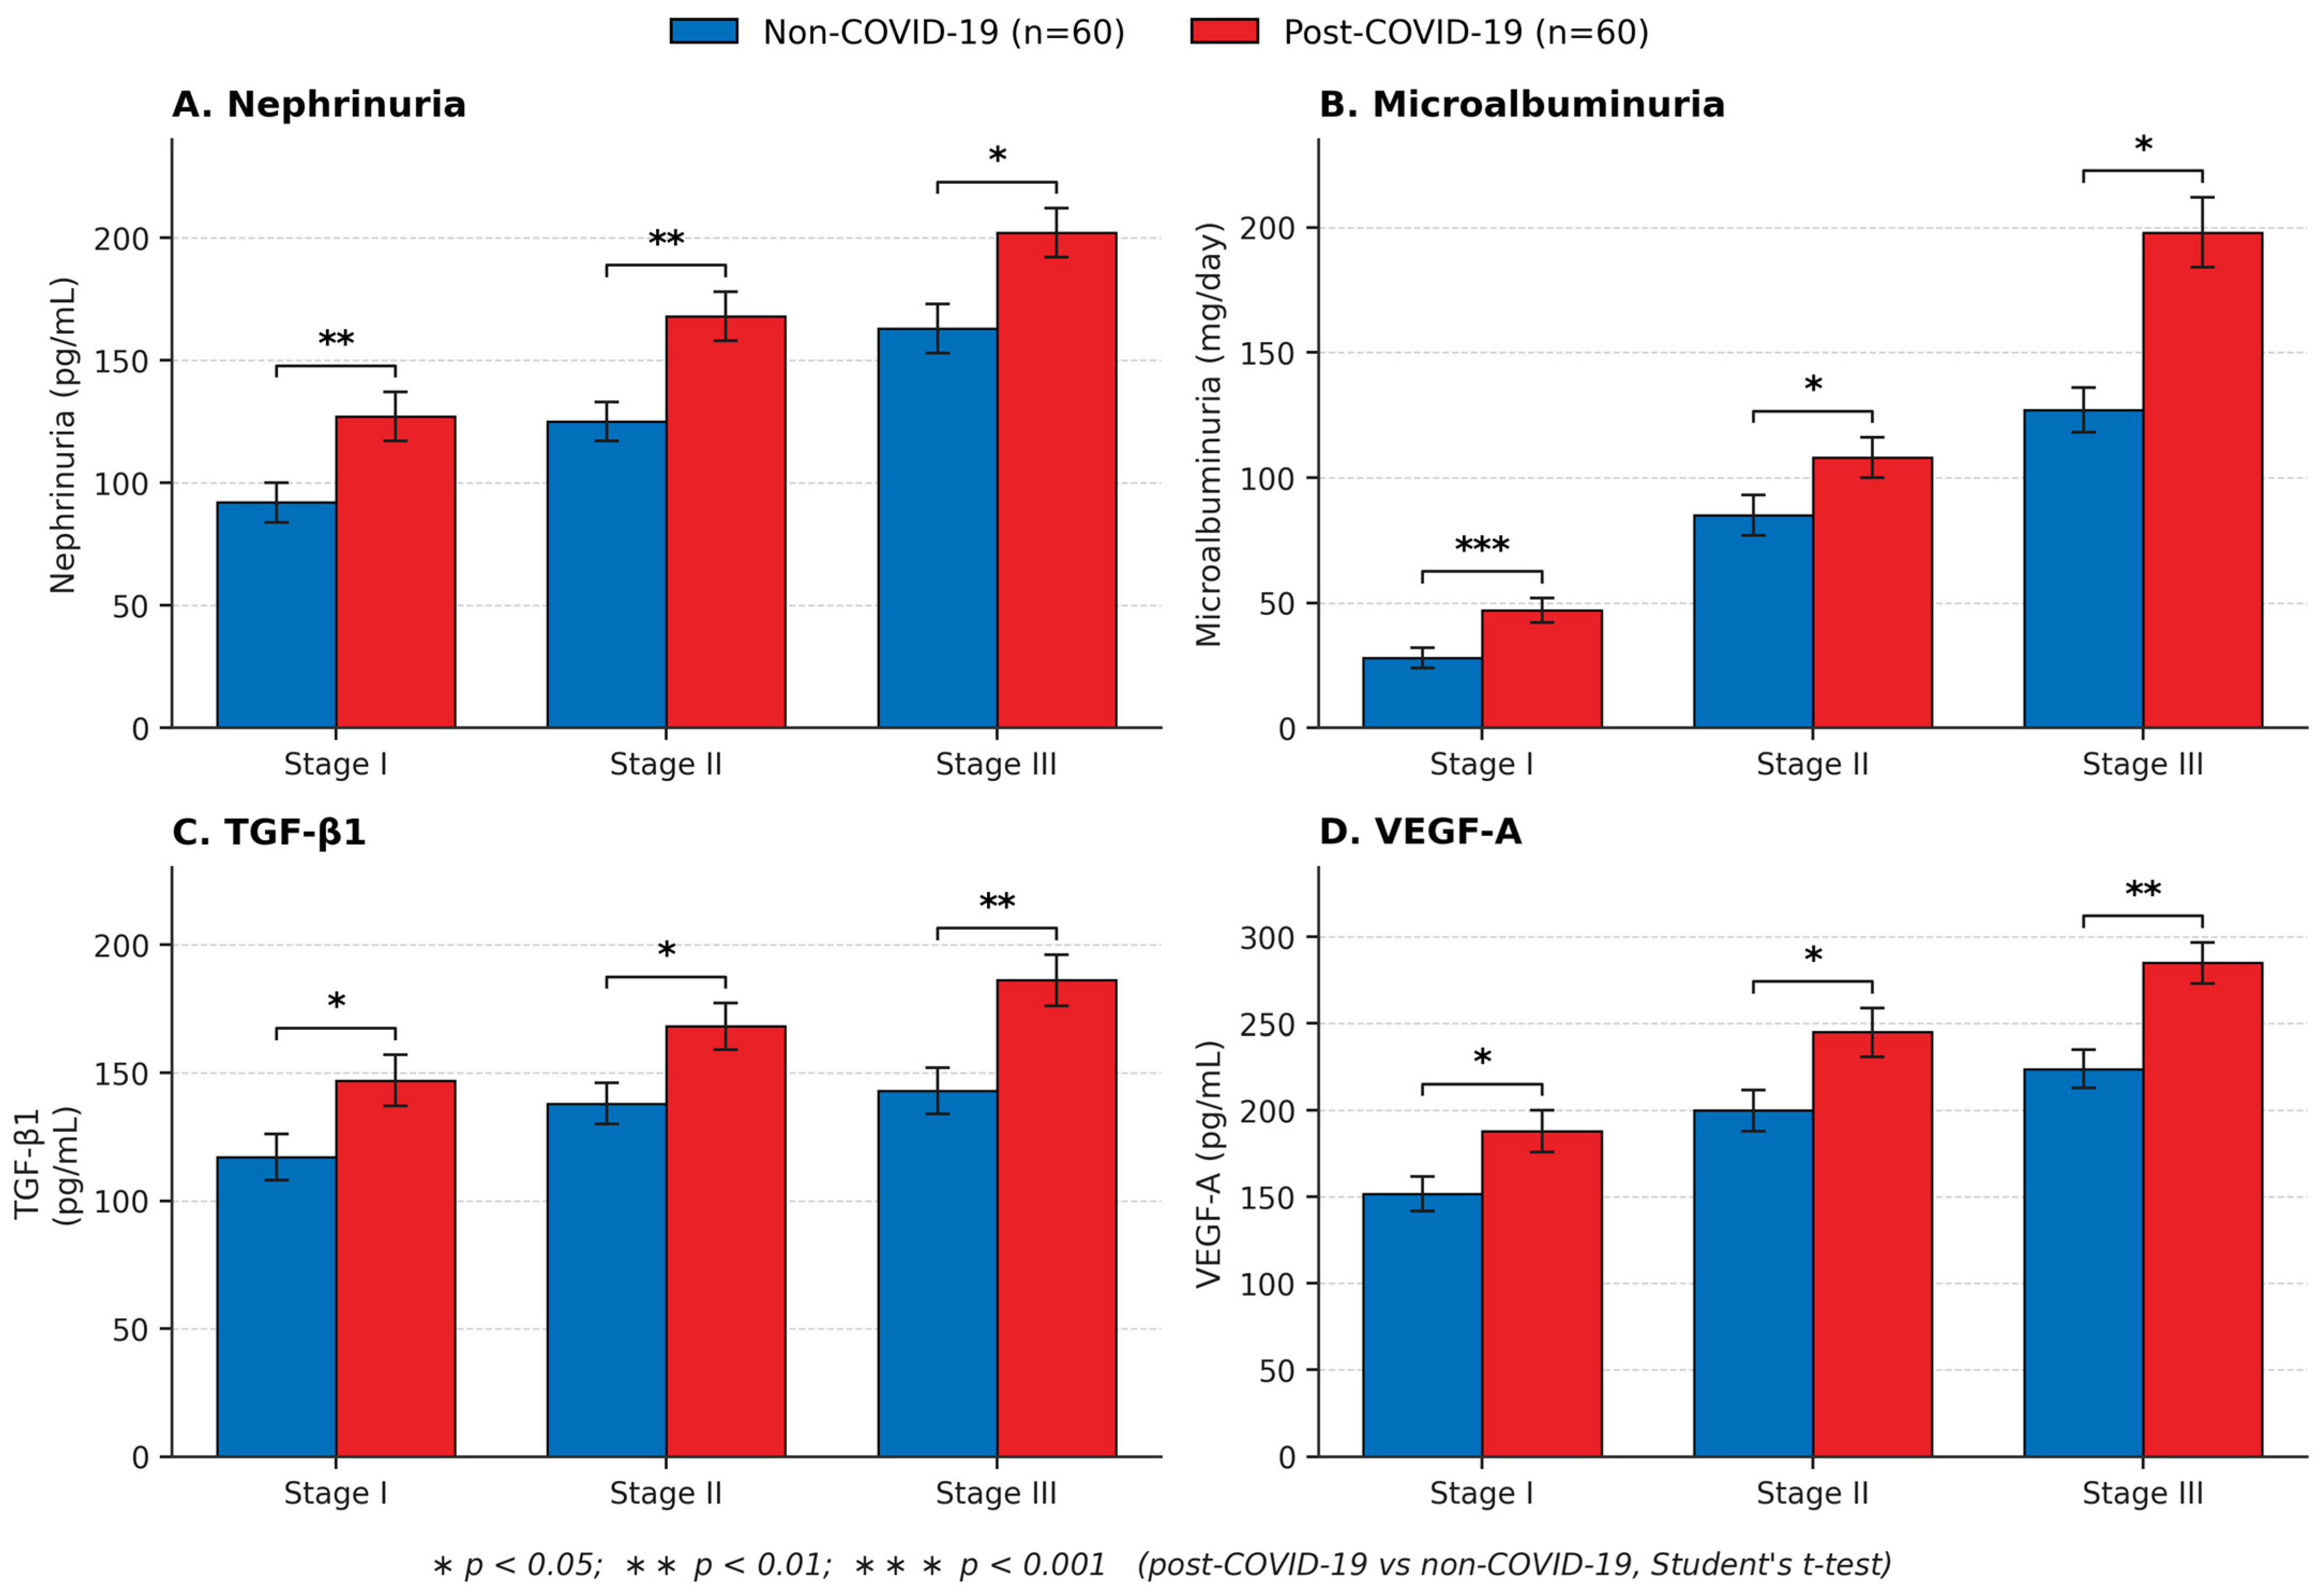
Renal markers increased progressively across the stages of hypertension and were consistently higher in the post-COVID-19 group (Table 2, Figure 2). Nephrinuria levels were already elevated at the earliest hypertension stage examined: nephrinuria was significantly higher in stage I post-COVID-19 patients (126.5 ± 9.1 vs. 91.9 ± 8.3 pg/mL; 95% CI for difference, 29.3 to 39.9 pg/mL, p < 0.01), at a time when serum creatinine, cystatin-C and eGFR were still within the reference range and did not differ between the groups. This pattern was consistently observed in stages II (168.2 ± 10.1 vs. 124.9 ± 9.3 pg/mL, p < 0.01) and III (203.3 ± 11.2 vs. 164.5 ± 9.7 pg/mL, p < 0.05).
Similar differences in nephrinuria were observed across all hypertension stages, with mean between-group differences of +34.6 pg/mL in stage I (95% CI 29.3–39.9), +43.3 pg/mL in stage II (95% CI 37.1–49.5), and +38.8 pg/mL in stage III (95% CI 32.1–45.5).
Microalbuminuria was also significantly elevated in post-COVID patients in all stages, with the greatest relative increase in stage I (46.8 ± 2.2 vs. 28.5 ± 1.4 mg/day, p < 0.001). However, in stage I, the mean microalbuminuria value in the non-COVID-19 group was still below the conventional microalbuminuria threshold of 30 mg/day, while nephrinuria showed a larger relative difference between groups at this stage and the traditional renal functional markers were still within the normal range. Serum cystatin-C and eGFR differed significantly between the two groups only from stage II onwards, whereas serum creatinine differed significantly in stages II and III. A similar trend was observed for profibrotic and endothelial markers: TGF-β1, aldosterone and VEGF-A were all elevated in post-COVID-19 patients in all stages, with the largest relative difference for VEGF-A in stage III (286.1 ± 16.4 vs. 223.2 ± 12.6 pg/mL, p < 0.01).

3.3. Correlation Analysis

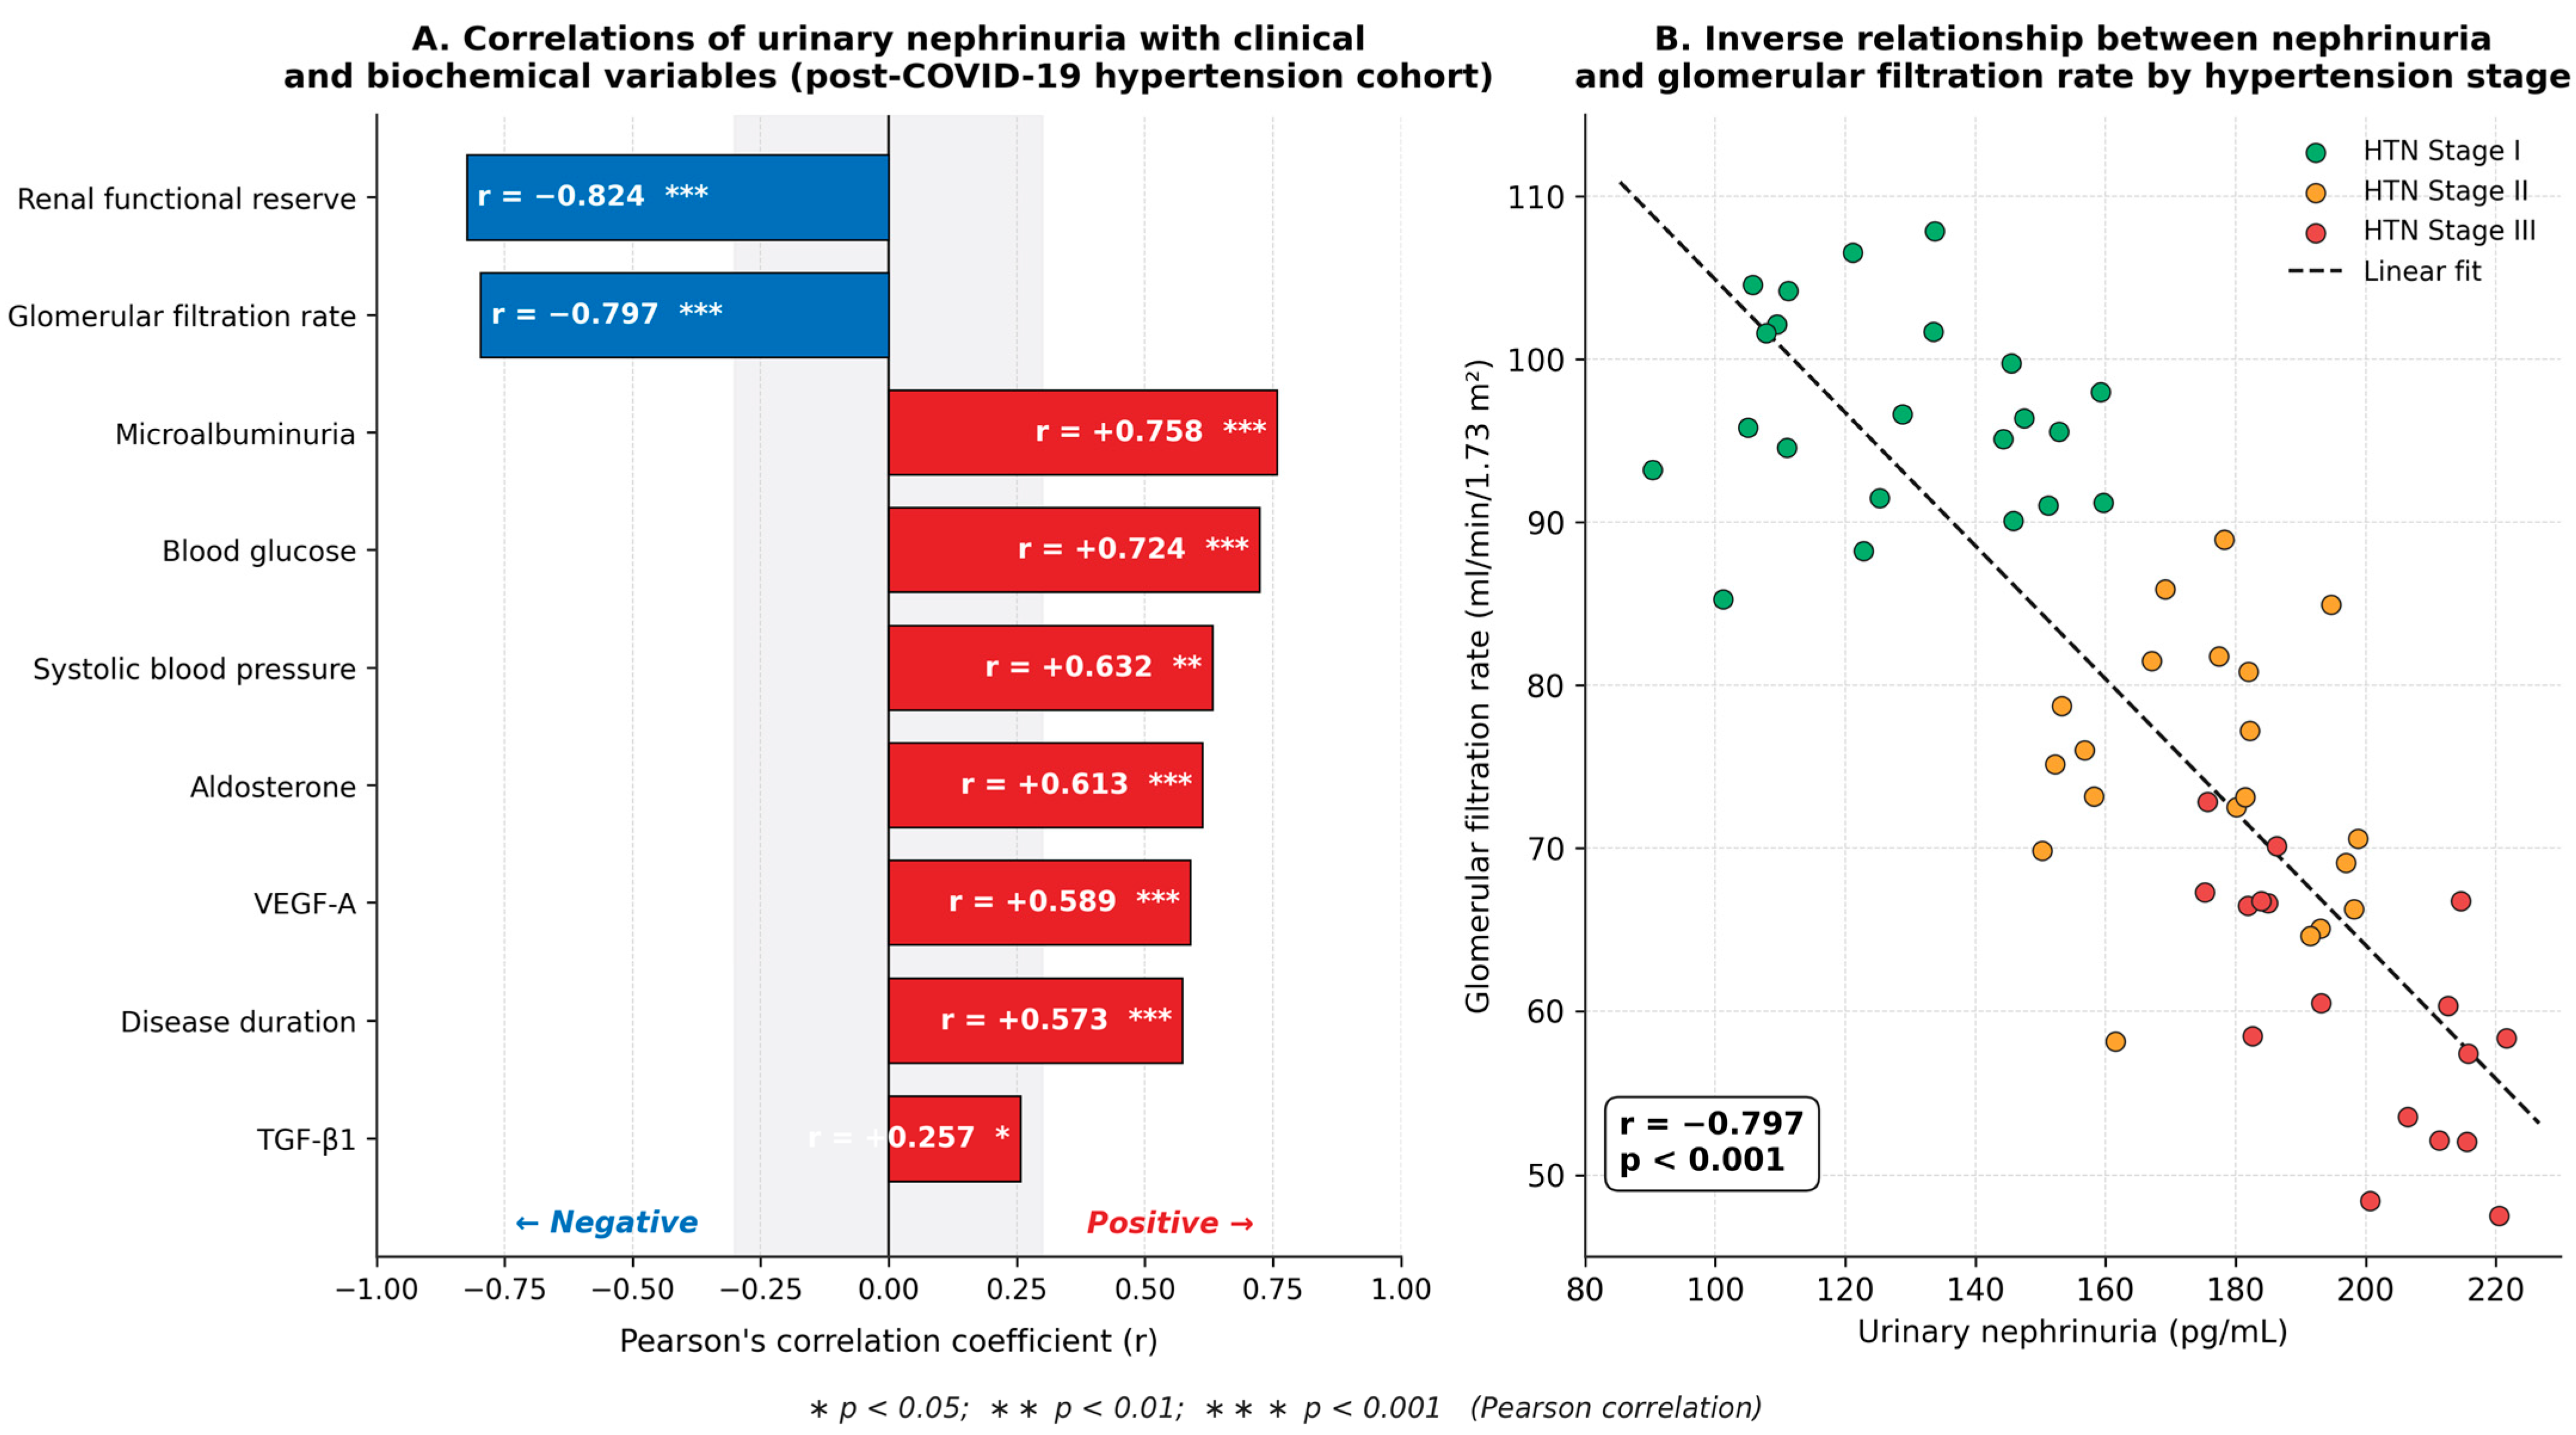
In the post-COVID-19 hypertension cohort, nephrinuria correlated strongly and inversely with renal functional reserve (r = −0.824, p < 0.001) and eGFR (r = −0.797, p < 0.001) and positively with microalbuminuria (r = 0.758, p < 0.001), fasting blood glucose (r = 0.724, p < 0.001), systolic blood pressure (r = 0.632, p < 0.01), aldosterone (r = 0.613, p < 0.001), VEGF-A (r = 0.589, p < 0.001) and disease duration (r = 0.573, p < 0.001). It also correlated positively with TGF-β1, albeit to a lesser extent (r = 0.257, p < 0.05). Similar correlation patterns were observed in the non-COVID-19 cohort, although the magnitude of the associations was numerically weaker (Table 3, Figure 3).

3.4. Response to Antihypertensive and Nephroprotective Therapy

Treatment with guideline-directed antihypertensive therapy (renin–angiotensin system inhibitors and other antihypertensive agents) for 6 months resulted in a significant decrease in systolic blood pressure in both groups (16.7% decrease in stage I post-COVID-19 patients from 154.2 ± 10.4 to 128.6 ± 5.6 mmHg, p < 0.05 and 21% in stage I non-COVID-19 patients from 149.6 ± 7.6 to 120.4 ± 5.4 mmHg, p < 0.01). Pre- and post-treatment values for systolic blood pressure, nephrinuria, microalbuminuria, TGF-β1 and aldosterone are presented in Table 4. Nephrinuria, microalbuminuria, TGF-β1 and aldosterone decreased after six months of therapy, with statistically significant reductions in stages I and II in both groups, whereas in stage III the post-treatment changes were smaller and several biomarkers did not reach statistical significance. Table 5 shows the intrarenal Doppler parameters at baseline and after 6 months of treatment; both groups had a reduction in mean RI and PI at all stages of hypertension, with the reduction being statistically significant at stages I and II and being numerically smaller in the post-COVID-19 group compared to the corresponding non-COVID-19 group at stage III.

4. Discussion

The early renal effects of SARS-CoV-2 infection in hypertensive patients remain insufficiently understood in the management of post-COVID and chronic diseases. There are three key findings of this study. First, nephrinuria was increased in post-COVID-19 hypertensive patients across all stages of the disease, including early-stage hypertension (normal serum creatinine, cystatin-C and eGFR). Second, nephrinuria was strongly correlated with renal functional reserve, eGFR, microalbuminuria, aldosterone and VEGF-A, suggesting that it is associated with a concerted profibrotic and endothelial injury profile, rather than being an independent marker. The observation that similar correlations were present in the non-COVID-19 cohort but with weaker magnitudes is consistent with a convergence of profibrotic, endothelial and podocyte-injury signals that appear more pronounced in patients with a history of SARS-CoV-2 infection. Third, nephrinuria responded to conventional renin–angiotensin system inhibition in early hypertension but less so in stage III, consistent with the limited reversibility of late-stage hypertensive nephropathy, in which structural changes are likely to prevail.

4.1. Early Detection: Nephrinuria as a Potential Early Marker

Microalbuminuria, serum creatinine and eGFR are well-known but late markers of renal damage. They either reflect the functional loss of nephrons or barrier dysfunction at a time when the actin cytoskeleton and foot processes have already become effaced. Nephrin is a membrane protein that is almost exclusively expressed in podocytes as the molecular backbone of the slit diaphragm. Nephrin is released from the cytoskeletal complex into the urine prior to the tight junction structure being grossly damaged when podocytes are exposed to mechanical stretch, oxidative stress or RAAS-mediated signaling [15,16,17]. The current findings, with an approximately 1.4-fold higher nephrinuria in the post-COVID-19 stage I group compared with the non-COVID-19 stage I group at a time when creatinine and eGFR did not differ between groups, are consistent with this sequence and support nephrinuria as a candidate early indicator of glomerular injury, rather than a marker that outperforms microalbuminuria in absolute terms. Similar findings of nephrinuria preceding microalbuminuria have been made in patients with early diabetic nephropathy, primary glomerular disease and hypertensive nephropathy, where podocyte-derived proteins were found in urine before any alteration in glomerular filtration rate [15,16,17]. Persistent low-grade proteinuria and podocyte injury and endothelial dysfunction months after the acute illness have been reported in more recent post-COVID renal cohorts, even in those with normal creatinine, supporting the present findings in this hypertensive Central Asian cohort [11,12,18].

4.2. Mechanistic Convergence: ACE2, RAAS and Podocyte Injury

The underlying basis for the observed differences is the interaction of viral and hemodynamic insults on a common pathway. ACE2 is the receptor for SARS-CoV-2 and is abundantly expressed in glomerular podocytes and proximal tubular cells [9,10]. ACE2 downregulation by viral binding results in a shift in the renin–angiotensin–aldosterone system (RAAS) towards angiotensin II, a potent vasoconstrictor, profibrotic and podocyte-apoptotic factor [13]. RAAS is already activated in hypertensive patients and viral-induced injury further enhances glomerular hyperfiltration, oxidative stress and aldosterone-induced profibrotic pathways. Our finding of a strong positive correlation between nephrinuria and aldosterone (r = +0.613, p < 0.001) and the consistently elevated TGF-β1 and VEGF-A levels in post-COVID patients support a two-hit pathogenic model and are consistent with the broader literature on long-COVID, which reports persistent inflammation, microvascular dysfunction and end-organ damage [1,3,5].

4.3. Hemodynamic Correlates and Endothelial Dysfunction

Intrarenal velocities and resistive indices derived from Doppler were selectively affected in post-COVID-19 patients in various stages, consistent with post-acute microvascular dysfunction, endothelial injury, thrombotic sequelae and persistent inflammatory activation reported in long COVID [19,20,21,22,23,24,25,26,27,28]. Patients in the post-COVID-19 group showed increased VEGF-A levels and reduced renal functional reserve, indicating that endothelial dysfunction is not limited to the acute phase and could contribute to the shift from a hemodynamically reversible state to structural renal damage. Intrarenal Doppler indices in the non-COVID-19 subgroups showed consistent improvement in our 6-month follow-up, while in the post-COVID-19 subgroups, the magnitude of improvement was numerically smaller and did not reach statistical significance in stage III (Table 5), which may reflect persistent microvascular involvement after SARS-CoV-2 infection. The high inverse correlation between nephrinuria and renal functional reserve (r = −0.824, p < 0.001) suggests podocyte dysfunction is related to the loss of physiological renal adaptability, which, once lost, may represent the early functional transition toward chronic kidney disease.

4.4. Clinical Implications

These findings may have several clinical implications. First, post-COVID-19 patients with hypertension may be a higher-risk group for early screening for renal disease even when the traditional markers are normal. A simple urinary biomarker panel, such as microalbuminuria and nephrinuria, can detect subclinical podocyte damage earlier than the current criteria. Second, the sensitivity of nephrinuria to renin–angiotensin system blockade in the early stages is consistent with the early start of nephroprotective treatment, as per the current guidelines for hypertension and long COVID management [1,5]. Third, the blunted response in stage III suggests risk stratification at the time of post-COVID follow-up, with enhanced nephroprotection in those in whom nephrinuria, aldosterone and TGF-β1 persist despite blood pressure control. These implications should be considered as hypothesis generating until confirmed in larger and longitudinal cohorts with a standardized nephrin reference threshold and outcome-based cut-offs.

5. Conclusions

Urinary nephrinuria was substantially higher in hypertensive patients with a history of COVID-19 than in their non-COVID-19 counterparts at the same hypertension stage, including at stage I where conventional renal functional markers remained within the normal range. Nephrinuria was correlated with renal functional reserve, glomerular filtration rate, aldosterone and VEGF-A, indicating that podocyte injury is an early event in the post-COVID renal involvement in hypertensive patients and not a definitive prognostic marker. Nephrinuria was reduced by conventional antihypertensive and nephroprotective treatment in early stages of hypertension but responded less in stage III, where structural damage is likely to be more established. The inclusion of nephrinuria in the post-COVID renal monitoring of hypertensive patients could be useful to identify patients who might benefit from earlier nephroprotective intervention but the clinical implementation and prognostic value of nephrinuria for incident CKD needs to be validated in longitudinal, outcome-based studies with a defined reference range.

6. Limitations

This study has several limitations. It is a single-site study in a regional Central Asian population, and the sample size within each subgroup (n = 20), although adequate for stratified comparisons, is too small for more granular subgroup analyses by sex, COVID-19 severity, vaccination history or specific antihypertensive medications. Diabetes was excluded by documented prior diagnosis, glucose-lowering medication use and fasting plasma glucose, but glycated hemoglobin (HbA1c) was not measured at enrollment, so some patients with previously unrecognized dysglycaemia may have been included, especially since fasting glucose values in some stage III patients approached the diagnostic threshold for diabetes. Nephrinuria was reported as absolute concentration in first-morning urine, which minimizes variability due to hydration status, but future studies should report a nephrin-to-urinary-creatinine ratio to enable direct comparison between studies. The immediate clinical applicability of the reported nephrin values remains limited because there is no widely accepted clinical reference value for urinary nephrin. The severity and clinical phenotype of the index SARS-CoV-2 infection (outpatient versus hospitalized, requirement for oxygen, treatments received) were not stratified and the prior duration, dose, adherence and class of antihypertensive medication at study entry were not formally quantified, so the six-month response cannot be attributed to a specific drug or to RAAS blockade exclusively. Formal testing of SARS-CoV-2 variants and vaccination status was also not performed. A moderate number of between-group and pre-post comparisons were conducted on a moderate sample size without formal adjustment for multiplicity, so some statistically significant results may be due to type I error and should be interpreted with caution. Lastly, the study did not evaluate long-term outcomes such as incident CKD, sustained eGFR decline, cardiovascular events or death; thus, the prognostic value of nephrinuria in post-COVID hypertension needs to be confirmed in longitudinal outcome-based studies. Multicenter, multi-ethnic studies with standardized measurements of nephrin and longer follow-up are needed to validate the predictive value of nephrinuria in post-COVID hypertension and to define reference values for clinical practice.

Author Contributions

Conceptualization, G.K., N.A. and U.O.; methodology, G.K., U.O. and O.F.; formal analysis, R.B., S.N. and A.D.; investigation, N.A., S.M., N.D., Z.A. and M.N. (Mokhibegim Nematova); data curation, S.R., N.S., N.N., M.N. (Mehinbonu Nurmukhammedova) and D.R.; resources, A.I., D.O.,M.O. and D.K.; visualization, O.F. and A.D.; writing—original draft preparation, U.O.; writing—review and editing, G.K., N.A. and U.O.; supervision, G.K. and U.O.; project administration, G.K.; funding acquisition, none. All authors have read and agreed to the published version of the manuscript.

Funding

This research received no external funding.

Institutional Review Board Statement

The study was conducted in accordance with the Declaration of Helsinki and approved by the Ethics Committee of Bukhara State Medical Institute (Protocol No. 312, approved on 13 May 2022).

Informed Consent Statement

Written informed consent was obtained from all participants prior to their enrollment in the study.

Data Availability Statement

The data presented in this study are available from the corresponding author, upon reasonable request. The data are not publicly available due to privacy and institutional restrictions.

Conflicts of Interest

The authors declare no conflicts of interest.

References

  1. Davis, H.E.; McCorkell, L.; Vogel, J.M.; Topol, E.J. Long COVID: Major findings, mechanisms and recommendations. Nat. Rev. Microbiol. 2023, 21, 133–146. [Google Scholar] [CrossRef]
  2. Crook, H.; Raza, S.; Nowell, J.; Young, M.; Edison, P. Long COVID: Mechanisms, risk factors and management. BMJ 2021, 374, n1648. [Google Scholar] [CrossRef]
  3. Su, S.; Zhao, Y.; Zeng, N.; Liu, X.; Zheng, Y.; Sun, J.; Zhong, Y.; Wu, S.; Ni, S.; Gong, Y.; et al. Epidemiology, clinical presentation, pathophysiology and management of long COVID: An update. Mol. Psychiatry 2023, 28, 4056–4069. [Google Scholar] [CrossRef]
  4. Mehandru, S.; Merad, M. Pathological sequelae of long-haul COVID. Nat. Immunol. 2022, 23, 194–202. [Google Scholar] [CrossRef]
  5. Raman, B.; Bluemke, D.A.; Lüscher, T.F.; Neubauer, S. Long COVID: Post-acute sequelae of COVID-19 with a cardiovascular focus. Eur. Heart J. 2022, 43, 1157–1172. [Google Scholar] [CrossRef]
  6. Tsampasian, V.; Bäck, M.; Bernardi, M.; Cavarretta, E.; Dębski, M.; Gati, S.; Hansen, D.; Kränkel, N.; Koskinas, K.C.; Niebauer, J.; et al. Cardiovascular disease as part of long COVID: A systematic review. Eur. J. Prev. Cardiol. 2024, 31, e76–e87. [Google Scholar] [CrossRef]
  7. Gusev, E.; Sarapultsev, A. Exploring the pathophysiology of long COVID: The central role of low-grade inflammation and multisystem involvement. Int. J. Mol. Sci. 2024, 25, 6389. [Google Scholar] [CrossRef] [PubMed]
  8. Castanares-Zapatero, D.; Chalon, P.; Kohn, L.; Dauvrin, M.; Detollenaere, J.; Maertens de Noordhout, C.; Primus-de Jong, C.; Cleemput, I.; Van den Heede, K. Pathophysiology and mechanism of long COVID: A comprehensive review. Ann. Med. 2022, 54, 1473–1487. [Google Scholar] [CrossRef] [PubMed]
  9. Bohmwald, K.; Diethelm-Varela, B.; Rodríguez-Guilarte, L.; Rivera, T.; Riedel, C.A.; González, P.A.; Kalergis, A.M. Pathophysiological, immunological and inflammatory features of long COVID. Front. Immunol. 2024, 15, 1341600. [Google Scholar] [CrossRef] [PubMed]
  10. Peluso, M.J.; Deeks, S.G. Mechanisms of long COVID and the path toward therapeutics. Cell 2024, 187, 5500–5529. [Google Scholar] [CrossRef]
  11. Altmann, D.M.; Whettlock, E.M.; Liu, S.; Arachchillage, D.J.; Boyton, R.J. The immunology of long COVID. Nat. Rev. Immunol. 2023, 23, 618–634. [Google Scholar] [CrossRef]
  12. Sherif, Z.A.; Gomez, C.R.; Connors, T.J.; Henrich, T.J.; Reeves, W.B. Pathogenic mechanisms of post-acute sequelae of SARS-CoV-2 infection (PASC). eLife 2023, 12, e86002. [Google Scholar] [CrossRef]
  13. Jiao, T.; Huang, Y.; Sun, H.; Yang, L. Research progress of post-acute sequelae after SARS-CoV-2 infection. Cell Death Dis. 2024, 15, 257. [Google Scholar] [CrossRef]
  14. Bakerly, N.D.; Smith, N.; Darbyshire, J.L.; Kwon, J.; Bullock, E.; Baley, S.; Sivan, M.; Delaney, B. Pathophysiological mechanisms in long COVID: A mixed method systematic review. Int. J. Environ. Res. Public Health 2024, 21, 473. [Google Scholar] [CrossRef] [PubMed]
  15. Aiyegbusi, O.L.; Hughes, S.E.; Turner, G.; Rivera, S.C.; McMullan, C.; Chandan, J.S.; Haroon, S.; Price, G.; Davies, E.H.; Nirantharakumar, K.; et al. Symptoms, complications and management of long COVID: A review. J. R. Soc. Med. 2021, 114, 428–442. [Google Scholar] [CrossRef]
  16. Kenny, G.; Townsend, L.; Savinelli, S.; Mallon, P.W.G. Long COVID: Clinical characteristics, proposed pathogenesis and potential therapeutic targets. Front. Mol. Biosci. 2023, 10, 1157651. [Google Scholar] [CrossRef]
  17. Yelin, D.; Moschopoulos, C.D.; Margalit, I.; Gkrania-Klotsas, E.; Landi, F.; Stahl, J.P.; Yahav, D. ESCMID rapid guidelines for assessment and management of long COVID. Clin. Microbiol. Infect. 2022, 28, 955–972. [Google Scholar] [CrossRef]
  18. Wang, C.; Yu, C.; Jing, H.; Wu, X.; Novakovic, V.A.; Xie, R.; Shi, J. Long COVID: The nature of thrombotic sequelae determines the necessity of early anticoagulation. Front. Cell. Infect. Microbiol. 2022, 12, 861703. [Google Scholar] [CrossRef] [PubMed]
  19. Antar, A.A.R.; Cox, A.L. Translating insights into therapies for long COVID. Sci. Transl. Med. 2024, 16, eado2106. [Google Scholar] [CrossRef] [PubMed]
  20. Cheng, A.L.; Herman, E.; Abramoff, B.A.; Anderson, J.R.; Becker, J.H.; Bhavaraju-Sanka, R.; Bunnell, A.; Cassidy, C.D.; Clinton, S.; Fine, J.S.; et al. Multidisciplinary collaborative guidance on the assessment and treatment of patients with long COVID: A compendium statement. PM&R 2025, 17, 684–708. [Google Scholar] [CrossRef]
  21. Akbarialiabad, H.; Taghrir, M.H.; Abdollahi, A.; Ghahramani, N.; Kumar, M.; Paydar, S.; Razani, B.; Mwangi, J.; Asadi-Pooya, A.A.; Malekmakan, L.; et al. Long COVID, a comprehensive systematic scoping review. Infection 2021, 49, 1163–1186. [Google Scholar] [CrossRef]
  22. Najafi, M.B.; Javanmard, S.H. Post-COVID-19 syndrome mechanisms, prevention and management. Int. J. Prev. Med. 2023, 14, 59. [Google Scholar] [CrossRef]
  23. Yong, S.J. Long COVID or post-COVID-19 syndrome: Putative pathophysiology, risk factors and treatments. Infect. Dis. 2021, 53, 737–754. [Google Scholar] [CrossRef]
  24. Astin, R.; Banerjee, A.; Baker, M.R.; Dani, M.; Ford, E.; Hull, J.H.; Lim, P.B.; McNarry, M.; Morten, K.; O’Sullivan, O.; et al. Long COVID: Mechanisms, risk factors and recovery. Exp. Physiol. 2023, 108, 12–27. [Google Scholar] [CrossRef] [PubMed]
  25. Gheorghita, R.; Soldanescu, I.; Lobiuc, A.; Caliman Sturdza, O.A.; Filip, R.; Constantinescu-Bercu, A.; Dimian, M.; Mangul, S.; Covasa, M. The knowns and unknowns of long COVID-19: From mechanisms to therapeutical approaches. Front. Immunol. 2024, 15, 1344086. [Google Scholar] [CrossRef]
  26. Ochilov, U.; Kholov, G.; Fayzulloyev, O.; Bobokalonov, O.; Naimova, S.; Akhmedova, N.; Ochilova, M.; Kutliyeva, M.; Kakharova, S. Silent invasion: COVID-19’s hidden damage to human organs. COVID 2025, 5, 156. [Google Scholar] [CrossRef]
  27. Koc, H.C.; Xiao, J.; Liu, W.; Li, Y.; Chen, G. Long COVID and its management. Int. J. Biol. Sci. 2022, 18, 4768–4780. [Google Scholar] [CrossRef] [PubMed]
  28. Brode, W.M.; Melamed, E. A practical framework for long COVID treatment in primary care. Life Sci. 2024, 354, 122977. [Google Scholar] [CrossRef]
Figure 1. Hypothetical model of kidney damage in COVID-19 patients with hypertension. SARS-CoV-2 viral binding and downregulation of ACE2 receptors on podocytes and tubular cells and pre-existing hypertension leading to RAAS overactivity. The interaction between SARS-CoV-2–mediated ACE2 downregulation and pre-existing hypertension results in increased oxidative stress, hyperfiltration and profibrotic pathways, ultimately leading to podocyte foot-process effacement and release of nephrin into the urine (nephrinuria). Nephrinuria may appear earlier than detectable changes in conventional renal functional markers and alongside early microalbuminuria, preceding detectable changes in eGFR or cystatin-C and eventually CKD.
Covid 06 00087 g001
Figure 2. Urinary and serum biomarkers in post-COVID-19 and non-COVID-19 patients at hypertension stages I–III. Bars represent mean ± SD; p values are for comparisons between groups at each stage. (A) Nephrinuria, (B) microalbuminuria, (C) TGF-β1 and (D) VEGF-A. At hypertension stage I, nephrinuria differed significantly between groups while serum creatinine, cystatin-C and eGFR remained within the normal range and did not differ between groups. * p < 0.05; ** p < 0.01; *** p < 0.001 (unpaired t-test).
Covid 06 00087 g002
Figure 3. Correlation analysis of urinary nephrinuria in the post-COVID-19 hypertension cohort. (A) Forest plot of Pearson correlation coefficients between nephrinuria and various clinical and biochemical parameters; bars are color-coded by the direction of the correlation. (B) Negative correlation between nephrinuria and glomerular filtration rate, with color-coded hypertension stages, showing the decline in filtration function with increasing nephrinuria. * p < 0.05; ** p < 0.01; *** p < 0.001.
Covid 06 00087 g003
Table 1. Demographic, clinical and biochemical characteristics of the study participants (n = 120). Data are presented as mean ± SD or n (%). The unpaired Student’s t-test was used to compare the post-COVID-19 and non-COVID-19 groups within each stage of hypertension.
CharacteristicHTN Stage IHTN Stage IIHTN Stage III
Post-COVIDNon-COVIDPost-COVIDNon-COVIDPost-COVIDNon-COVID
Age, years47.8 ± 8.446.5 ± 7.951.6 ± 7.250.8 ± 7.455.2 ± 6.154.4 ± 6.5
Male, n (%)12 (60)11 (55)13 (65)12 (60)14 (70)13 (65)
BMI, kg/m226.4 ± 2.626.1 ± 2.427.8 ± 2.927.2 ± 2.728.6 ± 3.128.1 ± 2.8
HTN duration, years3.6 ± 1.23.4 ± 1.17.4 ± 2.17.0 ± 2.011.8 ± 3.411.2 ± 3.1
Time since COVID-19, months6.2 ± 2.16.8 ± 2.47.1 ± 2.6
Systolic BP, mmHg154.2 ± 10.4149.6 ± 7.6168.6 ± 12.5165.3 ± 10.4166.8 ± 15.4164.2 ± 10.4
Diastolic BP, mmHg92.3 ± 6.490.8 ± 4.297.2 ± 4.695.3 ± 5.696.4 ± 5.2100.2 ± 6.4
Fasting glucose, mmol/L4.97 ± 0.304.05 ± 0.604.80 ± 0.704.05 ± 0.806.20 ± 0.905.90 ± 0.80
Total cholesterol, mmol/L4.7 ± 0.44.6 ± 0.35.0 ± 0.34.8 ± 0.55.4 ± 0.55.6 ± 0.6
HTN: hypertension; BMI: body mass index; BP: blood pressure.
Table 2. Renal and vasoactive biomarkers in post-COVID-19 and non-COVID-19 groups according to hypertension stage. Data are mean ± SD; p-values are for comparisons between groups within each stage (unpaired t-test).
Biomarker HTN Stage IHTN Stage IIHTN Stage III
Post-COVIDNon-COVIDMean Diff. (95% CI)pPost-COVIDNon-COVIDMean Diff. (95% CI)pPost-COVIDNon-COVIDMean Diff. (95% CI)p
Nephrinuria, pg/mL126.5 ± 9.191.9 ± 8.3+34.6 (29.3–39.9)<0.01168.2 ± 10.1124.9 ± 9.3+43.3 (37.1–49.5)<0.01203.3 ± 11.2164.5 ± 9.7+38.8 (32.1–45.5)<0.05
Microalbuminuria, mg/day46.8 ± 2.228.5 ± 1.4+18.3 (17.1–19.5)<0.001108.4 ± 6.884.8 ± 6.1+23.6 (19.5–27.7)<0.05197.7 ± 14.2127.4 ± 10.1+70.3 (62.4–78.2)<0.05
Creatinine, μmol/L82.8 ± 6.274.5 ± 5.4+8.3 (−1.4 to 18.0)NS100.2 ± 5.784.8 ± 4.2+15.4 (12.2–18.6)<0.05113.6 ± 7.797.3 ± 5.2+16.3 (12.1–20.5)<0.05
Cystatin-C, mg/L0.90 ± 0.040.80 ± 0.03+0.10 (−0.01 to 0.21)NS1.10 ± 0.021.00 ± 0.04+0.10 (0.08–0.12)<0.051.30 ± 0.061.10 ± 0.04+0.20 (0.17–0.23)<0.01
eGFR, mL/min/1.73 m295 ± 5.6104 ± 6.2−9.0 (−19.2 to 1.2)NS74 ± 4.689 ± 5.6−15.0 (−18.3 to −11.7)<0.0558.5 ± 4.172 ± 4.3−13.5 (−16.2 to −10.8)<0.05
TGF-β1, pg/mL147.3 ± 10.4117.1 ± 9.3 <0.05168.5 ± 9.2138.1 ± 10.4 <0.05186.4 ± 10.1143.4 ± 10.0 <0.01
VEGF-A, pg/mL188.0 ± 12.0152.5 ± 11.0 <0.05244.8 ± 15.5200.1 ± 13.2 <0.05286.1 ± 16.4223.2 ± 12.6 <0.01
RFR, %20.1 ± 2.622.5 ± 3.1 NS12.6 ± 1.816.4 ± 2.1 <0.057.8 ± 1.112.5 ± 1.6 <0.001
eGFR, estimated glomerular filtration rate (using serum cystatin-C); RFR, renal functional reserve; TGF-β1, transforming growth factor β1; VEGF-A, vascular endothelial growth factor A; NS, not significant.
Table 3. Pearson correlation coefficients between urinary nephrinuria and major clinical and biochemical parameters in the post-COVID-19 hypertension group (n = 60). The magnitude was interpreted as weak (|r| < 0.3), moderate (0.3 ≤ |r| < 0.6) or strong (|r| ≥ 0.6).
Variable Correlated with NephrinuriaRp-ValueDirection/Strength
Renal functional reserve (RFR)−0.824<0.001Strong negative
Glomerular filtration rate (eGFR)−0.797<0.001Strong negative
Microalbuminuria+0.758<0.001Strong positive
Fasting blood glucose+0.724<0.001Strong positive
Systolic blood pressure+0.632<0.01Strong positive
Aldosterone+0.613<0.001Strong positive
VEGF-A+0.589<0.001Moderate positive
Disease duration+0.573<0.001Moderate positive
TGF-β1+0.257<0.05Weak positive
eGFR, estimated glomerular filtration rate; RFR, renal functional reserve; TGF-β1, transforming growth factor β1; VEGF-A, vascular endothelial growth factor A.
Table 4. Baseline (pre) and six-month (post) values for systolic blood pressure, nephrinuria, microalbuminuria, TGF-β1 and aldosterone in post-COVID-19 and non-COVID-19 patients by hypertension stage. Data are mean ± SD; p-values are for paired pre- vs. post-treatment comparisons within each subgroup (paired t-test).
ParameterStageGroupPre-TreatmentPost-Treatmentp
Systolic BP, mmHgIPost-COVID154.2 ± 10.4128.6 ± 5.6<0.01
Non-COVID149.6 ± 7.6120.4 ± 5.4<0.001
IIPost-COVID168.6 ± 12.5138.4 ± 7.1<0.01
Non-COVID165.3 ± 10.4132.7 ± 6.4<0.01
IIIPost-COVID166.8 ± 15.4146.2 ± 8.6<0.05
Non-COVID164.2 ± 10.4141.8 ± 7.8<0.05
Nephrinuria, pg/mLIPost-COVID126.5 ± 9.198.4 ± 8.2<0.01
Non-COVID91.9 ± 8.382.6 ± 7.5<0.05
IIPost-COVID168.2 ± 10.1132.5 ± 9.6<0.01
Non-COVID124.9 ± 9.3104.7 ± 8.4<0.05
IIIPost-COVID203.3 ± 11.2186.4 ± 10.7NS
Non-COVID164.5 ± 9.7149.8 ± 9.1<0.05
Microalbuminuria, mg/dayIPost-COVID46.8 ± 2.232.1 ± 1.9<0.001
Non-COVID28.5 ± 1.422.3 ± 1.3<0.01
IIPost-COVID108.4 ± 6.878.6 ± 5.9<0.01
Non-COVID84.8 ± 6.162.4 ± 5.3<0.01
IIIPost-COVID197.7 ± 14.2182.3 ± 13.4NS
Non-COVID127.4 ± 10.1108.6 ± 9.4<0.05
TGF-β1, pg/mLIPost-COVID147.3 ± 10.4120.6 ± 9.5<0.05
Non-COVID117.1 ± 9.3102.4 ± 8.6<0.05
IIPost-COVID168.5 ± 9.2140.7 ± 8.4<0.01
Non-COVID138.1 ± 10.4118.6 ± 9.1<0.05
IIIPost-COVID186.4 ± 10.1174.9 ± 9.8NS
Non-COVID143.4 ± 10.0129.8 ± 9.2<0.05
Aldosterone, pg/mLIPost-COVID164.2 ± 12.5131.4 ± 10.6<0.01
Non-COVID138.6 ± 11.8115.3 ± 10.1<0.05
IIPost-COVID193.8 ± 13.6152.7 ± 11.4<0.01
Non-COVID161.2 ± 12.4129.4 ± 10.7<0.05
IIIPost-COVID224.6 ± 15.1204.8 ± 13.9NS
Non-COVID182.4 ± 13.2159.6 ± 11.8<0.05
TGF-β1, transforming growth factor β1; BP, blood pressure; NS, not significant (p ≥ 0.05). For each parameter, pre- and post-treatment values are paired within the same patients (n = 20 per subgroup).
Table 5. Intrarenal Doppler resistive index (RI) and pulsatility index (PI) at the segmental renal artery level at baseline and after six months of treatment in post-COVID-19 and non-COVID-19 patients by hypertension stage. Data are mean ± SD; p-values are for paired pre- vs. post-treatment comparisons within each subgroup (paired t-test).
StageGroupRIPI
PrePostpPrePostp
IPost-COVID0.66 ± 0.030.60 ± 0.03<0.051.32 ± 0.081.20 ± 0.07<0.05
Non-COVID0.64 ± 0.030.58 ± 0.02<0.051.27 ± 0.071.14 ± 0.06<0.01
IIPost-COVID0.72 ± 0.030.66 ± 0.03<0.051.45 ± 0.091.32 ± 0.08<0.05
Non-COVID0.70 ± 0.030.62 ± 0.03<0.011.40 ± 0.081.24 ± 0.07<0.01
IIIPost-COVID0.78 ± 0.040.75 ± 0.03NS1.62 ± 0.101.55 ± 0.09NS
Non-COVID0.75 ± 0.030.69 ± 0.03<0.051.55 ± 0.091.42 ± 0.08<0.05
RI, resistive index (dimensionless); PI, pulsatility index (dimensionless); NS, not significant. n = 20 per subgroup.
Disclaimer/Publisher’s Note: The statements, opinions and data contained in all publications are solely those of the individual author(s) and contributor(s) and not of MDPI and/or the editor(s). MDPI and/or the editor(s) disclaim responsibility for any injury to people or property resulting from any ideas, methods, instructions or products referred to in the content.