


Abstract
This study investigates the acoustic response of ZnO-based SAW devices fabricated on ZnO/Si and ZnO/SiO2/Si substrates through a combined finite element analysis and experimental approach. Two-dimensional FEA was used to analyze scattering parameters, three-dimensional FEA was used to determine eigenfrequencies and mode shapes, and ZnO thin films were deposited by RF magnetron sputtering with interdigital transducers defined by UV lithography. The ZnO/SiO2/Si device exhibited Rayleigh and Sezawa-type mode resonances at 145 MHz (4350 m/s) and 234 MHz (7020 m/s), respectively, in close agreement with simulation, while the ZnO/Si device resonated at 166 MHz with a phase velocity of 4980 m/s. Incorporation of the Au sensing layer improved signal transmission by approximately 2 dB, consistent with modeling predictions. For biosensing evaluation, the device was functionalized with a thiolated ssDNA probe targeting the EGFR L858R point mutation, a clinically relevant lung cancer biomarker. Probe immobilization and target hybridization were confirmed by contact angle measurements and resonance frequency shifts, with the sensor demonstrating a linear detection range of 0.1 to 0.6 µM and LOD of 0.09 µM. These findings establish an integrated framework of acoustic modeling, microfabrication, and biofunctionalization for ZnO-based SAW biosensors toward label-free nucleic acid detection.
1. Introduction
Surface acoustic wave (SAW) sensors based on piezoelectric materials have gained considerable attention over recent decades owing to their high sensitivity, miniaturized form factor, and broad operational frequency range spanning from the megahertz (MHz) to gigahertz (GHz) regime [1,2,3]. These devices operate by converting electrical signals into acoustic waves through interdigital transducers (IDTs) via the piezoelectric effect [4,5], enabling real-time monitoring of surface mass variations with exceptional resolution. As a result, SAW sensors have been widely adopted across a diverse range of applications, including ultraviolet (UV) detection [6], gas sensors [1,7], self-powered systems [8], and biological detection [3,9,10,11].
Among the key components governing SAW device performance, the sensing layer plays a particularly critical role [12,13,14]. In chemical and biological detection, this layer serves as the primary interface through which acoustic energy interacts with gas molecules [15] or biomolecules [16]. Molecular adsorption or binding events at this interface induce changes in effective surface mass density, producing measurable shifts in resonance frequency, amplitude, and phase response that are well described by perturbation-based models such as the Sauerbrey equation [17]. For biosensing applications specifically, the sensing layer must simultaneously deliver biochemical functionality and structural stability under potentially harsh chemical environments, making high biocompatibility, chemical resistance, and long-term durability essential material requirements [16].
Gold (Au) meets these requirements particularly well, combining chemical inertness and resistance to oxidation with excellent biocompatibility, which preserves the activity of immobilized bioreceptors. Its capacity for spontaneous thiol–gold chemisorption further allows thiolated ssDNA probes to form well-ordered self-assembled monolayers with high packing density and controlled orientation, avoiding the multi-step chemistry required on oxide surfaces. Au is furthermore compatible with established microfabrication protocols, as films may be deposited by sputtering or thermal evaporation and patterned by conventional UV lithography.
Conventional SAW devices are typically fabricated on single-crystal substrates such as quartz, lithium niobate (LiNbO3), or lithium tantalate (LiTaO3), materials valued for their strong electromechanical coupling and low insertion loss [9]. However, these substrates are relatively expensive and mechanically brittle, posing practical challenges during fabrication. Zinc oxide (ZnO) has emerged as a compelling alternative, offering several notable advantages for sensor development despite its lower electromechanical coupling coefficient compared to the aforementioned single-crystal materials. ZnO films deposited on Si or SiO2/Si substrates provide a cost-effective solution while preserving good piezoelectric properties and electromechanical coupling performance [18,19]. Furthermore, ZnO exhibits strong compatibility with standard microfabrication processes, low internal stress, and excellent adhesion to a wide range of substrates, allowing the deposition of uniform films several micrometers thick. ZnO can also be readily deposited onto Si substrates by radio-frequency (RF) magnetron sputtering, a process fully compatible with conventional semiconductor manufacturing. Collectively, these properties have driven the widespread exploration of ZnO-based multilayer structures for biosensing, gas sensing, liquid sensing, temperature sensing, and multimodal SAW sensor applications [20,21,22,23,24].
Despite the substantial body of work on ZnO-based SAW devices [25,26,27], most prior studies have concentrated on eigenfrequency characterization, insertion loss, or acoustic velocity, leaving the influence of the sensing layer on acoustic wave propagation and transmission largely unaddressed. In particular, limited attention has been given to the effect of a metallic Au layer on energy confinement and transmission behavior, although these factors directly affect signal quality and overall device performance. In SAW devices, the sensing layer functions not only as a biochemical interface for target immobilization and recognition, but also as an integral acoustic component capable of modifying wave propagation, and energy distribution. Moreover, few studies have coupled finite element analysis (FEA) using commercial simulation platforms such as COMSOL Multiphysics with systematic experimental validation to establish a reliable, predictive design framework for ZnO-based SAW biosensors.
To address these gaps, the present study integrates two-dimensional and three-dimensional FEA with experimental characterization to deliver a comprehensive evaluation of ZnO-based SAW devices fabricated on ZnO/Si and ZnO/SiO2/Si substrates. Particular emphasis is placed on elucidating the influence of the Au sensing layer on acoustic response and signal transmission. ZnO deposition parameters were optimized based on our previous work [28], with extended sputtering durations and reduced RF power employed to achieve smoother surface morphology, suppress flake-like microstructures, and attain sufficient film thickness within the operational limits of the deposition system. Given that the displacement field of surface acoustic waves is primarily confined within approximately one acoustic wavelength from the surface, film thickness is a critical parameter governing IDT efficiency and acoustic coupling [29]. Both 2D and 3D FEA models were developed in COMSOL Multiphysics to analyze frequency-domain scattering parameters (S11, S21) and eigenfrequencies, with simulation results subsequently validated through on-wafer and PCB-integrated vector network analyzer (VNA) measurements. As a proof-of-concept demonstration, the device was functionalized with a thiolated ssDNA probe targeting the EGFR L858R point mutation, a clinically significant biomarker for non-small-cell lung cancer, to assess the biofunctionalization capability and biosensing potential of the developed platform.
2. Materials and Methods
2.1. Finite Element Analysis
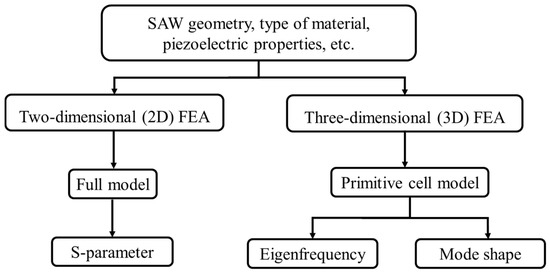
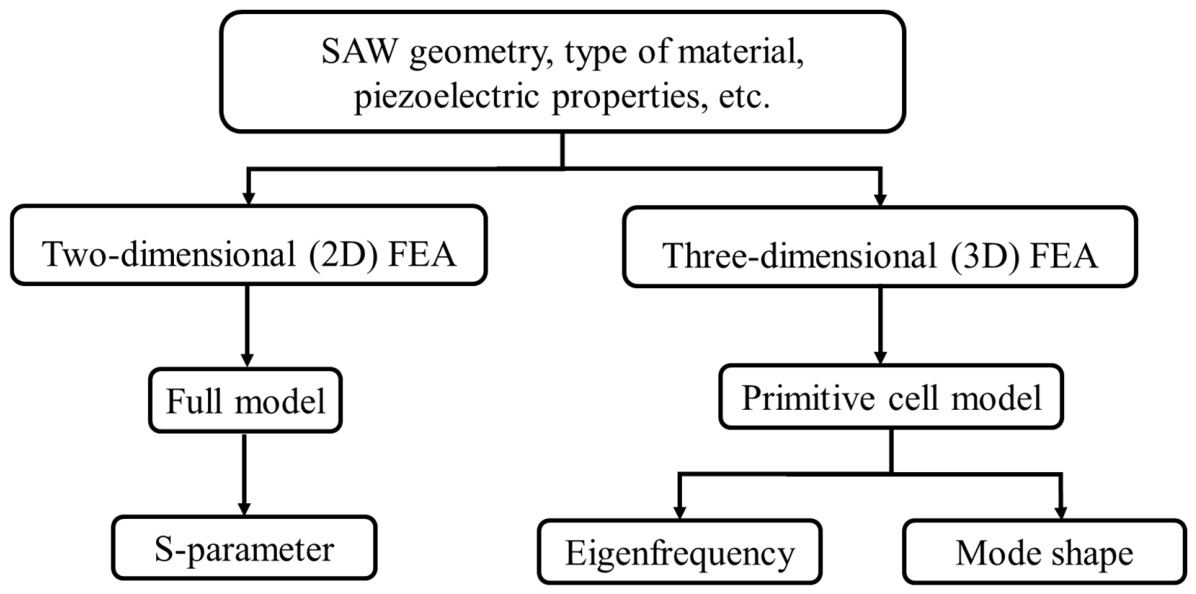
Simulations were performed using COMSOL Multiphysics 5.3a (COMSOL AB, Stockholm, Sweden), supported by the Center for Advanced Studies in Electronics Science and Technology, University of Hyderabad, India. A systematic FEA of ZnO/Si and ZnO/SiO2/Si structures, both with and without an Au sensing layer, was conducted using a Perfectly Matched Layer (PML) boundary approach, as illustrated in Figure 1. Two-dimensional frequency-domain FEA was employed to determine the resonance frequency, acoustic velocity, and propagation loss through analysis of the scattering parameters (S11, S21). Three-dimensional FEA was subsequently performed to extract eigenfrequencies and identify acoustic mode shapes.
Figure 1.
Illustrates the FEA methodologies used to estimate S-parameters, along with the corresponding simulated results of the SAW device in both 2D and 3D geometries.
2.2. Geometry
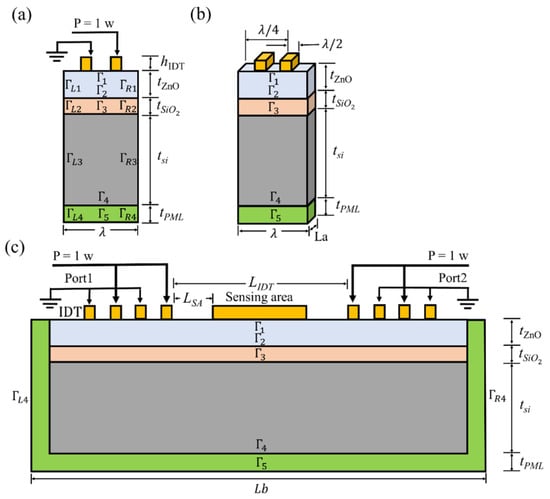
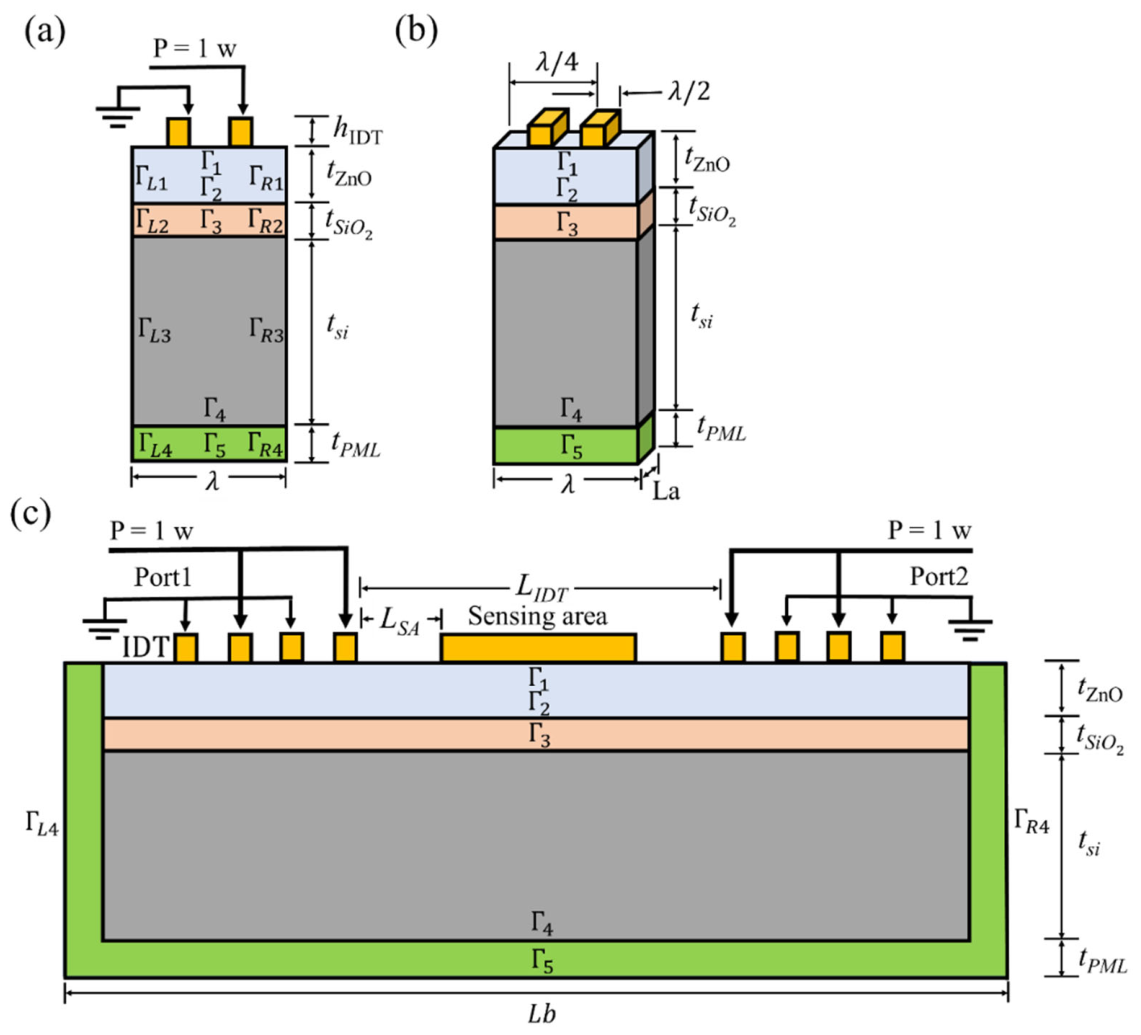
Figure 2 presents a schematic representation of the layered SAW device structures: ZnO/SiO2/Si and ZnO/Si (with Γ3 removed in the latter case). The schematic includes both the 3D primitive cell and the 2D full model. The periodicity of the IDT fingers corresponds to the acoustic wavelength (λ). The thicknesses of the ZnO, SiO2, and Si layers are denoted as t(ZnO), t(SiO2), and t(Si), respectively. IDTs are used to excite the propagation of surface acoustic waves (SAWs) along the surface of the piezoelectric medium. The IDTs consist of thin-film metallic electrodes arranged periodically on the ZnO surface. Gold (Au) is used for the IDT electrodes, forming two interdigitated comb-shaped structures that function as the transducer. In the simulation, the SAW structure is surrounded by a perfectly matched layer (PML) to enforce open-boundary conditions, allowing both electromagnetic and acoustic waves to propagate without reflection [30]. The film boundary is denoted by Γ, and the PML thickness is represented by t(PML). The IDTs are positioned on top of the ZnO surface. The IDT at Port 1 acts as the transmitter, generating acoustic waves, while the IDT at Port 2 serves as the receiver. The separation between the two IDTs is defined as L(IDT). The width and spacing of the conventional straight IDT fingers are both set to one quarter of the wavelength (λ/4), which maximizes the electromechanical coupling coefficient [30]. The device operates at an acoustic wavelength of λ = 30 µm. Additional parameters are summarized in Table 1.
Figure 2.
Structure of the SAW models: (a) side view of the 3D primitive-cell model, (b) perspective view of the 3D primitive-cell model, and (c) 2D full-body model.
Table 1.
The parameters of the simulation model.
2.3. Modeling
The governing model for ZnO-based SAW devices is derived from the piezoelectric constitutive equations, Newton’s second law of motion for the mechanical domain, and Maxwell’s equations for the electrical domain [25]. Two sets of boundary conditions, mechanical and electrical, were applied and implemented in COMSOLTM Multiphysics using the Piezoelectric Effect (pze) multiphysics coupling node, which couples the Solid Mechanics (solid) and Electrostatics (es) physics interfaces. A physics-controlled mesh with an extremely fine element size was adopted to ensure numerical accuracy. Material parameters for non-piezoelectric and piezoelectric components used in the simulations are listed in Table 2 and Table 3, respectively.
Table 2.
Non-piezoelectric material parameters used in the simulations.
Table 3.
Parameters of piezoelectric materials used in the simulation model.
The relationship between stress, strain, electric field, and electric displacement field in a stress-charge form [25,31] of a piezoelectric crystal is described by the piezoelectric linear constitutive equations:
where is the second-order stress tensor, is the electrical displacement vector (C/m2) is the strain tensor of the medium, is the electric field vector (V/m). , and are the elasticity tensor (N/m2), the piezoelectric tensor (C/m2), the permittivity tensor (F/m), respectively. The complete description of SAW propagation in a piezoelectric medium requires the simultaneous solution of the continuum equations of motion, Maxwell’s equations under the quasi-static approximation, strain-displacement relations, and the piezoelectric constitutive relations, subject to appropriate mechanical and electrical boundary conditions. The eigenfrequency of the SAW resonator is primarily governed by the designed acoustic wavelength and the wave propagation velocity, both of which are determined by the material properties, substrate configuration, and crystallographic propagation direction.
2.4. Fabrication of ZnO Film and IDT Pattern
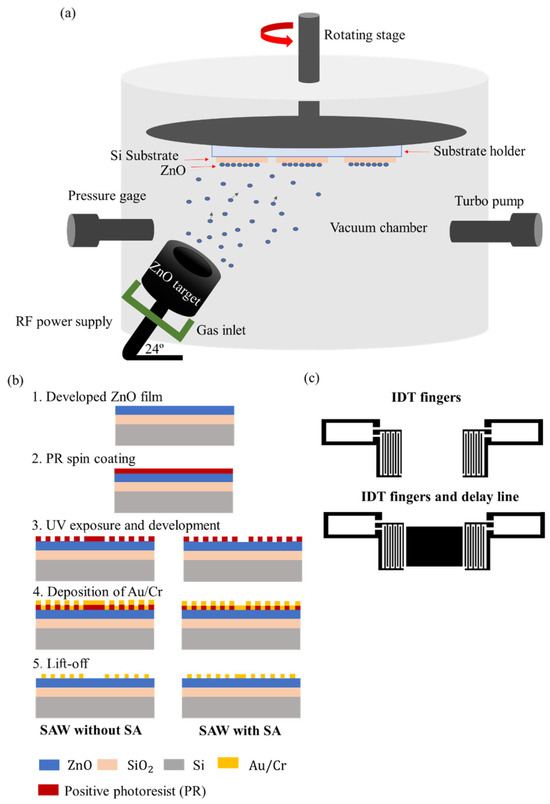
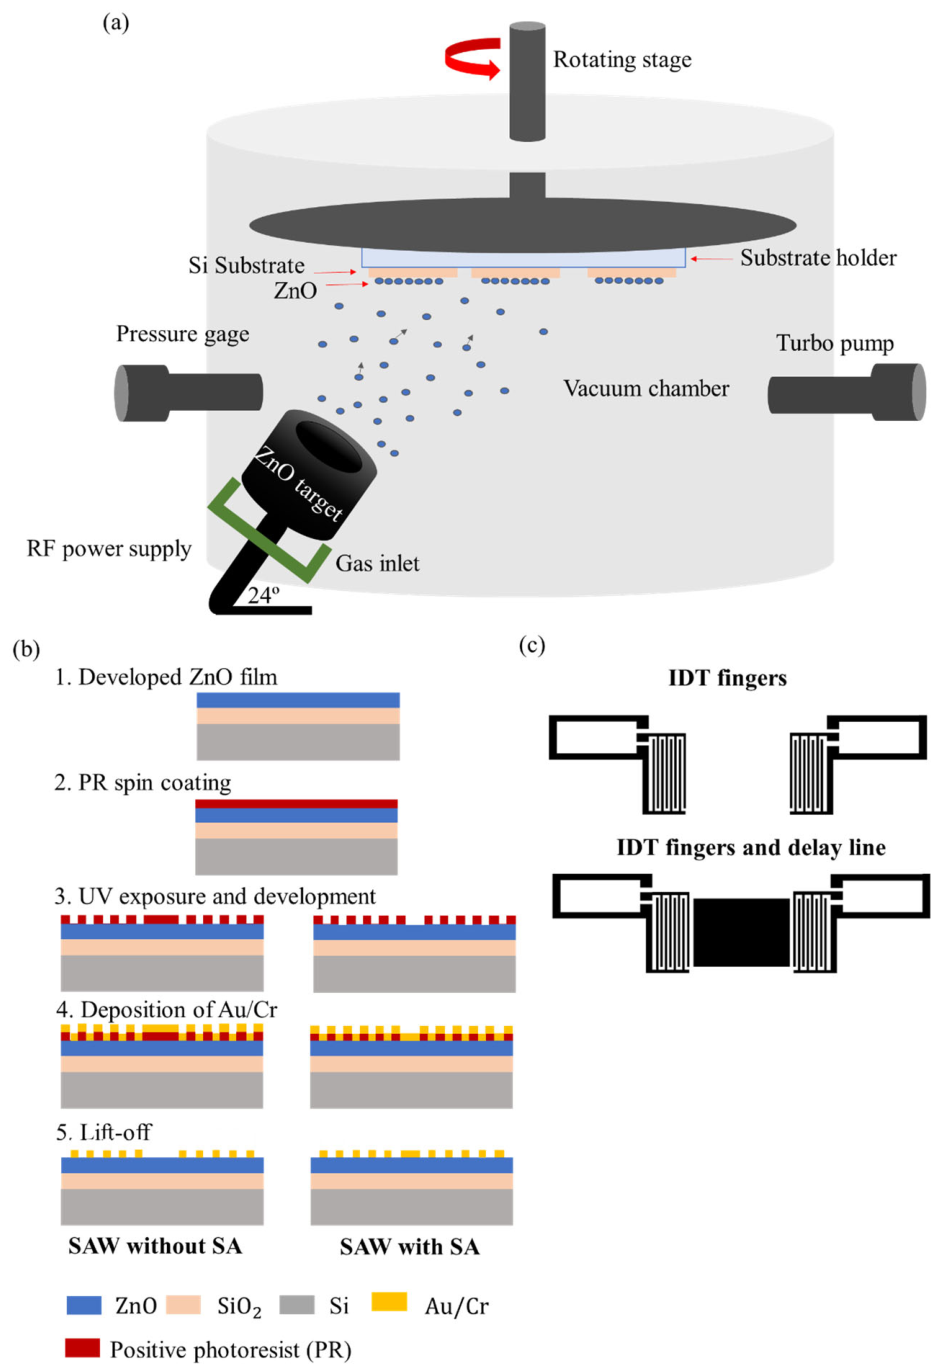
ZnO thin films were deposited by RF magnetron sputtering at Beamline 6 (BL-6) of the Synchrotron Light Research Institute (SLRI), Nakhon Ratchasima, Thailand. The deposition setup is schematically illustrated in Figure 3a. Two substrate configurations were prepared. The first, ZnO/Si, consisted of ZnO deposited directly onto boron-doped p-type Si (100) substrates. The second, ZnO/SiO2/Si, incorporated an intermediate thermally grown SiO2 layer of 1 µm thickness on Si (100) substrates with a resistivity of 1–10 Ω·cm. All sputtering conditions are summarized in Table 4.
Figure 3.
Schematic diagram of (a) RF sputtering technique used for ZnO thin-film deposition, (b) fabrication process flow of the ZnO-based SAW device, and (c) interdigital transducer (IDT) design of the ZnO-SAW device.
Table 4.
Sputtering parameters of ZnO films.
Prior to deposition, the Si substrates underwent a rigorous cleaning procedure. They were first treated with a 1:1 piranha solution comprising 95% sulfuric acid (H2SO4) and 35% hydrogen peroxide (H2O2) at 120 °C to remove organic and metallic contaminants. The substrates were subsequently immersed in buffered oxide etchant (BOE, 7:1) for 1 min to strip the native oxide layer, followed by treatment in 65% nitric acid (HNO3) at 115 °C for 10 min to promote the formation of a uniform oxide surface. After each chemical treatment step, the substrates were thoroughly rinsed with reverse osmosis (R.O.) water and dried under a nitrogen gas flow. The cleaned substrates were then baked at 200 °C for 1 h, allowed to cool to room temperature, and subjected to oxygen plasma surface treatment immediately prior to film deposition. IDT patterning on the ZnO films was carried out as illustrated in Figure 3b, with device designs incorporating both sensing layer and non-sensing layer configurations shown in Figure 3c. Au/Cr bilayer electrodes were selected for their high electrical conductivity and strong adhesion to the ZnO surface. IDT fabrication was performed using a MicroWriter ML3 maskless UV lithography system (Durham Magneto Optics Ltd., Sawston, Cambridge, UK) at the Tata Institute of Fundamental Research (TIFR), Hyderabad, India. Prior to lithography, substrates were cleaned sequentially with acetone, isopropyl alcohol (IPA), and deionized (DI) water under ultrasonic agitation for 3 min per solution. A positive photoresist (Microposit S1813, DuPont Electronics & Imaging, Marlborough, MA, USA) was spin-coated at 5000 rpm for 1 min and soft-baked at 115 °C for 1 min. Pattern exposure was carried out at a resist sensitivity of 127 mJ/cm2. Development was performed using a TMAH-based developer solution prepared from 22 mL DI water and 3 mL TMAH, with each development cycle consuming 5 mL of solution over a total development time of 17 s.
2.5. EGFR Mutation Detection Using the ZnO-Based SAW Biosensor
The ZnO-SAW biosensor was evaluated in a proof-of-concept study for the detection of nucleic acid corresponding to the L858R point mutation in exon 21 of the EGFR gene, a well-established biomarker for lung cancer. The target nucleic acid samples were obtained from U2Bio (U2Bio (Thailand) Co., Ltd., Bangkok, Thailand). The sequences used in this study were the EGFR ssDNA probe, 5′-SH-ACCCAGCAGTTTGGCCCGCCC-3′, and the EGFR ssDNA target, 5′-GGGCGGGCCAAACTGCTGGGT-3′.
Prior to biomolecule immobilization, the SAW biosensor chips were thoroughly cleaned by sequential treatment with piranha solution (70% H2SO4: 30% H2O2), deionized water, acetone, and absolute ethanol to ensure complete removal of surface contaminants. The chips were dried under ambient conditions within a laminar flow cabinet. Baseline resonance responses of the bare SAW devices were recorded before any surface modification. A 0.5 µM EGFR ssDNA probe solution was then drop-cast onto the Au sensing region and incubated for 2 h to facilitate thiol-gold self-assembled monolayer formation. Following incubation, the devices were washed sequentially with 0.1× TE buffer, deionized water, and absolute ethanol to remove non-specifically adsorbed probe molecules. A complementary EGFR ssDNA targets were subsequently introduced onto the sensing surface and incubated for 10 min to allow hybridization. The resonance response was continuously monitored throughout both the immobilization and hybridization stages. After a final washing step, the devices were air-dried and the post-hybridization resonance response was recorded to quantify the frequency shift associated with biomolecular binding.
3. Results
3.1. Simulation Analysis
3.1.1. Two-Dimensional FEA: Full Model
To investigate S parameters, a 2D full-body model was employed. A parametric sweep study named ‘PortName’, labeled as 1 and 2, was defined in COMSOL. For the 1D plot group, Electrostatics, Terminal, and S-parameter (dB) data were selected for the y-axis to obtain the S11 (es.S11dB) and S12/S21 (es.S21dB). The SAW device model was simulated in 1 MHz increments over the frequency range of 100–300 MHz. These simulations provide the characteristic reflection (S11) and transmission (S21) signals, which represent the relationship between the incident waves and the corresponding reflected or transmitted power in the SAW devices.
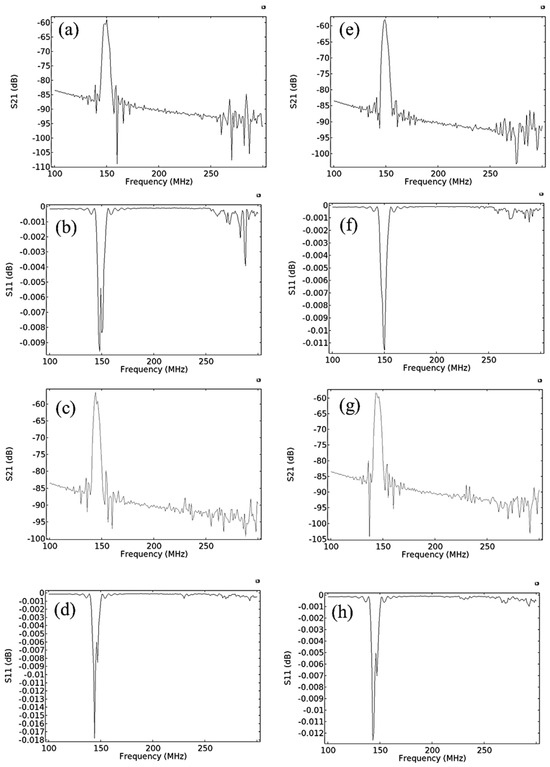
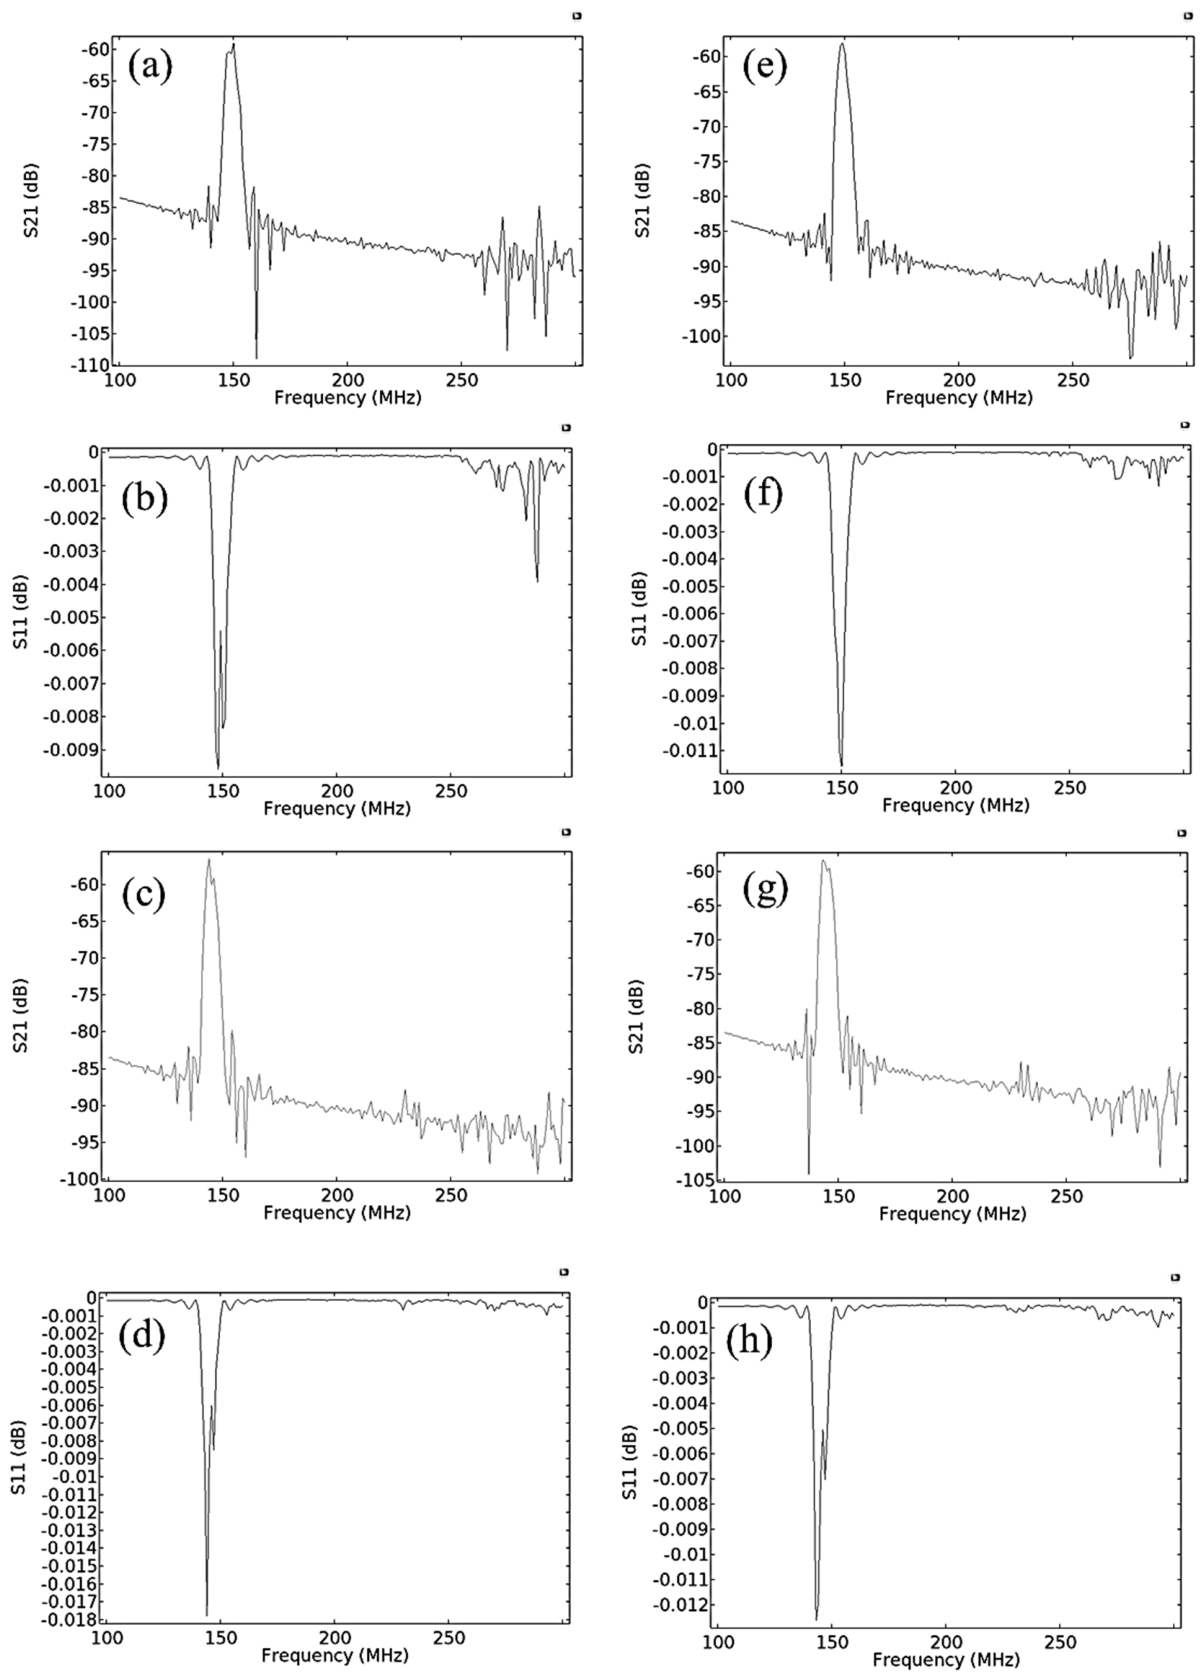
Table 5 shows the detailed boundary condition settings for the 2D full-body model used in the simulation. The substrate material selection is critical for the design of SAW devices. The electromechanical coupling factor, coefficient of thermal expansion, acoustic wave velocity, material compatibility, and raw material cost are all important considerations when selecting substrates. Among these, wave velocity is particularly important, as it directly influences the performance and design of SAW devices [32]. The ZnO/Si structure offers advantages for SAW devices, including high phase velocity and significant electromechanical coupling. However, the negative temperature coefficient of frequency (TCF) may cause instability in practical use, as temperature fluctuations can alter the SAW device’s resonance frequency [27]. A material with a positive temperature coefficient of frequency (TCF), such as SiO2, will also be incorporated into the structure. The performance of the ZnO-based SAW device was evaluated by analyzing the S-parameter vs. frequency response, as shown in Figure 4. The S11 and S21 signals were obtained for two device structures: ZnO/Si, shown in Figure 4a,b,e,f, and ZnO/SiO2/Si, shown in Figure 4c,d,g,h, both with and without the presence of the sensing layer, respectively. The S11 spectrum showed dip positions that corresponded to peaks in the S21 spectrum, indicating that resonant acoustic modes were present and propagated along the ZnO-based SAW devices.
Table 5.
Mechanical and electrical boundary conditions used in the 2D Full simulation model.
Figure 4.
Simulated S11 and S21 responses of the 2D full model: (a) S21 and (b) S11 of the ZnO/Si device without the Au sensing layer; (c) S21 and (d) S11 of the ZnO/SiO2/Si device without the Au sensing layer; (e) S21 and (f) S11 of the ZnO/Si device with the Au sensing layer; (g) S21 and (h) S11 of the ZnO/SiO2/Si device with the Au sensing layer.
Figure 5 demonstrates that the S21 spectrum for ZnO/Si has a prominent single peak at 149 MHz, which corresponds to the Rayleigh (R) mode. The relative thickness () is 0.04, and the calculated acoustic velocity is 4470 m/s. For the ZnO/SiO2/Si structure, two resonance peaks are observed: 145 MHz for R-mode and 234 MHz for Sezawa (S) mode. The corresponding acoustic velocities are calculated to be 4350 m/s and 7020 m/s, respectively. The R-mode appeared in a lower frequency band with higher intensity, while the S-mode, representing an overtone of the fundamental mode, appeared at a higher frequency with lower intensity. The S-mode exhibited a higher acoustic velocity than the R-mode, a behavior typically observed when the layer thickness-to-wavelength ratio (d/λ) exceeds 0.15 [33]. However, in this study, the d/λ ratio for the ZnO/SiO2/Si structure is 0.07, yet the S-mode is still present. The result is further supported by mode shape analysis, identifying SAW modes via displacement profile analysis at various frequencies through 3D FEA and experimental investigations. The higher velocity observed in the ZnO/Si structure compared to the ZnO/SiO2/Si structure is attributed to the greater SAW velocity of the Si substrate compared to both the ZnO and SiO2 layers. To evaluate the propagation losses of SAW modes in the device, the propagation loss values, presented in decibels (dB), were calculated from the transmission (S21) spectra () [29] for each ZnO-based SAW structure.
Figure 5.
The center frequencies of the Simulation result of the 2D full model of S21.
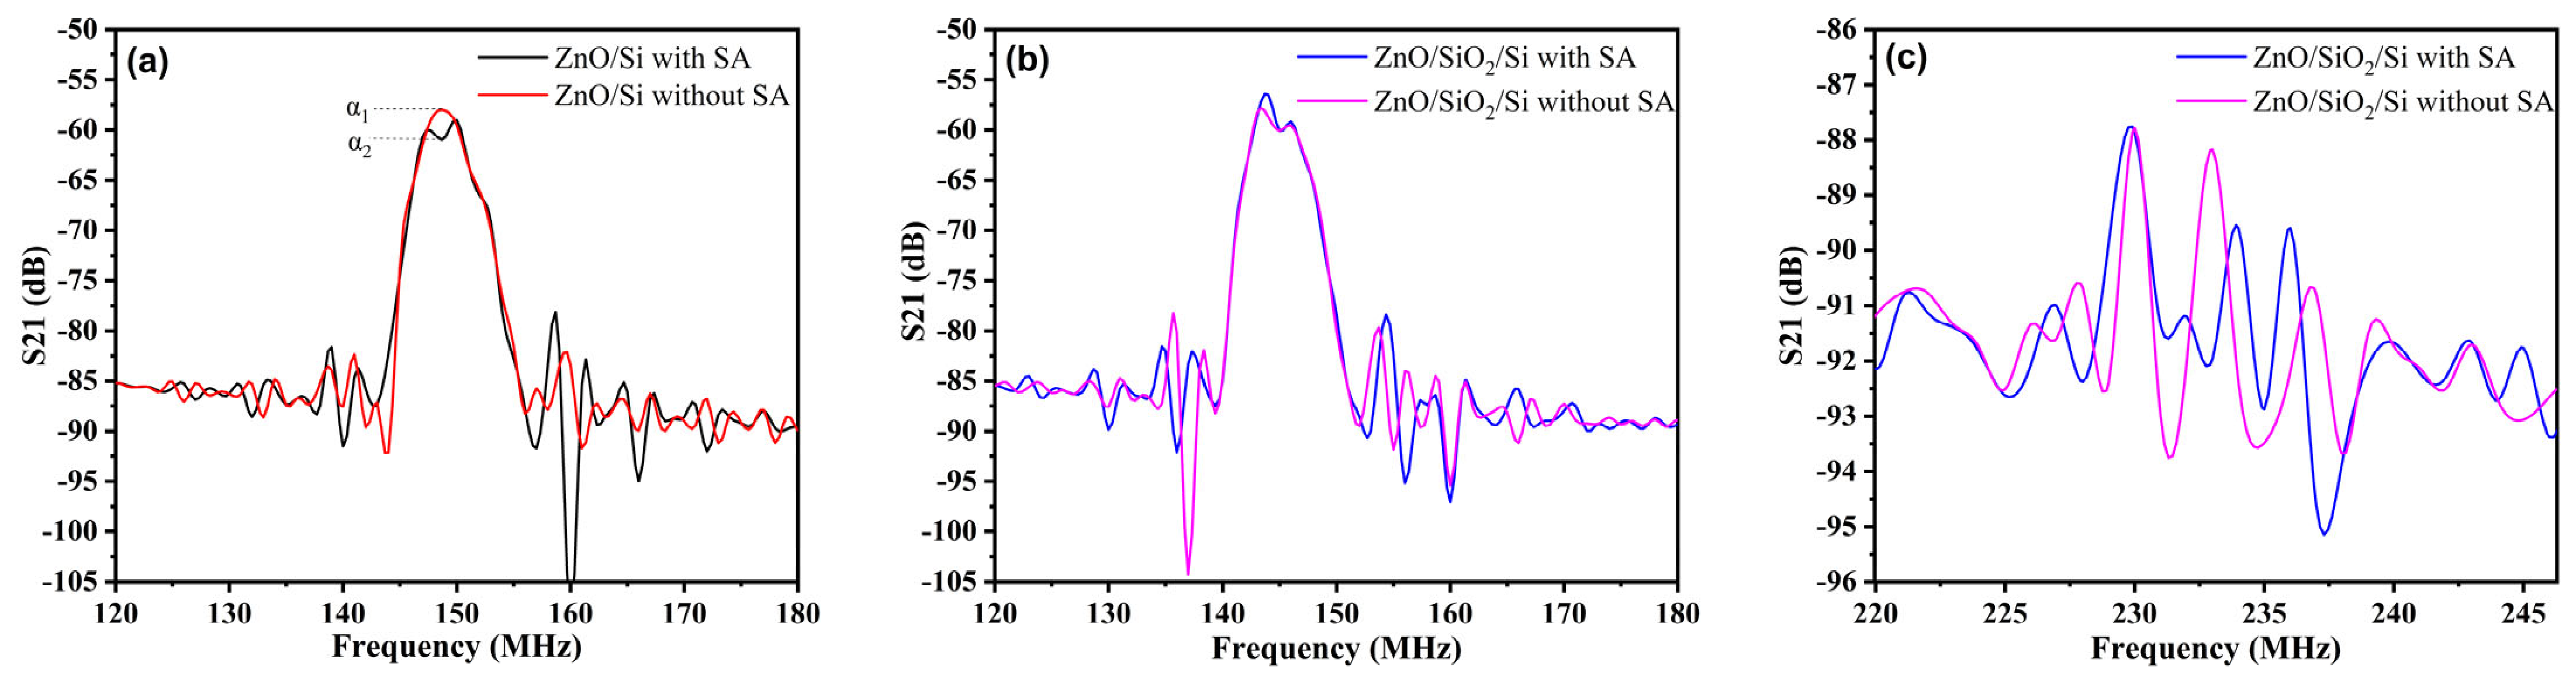
As shown in Figure 6, the first resonance mode (R1) of both the ZnO/Si and ZnO/SiO2/Si structure exhibited a change in propagation loss of approximately 2 dB with the addition of a sensing layer. It was noted that the presence of the sensing layer slightly altered the simulated transmission spectra.
Figure 6.
Simulated S21 responses with and without the Au sensing layer (SA): (a) ZnO/Si in the Rayleigh mode region (120–180 MHz), where α1 and α2 denote the S21 amplitudes with and without the sensing layer, respectively, from which the change in propagation loss (α2 − α1) was determined; (b) ZnO/SiO2/Si in the Rayleigh mode region (120–180 MHz); and (c) ZnO/SiO2/Si in the Sezawa mode region (220–245 MHz).
3.1.2. Three-Dimensional FEA: Primitive Cell
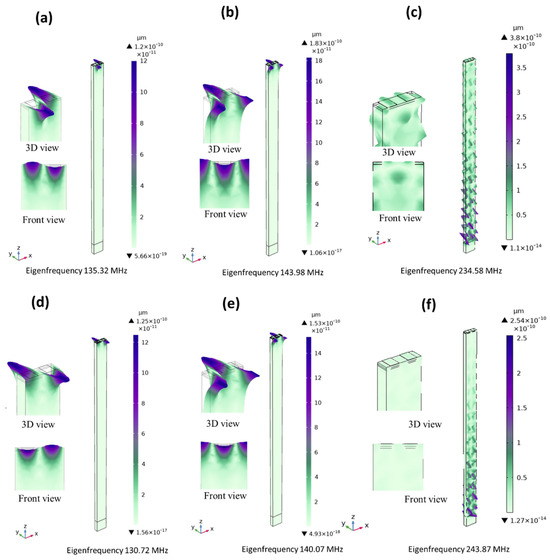
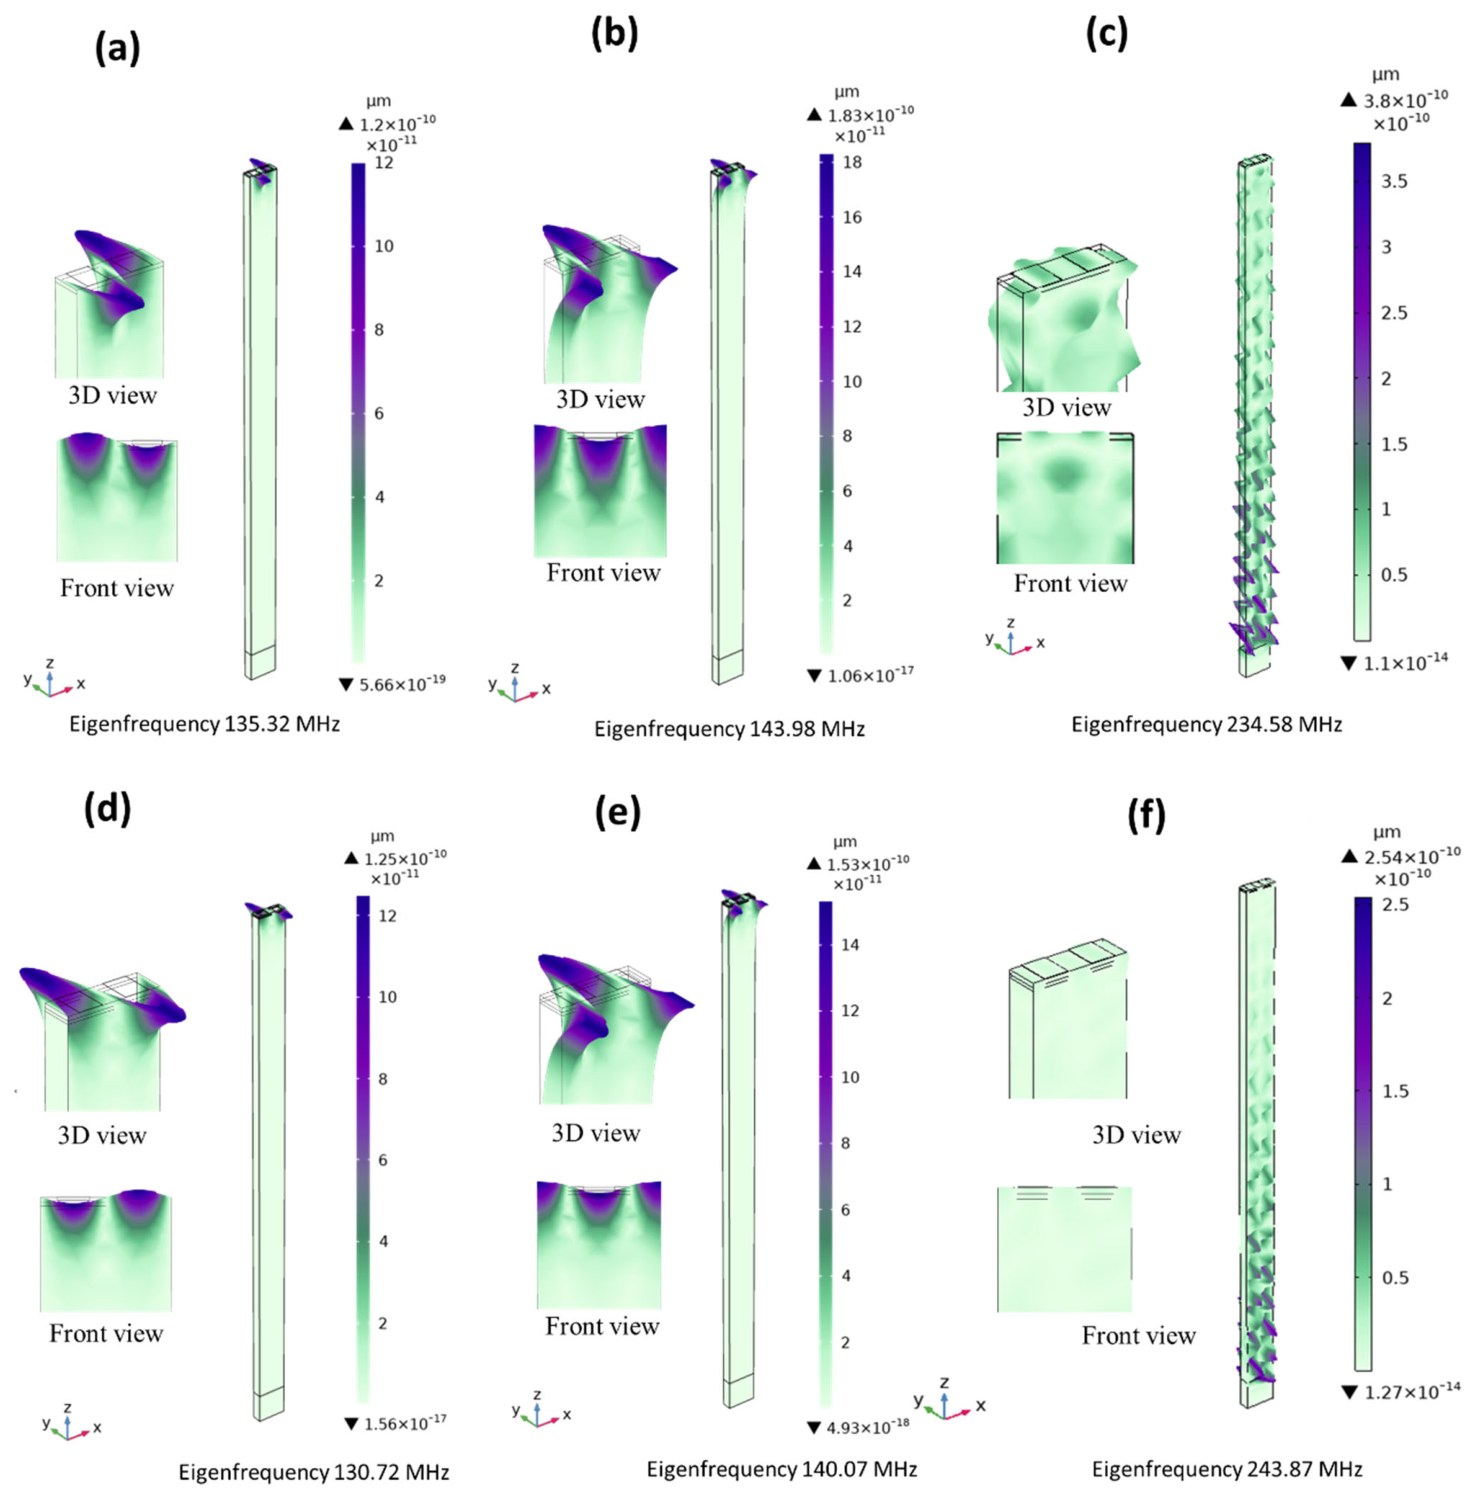
The propagation characteristics of the ZnO-based SAW device were examined through 3D FEA using an eigenfrequency study that focused on particle vibration patterns. The occurrence of the R- and S-modes in the ZnO SAW structure was identified by analyzing the mode shapes of the surface displacement profiles at various eigenfrequencies. Detailed boundary condition settings for the 3D primitive cell are provided in Table 6. The displacement results for the ZnO-based SAW devices are plotted in Figure 7. Displacement profiles are useful for identifying wave modes [34]. The distinction between the first and second modes is illustrated by the mechanical displacement observed at the first and second resonance frequencies, which correspond to the R- and S-modes of the ZnO-based SAW structure. The results were recorded at the resonance and anti-resonance frequencies during eigenfrequency analysis. R-mode frequencies were found at 135.32 MHz (anti-symmetric resonance frequency), as shown in Figure 7a, and 143.98 MHz (symmetric resonance frequency) for ZnO/Si, as shown in Figure 7b. For ZnO/SiO2/Si, Rayleigh mode frequencies were observed at 130.72 MHz (anti-symmetric resonance frequency), as shown in Figure 7d, and 140.07 MHz (symmetric resonance frequency), as shown in Figure 7e. The S-mode appeared at 234.58 MHz for the ZnO/Si device (Figure 7c) and at 243.87 MHz for the ZnO/SiO2/Si device (Figure 7f). In ZnO-based SAW devices, the Rayleigh mode is primarily localized near the top surface of the ZnO layer, whereas the S-mode is predominantly confined within the silicon substrate, with its acoustic wave penetrating more deeply into the silicon. The maximum displacement observed in the Sezawa-type mode is higher than in the other modes, because the Sezawa wave components are not well confined within the ZnO layer.
Table 6.
Mechanical and electrical boundary conditions used in the 3D primitive cell simulation model.
Figure 7.
Eigenfrequency modes of (a–c) the ZnO/Si and (d–f) ZnO/SiO2/Si SAW structure.
3.2. Fabrication Section
3.2.1. Morphology and Structure Characterizations
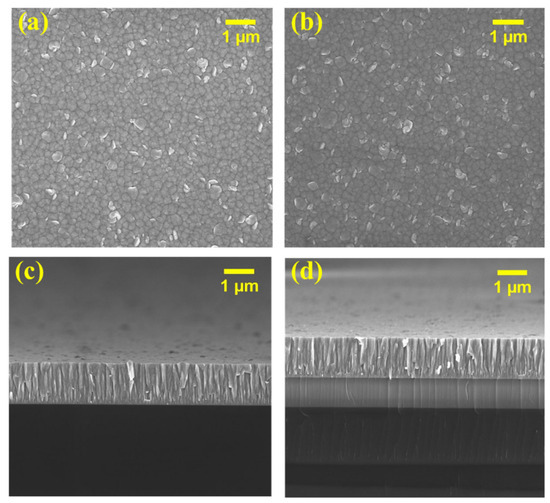
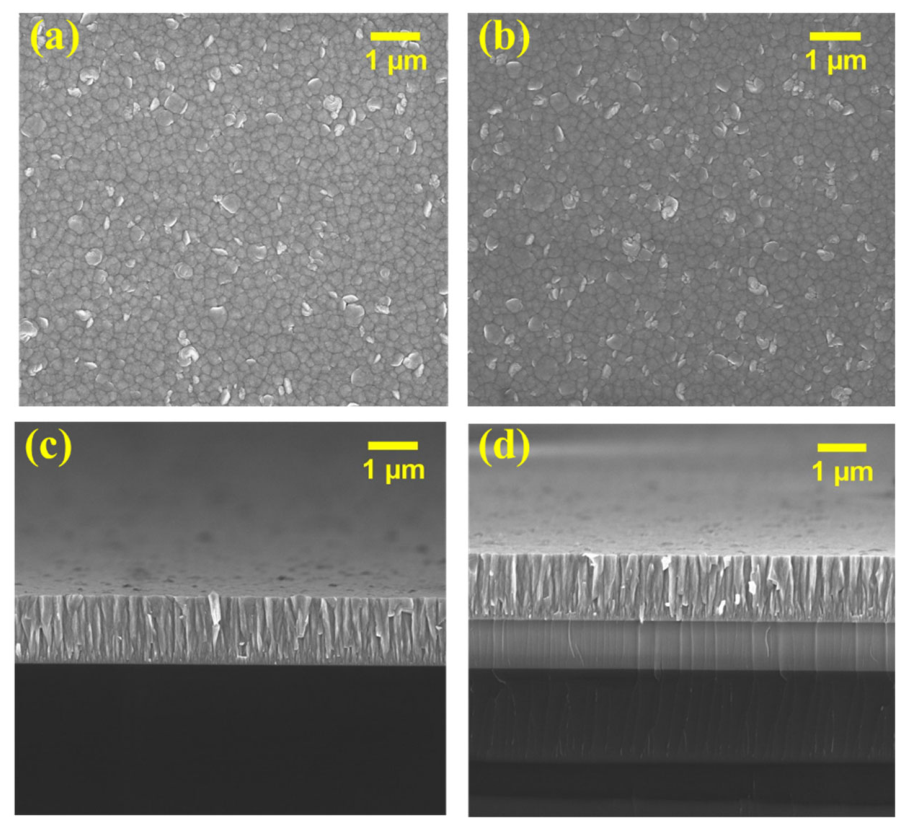
Figure 8 presents the surface and cross-sectional SEM images of the SAW device, obtained using FE-SEM (JEOL JSM-6010LV, JEOL Ltd., Tokyo, Japan) operated at an acceleration voltage of 5 kV and a working distance of 5 mm. The FE-SEM images were captured at a magnification of 10,000×. The surface morphology of the deposited ZnO film shows a relatively uniform grain-size distribution, with well-defined grains up to approximately 110 nm, along with a smaller fraction of irregular flake-like structures. The thickness of the ZnO film on both the SiO2/Si and Si substrates is approximately 1.3 µm, exhibiting a smooth surface, a columnar microstructure, and strong adhesion to the substrates.
Figure 8.
Surface and cross-sectional FE-SEM images of (a,c) ZnO/Si and (b,d) ZnO/SiO2/Si.
3.2.2. On-Wafer VNA Characterization of the ZnO-SAW Structure
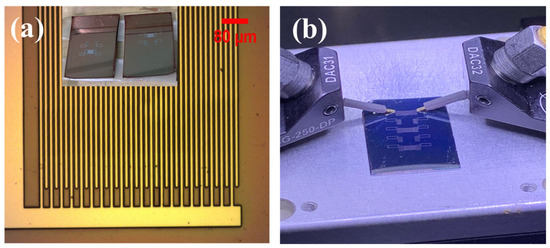
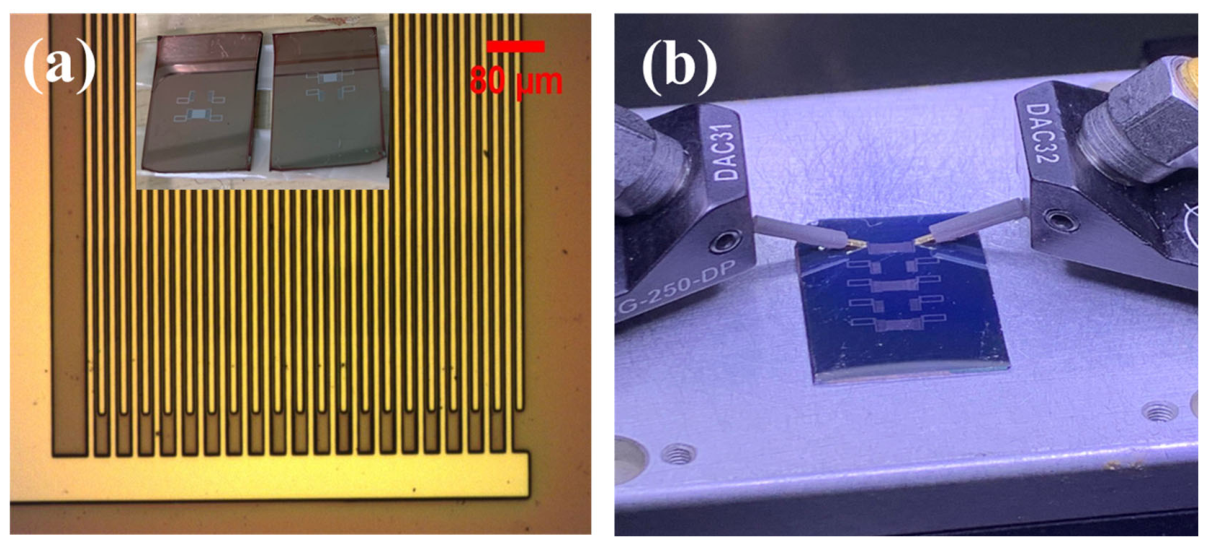
The developed pattern, observed under an optical microscope, as shown in Figure 9a. The S21 response of the ZnO SAW devices was measured using a ground-signal-ground (GSG) probe connected to a VNA, as shown in Figure 9b. The ZnO-SAW measurements were performed using an on-wafer VNA system integrated with a wafer probe station. This setup allows for direct characterization of SAW devices fabricated on ZnO films. Before measuring the S21 scattering parameters of the fabricated devices, the VNA was calibrated using a two-port calibration standard based on the SOLT (short, open, load, through) technique to minimize the influence of parasitic effects introduced by RF cables and probe equipment.
Figure 9.
(a) Optical image of the interdigital transducer (IDT) after the development process, and (b) ZnO-based SAW device with the measurement setup.
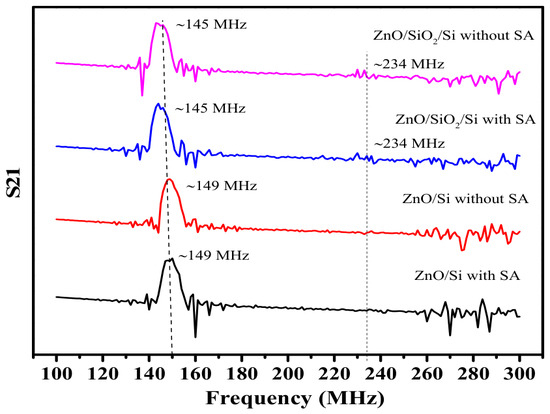
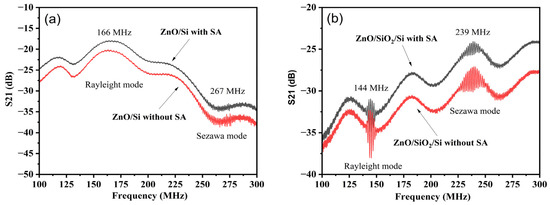
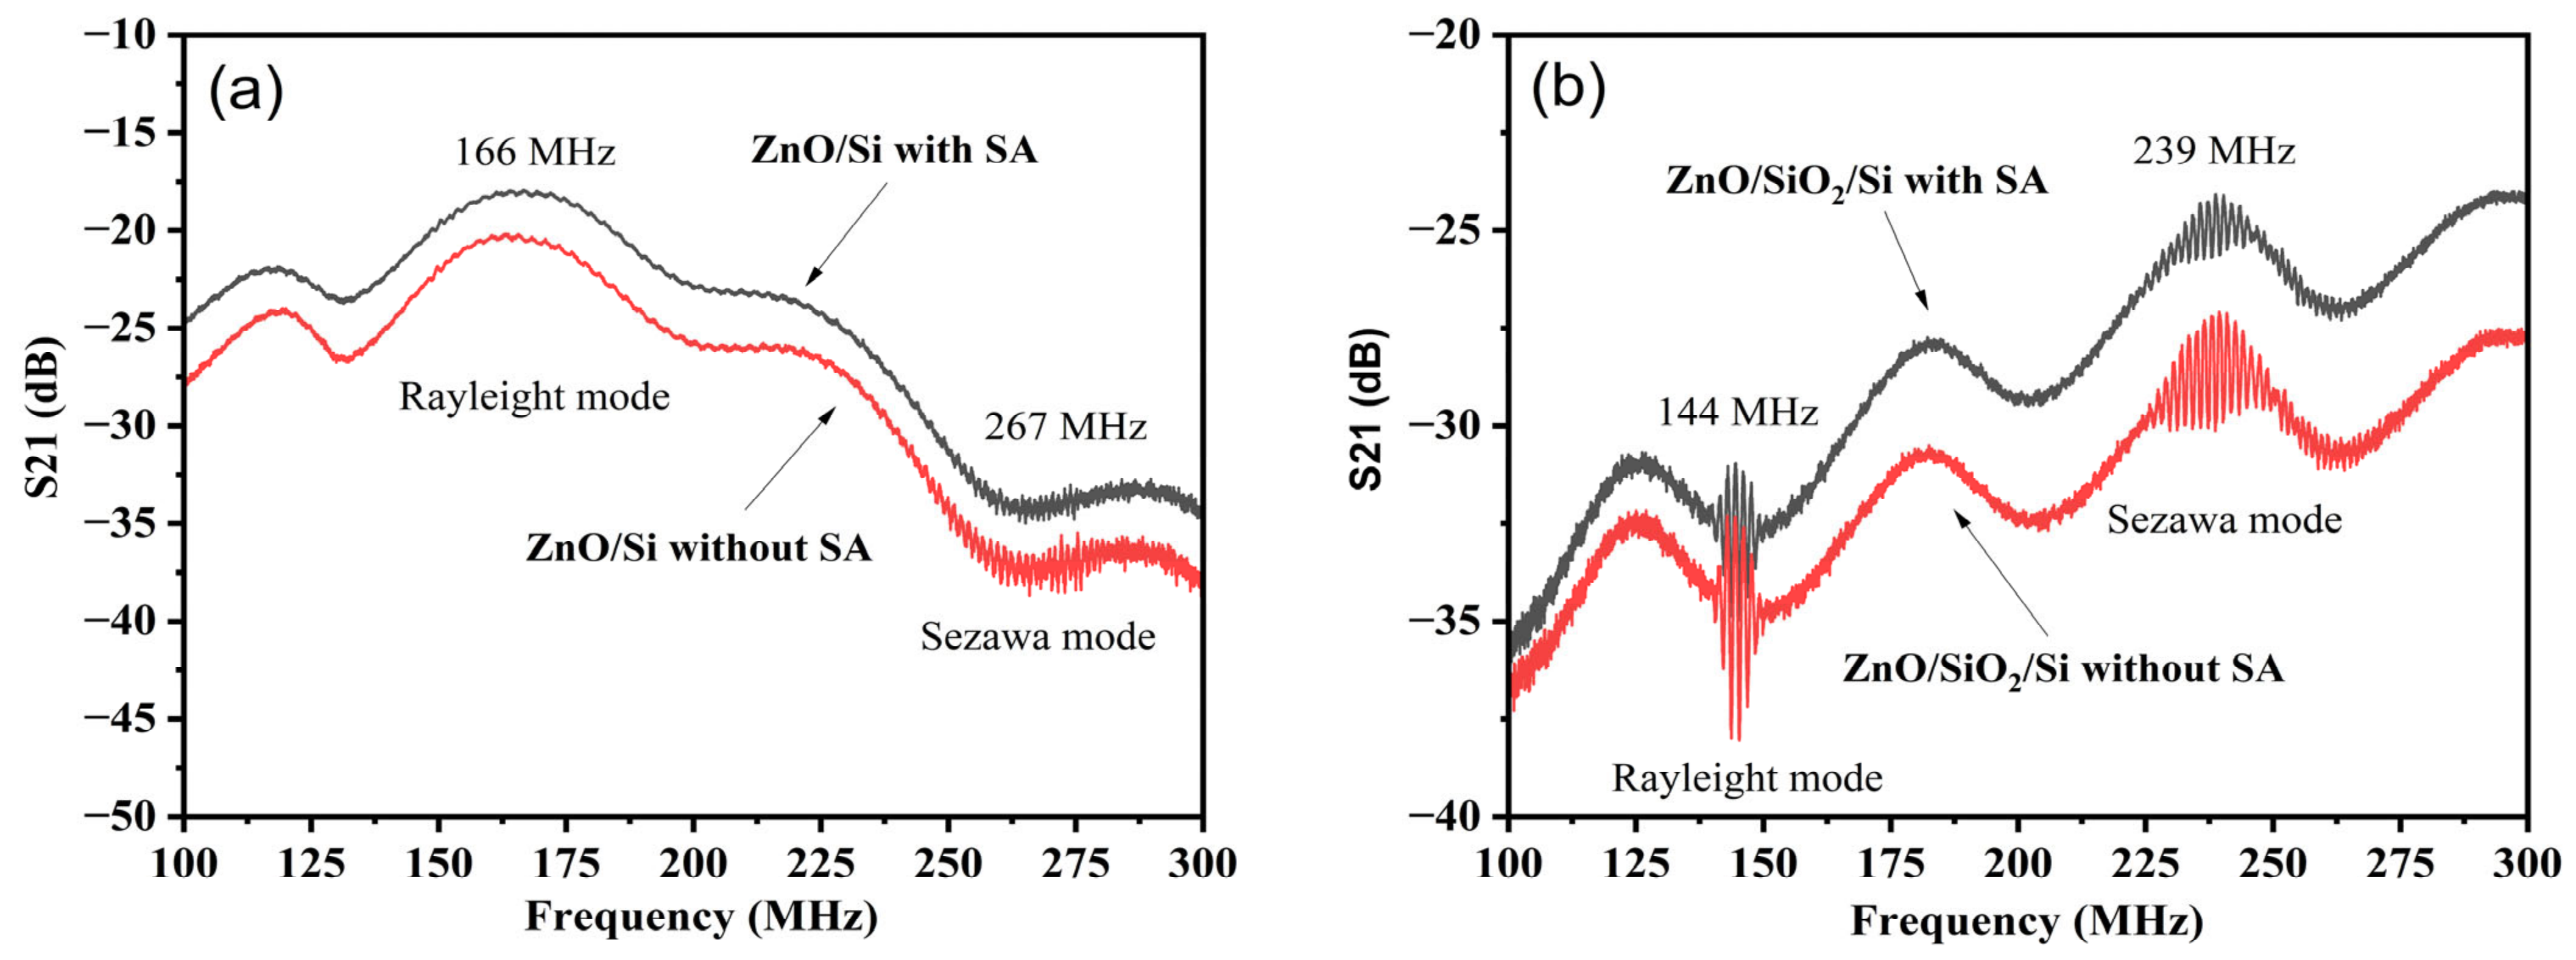
Figure 10 shows the S21 frequency responses of the two-port ZnO-SAW devices measured using the on-wafer VNA system. The ZnO/Si device shown in Figure 10a exhibited a Rayleigh-mode resonance at 166 MHz, corresponding to a phase velocity of 4980 m/s. This frequency was approximately 17 MHz higher than the simulated value of 149 MHz, representing a deviation of approximately 11.4%. A higher-frequency mode assigned as a Sezawa-type mode was observed at 238 MHz, corresponding to an estimated phase velocity of 7140 m/s based on the designed acoustic wavelength of 30 µm. For the ZnO/SiO2/Si device shown in Figure 10b, the Rayleigh and Sezawa-type modes were observed at 144 and 239 MHz, respectively. These frequencies agreed closely with the simulated values of 145 and 234 MHz, with deviations of approximately 1 and 5 MHz, respectively. In contrast, the larger discrepancy observed for the ZnO/Si Rayleigh mode indicates that the simulation did not fully reproduce the fabricated-device response for this configuration. Measurements of the fabricated IDT fingers showed widths ranging from 6 to 8 µm, with an average value of 7.09 ± 0.75 µm, compared with the designed value of 7.5 µm. This dimensional variation may have contributed to the resonance frequency shift. However, the discrepancy cannot be attributed exclusively to the IDT width because variations in finger spacing, ZnO thickness, effective elastic and piezoelectric properties, residual stress, crystallographic texture, and measurement boundary conditions may also affect the acoustic response. Therefore, the ZnO/Si discrepancy is acknowledged as a limitation of the present study, whereas the closer agreement obtained for the ZnO/SiO2/Si structure supports the applicability of the modeling framework to that device configuration.
Figure 10.
Measured S21 responses of the fabricated ZnO SAW devices, obtained by on-wafer VNA measurement with and without the Au sensing layer: (a) ZnO/Si, showing the Rayleigh mode at 166 MHz and the Sezawa mode at 267 MHz; and (b) ZnO/SiO2/Si, showing the Rayleigh mode at 144 MHz and the Sezawa mode at 239 MHz.
The appearance of the S-mode is expected when the acoustic velocity of the substrate exceeds that of the deposited piezoelectric thin film. Confirmation that this second mode is indeed the S-mode is supported by S-parameter analysis from both simulations and experimental measurements. By introducing a sensing layer to both developed devices, the results indicate that the sensing layer slightly affects transmission, with a change of approximately 2 dB, consistent with simulation predictions. The introduction of the sensing layer reduces signal loss, as evidenced by an increase in the S21 value. This suggests that the sensing layer may facilitate improved wave propagation from the input port to the device’s output port.
3.2.3. Characterization of the Embedded ZnO-SAW Device on a PCB Using VNA Measurements
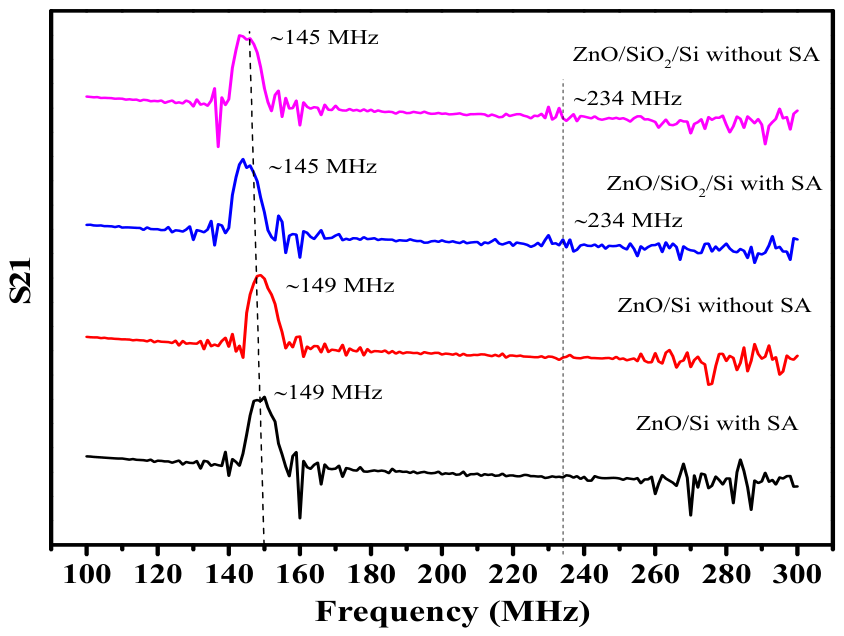
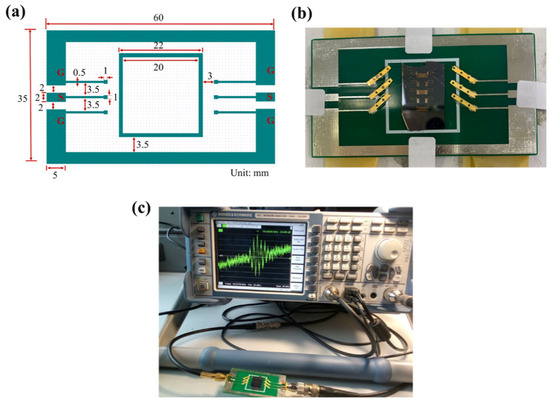
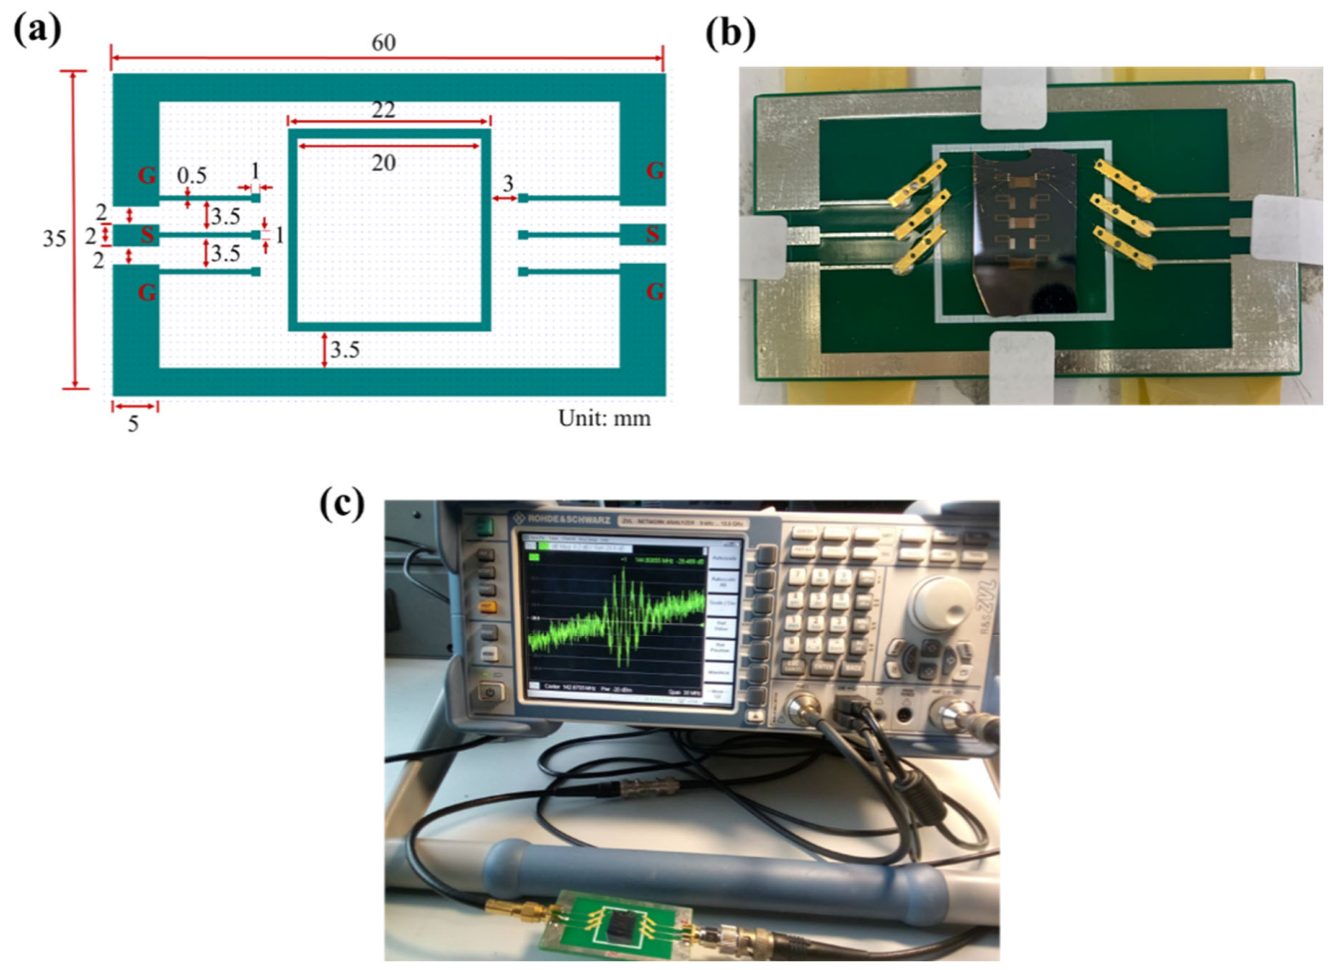
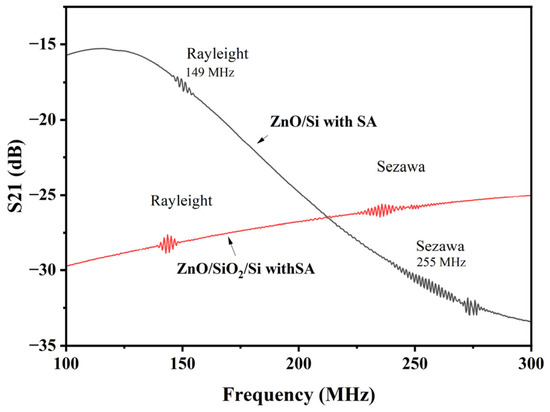
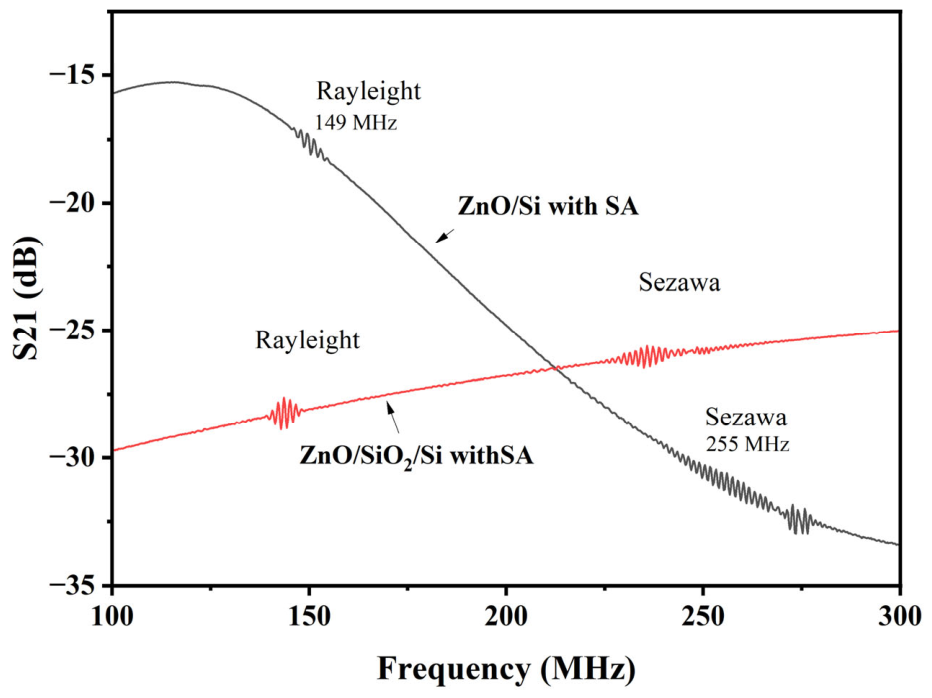
To simulate practical use and provide an appropriate environment for embedding ZnO-SAW devices into portable biosensor systems, PCB was used. The PCB layout was designed using Clewin4 software version 4.0.1 (WieWeb Software, Hengelo, The Netherlands), as shown in Figure 11a. The measurement setup, with the ZnO SAW devices mounted on the PCB using adhesive glue, is depicted in Figure 11b. Electrical components, such as SMA connectors, were mounted directly on the PCB surface to serve as connectors for the input and output ports. The IDT pads are electrically connected to the SMA connectors using Au wires. The SAW-PCB was connected with the VNA, as shown in Figure 11c. The S21 results for ZnO with a sensing layer are presented in Figure 12. Two distinct modes were identified for the ZnO/Si device: the Rayleigh mode at approximately 149 MHz and the Sezawa-type mode at 255 MHz. The ZnO/SiO2/Si device also exhibits two distinct modes: the Rayleigh mode at approximately 144 MHz and the Sezawa-type mode at 237 MHz. These values match the transducer pattern’s periodicity. This indicates that the ZnO-SAW embedded PCB device efficiently excites both modes. The losses observed in the S21 curves, as shown in the experimental results, range from −15 to −30 dB. These losses may be attributed to electrical finger resistance, acoustic propagation losses, electrical mismatches between the IDTs and the measurement circuits, and the use of a non-optimized SAW IDT geometry or improper connections between IDT fingers in the tested devices. Alternative IDT designs could be considered in the future, such as unidirectional interdigital transducers (UITs), floating electrode unidirectional IDTs (FEUDTs), or single-phase unidirectional IDTs (SPUDTs). These designs can direct most of the SAW energy in a preferred direction, suppress triple-crossing echo signals, and reduce insertion loss due to their inherent unidirectionality [35].
Figure 11.
(a) PCB design created using Clewin4 software, (b) Integrated ZnO-SAW device to the PCB, and (c) S-parameter measurement of the ZnO device mounted on the PCB using VNA.
Figure 12.
The measured S21 results obtained from ZnO SAW devices mounted on a PCB using VNA.
3.3. Biomarker Detection
3.3.1. Contact Angle Measurement
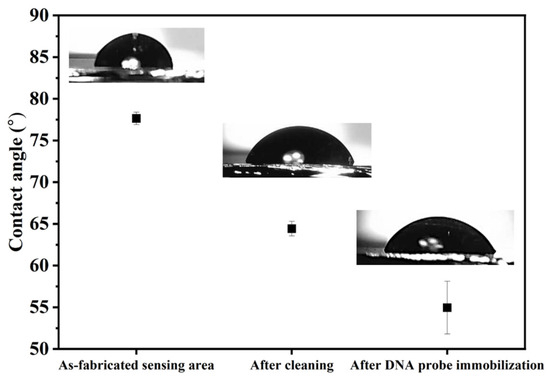
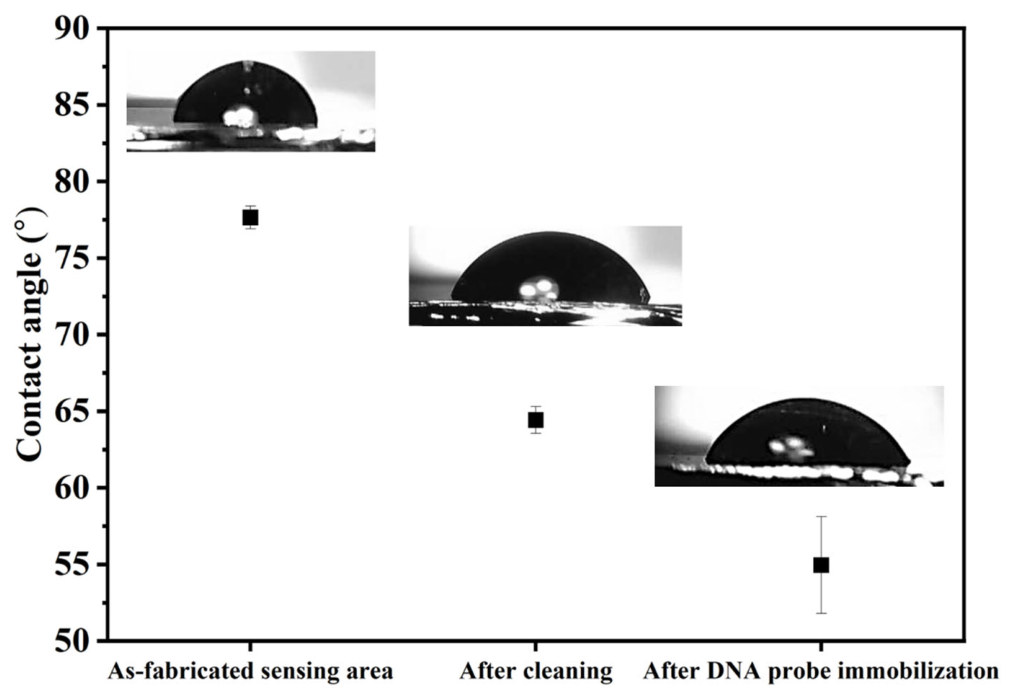
Contact angle (CA) measurements were performed prior to biomolecular immobilization to assess the wettability of the Au sensing surface of the SAW device. Wettability describes the interaction between a solid surface and a liquid and is generally classified as either hydrophobic or hydrophilic. Surface wettability plays an important role in biosensor performance, as bioreceptor layers require sufficient hydrophilicity to promote effective interactions with target biomolecules. The CA measurement procedure and Au surface cleaning followed the method described in our previous work [36]. As shown in Figure 13, the measured CA values were 77.64 ± 0.74°, 64.41 ± 0.86°, and 54.94 ± 3.16° for the bare Au sensing layer, after surface cleaning, and after DNA probe immobilization via thiol modification, respectively. The gradual decrease in CA indicates an increase in surface hydrophilicity during the surface modification process. This change can be attributed to the introduction of hydrophilic hydroxyl (–OH) groups during surface cleaning [37], as well as the presence of negatively charged phosphate groups in the immobilized DNA probe molecules [38].
Figure 13.
Contact angle measurements of the SAW sensing layer at different surface modification stages: as-fabricated sensing layer, after cleaning, and after thiol-DNA probe immobilization.
3.3.2. ZnO-SAW Biosensor on the Detection of Lung Cancer Biomarkers
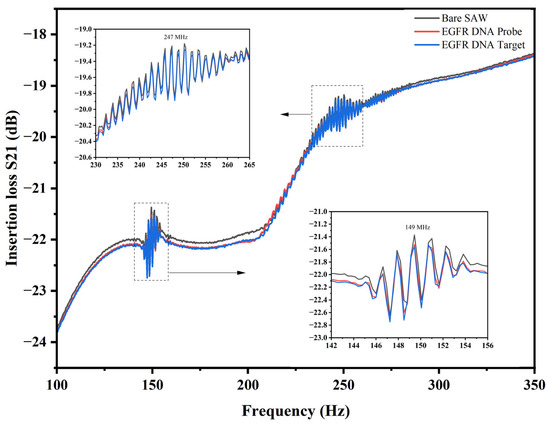
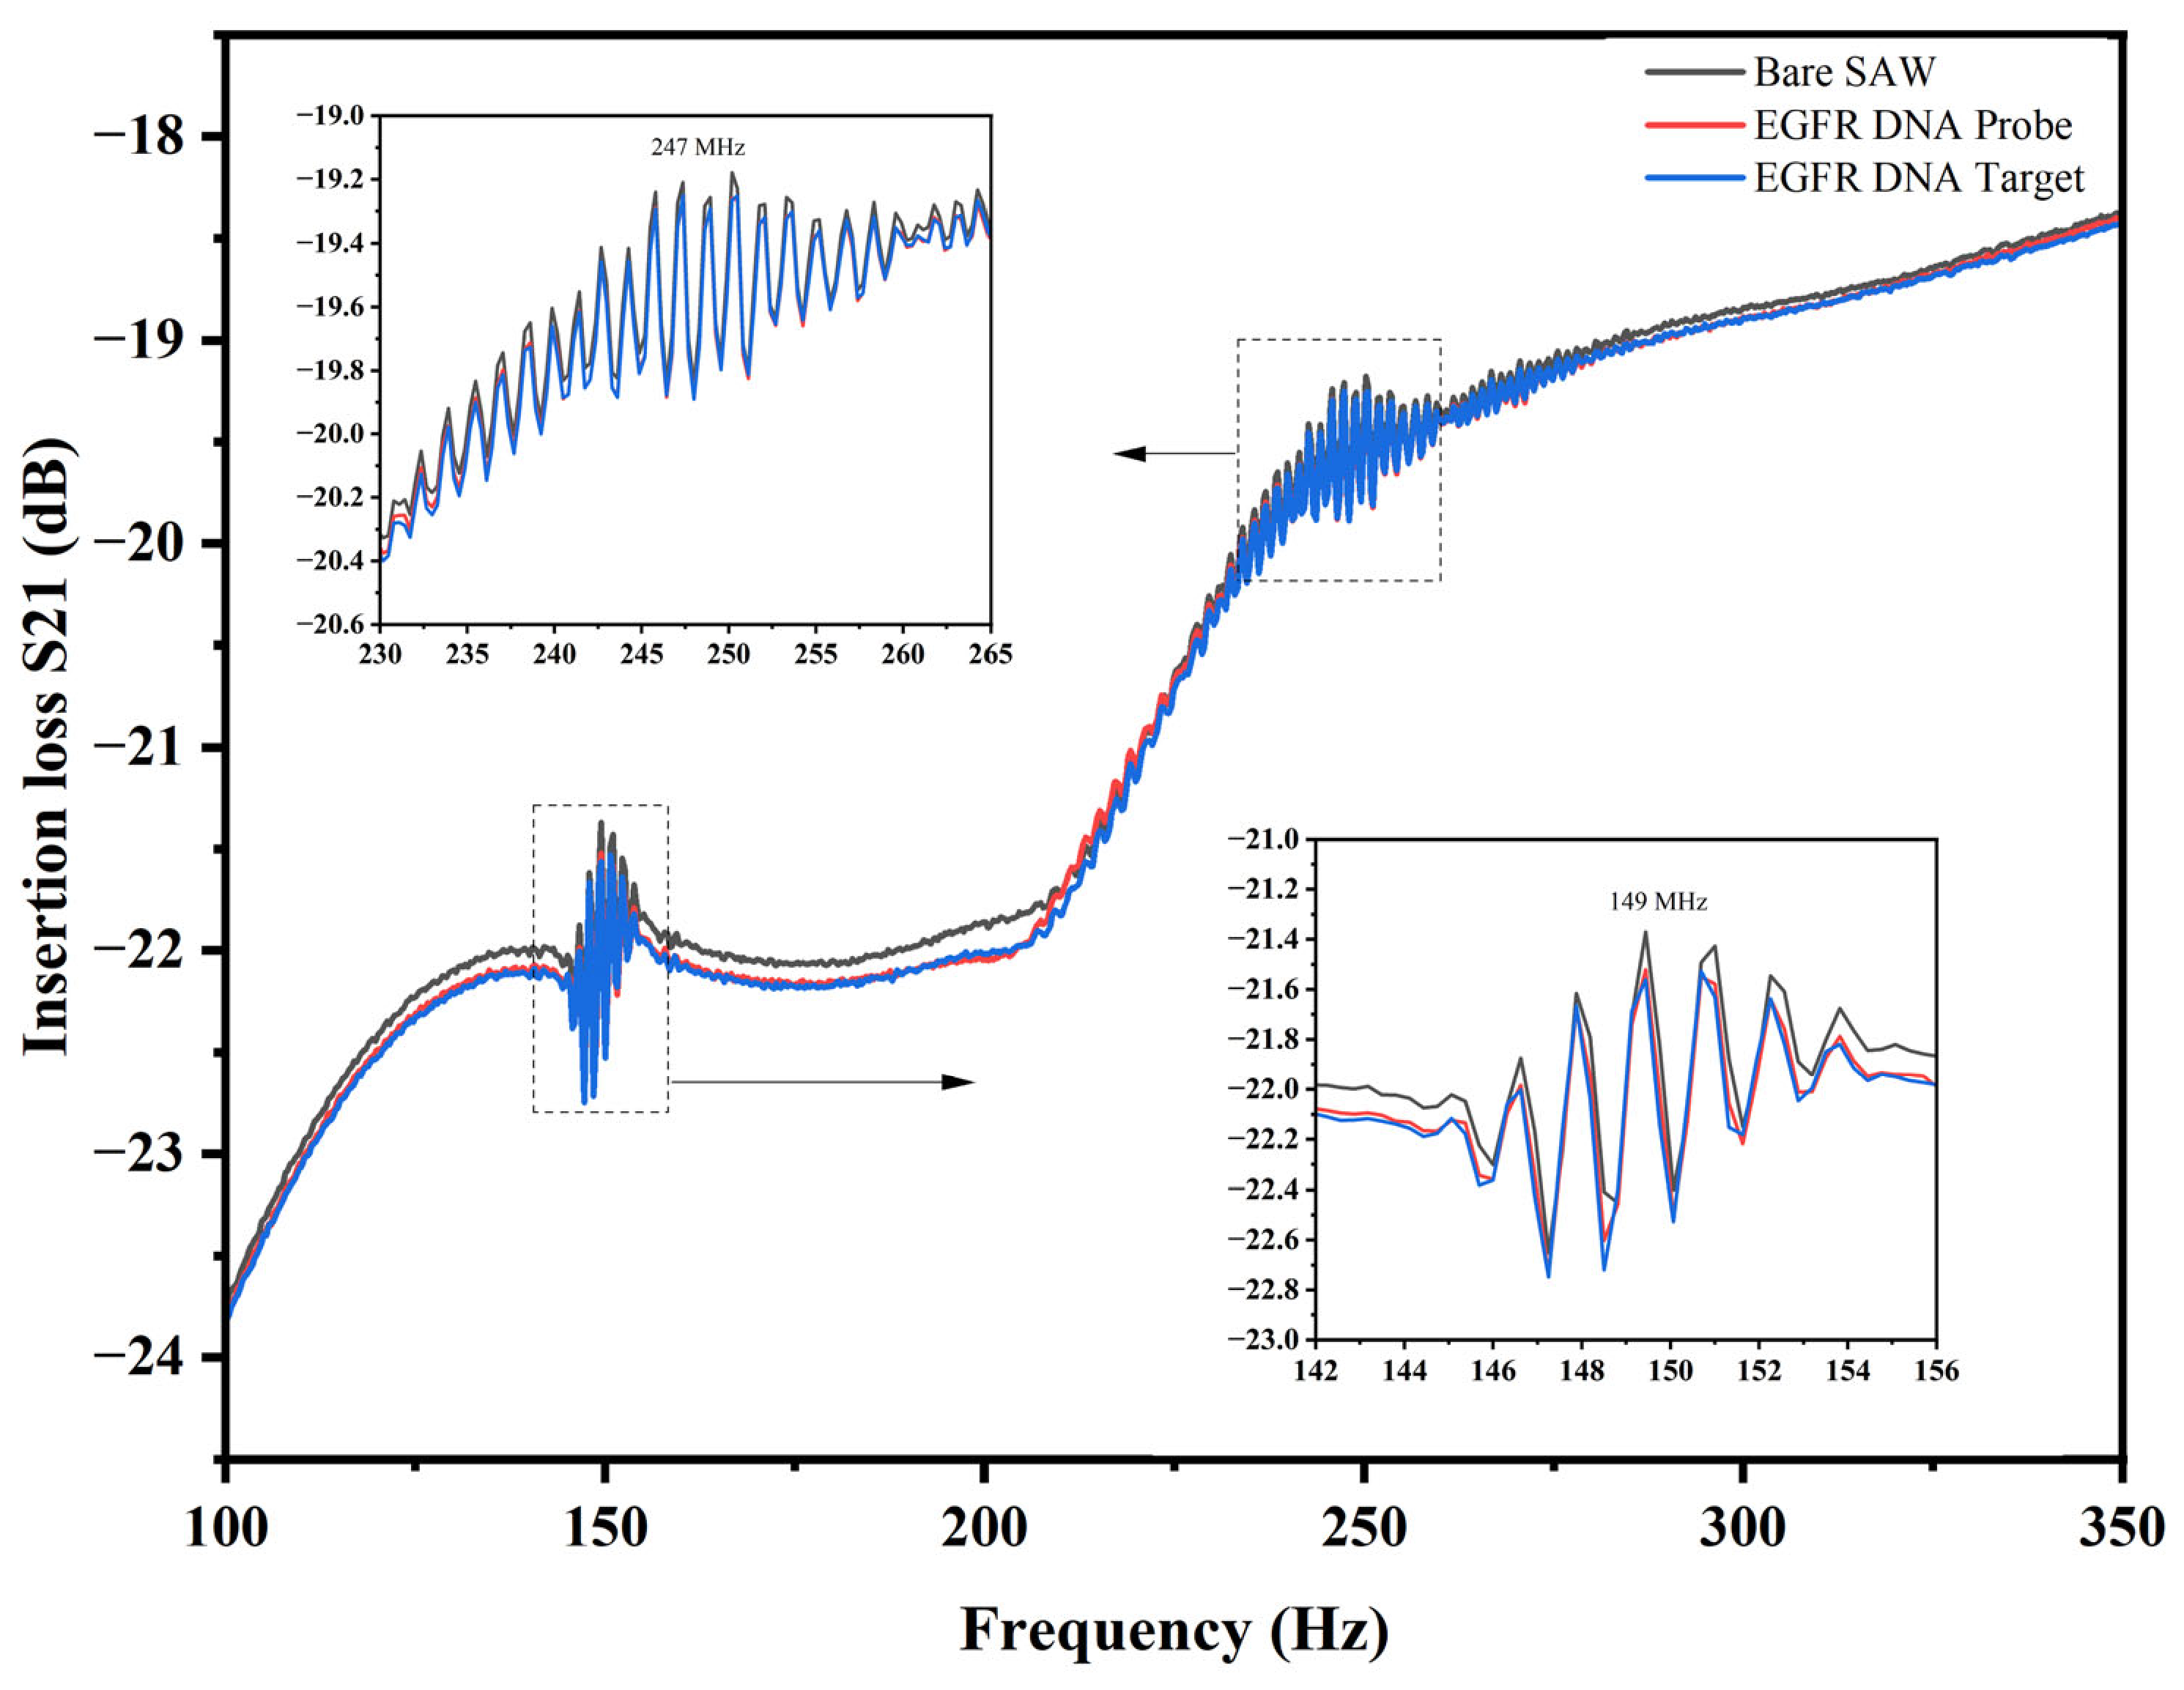
The sensing response was analyzed by monitoring the S21 parameter as a function of frequency. The fundamental resonance frequency of the bare SAW device was measured at 149.41 MHz, with an insertion loss of approximately −21.37 dB. A measurable frequency shift was observed, as shown in Figure 14. After EGFR DNA probe immobilization and subsequent EGFR DNA target hybridization, slight shifts in the resonance response were observed for both the Rayleigh and Sezawa-type modes. The inset figures further indicate resonance frequencies at around 149 MHz and 247 MHz, respectively.
Figure 14.
S21 insertion-loss response of the ZnO-based SAW biosensor measured at different stages, including the bare SAW device, after EGFR DNA probe immobilization, and after EGFR DNA target hybridization. The inset figures show the resonance responses at the Rayleigh mode (~149 MHz) and Sezawa-type mode (~247 MHz).
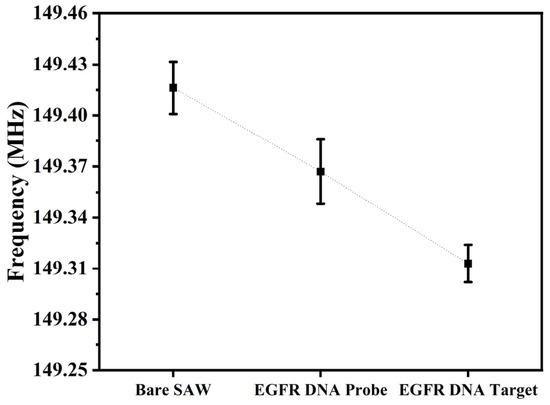
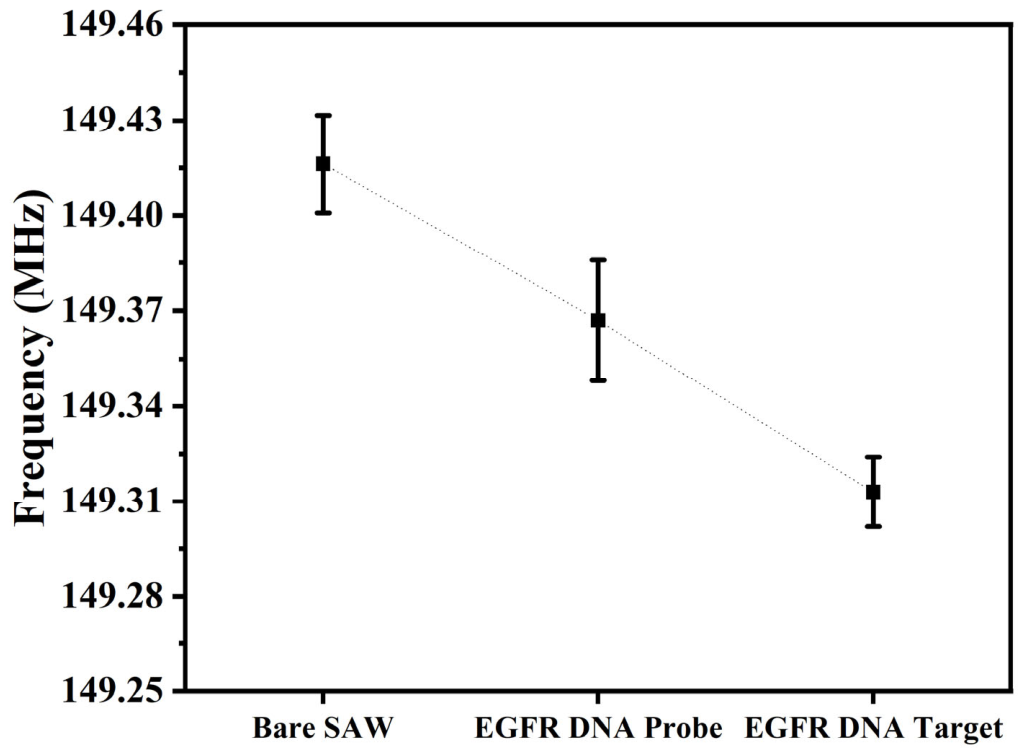
The observed frequency shifts are attributed to mass loading caused by biomolecular attachment on the Au sensing surface, which influences the propagation characteristics of the surface acoustic waves. Following modification of the active sensing layer with the immobilized exon 21 single-stranded DNA probe, the effective mass on the device surface increased, leading to a corresponding decrease in the resonance frequency, as illustrated in Figure 15. All measurements were performed in triplicate (n = 3). The mean resonance frequency of the bare SAW device was 149.416 ± 0.015 MHz. After immobilization of the EGFR DNA probe, the resonance frequency decreased to 149.367 ± 0.019 MHz, corresponding to a frequency shift of approximately 0.049 MHz. Following hybridization with the complementary EGFR DNA target, the resonance frequency further decreased to 149.313 ± 0.011 MHz. The frequency shifts were approximately 0.049 MHz after probe immobilization. This result confirms the effective immobilization of the exon 21 ssDNA probe and its subsequent hybridization with the complementary target sequence on the SAW sensing surface.
Figure 15.
Resonance frequencies of the ZnO-based SAW biosensor measured at different surface-modification stages: bare SAW device, after EGFR DNA probe immobilization, and after EGFR DNA target hybridization. Data are presented as mean ± standard deviation from three replicate measurements (n = 3).
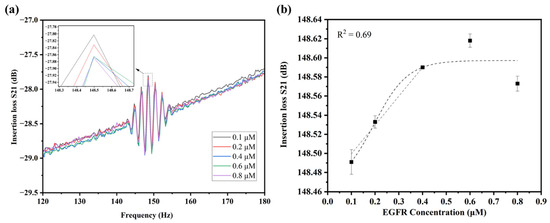
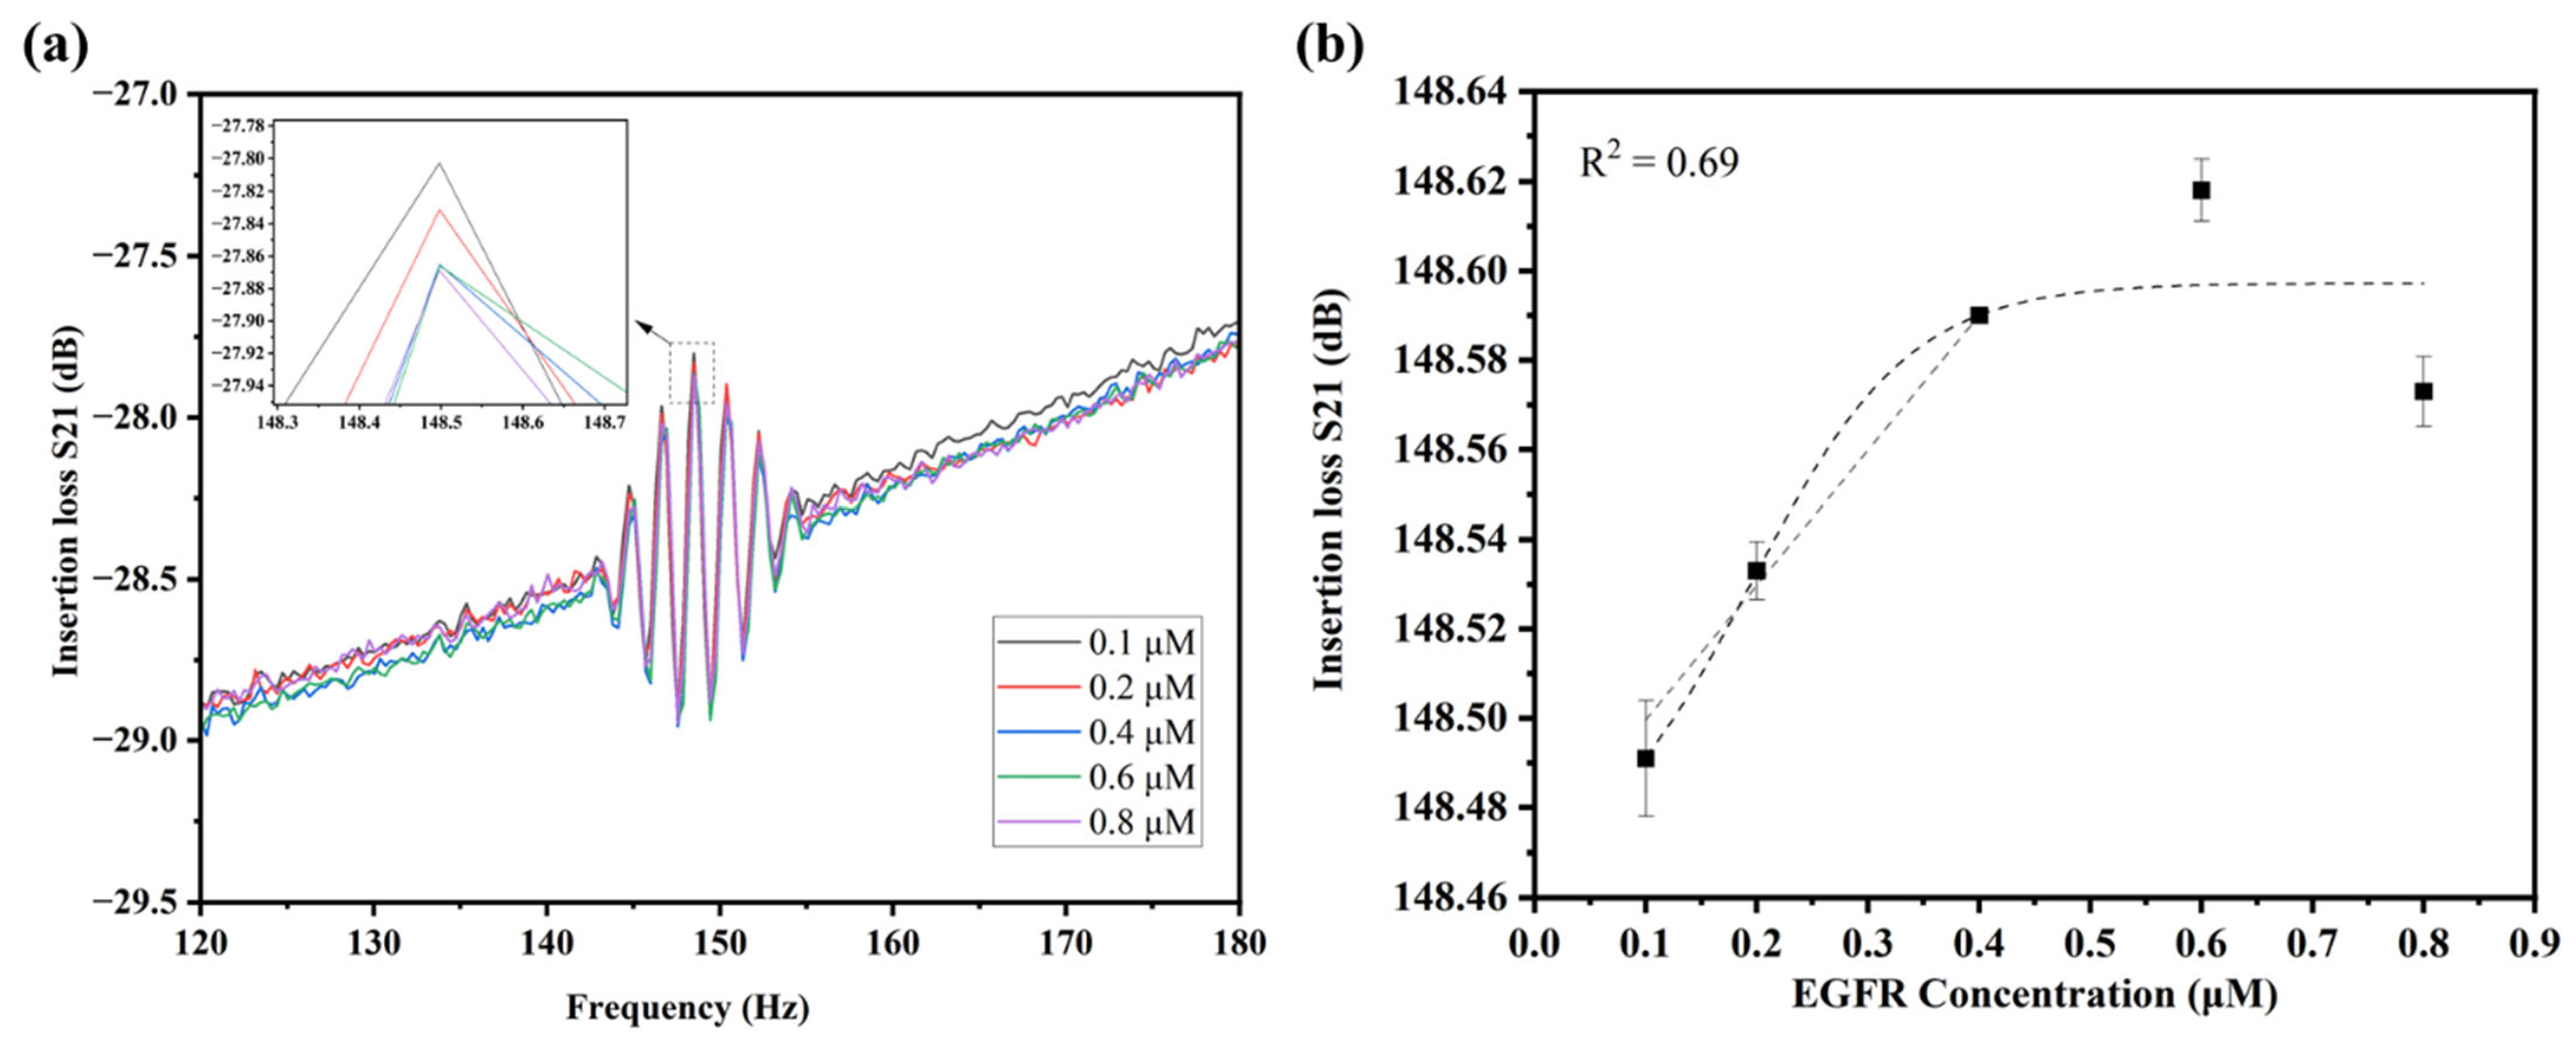
Figure 16a shows the S21 insertion-loss response of the ZnO-based SAW biosensor at EGFR concentrations from 0.1 to 0.8 µM. Each concentration had three replicate measurements (n = 3) and the resonance frequency values are summarized in Table 7. The resonance frequency shifted progressively as the EGFR concentration increased, particularly near 148.5 MHz, as shown in the inset. Figure 16b presents the relationship between resonance frequency shift and EGFR concentration. Linear regression over the concentration range of 0.1–0.4 µM produced the equation y = 301,271s[Conc.] + 1.48, with R2 = 0.69. This value reflects a moderate linear relationship within this range. The LOD was 0.09 µM according to the 3σ/slope criterion, where σ represents the standard deviation of the blank response. At concentrations above 0.6 µM, the response deviated from linearity, possibly because the sensing surface approached partial saturation relative to the immobilized probe concentration. This saturation reduces the number of available hybridizations sites and consequently decreases the incremental mass-loading response at higher target concentrations. Table 8 compares the analytical performance of representative SAW-based biosensors with that of the ZnO-based SAW biosensor developed in this study.
Figure 16.
Concentration-dependent response of the ZnO-based SAW biosensor to the EGFR L858R ssDNA target: (a) measured S21 insertion-loss spectra at target concentrations of 0.1, 0.2, 0.4, 0.6, and 0.8 µM, where each colored curve corresponds to one concentration as indicated in the legend, with the inset showing the magnified resonance region near 148.5 MHz; and (b) resonance frequency as a function of EGFR concentration, where symbols represent the mean of triplicate measurements, error bars denote the standard deviation, and the dashed line indicates the fitted response.
Table 7.
Resonance frequency of the ZnO-based SAW biosensor at different EGFR concentrations. Values are presented as mean ± standard deviation.
Table 8.
Comparison of the analytical performance of SAW-based biosensors.
4. Conclusions
This study presents an integrated framework for the design, fabrication, simulation, and experimental evaluation of ZnO-based SAW devices with an Au functional sensing layer. The ZnO/SiO2/Si structure showed close agreement between simulated and measured resonance frequencies, with deviations of approximately 1 MHz for the Rayleigh mode and 5 MHz for the Sezawa-type mode. In contrast, the ZnO/Si structure showed a larger deviation of approximately 11.4%, which may result from variations in IDT dimensions, ZnO film properties, residual stress, crystallographic texture, and measurement conditions. This discrepancy is therefore acknowledged as a limitation of the present model. Experimental on-wafer S21 measurements confirmed that the Au functional layer increased signal transmission by approximately 2 dB near the principal resonance, consistent with the FEA results. This result demonstrates that the Au layer acts not only as a biochemical interface but also as an acoustic component that affects wave transmission. However, residual insertion loss remained in both device configurations, which indicates the need for further improvement of the IDT geometry, impedance matching, and PCB integration. The Au surface successfully supported thiolated EGFR ssDNA probe immobilization and complementary target hybridization. The biosensor exhibited a linear response from 0.1 to 0.4 µM and achieved a limit of detection of 0.09 µM. These results demonstrate the feasibility of the ZnO-based SAW platform for label-free nucleic acid detection and provide a basis for future development toward higher sensitivity and clinical applications.
Author Contributions
Conceptualization, Methodology, Investigation, Data curation, and Writing—original draft preparation: T.S.; Methodology and Writing—review and editing: S.C., D.M., N.L.; Supervision, Investigation, and Reviewing: P.J.; Supervision: J.K.C.R.; Investigation: S.P.; Supervision, Funding acquisition, Project administration, Visualization, and Writing—review and editing: S.S. All authors have read and agreed to the published version of the manuscript.
Funding
This research was funded by Suranaree University of Technology Research and Development Fund (Grant No. IRD6-606-68-12-12).
Institutional Review Board Statement
Not applicable.
Informed Consent Statement
Not applicable.
Data Availability Statement
The datasets presented in this article are not readily available because they are part of an ongoing study and are being used for further research and commercial prototype development. Requests to access the datasets should be directed to the corresponding author.
Acknowledgments
The authors would like to thank Suranaree University of Technology, the Microelectronics Center, the Synchrotron Light Research Institute, and the University of Hyderabad for providing the necessary facilities and resources.
Conflicts of Interest
The authors declare no conflicts of interest.
Abbreviations
The following abbreviations are used in this manuscript:
| SAW | Surface acoustic wave |
| ZnO | Zinc oxide |
| FEA | Finite element analysis |
| FEM | Finite element method |
| IDT | Interdigital transducer |
| RF | Radio frequency |
| PML | Perfectly matched layer |
| VNA | Vector network analyzer |
| PCB | Printed circuit board |
| SEM | Scanning electron microscopy |
| FE-SEM | Field emission scanning electron microscopy |
| EGFR | Epidermal growth factor receptor |
| LOD | Limit of detection |
| ssDNA | Single-stranded deoxyribonucleic acid |
| DNA | Deoxyribonucleic acid |
| TCF | Temperature coefficient of frequency |
| CA | Contact angle |
| TMAH | Tetramethylammonium hydroxide |
References
- Ramaraj, S.G.; Alrebh, A.; Elamaran, D.; Zhou, H.; Huang, K.; Almansoori, M.; Yamahara, H.; Tabata, H. Surface acoustic wave gas Sensors: Recent developments and their role in sensing technology. Mater. Sci. Eng. B 2025, 317, 118157. [Google Scholar] [CrossRef] [Scilit]
- Aleixandre, M.; Horrillo, M.C. Recent Advances in SAW Sensors for Detection of Cancer Biomarkers. Biosensors 2025, 15, 88. [Google Scholar] [CrossRef] [Scilit] [PubMed]
- Huang, W.; Yang, Q.; Liao, J.; Ramadan, S.; Fan, X.; Hu, S.; Liu, X.; Luo, J.; Tao, R.; Fu, C. Integrated Rayleigh wave streaming-enhanced sensitivity of shear horizontal surface acoustic wave biosensors. Biosens. Bioelectron. 2024, 247, 115944. [Google Scholar] [CrossRef] [Scilit] [PubMed]
- Caliendo, C.; Laidoudi, F. Experimental and Theoretical Study of Multifrequency Surface Acoustic Wave Devices in a Single Si/SiO2/ZnO Piezoelectric Structure. Sensors 2020, 20, 1380. [Google Scholar] [CrossRef] [Scilit] [PubMed]
- Tiwari, V.; Makita, K.; Arino, M.; Morita, M.; Crozes, T.; Bellet-Amalric, E.; Kuroda, S.; Boukari, H.; Besombes, L. Radio-frequency stress-induced modulation of CdTe/ZnTe quantum dots. J. Appl. Phys. 2020, 127, 234303. [Google Scholar] [CrossRef] [Scilit]
- Nawaz, F.; Kim, S.; Lee, H.; Park, J.; Song, J.; Choi, C.; Lee, K. Toward Ultrafast Response and Recovery Characteristics Through ZnO Multilayer Thin Films in Surface Acoustic Wave UV Sensor. IEEE Sens. J. 2025, 25, 343–353. [Google Scholar] [CrossRef] [Scilit]
- Pasupuleti, K.S.; Reddeppa, M.; Nam, D.-J.; Bak, N.-H.; Peta, K.R.; Cho, H.D.; Kim, S.-G.; Kim, M.-D. Boosting of NO2 gas sensing performances using GO-PEDOT:PSS nanocomposite chemical interface coated on langasite-based surface acoustic wave sensor. Sens. Actuators B Chem. 2021, 344, 130267. [Google Scholar] [CrossRef] [Scilit]
- Chu, Y.B.; Zhang, Y. Design of SAW based MEMS device for self-powered electronics using artificial intelligence technique. Energy Rep. 2022, 8, 90–97. [Google Scholar] [CrossRef] [Scilit]
- Mandal, D.; Bovender, T.; Geil, R.D.; Sahoo, D.; Banerjee, S. Surface acoustic waves (SAW) sensor for the active detection of Microcystin-LR (Cyanobacteria). Sens. Bio-Sens. Res. 2025, 47, 100724. [Google Scholar] [CrossRef] [Scilit]
- Ji, J.; Yang, C.; Zhang, F.; Shang, Z.; Xu, Y.; Chen, Y.; Chen, M.; Mu, X. A high sensitive SH-SAW biosensor based 36° Y-X black LiTaO3 for label-free detection of Pseudomonas Aeruginosa. Sens. Actuators B Chem. 2019, 281, 757–764. [Google Scholar] [CrossRef] [Scilit]
- Rauf, S.; Luo, J.; Qazi, H.I.A.; Sohail, M.; Tao, R.; Fu, C.; Rauf, S.; Ahmad, I.; Iqbal, H.M.N.; Li, H. A novel leaky surface acoustic wave biosensor for detection of PKA activity in cell lysates based on peptide biomineralized metal nanoclusters. Sens. Actuators A Phys. 2023, 351, 114107. [Google Scholar] [CrossRef] [Scilit]
- Brookes, J.; Bufacchi, R.; Kondoh, J.; Duffy, D.M.; McKendry, R.A. Determining biosensing modes in SH-SAW device using 3D finite element analysis. Sens. Actuators B Chem. 2016, 234, 412–419. [Google Scholar] [CrossRef] [Scilit]
- Jaafar, M.M.; Mohd Razip Wee, M.F.; Nguyen, H.-T.-N.; Hieu, L.T.; Rai, R.; Sahoo, A.K.; Dee, C.F.; Chang, E.Y.; Yeop Majlis, B.; Tee, C.A. Surface Acoustic Wave Propagation of GaN/Sapphire Integrated with a Gold Guiding Layer. Sensors 2023, 23, 2464. [Google Scholar] [CrossRef] [Scilit] [PubMed]
- Li, X.; Sun, W.; Fu, W.; Lv, H.; Zu, X.; Guo, Y.; Gibson, D.; Fu, Y.-Q. Advances in sensing mechanisms and micro/nanostructured sensing layers for surface acoustic wave-based gas sensors. J. Mater. Chem. A 2023, 11, 9216–9238. [Google Scholar] [CrossRef] [Scilit]
- Abu Waar, Z.; Moustafa, M. Design and Analysis of SAW Gas Sensor Utilizing AIN/Diamond/Si Multilayered Structure for VOCs Detection. J. Electron. Mater. 2024, 53, 5255–5264. [Google Scholar] [CrossRef] [Scilit]
- Zeng, Y.; Yuan, R.; Fu, H.; Xu, Z.; Wei, S. Foodborne pathogen detection using surface acoustic wave biosensors: A review. RSC Adv. 2024, 14, 37087–37103. [Google Scholar] [CrossRef] [Scilit] [PubMed]
- Pomorska, A.; Shchukin, D.; Hammond, R.; Cooper, M.A.; Grundmeier, G.; Johannsmann, D. Positive Frequency Shifts Observed Upon Adsorbing Micron-Sized Solid Objects to a Quartz Crystal Microbalance from the Liquid Phase. Anal. Chem. 2010, 82, 2237–2242. [Google Scholar] [CrossRef] [Scilit] [PubMed]
- Raha, S.; Ahmaruzzaman, M. ZnO nanostructured materials and their potential applications: Progress, challenges and perspectives. Nanoscale Adv. 2022, 4, 1868–1925. [Google Scholar] [CrossRef] [Scilit] [PubMed]
- Lin, Q.; Zhao, C.; Li, M.; Xu, H. Recent Progress in Surface Acoustic Wave Sensors Based on Low-Dimensional Materials and Their Applications. Chemosensors 2024, 12, 255. [Google Scholar] [CrossRef] [Scilit]
- Aslam, M.Z.; Zhang, H.; Sreejith, V.S.; Naghdi, M.; Ju, S. Advances in the surface acoustic wave sensors for industrial applications: Potentials, challenges, and future directions: A review. Measurement 2023, 222, 113657. [Google Scholar] [CrossRef] [Scilit]
- Pang, H.-F.; Tao, R.; Luo, J.; Zhou, X.; Zhou, J.; McHale, G.; Reboud, J.; Torun, H.; Gibson, D.; Tao, K.; et al. Rayleigh and shear-horizontal surface acoustic waves simultaneously generated in inclined ZnO films for acoustofluidic lab-on-a-chip. Surf. Coat. Technol. 2022, 442, 128336. [Google Scholar] [CrossRef] [Scilit]
- Fu, Y.-Q.; Pang, H.-F.; Torun, H.; Tao, R.; McHale, G.; Reboud, J.; Tao, K.; Zhou, J.; Luo, J.; Gibson, D.; et al. Engineering inclined orientations of piezoelectric films for integrated acoustofluidics and lab-on-a-chip operated in liquid environments. Lab Chip 2021, 21, 254–271. [Google Scholar] [CrossRef] [Scilit] [PubMed]
- Cao, G.; Wang, H.; Zhang, P. Analysis of the Effects of Parameters on the Performance of Resonators Based on a ZnO/SiO2/Diamond Structure. Appl. Sci. 2024, 14, 874. [Google Scholar] [CrossRef] [Scilit]
- Laidoudi, F.; Boubenider, F.; Caliendo, C.; Hamidullah, M. Numerical Investigation of Rayleigh, Sezawa and Love Modes in C-Axis Tilted ZNO/SI for Gas and Liquid Multimode Sensor. J. Mech. 2020, 36, 7–18. [Google Scholar] [CrossRef] [Scilit]
- Cheng, C.; Lu, Z.; Yang, J.; Gong, X.; Ke, Q. Modulating the Performance of the SAW Strain Sensor Based on Dual-Port Resonator Using FEM Simulation. Materials 2023, 16, 3269. [Google Scholar] [CrossRef] [Scilit] [PubMed]
- Abraham, N.; Reshma Krishnakumar, R.; Unni, C.; Philip, D. Simulation studies on the responses of ZnO-CuO/CNT nanocomposite based SAW sensor to various volatile organic chemicals. J. Sci. Adv. Mater. Devices 2019, 4, 125–131. [Google Scholar] [CrossRef] [Scilit]
- Maouhoub, S.; Aoura, Y.; Mir, A. FEM simulation of Rayleigh waves for SAW devices based on ZnO/AlN/Si. Microelectron. Eng. 2015, 136, 22–25. [Google Scholar] [CrossRef] [Scilit]
- Sonklin, T.; Munthala, D.; Leuasoongnoen, P.; Janphuang, P.; Pojprapai, S. Effect of substrate-tilting angle-dependent grain growth and columnar growth in ZnO film deposited using radio frequency (RF) magnetron sputtering method. J. Mater. Sci. Mater. Electron. 2022, 33, 16977–16986. [Google Scholar] [CrossRef] [Scilit]
- Büyükköse, S.; Vratzov, B.; Ataç, D.; van der Veen, J.; Santos, P.V.; van der Wiel, W.G. Ultrahigh-frequency surface acoustic wave transducers on ZnO/SiO2/Si using nanoimprint lithography. Nanotechnology 2012, 23, 315303. [Google Scholar] [CrossRef] [Scilit] [PubMed]
- Lei, Y.; Hu, H.; Chen, J.; Zhang, P. Microfluidic Jetting Deformation and Pinching-off Mechanism in Capillary Tubes by Using Traveling Surface Acoustic Waves. Actuators 2020, 9, 5. [Google Scholar] [CrossRef] [Scilit]
- Liang, X.; Zhang, Y.; Xu, F.; Tan, Q.; Zhang, J. Simulation Design of Surface Acoustic Wave Sensor Based on Langasite Coplanar Integration with Multiple Parameters. Micromachines 2022, 13, 705. [Google Scholar] [CrossRef] [Scilit] [PubMed]
- Mandal, D.; Banerjee, S. Surface Acoustic Wave (SAW) Sensors: Physics, Materials, and Applications. Sensors 2022, 22, 820. [Google Scholar] [CrossRef] [Scilit] [PubMed]
- Lee, D.-S.; Lee, J.; Fu, Y.Q.; Milne, W.; Sunglyul, M.; Jung, M.; Park, S.; Yoon, H. A Surface Acoustic Wave-Based Immunosensing Device Using a Nanocrystalline ZnO Film on Si. J. Nanosci. Nanotechnol. 2009, 9, 7181–7185. [Google Scholar] [CrossRef] [Scilit] [PubMed]
- Aslam, M.Z.; Jeoti, V.; Karuppanan, S.; Malik, A.F.; Iqbal, A. FEM Analysis of Sezawa Mode SAW Sensor for VOC Based on CMOS Compatible AlN/SiO2/Si Multilayer Structure. Sensors 2018, 18, 1687. [Google Scholar] [CrossRef] [Scilit] [PubMed]
- Li, L.; Wang, F.; Li, K.; Han, Y.; Hu, K.; Sun, Z.; Xie, Y.; Kong, D.; Song, D.; Qian, L.; et al. Effect of interdigital transducers structure on insertion loss of high-frequency surface acoustic wave devices. J. Mater. Sci. Mater. Electron. 2022, 33, 22017–22026. [Google Scholar] [CrossRef] [Scilit]
- Sonklin, T.; Tongpeng, S.; Munthala, D.; Suksaweang, S.; Janphuang, P.; Bharti, A.; Mathur, A.; Avasthi, D.K.; Jiansirisomboon, S.; Pojprapai, S. Development of gold nanospikes-modified quartz crystal microbalance biosensor for prostate specific antigen detection. Surf. Interfaces 2024, 45, 103877. [Google Scholar] [CrossRef] [Scilit]
- Yang, X.M.; Zhong, Z.W.; Diallo, E.M.; Wang, Z.H.; Yue, W.S. Silicon wafer wettability and aging behaviors: Impact on gold thin-film morphology. Mater. Sci. Semicond. Process. 2014, 26, 25–32. [Google Scholar] [CrossRef] [Scilit]
- Munthala, D.; Sonklin, T.; Chanlek, N.; Mathur, A.; Roy, S.; Avasthi, D.K.; Suksaweang, S.; Pojprapai, S. Portable DNA Probe Detector and a New Dry-QCM Approach for SARS-CoV-2 Detection. Technologies 2025, 13, 114. [Google Scholar] [CrossRef] [Scilit]
- Zhang, Y.; Yang, F.; Sun, Z.; Li, Y.-T.; Zhang, G.-J. A surface acoustic wave biosensor synergizing DNA-mediated in situ silver nanoparticle growth for a highly specific and signal-amplified nucleic acid assay. Analyst 2017, 142, 3468–3476. [Google Scholar] [CrossRef] [Scilit] [PubMed]
- Di Pietrantonio, F.; Benetti, M.; Cannatà, D.; Verona, E.; Girasole, M.; Fosca, M.; Dinarelli, S.; Staiano, M.; Marzullo, V.M.; Capo, A.; et al. A Shear horizontal surface acoustic wave biosensor for a rapid and specific detection of d-serine. Sens. Actuators B Chem. 2016, 226, 1–6. [Google Scholar] [CrossRef] [Scilit]

Disclaimer/Publisher’s Note: The statements, opinions and data contained in all publications are solely those of the individual author(s) and contributor(s) and not of MDPI and/or the editor(s). MDPI and/or the editor(s) disclaim responsibility for any injury to people or property resulting from any ideas, methods, instructions or products referred to in the content. |
© 2026 by the authors. Licensee MDPI, Basel, Switzerland. This article is an open access article distributed under the terms and conditions of the Creative Commons Attribution (CC BY) license.