


Abstract
In this study, two low-concentration solutions of 1,4,5,8-Naphthalene tetracarboxylic dianhydride (NTCDA) in two imidazolium-based ionic liquids (IL), EMIM-DCA and EMIM-Ac, at room temperature were mixed; after around ten days of storage, the formation of two variants of electron-withdrawing molecules of Naphthalene tetracarboxylic diimide NTCDI-R derivatives were detected. Their radical anions (RA) were registered by EPR via irradiating the resulting mixture of both solutions with visible or UV light. Chemical shift recording and precise concentration control of NTCDA in ionic liquid solutions were accomplished using 500 MHz and 700 MHz 1H NMR. The formation of the NTCDA•− upon light illumination was also confirmed by NMR, which showed paramagnetic broadening of the 1H line due to the electron chemical exchange between NTCDA and NTCDA•− after light-on and light-off modes. The time-dependent line broadening is in quantitative agreement with the corresponding EPR data for the light-on-/light-off-dependent concentration of NTCDA•−. The putative structure of R in NTCDI-R was calculated by DFT. The possibility of using NTCDI-R•− as a spin probe for studying molecular diffusion in high viscous ionic liquid is assessed.
1. Introduction
Naphthalene tetracarboxylic diimide (NTCDI) and its first homologue, perylene tetracarboxylic diimide (PTCDI), which belongs to the class of arylene diimides, have attracted the attention of researchers due to their unique functional properties, such as electron affinity, charge carrier mobility, and thermal and oxidative stability. These properties make them promising for applications in organic electronics, including organic field-effect transistors (OFETs) [1], organic solar cells (OSCs) [2], and organic light-emitting diodes (OLEDs) [3]. Interest is focused on the structural and functional properties of new Naphthalene diimide (NDI) and perylene diimide (PDI) derivatives depending on the composition and architecture of their attached chains. Indeed, the range of properties and applications of arylene diimides (hereinafter referred to as NTCDI-R and PTCDI-R derivatives) has expanded significantly over the past two to three decades due to numerous modifications of the NTCDI-R and PTCDI-R structures using various molecular functional fragments and units, including those with supramolecular bonds of the H∙∙∙O, H∙∙∙N, π–π type and charge-transfer complexes [4]. These modifications selectively influence the functional properties and similarly selectively expand the scope of applications, likely dominating in electrical energy storage devices [5,6,7,8]. The motivation to study NTCDI-R using electron paramagnetic resonance (EPR) is mainly connected with the high probability of NTCDI-R radical anion (RA) formation in the electron-donor medium under light excitation in the “on/off” mode, i.e., the possibility of externally controlling the radical concentration, eliminating direct mechanical contact with the solution containing the radical ions. This makes the diffusion-controlled kinetics of ion-radical formation/dissociation in IL more convenient for studying charge mobility in IL electrolytes. The transport of ions in ILs is often limited by their high viscosities; therefore, mixing them with low-viscous organic solvents (OS) or combining them with other ILs [9] must be taken into consideration in terms of electrolyte parameters. The analysis of EPR spectra of IL/OS mixtures as a function of their relative parts is presented in [10]. Magnetic resonance methods are currently suitable for studying organic (metal-free) energy storage devices. The electrochemical characteristics of which have already been described in the literature [11], where the electrodes used are the n/p-type organic materials polyimide/polytriphenylamine, respectively, and the electrolyte is a pure EMI-TFSI ionic liquid. This combination also exhibits more efficient characteristics compared to the metal–organic pair described in [11].
The synthesis of NTCDI-R is based on the reaction of 1,4,5,8- Naphthalene tetracarboxylic dianhydride (NTCDA) with the R-NH2 amines, resulting in the replacement of two axial oxygen atoms by nitrogen, as shown below.
NTCDA + R-NH2 → NTCDI-R
R = H NTCDA + NH3 → NTCDI-H +H2O
Although R-NH2 is formally absent from the reaction mixture, the formation of NTCDI-R could be expected due to residual impurities, most likely associated with the synthesis of the EMIM+ cation, given that imidazolium is most often prepared by quaternization of the imidazole ring using the –CnH2n+1 (n = 1,2…) alkyl chain [12]. The presence of R2 = -CH2-CH3 is confirmed by RA EPR data of NTCDI-R2 discussed later. The second registered NTCDI-R corresponds to R1 = H (1a) due to residual ammonium compounds, most likely accumulated as a result of the of the main imidazole ring by the Debus-Radziszewski method [13]. Here the NMR data indicate an even higher concentration of all impurities compared to the working concentration of NTCDA limited by the low solubility. NMR analysis data and comments regarding the qualitative assessment of the relative amounts of reagents namely ammonium and ethylamine in the working solutions are placed in Supplementary Materials SM-1a [14,15,16,17,18]. Thus 1H NMR and EPR experiments confirm that absolute and relative concentrations of reactants NTCDA, ammonium or ethylamine support the formation of NTCDI-R reactions shown in (1).
In this study, NTCDI-R was detected in all experiments leading the same protocol and was subsequently used for: (a) their structure identification by EPR and DFT on possible versions of unknown exactly Rj substituents in NTCDI-R, (b) assessing it as spin probe(s) for their rotational and translation diffusions studied in ILs and their mixtures with each other as well with organic solvents. It should be emphasized that the current experiments with NTCDI-R were a planned continuation of the work begun in [10] with NTCDA-IL solutions to test NTCDI-R derivatives as light-induced spin probes for RA or, more likely, spin labels for molecular diffusion experiments in imidazolium-based ionic liquid solutions using EPR. The 1H NMR experiment confirmed the possibility of light-induced detection of NTCDA RA by electron chemical exchange detection.
2. Materials and Methods
Two imidazolium-based RTILs from Ionic Liquids Technologies (IoLiTec) GmbH (Heilbronn, Germany) have been used in this study: 1-Ethyl-3-methylimidazolium dicyanamide (EMIM-DCA) > 98%, 1-Ethyl-3-methylimidazolium acetate (EMIM-Ac), ≥95% and NTCDA in Merck. The samples for EPR experiments were prepared as NTCDA filtered solutions in EMIM-DCA and EMIM-Ac with the concentrations of 0.6 × 10⁻³ mol/L. NTCDA:EMIM-DCA and NTCDA:EMIM-Ac working solutions were prepared for use after being stored unopened in a dark place for at least 24 h. Note, the comparison of EPR spectra of the filtered and unfiltered solutions does not indicate an influence of a possible residual undiluted solid state fraction of NTCDA with particles sizes < 0.2 nm [10]. The measurements were carried out in the temperature range between 295 and 335 K. The X-band EPR spectra were recorded using a CW Bruker spectrometer ELEXYS E500 (Bruker BioSpin, Ettlingen, Germany) operated at ~9.4 GHz/0.35 T (X-band) microwave frequency. For the light excitation of NTCDI solutions a 50-mW diode laser operated on 532 nm (Changsha Hetong Technology Co., Ltd. Changsha, China) for the CW photolysis has been used. An optical transmission resonator, ER 4104OR (Bruker BioSpin, Ettlingen, Germany), provided a simple pathway for the light inside EPR cavity. To exclude undesirable line broadening connected with the saturation and overmodulation of narrow EPR spectra in NTCDA solutions, the microwave power Pμw and magnetic field modulation amplitude Hmod were not exceeded 0.5 mW and 0.02 mT respectively.
3. Results and Discussion
3.1. EPR
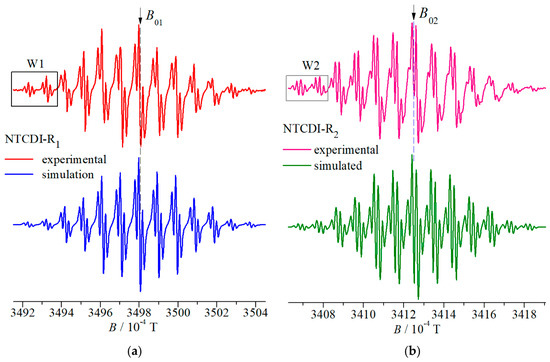
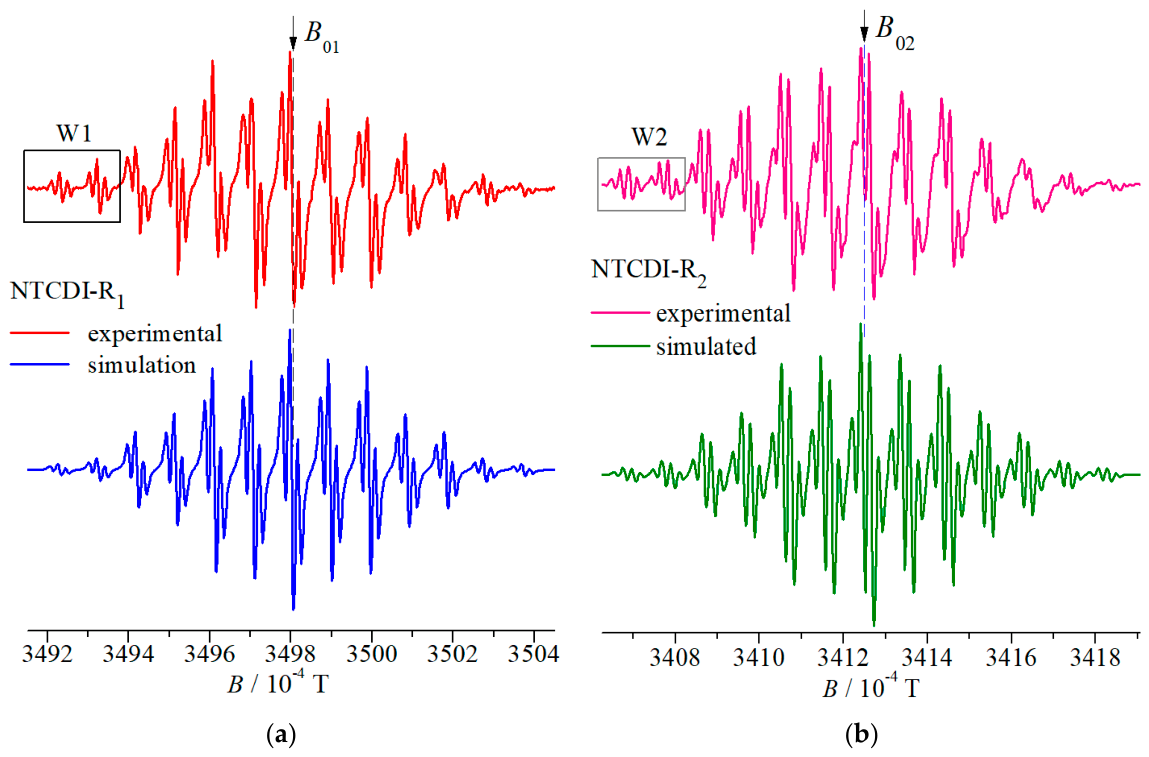
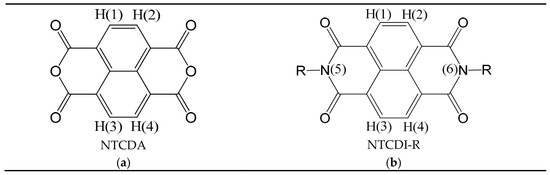
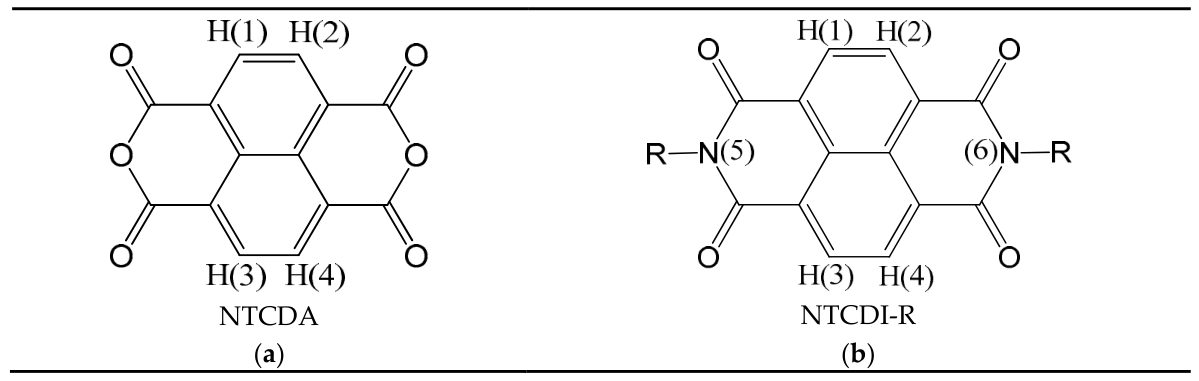
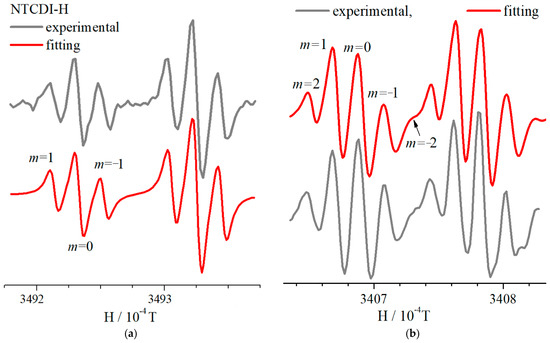
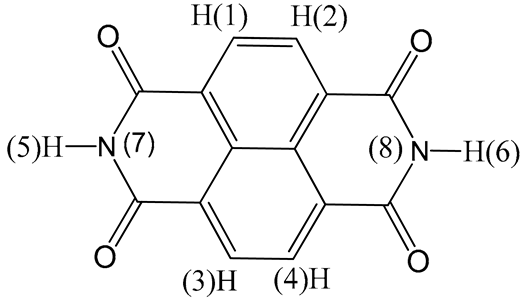
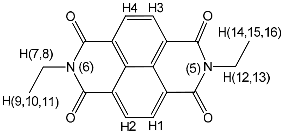
EPR of NTCDA and NTCDI-R RAs research were started probably in [19]. Their experimental hfc parameters of aromatic rings and partially side chains are available for the analysis of resolved experimental NTCDI EPR spectra Figure 1a,b due to the small value of the hfc linewidth ΔBm in the absence of (a) magnetic field overmodulation and (b) microwave power saturation. The electron spin densities distribution decreases significantly with distance from the center of NTCDI-R (the center of symmetry of NTCDI-H) and resolved EPR spectra visually consists of 13 basic lines attributed to spectrum assigned (see Figure 2a,b) to four equivalent 1H 4H(1,2,3,4), with the total nuclear spin I4H = 4(1/2) = 2, m4H = 2, 1, 0, −1, −2, as well as 2N(5,6), with I2N = 2(1) = 2 m2 = 2, 1, 0, −1, −2 for two equivalent 14N. This hfc spectrum structure relates to the cases with ARj << A4H, AN, and/or two times deprotonated NTCDI-H, i.e., (NTCDI)•− •− [19]. The isotropic constants A of NTCDI-H in Figure 3 and corresponding to figure text are designated as isotropic A1 = A4H ≈ 1.95 ± 0.05 × 10⁻⁴ T (G), A2 = AN ≈ A1/2, as well as Aj(R) of other protons 1Hj on the side chains R are presented in Table 1 and Table 2 and assigned in Figure 3. Figure 1a,b shows two main variants of experimental and pre-simulated NTCDI-Rj spectra corresponding to different Rj structures. The experimental spectra in Figure 1a,b demonstrate unequal line widths of the hfc components in the low- and high-field parts relative to B01 and B02, attributed to Zeeman transitions with isotropic g-factors g01,2. This effect of the influence of the magnetic anisotropy of paramagnetic on the line width of hfc components with different mI in solutions is well known and is widely used in EPR to study the dynamics of rotational and translational diffusion of organic radicals and organometallic complexes in the liquid phase, for example, in solutions of organic solvents. Note that both simulated spectra in Figure 1a,b were constructed with a single (individual for each spectrum) line width using the Lorentz function (the first derivative of absorption line). Some theoretical data from the literature concerning the features of hfc lines in liquids caused by the anisotropy of hyperfine interactions are presented in SM-2 [20,21,22] in the same format in which they were presented by us in our previous work [10].
Figure 1.
(a) Experimental (T = 295 K) and simulated spectra of NTCDI-R1 show a well resolved triplet (1:2:1) of the hfc structure in W1 region, very likely ascribed to the structure with R1 = H, and is discussed in details later. (b) Similar spectra of NTCDI-R2 with a well-resolved “quartet”/(quintet) could be assigned to R2 = CH2-CH3. The spectrum part in the W2 is discussed later. In both (a,b) simulated spectra have the same hfc linewidth ΔBm=0 = 0.088 × 10⁻⁴ Tesla and simulated only for the qualitative presentation of correct hfc data. Note that the fitting of complete spectra has not idea in this case taking in mind that all parameters are available from the not overlapped parts of spectra (W1 and W2 in (a,b)) and appropriate fitting data are placed below and discussed later.
Figure 2.
Electron acceptors structures: (a) NTCDA, (b) NTCDI-Rj [R1 = H and R2 =CH2-CH3 as supposed by fitting of experimental spectra and DFT hfc computing.
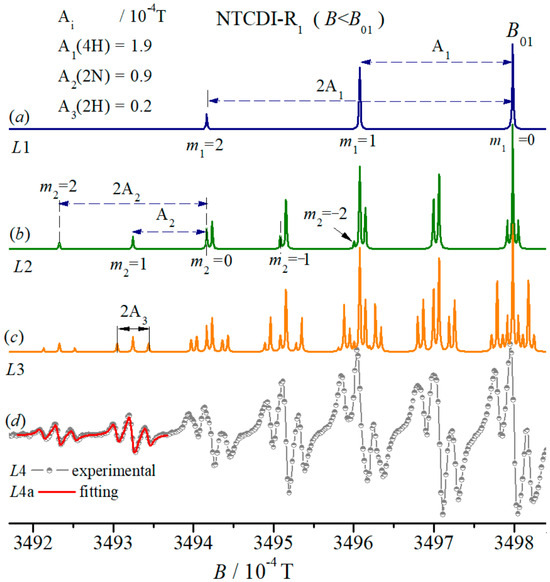
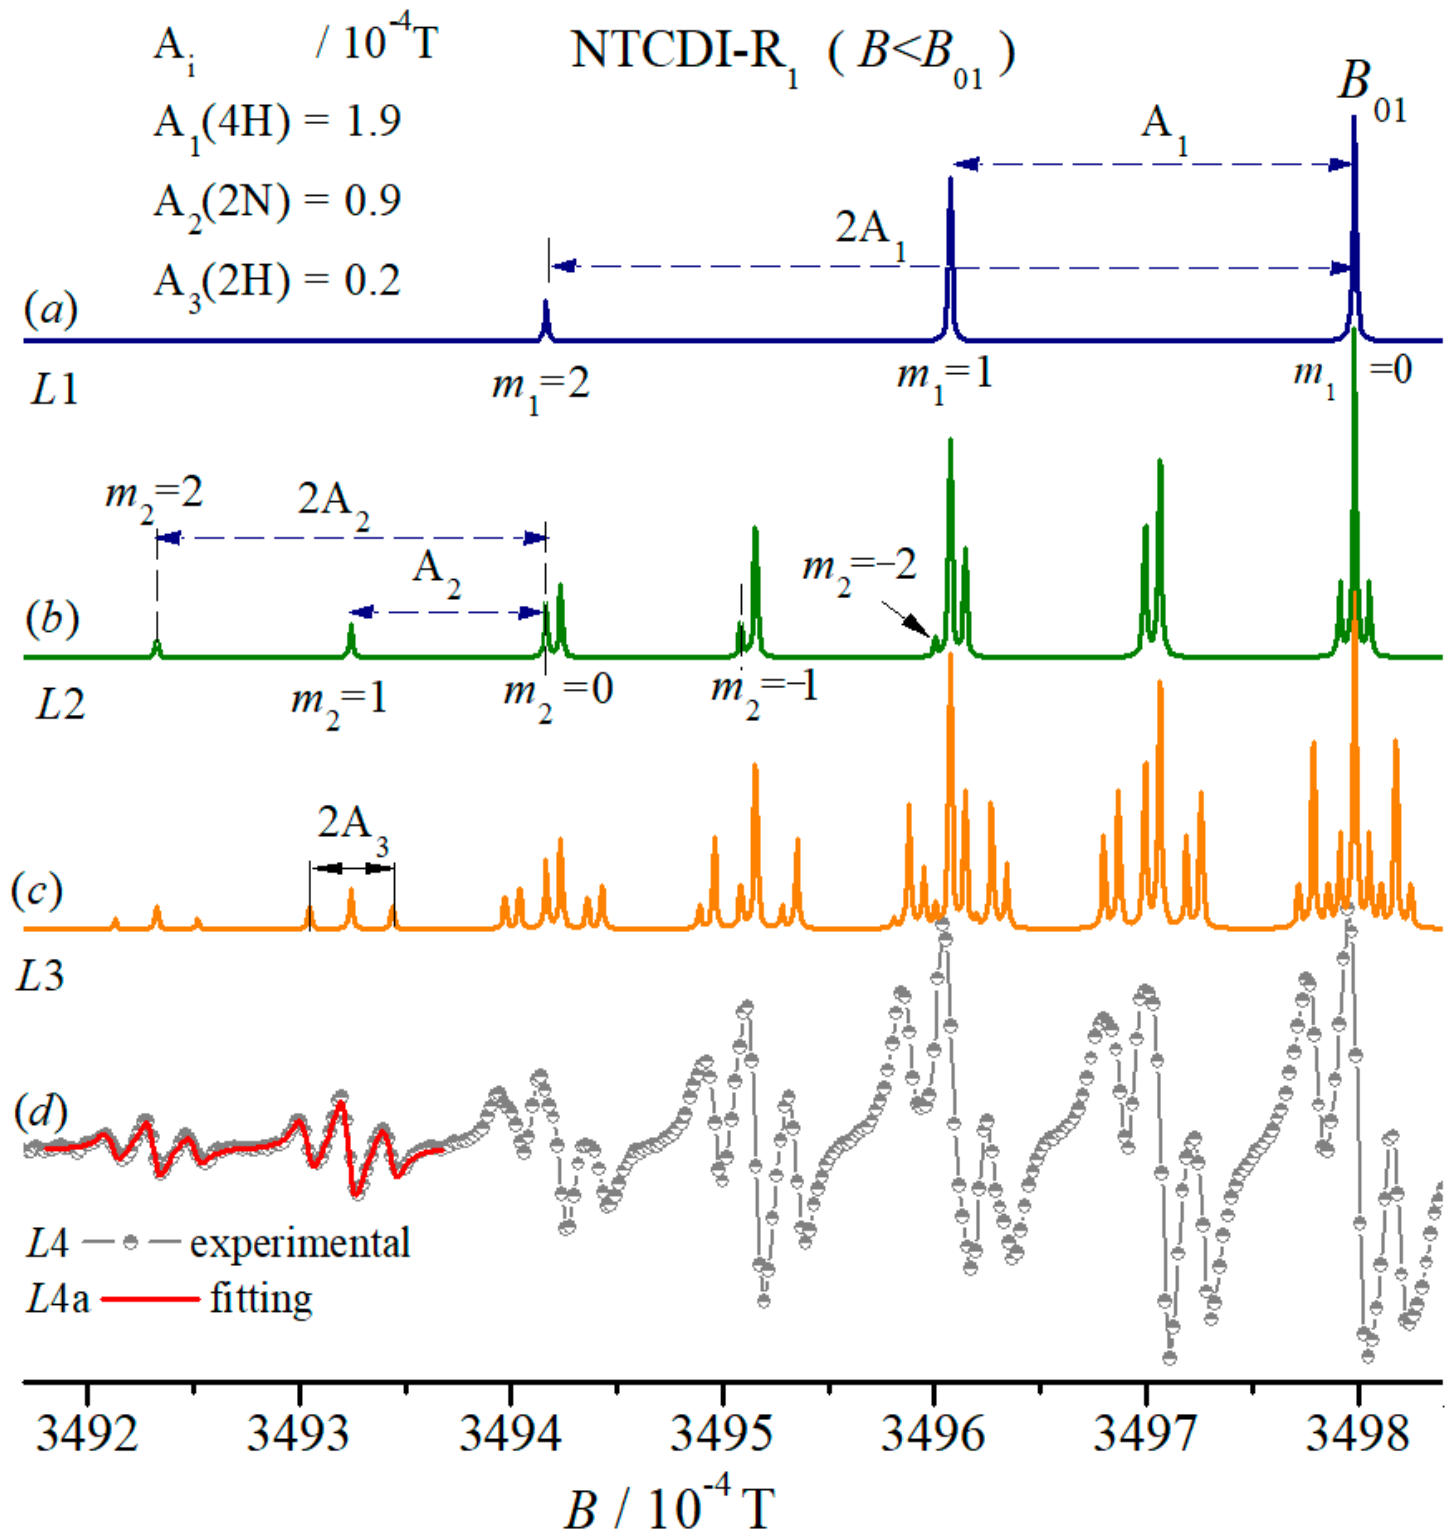
Figure 3.
Simulation of low field (B < B01) experimental (L4) spectra hfc parameters (Aj). The successive spectra L1, L2, L3 include, respectively, the splitting of hfc: (a) (A1), (b) (A1 + A2) (c) A1 + A2 + A3, that close to NTCDI-H spectrum structure [19], (d) L4–experimental, L4a-fitting (m1 = 2; m2 = 2,1; m3 =1,0,−1. To visualize the position of the resonance fields of all hfc components, Lorentzian absorption spectra with a line width of 0.05 G (10−4 T) were constructed. The fitting procedure yields the parameters A1,2,3 shown in the inset at the top of the figure.
Table 1.
DFT data of anisotropic AX,Y,Z, gX,Y,Z -tensors and isotropic A0j (A1,2,3) and g0 of the RA NTCDI-H [all A are expressed in units of 10−4 T (G)].
Table 2.
DFT data of anisotropic AX,Y,Z and gX,Y,Z -tensors of the NTCDI-CH2-CH3 RA [A0j are in units of 10−4 T (G)].
Spectra processing was carried out on example with NTCDI-R1, due to the slightly simpler structure of the hfc spectrum. In Figure 3 the modeling spectra of the sequential splitting in region B < B01 are shown where the spectra of hfc splitting include: (a) A1(4H), (b) A1 + A2 (2N), (c) A1 + A2 + A3 (2H), which closely matched the structure of NTCDI-H due to experimental data in [19] and DFT hfc computing in this work.
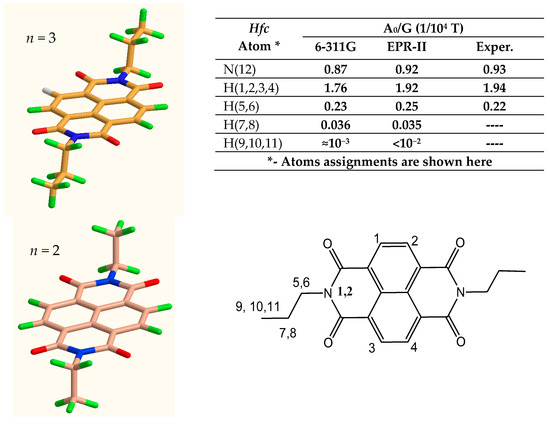
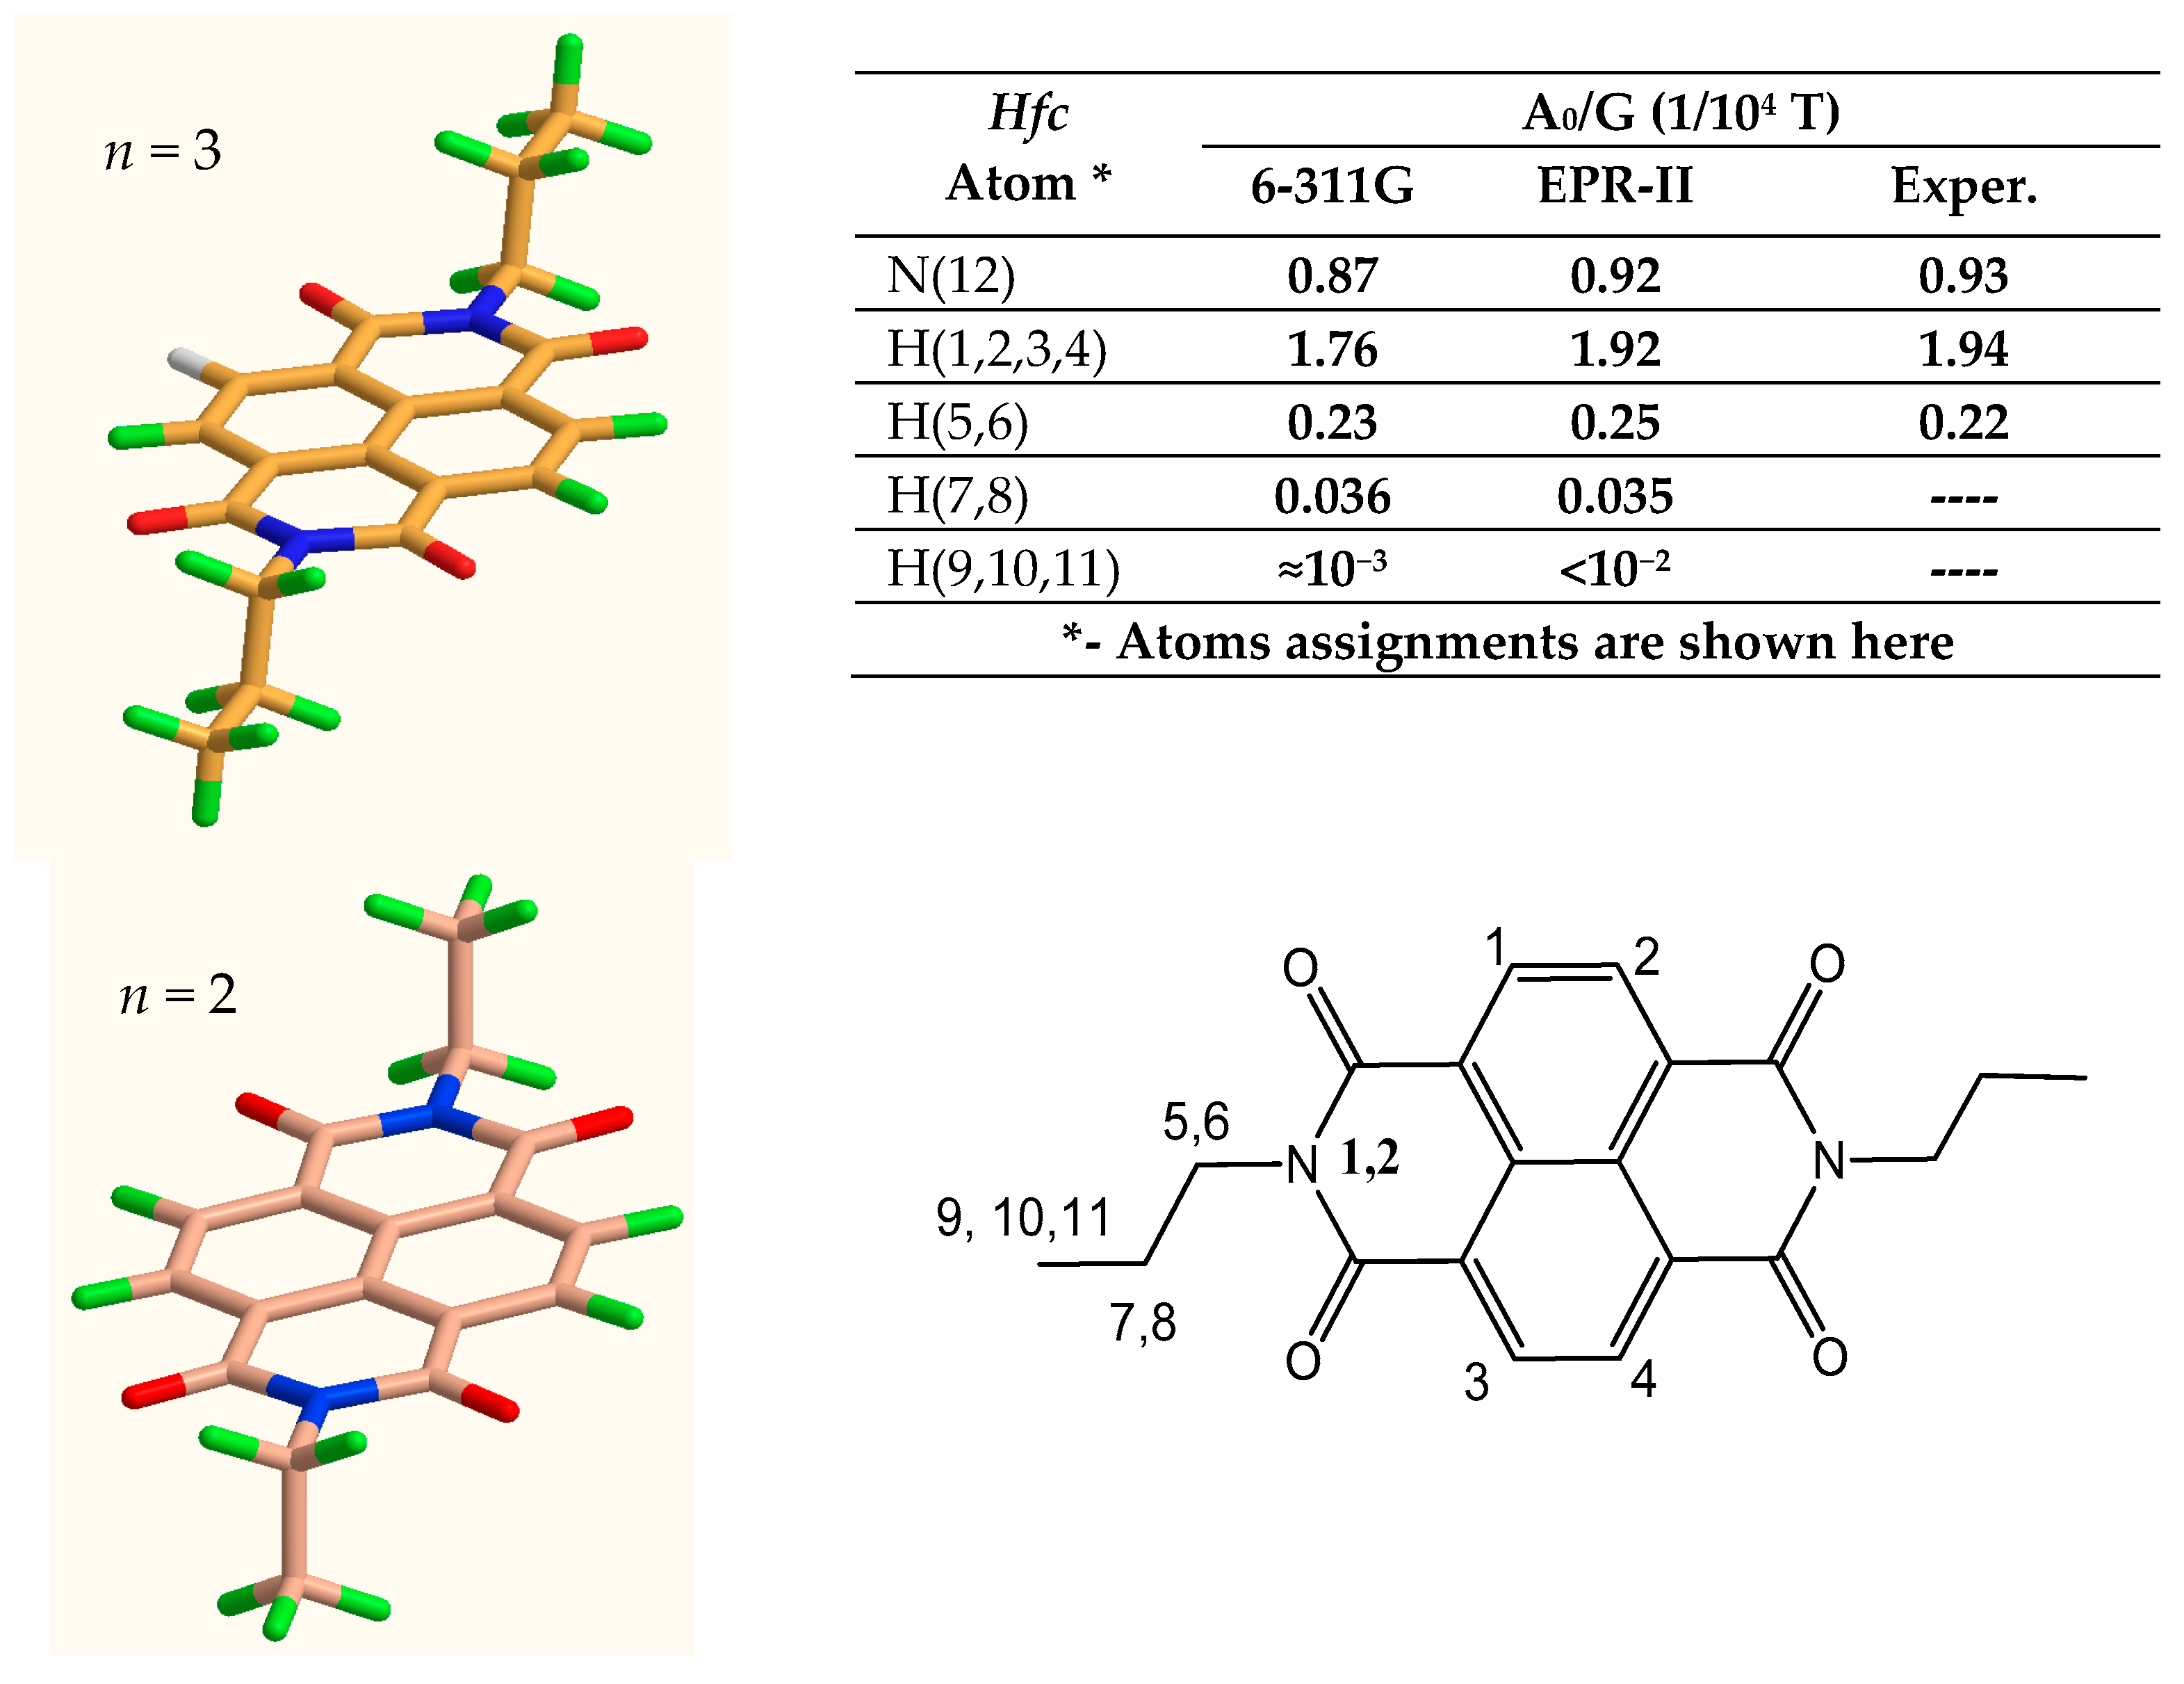
For ease of the hfc components identification, absorption spectra a-L1, b-L2, c-L3 were used. The model spectra confirm the non-overlap of the lines [MS = ±1/2, m1 = 2, m2 = 1, 2, m3 = 1, 0, −1] with other nearby hfc components. Resonance fields B1-6 of the two triplets inside W1 in Figure 1a are sufficient for the determination of all spectral hfc parameters without fitting by (Table S1) in SM-1b. The hfc constants from experimental spectra and DFT calculated here, as well as those taken from the literature [19], are placed in Table 1 and Table 2. Comparison of the parameters shows that the relating structures of the NTCDI-R1,2 derivatives are likely correct. As it was mentioned the chemical structure of R2 in general is -CnH2n+1. The inserted table in Figure 4 presents the results for n = 3, which indicate little difference between the n = 2 and n = 3 cases. Despite the part of the spectrum corresponding to the triplet (H5,6, m3 = 1, 0, −1) is close to isotropic (Figure 5a), the spectra processing gives (ΔBm=1 − ΔBm=−1) ≈ 2β1 ≈ 0.02 G (T = 293 ± 2 K) due to ±β1 contributions i.e., (α0 + α1 + β1 + δ1) and (α0 + α1 − β1 + δ1) for m3 = ±1 respectively as follows from expression (4a) in SM-2. These data provide grounds for using NTCDI-H as a spin probe for studying molecular diffusion in IL, however, the accuracy of the line width determination may be limited by the small anisotropy of the hfc protons > N-H, namely, an order of magnitude smaller than on rings (>C-H), as follows from Table 1. The NTCDI-CH2- CH3 derivative can be bit better for this purpose due to effective nuclear spin I = 2, i.e., according to (4a, SM-4) ΔBm=2 − ΔBm=−2 = 4β1 instead 2β1 in NTCDI-H (I = 1, m = 1, 0, −1). The processing of spectrum in Figure 5b gives β1(3) >> δ1(3) and Chi2 started to be minimal at ratio β1(3)/δ1(3) ≈ 12. Parameters β1(3) and δ1(3) calculated by Equation (5) in SM-2 using mentioned expressions for Δg, ΔA, δg, δA and data in Table 2 gives ratio β1(3)/δ1(3) ≈ 15 that is close to experimental (≈13).
Figure 4.
3D image of NTCDI-CnH2n+1 are shown for the both cases n = 2, 3 clearly depict structures with a center and plane of symmetry perpendicular to the aromatic plane dividing the molecule along the N-N axis. This symmetry ensures the equivalence of atoms in the corresponding groups, which is clearly confirmed by the experimental ESR parameters of the hfc, shown in the table in the inset.
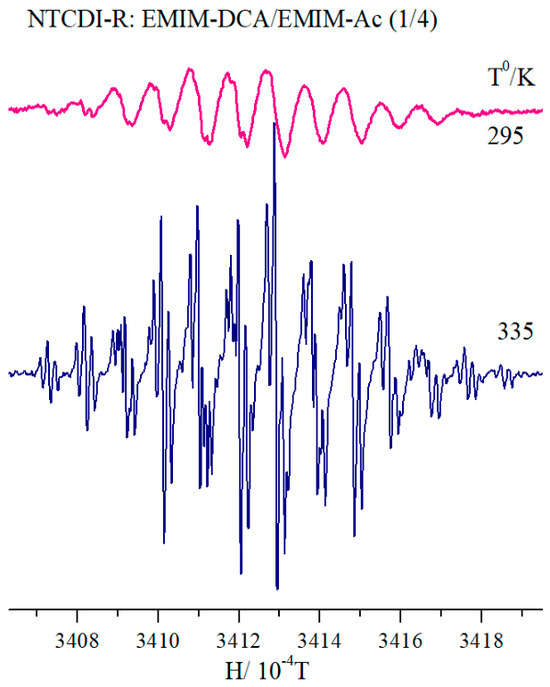
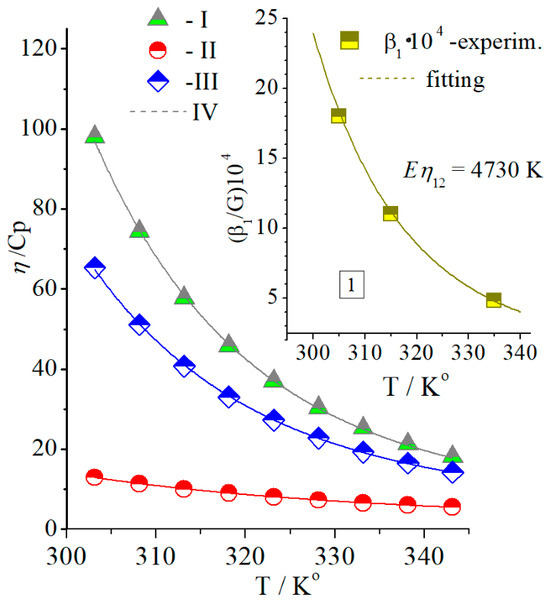
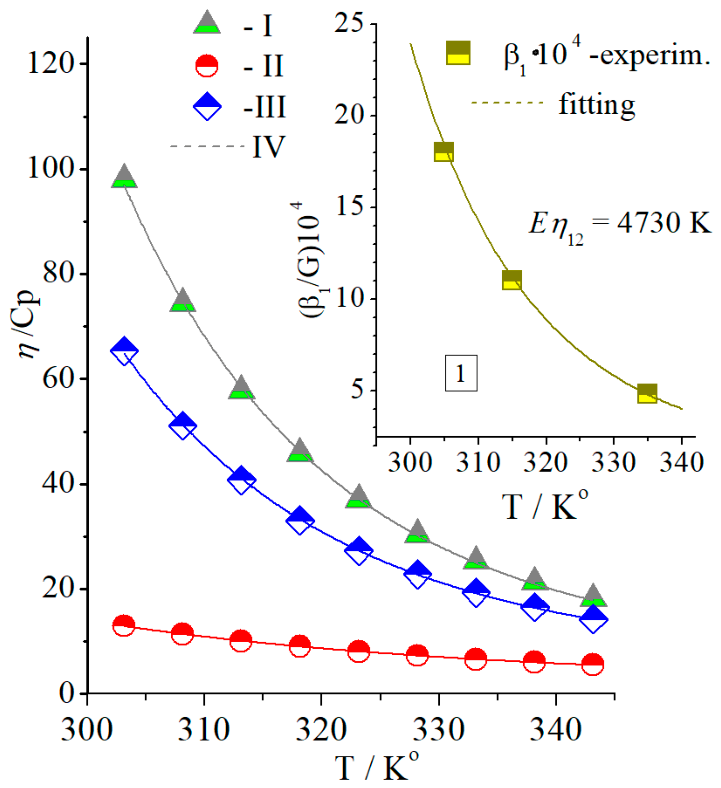
Here and below, the indexes in brackets (1), (2), (3) refer to the parameters Ai (i = 1, 2, 3), indicated in the inset of Figure 3. From a practical point of view, analysis of these values can be considered as the data for studying the temperature-dependent dynamic viscosity of IL mixture solutions directly by the EPR method. The use of PPDN and NTCDA in [10] demonstrates sensitivity of these RAs EPR spectra to temperature/viscosity changes. In case of the high stability of RA spin probe one can get the information of RA reactions rates at least the contribution responsible for the rotation and translation molecular RA diffusion dependent on temperature. According to expressions (1S) and (2S) in SM-2, the parameters α1, β1, δ1 are the functions of τc ~(ηT−1)~[exp(Eη/T)]T−1. Similar to the experimental examples in [10] here EPR of the NTCDI-H was applied to determine Eη of EMIM-DCA and EMIM-Ac mixture with a volume ratio of 1:4 respectively, i.e., with a dominance of the highly viscous EMIM-Ac (Table 3). The linewidth ΔBm of the hfc spectra exhibits significant variation depending on temperature, as shown in Figure 6. All experimental spectra included intermediate temperature points T = 305°, 315°, and 325° K are introduced in Figure S2 in SM-3. The molecular weights of both the above mentioned ILs are mainly determined by EMIM and are therefore almost identical. The ILs data regarding η = F(T) for the comparison with those obtained in this work by the EPR were taken from [23]. Here the dynamic viscosity, η12, of binary mixture consisting of the components with viscosities η1 and η2 obeys the Arrhenius approach [24]
where x1,2 (x1 + x2 = 1) are the mole fractions and η1, η2 are viscosities of appropriate components in mixture. Assigning index i = 1 to EMIM-Ac and i = 2 to EMIM-DCA and taking into account that molecular mass of (IL)1,2 are close (M1 ≈ M2) Equation (2) overwrite in form for processing.
Table 3.
Parameters η1, η2 are taken from [15], η12 = exp[ln(η12)] is calculated by Equation (2a).
Figure 6.
NTCDI-H spectra recorded at the extreme points of experimental temperature interval 295–335° K.
Table 3 data were processed by fitting using an expression η = ηꝏexp(Eη/T). The parameter suitable for the comparison of [10] and EPR results in this study is activation energy Eη. Processed of η1, η2, η12 dependences exhibited in Figure 7 give respectively: Eη1 = 5180 K, Eη2 = 2550 K, Eη12 = 4670 K. A similar consideration for β1 displayed in insert 1 in Figure 7 gives Eη12 = 4730 K, i.e., it coincides with Eη12 = 4670 K with a deviation of about 1.3% estimated by fitting.
Figure 7.
The calculation of Eη12—utilizing Equation (2) of mixing solution volumes of EMIM-Ac (V1 = 0.8 V) + EMIM-DCA (V2 = 0.2 V) where V1 + V2 = V is the volume of mixing solution. On Figure 6 the viscosities data from [15] are denominated as: I–EMIM-Ac, II- EMIM-DCA, III–mix of I and II calculated by Equation (2a). Insert 1 shows the dependence of β1 on T (see text for further details).
In the EPR data analysis, the data concerning the exceptional combination of the two ionic liquids used in the formation of NTCDI-R in this work are particularly noteworthy. Among the other ionic liquids used as a partner for EMIM-DCA, EMIM-Ac did not have chemical purity (≥95.0%). Furthermore, NTCDI was synthesized in a mixture of EMIM-DCA and EMIM-Ac, rather than in a mixture of EMIM-DCA and (1) EMIM-TF2N, (2) BMIM-TF2N, (3) EMIM-TFO, (4) DMIM-PF6, and (5) PMPyrr-TF2N, with imidazolium being the major cation among the above, except for PMPyrr. This suggests that the concentration of R-NH2-related impurities in this case is most likely predominant in EMIM-Ac.
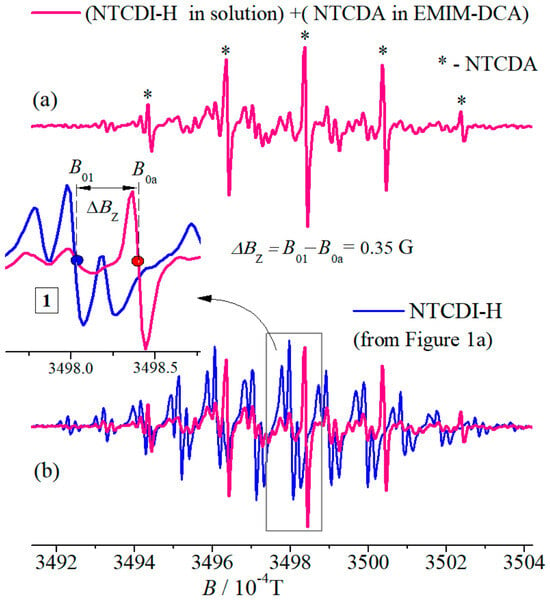
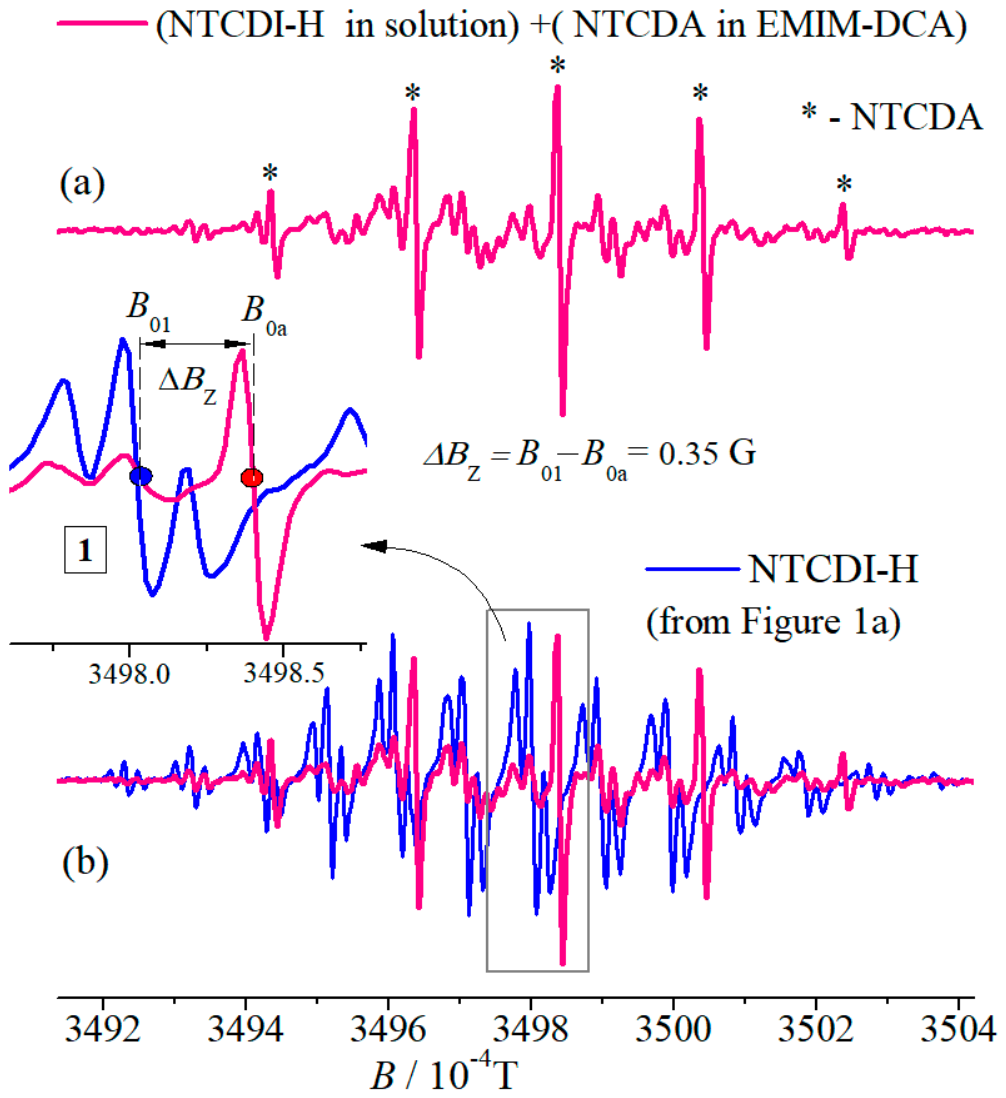
In conclusion of the discussion of the EPR data, we note that the agreement between the experimental data and the g-factor calculated using ORCA 4.2, 5.0 Software [25] appears good. Indeed, taking into account that in EPR experiments two different positions of the resonant field are related simply g1H1 = g2H2 = hν = constant the ΔB12 = B1 − B2 = B1(g2 − g1)/g2 = B1(g2 − g1)/2 (g2 ≈ 2 due to g2/2 = 1.00175) and using g1 = 2.0037 (is g0 of NTCDI-H in Table 1), g2 = 2.0035 (is NTCDA g0 [10]) ΔB12 = (3498 G)∙(2.0037 − 2.0035)/2 = 0.3498 ≈ 0.35 G that exactly coincides with the experimental ΔBZ shown in insert 1 of Figure 8, or in the figure caption.
Figure 8.
(a) NTCDI-H in its above mix solution EMIM-DCA + EMIM-Ac plus additive of NTCDA: EMIM-DCA solution, (b) previous spectrum (a) plus experimental RA NTCDI-H presented in Figure 1 before. In insert 1 is the part of both spectra in interval ΔBZ = B01 − B0a = 0.35 G where B0a is Zeeman resonance field position of NTCDA in EMIM-DCA solution and mentioned above H01 corresponded to NTCDI-H. Appropriate spectra attributions are inside figure.
3.2. 1H NMR
3.2.1. NTCDA (NDA). EPR Protocol for Light-Induced NMR Experiment
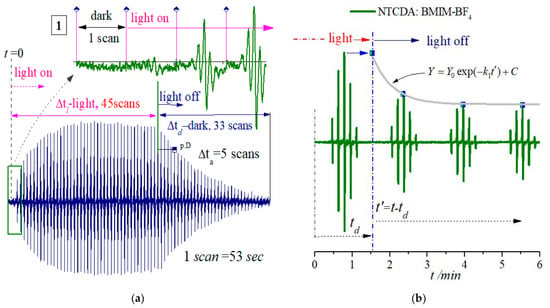
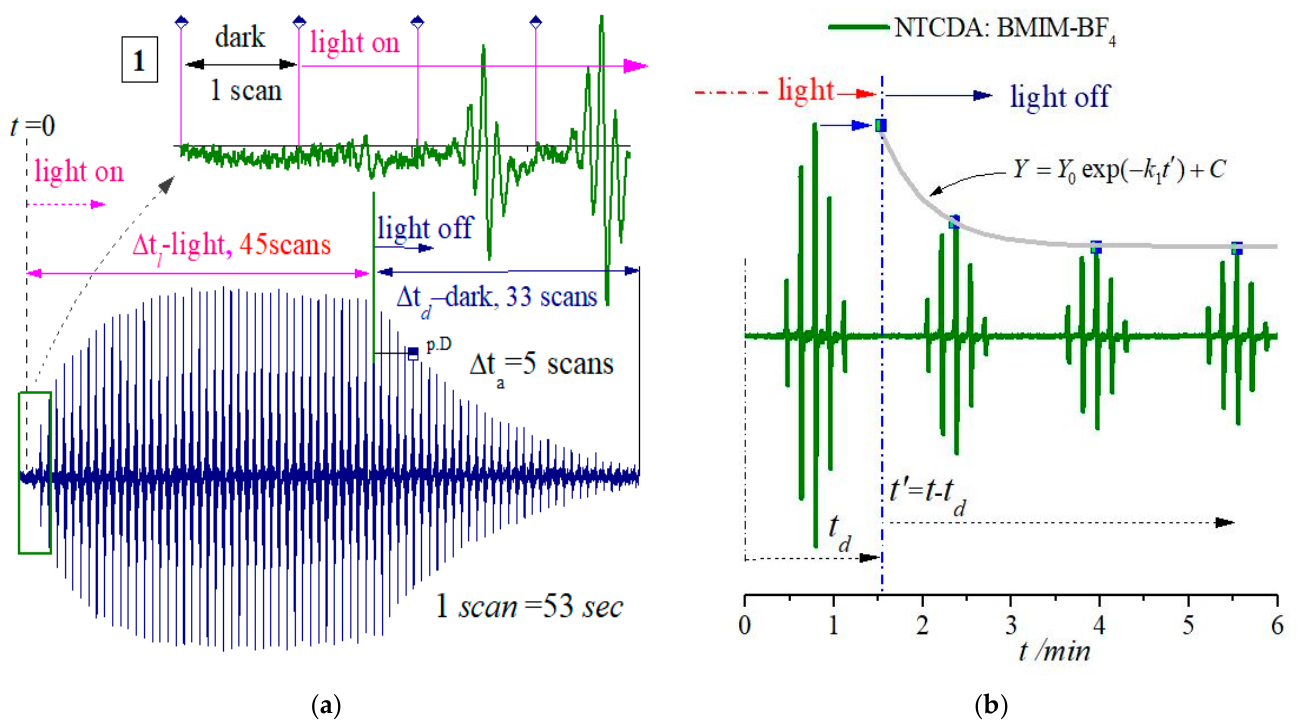
An attempt was made to use 1H NMR to detect the paramagnetic polarization caused by the formation of NTCDA and NTCDI RAs in the IL continuum due to the addition of electrons from the IL anion [10] after light excitation. It was expected that the corresponding broadening ΔEX of the 1H NMR line of NTCDA or NTCDI and its paramagnetic shift Dp could indicate electron transfer between NTCDA and NTCDA•− i.e., electron chemical exchange (ECE) fixation by NMR [26,27,28], thus there is no urgent need for an EPR method for the light-induced NTCDA•− detection. At least, this is useful at the level of the RA fixation and does not require quantitative processing of data on the spin density (SD) distribution on the anion-radical, which is more accessible for EPR. Moreover, at sufficient concentrations of RAs, the determination of Ai value < 0.1 G (0.1 mT is more accessible for NMR than for EPR but this task was out of plan due to significant hfc (around 2 G) of four ring NTCDA protons. However, the rate constant evaluation of electron transfer between the NTCDA or NTCDI molecule and their RA is one of the visible applications of NMR. Another important NMR priority is determination SD sign by the direction of the paramagnetic NMR shift (to low or high field) of the corresponding 1H lines. This may be more convenient than using electron-nuclear multi-resonance methods to determine the sign of the local SD distributed over the RA. EPR results on the formation of NTCDA•− and PPDN•− in some imidazolium based ILs support the test of a simple express analysis for detecting light-induced paramagnetic polarization in NTCDA:EMIM-DCA solution by NMR. Preliminary experiments to study the kinetics of EPR formation/dissociation of PPDN•− and NTCDA•− solutions in EMIM-DCA and BMIM-BF4 in the “light on/light off” mode have already been carried out and showed that the simplest option for recording the NMR spectrum of a sample illuminated outside the NMR spectrometer is possible, but the recording time depends on the preliminary EPR protocol of individual samples. Examples of full (PPDN•−) and selective NTCDA•− (dissociation part) kinetics obtained using the EPR method are shown in Figure 9a,b. Recording a continuous sequence of any number of EPR spectrum scans allows one to obtain data on the generation/dissociation kinetics of photoinduced RA over time by modulating the on/off switching of light. For example, the protocol in Figure 9a shows that approximately 20 scans are sufficient to reach equilibrium for the RA concentration, while dark mode allows one to record the entire NMR spectrum or part of it in just 2–4 min without data loss due to the relatively rapid concentration decrease. Thus, point D (Figure 9a) represents a reasonable maximum time Δta before the start of the NMR frequency scan within the spectral range of interest. In the case of NTCDA the kinetics exhibited in Figure 9b shows a loss of RA concentration by 40–50% within 1–1.5 min, but this level of residual concentration is maintained for at least several tens of minutes. The dissociation of NTCDA•− in time regime “light off” is described by a first-order reaction using Y function shown in the inset in Figure 9b. However, the origin of the subsequent residual concentration level of NTCDA•− over time remains unclear and the above result requires further experiments, but for now this study can be omitted since it does not significantly affect the result considered by NMR.
Figure 9.
The continuous recording of successive EPR spectrum scans in the light on/off mode corresponds to: (a) PPDN:EMIM-DCA solution. The relevant information regarding the hfc PPDN EPR data is presented in [10]. Detailed fragment of the first four spectra scans of the PPDN radical anion (PPDN•−) with lines indicating the boundaries of the spectrum (scan) is shown in insert 1, (b) the solution of NTCDA:BMIM-BF4 with the duration of scan around td = 93 s. The “dark off” kinetics evaluated by expression Y with td and t’ denominations are shown in inserts in Figure 8b.
3.2.2. 1H NMR Spectra
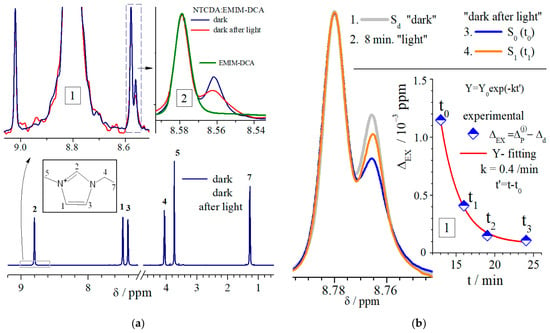
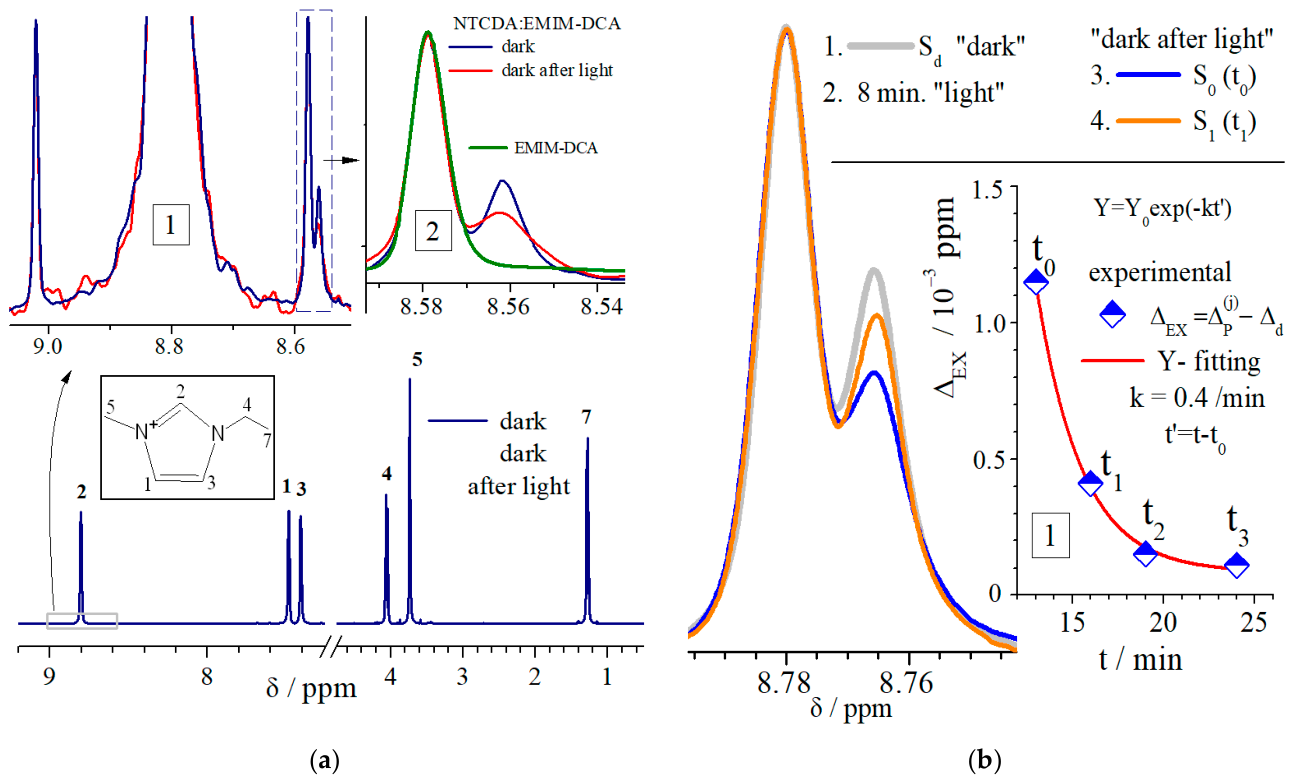
Two samples SN1, SN2 from the one NTCDA:EMIM-DCA solution in light-induced experiment were used. The singlet line of NTCDA equivalent protons was detected around chemical shift δ4H = 8.562 ppm (blue line) with partly overlapping of X line (δx = 8.579 ppm) as shown in inserts 1 and 2 in Figure 10a. Note that the spectrum of EMIM-DCA solvent is presented only in inset 2. Sample N1 (SN1) in NMR working ampule was illuminated outside spectrometer within around 7 min and then placed in the sample compartment of the NMR spectrometer. The response “dark after light” has been detected in NMR spectrum due to surely fixation of NTCDA proton line broadening as shown in insert 2 in Figure 10a. However, for SN1 (Figure 10a), it was not possible to obtain acceptable experimental data on the kinetics of the paramagnetic contribution taking in mind the long interval between the recording times of the first two spectra: approximately 27 min for a full spectrum scan plus ~3 min for sample setup before the first scan. Thus, five new 1H NTCDA spectra of the new sample solution SN2 with the same NTCDA concentration were recorded in the range limited by ±0.025 ppm near δ = 8.77 ppm, including their kinetics data of the paramagnetic contribution presented in Figure 10b and in insert 1. Furthermore, the shift of δ = 8.77 ± 0.15 ppm coincides with similar data in numerous publications devoted to the synthesis of NTCDI derivatives.
Figure 10.
(a) 1H NMR spectrum of NTCDA:EMIM-DCA solution (SN1) with EMIM spectrum lines identification. NTCDA line (4H singlet around, δ = 8.7625 ppm before and after light pumping, presented in two scales in insert 1 and 2, with data of the position of two reference lines at resonance frequencies assigned to points 9.022 and 8.579 ppm respectively, (b) spectra of new sample (SN2), realizing records in a narrow spectral range of ±0.025 ppm around δ = 8.77 ppm, together with data on the ΔEX kinetics function parameters, are presented in Insert 1 (Figure 10b).
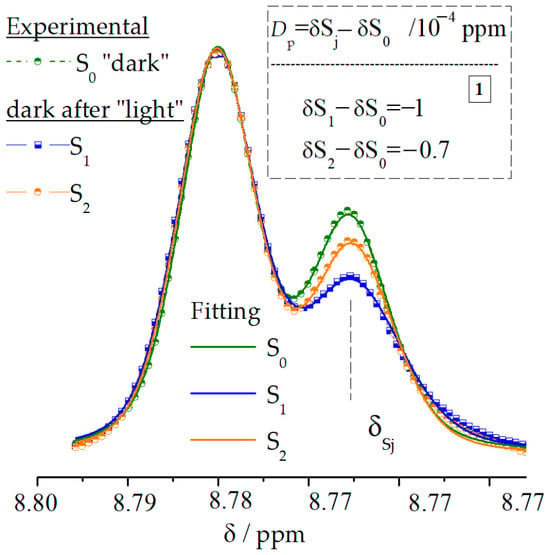
As a result, the duration between two (“dark” and “dark after light”) spectra recording was reduced to ~3–4 min (inset 2 of Figure 10a) compared to ~27 min for the previous spectrum in Figure 9a. To get the kinetics data the new SN2 samples was used ΔEX(t) = ΔP(j) − ΔD, where ΔP(j) and ΔD are the half-widths of the singlet lines corresponding to the paramagnetic contribution (blue, red) lines and pure diamagnetic (gray) line respectively. Index j in insert 1 in Figure 10b relates to the current spectra S0,1,2,3. Namely ΔEX(t0) = ΔP(S0) − ΔD, ΔEX(t1) = ΔP(S1) − ΔD, ΔEX(t2) = ΔP(S2) − ΔD, ΔEX(t3) = ΔP(S3) − ΔD (S3 is identical to S2). This response to light pumping was reliably reproduced in other experiments. However preliminary EPR experiments show that RA concentration increases in these systems during illumination but is essentially sensitive not only to light power as could be predicted, but for instance to the homogeneity of the light power density on the surface of sample, the specification of the experimental illumination geometry taking in mind the cylindrical sample form (liquid in tube), etc. Moreover, the mechanical stirring of the sample solution after irradiation is different from the stirring caused by the molecular diffusion of RA in liquids, but in our case the shaking cannot be avoided when placing the sample in the NMR spectrometer, which precludes control over the kinetics of RA formation in a diffusion-controlled reaction like that shown in Figure 8a, i.e., without any mechanical stirring like in EPR experiments. Indeed, according to EPR data obtained before, the concentration of light-induced ARs decreases after even the weak shaking the mixture. This observation shows that with the above-mentioned express control of the ARs presence in the solution after light excitation, the correct prediction of the initial concentration may apparently encounter difficulties, but for the purposes of registering ARs appearance this is not of fundamental importance. Sequentially recorded NMR spectra indicate changes in line shape that correlate with similar dynamic changes in the EPR spectra. Indeed, observing the decrease in the EPR spectrum amplitude over time after turning off the light, and considering that no changes in the EPR linewidth were observed, the amplitude behavior indicates a decrease in the integrated line intensity, namely, the RA concentration. In the NMR spectra, this effect leads to an increase in the NMR signal amplitude due to the decrease in the RA concentration, and consequently to a decrease in the line width. This reduces the influence of the paramagnetic contribution, leading to a reduction in the paramagnetic broadening caused by ECE. The NTCDA spectrum amplitude, shown in Figure 10b, convincingly demonstrates that the maximum amplitude of the diamagnetic state of the “dark” (Sd) spectrum decreases significantly in the first recording (S0) at t0 due to line broadening under the influence of light. The linewidth then narrows in the second recording (S1) at t1, and then to a value close to the “dark” value at t2,3 indicating a decrease of the NTCDA•− concentration over time after turning the light off. Thus, the broadening of the NTCDA proton NMR line allows one to estimate the parameters of electron transfer kinetics. The broadening of the NMR line ΔEX = 1/T2EX and its shift Dp from the resonance position δd in the diamagnetic state to the position δp in the paramagnetic state are both due to the contribution from ECE and are determined as follows [26]:
Figure 11.
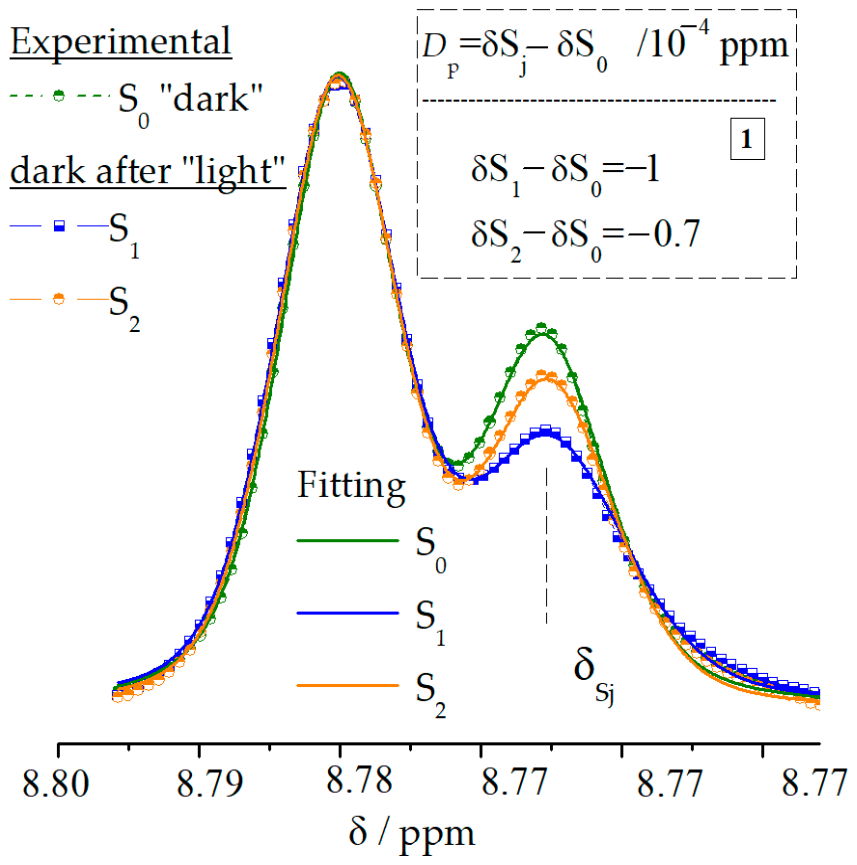
Spectrum analysis of SN2 sample (Figure 9b) with regards of Dp determination. The process of fitting was performed utilizing functional Y = C1FL + C2FG where C2 and C2 are relative contribution of appropriate Lorentzian FL and FG Gaussian functions assuming C1 + C2 = 1 (here C1 ≈ C2). To estimate fp, the maximum value Dp = δS1 − δS0 = 10−4 ppm was used (see insert 1 in Figure 11).
Figure 12.
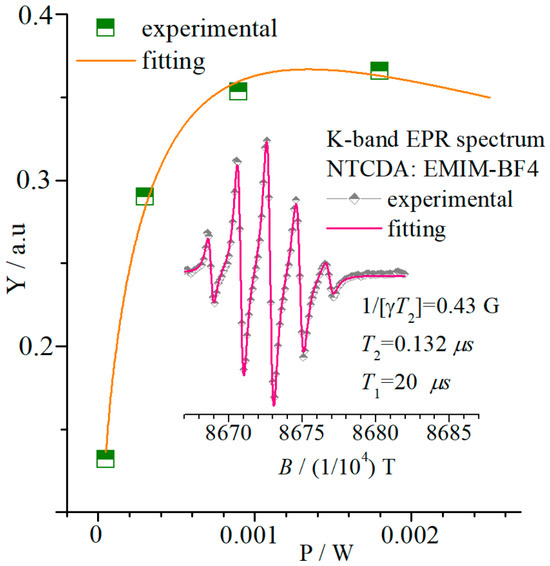
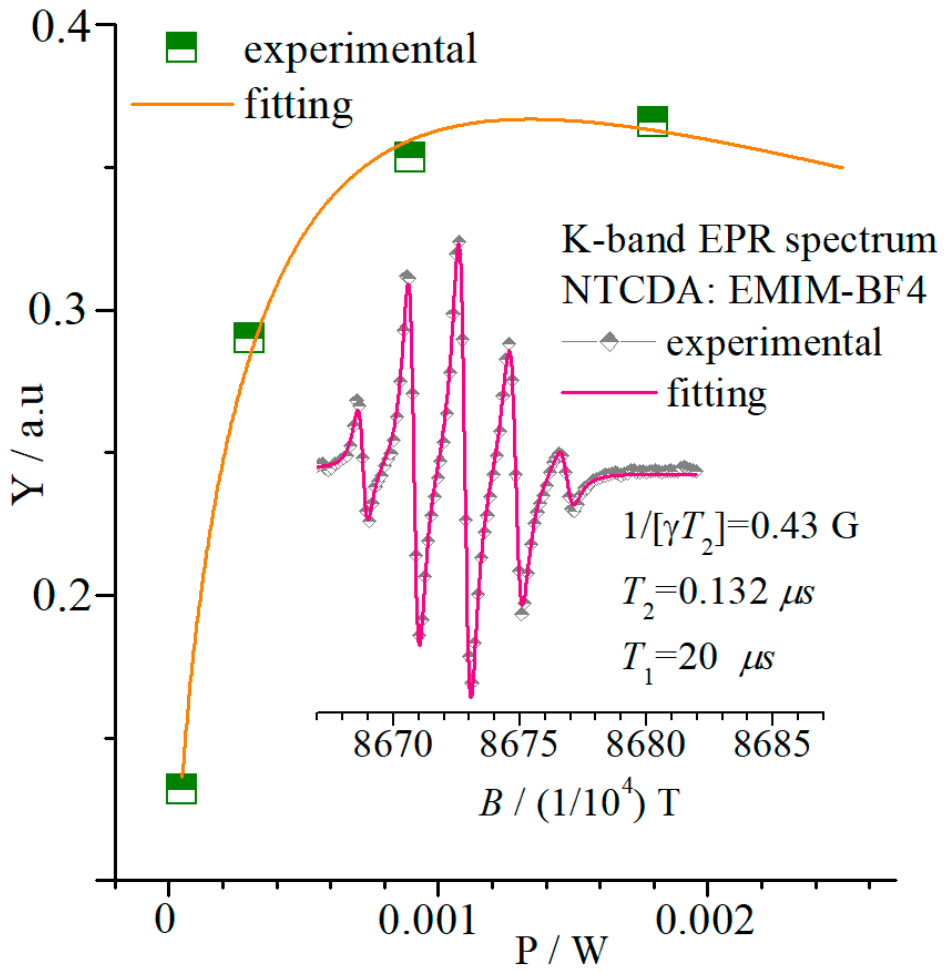
EPR line saturation function of EPR is Y-amplitude vs. microwave power. Saturation is started around P = 1 mW and corresponded to T1 ≈ 2 × 10⁻⁵ s. In insert 1 are experimental and fitted spectrum where A = 0.2 mT (2 G). T1 was determined by EPR line amplitude saturation using the method described in [29]. Note that here the calculated T1 ≈ 2 × 10⁻⁵ s is related to EMIM-BF4 that viscosity is around 1.6 times more than of EMIM-DCA and taking into account that T1 ~1/η in EMIM-DCA T1 ≈ 2 × 10⁻⁵/0.6 ≈ 3.2 × 10⁻⁵ s.
- Denoting ΔEX/Dp as F, one obtains an expression for τp.
Substituting in (7) values: Z = 0.013, T1 = 3.2 × 10⁻⁵ s, −A = 2πA’, where A’ = −2G = −5.6 MHz (1G = 2.8 MHz), F = 1.2 × 10⁻³/1.0 × 10−4 ≈ 12 we get τp ≈ 1.6 × 10⁻⁸ s. The obtained value of τp can simplify further calculations of fp, since (τpA)2 << 1 (and not τpA2) and (τpT1) << 1. Thus using (3) fp = ΔEX(Hz)/[τp∙(πA’)2] = 5 × 102 × 1.2 × 10−3/[(1.6 × 10−8(3.14 × 5.6 × 106)2 ≈ 1.3 × 10⁻⁷. This result is not surprising and correlates with data from [26], where line broadening was reliably detected at a radical concentration of ~10−7 M. To test the influence of the duration of light pumping on the process of accumulation of ion-radicals, this time for SN1 was approximately 1.5 times longer than for SN2, which is confirmed by a comparison of the integrals of their NTCDA lines. Currently, quantitative 1H NMR data for NTCDI-R show some new, unusual light-induced responses and certainly require further experiments using 1H NMR spectrometer with a sample illumination attachment. However, this is currently not possible, and addressing this issue planning to be the next step.
4. Conclusions
This study demonstrates the feasibility of forming NTCDI-R using NTCDA in NTCDA:EMIM-DCA and NTCDA:EMIM-Ac ionic liquid mixtures at room temperature without any additives or external factors. EPR and DFT methods identified R = CH2-CH3 as a component of residual impurities after the quaternization of R-NH2 during the synthesis of the imidazole ring using the –CnH2n+1 alkyl chain, namely -CH2-CH3 and -CH3 in EMIM+. These data confirm the feasibility of synthesizing NTCDI-R using the NTCDA molecule in an ionic liquid environment and are registered as a German patent [30]. Analysis of the EPR line widths of the NTCDI-CH2-CH3 derivative revealed a fairly good sensitivity of the spin-dynamic response to temperature changes, which suggests the use of NDI derivatives as a spin probe or label in studying the diffusion of electron acceptors, at least in the environment of imidazolium-based ionic liquids, as well as mixtures of ionic liquids with other types of organic substances and, especially, biological fluid systems. The broadening of the NTCDA singlet line, attributed to four equivalent protons, caused by ESE confirms the formation of NTCDA•−. A simple protocol of pre-irradiating NTCDA with light in solutions of certain ionic liquids outside the NMR spectrometer can serve as a useful rapid test of the formation of radical anions with a lifetime of at least several tens of minutes.
It also ought to be noted that the process of oxygen-to-nitrogen exchange in planar aromatic structures such as PTCDA, PMDA, and other similar structures cannot be ruled out in ionic liquid solutions, where the cation is based on an imidazole ring synthesized using various alkylamines. The possibility of such an unplanned reaction protocol is due to the potential of NDA to interact with residual alkylamines in ionic liquids.
Supplementary Materials
The following supporting information can be downloaded at https://www.mdpi.com/article/10.3390/liquids6030028/s1, Figure S1a: A portion of the high-field 1H spectrum of NTCDA:EMIM-DCA from Figure 9a in MT. Inset 1 shows the zoomed in –CH2- and –CH3 spectra of residual ethylamine. In Figure S1a, (ri) stands for “residual impurities.” One of the two dominant singlets at around 2.9 ppm in the third rectangle corresponds to methylamine ri. Observing –NH2 at such a low concentration seems unlikely due to rapid exchange, leading to significant broadening of the –NH2 singlet line.; Figure S1b: Two parts of the 1H high-field spectrum of NTCDA:EMIM-DCA shown in Figure 9a (MT), with spectra corresponding to the –CH2-CH3 side chain of EMIM in EMIM-DCA IL; Figure S1c: 1H NMR spectrum of NTCDA:EMIM-Ac + NTCDA: EMIM-DCA mixture (50:50%) recorded at RT. In insert 1 are extracted spectra integrals SH2O and SCH2; Figure S1d: Two spectra intervals included broadened lines with Δδ/ΔT: (a) −0.00667 and (b) −0.008 ppm/degree; Figure S1e: Extended scale versions of the spectra presented in Figure S1d(a), Figure S1f: The NTCDA signal in the new (vs ethylamine before) EMIM-DCA solution; Figure S1g: Fragments of the two 1H NMR spectra shown in Figures S1e and S1f, recorded at t = 27 °C, include the reactants NH3 and NTCDA; Figure S1h: A structural variant of the hydrogen-bonded (ammo-nia)-(Ac anion) supramolecular complex, predicted by Chem3D software; Table S1: The system of 6 equations of resonance hfc magnetic fields for Aj constants determination without spectrum fitting (two triplets [MS = ±1/2, m1 = 2, m2 = 1, 2, m3 = 1,0,−1]); Figure S2. All temperature-dependent spectra of NTCDI-H.
Author Contributions
Conceptualization, A.K.; Methodology, A.K. and S.E.; Validation, A.K.; S.E. and V.K.; Investigation, A.K., S.E. and A.A.K.; Writing—original draft preparation, A.K.; Review and editing S.E., V.K., U.R., F.W., B.R., P.S. and A.A.; Formal analysis, V.K., U.R., P.S. and A.A. All authors have read and agreed to the published version of the manuscript.
Funding
The authors gratefully acknowledge the financial support for the NMR study provided to Kazan Federal University as part of a state assignment in the field of scientific activity FZSM-2026-0021.
Data Availability Statement
All generated and required physicochemical data are reported in this manuscript.
Conflicts of Interest
The authors declare no conflict of interest.
References
- Zhan, X.; Facchetti, A.; Barlow, S.; Marks, T.J.; Ratner, M.A.; Wasielewski, M.R.; Marder, S.R. Rylene and related diimides for organic electronics. Adv. Mater. 2011, 23, 268–284. [Google Scholar] [CrossRef] [Scilit] [PubMed]
- Rundel, K.; Maniam, S.; Deshmukh, K.; Gann, E.; Prasad, S.K.K.; Hodgekiss, J.M.; Langford, S.J.; McNeill, C.R. Naphthalene diimide-based small molecule acceptors for organic solar cells. J. Mater. Chem. A. 2017, 5, 12266–12277. [Google Scholar] [CrossRef] [Scilit]
- Qin, Y.; Li, G.; Qi, T.; Huang, H. Aromatic imide/amide-based organic small molecule emitters for organic light-emitting diodes. Mater. Chem. Front. 2020, 4, 1554–1568. [Google Scholar] [CrossRef] [Scilit]
- Puniya, R.R.; Chhapoliya, M.; Singhal, R.; Singh, D. Pyromellitic diimides and naphthalene diimides: From versatile supramolecular building blocks to advanced materials. Mater. Today Adv. 2025, 28, 100627. [Google Scholar] [CrossRef] [Scilit]
- Al Kobaisi, M.; Bhosale, S.V.; Latham, K.; Raynor, A.M.; Bhosale, S.V. Functional naphthalene diimides: Synthesis, properties, and applications. Chem. Rev. 2016, 116, 11685–11796. [Google Scholar] [CrossRef] [Scilit] [PubMed]
- Wu, Z.; Liu, Q.; Yang, P.; Chen, H.; Qichun, Z.; Sheng, L.; Yongbing, T.; Shanqing, Z. Molecular and Morphological Engineering of Organic Electrode Materials for Electrochemical Energy Storage. Electrochem. Energy Rev. 2022, 5, 26. [Google Scholar] [CrossRef] [Scilit]
- Yuan, S.; Huang, X.; Taoyi, K.; Lei, Y.; Wang, Y. Organic Electrode Materials for Energy Storage and Conversion: Mechanism Characteristics, and Applications. Acc. Chem. Res. 2024, 57, 1550–1563. [Google Scholar] [CrossRef] [Scilit] [PubMed]
- Lyu, H.; Li, P.; Liu, J.; Mahurin, S.; Chen, J.; Hensley, D.K.; Veith, G.M.; Guo, Z.; Dai, S.; Sun, X.-G. Aromatic Polyimide/Graphene Composite Organic Cathodes for Fast and Sustainable Lithium-Ion Batteries. ChemSusChem 2018, 11, 763–772. [Google Scholar] [CrossRef] [Scilit] [PubMed]
- Wang, Y.-L.; Li, B.; Sarman, S.; Mocci, F.; Lu, Z.-Y.; Yuan, J.; Laaksonen, A.; Michael, D.F. Microstructural and Dynamical Heterogeneities in Ionic Liquids. Chem. Rev. 2020, 120, 5798–5877. [Google Scholar] [CrossRef] [Scilit] [PubMed]
- Konkin, A.; Ritter, U.; Konkin, A.A.; Knauer, A.; Krinichnyi, V.I.; Klochkov, V.; Aganov, A.; Gafurov, M.; Wendler, F.; Scharff, P. PPDN and NTCDA radical anions formation in EMIM-DCA, BMIM-BF4 EMIM-Ac ionic liquid solutions under the steady state UV and Vis light illumination: A combined X-, K-band EPR and DFT study. J. Mol. Liq. 2022, 362, 119631. [Google Scholar] [CrossRef] [Scilit]
- Qin, J.; Lan, Q.; Liu, N.; Men, F.; Wang, X.; Song, Z.; Zhan, H. A Metal-free Battery with Pure Ionic Liquid Electrolyte. iScience 2019, 15, 16–27. [Google Scholar] [CrossRef] [Scilit] [PubMed]
- Dzyuba, S.V.; Kollar, K.D.; Sabnis, S.S. Synthesis of Imidazolium Room-Temperature Ionic Liquids Exploring Green Chemistry and Click Chemistry Paradigms in Undergraduate Organic Chemistry Laboratory. J. Chem. Educ. 2009, 86, 856. [Google Scholar] [CrossRef] [Scilit]
- Debus, H. Ueber die Einwirkung des Ammoniaks auf Glyoxal. Justus Liebigs Ann. Chem. 1858, 107, 199–208. [Google Scholar] [CrossRef] [Scilit]
- Arduengo, A.J.; Gentry, F.P.; Taverkere, P.K.; Simmons, H.E. Process for Manufacture of Imidazoles. U.S. Patent 6177575 B1, 23 January 2001. [Google Scholar]
- Ndruru, S.T.C.L.; Wahyuningrum, D.; Bundjali, B.; Arcana, I.M. Green Synthesis of [EMIm]Ac Ionic Liquid for Plasticizing MC-based Biopolymer Electrolyte Membranes. Bull. Chem. React. Eng. Catal. 2019, 14, 345–357. [Google Scholar] [CrossRef] [Scilit]
- Filippov, A.; Gnezdilov, O.I.; Rudakova, M.; Gimatdinov, R.; Arkhipov, V.P.; Antzutkin, O.N. NMR study of nitrate ionic liquids confined between micrometer-spaced plates. Appl. Chem. Eng. 2024, 7, 5462. [Google Scholar] [CrossRef] [Scilit]
- Tang, X.; Xu, Y.; Zhu, X.; Lu, Y. Changes in microstructure of two ammonium-based protic ionic liquids proved by in situ variable-temperature 1H NMR spectroscopy: Influence of anion. Magn. Reson. Chem. 2018, 56, 73–79. [Google Scholar] [CrossRef] [Scilit] [PubMed]
- Nowacki, M.; Hoffmann, M.; Wałęsa-Chorab, M. Photopolymerization of Styrene-Naphthalenediimide Monomer: Formation of Pattern and Electrochromism. Int. J. Mol. Sci. 2025, 26, 4807. [Google Scholar] [CrossRef] [Scilit] [PubMed]
- Nelsen, S.F. Heterocyclic Radical Anions. II. Naphthalic and 1,4,5,8-Naphthalene tetracarboxylic Acid Derivatives. J. Am. Chem. Soc. 1967, 89, 5925–5931. [Google Scholar] [CrossRef] [Scilit]
- Kivelson, D. Theory of ESR Linewidths of Free Radicals. J. Chem. Phys. 1960, 33, 1094–1106. [Google Scholar] [CrossRef] [Scilit]
- Wilson, R.; Kivelson, D. ESR Linewidths in Solution. I. Experiments on Anisotropic and Spin-Rotational Effects. J. Chem. Phys. 1966, 44, 154–168. [Google Scholar] [CrossRef] [Scilit]
- Misra, S.K. Multifrequency Aspects of EPR. In Multifrequency Electron Paramagnetic Resonance: Theory and Applications; Misra, S.K., Ed.; Wiley-VCH Verlag GmbH & Co. KGaA: Weinheim, Germany, 2011; pp. 23–55. [Google Scholar]
- Quijada-Maldonado, E.; Van der Boogaart, S.; Lijbers, J.H.; Meindersma, G.W.; De Haan, A.B. Experimental densities, dynamic viscosities and surface tensions of the ionic liquids series 1-ethyl-3-methylimidazolium acetate and dicyanamide and their binary and ternary mixtures with water and ethanol at T = (298.15 to 343.15 K). J. Chem. Thermodyn. 2012, 51, 51–58. [Google Scholar] [CrossRef] [Scilit]
- Gmehling, J.; Kolbe, B.; Kleiber, M.; Rarey, J. Chemical Thermodynamics for Process Simulation, 2nd ed.; Wiley-VCH Verlag GmbH & Co. KGaA: Weinheim, Germany, 2019. [Google Scholar] [CrossRef] [Scilit]
- Neese, F. The ORCA program system. Comput. Mol. Sci. 2012, 2, 73–78. [Google Scholar] [CrossRef] [Scilit]
- De Boer, E.; MacLean, C. Spin densities in the alkyl groups of alkylsubstituted naphthalene negative ions, determined by N.M.R. Mol. Phys. 1965, 9, 191–193. [Google Scholar] [CrossRef] [Scilit]
- De Boer, E.; MacLean, C. NMR Study of Electron Transfer Rates and Spin Densities in pXylene and pDiethylbenzene Anions. J. Chem. Phys. 1966, 44, 1334–1342. [Google Scholar] [CrossRef] [Scilit]
- De Boer, E.; Colpa, J.P. Signs of spin densities and vibronic interactions in 1- and 1,4-alkyl-substituted benzene anions. J. Phys. Chem. 1967, 71, 21–28. [Google Scholar] [CrossRef] [Scilit]
- Pool, C.P. Electron Spin Resonance: A Comprehensive Treatise on Experimental Techniques; John Wiley & Sons: New York, NY, USA, 1967; p. 557. [Google Scholar]
- Konkin, A.; Wendler, F.; Redlingshöfer, B. Efficient Production of a Full-Organic Battery. German Patent DPMA 10 2026 001 433.6, 18 March 2026. [Google Scholar]

Disclaimer/Publisher’s Note: The statements, opinions and data contained in all publications are solely those of the individual author(s) and contributor(s) and not of MDPI and/or the editor(s). MDPI and/or the editor(s) disclaim responsibility for any injury to people or property resulting from any ideas, methods, instructions or products referred to in the content. |
© 2026 by the authors. Licensee MDPI, Basel, Switzerland. This article is an open access article distributed under the terms and conditions of the Creative Commons Attribution (CC BY) license.