


Abstract
This study presents the experimental characterization of the volumetric and transport properties of pseudo-binary mixtures of commercial diesel and residual chicken fat methyl ester biodiesel over the temperature range of 293.15–353.15 K at 0.078 MPa. Density measurements were performed using a U-shaped vibrating-tube densimeter; kinematic viscosities were obtained using Cannon–Fenske capillary viscometers. The results show that density decreased with increasing temperature and diesel content. The excess molar volume (VE) was negative for all mixtures; the strongest volumetric contraction took place at around x1 ≈ 0.4–0.6. The Redlich–Kister equation and the Prigogine–Flory–Patterson (PFP) model were applied to represent excess molar volumes, with an absolute average deviation (AAD) lower than 14.92%. The thermal expansion coefficient () and its excess property () further confirmed the existence of non-ideal mixing driven by polar–apolar interactions. The kinematic viscosity () was confirmed to be temperature-dependent and increased with the amount of FAMEs; this effect can be associated with the greater polarity and structural rigidity of esters. The McAllister model also adequately reproduced the dynamic viscosity () with an AAD < 4.2%. Furthermore, an increase in the activation enthalpy () was observed at higher FAME fractions, indicating a high energy demand is required to overcome the internal energy barrier for the initial displacement of the molecules.
1. Introduction
Biofuels produced from biomass represent a renewable energy source whose utilization has been consolidated as a strategic alternative to fossil fuels [1]. Among biofuels, bioethanol and biodiesel are the most relevant; bioethanol is obtained through the fermentation of sugars or starches while biodiesel is produced from transesterification of oils or fats. Both are compatible with existing internal combustion engine technologies and the fuel distribution network [2].
The operation of an engine with vegetable oil was demonstrated at the end of the nineteenth century, while the first vehicles were designed based on ethanol as fuels. However, the development and low cost of petroleum-derived fuels throughout the twentieth century relegated biofuels to a secondary role until following the energy crisis of the 1970s and the rise in environmental awareness, research and application in this field gained renewed momentum [3]. Nowadays, their use is regulated in various regions of the world through mandatory blending policies in variable proportions. For instance, blends such as E10 and E85 (ethanol in gasoline) or B5, B10, and B20 (biodiesel in conventional diesel) have been widely adopted in countries such as Brazil, the United States, and members of the European Union, bringing benefits in terms of reduced greenhouse gas emissions and diversification of the energy matrix [4].
The use of liquid fuels derived from crude oil, especially diesel, contributes to a decrease in air quality and the production of greenhouse gases, as well as the generation of suspended particles, nitrogen oxides (NOx), carbon monoxide (CO), and unburned organic compounds. The amount of these pollutants emitted into the environment depends on the combustion efficiency, fuel atomization, and the quality of the air–fuel mixture within the piston [5]. Some of the hydrocarbon properties that have the greatest influence on these processes are viscosity and volumetric properties, as these determine the thermodynamic state of the fuel [6]. The kinematic viscosity plays a decisive role in the formation of the injection spray, the mean droplet diameter, jet penetration, and its dispersion with air, thereby influencing combustion efficiency, ignition delay, and the formation of carbonaceous residues [7]. Regarding volumetric properties, isobaric thermal expansivity is essential for understanding fuel behavior [8].
Therefore, the fatty acid methyl esters (FAMEs) produced from waste oils or fats have become increasingly established as a renewable alternative for the partial substitution of petroleum-derived diesel. Based on the oxygen content of the FAME molecules, their combustion reduces unburned material and the CO amount, and their lubricity is also enhanced [9]. In contrast, FAMEs have limitations, such as high viscosity, that affect atomization during engine operation, especially in cold climates, and they tend to oxidize during long periods of storage, generating peroxides and sediments [10]. Morita and Sugiyama [11] determined that density and viscosity alter the average droplet diameter and the concentration of pollutants in exhaust gases. An increase in biodiesel in blends with diesel increases the density and viscosity of the mixture, which promotes high NOx emissions but reduces CO emissions under certain conditions [12]. For this reason, the systematic measurement of kinematic viscosity and density for commercial diesel and fatty acid methyl ester (FAME) pseudo-binary systems, together with their derived volumetric and transport properties, constitutes a relevant research subject for understanding the molecular interactions in the temperature range of 293.15 to 353.15 K at atmospheric pressure.
2. Materials and Methods
2.1. Fuel Characterization
The diesel was collected from a local service fuel station in Mexico City. Table 1 shows the tests, methods [13,14,15,16,17], and results of the experimental characterization of the diesel sample carried out in our laboratory, where distillation tests were performed at the atmospheric pressure of Mexico City (0.078 MPa).
Table 1.
Properties of commercial diesel.
The chicken fat sample consisted of the residues left after cooking and was collected from several Mexican rotisserie establishments located in the Tehuantepec region of Oaxaca, Mexico. This fat was subject to pretreatment that consisted of washing the fat with distilled water, followed by centrifugation, filtering and drying at 373.15 K. The latter stages were done to remove the suspended solids, proteins, inorganic salts, water-soluble compounds and moisture, aiming to attain a high yield of transesterification; in contrast, water can promote the hydrolysis of triglycerides that tend to produce free fatty acids (FFAs) and subsequent secondary saponification [9,18]. Afterwards, the saponification index (SI) for the residual chicken fat was 195.71 mg KOH·g−1 oil. Literature data indicate an SI content between 168 and 196 mg KOH·g−1 fat for pork lard and chicken fat [19,20].
Pretreated chicken fat was esterified with methanol at 333.15 K, aiming to diminish the free fatty acids; esterification was carried out using sulfuric acid as a catalyst at 0.7 wt% for 2 h and a molar ratio of methanol:fat of 6:1 based on a literature survey [21,22]. Afterwards, the remaining fluid was stabilized for 24 h to allow for phase separation, yielding a pretreated fat (heavy) phase and an FFA-rich phase (light). The fat fraction was washed with distilled water to remove the excess alcohol and traces of catalyst, followed by drying at 373.15 K.
The esterified fat was mixed with methanol at a molar ratio of 6:1 to carry out the transesterification using potassium hydroxide (1 wt%) as a catalyst for 1 h at 338.15 K. Afterwards, the fluid was kept stable for 24 h for further phase separation [21]. The upper phase rich in FAMEs was extracted to be washed with distilled water to remove catalyst and alcohol at 323.15 K. Water was removed from biodiesel by decantation, and traces of moisture together with volatile compounds were removed by evaporation at 373.15 K [9,23].
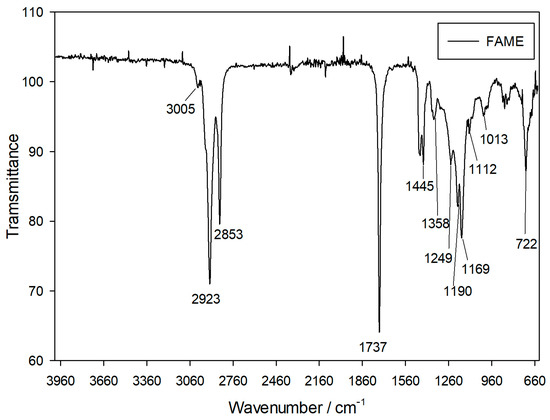
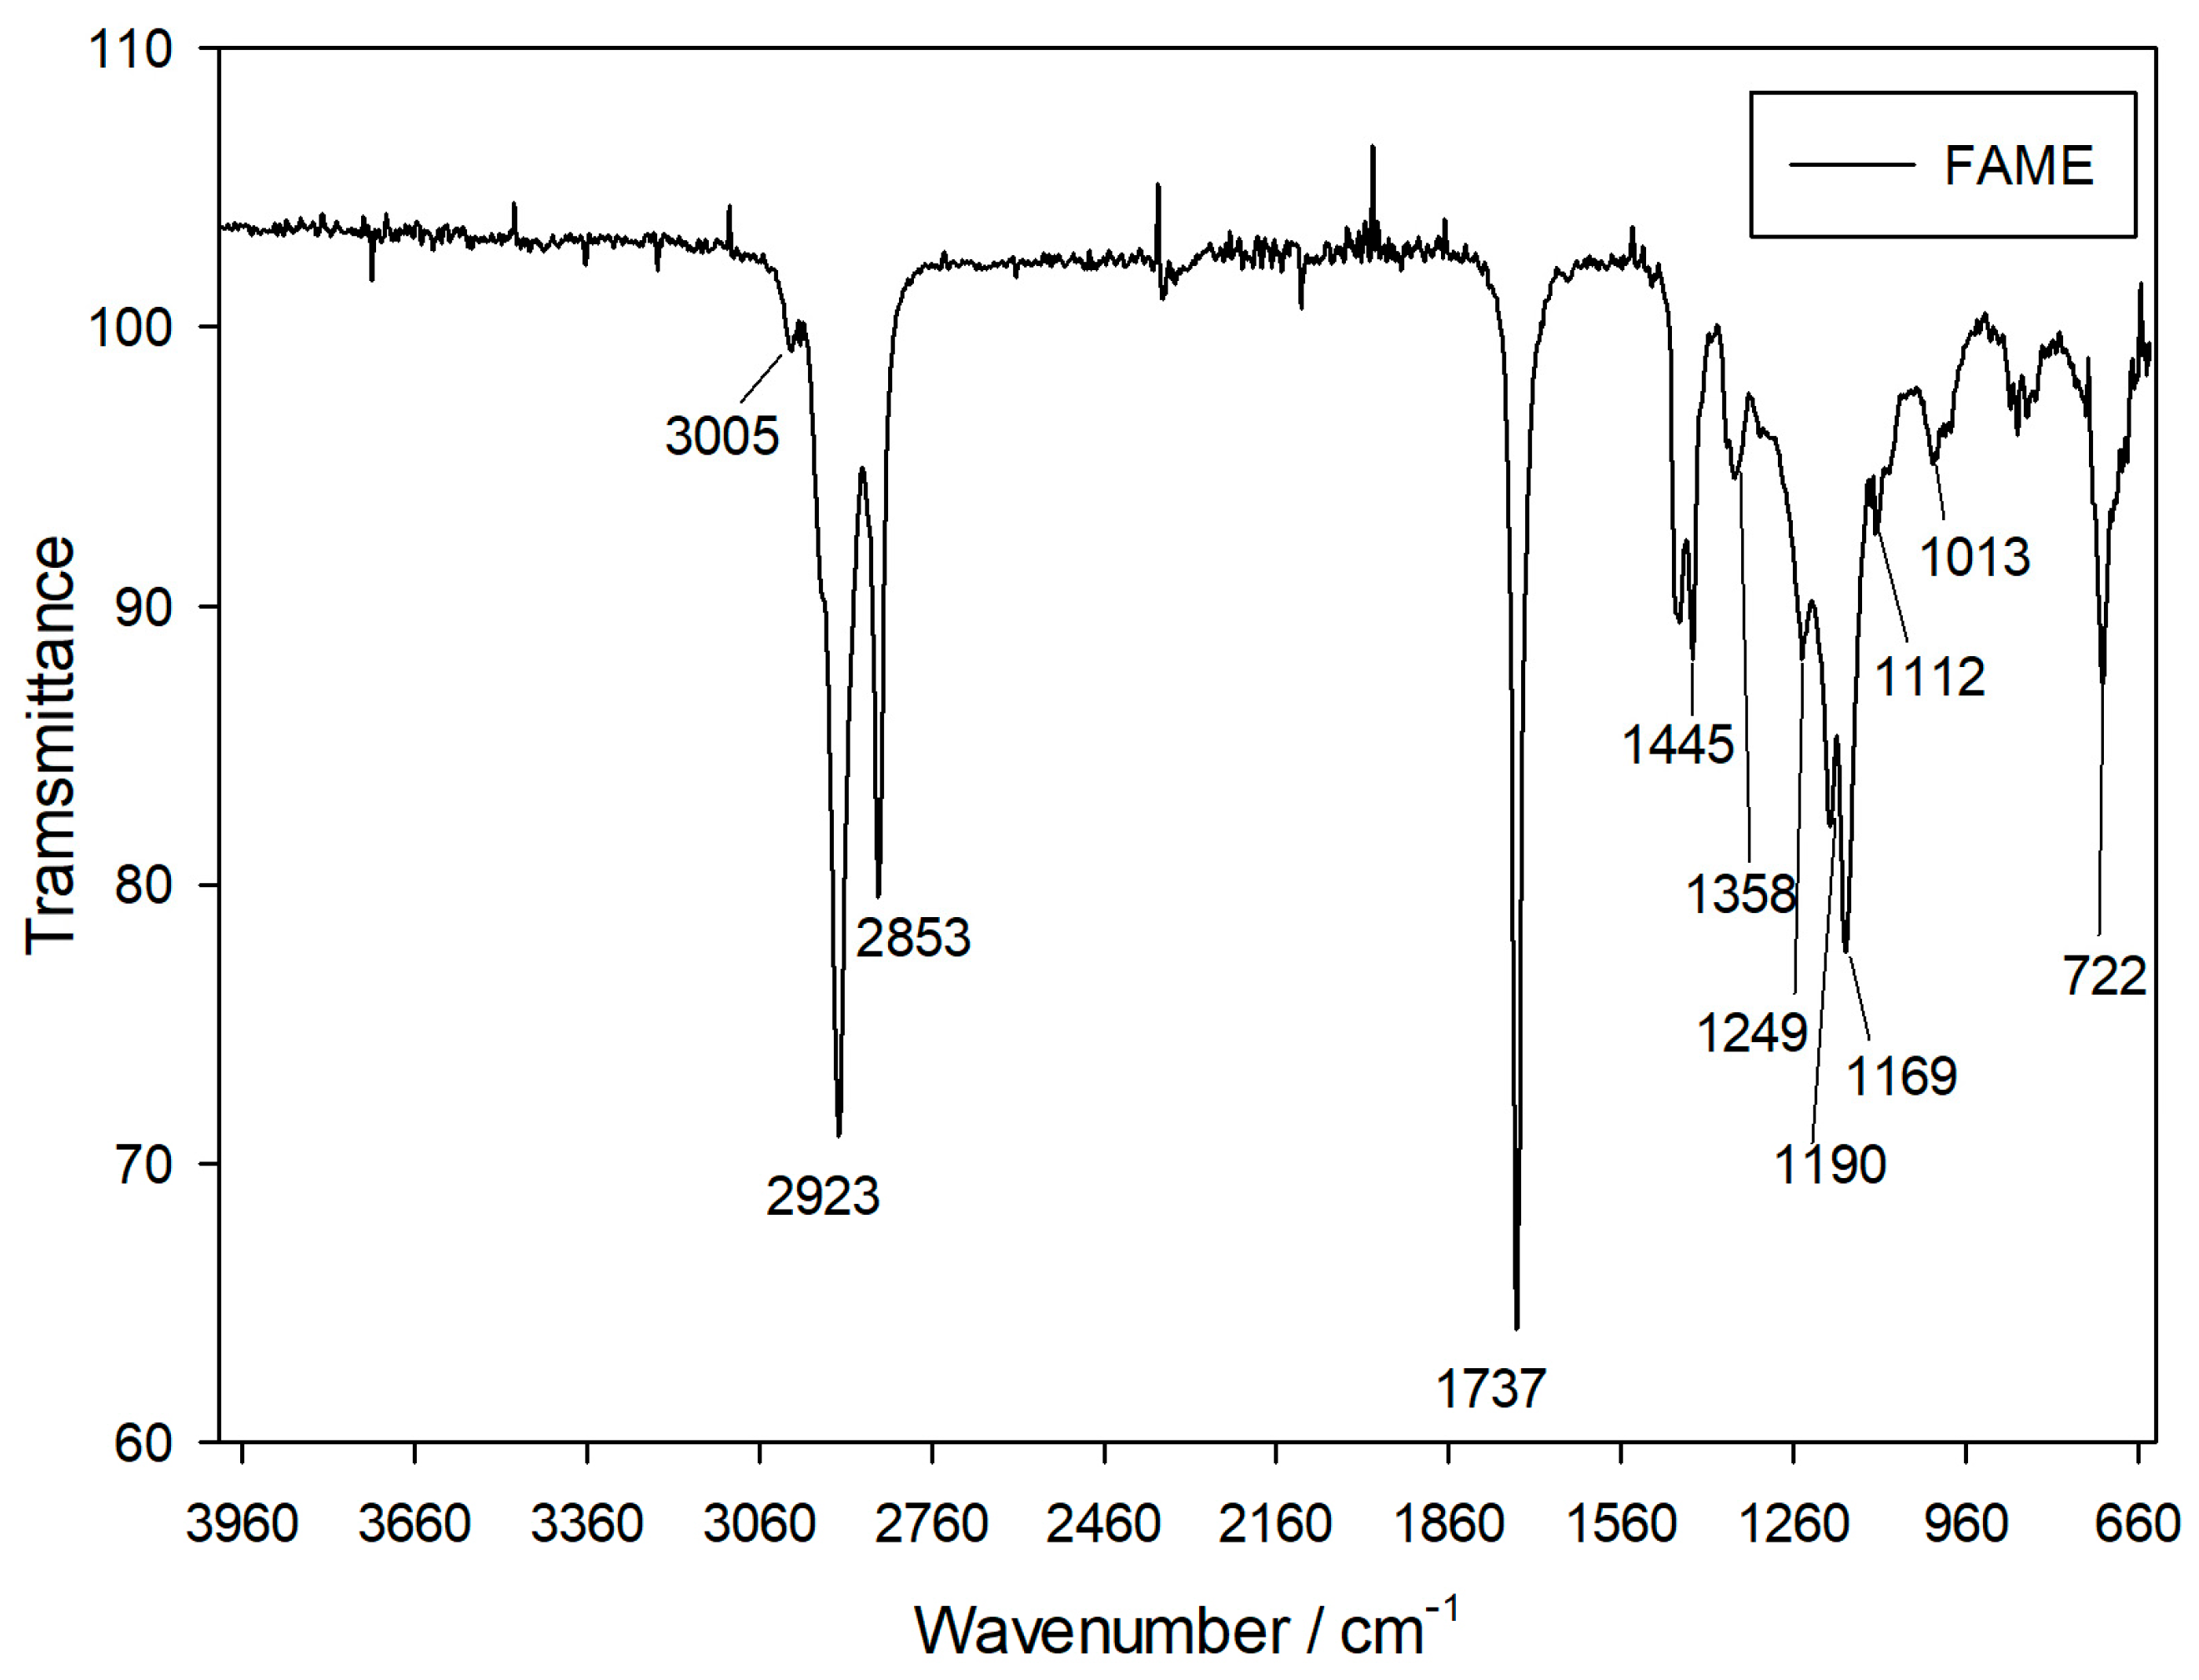
Fourier Transform Infrared Spectroscopy (FTIR) analysis was carried out with the purpose of identifying the characteristic functional groups present in the FAME. The FTIR spectrum of the biodiesel produced from residual chicken fat is depicted in Figure 1 and exhibits the distinct absorption bands associated with fatty acid methyl esters (FAMEs). A strong band at 1737 cm−1 corresponds to the carbonyl stretching vibration ν(C=O), which is typical of ester functional groups [24]. The transesterification that produced the fatty acid methyl esters was also confirmed by the C–O–C stretching vibrations ν(C–O–C) identified by the bands at 1249, 1169, 1112, and 1013 cm−1 [25,26], as well as the CH3 groups adjacent to the carbonyl group within the ester molecule identified at 1190 cm−1 [27]. The presence of long hydrocarbon chains derived from fatty acids was confirmed by the bending vibration (CH2) at 722 cm−1; the aliphatic stretching vibrations ν(C–H) were associated with the peaks at 2923 and 2853 cm−1. Cis-type unsaturation (oleate/linoleate) seems to be confirmed by the weak signal at 3005 cm−1 that was produced by unsaturated fatty (oleic and linoleic) acids [26]. Low concentrations of impurities can be indirectly confirmed in the biodiesel sample since no significant signals were observed at 3600–3200 cm−1, associated with water or alcohols, at 1705 cm−1 for free fatty acids or at 1560 and 1410 cm−1 for carboxylate salts, as well as any signals associated with monoglycerides or diglycerides [28,29].
Figure 1.
FTIR spectrum of biodiesel (FAME) derived from residual chicken fat.
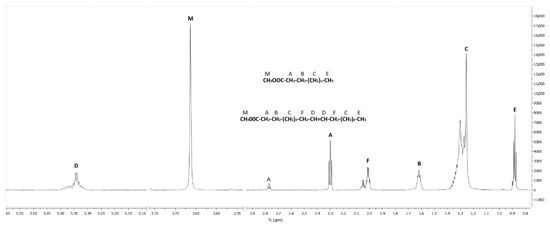
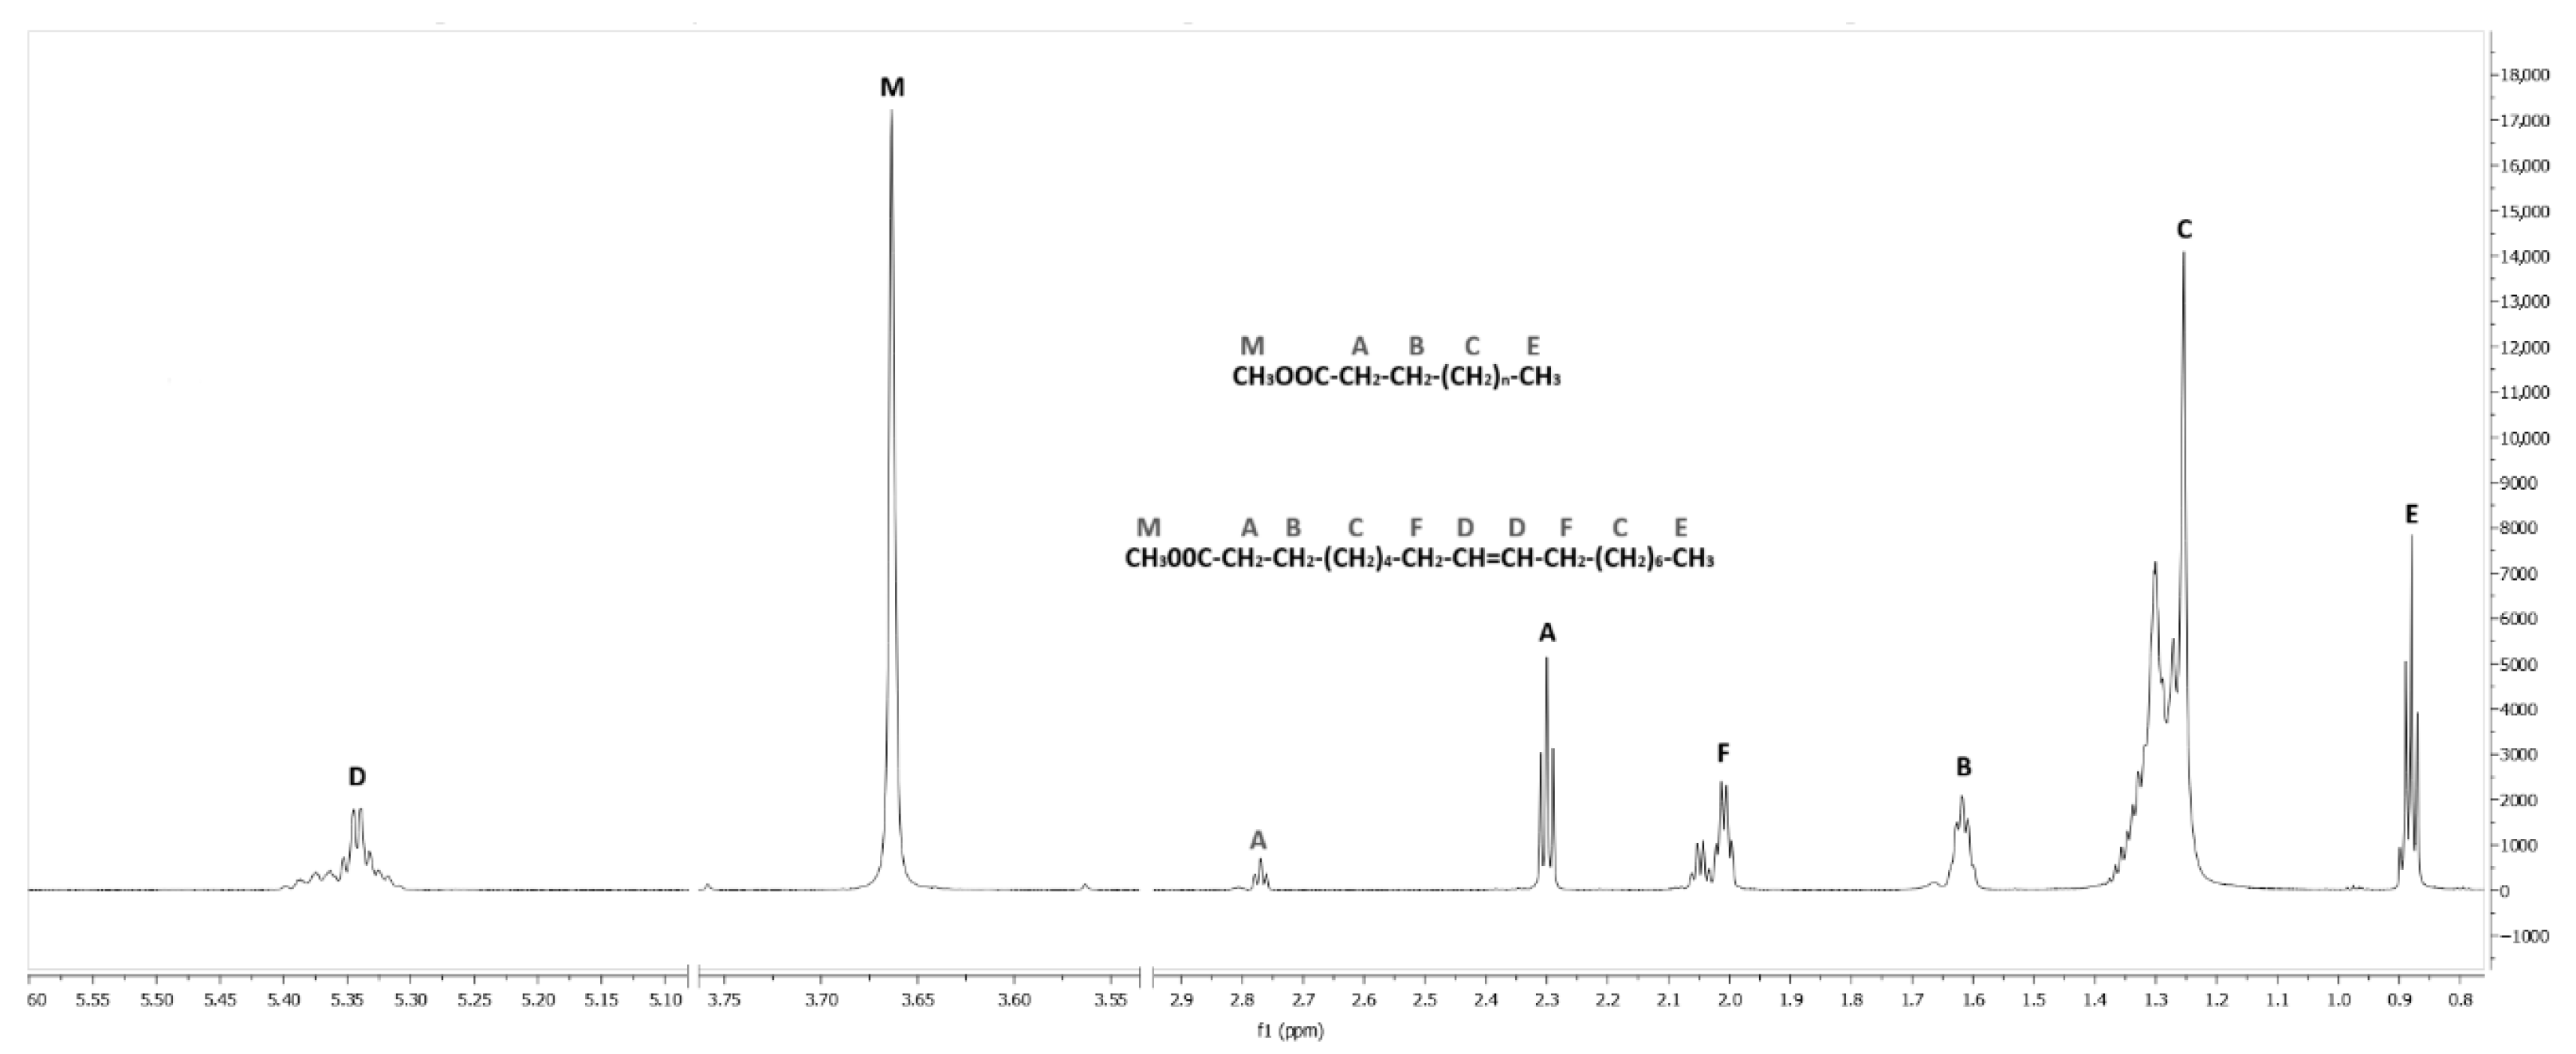
The transesterification reaction was verified by 1H-NMR analysis (Bruker spectrometer at 750 MHz, using CDCl3 as a solvent); the spectrum for the FAME is depicted in Figure 2. The multiplet (D) between 5.30 and 5.40 ppm was ascribed to the olefinic protons (–CH=CH–) of unsaturated fatty acids; it indicates that the lipids have double bonds [30]. The highest peak was the singlet (M) at 3.65–3.70 ppm that corresponds to the methoxy group (–O–CH3) of the methyl ester [30,31]. The weak triplet signal (A) observed between 2.75 and 2.85 ppm represents an allylic group with protons adjacent to double bonds that corroborates unsaturated chains [31,32]; the other triplet (A) between 2.2 and 2.4 ppm was attributed to the two protons of the methylene group α next to the carbonyl (–CH2–COO–). A triplet (F) between 1.90 and 2.10 ppm revealed bis-allylic protons, which confirmed polyunsaturated fatty acids. The multiplet (B) between 1.55 and 1.70 ppm indicates β-methylene protons related to the carbonyl group. The signal (C) between 1.20 and 1.46 ppm was ascribed to the aliphatic –(CH2)ₙ– chain of the long-chain fatty acid esters. The triplet (E) at 0.80–0.95 ppm indicates a methyl group [33]. Finally, the yield was determined by characteristic signals identified in the 1H-NMR spectrum based on Equation (1):
where is the integrated area of the methoxy singlet (M), and is the integrated area of the triplet A (2.2–2.4 ppm). The calculated yield was 94.5%.
Figure 2.
1H NMR spectrum of the FAME obtained from catalytic transesterification of chicken fat.
2.2. Density Measurements
The molecular weight for diesel and biodiesel was estimated by cryoscopy (WR 5009, Precision Systems, Natick, MA, USA); the reported values were 182.37 g·mol−1, = 10.6 g·mol−1 (k = 2) for diesel and 296.11 g·mol−1, = 12.4 g·mol−1 (k = 2) for the FAME. Since both materials are multicomponent mixtures, the reported values correspond to the average molecular weights of the samples analyzed. Binary mixtures of diesel () and FAME () were prepared gravimetrically by successive weighing on a high-precision analytical balance (sensitivity ±0.1 mg, EP 520A, Precisa Gravimetrics AG, Zurich, Switzerland). Each pseudo-component, stored in separate flasks, was degassed under vacuum with controlled heating to avoid evaporation and stirred magnetically to ensure homogeneity. For each composition, biodiesel was first transferred to an amber flask and weighed, followed by diesel, ensuring controlled and reproducible mixture preparation.
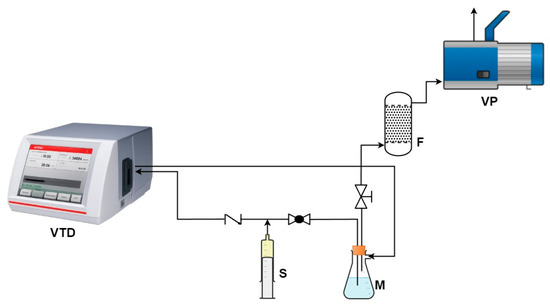
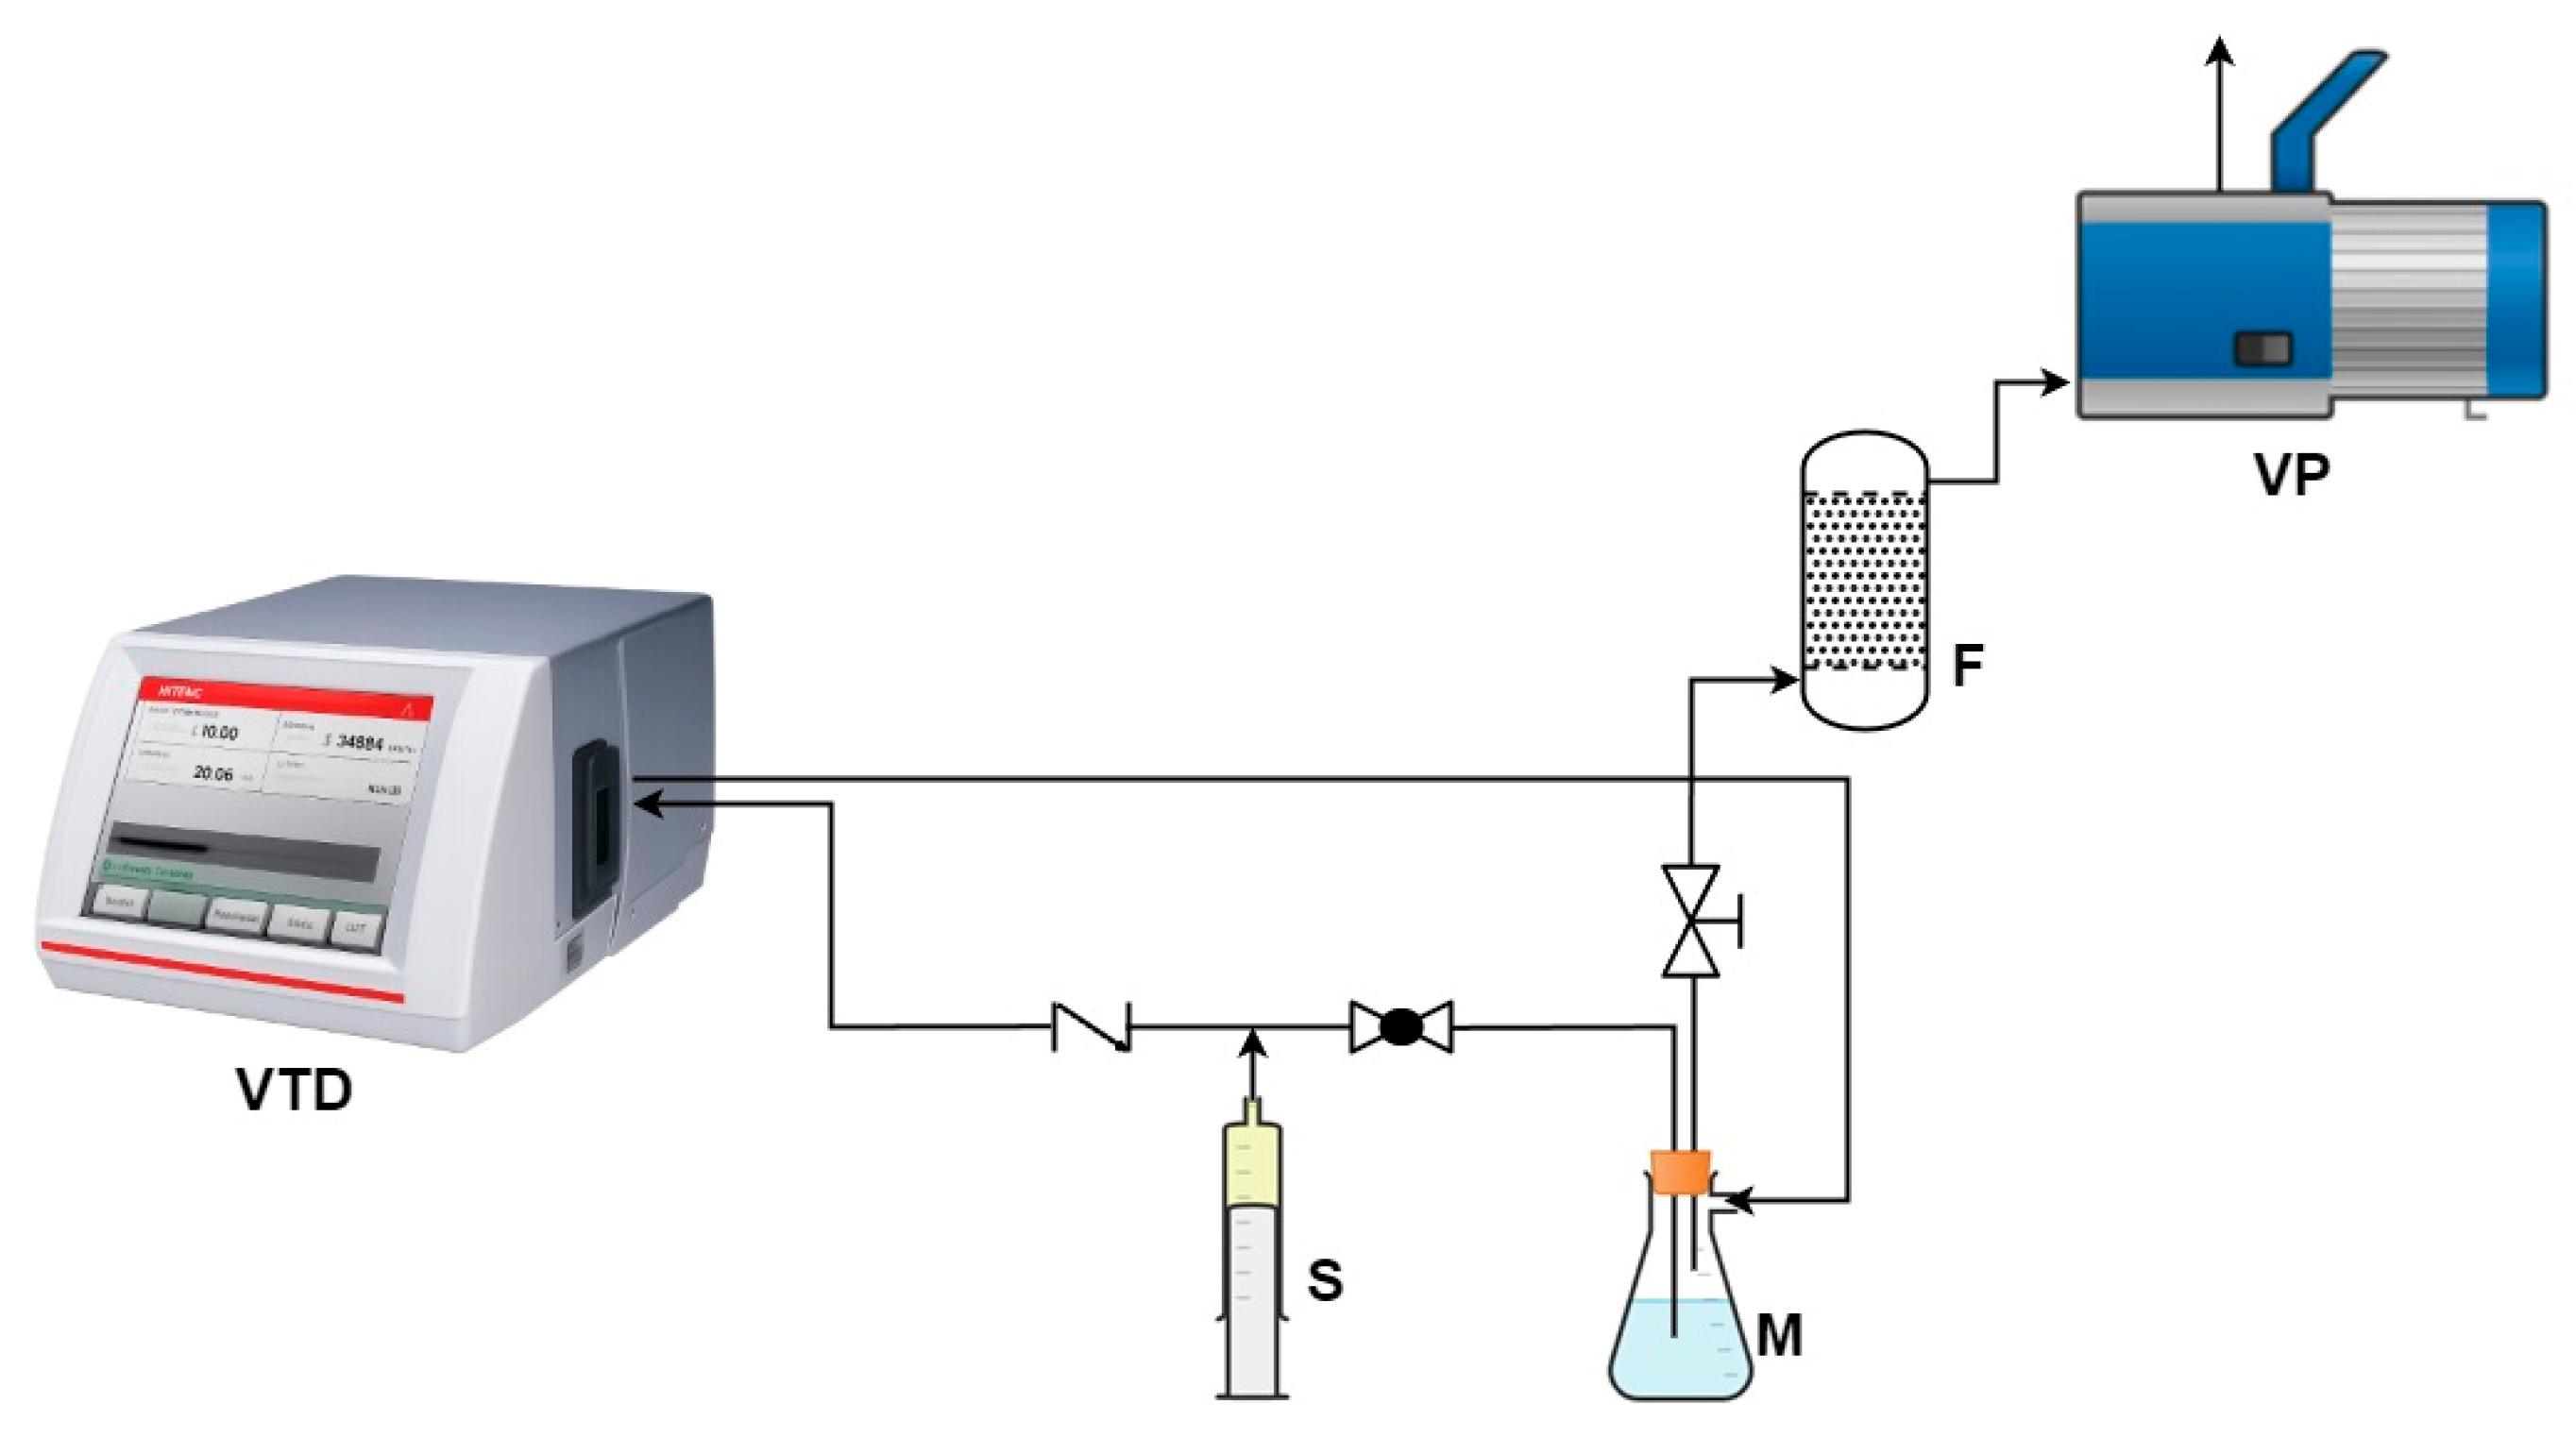
The density measurements of the commercial diesel + FAME mixtures were carried out with four repetitions for each experimental point by transferring a portion of the homogeneous mixture to a Büchner flask, which was configured as part of a closed-loop circuit, based on Figure 3, and connected to a (Anton Paar DMA 4500M, Graz, Austria) vibrating-tube densimeter (VTD). The VTD has an internal temperature sensor; previous calibrations indicated uncertainties of g·cm−3 and 0.02 K. The top of the Büchner flask was connected to a 10 cm3 syringe (S), which was attached to one inlet of the VTD; the other inlet was alternately coupled to the dry air cartridge (F), vacuum pump (VP), or lateral flask. This configuration ensured dry-air operation under atmospheric pressure, a careful mixture feed from the flask to the VTD and reproducibility of measurements by minimizing evaporation of light components.
Figure 3.
Schematic representation of the experimental setup for density measurements.
2.3. Calculations of Volumetric Properties
The excess molar volume () for the mixture in cm3·mol−1 was determined as the difference between the corresponding experimental molar volume and the ideal molar volume, which is the sum of the molar fraction multiplied by the molar volume of each species i as a function of the number of species, according to Equation (2):
where PM is the molecular weight of the mixture, is the density of the mixture, and , , and , correspond to the mole fraction, molecular weight, and density, in that order, of commercial diesel (superscript 1) and biodiesel (superscript 2). Furthermore, the behavior of was correlated using the Redlich–Kister polynomial function as expressed in Equation (3):
where denotes the order of the polynomial expression limited to a fifth-order function and represents each fitting parameter.
In addition, the Prigogine–Flory–Patterson (PFP) model is a very useful tool for the analysis of the behavior of non-ideal mixtures, since it relates ideal volumetric deviations to the physical mechanisms that dominate intermolecular interactions. This model is based on Flory’s solution theory [34,35,36,37], later expanded by Prigogine [38,39] and Patterson [40], incorporating into the model the effects of molecular size, interaction energy, and the internal cohesion of the components.
According to the PFP model, the excess molar volume () is composed of three independent physical contributions. These contributions represent different molecular mechanisms that simultaneously intervene during the mixing process, which is expressed by the following equation:
where (the first contribution) is the term representing the energetic interaction between different molecules and indicates the cohesive energies, (the second contribution) is the term related to the free volume, and (the third contribution) is the term linked to the internal pressures, related to the difference in internal cohesive forces of each component. The developed model is expressed as [41]:
where , cm3 mol−1, is the excess molar volume; is the mole fraction; , cm3 mol−1, is the characteristic volume; , MPa, is the characteristic pressure; is the molecular contact energy fraction; is the molecular surface fraction; and , J·cm−3, is the interaction parameter of the PFP model, determined by nonlinear least-squares regression minimizing the difference between experimental and calculated excess molar volumes.
Meanwhile, the reduced volume is represented by Equation (6):
where , in K−1, is the isobaric thermal expansivity of the pure component. On the other hand, the characteristic pressure is expressed as follows
where , in MPa−1, is the isothermal compressibility of the pure components; these values were taken from the literature and are shown in Table 2.
Table 2.
Values of the isothermal compressibility of the pure components reported in the literature.
Likewise, the characteristic volume is represented by Equation (8), where :
Meanwhile, the fraction of molecular contact energy is given by the following equation:
The reduced volume of the binary mixture is defined as [44]:
is a hard-core volume fraction and is expressed by the following equation:
The molecular surface fraction, , is given by Equation (12):
In addition, is the surface-to-volume ratio of the molecular fraction of the components determined by the Bondi method [45]:
In addition, the partial molar volumes of diesel and biodiesel () were calculated according to Equations (14) and (15):
where is the molar volume of the FAME and is the molar volume of diesel.
The isobaric thermal expansion coefficient for each mixture was calculated according to the function and the first-order function to calculate density (); therefore,
where and correspond to the interception and the slope, respectively.
Meanwhile, the excess isobaric thermal expansion coefficient for the mixture, , was determined by
This expression depends on the mole fraction () and the thermal expansion coefficient () of the component . This expression allows quantification of deviations from ideal behavior, which are attributed to intermolecular interactions between the components [46].
2.4. Transport Properties
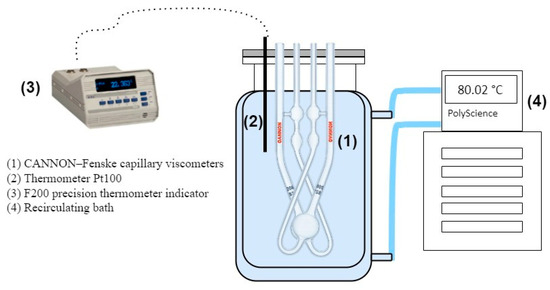
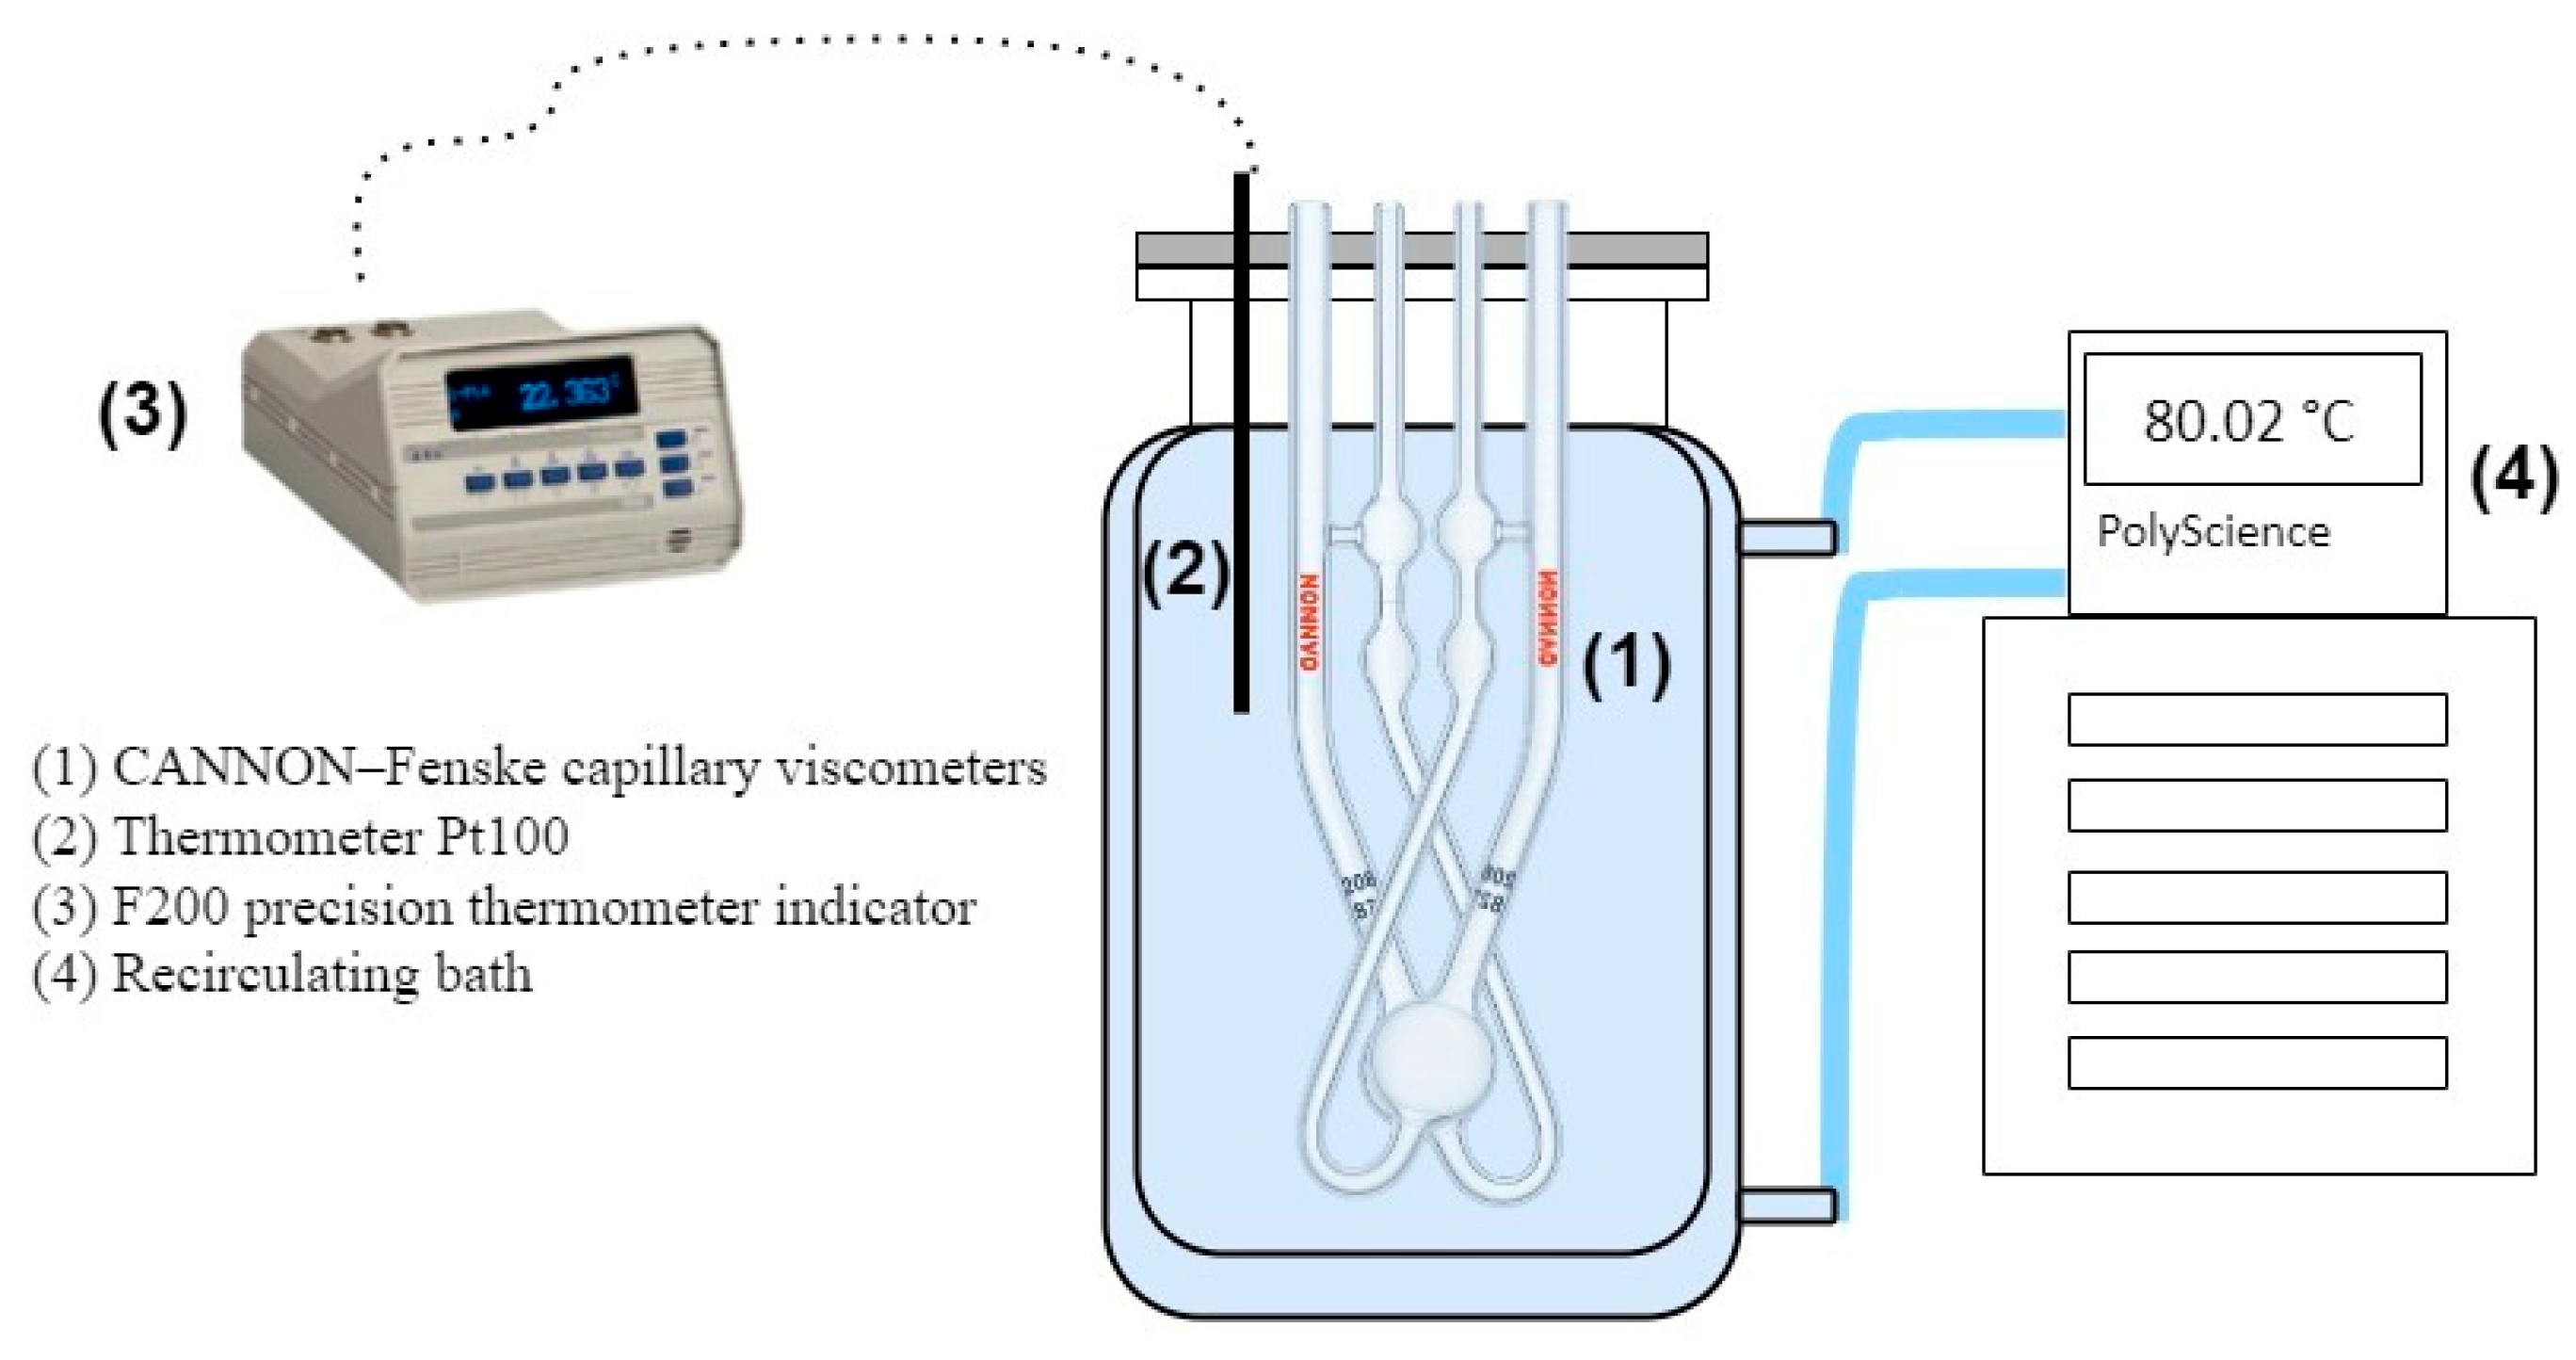
The kinematic viscosity () was determined experimentally using two calibrated capillary viscometers with sizes of 75 and 100 (Cannon Instrument Company, State College, PA, USA). The viscosity was calculated by relating the efflux time () to the corresponding viscometer constant () at each temperature, according to the expression , repeating the measurement four times for each temperature and composition point. The viscometers (1) were immersed in a water bath, as depicted in Figure 4, and the temperature was controlled by a recirculating bath (4) (Polyscience, PD07R, Niles, IL, USA) with a thermal stability of ±0.005 K. The temperature stability of the water bath container was ±0.02 K, ensuring uniform measurement conditions. A PT-100 (2) thermometer (Thermo-Est, Maizières-les-Metz, France) measured the system temperature and was connected to a temperature indicator (3) (ASL, F200, Redhill, UK).
Figure 4.
Schematic representation of the experimental setup for viscosity measurements.
Once the kinematic viscosity was measured, the dynamic viscosity () was calculated and subsequently the dynamic viscosity deviation () was determined using the following expression:
where is the dynamic viscosity of the mixture and the variables and are the mole fraction and the dynamic viscosity of diesel (component 1) and biodiesel (component 2), respectively.
The four-body McAllister model [47] was employed to represent the experimental dynamic viscosity data, which is expressed by:
where , , and denote the optimized parameters.
The thermodynamic activation parameters associated with viscous flow were determined using Eyring’s equation which is derived from the transition-state theory for liquids [48]:
where is the dynamic viscosity (Pa·s), denotes Planck’s constant , is Avogadro’s number , is the molar volume , symbolizes the Gibbs free energy of activation for viscous flow , is the universal gas constant (8.3144 ) and expresses the temperature ().
Moreover, the Gibbs free energy of activation is related to the enthalpy and entropy of activation according to ; hence, by substituting the last equation into Equation (20) and linearizing:
Thus, the graphical representation of versus enables the determination of the activation parameters; the slope of the linear fit corresponds to , whereas the y-intercept is equal to . From these values, and can be obtained for each composition, providing fundamental information on the energetic barriers and the degree of molecular organization associated with the viscous-flow process.
3. Results
3.1. Density Determination
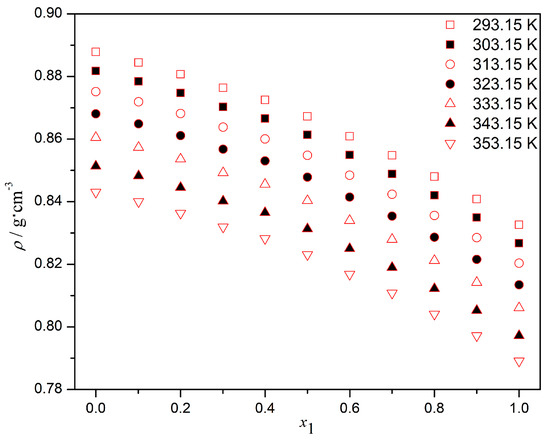
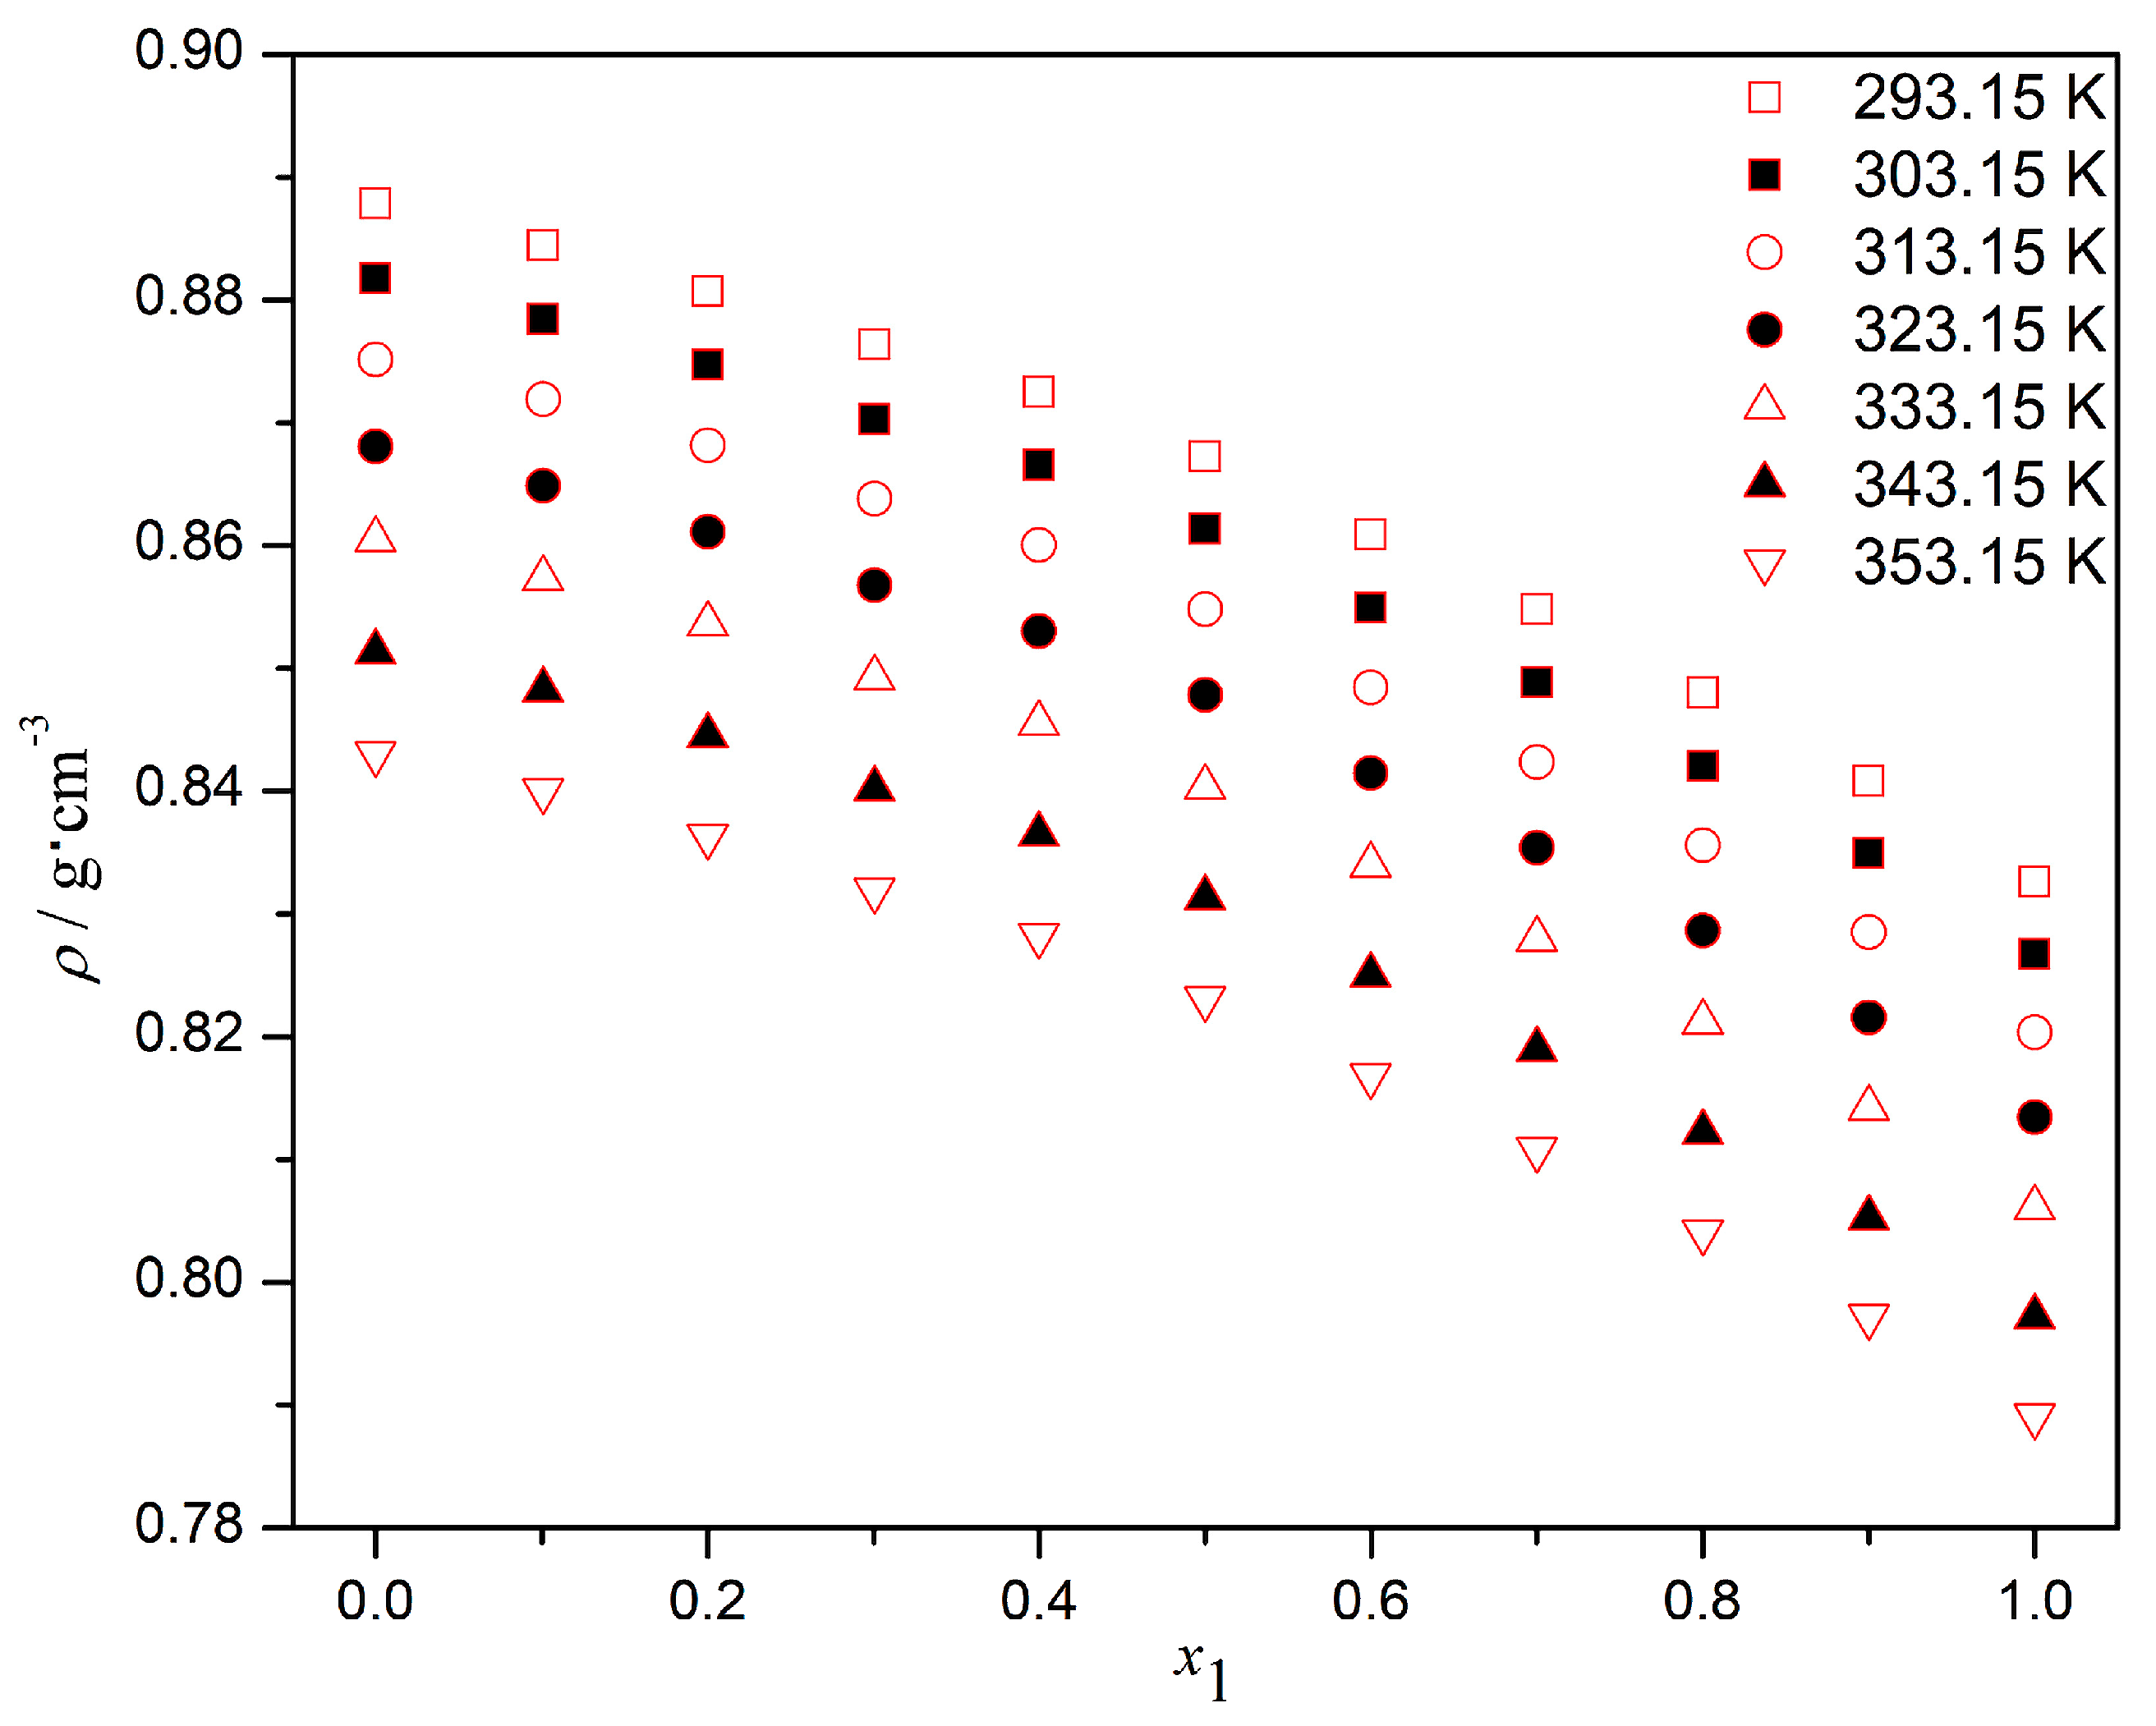
The experimental density () for the mixture of commercial diesel (1) and residual chicken fat methyl ester biodiesel (2) is presented isothermally in Figure 5 and summarized in Table 3. In the temperature range of 293.15 to 353.15 K and 0.078 MPa, the density decreased with increasing temperature and with high amounts of commercial diesel (). This phenomenon has been described for diesel and biodiesel mixtures, where biodiesel typically exhibited densities between 0.82 and 0.90 g·cm−3, compared to 0.74 to 0.86 g·cm−3 for diesel [42,49,50,51]. The synergistic contributions of dispersive and polar forces contributed to the described behavior, typical of non-ideal mixtures between nonpolar compounds (hydrocarbons) and oxygenated molecules [52,53].
Figure 5.
Densities for commercial diesel () + residual chicken biodiesel () at atmospheric pressure.
Table 3.
Densities of the mixture of commercial diesel () + FAME () derived from residual chicken fat.
The decrease in density with increasing amounts of commercial diesel represented a systematic transition from a system dominated by polar and rigid molecules, such as those in FAMEs, to a predominantly nonpolar system with flexible molecules, characteristic of commercial diesel [54]. In systems with higher amounts of FAME, carbonyl (C=O) and ester (–COO–) functional groups were present, which produced dipole–dipole interactions [55]. These interactions favored a more compact and oriented organization, as the dipoles partially aligned and minimized the system’s energy, increasing the cohesion of the system in the liquid phase. Therefore, greater molecular packing was achieved, resulting in higher density values compared to commercial diesel [55,56].
It can be noted that increasing the amount of commercial diesel fuel added predominantly nonpolar molecules that were incapable of strong dipolar interactions. Therefore, induced dipole–dipole interactions or Debye forces became relevant, since the permanent dipoles of FAME could induce temporary polarization in diesel molecules. These interactions were weaker and less ordered than permanent dipole interactions, leading to a progressive loss of order in the structure and less fluid packing. Additionally, increasing the temperature weakened both dipolar and induced dipole interactions, increased molecular motion and favored fewer compact configurations [54].
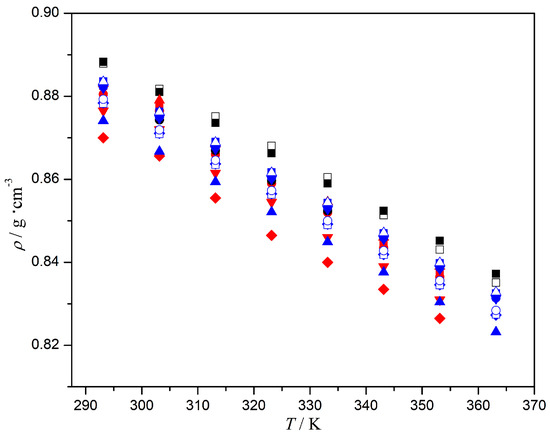
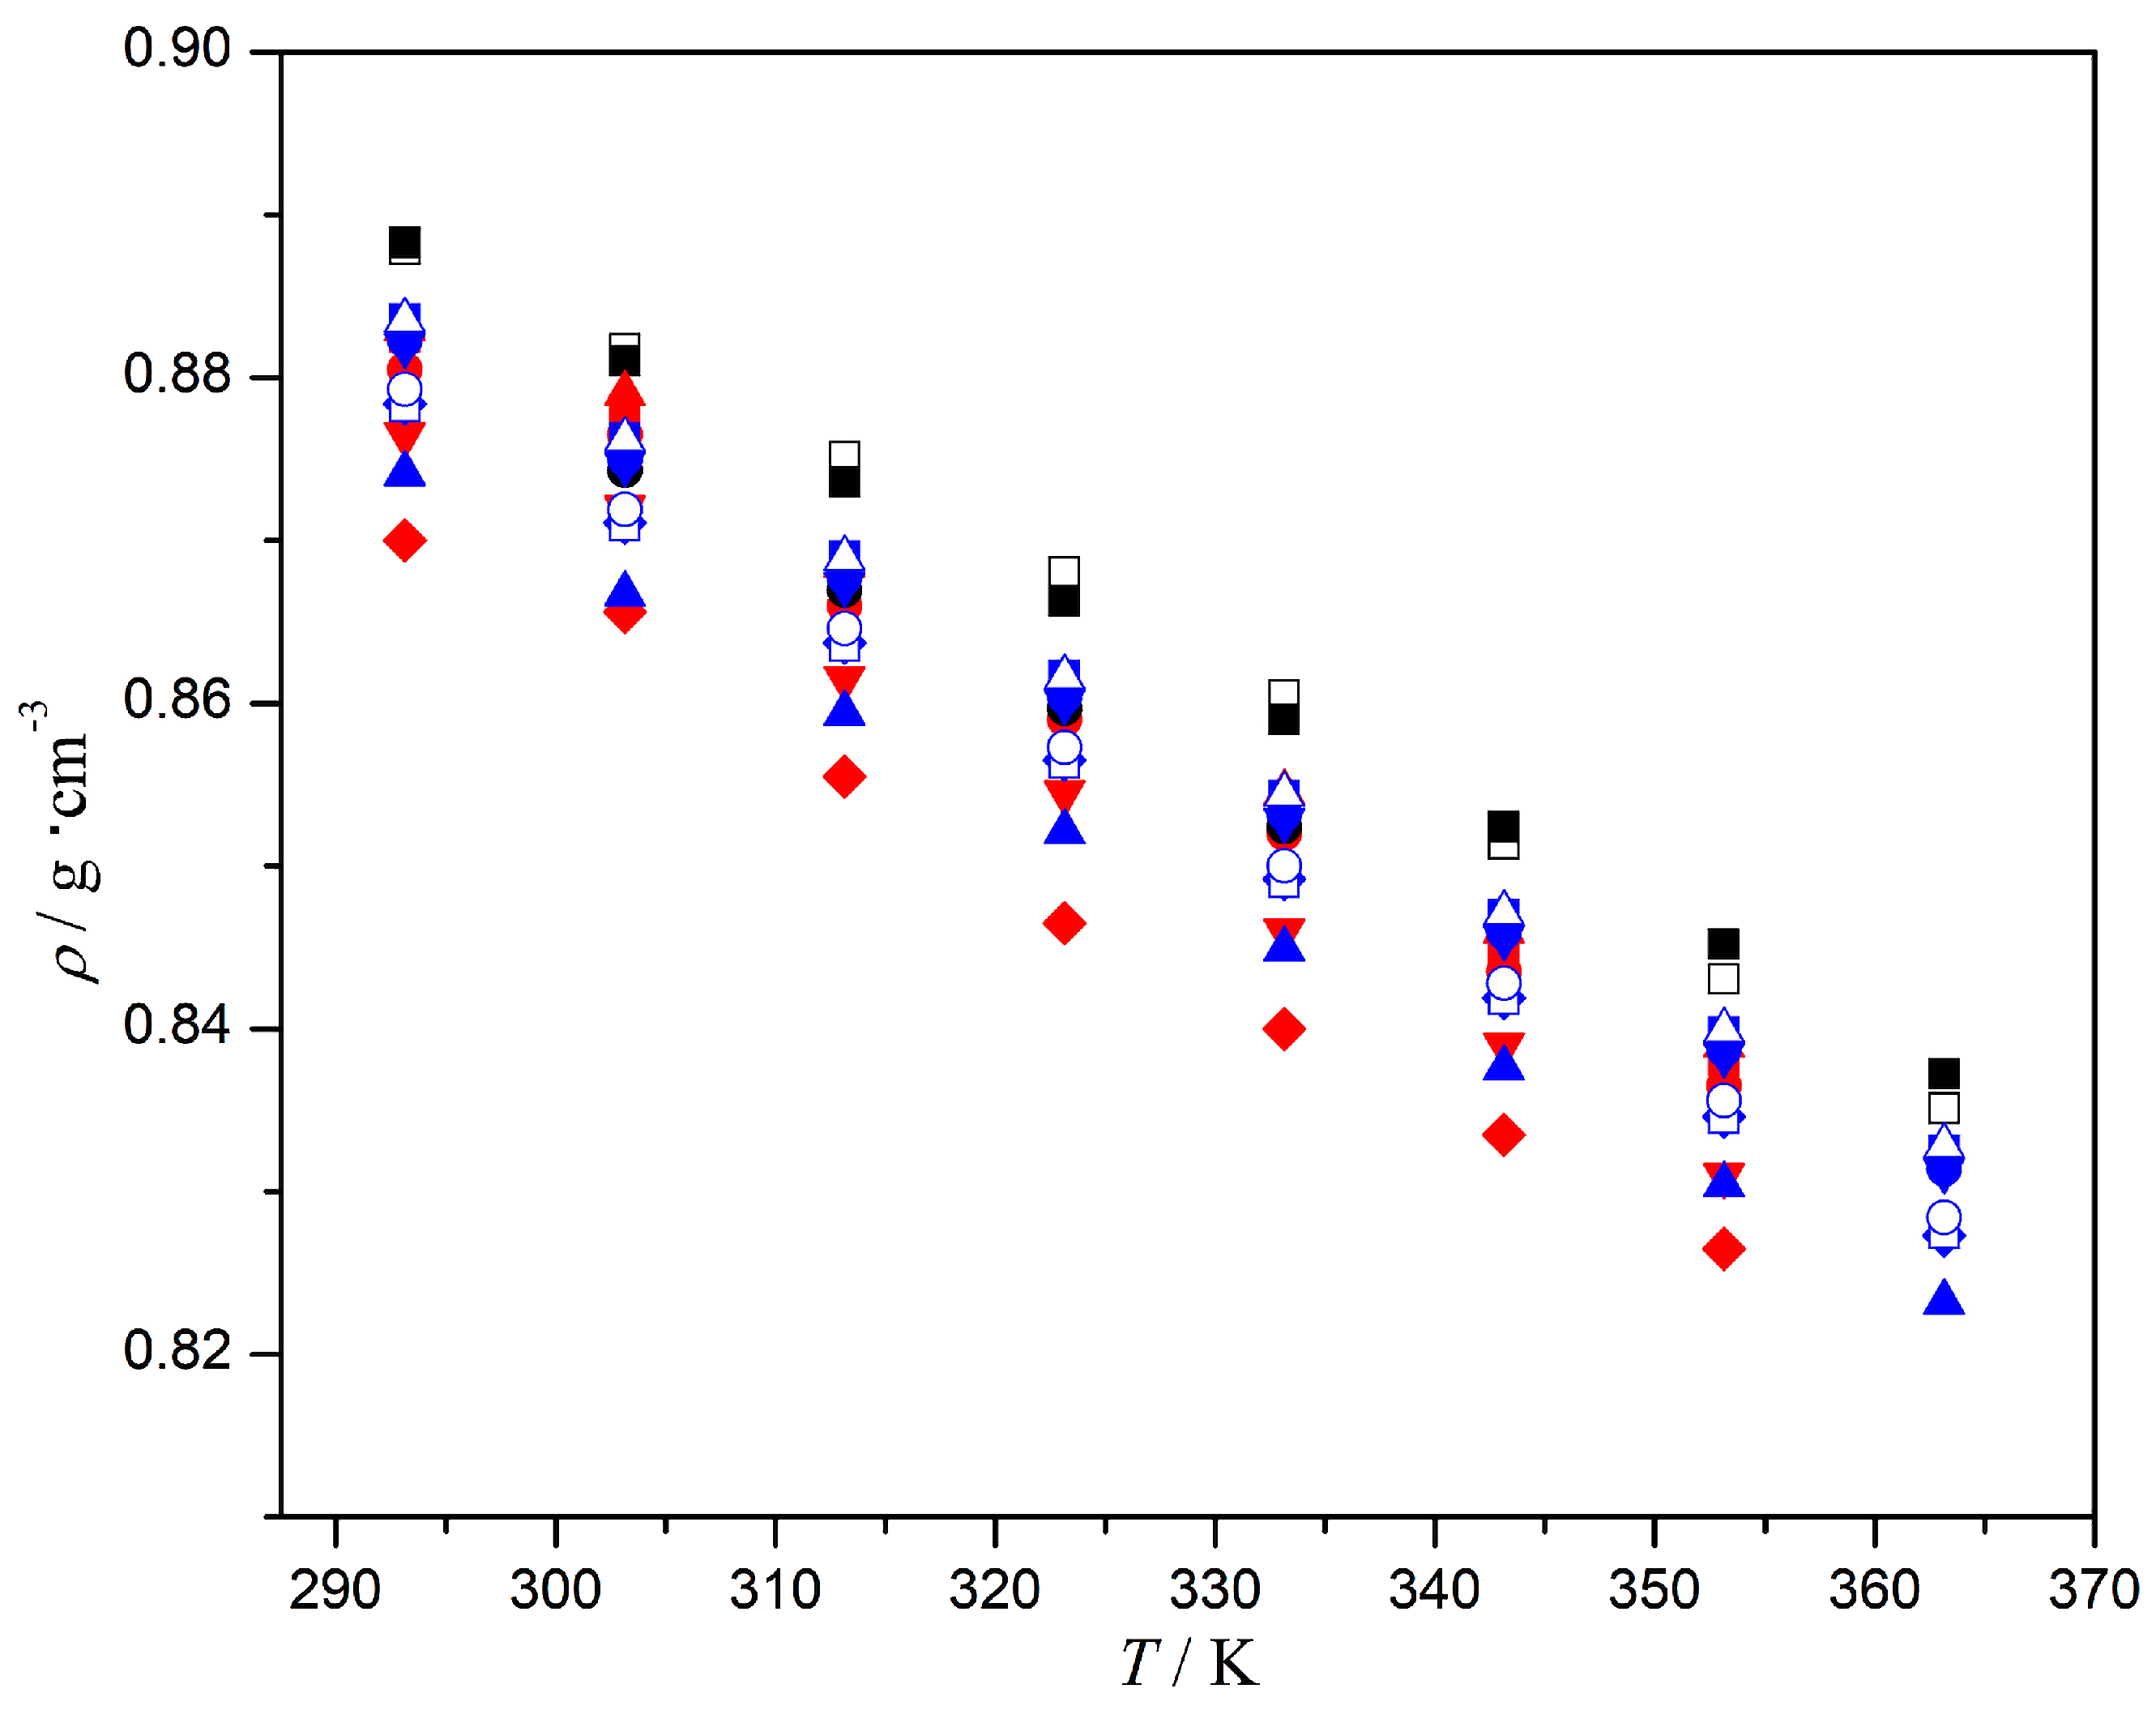
Furthermore, Figure 6 depicts the density trends of the FAMEs derived from residual chicken fat obtained in this work and those reported for fatty acid methyl esters in the literature [57,58,59,60] as a function of temperature, synthesized from various sources. The residual chicken fat biodiesel had one of the highest densities in contrast with the other biodiesel sources. Waste cooking oil methyl ester biodiesel [57] exhibited the second highest density, highlighting the nature of the recycled feedstock in that it is likely to contain multiple impurities. The density sets corresponding to the FAMEs derived from vegetable oils (soybean, canola, and sunflower) [58], as well as the FAMEs obtained from soybean, rapeseed and palm oil blends [60], have the lowest values. This behavior was consistent with biodiesel fuels derived from vegetable sources that generally contained a high composition of unsaturated esters instead of the saturated esters commonly contained in residuals or fats, as well as traces of glycerine and moisture that significantly increased the density values. Although the density of pure unsaturated esters was higher than saturated esters with the same carbon chain length, the molecular arrangement among different unsaturated components did not allow for complete packing due to the presence of cis double bonds, which introduce kinks and bending in the chains [61].
Figure 6.
Densities of chicken fat biodiesel from this work (□) and of the fatty acid methyl ester biodiesel samples reported in the literature produced from different sources: ■, waste cooking oil [57]; ■, soybean [58]; ●, canola [58], ▲, sunflower [58]; ▼, waste oil [58]; ♦, edible tallow [58]; ●, Solben Co. [59]; ■, soybean (S) [60]; ●, rapeseed (R) [60]; ▲, palm oil (P) [60]; ▼, S + R [60]; ♦, R + P [60]; □, S + P [60]; ○, S + R + P [60]; Δ, sunflower oil [60].
3.2. Volumetric Properties
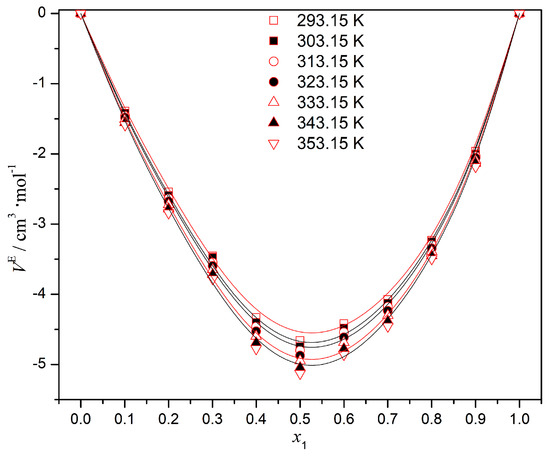
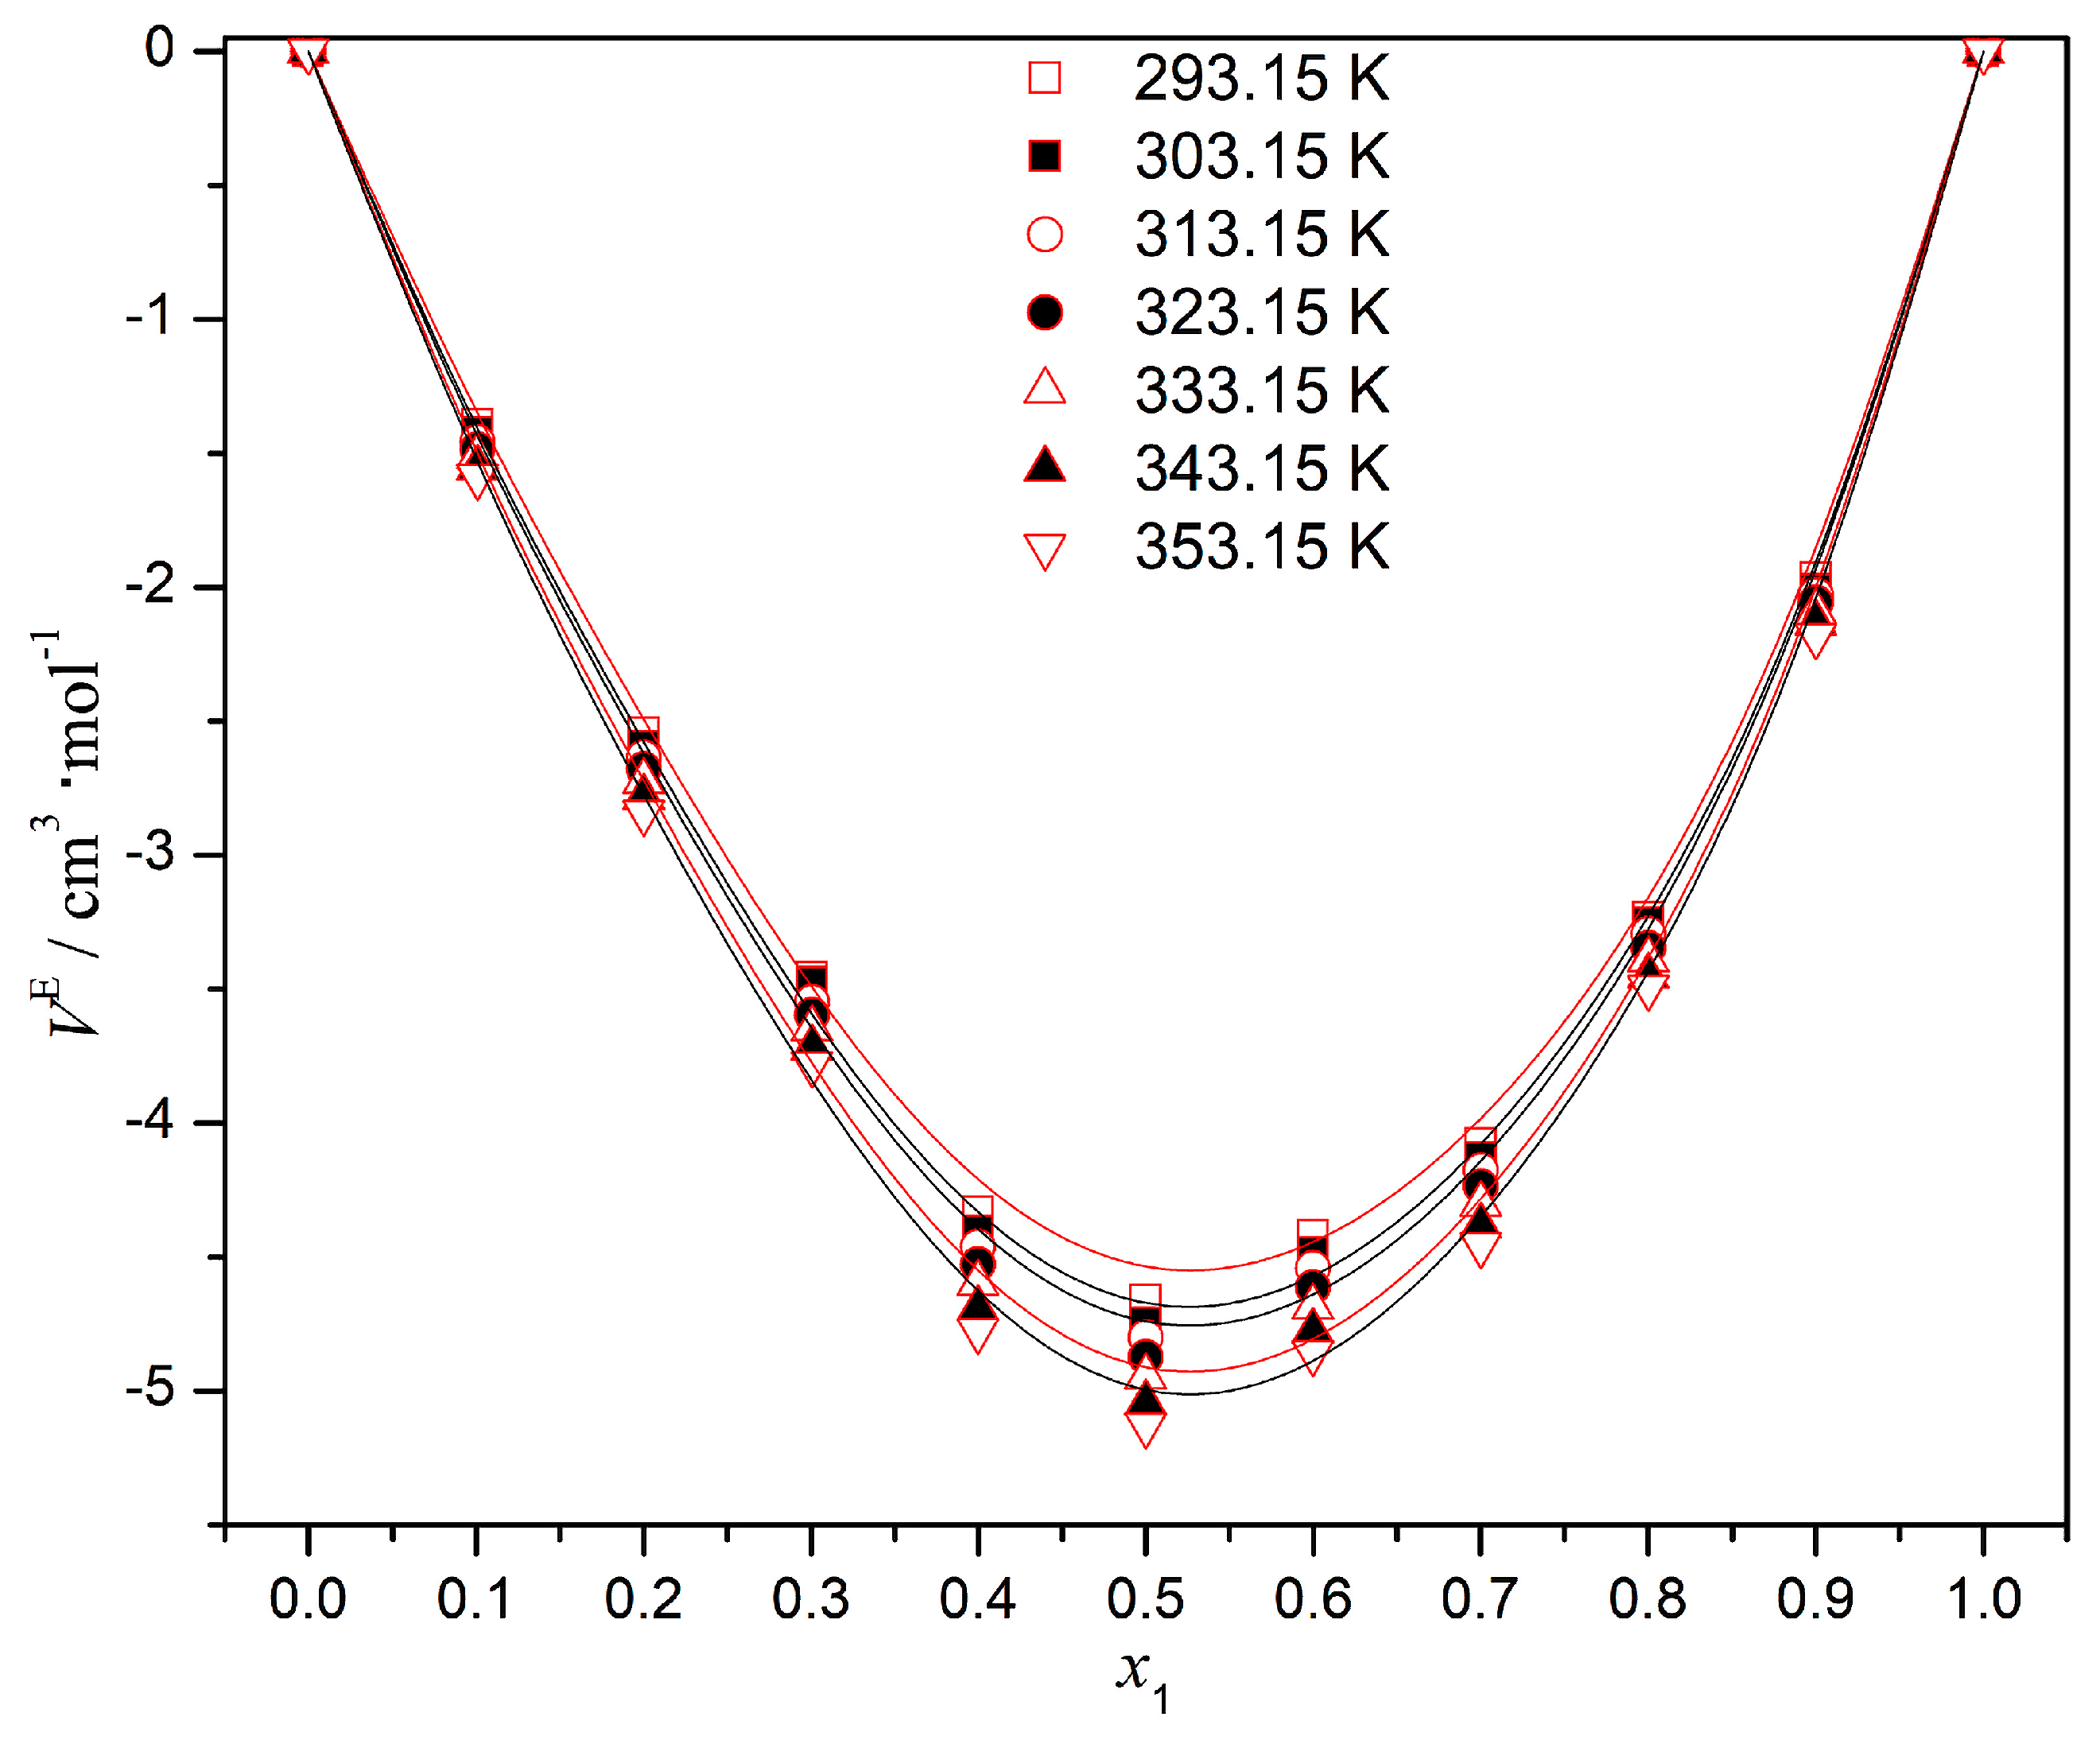
The behavior of the excess molar volume () of the commercial diesel () + chicken fat biodiesel () system is depicted in Figure 7, with symbols corresponding to the experimental values and the solid lines representing the correlation using the Redlich–Kister polynomial function. The values were negative across the entire composition range with a pronounced minimum occurring at mole fractions between 0.4 and 0.6. This negative sign indicated volumetric contraction upon mixing diesel and FAMEs, which was interpreted as occurring due to the predominance of attractive intermolecular interactions and more efficient packing between molecules of dissimilar nature (polar esters versus nonpolar hydrocarbons). Such behavior has previously been reported in studies of diesel–biodiesel mixtures and was associated with the complementary packing of molecules differing in size and polarity [57,62]. The increasing temperature, interpreted as thermal energy augmentation, meant that excess molar volumes tended to high negative values. This was ascribed to the weakening of specific interactions and orientations between ester and hydrocarbon groups, disrupting partially ordered liquid structures [63,64]. The expanded uncertainty of was estimated as (k = 2).
Figure 7.
Excess molar volumes of the commercial diesel () + residual chicken fat biodiesel () mixture.
The Redlich–Kister model accurately reproduced the overall trend of the experimental data, including the position of the minimum values. The excellent agreement between the experimental and calculated values, represented by the solid lines, was confirmed by the low absolute average deviation (AAD), as shown in Table 4, together with the parameters. The results from the Redlich–Kister polynomial for describing excess molar volumes in fuel mixtures agreed with the findings reported elsewhere [42,65]. The negative A0 values (from −18.425 to −20.312) confirmed the predominance of negative excess volumes, evidencing attractive interactions between FAME and diesel molecules. The progressive increase in A0 and A1 parameters with temperature confirmed the non-ideal behavior, where the molecules tended to lose order and attractive interactions were weaker. The A3–A5 coefficients, fitted with minor variations, were useful to improve the corrective function during fine-tuning [66,67].
Table 4.
Parameters of Equation (3) for the excess molar volume correlation (the units are expressed in cm3 mol−1).
The standard deviation (STD) was lower than 0.11 cm3·mol−1 and the absolute average deviation was below 1.6%; these were estimated by
where N denotes the number of experimental data points, m is the number of fitted parameters, and subscripts and represent the experimental and calculated values.
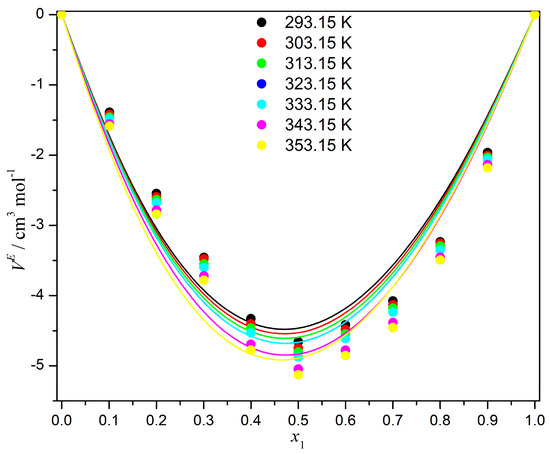
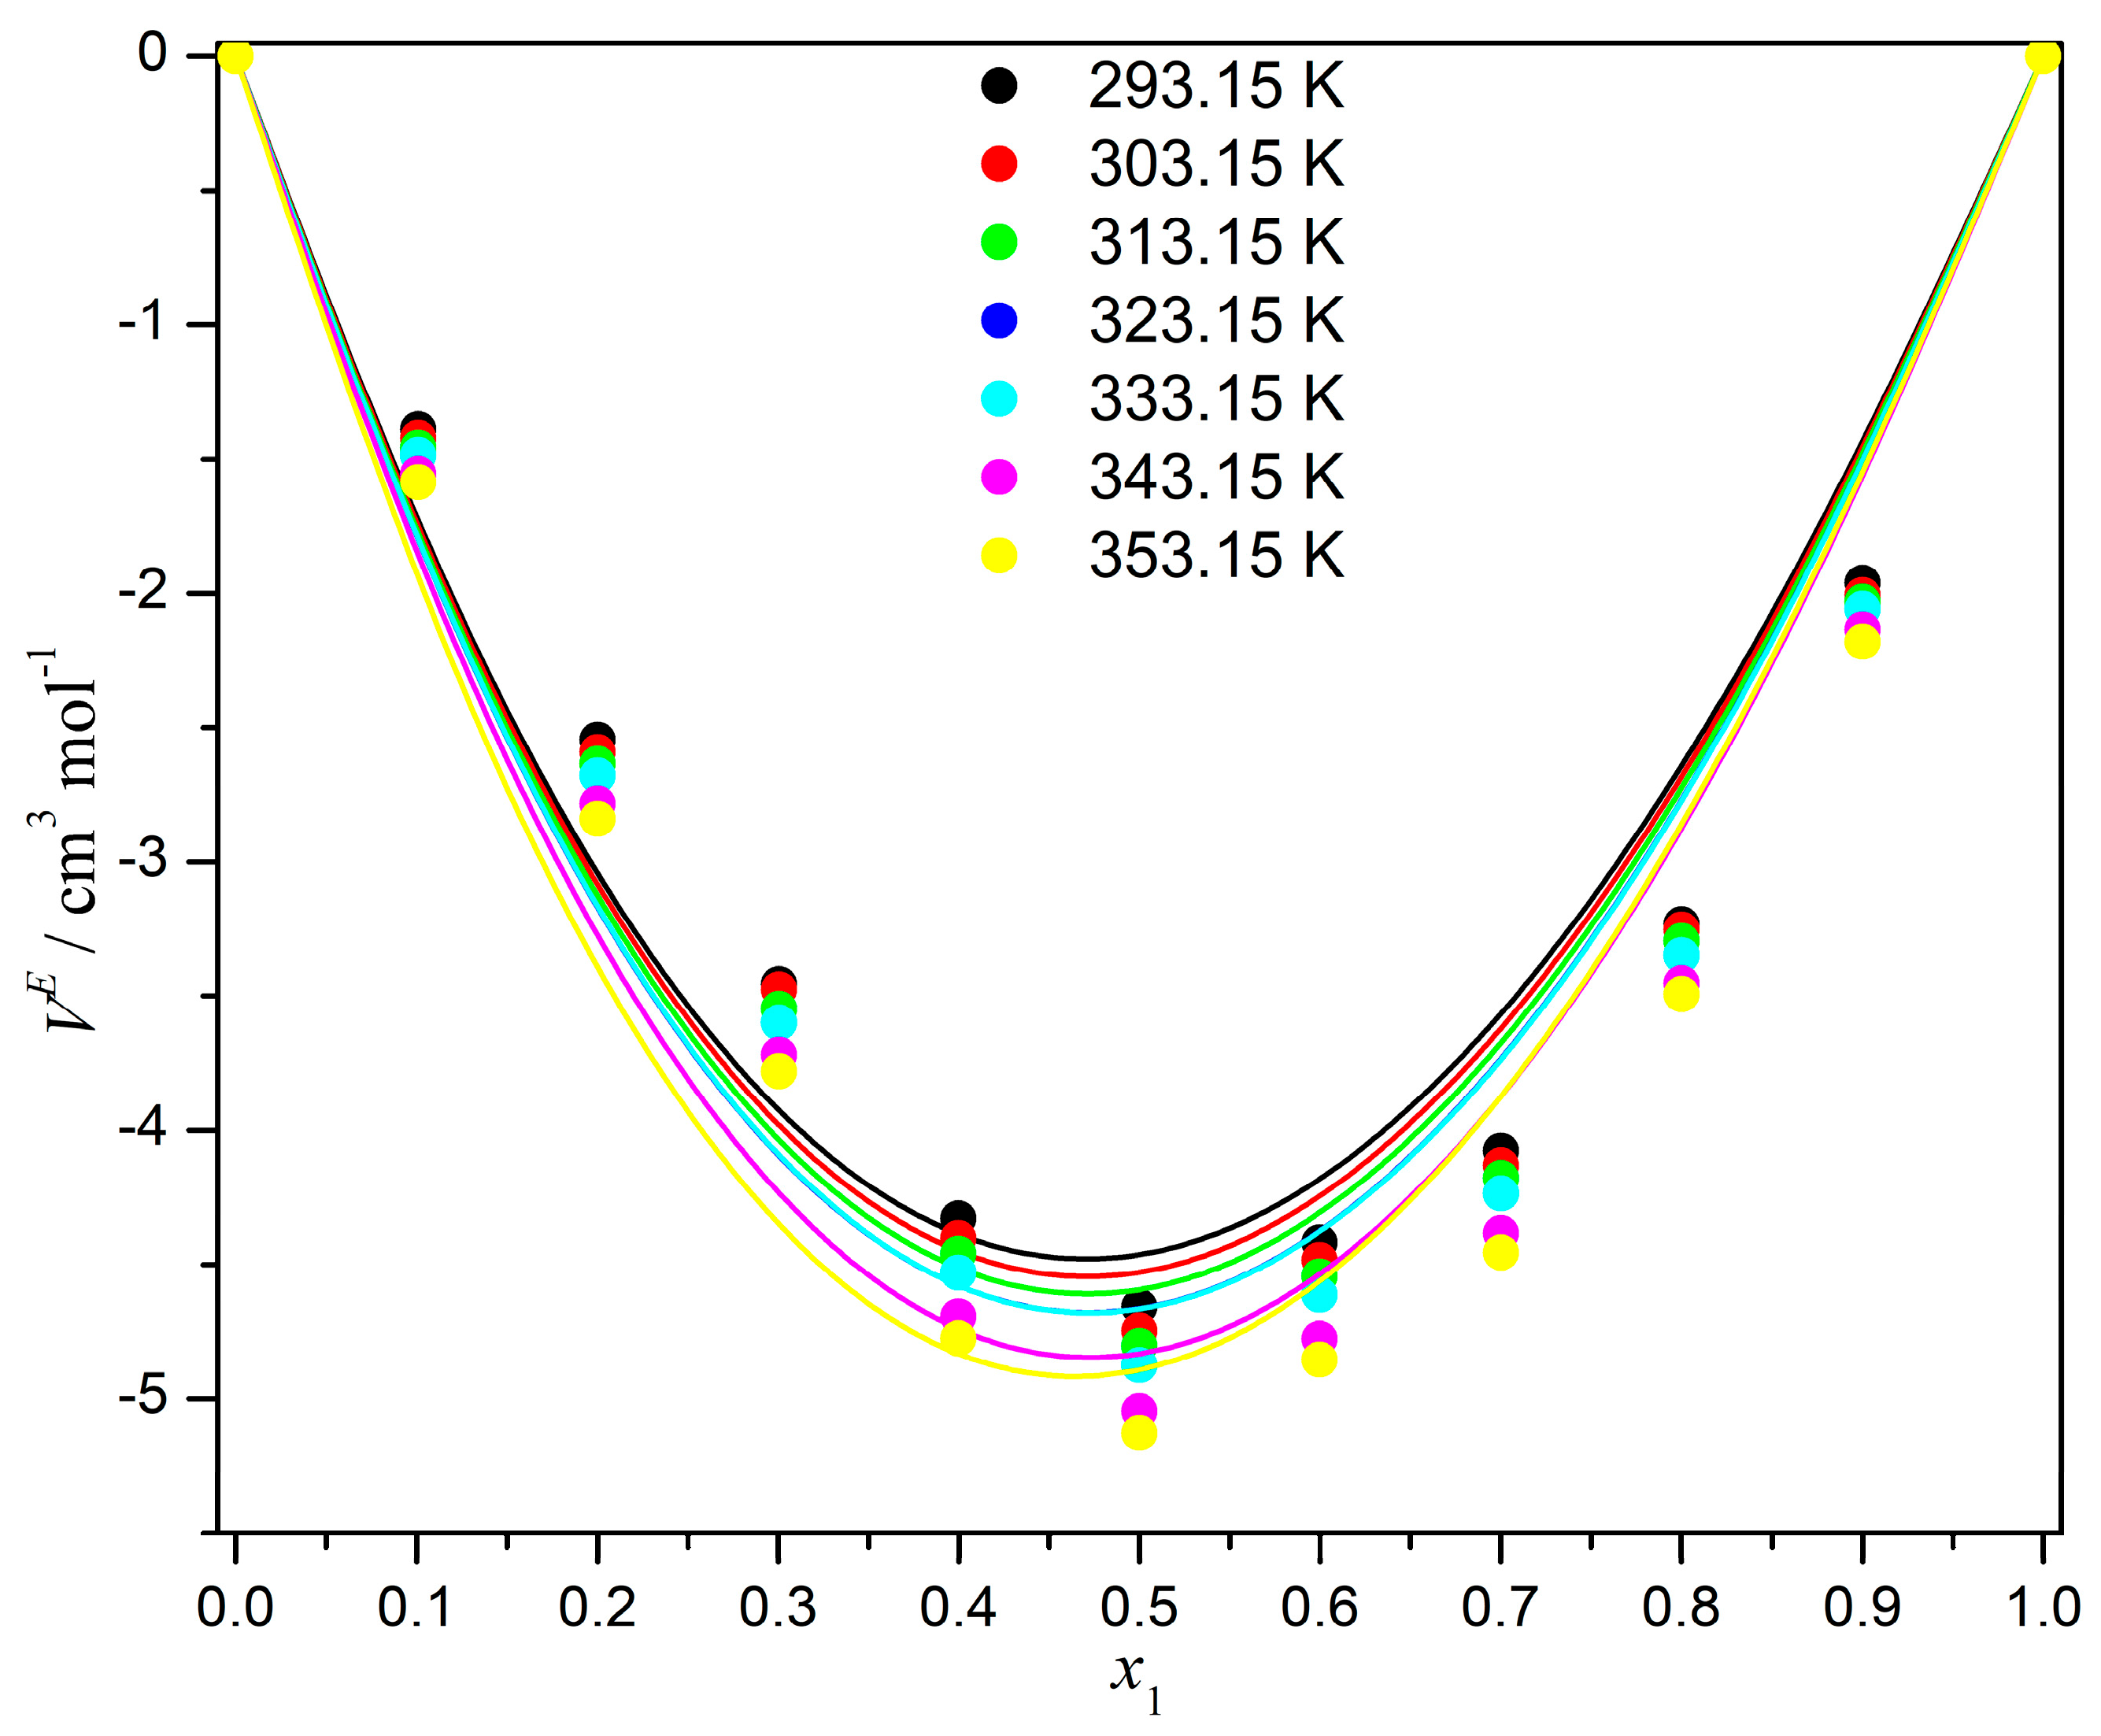
In addition, Figure 8 shows, by means of the points in the graph, the excess molar volumes () of the commercial diesel () + FAME mixtures obtained from residual chicken fat, and by means of the solid lines, the excess molar volumes calculated using the PFP model () in the temperature range of 293.15 to 353.15 K. Likewise, Table 5 presents these values and the excess volume contributions , , and . It can be observed that the excess molar volumes of the mixture were negative over the entire composition and temperature range studied, which indicated that the heteromolecular interactions of the diesel + FAME mixture exhibited greater packing; this can be ascribed to the addition of polar chains with ester groups from FAMEs into the diesel matrix. This favored greater compactness, reducing the total volume of the system.
Figure 8.
Experimental excess molar volumes of the commercial diesel () + FAME mixture compared with the excess molar volumes calculated using the PFP model.
Table 5.
Contributions to the excess molar volume, , and interaction parameter, , obtained using the Prigogine–Flory–Patterson (PFP) model.
In all isotherms, the minimum value of was located at , which is usually observed in non-ideal mixtures where there are significant differences in molecular size, shape, chain rigidity and moderate energetic interactions [68,69]. The values adequately represented the experimental excess molar volumes both in shape and magnitude over the entire composition and temperature range. Therefore, it can be confirmed that the PFP model was capable of adequately representing the physical properties of the commercial diesel + FAME mixture.
Meanwhile, Table 5 presents the individual contributions to the excess molar volume calculated by means of the PFP model, as well as the values of the interaction parameter, , for the different temperatures. The interactional contribution, , had negative values over the entire composition and temperature range, which confirmed the predominant energetic interactions between the diesel and FAME molecules. Likewise, the values of were negative and progressively decreased with increasing temperature, which indicated that the heteromolecular forces were dominated by dispersive and dipole-induced forces, without the presence of strong specific chemical associations, and that the increase in thermal energy diminished the net effect of energetic interactions [70].
In addition, the free volume contribution, , was positive over the entire composition and temperature range, and showed a systematic increase with increasing temperature. This indicated a thermal expansion effect and greater conformational freedom of the molecular chains. The contribution associated with the internal pressure, , represented a corrective energetic term that arises from differences in the internal cohesive forces of the pure components; its aim is to explain how each component present in the mixture responded differently to thermal and mechanical perturbations after the mixing process. According to Table 5, the contribution was negative over practically the entire temperature range, except for at the temperature of 353.15 K; the negative value of this contribution indicated that the differences in the internal pressure of the pure components favored an additional contraction of the molar volume of the mixture. The presence of FAMEs may contribute to higher internal cohesive forces, associated with the presence of polar ester groups and long hydrocarbon chains, compared to commercial diesel, whose composition was predominantly paraffinic and aromatic. In addition, it can be observed that the value of increased with increasing temperature, which can be attributed to the fact that the internal pressure of the mixture was more sensitive to thermal expansion.
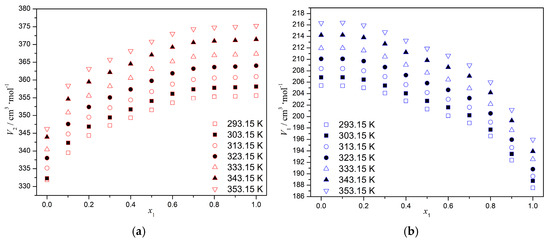
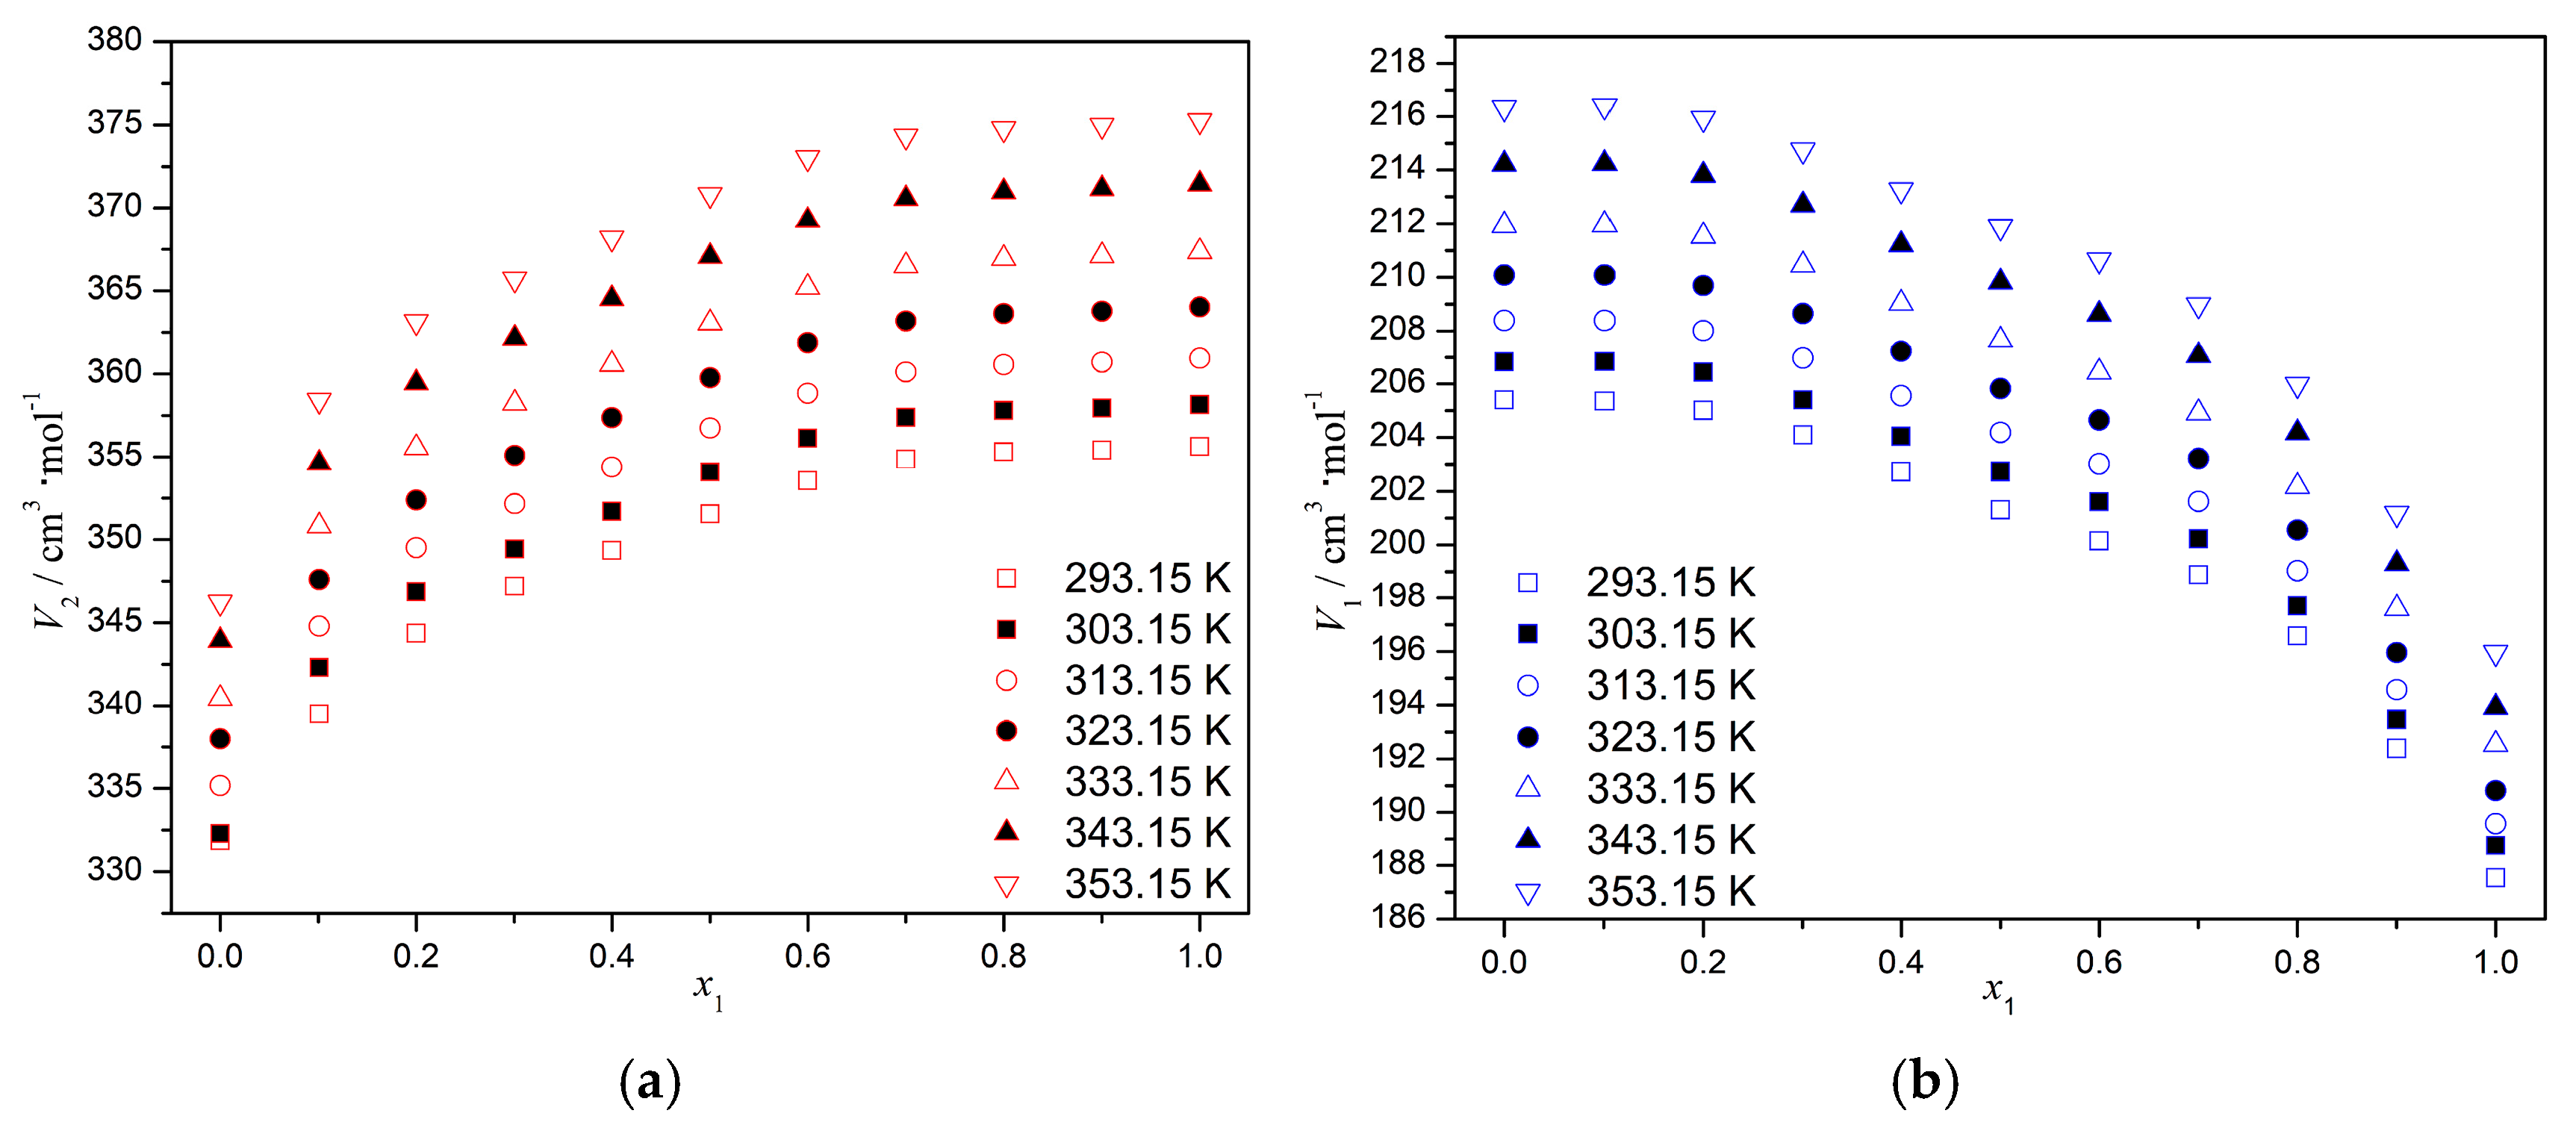
Isothermal trends for the partial molar volumes are depicted in Figure 9 as a function of the diesel mole fraction. The corresponding variable for biodiesel () increased with both temperature and diesel content, reaching values of around 330 cm3·mol−1 at 293.15 K and up to 380 cm3·mol−1 at 353.15 K, indicating a less polar mixture due to the addition of nonpolar hydrocarbons with reduced affinity to the carbonyl (C=O) groups. This confirmed the thermal expansion reduced intermolecular cohesion and weakened the dipole–dipole interactions between the ester groups of the FAME and the hydrocarbon chains of diesel; this produced a liquid structure with low density [55,71,72]. Regarding the behavior of partial molar volumes for diesel (), the values were higher under diluted diesel and decreased as the diesel fraction increased, approaching a minimum at . This behavior described the partial expansion of diesel when dissolved in a biodiesel medium; the differences in polarity and molecular size reduced the molecular packing and led to more free space volume, with positive deviations from ideal behavior [72]. The combined analysis of partial molar volume for each component confirmed that biodiesel tended to suffer a relative expansion when mixed with diesel, while it seemed to experience a compaction with high quantities of diesel [73].
Figure 9.
Partial molar volumes for diesel + biodiesel systems as a function of diesel mole fraction. Red points, partial molar volumes of biodiesel (a); blue points, partial molar volumes of diesel (b).
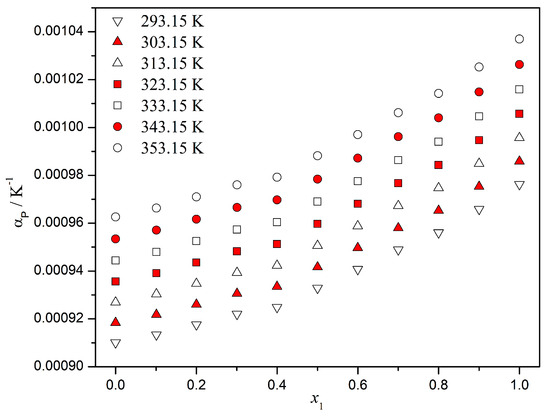
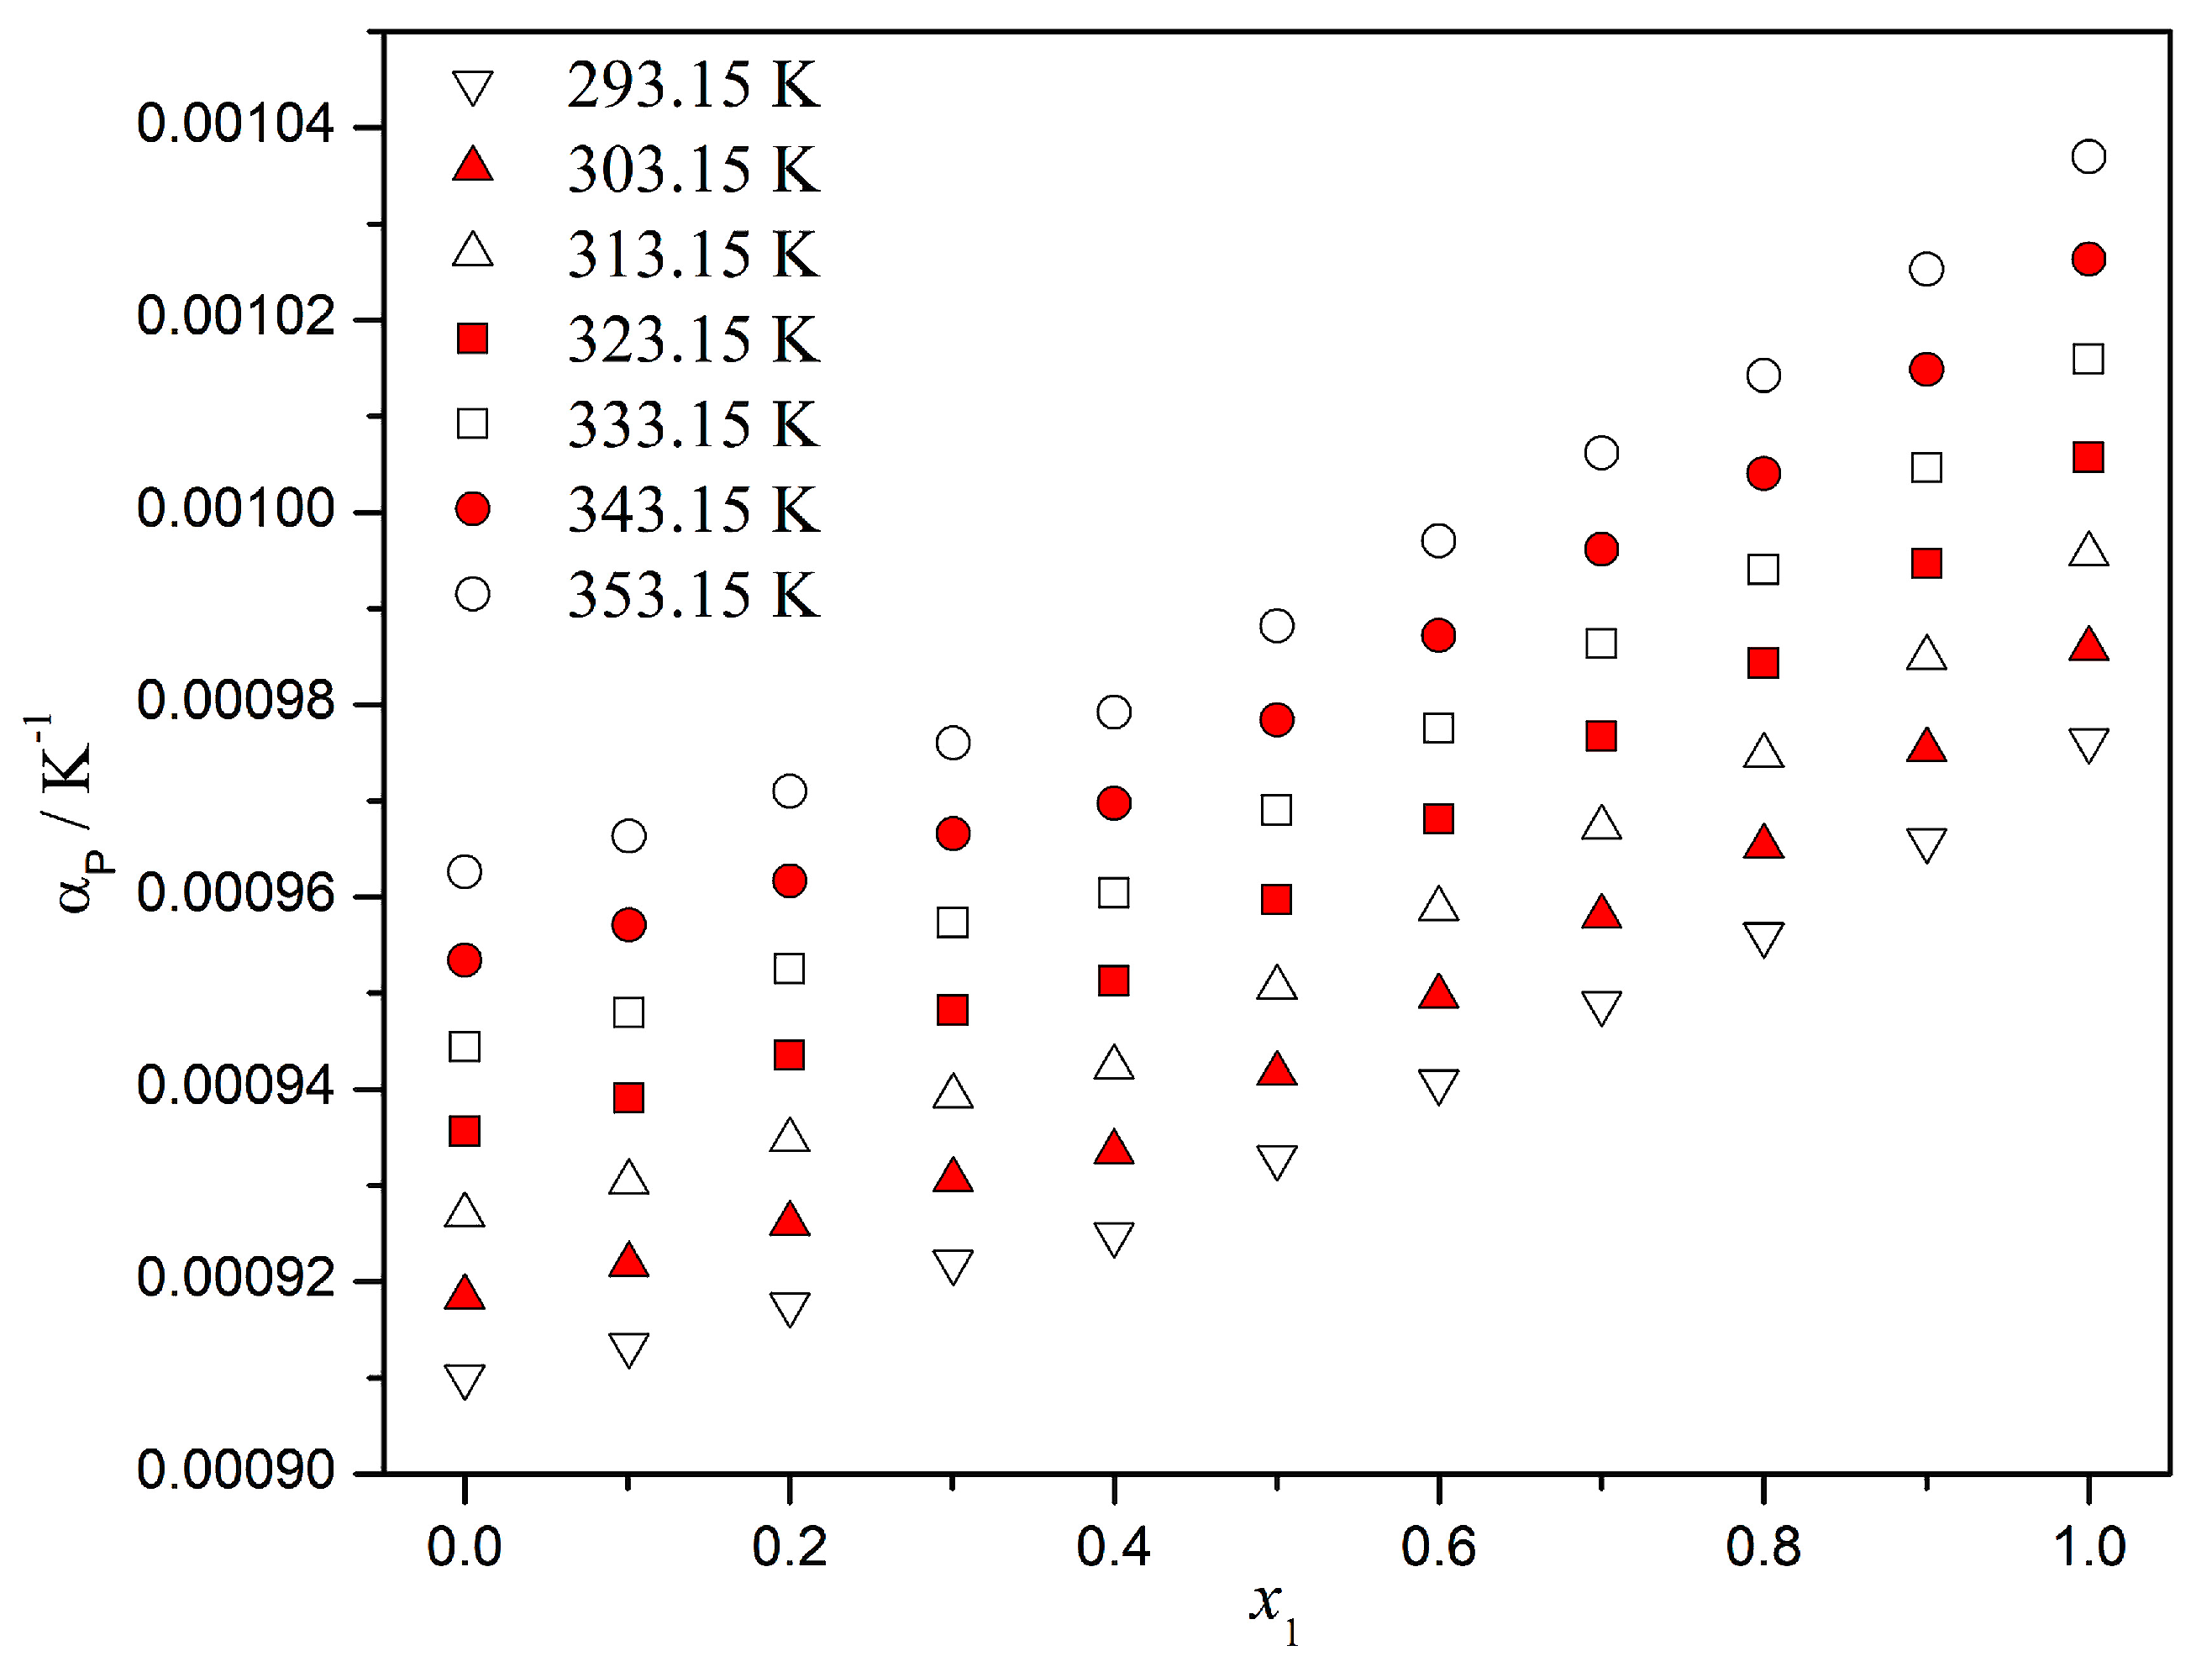
The trends in the isobaric thermal expansivity () as a function of the diesel molar composition () are illustrated in Figure 10. A moderate increase in values occurred within = 0–0.4, suggesting dominant specific (dipole–dipole and dispersive) interactions that reduced molecular mobility and compacted liquid structures [58,73]. As the temperature increased, rose progressively, reaching its maximum values at 353.15 K. The increase in with temperature and diesel content demonstrated the general volumetric expansion linked to the structural differences between the components. The thermal increase was associated with the breakdown of some intermolecular interactions, which were replaced by weaker dispersive forces. The increase in , linked to the liquid density decrease and structural disorder, has been studied for mixtures containing fatty acid methyl esters with alcohols or hydrocarbons [42,73,74,75]. The increasing presence of diesel favored thermal expansion due to the high content of aliphatic hydrocarbons that possessed great rotational and vibrational freedom, as well as its structural rigidity and low polarity [51]. The expanded uncertainty of isobaric thermal expansivity was , with a 0.95 confidence level and coverage factor .
Figure 10.
Isobaric thermal expansivity () of a diesel (1) + biodiesel (2) mixture.
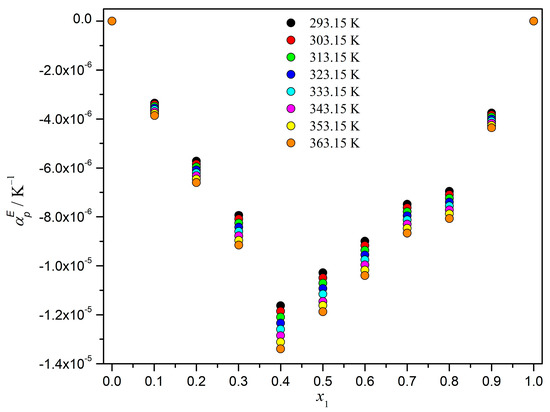
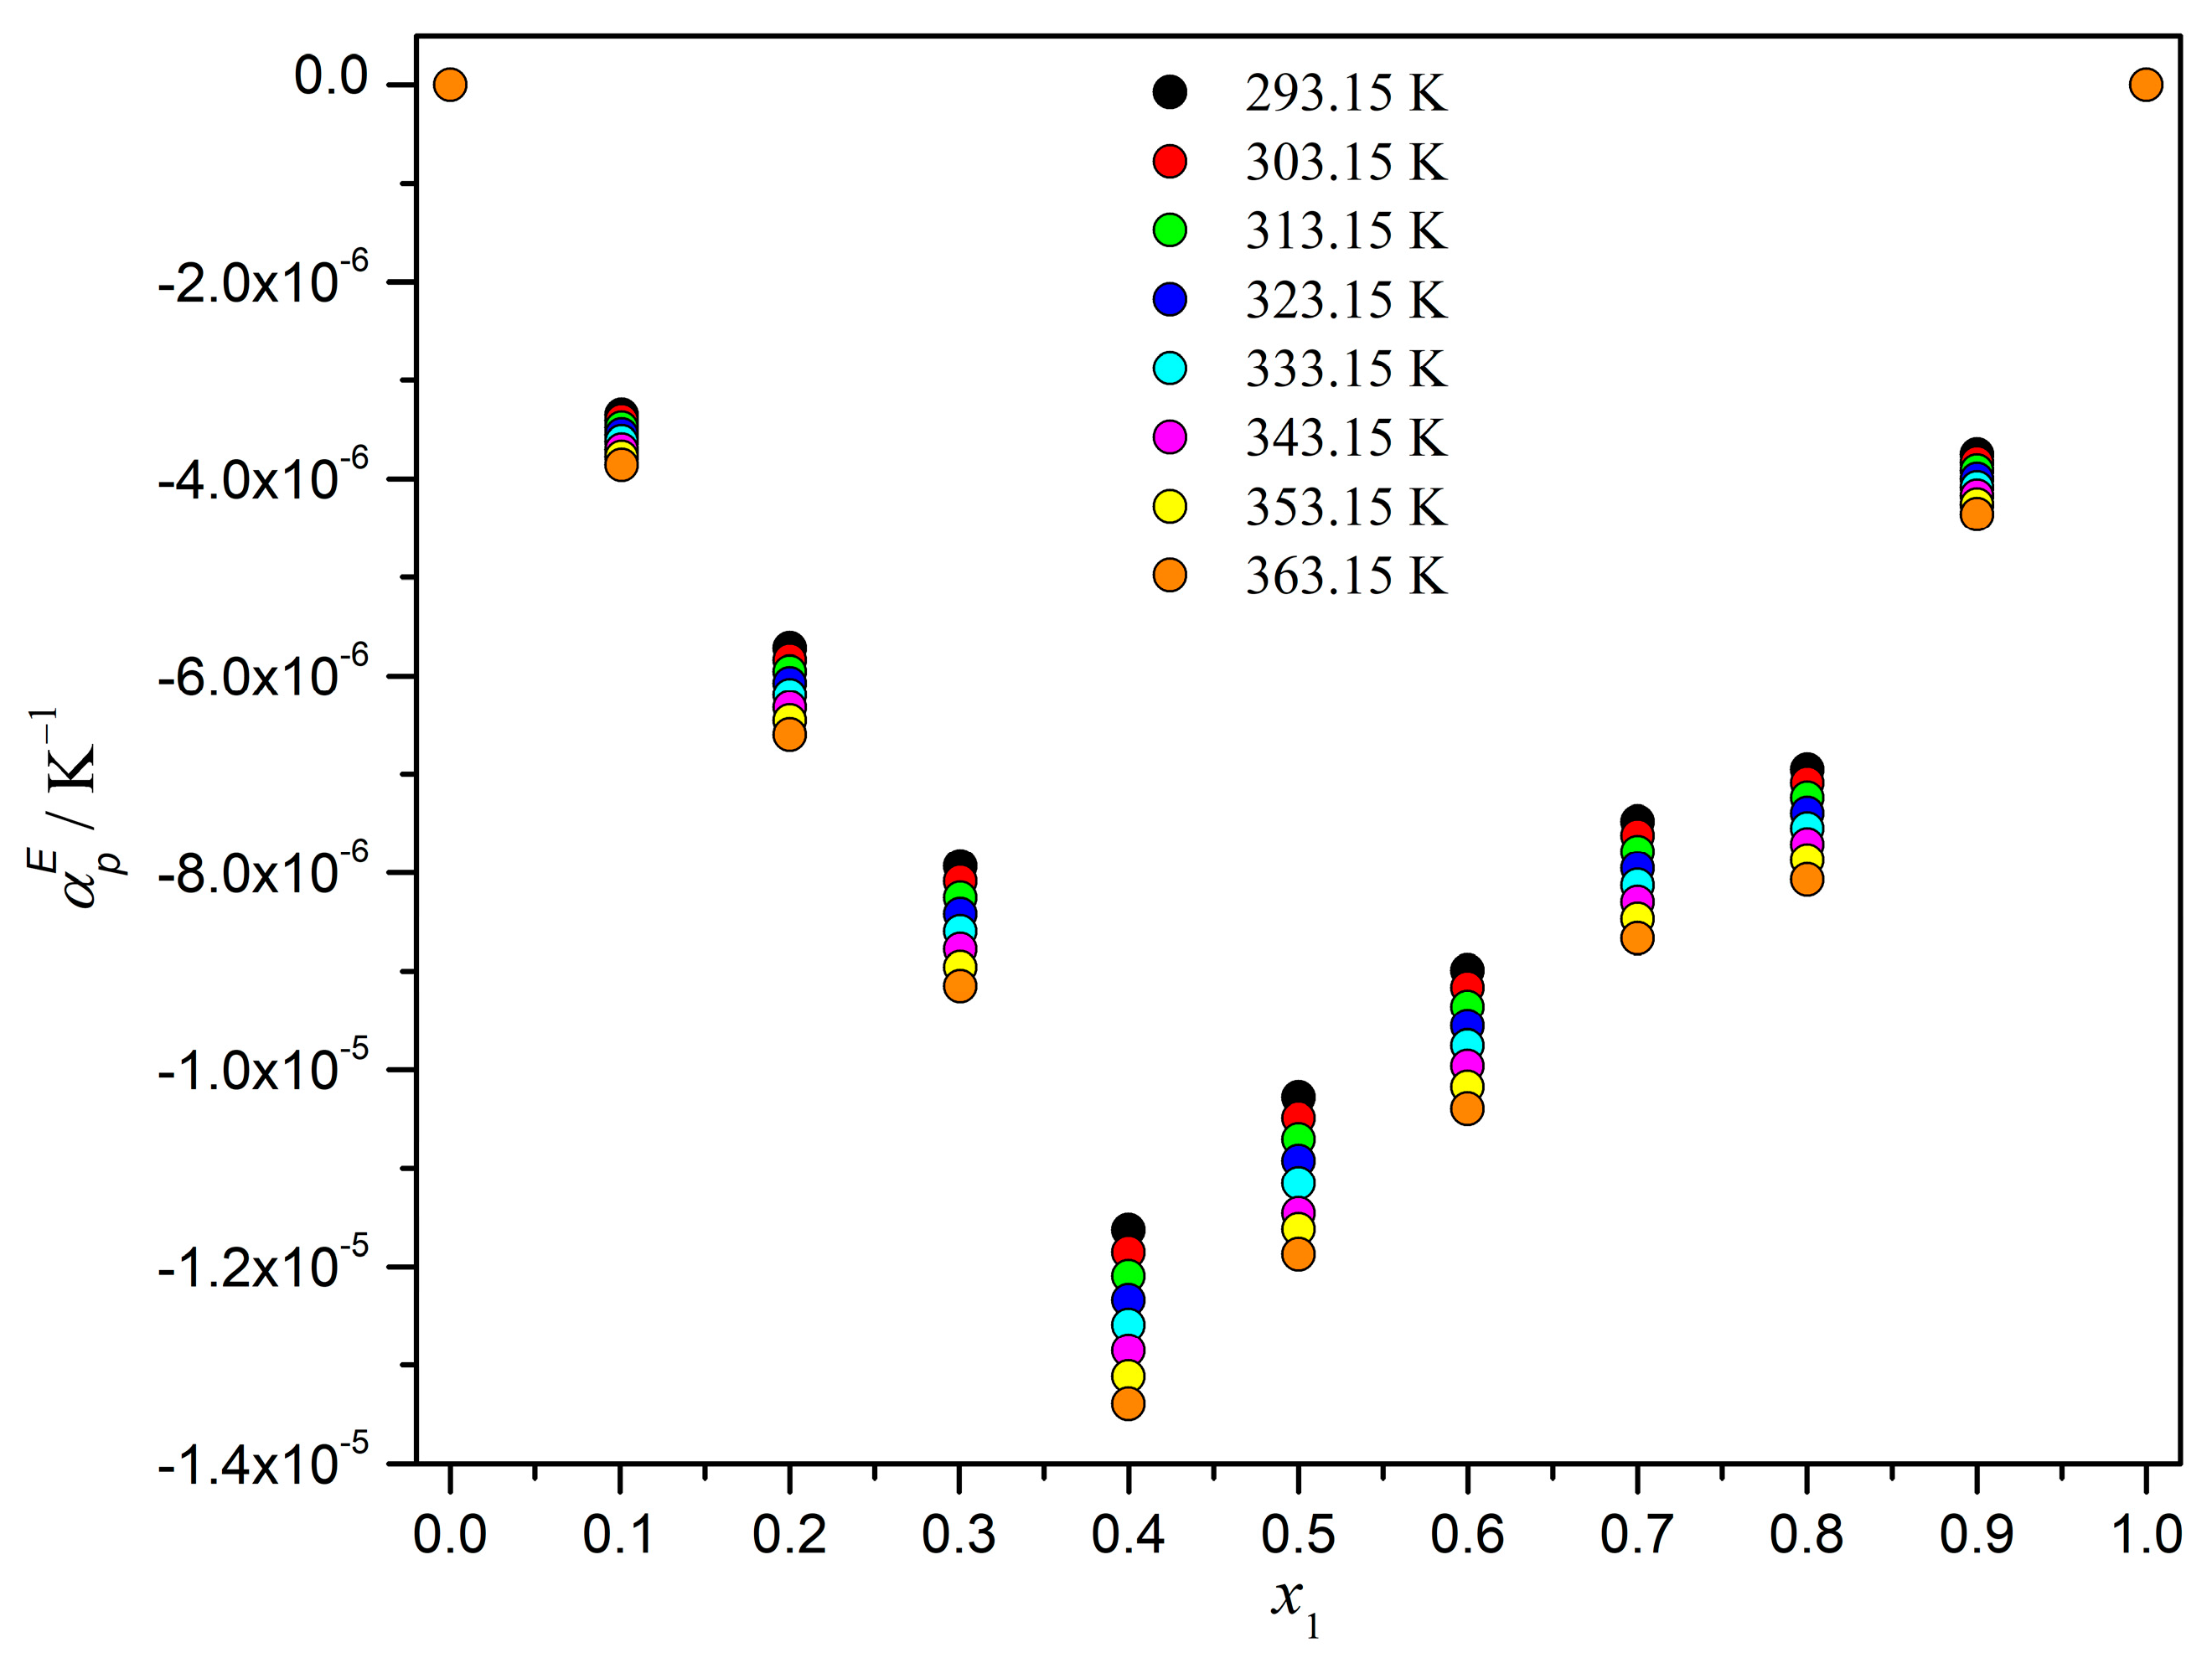
The excess thermal expansivity () is illustrated in Figure 11 for the studied temperature and composition range. The negative trend for with a distinguishable well-defined minimum of indicates the specific and non-additive molecular interactions that allowed for relative molecular packing and a reduction in the configurational freedom of the fluid when the compositions are near or . Noticeable differences between isotherms were not observed; hence, the interactions responsible for this non-ideality were not fully weakened by the increase in thermal energy. This can be interpreted as evidence that ester–ester or ester–hydrocarbon interactions were sufficiently strong to persist even at elevated temperatures. Such mechanisms have previously been discussed in theoretical models for diesel–biodiesel mixtures, where ester polarity and chain length contributed to the formation of more ordered microstructures [57,76]. The expanded uncertainty of was estimated as (k = 2).
Figure 11.
Excess thermal expansion coefficient, , for diesel (1) + biodiesel (2) mixture.
3.3. Kinematic Viscosity
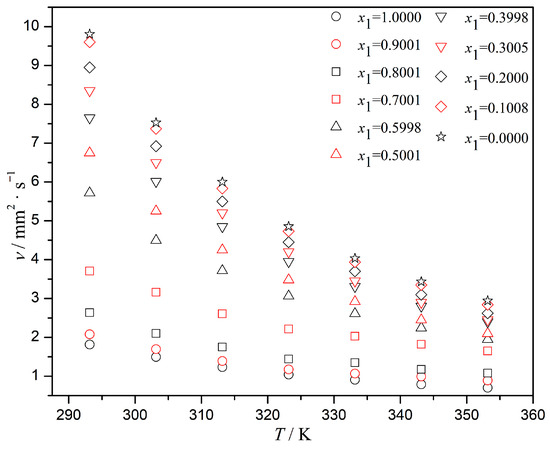
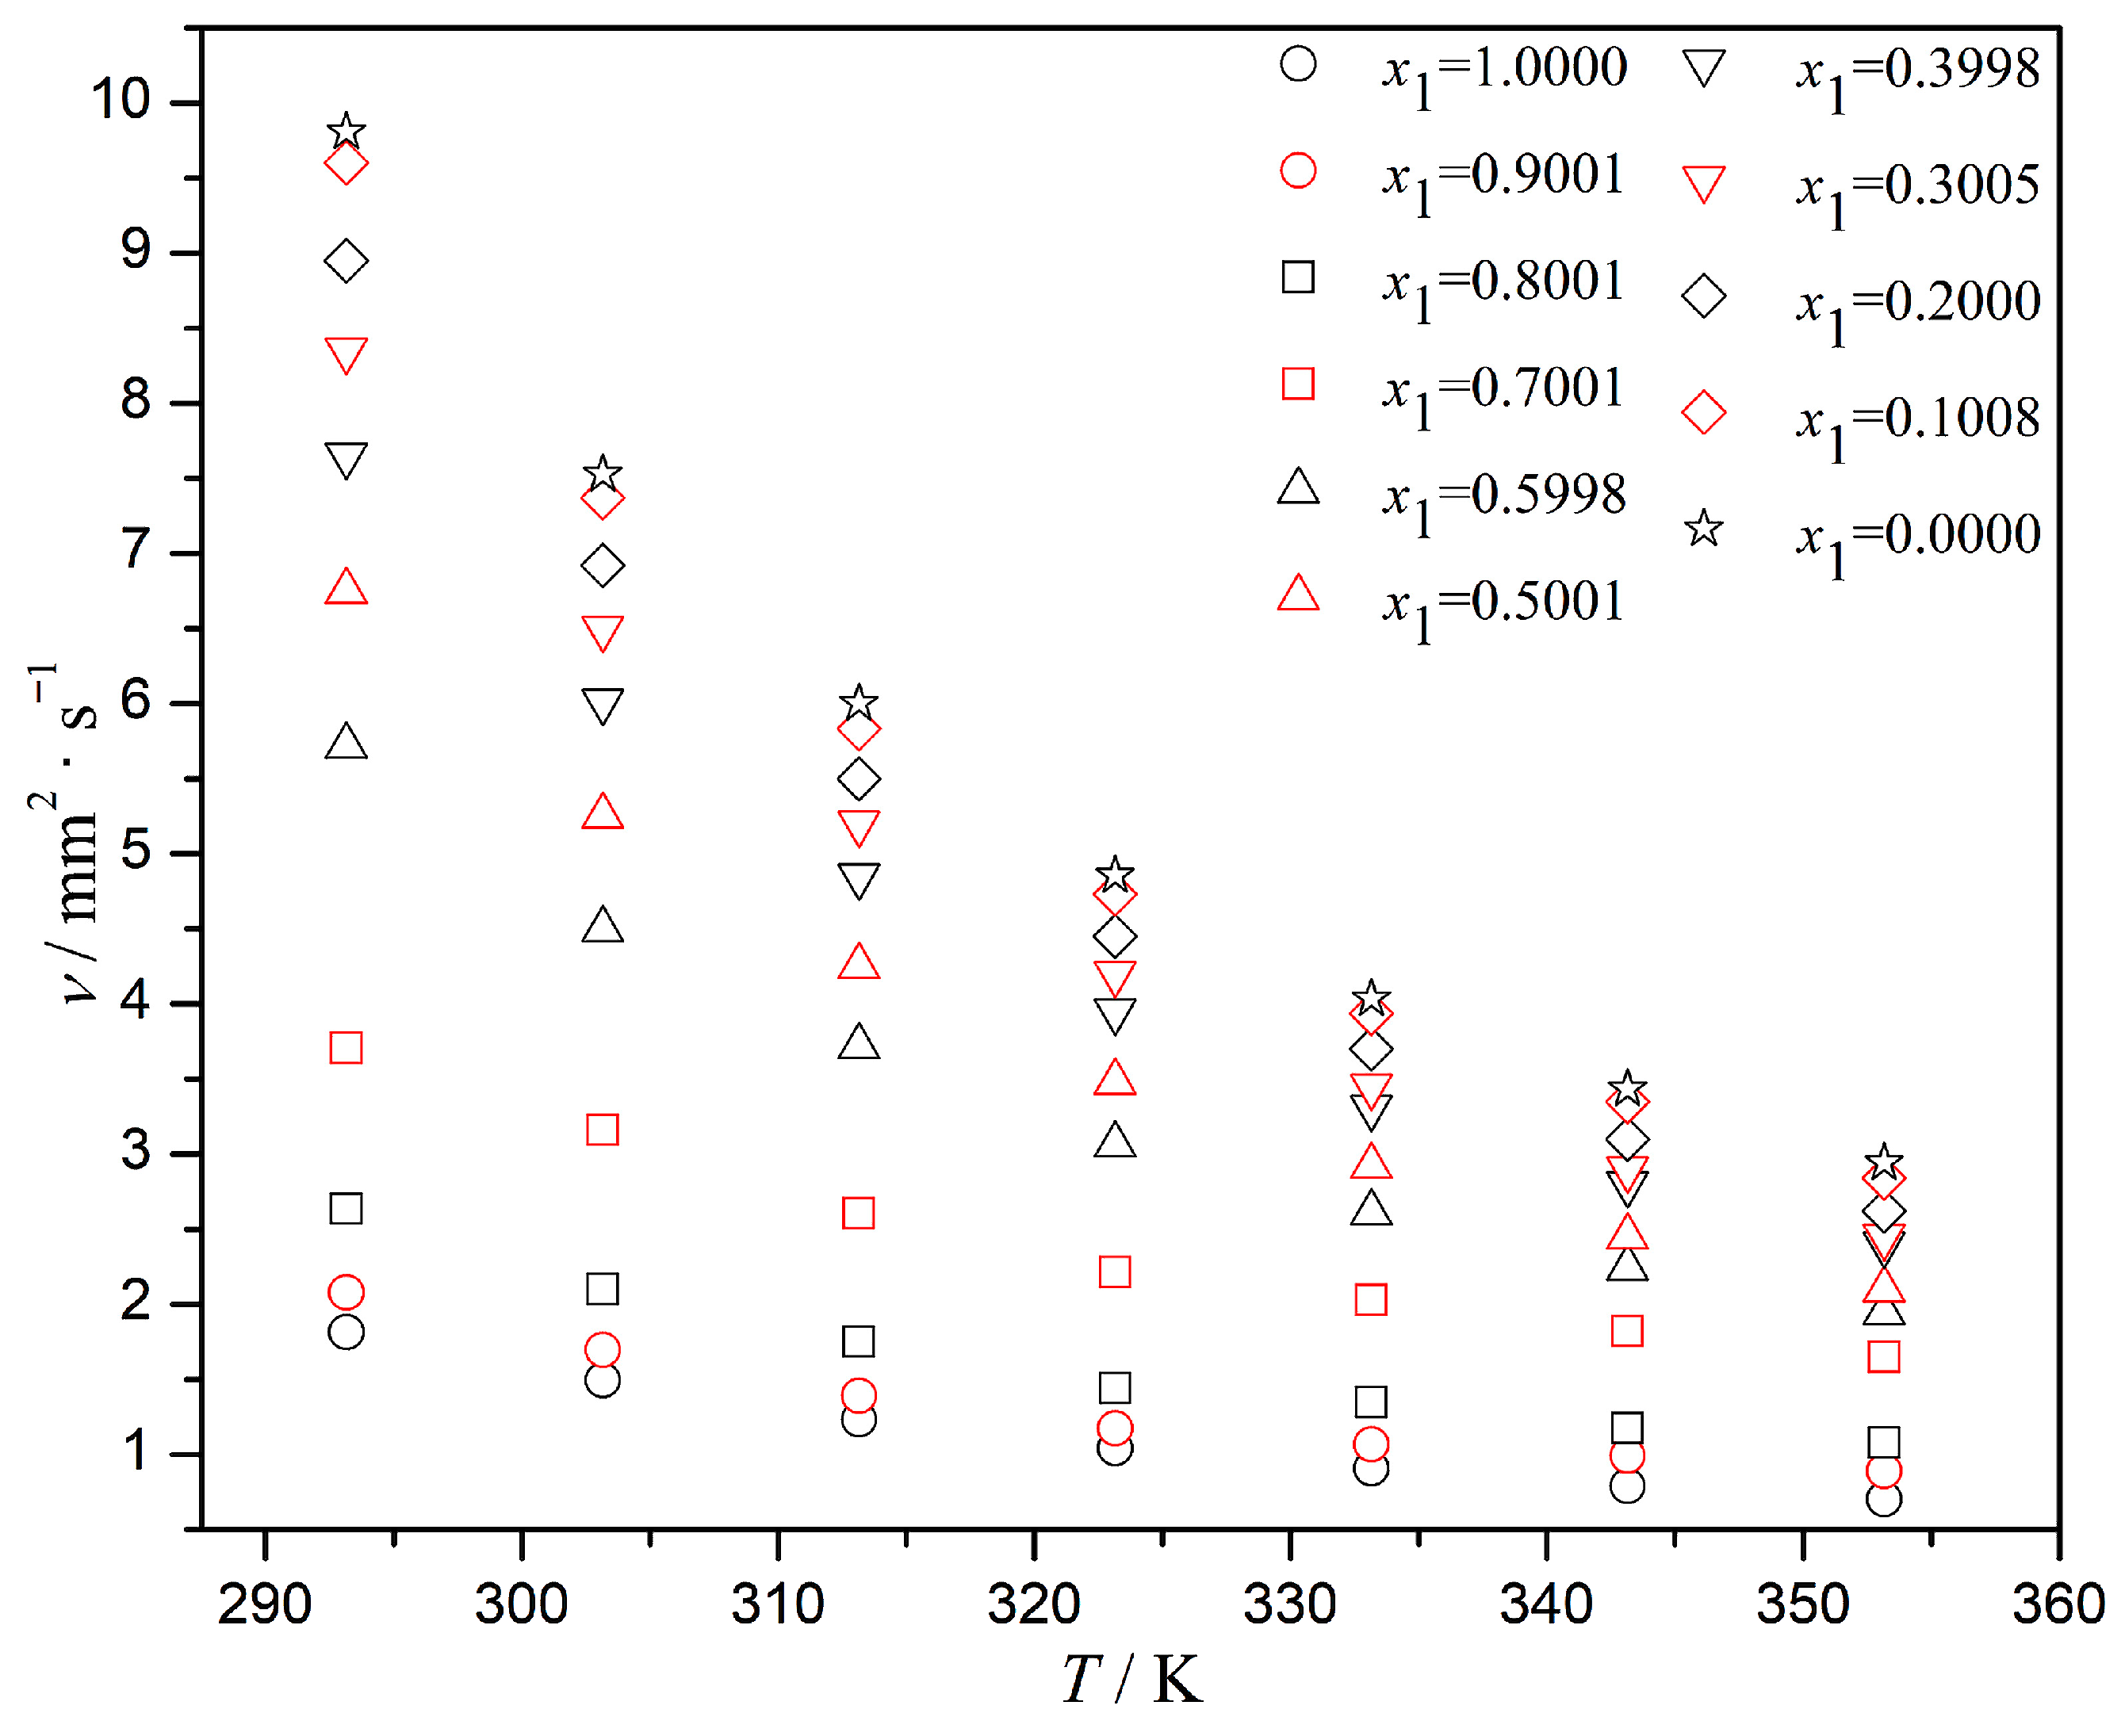
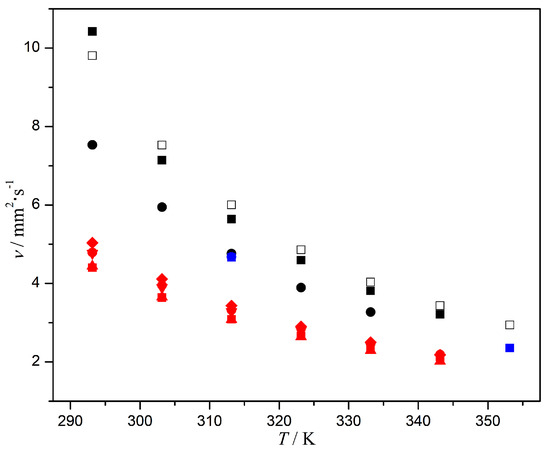
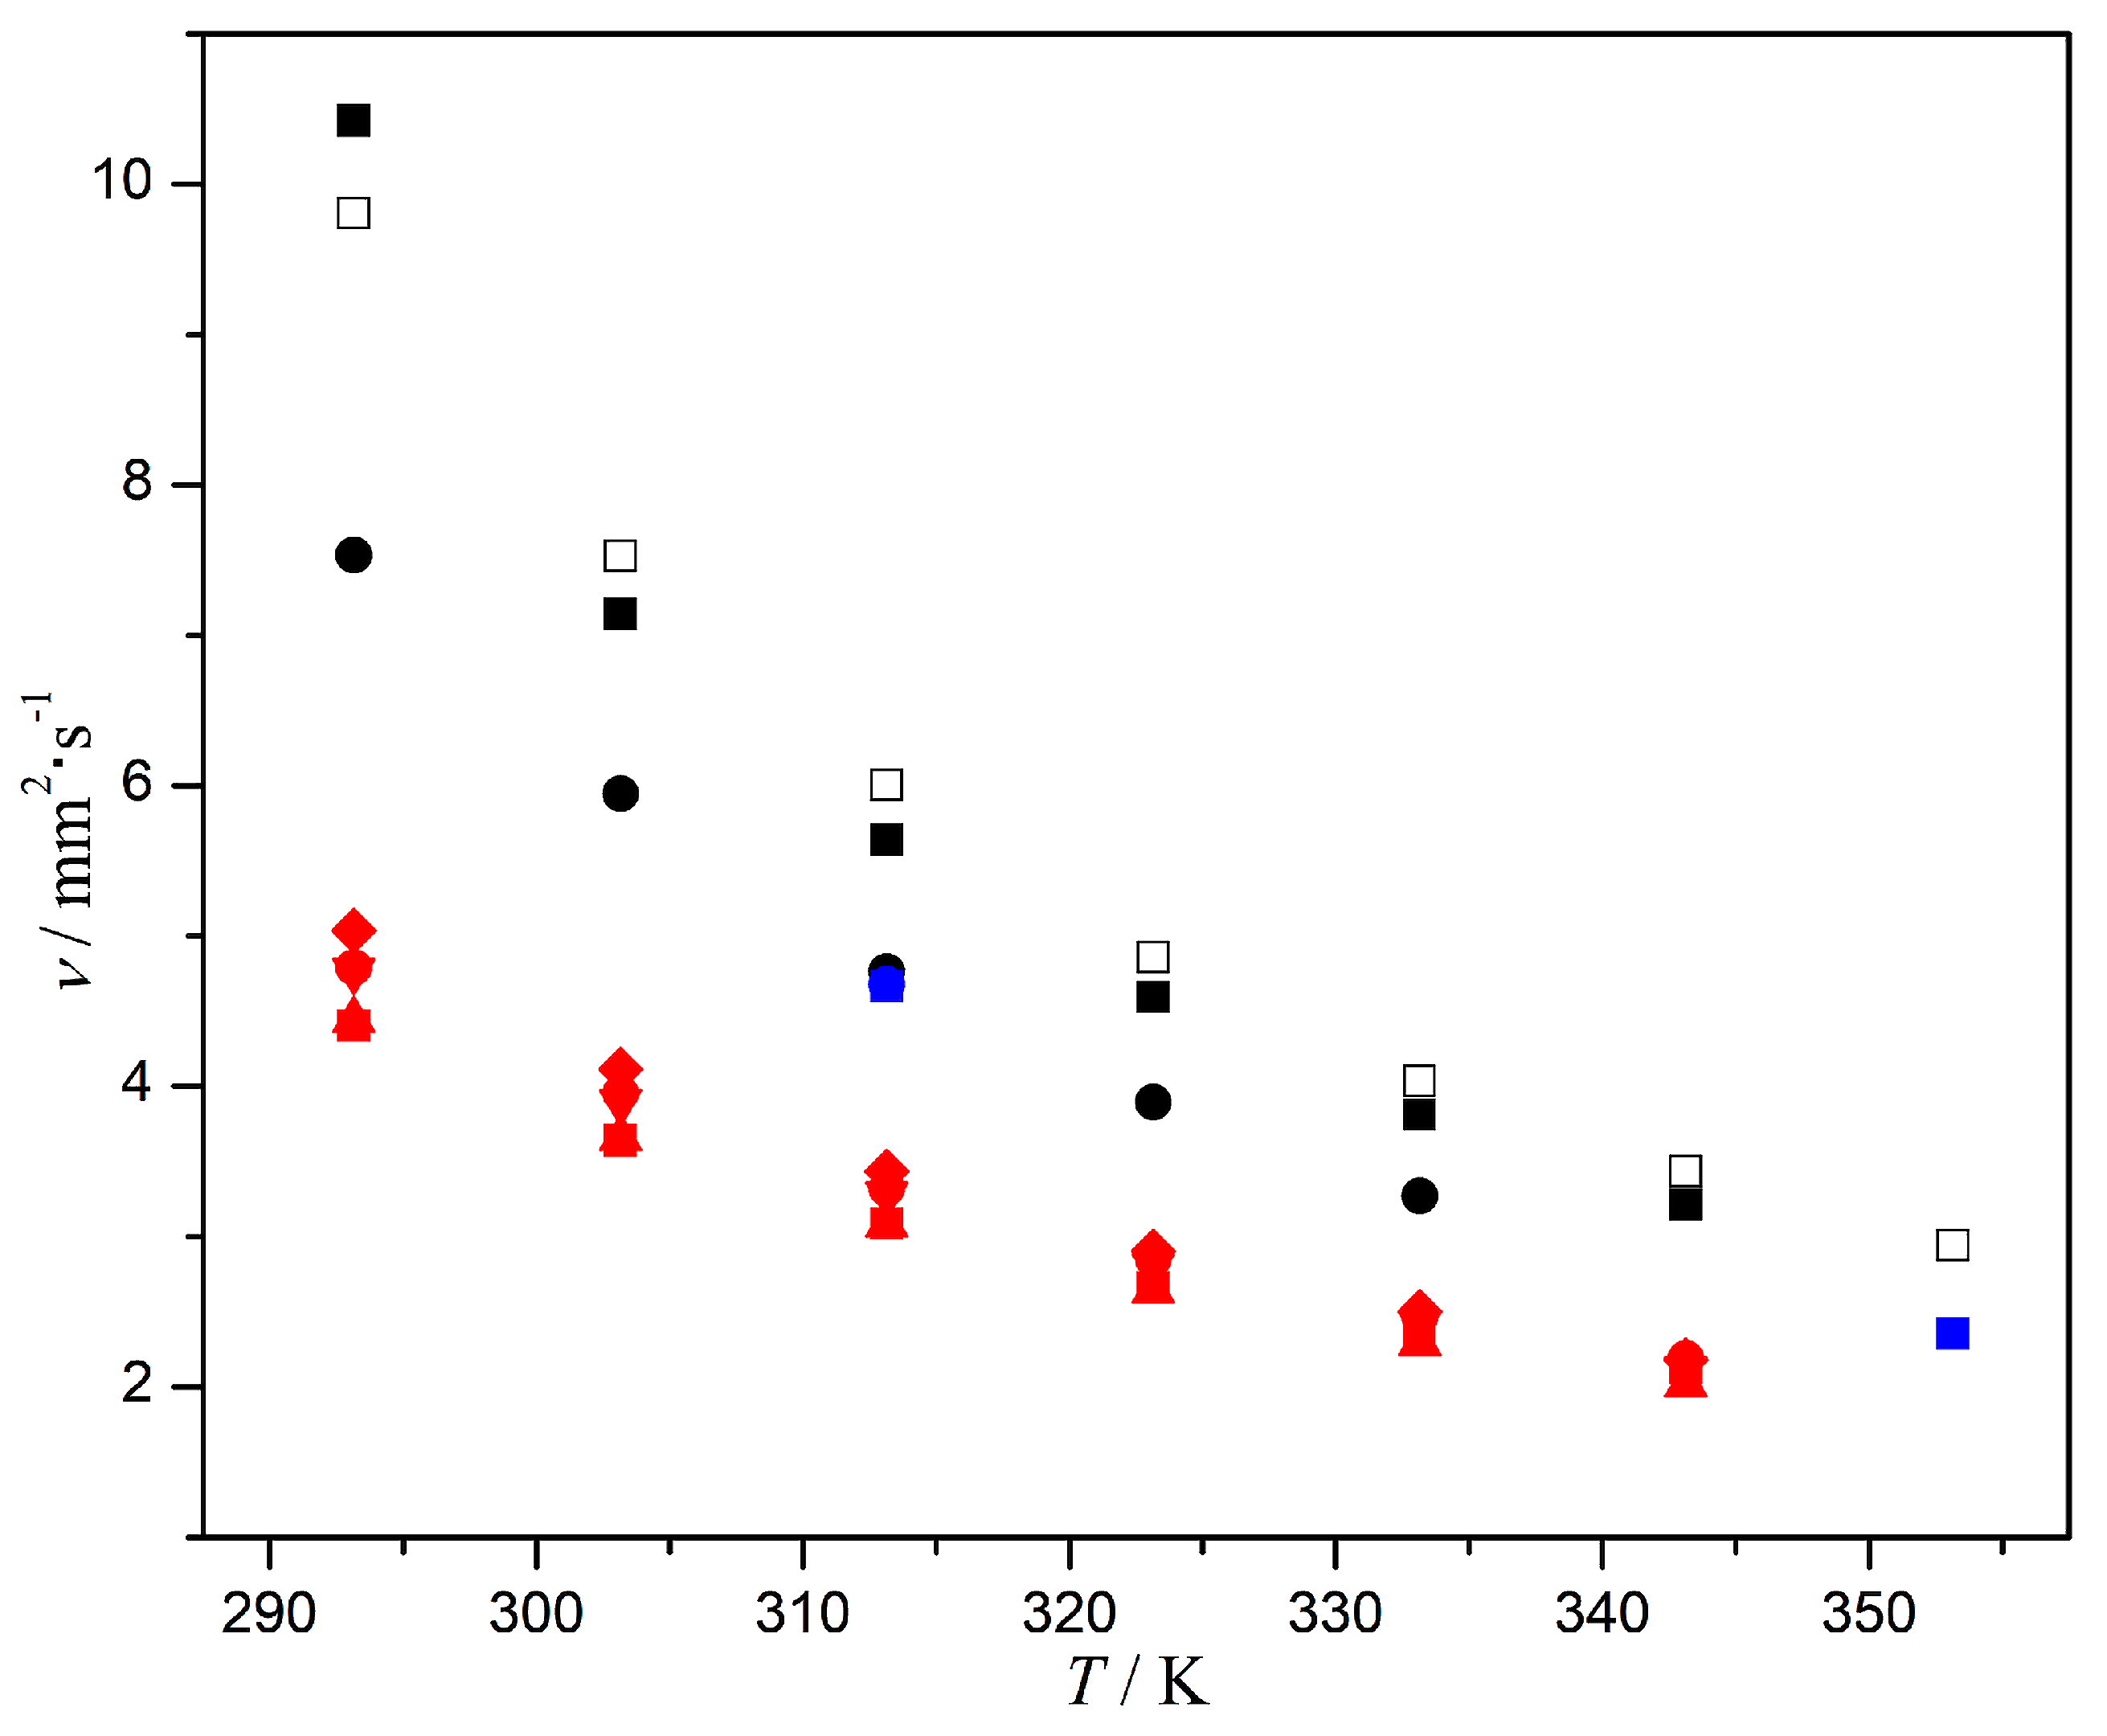
The kinematic viscosity () at each composition and temperature is presented in Figure 12 and Table 6. The general behavior indicated a monotonical viscosity decrease with increasing temperature, commonly reported in organic liquids; the thermal energy barrier associated with the molecular arrangement was lowered to facilitate the relative mobility of hydrocarbon chains and ester structures [77,78]. For each isotherm, a clear and systematic increase in was observed as the biodiesel mole fraction increased. The methyl esters possessed high molar masses, polar carbonyl and ester groups, and long aliphatic chains; these molecular characteristics promoted strong molecular interactions and a great structural rigidity that together induced flow resistance. The kinematic viscosity was not a linear function of the composition and a sharp increase in was observed in the interval of . This effect seemed to be caused by heteromolecular interactions between the ester groups from biodiesel and the aliphatic chains from diesel, which led to ordered configurations and an increase in the intermolecular friction.
Figure 12.
Kinematic viscosity (ν) for a diesel (1) + biodiesel (2) mixture.
Table 6.
Kinematic viscosities (ν) for a diesel (1) + biodiesel (2) mixture.
The isothermal ν can be observed in Figure 13, which covered each fatty acid methyl ester biodiesel sample obtained from different vegetable oil or animal fat feedstocks. Biodiesel samples produced from residual sources [78] were expected to have the highest kinematic viscosities, reflecting a strong dependence on the high content of long-chain saturated and monounsaturated fatty acids as well as material affected by oxidation, thermal cycling and the formation of polar degradation products. On the contrary, the viscosity magnitude diminished for biodiesel synthetized from vegetable sources including soybean oil, canola oil, sunflower oil and palm oil; the high unsaturation degree tended to reduce the kinematic viscosity in biodiesel from vegetables due to the presence of multiple double bonds that increased the molecular flexibility and weakened the molecular interactions [79,80].
Figure 13.
Kinematic viscosity of fatty acid methyl ester biodiesels: □, this work; ■, waste cooking oil [57]; ■, soybean oil [58]; ●, canola oil [58]; ▲, sunflower oil [58]; ▼, waste oil [58]; ♦, edible tallow [58]; ●, Solben Co. [59]; ■, waste frying oil [81]; ●, waste canola oil [81].
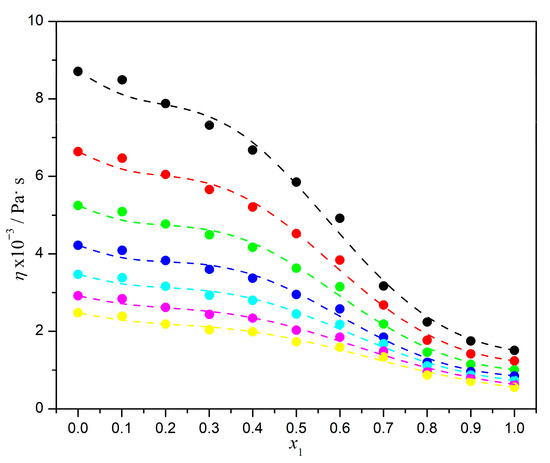
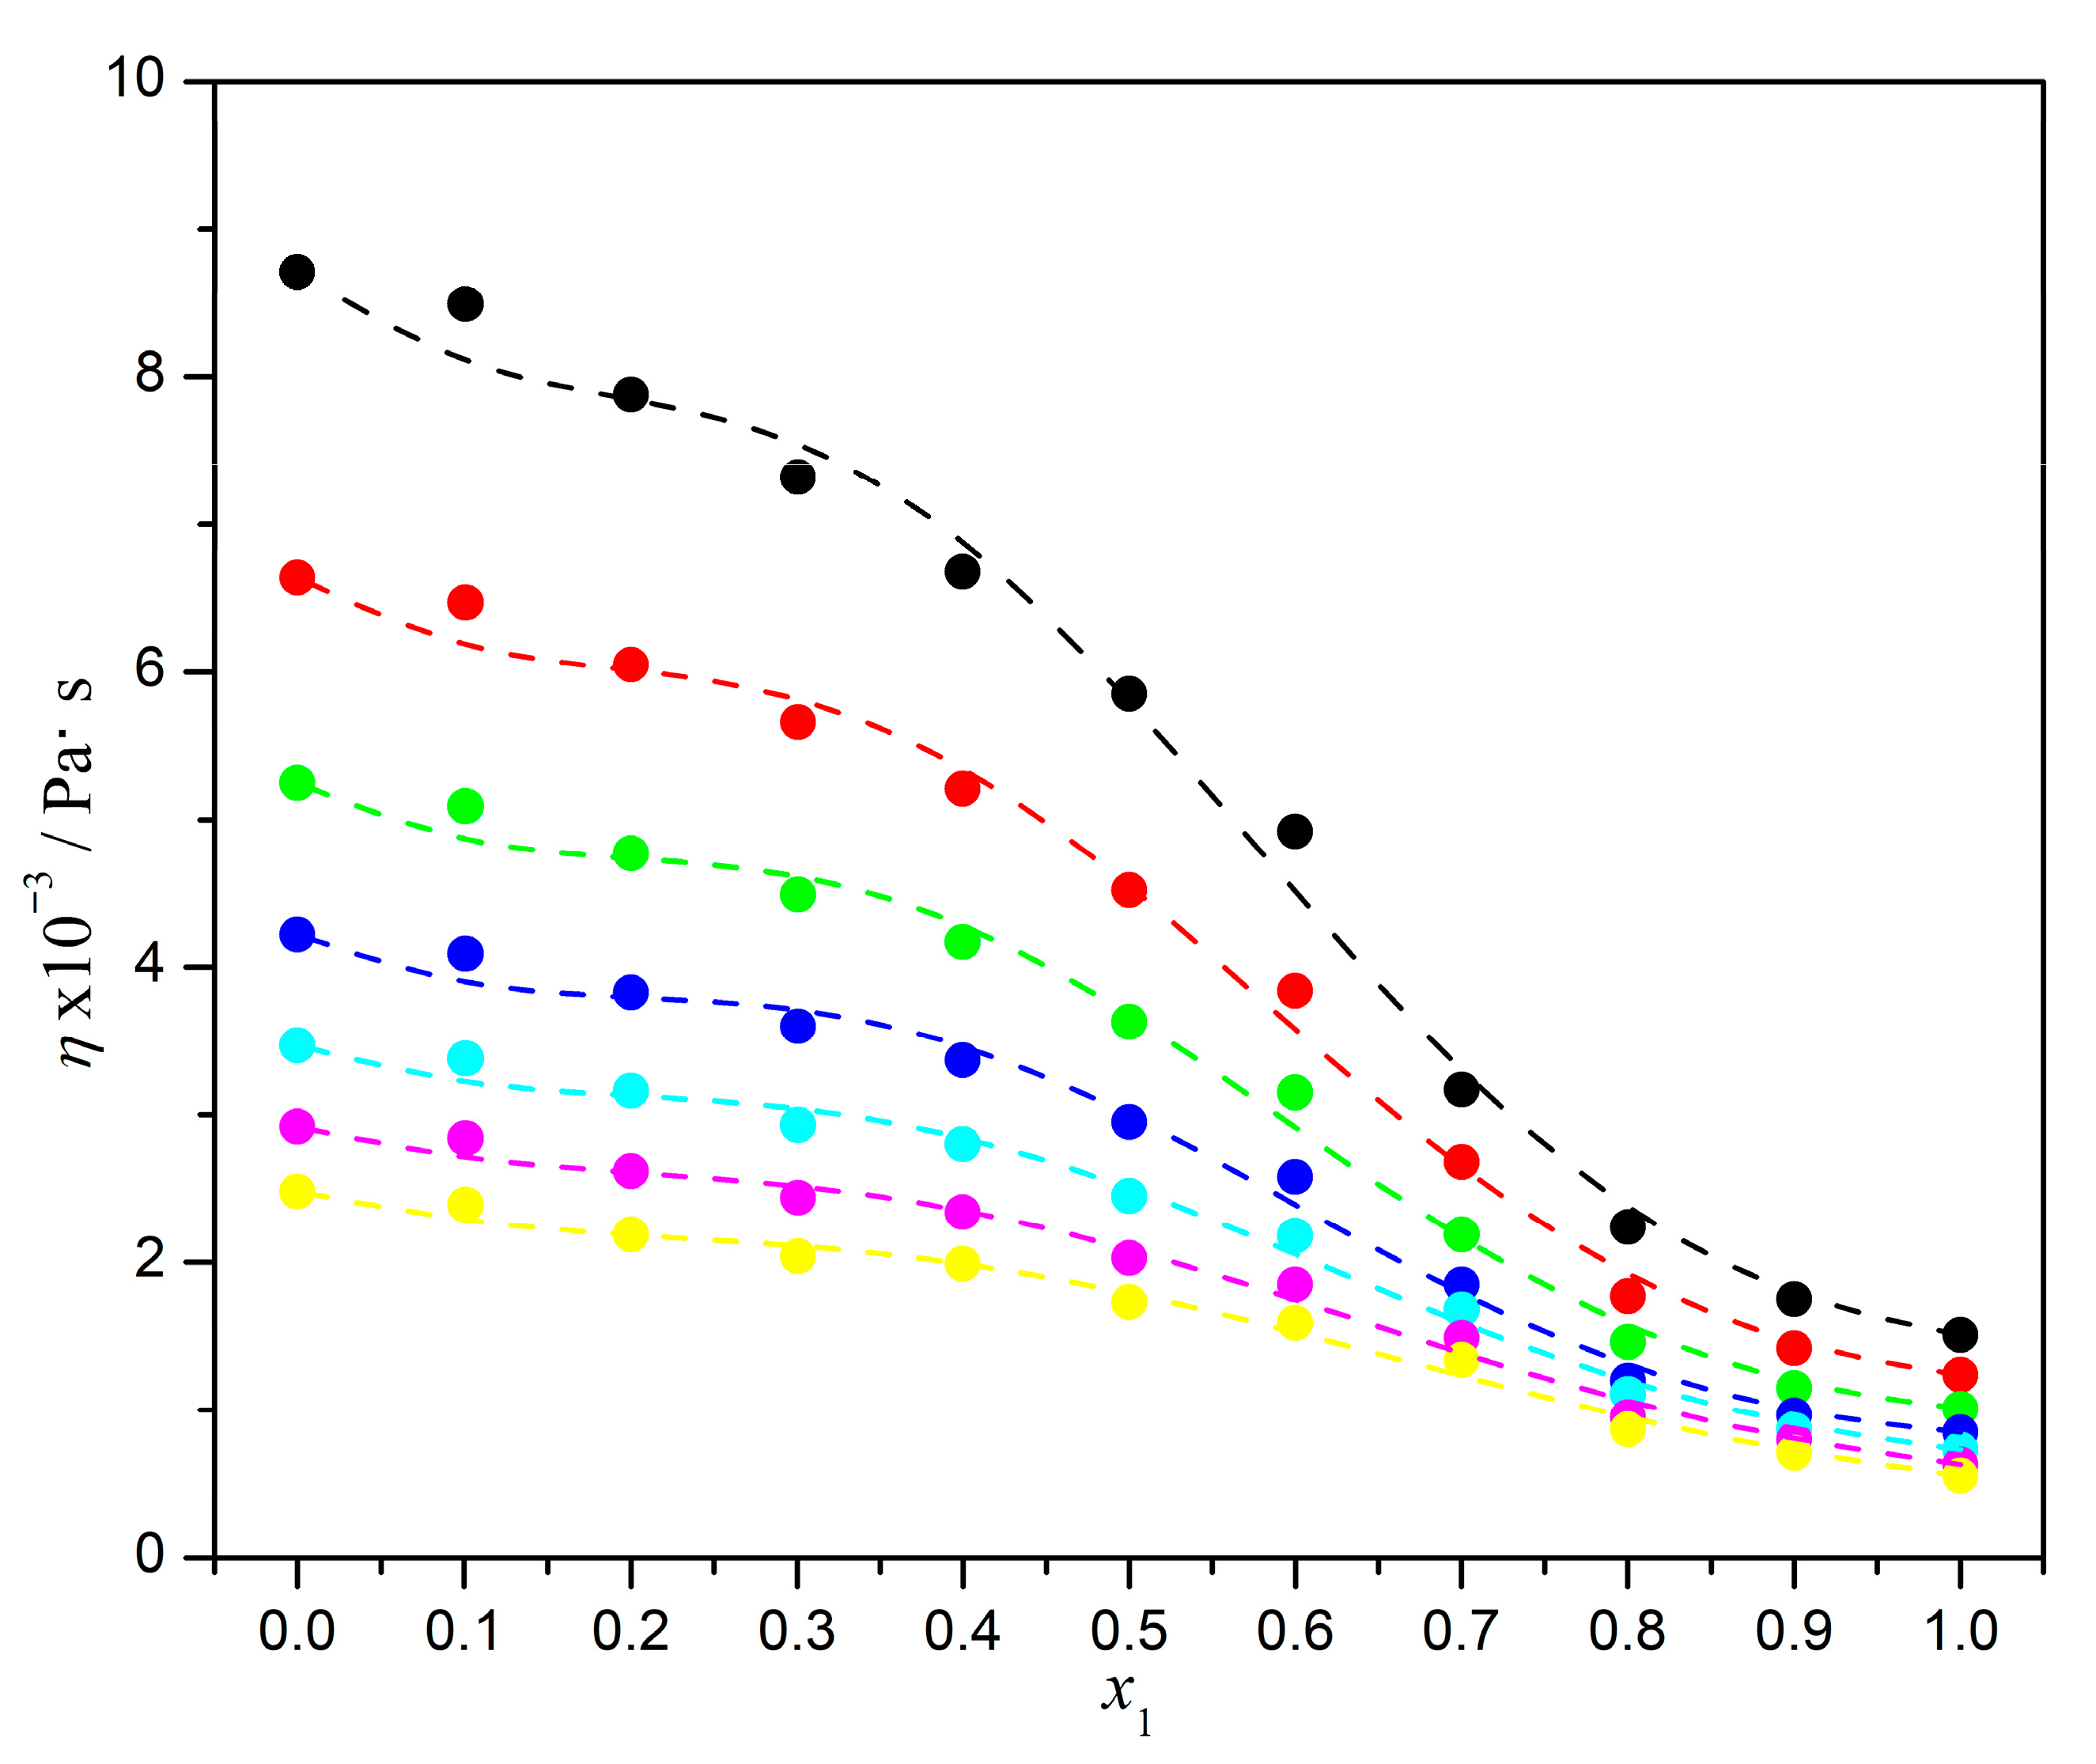
The variation in the dynamic viscosity () is shown in Figure 14. This variable presented a pronounced and systematic decrease with an increase in temperature; the specific interactions weakened and the compositional variation in viscosity became smoother [71,82,83]. Nevertheless, the dependence of dynamic viscosity on composition is not strictly linear, particularly at lower temperatures, where the differences between adjacent compositions were more pronounced. Heteromolecular interactions increased the viscosity between the ester groups of FAMEs and the aliphatic chains of diesel, allowing for ordered configurations and an increase in intermolecular friction. The dashed lines in Figure 14 correspond to the values calculated by the McAllister model, commonly employed to describe the viscosity of non-ideal liquid mixtures. The excellent agreement between the experimental data and the model predictions yielded an AAD < 4.2%, as listed in Table 7, along with the corresponding parameters. The deviation seemed to increase as temperature increased; this was a consequence of the gradual reduction in intermolecular interactions. The expanded uncertainty of dynamic viscosity was estimated using standard error propagation from the uncertainties of density and kinematic viscosity. The expanded uncertainty (k = 2) was , corresponding to a confidence level of 95%.
Figure 14.
Dynamic viscosity ( ) of diesel (1) and residual chicken fat biodiesel (2) mixtures at: ●, 293.15; ●, 303.15; ●, 313.15; ●, 323.15; ●, 333.15; ●, 343.15; ●, 353.15 K.
Table 7.
Parameters for the McAllister model.
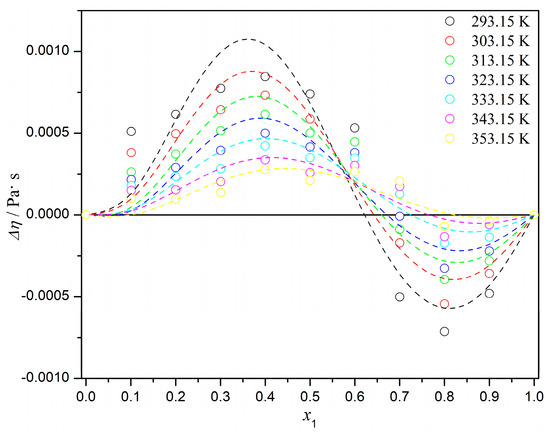
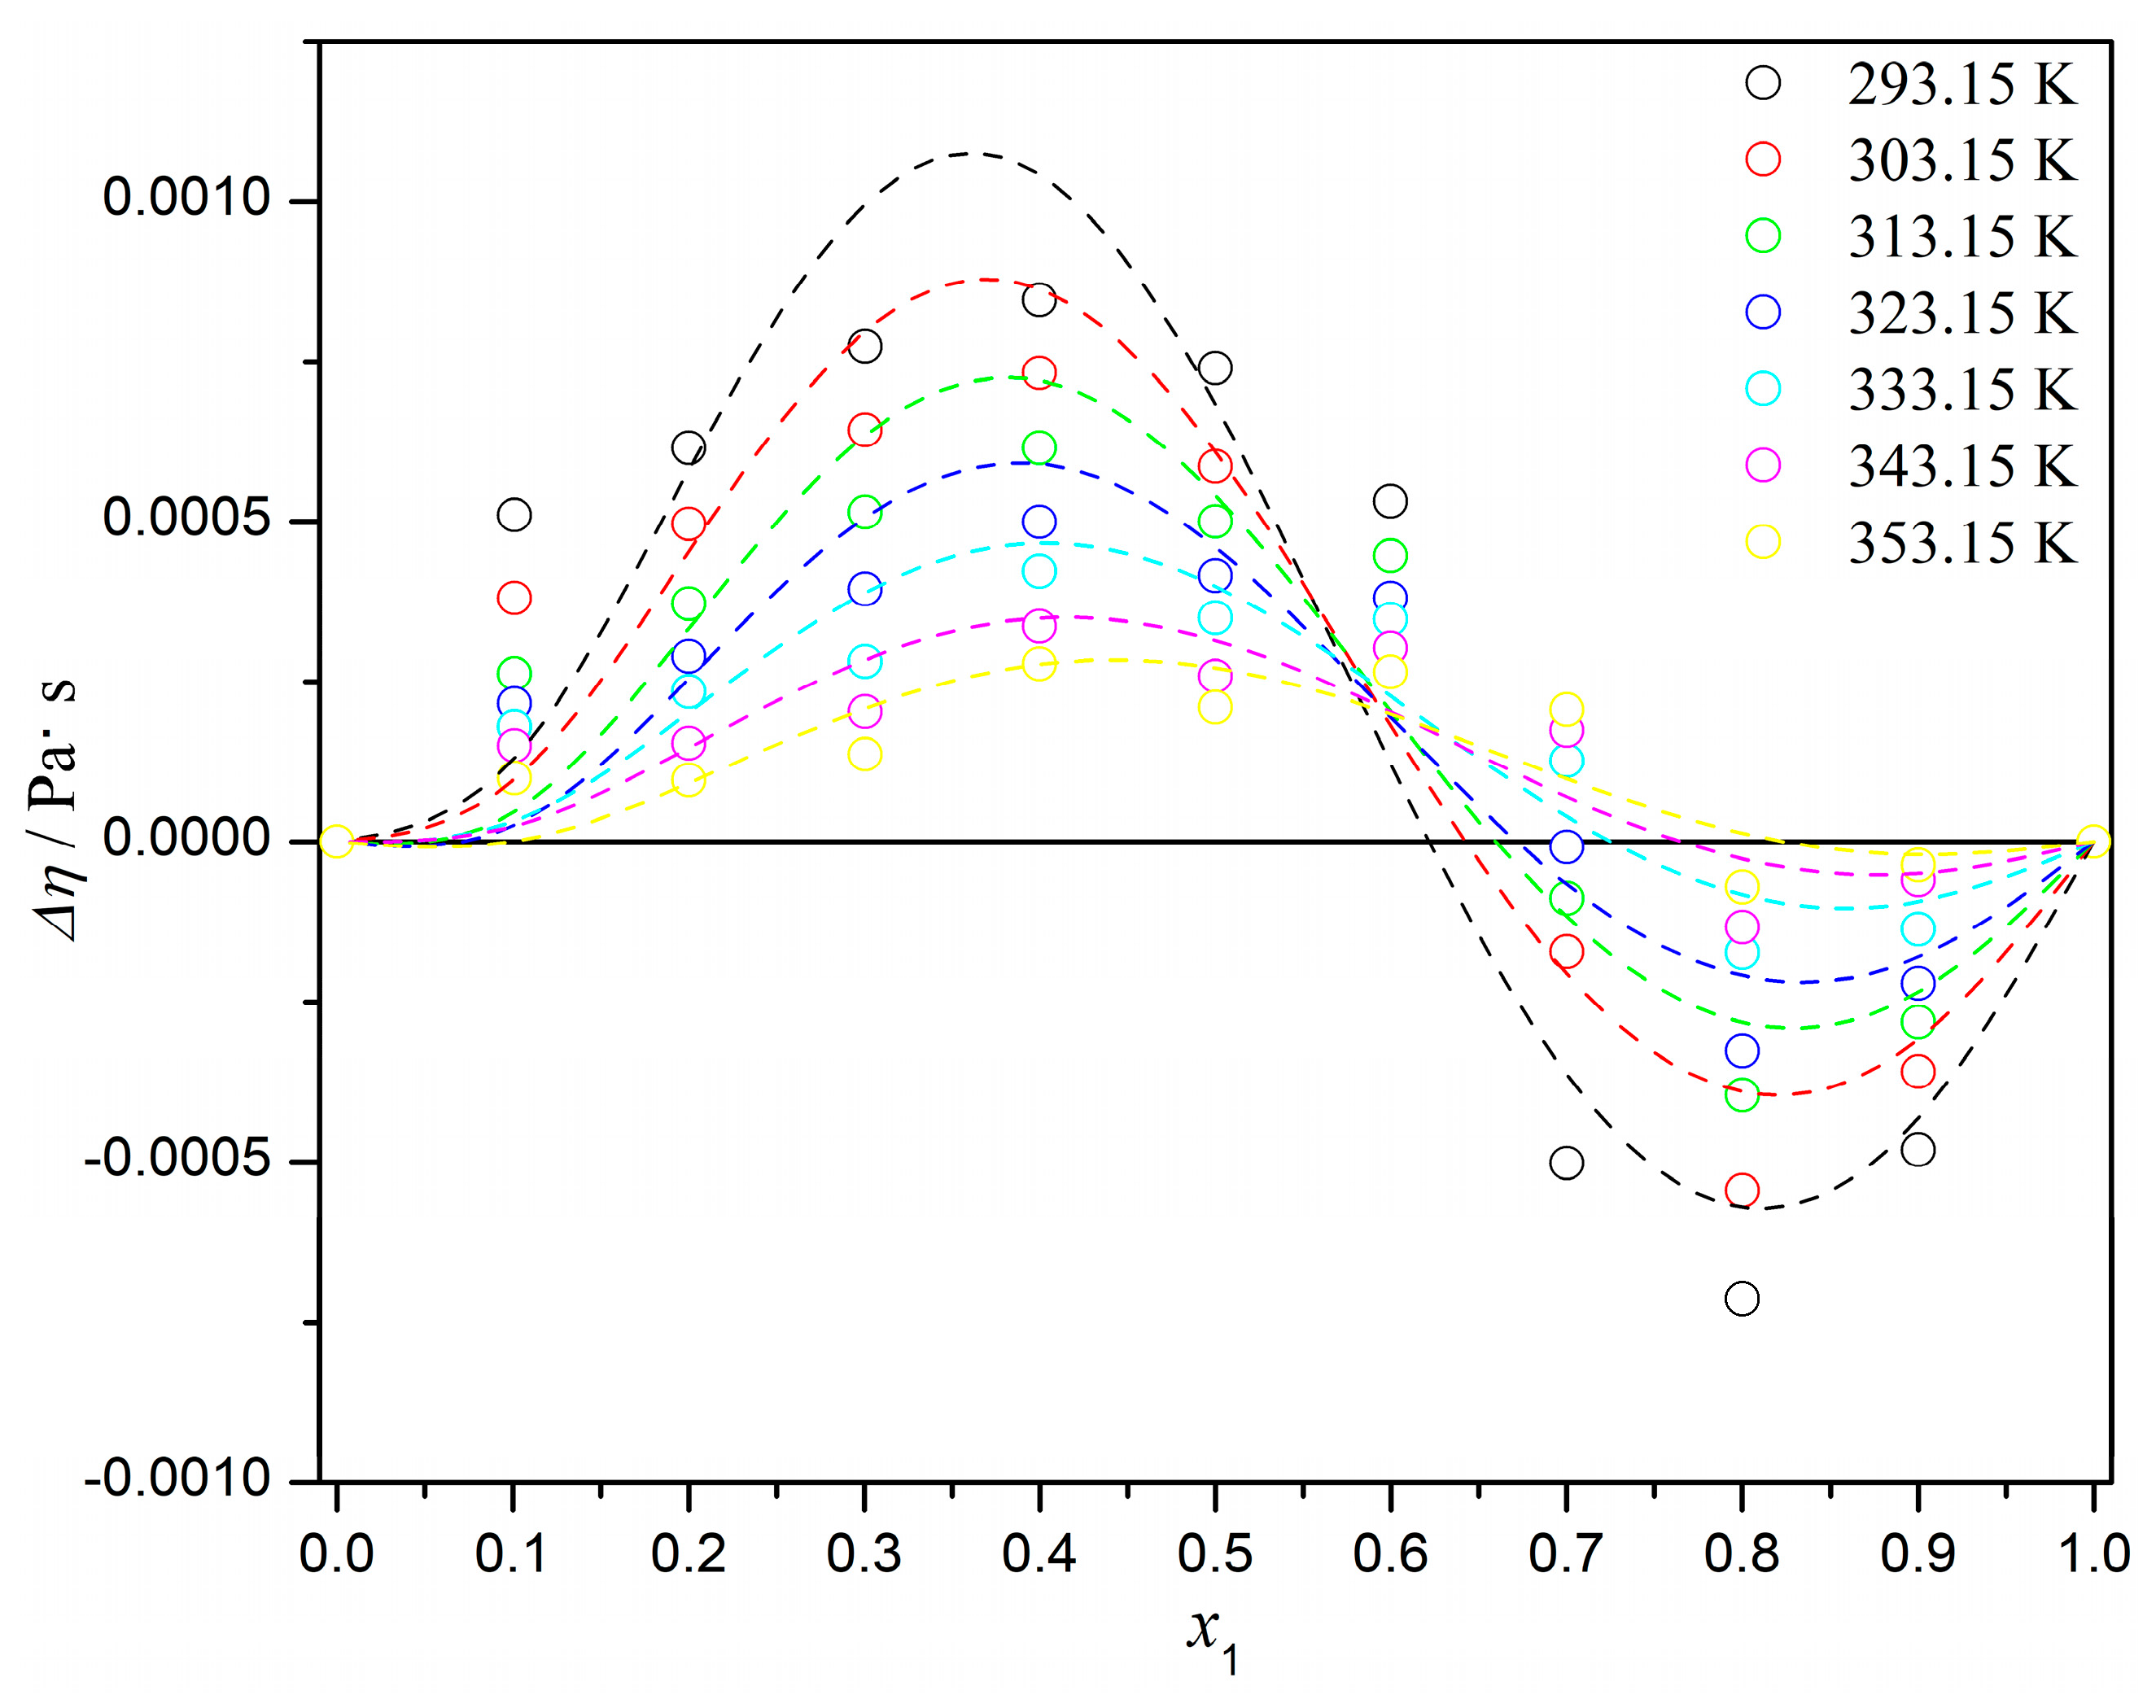
Figure 15 illustrates the deviation in dynamic viscosity (Δη), where the symbols correspond to the experimental values, whereas the dotted lines represent the values calculated by the McAllister model. The viscosity deviations exhibit two general regions: the first is characterized by positive deviations in the biodiesel-rich region from a diesel mole fraction of zero to 0.6, and the second region exhibits negative values that correspond to the diesel-rich mixture with diesel mole fractions of 0.6 to 1. The positive deviations indicated that the experimental viscosity of the mixtures was higher than expected from ideal behavior; this suggested strong heteromolecular interactions between the polar ester groups of biodiesels and the hydrocarbon chains of diesel, causing more ordered configurations and an increase in the effective intermolecular friction and leading to enhanced resistance to flow [55,71,73]. The thermal exposure reduced intermolecular cohesion, which diminished specific ester–hydrocarbon associations and facilitated molecular motion [71,84]. On the contrary, the negative deviations observed for diesel-rich mixtures could be explained by a plasticizing effect; the FAME molecules mainly contained in biodiesel partially disrupted the hydrocarbon–hydrocarbon interactions of diesel, inducing a local reduction in viscosity [58]. Therefore, the asymmetric Δη behavior occurred due to a combination of structural and energetic effects [85]. The McAllister model accurately reproduced both the shape and the location of maximum and minimum viscosity deviation since the model incorporates interaction parameters related to molecular size, molar mass, and intermolecular forces.
Figure 15.
Dynamic viscosity deviation of the commercial diesel (x1) + chicken fat FAME (x2) mixtures as a function of composition.
3.4. Thermodynamic Activation Parameters
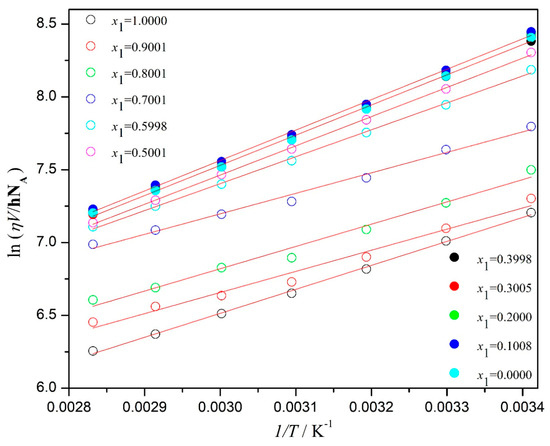
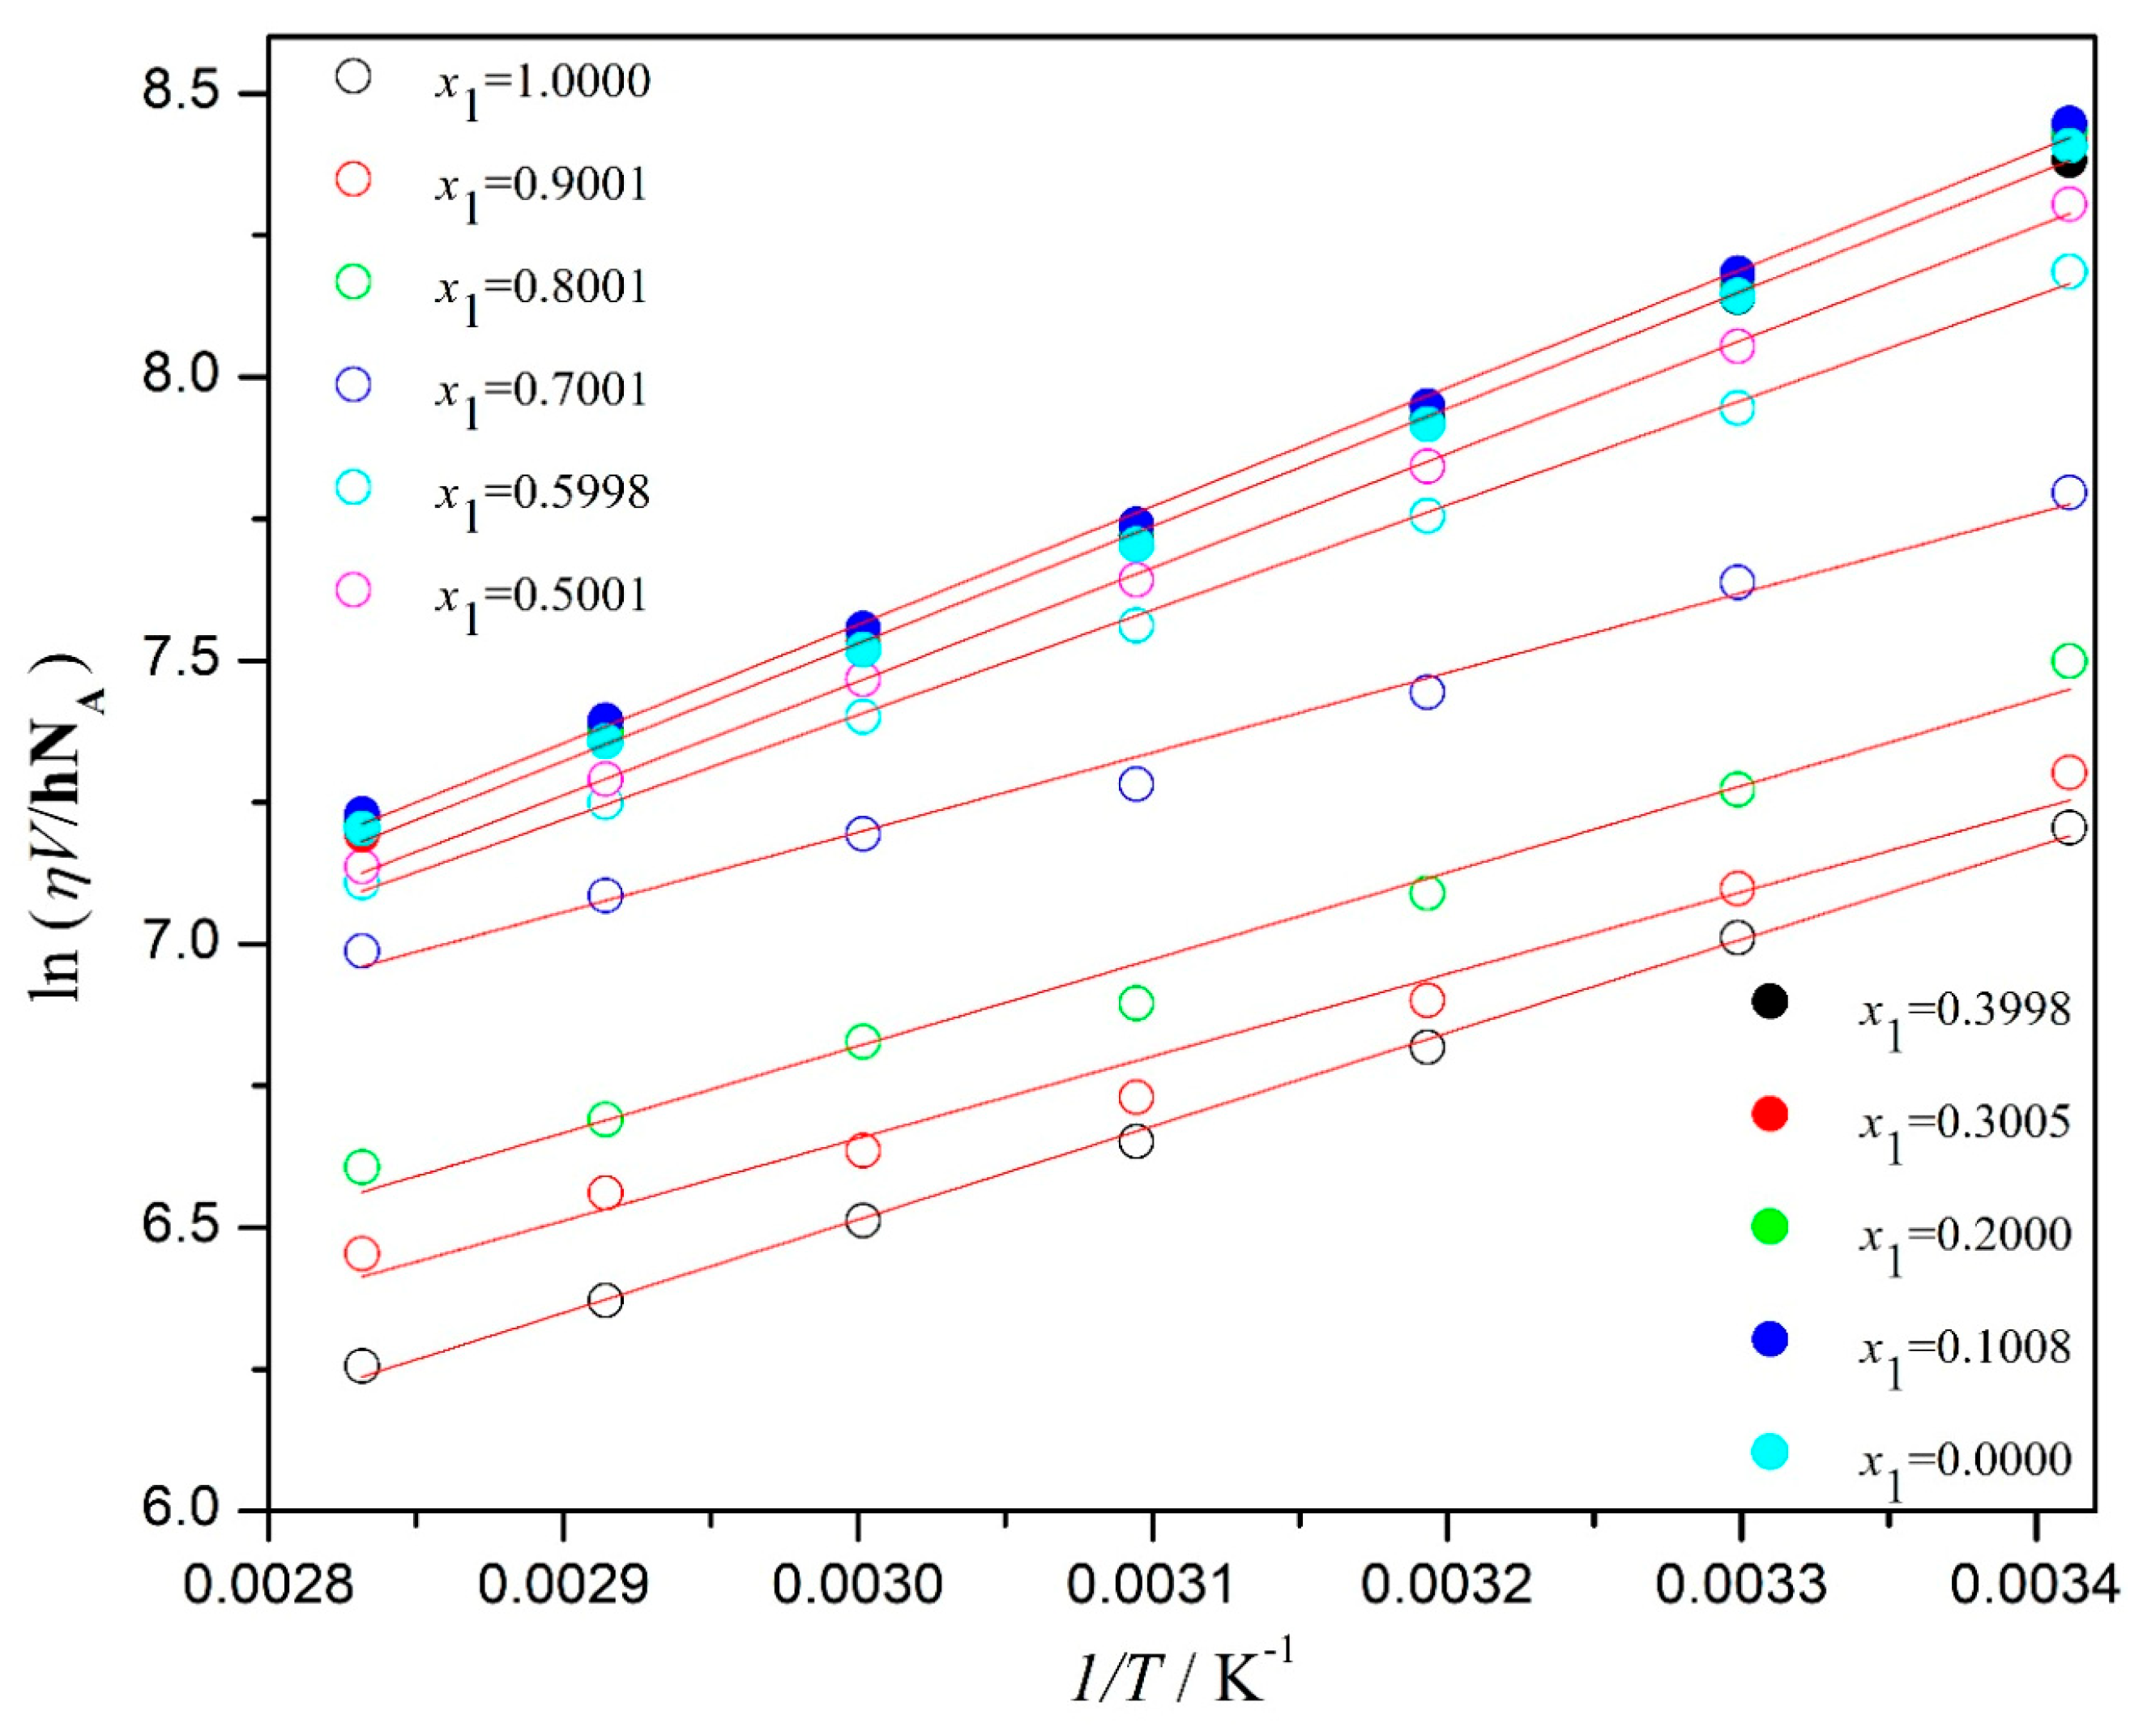
The plot of as a function of is depicted in Figure 16, where a well-defined linear relationship is observed over the investigated temperature range. This confirmed the suitability of Eyring’s transition-state theory to properly describe the viscous flow and the control of the activated process over the momentum transport, where molecules must overcome an energy barrier to reorganize and enable macroscopic liquid flow. The slopes of the straight lines increased as the biodiesel content in the mixture increased; this implied values of high activation enthalpy , that is, the energetic barrier that must overcome to ensure molecular motion, as listed in Table 8. This increase was associated with the high molar mass of methyl esters and the content of polar functional groups (carbonyl and ester) and long aliphatic chains; all these factors promoted stronger intermolecular interactions and greater structural cohesion of the fluid [86].
Figure 16.
Plot of versus for the diesel + biodiesel mixtures.
Table 8.
Gibbs free energy of activation (), activation enthalpy (), and activation entropy () for the viscous-flow process of diesel (1) + biodiesel (2) mixtures.
The y-axis intercepts of the linear fits in Figure 16 were related to the activation entropy , and the values are summarized in Table 8. The negative magnitude of indicated a more ordered transition state, associated with viscous flow, in comparison to the initial state, a characteristic feature of liquids exhibiting directional interactions or transient molecular associations [87]. Mixtures with high methyl ester biodiesel content attained more negative values, suggesting increased configurational restriction during the flow process. This behavior was consistent with the formation of more organized structures placed locally, induced by dipole–dipole interactions between FAME ester groups and heteromolecular interactions with diesel hydrocarbon chains at intermediate compositions for the latter [88].
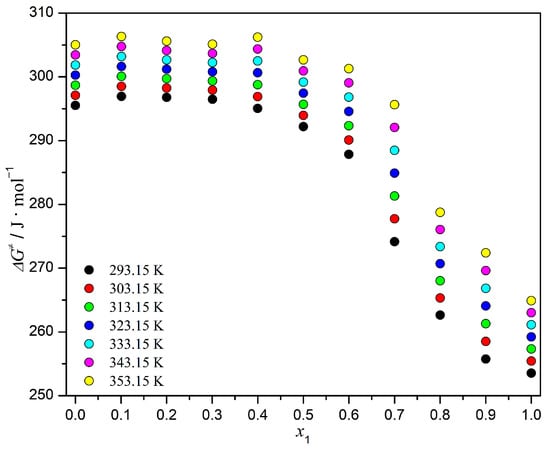
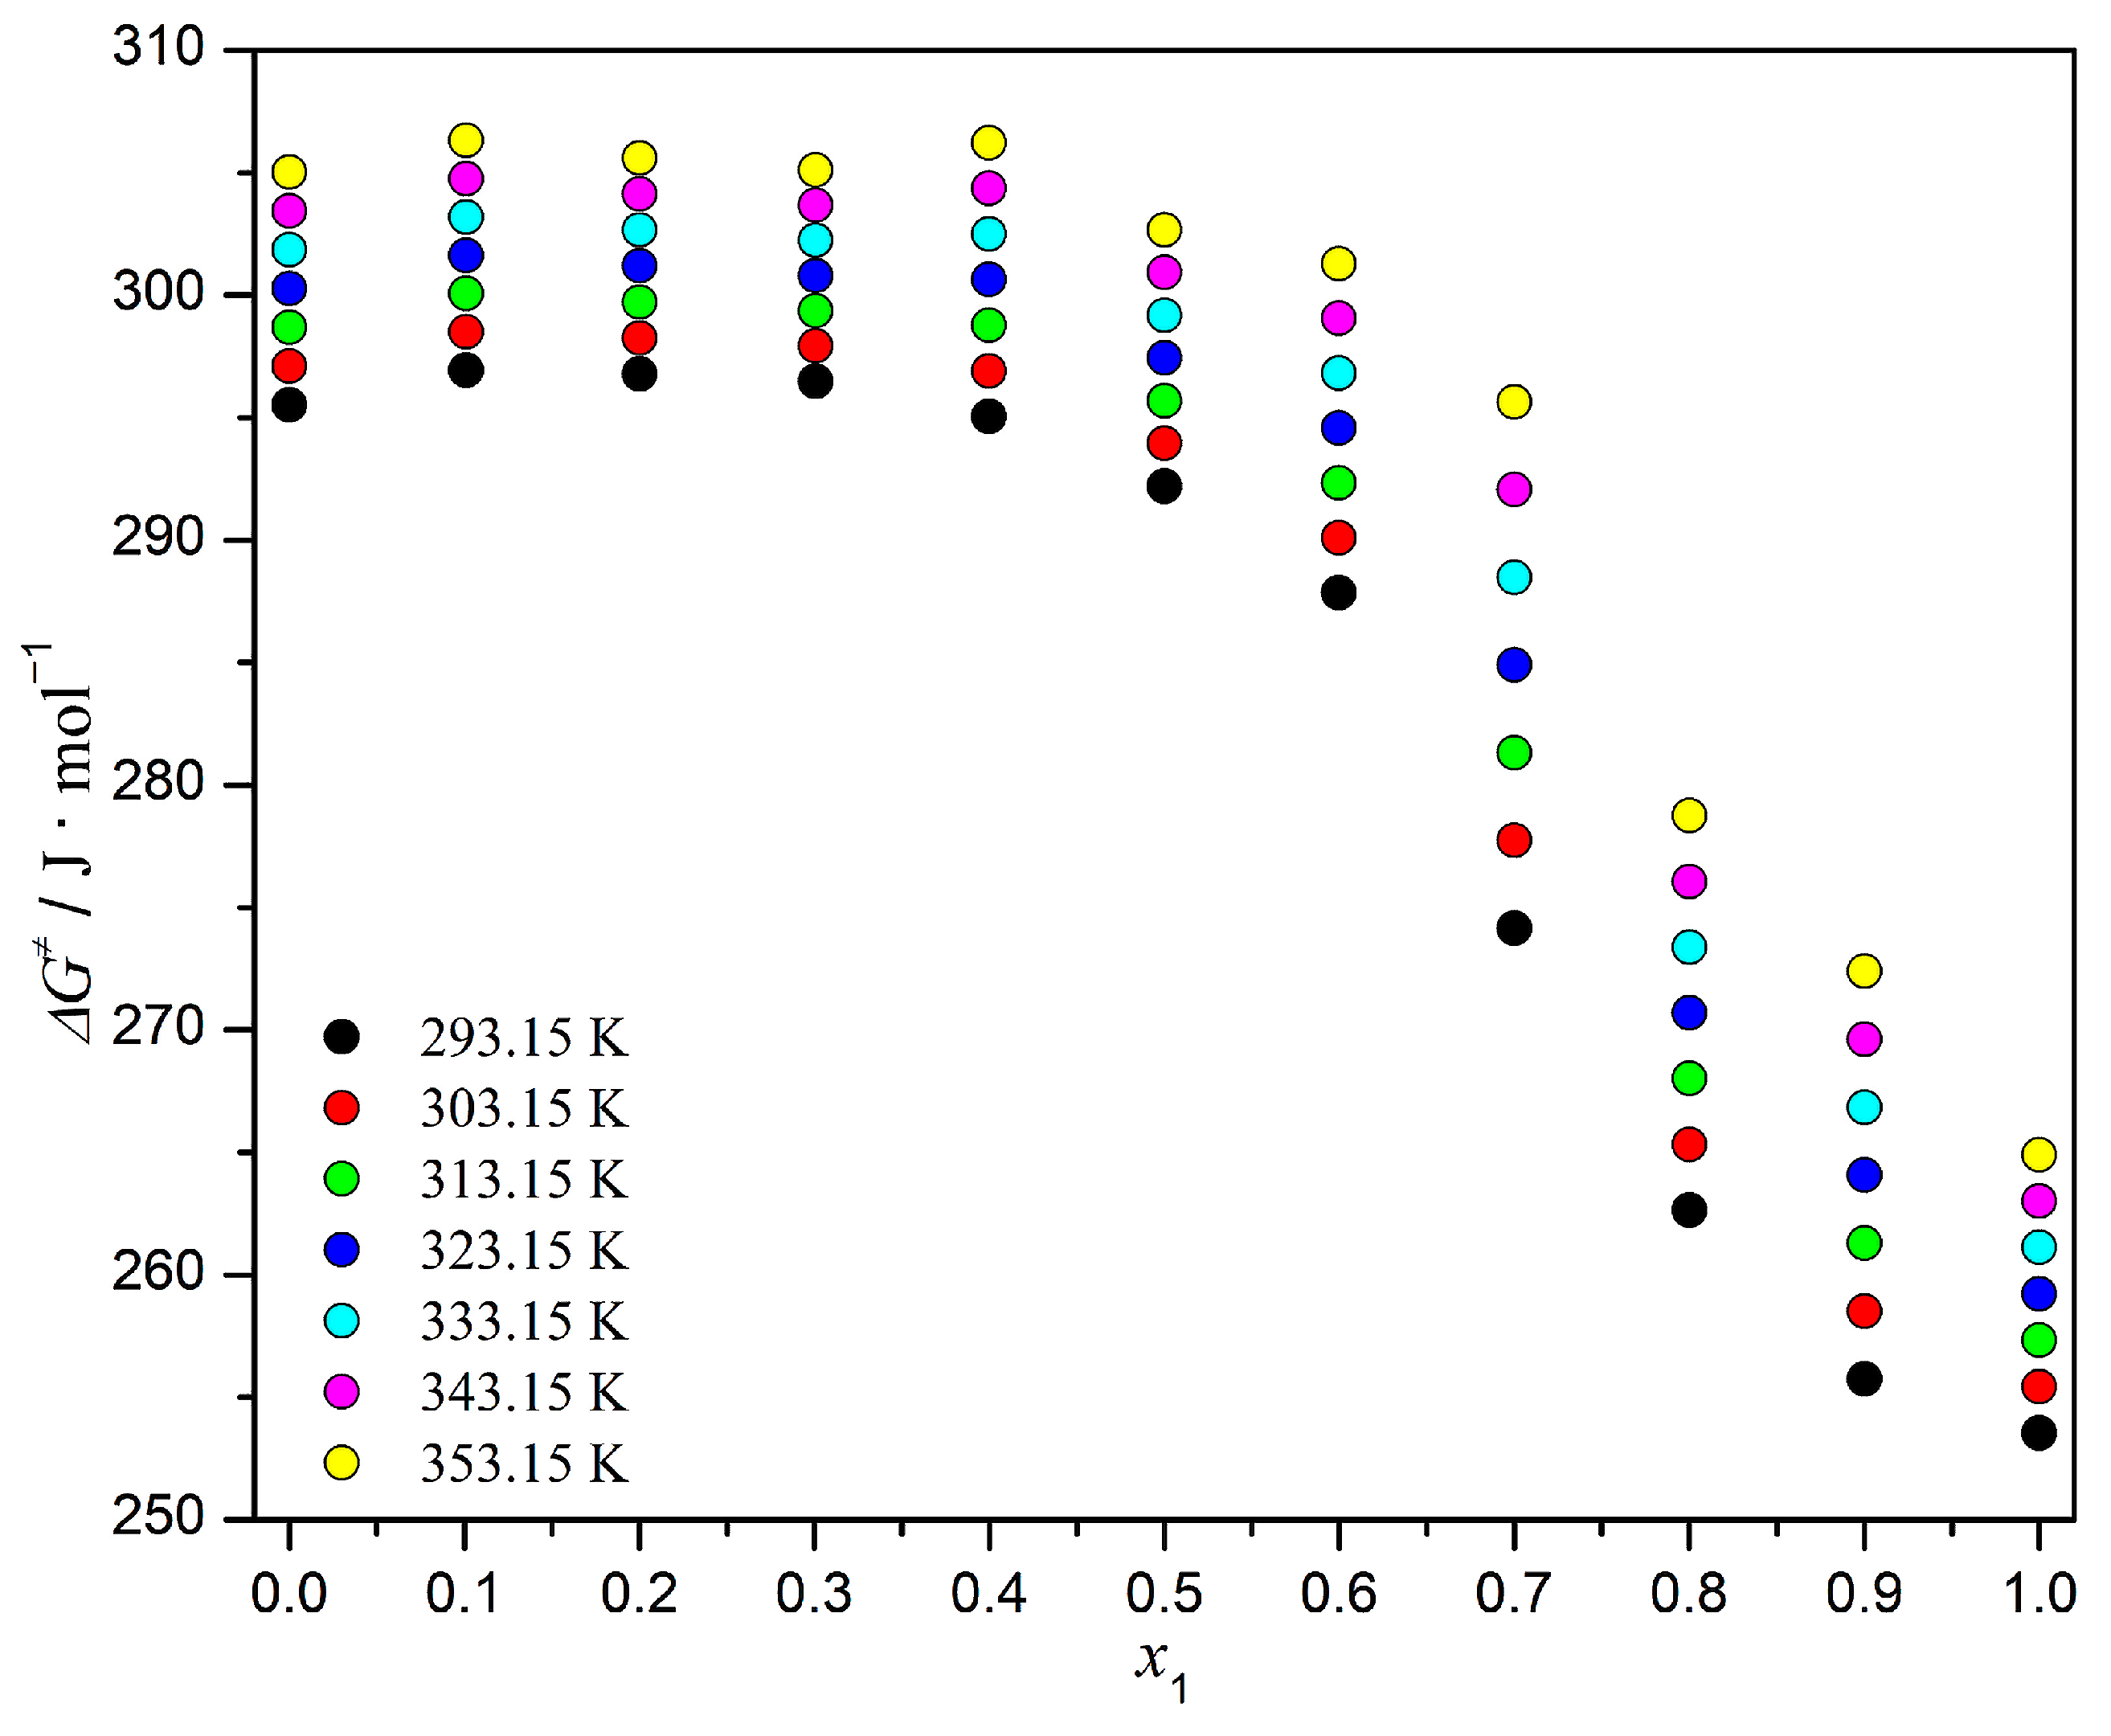
Figure 17 complements this analysis by illustrating the variation in the Gibbs free energy of activation for viscous flow as a function of composition at different temperatures. For all isotherms, increased systematically with increasing biodiesel mole fractions, reaching the highest values in the ester-rich region; this confirmed that viscous flow became progressively less energetically favorable as the FAME content increased, in full agreement with the observed increase in both the dynamic and kinematic viscosities of the system. Furthermore, decreased with increasing temperature for all compositions, reflecting the dominant role of thermal energy in facilitating molecular rearrangement. The increase in thermal energy weakened intermolecular interactions and enhanced the molecular mobility required to reach the transition state, thereby reducing the free-energy barrier for flow [89]. Nevertheless, the separation between the curves corresponding to different compositions remained nearly constant with temperature, indicating that the structural differences between diesel and FAMEs continued to exert a significant influence on the flow mechanism even at elevated temperatures.
Figure 17.
Gibbs free energy of activation for viscous flow, , for diesel (1) + biodiesel (2) mixtures.
4. Conclusions
- Based on physicochemical and thermophysical characterization, the fatty acid methyl ester biodiesel synthetized from residual chicken fat exhibited a composition dominated by medium- and long-chain alkyl esters, in contrast with biodiesels produced from vegetable sources.
- Density decreased with increases in temperature and diesel content because of thermal exposure and the proper diesel structural compaction.
- The negative excess molar volumes indicated significant attractive interactions between the carbonyl groups of methyl esters and the hydrocarbon chains of diesel. The local minimum observed near x1 ≈ 0.4–0.45 confirmed the efficient packing and the enhancement of heteromolecular interactions at intermediate compositions.
- The partial molar volume of biodiesel increased with temperature, consistent with its higher polarity and structural rigidity, mainly ascribed to esters.
- Mixtures with a higher biodiesel content exhibited low thermal expansivity, indicative of more compact molecular arrangements, while the excess thermal expansion coefficient () was negative for all composition ranges, confirming the non-ideal behavior controlled by ester–hydrocarbon interactions.
- The high activation enthalpies () and increasingly negative activation entropies () for mixtures rich in FAMEs indicated more ordered transition states and higher energetic barriers to viscous flow. Properties such as viscosity have an important impact on atomization behavior and the quality of fuel injection in diesel engines, since they affect droplet size, spray formation, and the overall combustion process.
Author Contributions
Investigation: A.Z.-M., S.G.-A. and R.G.-M.; Conceptualization: A.Z.-M., R.G.-M. and S.G.-A.; Methodology: S.G.-A. and O.E.-S.; Data curation: R.G.-M. and H.I.P.-L.; Validation: H.I.P.-L. and J.D.-G.; Writing—original draft: O.E.-S. and J.D.-G.; Writing—review and editing; A.Z.-M. and J.D.-G.; Supervision: H.I.P.-L. and O.E.-S. All authors have read and agreed to the published version of the manuscript.
Funding
The authors gratefully acknowledge the financial support provided by SECIHTI through the SNII program and the project grant number CF-2023-I-311.
Data Availability Statement
The original contributions presented in this study are included in the article. Further inquiries can be directed to the corresponding author.
Conflicts of Interest
The authors declare no conflicts of interest.
References
- Demirbas, A. Progress and recent trends in biodiesel fuels. Energy Convers. Manag. 2009, 50, 14–34. [Google Scholar] [CrossRef] [Scilit]
- Knothe, G. Biodiesel and renewable diesel: A comparison. Prog. Energy Combust. Sci. 2010, 36, 364–373. [Google Scholar] [CrossRef] [Scilit]
- Nigam, P.S.; Singh, A. Production of liquid biofuels from renewable resources. Prog. Energy Combust. Sci. 2011, 37, 52–68. [Google Scholar] [CrossRef] [Scilit]
- Atabani, A.E.; Silitonga, A.S.; Badruddin, I.A.; Mahlia, T.M.I.; Masjuki, H.H.; Mekhilef, S. A comprehensive review on biodiesel as an alternative energy resource and its characteristics. Renew. Sustain. Energy Rev. 2012, 16, 2070–2093. [Google Scholar] [CrossRef] [Scilit]
- Lapuerta, M.; Armas, O.; Rodriguez-Fernandez, J. Effect of biodiesel fuels on diesel engine emissions. Prog. Energy Combust. Sci. 2008, 34, 198–223. [Google Scholar] [CrossRef] [Scilit]
- Payri, R.; Salvador, F.J.; Gimeno, J.; de la Morena, J. Effects of nozzle geometry on direct injection diesel engine combustion process. Appl. Therm. Eng. 2009, 29, 2051–2060. [Google Scholar] [CrossRef] [Scilit]
- Benjumea, P.; Agudelo, J.; Agudelo, A. Basic properties of palm oil biodiesel–diesel blends. Fuel 2008, 87, 2069–2075. [Google Scholar] [CrossRef] [Scilit]
- Rowane, A.J.; Mahesh Babu, V.; Rokni, H.B.; Moore, J.D.; Gavaises, M.; Wensing, M.; Gupta, A.; McHugh, M.A. Effect of composition, temperature, and pressure on the viscosities and densities of three diesel fuels. J. Chem. Eng. Data 2019, 64, 5529–5547. [Google Scholar] [CrossRef] [Scilit]
- Atadashi, I.M.; Aroua, M.K.; Aziz, A.A. High quality biodiesel and its diesel engine application: A review. Renew. Sustain. Energy Rev. 2010, 14, 1999–2008. [Google Scholar] [CrossRef] [Scilit]
- Gui, M.M.; Lee, K.T.; Bhatia, S. Feasibility of edible oil vs. non-edible oil vs. waste edible oil as biodiesel feedstock. Energy 2008, 33, 1646–1653. [Google Scholar] [CrossRef] [Scilit]
- Morita, A.; Sugiyama, G. Influence of density and viscosity of diesel fuel on exhaust emissions. In 2003 JSAE/SAE International Spring Fuels and Lubricants Meeting; SAE Technical Paper Series; SAE International: Warrendale, PA, USA, 2003. [Google Scholar] [CrossRef] [Scilit]
- Ozsezen, A.N.; Canakci, M.; Turkcan, A.; Sayin, C. Performance and combustion characteristics of a DI diesel engine fueled with waste palm oil and canola oil methyl esters. Fuel 2009, 88, 629–636. [Google Scholar] [CrossRef] [Scilit]
- ASTM D4737-10; Standard Test Method for Calculated Cetane Index by Four Variable Equation. ASTM International: West Conshohocken, PA, USA, 2010.
- ASTM D93-20; Standard Test Methods for Flash Point by Pensky-Martens Closed Cup Tester. ASTM International: West Conshohocken, PA, USA, 2020.
- ASTM D7039-15a; Standard Test Method for Determination of Sulfur in Gasoline and Diesel Fuel by Monochromatic Wavelength Dispersive X-ray Fluorescence Spectrometry. ASTM International: West Conshohocken, PA, USA, 2015.
- ASTM D1298-12b; Standard Test Method for Density, Relative Density, or API Gravity of Crude Petroleum and Liquid Petroleum Products by Hydrometer Method. ASTM International: West Conshohocken, PA, USA, 2012.
- ASTM D86-18; Standard Test Method for Distillation of Petroleum Products and Liquid Fuels at Atmospheric Pressure. ASTM International: West Conshohocken, PA, USA, 2018.
- Meher, L.C.; Dharmagadda, V.S.S.; Naik, S.N. Optimization of alkali-catalyzed transesterification of Pongamia pinnata oil for production of biodiesel. Bioresour. Technol. 2006, 97, 1392–1397. [Google Scholar] [CrossRef] [Scilit] [PubMed]
- Ivanova, M.; Hanganu, A.; Dumitriu, R.; Tociu, M.; Ivanov, G.; Stavarache, C.; Popescu, L.; Ghendov-Mosanu, A.; Sturza, R.; Deleanu, C.; et al. Saponification value of fats and oils as determined from 1H-NMR data: The case of dairy fats. Foods 2022, 11, 1466. [Google Scholar] [CrossRef] [Scilit]
- Rincón, L.A.; Cadavid, J.G.; Orjuela, A. Used cooking oils as potential oleochemical feedstock for urban biorefineries—Study case in Bogota, Colombia. Waste Manag. 2019, 88, 200–210. [Google Scholar] [CrossRef] [Scilit]
- Canakci, M.; Van Gerpen, J. Biodiesel production from oils and fats with high free fatty acids. Trans. ASAE 2001, 44, 1429–1436. [Google Scholar] [CrossRef] [Scilit]
- Arora, R. Esterification of high free fatty acid rice bran oil: Parametric and kinetic study. Chem. Biochem. Eng. Q. 2016, 29, 617–623. [Google Scholar] [CrossRef] [Scilit]
- Leung, D.Y.C.; Wu, X.; Leung, M.K.H. A review on biodiesel production using catalyzed transesterification. Appl. Energy 2010, 87, 1083–1095. [Google Scholar] [CrossRef] [Scilit]
- Mohiddin, M.N.; Saleh, A.A.; Reddy, A.N.R.; Hamdan, S. A study on chicken fat as an alternative feedstock: Biodiesel production, fuel characterisation, and diesel engine performance analysis. Int. J. Automot. Mech. Eng. 2018, 15, 5535–5546. [Google Scholar] [CrossRef] [Scilit]
- Maafa, I.M. Biodiesel synthesis from high free-fatty-acid chicken fat using a scrap-tire derived solid acid catalyst and KOH. Polymers 2022, 14, 643. [Google Scholar] [CrossRef] [Scilit]
- Mashodi, N.; Rahim, N.Y.; Muhammad, N.; Asman, S. Evaluation of extra virgin Olive oil adulteration with edible oils using ATR-FTIR spectroscopy. Malays. J. Appl. Sci. 2020, 5, 35–44. [Google Scholar] [CrossRef] [Scilit]
- Siatis, N.G.; Kimbaris, A.C.; Pappas, C.S.; Tarantilis, P.A.; Polissiou, M.G. Improvement of biodiesel production based on the application of ultrasound: Monitoring of the procedure by FTIR spectroscopy. J. Am. Oil Chem. Soc. 2006, 83, 53–57. [Google Scholar] [CrossRef] [Scilit]
- Dubé, M.A.; Zheng, S.; McLean, D.D.; Kates, M. A comparison of attenuated total reflectance-FTIR spectroscopy and GPC for monitoring biodiesel production. J. Am. Oil Chem. Soc. 2004, 81, 599–603. [Google Scholar] [CrossRef] [Scilit]
- Mirghani, M.E.S.; Che Man, Y.B.; Jinap, S.; Baharin, B.S.; Bakar, J. FTIR spectroscopic determination of soap in refined vegetable oils. J. Am. Oil Chem. Soc. 2002, 79, 111–116. [Google Scholar] [CrossRef] [Scilit]
- Braga, E.; Damasceno, L.; Barros de Sousa Silva, C.; Silva, L.; Cavalcante, M.; Barreto, C.; Silva, S.; Murilo Tavares de Luna, F.; Bertini, L.; Nascimento, T.; et al. 1H NMR and UV-Vis as analytical techniques to evaluate biodiesel conversion and oxidative stability. Fuels 2024, 5, 107–122. [Google Scholar] [CrossRef] [Scilit]
- Knothe, G. Monitoring a progressing transesterification reaction by fiber-optic near infrared spectroscopy with correlation to 1H nuclear magnetic resonance spectroscopy. J. Am. Oil Chem. Soc. 2000, 77, 489–493. [Google Scholar] [CrossRef] [Scilit]
- Meher, L.; Vidyasagar, D.; Naik, S. Technical aspects of biodiesel production by transesterification—A review. Renew. Sustain. Energy Rev. 2006, 10, 248–268. [Google Scholar] [CrossRef] [Scilit]
- Peng, X.-H.; Xiao, H.-M.; Zhao, S.; Hussain, D.; Chen, J.-L.; Luo, D.; Wang, D.; Lv, X.; Chen, H.; Wei, F.; et al. Rational biodiesel production by screening different long-term stored plant oils via nuclear magnetic resonance spectroscopic measurement. Ind. Crops Prod. 2023, 205, 117557. [Google Scholar] [CrossRef] [Scilit]
- Flory, P.J. Statistical thermodynamics of liquid mixtures. J. Am. Chem. Soc. 1965, 87, 1833–1838. [Google Scholar] [CrossRef] [Scilit]
- Flory, P.J.; Orwoll, R.A.; Vrij, A. Statistical thermodynamics of chain molecule liquids. II. Liquid mixtures of normal paraffin hydrocarbons. J. Am. Chem. Soc. 1964, 86, 3515–3520. [Google Scholar] [CrossRef] [Scilit]
- Flory, P.J.; Orwoll, R.A.; Vrij, A. Statistical thermodynamics of chain molecule liquids. I. an equation of state for normal paraffin hydrocarbons. J. Am. Chem. Soc. 1964, 86, 3507–3514. [Google Scholar] [CrossRef] [Scilit]
- Abe, A.; Flory, P.J. The thermodynamic properties of mixtures of small, nonpolar molecules. J. Am. Chem. Soc. 1965, 87, 1838–1846. [Google Scholar] [CrossRef] [Scilit]
- Prigogine, I. The Molecular Theory of Solutions; North Holland: Amsterdam, The Netherlands, 1957. [Google Scholar]
- Prigogine, I.; Trappeniers, N.; Mathot, V. Statistical thermodynamics of r-MERS and r-MER solutions. Discuss. Faraday Soc. 1953, 15, 93. [Google Scholar] [CrossRef] [Scilit]
- Patterson, D.; Delmas, G. Corresponding states theories and liquid models. Discuss. Faraday Soc. 1970, 49, 98–105. [Google Scholar] [CrossRef] [Scilit]
- Rocha Pinto, R.; Santos, D.; Mattedi, S.; Aznar, M. Density, refractive index, apparent volumes and excess molar volumes of four protic ionic liquids + water at T=298.15 and 323.15 K. Braz. J. Chem. Eng. 2015, 32, 671–682. [Google Scholar] [CrossRef] [Scilit]
- Ivaniš, G.R.; Radović, I.R.; Veljković, V.B.; Kijevčanin, M.L. Thermodynamic properties of biodiesel and petro-diesel blends at high pressures and temperatures. Experimental and modeling. Fuel 2016, 184, 277–288. [Google Scholar] [CrossRef] [Scilit]
- Ivaniš, G.R.; Radović, I.R.; Veljković, V.B.; Kijevčanin, M.L. Biodiesel density and derived thermodynamic properties at high pressures and moderate temperatures. Fuel 2016, 165, 244–251. [Google Scholar] [CrossRef] [Scilit]
- Sun, Y.; Su, L.; Wang, H. Volumetric properties of binary liquid mixtures: Application of the Prigogine–Flory–Patterson theory to excess molar volumes of dichloromethane with benzene or toluene. J. Chem. Thermodyn. 2009, 41, 1154–1161. [Google Scholar] [CrossRef] [Scilit]
- Radovic, I.R.; Grozdanic, N.D.; Djordjevic, B.D.; Serbanovic, S.P.; Kijevcanin, M.L. Prediction of excess molar volumes of binary mixtures by Prigogine-Flory-Patterson (PFP) and extended real association solution (ERAS) models. J. Serbian Chem. Soc. 2017, 82, 1379–1390. [Google Scholar] [CrossRef] [Scilit]
- Santos, D.Q.; de Lima, A.L.; de Lima, A.P.; Neto, W.B.; Fabris, J.D. Thermal expansion coefficient and algebraic models to correct values of specific mass as a function of temperature for corn biodiesel. Fuel 2013, 106, 646–650. [Google Scholar] [CrossRef] [Scilit]
- McAllister, R.A. The viscosity of liquid mixtures. AIChE J. Am. Inst. Chem. Eng. 1960, 6, 427–431. [Google Scholar] [CrossRef] [Scilit]
- Powell, R.E.; Roseveare, W.E.; Eyring, H. Diffusion, Thermal Conductivity, and Viscous Flow of Liquids. Ind. Eng. Chem. 1941, 33, 430–435. [Google Scholar] [CrossRef] [Scilit]
- Saleh, M.A.; Akhtar, S.; Begum, S.; Ahmed, M.S.; Begum, S.K. Density and viscosity of 1-alkanols. Phys. Chem. Liq. 2004, 42, 615–623. [Google Scholar] [CrossRef] [Scilit]
- Tat, M.E.; Van Gerpen, J.H. The specific gravity of biodiesel and its blends with diesel fuel. J. Am. Oil Chem. Soc. 2000, 77, 115–119. [Google Scholar] [CrossRef] [Scilit]
- Jafarihaghighi, F.; Ardjmand, M.; Salar Hassani, M.; Mirzajanzadeh, M.; Bahrami, H. Effect of fatty acid profiles and molecular structures of nine new source of biodiesel on combustion and emission. ACS Omega 2020, 5, 16053–16063. [Google Scholar] [CrossRef] [Scilit]
- Mishra, R.; Sharma, D.; Prajapati, C. Excess molar volume and deviations in viscosity of the binary liquid mixtures containing 1,3-dioxolane + alkanols at T = 298.15k. Am. J. Heterocycl. Chem. 2024, 10, 13–25. [Google Scholar] [CrossRef] [Scilit]
- Naum, M.M.; Dumitrescu, V. Excess thermodynamic properties and FTIR studies of binary mixtures of toluene with 2-propanol or 2-methyl-1-propanol. Molecules 2024, 29, 4706. [Google Scholar] [CrossRef] [Scilit]
- Speight, J.G. Production, properties and environmental impact of hydrocarbon fuel conversion. In Advances in Clean Hydrocarbon Fuel Processing; Woodhead Publishing: Cambridge, UK, 2011; pp. 54–82. [Google Scholar] [CrossRef] [Scilit]
- Berman, P.; Meiri, N.; Colnago, L.A.; Moraes, T.B.; Linder, C.; Levi, O.; Parmet, Y.; Saunders, M.; Wiesman, Z. Study of liquid-phase molecular packing interactions and morphology of fatty acid methyl esters (biodiesel). Biotechnol. Biofuels 2015, 8, 12. [Google Scholar] [CrossRef] [Scilit]
- Lapuerta, M.; Rodríguez-Fernandez, J.; García-Contreras, R.; Bogarra, M. Molecular interactions in blends of alcohols with diesel fuels: Effect on stability and distillation. Fuel 2015, 139, 171–179. [Google Scholar] [CrossRef] [Scilit]
- Sánchez-Rodríguez, G.; Domenzaín-González, J.; Verónico-Sánchez, F.J.; Pérez-López, H.I.; Zúñiga-Moreno, A.; Elizalde-Solis, O. Density and viscosity in biodiesel + diesel mixtures from recycled feedstocks. Appl. Sci. 2025, 15, 3812. [Google Scholar] [CrossRef] [Scilit]
- Moradi, G.R.; Karami, B.; Mohadesi, M. Densities and kinematic viscosities in biodiesel–diesel blends at various temperatures. J. Chem. Eng. Data 2013, 58, 99–105. [Google Scholar] [CrossRef] [Scilit]
- Cano-Gómez, J.J.; Iglesias-Silva, G.A.; Rivas, P.; Díaz-Ovalle, C.O.; de Jesús Cerino-Córdova, F. Densities and viscosities for binary liquid mixtures of biodiesel + 1-butanol, + isobutyl alcohol, or + 2-butanol from 293.15 to 333.15 K at 0.1 MPa. J. Chem. Eng. Data 2017, 62, 3391–3400. [Google Scholar] [CrossRef] [Scilit]
- Pratas, M.J.; Freitas, S.V.D.; Oliveira, M.B.; Monteiro, S.C.; Lima, Á.S.; Coutinho, J.A.P. Biodiesel density: Experimental measurements and prediction models. Energy Fuels Am. Chem. Soc. J. 2011, 25, 2333–2340. [Google Scholar] [CrossRef] [Scilit]
- Aldred, E.M.; Buck, C.; Vall, K. Lipids. In Pharmacology; Lippincott Williams & Wilkins: Philadelphia, PA, USA, 2009; pp. 73–80. [Google Scholar] [CrossRef] [Scilit]
- Abdalla, I.E. Experimental studies for the thermo-physiochemical properties of Biodiesel and its blends and the performance of such fuels in a Compression Ignition Engine. Fuel 2018, 212, 638–655. [Google Scholar] [CrossRef] [Scilit]
- Forghani, F.; Iloukhani, H.; Khanlarzadeh, K. Experimental study and modeling using the PFP theory and the ERAS model of the excess molar volume and isentropic compressibility of dimethylbenzylamine with alkanol mixtures at different temperatures. J. Chem. Eng. Data 2022, 67, 297–304. [Google Scholar] [CrossRef] [Scilit]
- Iloukhani, H.; Fattahi, M. Application of the extended real associated solution (ERAS) theory to excess molar enthalpies of benzaldehyde + 1-alkanols (C1 to C5) at T = 298.15 K. J. Chem. Thermodyn. 2011, 43, 1597–1603. [Google Scholar] [CrossRef] [Scilit]
- Zhu, C.; Zhang, Z.; Xue, S.; Hou, K.; Liu, H.; Liu, X.; He, M. Association effect on the density, viscosity and excess properties of fatty acid ester + alcohol mixtures: Experiment and modeling. Fuel 2022, 316, 123425. [Google Scholar] [CrossRef] [Scilit]
- Stec, M.; Tatarczuk, A.; Spiewak, D.; Wilk, A. Densities, excess molar volumes, and thermal expansion coefficients of aqueous aminoethylethanolamine solutions at temperatures from 283.15 to 343.15 K. J. Solut. Chem. 2014, 43, 959–971. [Google Scholar] [CrossRef] [Scilit] [PubMed]
- Komninos, N.P.; Rogdakis, E.D. Geometric investigation of the three-coefficient Redlich-Kister expansion global phase diagram for binary mixtures. Fluid Phase Equilibria 2020, 525, 112728. [Google Scholar] [CrossRef] [Scilit]
- Bahadur, I.; Letcher, T.M.; Singh, S.; Redhi, G.G.; Venkatesu, P.; Ramjugernath, D. Excess molar volumes of binary mixtures (an ionic liquid + water): A review. J. Chem. Thermodyn. 2015, 82, 34–46. [Google Scholar] [CrossRef] [Scilit]
- Caqueret, V.; Berkalou, K.; Havet, J.-L.; Debacq, M.; Vitu, S. Density, excess molar volume and vapor–liquid equilibrium measurements at 101.3 kPa for binary mixtures containing ethyl acetate and a branched alkane: Experimental data and modeling. Liquids 2023, 3, 187–202. [Google Scholar] [CrossRef] [Scilit]
- Assaf, K.I.; Nau, W.M. Dispersion interactions in condensed phases and inside molecular containers. Acc. Chem. Res. 2023, 56, 3451–3461. [Google Scholar] [CrossRef] [Scilit]
- Parente, R.C.; Nogueira, C.A., Jr.; Carmo, F.R.; Lima, L.P.; Fernandes, F.A.N.; Santiago-Aguiar, R.S.; de Sant’Ana, H.B. Excess volumes and deviations of viscosities of binary blends of sunflower biodiesel + diesel and fish oil biodiesel + diesel at various temperatures. J. Chem. Eng. Data 2011, 56, 3061–3067. [Google Scholar] [CrossRef] [Scilit]
- Vural, U.S.; Durmaz, F.; Kocyigit, O.; Kocyigit, H.; Muradoglu, V.; Akin, B. Excess molar volumes, viscosity, refractive index, and Gibbs energy of activation of binary biodiesel + benzene, and biodiesel + toluene mixtures at 298.15 and 303.15 K. Russ. J. Phys. Chem. 2008, 82, 2260–2268. [Google Scholar] [CrossRef] [Scilit]
- Vargas-Ibáñez, L.T.; Cano-Gómez, J.J.; Iglesias-Silva, G.A.; Santos-López, I.A.; Rivas-García, P.; Alcalá-Rodríguez, M.M.; Zwolinski, P. Thermophysical and excess properties of diesel + biodiesel with octanol isomers at different temperatures. J. Mol. Liq. 2022, 363, 119779. [Google Scholar] [CrossRef] [Scilit]
- Bahadur, I.; Deenadayalu, N.; Ramjugernath, D. Effects of temperature and concentration on interactions in methanol + ethyl acetate and ethanol + methyl acetate or ethyl acetate systems: Insights from apparent molar volume and apparent molar isentropic compressibility study. Thermochim. Acta 2014, 577, 87–94. [Google Scholar] [CrossRef] [Scilit]
- Siraj, S. Effects of thermal, physical, and chemical properties of biodiesel and diesel blends. Am. J. Mech. Ind. Eng. 2017, 2, 24. [Google Scholar] [CrossRef] [Scilit]
- Vasileiadis, V.; Papageorgiou, I.T.; Kyriklidis, C.; Vasiliadou, I.A.; Tsanaktsidis, C.G. Mathematical correlations for volumetric (density and specific gravity) properties of diesel/biodiesel blends. Appl. Sci. 2025, 15, 4404. [Google Scholar] [CrossRef] [Scilit]
- Wang, S.; Sui, M.; Luo, H.; Li, F.; Zhai, Y. The study on the influence of oxidation degree and temperature on the viscosity of biodiesel. Green Process. Synth. 2020, 9, 182–190. [Google Scholar] [CrossRef] [Scilit]
- Ramírez Verduzco, L.F. Density and viscosity of biodiesel as a function of temperature: Empirical models. Renew. Sustain. Energy Rev. 2013, 19, 652–665. [Google Scholar] [CrossRef] [Scilit]
- Knothe, G. “designer” biodiesel: Optimizing fatty ester composition to improve fuel properties. Energy Fuels Am. Chem. Soc. J. 2008, 22, 1358–1364. [Google Scholar] [CrossRef] [Scilit]
- Phankosol, S.; Sudaprasert, K.; Lilitchan, S.; Aryusuk, K.; Krisnangkura, K. An empirical equation for estimation of kinematic viscosity of fatty acid methyl esters and biodiesel. J. Am. Oil Chem. Soc. 2015, 92, 1051–1061. [Google Scholar] [CrossRef] [Scilit]
- Kassem, Y.; Çamur, H. A laboratory study of the effects of wide range temperature on the properties of biodiesel produced from various waste vegetable oils. Waste Biomass Valorization 2017, 8, 1995–2007. [Google Scholar] [CrossRef] [Scilit]
- Gülüm, M.; Onay, F.K.; Bilgin, A. Comparison of viscosity prediction capabilities of regression models and artificial neural networks. Energy 2018, 161, 361–369. [Google Scholar] [CrossRef] [Scilit]
- Ramírez-Verduzco, L.F.; García-Flores, B.E.; Rodríguez-Rodríguez, J.E.; del Rayo Jaramillo-Jacob, A. Prediction of the density and viscosity in biodiesel blends at various temperatures. Fuel 2011, 90, 1751–1761. [Google Scholar] [CrossRef] [Scilit]
- Geacai, S.; Iulian, O.; Nita, I. Measurement, correlation and prediction of biodiesel blends viscosity. Fuel 2015, 143, 268–274. [Google Scholar] [CrossRef] [Scilit]
- Thol, M.; Richter, M. Dynamic viscosity of binary fluid mixtures: A review focusing on asymmetric mixtures. Int. J. Thermophys. 2021, 42, 161. [Google Scholar] [CrossRef] [Scilit]
- Knothe, G.; Steidley, K.R. Kinematic viscosity of biodiesel fuel components and related compounds. Influence of compound structure and comparison to petrodiesel fuel components. Fuel 2005, 84, 1059–1065. [Google Scholar] [CrossRef] [Scilit]
- dos Santos, L.J.; Espinoza-Velasquez, L.A.; Coutinho, J.A.P.; Monteiro, S. Theoretically consistent calculation of viscous activation parameters through the Eyring equation and their interpretation. Fluid Phase Equilibria 2020, 522, 112774. [Google Scholar] [CrossRef] [Scilit]
- Pires de Oliveira, I.; Caires, A.R.L. Molecular arrangement in diesel/biodiesel blends: A Molecular Dynamics simulation analysis. Renew. Energy 2019, 140, 203–211. [Google Scholar] [CrossRef] [Scilit]
- Duncan, A.M.; Ahosseini, A.; McHenry, R.; Depcik, C.D.; Stagg-Williams, S.M.; Scurto, A.M. High-pressure viscosity of biodiesel from soybean, canola, and coconut oils. Energy Fuels Am. Chem. Soc. J. 2010, 24, 5708–5716. [Google Scholar] [CrossRef] [Scilit]

Disclaimer/Publisher’s Note: The statements, opinions and data contained in all publications are solely those of the individual author(s) and contributor(s) and not of MDPI and/or the editor(s). MDPI and/or the editor(s) disclaim responsibility for any injury to people or property resulting from any ideas, methods, instructions or products referred to in the content. |
© 2026 by the authors. Licensee MDPI, Basel, Switzerland. This article is an open access article distributed under the terms and conditions of the Creative Commons Attribution (CC BY) license.