


Abstract
Genome-wide association studies (GWAS) link germplasm diversity to molecular markers for crop improvement. This review synthesizes nine barley GWAS articles and two articles on the development or validation of GWAS-derived Kompetitive Allele-Specific PCR (KASP) assays relevant to Kazakhstan, published between 2016 and 2025. Earlier studies used 9K single-nucleotide polymorphism (SNP) arrays and mainly single-model analyses, whereas later studies used higher-density 50K arrays with multi-environment phenotyping, multiple GWAS models, haplotype analysis, and candidate-gene prioritization. Across 22 traits, 459 reported GWAS association/quantitative trait locus (QTL) entries were extracted: 180 yield-component, 90 grain-quality, 87 phenological, 59 morphological, and 43 disease-resistance entries. These corresponded to 350 distinct lead-marker identifiers and do not represent 459 unique genomic or causal loci. Cross-trait integration revealed marker-rich regions on all seven chromosomes, consistent with pleiotropy or tight linkage, although the available evidence cannot distinguish these mechanisms. Twenty-seven GWAS-derived SNPs were converted into KASP assays, but only a subset was evaluated in separate germplasm panels. Thirty-three SNPs representing 55 associations were prioritized because they exceeded study-specific Bonferroni thresholds and recurred in at least two environments and/or years. Translation into breeding will require validation in separate germplasm panels and multiple environments, genotype-by-environment modeling, pangenome-informed variant discovery, and integration of diagnostic markers with genomic selection for polygenic traits.
1. Introduction
Barley (Hordeum vulgare L.) is one of the oldest domesticated cereal crops and remains an important component of global agriculture. It originated in the Fertile Crescent and became one of the first domesticated [1,2] grains used by early human civilizations as a source of carbohydrates, protein, and dietary fiber [3]. At present, barley is widely cultivated across diverse climatic zones due to its broad ecological plasticity and relatively high tolerance to drought and other abiotic stresses [4]. Globally, barley grain is used mainly for animal feed, malting, and food production [3].
In Kazakhstan, barley is the second-most important cereal crop after wheat [5] and occupies a significant role in agricultural production, livestock feeding, and rural livelihoods [6]. The crop is grown across diverse agroecological zones of the country, including northern, central, southern, and southeastern regions [7]. These regions differ considerably in precipitation, temperature, soil type, irrigation availability, and disease pressure. Traditionally, two-row spring barley has been the dominant barley type in Kazakhstan, largely because of the country’s long cold winters and often arid summers [8]. However, six-rowed barley also has potential value for feed-oriented breeding because the fertility of all three spikelets at each rachis node generally increases the number of kernels per spike. Differences in grain protein content between two- and six-rowed cultivars should not be attributed to row type alone because they also reflect end-use selection, genotype, environment, and grain yield [9].
Kazakhstan ranks among the world’s leading barley-producing countries. In the 2025–2026 production year, it ranked ninth globally, with an estimated production of 3.59 million metric tons [10]. However, its average barley yield remained substantially lower than those of other major barley-producing countries. Kazakhstan recorded an average yield of approximately 1.57 t/ha, compared with 5.63 t/ha in the European Union, 4.67 t/ha in Argentina, 3.48 t/ha in Australia, and 3.03 t/ha in Russia in the 2025–2026 season [10]. Moreover, the 10-year trend indicates that barley yield in Kazakhstan has declined by approximately 9.6% [10]. This persistent yield gap highlights the need to develop high-yielding barley cultivars that perform consistently across Kazakhstan’s diverse and often stressful environmental conditions.
The establishment of the first physical, genetic, and functional sequence assembly of the 5.1 Gb barley genome created the genomic foundation for high-density marker discovery, association mapping, and positional analysis of agronomically important loci [11]. A major technological advance was the chromosome-scale assembly of the cultivar Morex, which anchored 4.54 Gb to precise chromosomal positions and provided a reference framework for mapping single-nucleotide polymorphisms (SNPs), comparing quantitative trait loci (QTLs), and identifying candidate genes [12]. After that, genome-wide association studies (GWAS), also known as association mapping, have become powerful tools for dissecting the genetic architecture of complex quantitative traits in economically important crops [13]. GWAS identify statistical associations between genome-wide molecular markers and phenotypic variation in genetically diverse populations by exploiting linkage disequilibrium (LD) between markers and causal loci [14]. In contrast to traditional biparental linkage mapping [15,16], which detects quantitative trait loci using recombination events within a limited number of parental lines, GWAS uses historical recombination accumulated over many generations in natural or breeding populations [17,18]. Consequently, GWAS can capture broader allelic diversity and often provide higher mapping resolution.
In a typical GWAS, a diverse panel of accessions is phenotyped for target traits under field or controlled conditions and genotyped using high-throughput molecular marker platforms [19]. Marker–trait associations (MTA) are then identified using statistical models that account for population structure and relatedness among accessions, thereby reducing the risk of false-positive associations [20,21]. Significant associations indicate genomic regions that may contain genes or regulatory elements contributing to phenotypic variation. Following validation, these loci can support candidate-gene identification, marker-assisted selection, genomic selection, and the introgression of favorable alleles into breeding materials [22]. GWAS therefore provides an effective approach for identifying genomic regions, molecular markers, and candidate genes associated with grain yield and its component traits in barley. Integrating validated GWAS-derived markers into breeding programs may accelerate the development of high-yielding cultivars with stable performance and improved adaptation to Kazakhstan’s variable agroecological conditions.
At the international level, barley GWAS has evolved from relatively low-density association mapping in diversity panels to high-resolution analyses based on dense SNP arrays, exome sequencing, multi-parent populations, and multi-environment phenotyping. One of the earliest landmark studies demonstrated that association mapping across approximately 500 barley cultivars could resolve loci for morphological traits to the level of candidate polymorphisms, including variation linked to the ANT2 pigmentation gene [23]. GWAS was subsequently applied to complex agronomic and grain-quality traits, identifying multiple loci for heading time, plant height, thousand-kernel weight, starch content, and protein content in globally diverse spring barley [13]. Association studies also clarified the genetic basis of major adaptive characteristics: natural allelic variation in HvCEN was shown to contribute to spring growth habit and the expansion of cultivated barley into contrasting environments [24], while loci associated with winter hardiness [25] and salinity tolerances [26] were identified in breeding and diversity panels. Disease-resistance GWAS revealed genomic regions controlling Fusarium head blight severity and deoxynivalenol accumulation in contemporary breeding germplasm [27], demonstrating the applicability of association mapping to quantitatively inherited resistance. Large-scale analyses of 1862 breeding lines evaluated across 97 field trials further dissected the genetic architecture of malting quality and showed that many favorable loci were specific to individual breeding programs [28]. The development of the wild-barley nested association mapping population HEB-25 expanded the accessible allelic diversity and enabled detailed analysis of flowering time and stress-adaptive traits [29,30,31]. Exome sequencing of 267 georeferenced barley landraces and wild accessions revealed strong geographical structuring of genetic variation and extensive variant-by-environment associations, particularly for flowering time and plant height, emphasizing the importance of locally adapted haplotypes [32]. More recently, exome sequencing and multi-environment field trials have enabled direct examination of genotype-by-environment interactions and the genetic basis of local adaptation [33], while integrating GWAS with genomic prediction has facilitated the simultaneous evaluation of yield, grain quality, and disease resistance in operational breeding populations [34]. Collectively, these advances have transformed barley GWAS from a locus-discovery approach into an integrated breeding tool for identifying adaptive alleles, prioritizing candidate genes, exploiting wild and cultivated diversity, and developing diagnostic markers for crop improvement.
Barley GWAS research in Kazakhstan has developed rapidly during the past decade. Early studies focused on the association mapping of stem rust resistance [35] and agronomic traits [8,9] using 9K SNP arrays. Subsequent research expanded to grain quality [36,37,38], powdery mildew resistance [39], flowering time, plant architecture [40], yield-related traits [38], and adult-plant resistance to stem rust [41]. More recent studies have incorporated high-density SNP genotyping, multiple GWAS models, linkage disequilibrium-based QTL delineation, haplotype analysis, development of Kompetitive Allele-Specific PCR (KASP) assays, and transcriptomic data to improve candidate-gene prioritization [41].
KASP is a fluorescence-based genotyping method initially developed by KBioscience [42]. KASP is a technology now belonging to LGC Genomics (www.biosearchtech.com). The assay uses two competing allele-specific forward primers, each with a different fluorescent tail, along with a single common reverse primer. During PCR amplification, the primer matching the target allele is preferentially extended, producing an allele-specific fluorescent signal that allows samples to be classified as homozygous for either allele or heterozygous. KASP is widely used in plant genetics and breeding [43,44,45] because it is accurate, relatively inexpensive, scalable, and suitable for screening large numbers of samples without requiring specialized sequencing equipment [42]. Once a SNP associated with a target trait has been validated, it can be converted into a KASP assay and applied in marker-assisted selection to identify favorable alleles at early breeding stages [42]. The staged hierarchy of evidence used in this review, from initial GWAS discovery to demonstrated breeding implementation, is summarized in Figure 1.
Figure 1.
Staged hierarchy of evidence for translating barley GWAS associations into breeding applications: initial GWAS discovery, within-study recurrence, replication in separate germplasm, functional evidence, diagnostic-marker development and validation, and demonstrated breeding implementation.
This review synthesizes findings from barley GWAS focused on Kazakhstan. It aims to summarize the genetic resources, phenotypic traits, genotyping platforms, analytical methods, major marker–trait associations and QTLs, candidate genes, and breeding implications reported across these studies. In addition, the review identifies current research gaps and priorities for the future application of genomic approaches in developing productive, resilient, and locally adapted barley cultivars for Kazakhstan’s diverse agroecological environments.
Throughout this review, the breeding relevance of markers was interpreted according to a staged hierarchy of evidence: (i) initial GWAS discovery; (ii) recurrence across environments, years, or analytical models within the discovery material; (iii) replication in a separate germplasm panel; (iv) functional evidence supporting the candidate variant or gene; (v) development and validation of a diagnostic or predictive marker assay; and (vi) demonstrated implementation in a breeding program. Statistical significance at the discovery stage alone was not considered sufficient evidence of marker stability, diagnostic value, transferability to elite germplasm, or breeding utility.
The scope of this review is limited to marker–trait associations identified through barley GWAS relevant to Kazakhstan and to KASP assays subsequently developed from these associations. Linkage-mapping-derived markers, genomic-selection models without GWAS evidence, gene-specific or functional markers developed independently of GWAS, and markers developed outside Kazakhstan without evaluation in Kazakh germplasm were excluded from the quantitative synthesis. Genomic selection, pangenome-assisted marker development, and functional-marker development are discussed only as complementary future strategies.
2. Materials and Methods
A structured literature search was conducted using Scopus, the Web of Science Core Collection, PubMed, and Google Scholar on 20 July 2026, and was updated on 7 August 2026. ResearchGate was used only as a supplementary source for locating full texts and citation leads and was not treated as a bibliographic database. The search combined terms describing the crop, analytical approach, marker technology, and geographical scope, including “barley”, “Hordeum vulgare”, “genome-wide association study”, “GWAS”, “association mapping”, “QTL”, “SNP”, “KASP”, “Kazakhstan”, and “Kazakh germplasm”. The complete database-specific search strings, search dates, and numbers of retrieved records are provided in Table S1. Two authors [Y.G. and S.A. (Shyryn Almerekova)] independently screened the titles and abstracts and subsequently assessed the full texts against the predefined eligibility criteria. Disagreements were resolved through discussion and consensus, with consultation of a third author (Y.T.) when necessary.
Records were exported to MS Excel and deduplicated first by DOI, then by title, publication year, and first author. Studies were eligible when they: (i) were full-length peer-reviewed articles; (ii) investigated barley; (iii) included field evaluation in Kazakhstan and/or a substantial component of Kazakh barley germplasm relevant to breeding in Kazakhstan; and (iv) reported GWAS-derived marker–trait associations, QTLs, or the development or validation of KASP assays derived from such associations. Linkage-mapping studies, genomic selection studies without GWAS results, studies of other crop species, conference abstracts, unpublished materials, and articles without Kazakhstan-related data were excluded. The updated search did not identify additional eligible studies conducted by a fully independent research group.
The search retrieved 10 records from Scopus, 10 from the Web of Science Core Collection, 10 from PubMed, 14 from Google Scholar, and 14 from ResearchGate (Table S1). After removal of duplicates, 14 full-text articles were assessed, and 11 articles were included: nine GWAS articles and two articles reporting the development or validation of KASP assays (Table S2). Three full-text articles were excluded: one because it focused on SNP-based population structure and genetic diversity rather than GWAS, and two because they presented site-specific analyses based on germplasm and phenotypic datasets substantially overlapping with those examined in broader publications; their inclusion in the quantitative synthesis could therefore have introduced non-independent evidence and double counting of marker–trait associations. The selection process and reasons for full-text exclusion are summarized in the flow diagram presented in Figure S1.
Trait names and abbreviations were harmonized across studies to account for differences in terminology and reporting conventions. The standardized traits were heading-to-maturity time (HMT), heading time (HT), vegetation period (VP), plant height (PH), peduncle length (PL), productive tillering (PT), number of kernels per spike (NKS), number of productive spikes (NPS), spike density (SD) or rachis internode length (RIL), spike length (SL), thousand-kernel weight (TKW), weight of kernels per plant (WKP), weight of kernels per spike (WKS), grain yield per square meter (YM2), extractivity (EX), grain cellulose content (GCC), grain lipid content (GLC), grain protein content (GPC), grain starch content (GSC), grain test weight per liter (TWL), powdery mildew (PM) resistance, and stem rust resistance (SR). The principal terminological conversions included standardizing seed maturation time as heading-to-maturity time (HMT), thousand-grain weight as thousand-kernel weight (TKW), and yield per square meter as YM2. Measurements that were related but not directly equivalent, including spike density (SD) and rachis internode length (RIL), were retained as separate traits.
For the quantitative synthesis, the unit of extraction was a reported SNP–trait or QTL–trait entry rather than a unique genomic or causal locus. Each entry listed in the association or QTL tables of the source publications was extracted once and retained at the reporting level used in the original study. For each entry, we recorded the original trait designation, standardized trait, original study terminology, original locus identifier, lead SNP, chromosome, original physical position and reference assembly, p-value, source publication, experimental environment and year, GWAS model, and evidence basis (Table S3).
The resulting dataset comprised 459 reported entries across 22 traits, corresponding to 350 distinct lead-marker identifiers and 458 distinct exact SNP–trait combinations. The same SNP associated with different traits was retained as a separate entry for each trait. When the same SNP–trait combination was reported in different studies, each occurrence was retained as a separate study-specific entry. Specifically, the association between 12_31509 and grain protein content was reported in two studies and was therefore represented by two entries. No exact SNP–trait duplicates occurred within the same publication.
No cross-study LD-based or distance-based merging of neighboring markers was performed because the reviewed studies differed in germplasm composition, marker platforms and densities, mapping resolution, analytical models, and reference-genome versions. Consequently, the total of 459 represents reported association/QTL entries and should not be interpreted as the number of unique genomic or causal loci.
The prioritized associations were selected from the complete dataset using two mandatory criteria: statistical significance and stability across experimental conditions. First, an association was required to exceed the study-specific Bonferroni-corrected significance threshold reported in the original publication. Because the reviewed studies differed in the number of SNPs retained after quality control, the corresponding Bonferroni thresholds were taken directly from each source study rather than replaced with a single universal p-value threshold. Second, the same lead SNP–trait association was required to be detected in at least two distinct environments, years, or environment–year combinations, or to have been explicitly classified as stable across environments or years according to the criteria of the original publication. Among the associations that met both requirements, priority was given to those with the lowest reported p-values for each trait. When the same SNP met the selection criteria for more than one trait, each qualifying SNP–trait association was retained.
Reported phenotypic variance explained and allelic effects were included to characterize the magnitude and direction of individual associations but were not used as mandatory selection thresholds. Associations detected by multiple GWAS models were not assigned additional numerical weight, and validation in a separate germplasm panel, minor allele frequency, and local linkage disequilibrium were not used as selection criteria because these characteristics were not reported consistently across all source studies.
3. Results and Discussion
3.1. Overview of Barley GWAS Research in Kazakhstan
Barley GWAS research in Kazakhstan has developed considerably over the past decade. Early studies were based on relatively small germplasm collections, low- to medium-density SNP arrays, and conventional statistical models. More recent works have used larger and more diverse populations, high-density genotyping, multi-environment phenotyping, multiple GWAS models, haplotype analysis, and transcriptomic data [38,40,41]. This progression reflects a broader shift from simply detecting significant MTAs toward identifying biologically meaningful QTLs and evaluating their value for breeding.
The first Kazakhstan-focused barley GWAS [35] investigated SR in a collection of 92 commercial cultivars and breeding lines. Using the 9K SNP array, the study identified a significant resistance-associated region on chromosome 6H. At the same time, it showed that small population size and strong population structure can reduce statistical power and lead to overcorrection in mixed-model analyses. Subsequent studies expanded the research to agronomic adaptation and grain productivity. Two major investigations evaluated two-rowed [8] and six-rowed [9] spring barley at six breeding locations across Kazakhstan over three years. These studies provided the first broad multi-environment assessment of local and introduced barley germplasm and identified stable associations for flowering time, maturity, plant architecture, spike characteristics, grain weight, and yield.
From 2022 onward, GWAS research in Kazakhstan increasingly focused on grain-quality traits, including GPC, GSC, GCC, GLC, EX, and TWL. An important methodological advance was the conversion of significant grain-quality-associated SNPs into KASP assays, two of which were successfully validated in a separate germplasm panel of barley breeding lines [36,37]. The most recent studies [38,40,41] have used the 50K SNP array and more than 26,000–31,000 polymorphic markers. They have also incorporated best linear unbiased prediction (BLUP) values, multi-locus GWAS models, model consensus, favorable allele combinations, haplotypes, and gene-expression information. As a result, Kazakhstan barley GWAS has moved beyond the identification of isolated SNPs toward a more integrated understanding of QTLs, candidate genes, and breeding-relevant alleles.
For clarity, the evidence synthesis is organized into four biological themes: adaptation and agronomic traits, fungal disease resistance, grain yield and its components, and grain quality. These theme-specific sections are preceded by a cross-study summary of broad-sense heritability and followed by integrative sections addressing cross-trait co-localization, KASP assay development, and remaining research gaps. This organization provides a transition from a chronological overview of barley GWAS research in Kazakhstan to a trait-based and, subsequently, cross-trait synthesis of the available evidence.
3.2. Heritability Estimation
Broad-sense heritability estimates were reported for 18 traits across three barley GWAS conducted in Kazakhstan, ranging from 4.4% for vegetation period to 52.0% for grain cellulose content (Table 1).
Table 1.
Broad-sense heritability estimates for traits reported in the reviewed barley GWAS relevant to Kazakhstan.
Five traits showed estimates exceeding 30%: GCC (52.0%), SD (44.8%), SL (36.5%), TWL (34.0%), and PL (31.1%). The remaining 13 traits had heritability estimates ranging from 4.4% to 27.0%. Phenological traits exhibited the lowest values, with estimates of 4.4% for vegetation period, 5.5% for HT, and 5.9% for HMT. Among yield components, heritability ranged from 8.2% for YM2 to 44.8% for SD. Grain-quality traits displayed the widest range, from 5.0% for GSC to 52.0% for GCC. Numerical heritability estimates were not reported in the reviewed studies of grain quality evaluated across three environments, PM, or SR.
Broad-sense heritability is specific to the population, environments, experimental design, phenotyping precision, and variance-partitioning model used in each study. The reported estimates may therefore be influenced by population composition and structure, the number and range of test environments and years, genotype-by-environment interaction, and experimental errors. Consequently, the values summarized in Table 1 should not be interpreted as intrinsic genetic parameters of Kazakh barley germplasm or compared directly across traits and studies. They are presented only as study-specific reference metrics that describe the proportion of phenotypic variance attributable to genetic differences under the conditions of the corresponding original experiment.
3.3. GWAS of Adaptation and Agronomic Traits
Early barley GWAS research in Kazakhstan focused on how two-rowed [8] and six-rowed [9] spring barley performed across the country’s contrasting growing regions. One of the first large multi-environment studies evaluated 366 two-rowed accessions, including 94 cultivars and breeding lines from Kazakhstan and 272 accessions from the United States [8]. The material was tested from 2009 to 2011 at six locations representing western (Aktobe Agricultural Experimental Station), northern (Karabalyk Agricultural Experimental Station), central (Karaganda Agricultural Experimental Station), southern (I. Zhakhaev Kazakh Research Institute of Rice Growing and Krasnovodopad Agricultural Experimental Station), and southeastern (Kazakh Research Institute of Agriculture and Plant Growing) Kazakhstan. Ten agronomic traits were measured, including HT, HMT, PH, PL, PT, SL, NKS, RIL, TKW, and YM2. This wide-ranging design was particularly useful because barley-growing regions in Kazakhstan differ greatly in rainfall, temperature, soil conditions, and access to irrigation. As a result, the study was able to assess not only genetic variation among accessions, but also how well they adapted to different environments. On average, the Kazakh material did not significantly outperform the US accessions across the six locations, and 24 US lines produced higher mean yields than the local standard cultivar Ubagan. Population analysis also showed that Kazakh germplasm was genetically closer to US material, especially accessions from Montana and Washington, than to several other international barley groups. The source study did not provide pedigree records demonstrating that accessions from Montana or Washington had been used directly as parents in breeding programs in Kazakhstan [6,9]. The authors proposed two possible historical explanations: the use of Russian-origin germplasm in both breeding networks and the use of genetic resources collected by N. I. Vavilov and H. Harlan to develop material adapted to broadly similar latitudes. Thus, the observed genetic proximity is consistent with partially shared historical germplasm sources and adaptation to comparable environments, but direct pedigree relationships remain unconfirmed. The GWAS identified 91 MTAs detected in at least two environments, including several potentially novel associations for HT, NKS, and TKW. Some heading-time loci were also associated with spike traits, suggesting that genes involved in adaptation may influence yield indirectly through developmental timing and reproductive structure [8]. The geographical distribution of the experimental locations represented in the reviewed studies is summarized in Figure S2.
A related study [9] examined six-rowed spring barley, which is especially relevant to feed-oriented breeding because all three spikelets at each rachis node are fertile [46]. This morphology generally increases the number of kernels per spike. Although six-rowed material is commonly directed toward feed markets, where relatively high grain protein content may be desirable, protein concentration should not be attributed to row type alone because it is also influenced by end-use selection, genotype, environment, and grain yield. This usually results in more NKS and may also contribute to higher GPC [47]. The reviewed study did not provide sufficient evidence to separate these effects. The study included 275 accessions from six US breeding programs and nine accessions from Kazakhstan, tested at the same six locations between 2009 and 2011. Environmental effects were strong, and yield varied considerably among sites and years. Even so, the US six-rowed accessions had higher average yields than the local comparison group at all six locations. At the Karabalyk Agricultural Experimental Station in northern Kazakhstan, 28 US accessions outperformed the best local line, indicating that this material could be a useful source of alleles for feed barley improvement. The GWAS detected 47 stable MTAs for yield, PT, NKS, SL, RIL, PL, HT, HMT, and TKW. Twenty-five of these associations were considered putatively novel. These results showed that six-rowed germplasm could broaden the genetic base for barley breeding in Kazakhstan. However, the local six-rowed group was very small, and the detected QTLs should not be transferred directly into two-rowed breeding programs without validation, since row type strongly affects spike structure, kernel number, kernel weight, and grain quality [9].
Flowering time and maturity were consistently identified as key components of adaptation [48]. These traits determine when reproductive development and grain filling take place and therefore influence the plant’s exposure to terminal drought, heat, and other environmental stresses [40]. The early two-rowed and six-rowed studies identified several stable associations for heading and maturity [8,9], and further work [40] was extended in 2024 with a high-density GWAS of 273 two-rowed spring barley accessions evaluated over three years in northern and southeastern Kazakhstan. Six traits were studied: HT, HMT, VP, PH, PL, and YM2. The analysis identified 95 QTLs, of which 58 were located near previously reported QTLs [29,49,50] or candidate genes and 37 were considered putatively novel [40]. Thirteen novel QTLs formed three genomic hotspots on chromosomes 1H, 3H, and 6H. Because these regions were associated with several traits, they represent candidate multi-trait regions consistent with either pleiotropy or tight linkage among trait-specific loci. These findings demonstrate statistical co-localization among signals for flowering time, plant height, peduncle development, and yield but do not establish shared causal control. However, the value of a flowering allele depends on the target environment. Earlier heading may help plants escape terminal drought in southeastern Kazakhstan, while a longer growing season may be more beneficial in cooler northern regions. For this reason, flowering alleles should be selected according to regional adaptation rather than simply classified as early or late [40].
Several adaptation-related associations were positionally connected to known developmental genes. In the 2024 study [40], Ppd-H1 (HvPRR37) coincided with QTL_YM2_03, Ppd-H2 (HvFT3) with QTL_HMT_04 and QTL_VP_04, Vrn-H1 (HvBM5A) was located near QTL_PH_05, QTL_PL_11, and QTL_YM2_08, and Vrn-H3 (HvFT1) was associated with QTL_HT_18. HvCEN was identified as a candidate gene for QTL_PL_04. Earlier work [8] also located 11_21303 near HvCO16/HvPRR59/HvPRR73, 12_31509 near HvCO5/HvPRR1/HvTOC1, and 11_10935 near HvLUX. These positional correspondences support the biological plausibility of the associations but do not constitute functional confirmation.
The 1H hotspot contained QTL_YM2_01, which was detected in five environments; its G allele increased grain yield by an average of 26.29 g/m2 in the studied panel [40]. Because this effect has not yet been validated across independent breeding populations in Kazakhstan, the allele should be regarded as a promising candidate rather than a universally advantageous or region-specific diagnostic allele.
Plant architecture was also closely linked to both adaptation and productivity. The main traits studied included PH, PL, PT, SL, SD, and RIL. Their expression depended on genotype, environment, and genotype-by-environment interaction. Moderate reductions in plant height may improve lodging resistance, but excessive dwarfing can reduce biomass, peduncle elongation, or spike emergence. Similarly, longer spikes may support more spikelets, whereas changes in SD can influence kernel development and the microclimate around the spike. These relationships are also shaped by row type. The QTL hotspots identified in 2024 [40] provided further evidence that flowering, plant architecture, and yield share parts of their genetic control. This can be beneficial when one allele improves several traits at once, but it can also create trade-offs. For example, a locus that promotes earlier flowering and shorter plants may improve drought escape and lodging resistance, yet reduce the duration of grain filling under favorable conditions [40].
Overall, these studies show that Kazakhstan should not be treated as a single barley-growing environment. Strong genotype-by-environment interactions were observed across northern, central, western, southern, and southeastern regions. The early two-rowed and six-rowed studies were valuable because they tested germplasm across six locations and three years, while the later high-density work provided narrower QTL intervals and more clearly resolved multi-trait association hotspots. Together, they show how barley GWAS research in Kazakhstan has moved from broad germplasm evaluation toward a more detailed understanding of how flowering, plant architecture, and regional adaptation contribute to productivity. Foreign germplasm, particularly from the United States, has provided useful sources of variation, but these accessions are best viewed as donors of favorable alleles to be combined with locally adapted Kazakhstani material.
3.4. GWAS of Fungal Disease Resistance
GWAS research on fungal disease resistance in Kazakhstan has mainly focused on powdery mildew (PM) [39] and stem rust (SR) [35,41]. PM, caused by Blumeria graminis f. sp. hordei [51], is an important disease of barley and has become increasingly relevant in southern and southeastern Kazakhstan. Genievskaya and coauthors [39] evaluated 406 spring barley accessions from Kazakhstan, the United States, Europe, and Africa over three years in southeastern Kazakhstan using the 9K SNP array. Disease development varied greatly across seasons, and no symptoms were observed in 2021 due to unfavorable weather conditions for the pathogen. Seven QTLs were identified on chromosomes 4H, 5H, and 7H (FDR p-values < 0.05). Two overlapped previously reported [52,53] resistance regions, while five were considered putatively novel [39]. Haplotype analysis also identified three haplotypes associated with complete resistance and one associated with high disease severity. These haplotypes may be more useful for breeding than individual SNPs because they represent favorable combinations of linked alleles, although they still need to be validated in other environments and against different pathogen populations [39].
SR, caused by Puccinia graminis f. sp. tritici (Pgt), is a serious fungal disease of barley and has historically posed a major threat to barley production worldwide [54]. It remains a particularly significant risk in many of the major barley-growing regions [41]. Resistance to SR was first investigated in southern Kazakhstan in 2016 using 92 local spring barley cultivars and breeding lines genotyped with the 9K SNP array [35]. In the GLM analysis, two SNPs at the same position on chromosome 6H remained significant after multiple-testing correction, whereas the MLM detected no significant associations. This difference was likely due to overcorrection for population structure and kinship in the relatively small and genetically structured panel.
A more detailed study published in 2025 evaluated 273 diverse two-rowed accessions in two Kazakhstan environments (southern and southeastern) using the 50K SNP array and five GWAS models [41]. This study identified 204 MTAs, of which 96 were supported by more than one model and grouped into 19 model-stable QTLs. Six QTLs overlapped known resistance genes or previously reported regions [35,55,56], including the Rpg1 and Rpg6 genes, while a novel major-effect QTL, Q_rpg_5H.1, was detected on chromosome 5H [41]. Gene expression data from 16 barley tissues and developmental stages were then used to prioritize candidate genes, including WRKY transcription factors and pathogenesis-related protein 5 genes, within the 5H region [41].
Taken together, the studies published in 2016, 2023, and 2025 show how barley disease-resistance GWAS in Kazakhstan have progressed through the use of larger populations, denser marker sets, more robust statistical models, and improved candidate-gene analysis. For breeding, the most valuable loci will be those that show consistent effects across environments or analytical models without reducing agronomic performance. PM resistance haplotypes on chromosomes 4H, 5H, and 7H could be combined through marker-assisted pyramiding, while known SR genes [35], such as Rpg1 and Rpg6, could be combined with newly identified adult-plant resistance loci [41]. Because adult-plant resistance is often partial, polygenic, and potentially more durable than resistance controlled by a single race-specific gene, the most promising SNPs should be converted into low-cost KASP assays and validated in elite breeding material alongside yield, maturity, and grain-quality traits.
3.5. GWAS of Grain Yield and Yield-Related Traits
Grain yield in barley is a highly complex and environmentally responsive trait because it results from the combined effects of flowering time, plant architecture, productive tillering, spike morphology, kernel number, kernel weight, and the plant’s ability to tolerate drought, heat, and disease [57,58]. The first Kazakhstan studies of two-rowed [8] and six-rowed [9] barley showed that yield and its components varied considerably across locations and years, confirming the strong influence of genotype-by-environment interaction. In the two-rowed panel, stable MTAs were detected for NKS and TKW, while the six-rowed study identified loci associated with YM2, PT, NKS, SL, RIL, and TKW. These early studies were particularly valuable because they tested diverse germplasm across six locations in Kazakhstan over three years, although the relatively low-density 9K SNP platform limited mapping resolution and often yielded broad QTL regions [8,9].
Later work provided a more integrated view of yield formation by showing that yield-related loci frequently overlap with regions controlling flowering and plant architecture [40]. The QTL hotspots were identified on chromosomes 1H, 3H, and 6H, where the same genomic regions were associated with HT, HMT, VP, PH, PL, and YM2. This overlap identifies candidate multi-trait regions consistent with either pleiotropic effects or clusters of tightly linked trait-specific genes. Additional fine-mapping and multi-trait analyses are required to distinguish among these possibilities. Such regions may be valuable for breeding when a single favorable haplotype improves several traits simultaneously, but they may also introduce trade-offs. For example, an allele that promotes earlier flowering and shorter plants may improve drought escape and lodging resistance, yet reduce biomass accumulation or grain-filling duration under favorable conditions [40].
The most detailed study of yield-related traits in Kazakhstan, published in 2025 [38], evaluated 273 two-rowed spring barley accessions over three seasons (2020, 2021, and 2022) in southeastern Kazakhstan and analyzed seven traits: NPS, NKS, SL, SD, WKS, WKP, and TKW. Using 31,834 high-quality SNPs from the 50K array, the study identified 346 QTLs, including 93 stable loci detected across environments or supported by BLUP analysis, and 5 QTLs consistently detected in all environments and in the combined dataset. Major-effect QTLs were found for SL and TKW, and the novel locus Hv_TKW_3H.5 showed a strong relationship with WKP. The study also prioritized 134 candidate genes involved in stress response, transport, metabolism, growth, and seed development by integrating GWAS with expression data. Importantly, the combined presence of favorable alleles at several moderate- and major-effect QTLs had a significant effect on WKS, showing that yield improvement is more likely to result from the accumulation of beneficial alleles than from selection for a single marker [38].
Overall, these studies confirm that marker-assisted selection may be effective for stable QTLs controlling individual yield components, especially SL or TKW, but WKP is too polygenic and environment-dependent to be improved through a few markers alone. For this reason, the most promising strategy is to combine validated GWAS loci with multi-environment testing and genomic selection, which can capture the effects of many small-effect alleles and help identify genotypes with stable performance across Kazakhstan’s contrasting production regions.
3.6. GWAS of Grain-Quality Traits
Barley grain quality depends largely on its intended use; feed barley often benefits from higher protein content [59], whereas malting barley generally requires moderate protein and high starch [60]. In Kazakhstan, the first major GWAS of grain-quality traits was published in 2022 and evaluated 658 two-rowed and six-rowed accessions from Kazakhstan and the United States for GPC, GSC, EX, and TWL [36]. The material was grown at three locations (Karabalyk Agricultural Experimental Station, Karaganda Agricultural Experimental Station, and I. Zhakhaev Kazakh Research Institute of Rice Growing) in 2010 and 2011, and was genotyped using the 9K SNP array. The study identified 30 QTLs, of which 25 were located near previously reported genes [61] or quality-related regions [13,62,63,64,65] and five were considered putatively novel. An important practical outcome was the conversion of five significant SNPs into KASP assays, two of which were successfully validated in a separate germplasm panel of breeding lines and showed associations with protein, starch, and extractivity, representing a clear step from GWAS discovery toward routine breeding application [36].
The next study, published in 2023 [37], examined 406 two-rowed spring barley accessions over two seasons (2020 and 2021) in southeastern Kazakhstan and focused on GPC, GSC, GCC, GLC, and TWL. Environmental conditions strongly influenced all traits (p < 2 × 10⁻¹⁶), with heat and drought during grain filling generally associated with higher protein and lower starch content. The GWAS identified 26 QTLs, including nine putatively novel loci, and several candidate genes were linked to flowering time and dehydration response, suggesting that some grain-quality effects may arise indirectly through differences in developmental timing and stress exposure [37].
Although the two studies differed in population size, row type, testing environments, and trait coverage, they were complementary. Together, they showed that barley quality is controlled by many loci and is strongly shaped by the environment. From a breeding perspective, favorable alleles should be selected according to the intended end use, since higher protein may be desirable for feed barley but less suitable for malting, where starch and extractivity are more important. The validated KASP markers provide useful candidates for breeding, but they should be tested in additional populations and environments, and marker-assisted selection should be combined with direct grain-quality assessment and, where possible, multi-trait genomic prediction.
3.7. Cross-Trait Integration of Kazakhstan Barley GWAS Findings
The chromosome maps combine SNP markers reported in previously published barley GWAS relevant to Kazakhstan and show their distribution across all seven barley chromosomes (Figure 2, Figure 3, Figure 4 and Figure 5). Several chromosomal regions contain markers associated with different trait groups. These patterns should be regarded as hypothesis-generating physical co-localizations rather than evidence of confirmed pleiotropy. A shared marker or a cluster of nearby markers associated with different traits may be consistent with a pleiotropic causal variant or with tightly linked trait-specific variants. However, such patterns may also arise from LD, correlated phenotypes, population structure, shared environmental effects, overlapping germplasm, or differences among GWAS models and datasets. We therefore distinguish physical co-localization from statistical multi-trait association and experimentally confirmed biological pleiotropy. None of the co-localization patterns summarized in this review is considered proof of causal pleiotropy.
Figure 2.
Physical maps of barley chromosomes 1H and 2H showing the positions of agronomic trait-associated SNP markers and known barley genes. Dashed boxes indicate chromosome segments presented at higher resolution in the corresponding close-up panels. Colors denote trait groups: blue—phenological traits; yellow—plant morphological traits; black—yield components; green—grain-quality traits; pink—disease-resistance traits; and red—known barley genes. Physical positions are given in base pairs according to Morex v3 [66]. Markers with unavailable positions in the Morex v3 reference genome were excluded from the map; *—close-up view of chromosome segment.
Figure 3.
Physical maps of barley chromosomes 3H and 4H showing the positions of agronomic trait-associated SNP markers and known barley genes. Dashed boxes indicate chromosome segments presented at higher resolution in the corresponding close-up panels. Colors denote trait groups: blue—phenological traits; yellow—plant morphological traits; black—yield components; green—grain-quality traits; pink—disease-resistance traits; and red—known barley genes. Physical positions are given in base pairs according to Morex v3 [66]. Markers with unavailable positions in the Morex v3 reference genome were excluded from the map; *—close-up view of chromosome segment.
Figure 4.
Physical maps of barley chromosomes 5H and 6H showing the positions of agronomic trait-associated SNP markers and known barley genes. Dashed boxes indicate chromosome segments presented at higher resolution in the corresponding close-up panels. Colors denote trait groups: blue—phenological traits; yellow—plant morphological traits; black—yield components; green—grain-quality traits; pink—disease-resistance traits; and red—known barley genes. Physical positions are given in base pairs according to Morex v3 [66]. Markers with unavailable positions in the Morex v3 reference genome were excluded from the map; *—close-up view of chromosome segment.
Figure 5.
Physical map of the barley 7H chromosome showing the positions of agronomic trait-associated SNP markers and known barley genes. Dashed boxes indicate chromosome segments presented at higher resolution in the corresponding close-up panels. Colors denote trait groups: blue—phenological traits; yellow—plant morphological traits; black—yield components; green—grain-quality traits; pink—disease-resistance traits; and red—known barley genes. Physical positions are given in base pairs according to Morex v3 [66]. Markers with unavailable positions in the Morex v3 reference genome were excluded from the map; *—close-up view of chromosome upper segment; **—close-up view of chromosome lower segment.
Cross-trait clustering is evident across all seven barley chromosomes, with markers representing phenological, morphological, yield-related, grain-quality, and disease-resistance traits frequently co-localized within enlarged chromosomal regions. On chromosomes 1H and 2H, these markers form prominent clusters within the same genomic intervals (Figure 2). Comparable patterns occur on 3H and 4H, where densely grouped markers are also located near known barley genes (Figure 3). Marker-rich regions are likewise present on 5H and 6H (Figure 4), while both enlarged segments of 7H contain multiple trait-associated markers, including disease-resistance loci positioned near the known stem rust resistance gene Rpg1 (Figure 5).
These overlapping regions are particularly important for breeding because selection for one trait group may also affect other agronomic or quality characteristics. In some cases, favorable alleles from different trait groups may occur within the same haplotype and could be selected together. In other cases, close linkage may create undesirable trade-offs. Overall, the integrated maps provide a useful framework for identifying genomic regions to prioritize for haplotype analysis, fine-mapping, multi-trait GWAS, and KASP marker validation. However, physical co-localization alone does not establish pleiotropy. Fine mapping, conditional and multi-trait analyses, haplotype evaluation, and functional validation are required to distinguish shared causal effects from tight linkage, LD, and correlations among traits or environments.
Distinguishing pleiotropy from tight linkage requires a staged analytical and experimental strategy. Haplotype analysis can first determine whether associations with different traits are consistently carried by the same local haplotype or by distinct combinations of neighboring alleles. Fine mapping in larger, denser populations, followed by analysis of recombination events in segregating populations, can then test whether the trait effects remain inseparable or can be assigned to distinct linked intervals. If recombinants separate the effects on different traits, tight linkage is the more likely explanation; persistence of multiple trait effects after recombination-based resolution would provide stronger support for pleiotropy. Resequencing and pangenome-based variant dissection can further reveal structural variants, presence–absence variation, and locally adapted haplotypes that are not represented by fixed SNP arrays. Finally, functional evidence from gene expression, mutant, gene-editing, or transgenic analyses is required to establish whether a single causal gene or variant directly affects multiple traits. This distinction is important for breeding because unfavorable linkages may potentially be broken through recombination, whereas true pleiotropic trade-offs may require environment-specific allele deployment or multi-trait selection indices.
Across the reviewed barley GWAS conducted in Kazakhstan, 459 reported association/QTL entries were extracted for 22 traits and grouped into five major categories (Figure 6; Table S3). These entries represent study-reported SNP–trait or QTL–trait records rather than 459 unique genomic loci. Yield components accounted for the largest share, with 180 entries (39.2%), followed by grain-quality traits with 90 (19.6%), phenological traits with 87 (19.0%), plant morphological traits with 59 (12.9%), and disease resistance with 43 (9.4%).
Figure 6.
Distribution of reported barley GWAS association/QTL entries included in the quantitative synthesis. (A) Number and proportion of entries within the five major trait groups. (B) Number of entries reported for individual traits. A total of 459 association/QTL entries were extracted across 22 traits. These entries represent records reported in the source publications and not necessarily unique genomic loci. HMT, heading-to-maturity time; HT, heading time; VP, vegetation period; PH, plant height; PL, peduncle length; PT, productive tillering; NKS, number of kernels per spike; NPS, number of productive spikes; SD, spike density; SL, spike length; TKW, thousand-kernel weight; WKP, weight of kernels per plant; WKS, weight of kernels per spike; YM2, grain yield per square meter; EX, extractivity; GCC, grain cellulose content; GLC, grain lipid content; GPC, grain protein content; GSC, grain starch content; TWL, grain test weight per liter; PM, powdery mildew resistance; and SR, stem rust resistance.
Application of the predefined selection criteria yielded 55 prioritized SNP–trait associations, representing 33 distinct SNPs and 21 phenological, agronomic, grain-quality, and disease-resistance traits across all seven barley chromosomes (Table 2). All selected associations exceeded the study-specific Bonferroni significance threshold and were repeatedly detected in at least two distinct environments and/or years. Thus, Table 2 represents a systematically selected subset of statistically significant and environmentally recurrent associations rather than an illustrative or subjectively ranked collection of markers.
Table 2.
Prioritized stable and Bonferroni-significant SNP–trait associations reported in barley GWAS conducted in Kazakhstan.
The p-values ranged from 9.63 × 10⁻¹⁹ to 7.64 × 10−05, while the proportion of explained phenotypic variance ranged from 1.10% to 85.30%. Six SNPs were associated with more than one trait, whereas 27 SNPs were associated with a single trait. Marker 12_31509 on chromosome 6H was associated with nine traits: EX, GPC, GSC, HMT, HT, PH, PL, TKW, and YM2. The association of 12_31509 with these traits represents a notable multi-trait association pattern consistent with pleiotropy or tight linkage, but it does not distinguish between these mechanisms. Markers 11_10935 and 11_21505 on chromosome 3H were associated with six and five traits, respectively, while 11_20971, 11_21103, and 12_30026 were associated with three, three, and two traits, respectively. The highest R2 was recorded for PM resistance at 12_20274 on 4H (85.30%), followed by stem rust resistance at JHI-Hv50k-2016-435161 on 7H (30.10%). Among agronomic traits, the highest R2 values were detected for PH (16.23%), HMT (12.41%), SD (12.08%), TKW (11.92%), YM2 (11.11%), and SL (11.10%). Collectively, these 33 SNPs represent associations that meet study-specific Bonferroni significance and are repeatedly detected across environments and/or years. They therefore constitute prioritized candidates for subsequent separate validation rather than markers already demonstrated to be diagnostic or directly applicable in breeding.
Collectively, barley GWAS relevant to Kazakhstan have combined diverse germplasm with multi-environment phenotyping and genome-wide SNP genotyping. The accumulated evidence spans initial association discovery, identification of stable or recurrent associations, candidate-gene prioritization, KASP assay development, and preliminary validation in separate germplasm panels. These stages are summarized within the evidence hierarchy presented in Figure 1.
The largest group comprised 180 reported entries for yield components, including NKS, NPS, SD, SL, TKW, WKP, WKS, and YM2. In addition, 87 entries were associated with phenological traits, 59 with plant morphology, 90 with grain-quality characteristics, and 43 with resistance to SR and PM (Table S3). The major stem rust resistance regions identified in the reviewed studies were also discussed in relation to the known Rpg1 and Rpg6 resistance genes, whereas putatively novel multi-trait QTL hotspots for adaptation-related traits were reported on chromosomes 1H, 3H, and 6H. Integrating GWAS results with haplotype analysis and transcriptomic data facilitated the prioritization of candidate genes involved in plant development, metabolism, and stress responses. These findings have also supported the development of KASP markers, providing practical tools to validate favorable alleles and accelerate marker-assisted barley breeding in Kazakhstan.
3.8. Development of KASP Marker Panels
A set of 27 unique KASP markers (Table 3) was developed from SNPs previously associated with phenological traits, plant morphology, yield components, grain yield, and grain quality in barley [8,9,36,43,44]. The markers covered all seven barley chromosomes: six were located on 1H, four on 2H, three on 3H, two on 4H, five on 5H, four on 6H, and three on 7H. Several markers were associated with multiple trait groups, representing multi-trait association patterns consistent with either pleiotropy or close linkage. The currently available evidence does not distinguish between these mechanisms. Among the most broadly associated markers, ipbb_hv_6 on chromosome 3H was linked to TKW, YM2, HT, HMT, PH, NKS, PL, GPC, GSC, and TWL. Similarly, ipbb_hv_7 on 6H was associated with HT, HMT, PH, PL, NKS, TKW, YM2, GPC, GSC, EX, and TWL. Other markers with broad effects included ipbb_hv_116 on 1H and ipbb_hv_128 on 7H, both of which were associated with phenological, plant morphological, and grain-quality traits. The broad association profiles of these markers also raise the possibility of breeding trade-offs. For example, ipbb_hv_6 and ipbb_hv_7 originate from SNPs associated with phenology, plant architecture, yield components, grain yield, and grain-quality traits. Selection for an allele considered favorable for one target trait could therefore alter other correlated characteristics, such as flowering time, plant height, grain yield, protein content, or starch content. However, the available studies do not establish that all of these relationships are caused by the same variant, and the direction and stability of the allelic effects may differ among germplasm panels and environments. These markers should therefore not be used for single-trait selection without first evaluating their local haplotypes and allele effects across all relevant traits. In breeding practice, potentially favorable multi-trait markers should be assessed using multi-trait selection indices and multi-environment trials so that gains in the target trait are not accompanied by undesirable changes in adaptation, productivity, or grain quality. For a specific breeding objective, the favorable allele should therefore be defined by its weighted net effect across all target traits in the intended population and environment rather than by its direction of effect on a single trait. For example, an allele increasing GPC should not be selected when the associated reduction in grain yield exceeds the acceptable threshold defined for the target breeding program.
Table 3.
KASP markers developed from SNPs associated with phenological traits, plant morphological traits, yield components, and grain quality traits in barley.
The technical performance and validation outcomes of the assays differed among the evaluated germplasm panels. In [43], 23 KASP assays were tested in 35 two-rowed promising lines, of which 21 were polymorphic; six assays reproduced their originally targeted associations, whereas nine showed significant associations with other agronomic traits. In [44], 21 assays were evaluated in 11 six-rowed breeding lines, of which seven were polymorphic; significant associations were detected between seven assays and six agronomic traits, although the small panel size means that these results should be regarded as preliminary. In [36], five grain-quality-associated SNPs were converted into KASP assays and evaluated in 34 two-rowed breeding lines. Three assays were polymorphic, and ipbb_hv_6 and ipbb_hv_128 reproduced their original grain-quality associations. Table 3 therefore distinguishes technical assay performance from replication of the originally reported marker–trait relationship.
Some markers showed more specific relationships: ipbb_hv_5, ipbb_hv_10, ipbb_hv_106, ipbb_hv_107, and ipbb_hv_111 were mainly associated with NKS; ipbb_hv_11 and ipbb_hv_113 with TKW; ipbb_hv_9 and ipbb_hv_132 with HT; ipbb_hv_108 with SL; and ipbb_hv_129 with NPS. The marker ipbb_hv_119 was specifically associated with GPC and TWL, whereas ipbb_hv_130 was associated with SL and PL.
Overall, this KASP panel offers a useful starting point for screening barley breeding material and selecting favorable alleles for adaptation, plant architecture, productivity, and grain quality. However, the effects of the multi-trait markers should be confirmed in separate populations and across contrasting environments before they are used routinely in breeding programs.
3.9. Research Gaps and Future Directions
The reviewed studies demonstrated that barley GWAS research in Kazakhstan has progressed from initial association discovery to an emerging molecular breeding framework. Across 22 traits, the quantitative synthesis comprised 459 reported GWAS association/QTL entries corresponding to 350 distinct lead-marker identifiers. These values describe the published evidence base and do not represent 459 or 350 separately resolved genomic loci. The dataset includes associations reported at different levels of evidence, including single-environment, environment-specific, model-specific, multi-model, multi-environment, and stable or recurrent associations, as documented in Table S3. These resources cover phenology, plant architecture, yield components, grain quality, and resistance to two fungal diseases. Nevertheless, most associations remain at the discovery stage, and only a subset of the KASP assays has been evaluated in separate germplasm panels. The principal challenge is therefore no longer generating additional lists of significant markers, but establishing which alleles are sufficiently reproducible, diagnostic, and agronomically favorable for routine selection.
An important limitation of the available evidence is its limited institutional independence. All nine included GWAS articles, and both KASP-related articles, involved an interconnected research network centered on the Institute of Plant Biology and Biotechnology, although several studies included collaborators from other breeding organizations in Kazakhstan and international institutions. Consequently, the publications share authors, germplasm, field sites, genotyping platforms, or analytical workflows and should not be interpreted as fully separate replications. This concentration reflects the still-limited number of barley GWAS programs in Kazakhstan but may increase the risk of selection, reporting, and methodological biases.
A first priority is to improve comparability among studies. Existing experiments differ in germplasm composition, marker platforms, field sites, statistical models, significance thresholds, and QTL definitions; some also share accessions, which prevents their results from being treated as independent evidence. Depositing genotype, phenotype, weather, and soil data in reusable formats would enable reanalysis, meta-QTL analysis, and, eventually, SNP-level meta-GWAS. The current synthesis also reveals trait gaps: direct GWAS of drought and heat tolerance, water- and nutrient-use efficiency, root architecture, lodging, major local diseases, and malting or feed quality remain limited or absent.
A second priority is to replace separate environment-by-environment scans with models that explicitly estimate QTL-by-environment and genome-by-environment interactions. Kazakhstan should be treated as a network of target environments rather than one breeding region. Environmental covariates such as temperature, precipitation, soil moisture, photoperiod, and heat or drought indices during critical developmental stages should be integrated with multi-environment phenotypes. Reaction-norm genomic models have shown that marker-by-environment terms can improve prediction across variable conditions [67]. Multi-trait GWAS and genomic prediction are also needed to distinguish true pleiotropy from tight linkage in the multi-trait hotspots identified on all seven chromosomes and to quantify trade-offs among flowering time, yield, disease resistance, and grain composition.
Genotyping must also move beyond the ascertainment limits of the 9K and 50K arrays. The 50K array substantially increased coverage but was developed mainly from European germplasm [68]. This creates ascertainment bias because variants that were common in the germplasm used to design the arrays are preferentially represented, whereas rare alleles, structural variants, and Kazakhstan-specific haplotypes are likely to be underrepresented or absent. Consequently, an apparent absence of genetic diversity or marker–trait associations in local germplasm may partly reflect inadequate marker coverage rather than a true absence of relevant variation. Resequencing Kazakhstan landraces, cultivars, breeding lines, and wild Hordeum accessions using low-coverage whole-genome sequencing or deeper sequencing of representative core accessions would enable the discovery of rare local alleles, structural variants, and haplotypes that are missing from fixed SNP arrays. These data could support imputation, pangenome construction, improved GWAS resolution, and the development of markers that more accurately represent the diversity used in Kazakhstan breeding programs. Global genebank genomics and barley pangenomes have demonstrated the scale of previously inaccessible diversity, including presence–absence variation and large inversions [69,70]. For example, more recently, the barley pangenome was expanded to 76 chromosome-scale assemblies and short-read data from 1315 genotypes, revealing extensive structural variation, gene presence–absence variation, copy-number differences, and previously inaccessible alleles at loci controlling disease resistance and plant architecture [71]. A genomically characterized Kazakhstan core collection would support both conservation and targeted pre-breeding.
Translation into breeding requires a staged validation pipeline. Priority should be given to loci detected across environments or models that have useful allele frequencies, meaningful effects, and no major unfavorable associations. Lead SNPs should first be replicated in separate panels and elite Kazakhstan backgrounds, then tested in segregating populations and multi-location nurseries. Haplotype analysis and fine-mapping should precede conversion to KASP assays. The goal should be diagnostic or predictive markers, rather than assays that merely reproduce linkage in the discovery panel. The pangenome-assisted Rph7 marker illustrates how broad germplasm validation can produce a breeder-ready KASP assay [45]. Candidate genes underlying the strongest loci should be tested through expression analysis, mutant resources, and, where justified, CRISPR/Cas editing, which is technically feasible in barley [72].
Finally, marker deployment should reflect trait architecture. Validated major-effect loci for disease resistance or specific quality traits are suitable for MAS and gene pyramiding, whereas grain yield and environmental adaptation require genome-wide prediction. Barley breeding studies have shown that genomic-selection accuracy depends on training-population composition, heritability, relatedness, and allele-frequency change over cycles [73]. Kazakhstan programs should therefore establish connected training populations linking research panels with active breeding nurseries, update prediction models each cycle, and evaluate region-specific and multi-environment models. Stable GWAS loci may be fitted as fixed effects or weighted markers, while genome-wide markers capture the remaining polygenic variation. This integrated route, from harmonized GWAS evidence and pangenome-informed variant discovery to validated markers, MAS, and genomic selection, offers the clearest path for converting the accumulated GWAS evidence into measurable genetic gain and locally adapted, high-yielding, disease-resistant, and quality-defined barley cultivars.
Based on the differences in trait architecture and the available levels of evidence, the most appropriate breeding strategy varies among trait groups (Table 4).
Table 4.
Recommended breeding strategies for the trait groups considered in barley GWAS relevant to Kazakhstan.
An operational workflow for integrating validated KASP markers with genomic selection may include five steps. First, the KASP marker–trait relationship should be replicated in elite breeding material and across representative target environments. Second, the validated marker and genome-wide marker set should be genotyped in a connected training population with multi-environment phenotypic data. Third, the effect and direction of the KASP allele should be estimated across environments and evaluated for possible unfavorable associations with other traits. Fourth, a validated major-effect KASP marker may be included as a fixed covariate in a GBLUP or Bayesian genomic prediction model, while the remaining genome-wide markers are modeled as random effects to capture residual polygenic variation. Finally, genomic estimated breeding values should be combined with the KASP genotype and a multi-trait selection index to select crossing parents and progeny. Marker effects and prediction accuracy should be reassessed in each breeding cycle because allele frequencies, relatedness, and target environments may change over time. This framework is intended as a decision guide rather than as evidence that the currently available markers are already suitable for routine breeding deployment.
4. Conclusions
The review extracted 459 reported GWAS association/QTL entries across 22 agronomic traits from barley studies conducted in Kazakhstan during the last decade. These entries corresponded to 350 distinct lead-marker identifiers and should not be interpreted as 459 unique genomic or causal loci. The largest share of reported entries was associated with yield components (180), followed by grain quality (90), phenology (87), plant morphology (59), and resistance to stem rust and powdery mildew (43). The non-random chromosomal distribution and cross-trait clustering across all seven barley chromosomes identify candidate multi-trait regions consistent with pleiotropy or tight linkage, although the underlying mechanisms remain unresolved. These patterns indicate that marker effects must be interpreted in a multi-trait context to prevent unfavorable correlated responses during selection. From a translational perspective, 33 distinct SNPs representing 55 SNP–trait associations were prioritized because they exceeded the study-specific Bonferroni significance thresholds and were repeatedly detected across environments and/or years. Although this combination of statistical significance and environmental recurrence provides stronger evidence than a single-environment GWAS signal, these SNPs still require validation in separate germplasm panels before they can be regarded as diagnostic markers for routine breeding. Only a limited number of these markers have been evaluated in separate genetic backgrounds, highlighting that assay conversion alone is insufficient for deployment in breeding programs. Robust application requires multi-environment validation and assessment of marker stability across diverse germplasm. Major-effect loci associated with disease resistance and quality traits are suitable for marker-assisted selection and allele pyramiding, whereas complex traits such as yield and adaptation are better addressed through genomic prediction approaches that capture polygenic variation. Further progress in barley improvement will depend on aligning all QTL positions to the Morex v3 reference genome, explicitly modeling genotype-by-environment interactions, incorporating pangenome-based variant discovery, and validating favorable haplotypes in elite Kazakhstan breeding material across multi-location trials. The most effective strategy for genetic gain will be integrating validated KASP markers with genomic selection frameworks, enabling the conversion of GWAS-derived associations into stable, predictable improvements in yield, resilience, and grain quality.
Supplementary Materials
The following supporting information can be downloaded at https://www.mdpi.com/article/10.3390/crops6050089/s1. Table S1: Database-specific search strategies used to identify barley GWAS and KASP-marker studies relevant to Kazakhstan. Table S2: Full-text articles assessed for eligibility and their identification across the literature sources searched. Table S3: Full list of reported barley GWAS association/QTL entries included in the quantitative synthesis. Figure S1: Flow diagram showing the identification, screening, eligibility assessment, and final inclusion of articles in the review. Figure S2: Geographic locations of experimental sites represented in the barley GWAS conducted in Kazakhstan and included in the review.
Author Contributions
Conceptualization, Y.T., Y.G. and S.A. (Saule Abugalieva); formal analysis, S.A. (Shyryn Almerekova) and Y.G.; investigation, S.A. (Shyryn Almerekova) and Y.G.; data curation, Y.T., Y.G. and S.A. (Saule Abugalieva); writing—original draft preparation, S.A. (Shyryn Almerekova) and Y.G.; writing—review and editing, S.A. (Shyryn Almerekova), Y.G., Y.T. and S.A. (Saule Abugalieva); supervision, Y.T., S.A. (Saule Abugalieva) and S.A. (Shyryn Almerekova); project administration, Y.T.; funding acquisition, Y.T. All authors have read and agreed to the published version of the manuscript.
Funding
This research has been funded by the Committee of Science of the Ministry of Science and Higher Education of the Republic of Kazakhstan (Grant No. BR24992903).
Data Availability Statement
The original contributions presented in the study are included in the article and Supplementary Materials. Further inquiries can be directed to the corresponding author.
Acknowledgments
During the preparation of this manuscript, generative AI was used only to assist with the visual design of schematic elements in Figure 1 and Figure S1. It was not used to generate, infer, modify, or analyze scientific data. All chromosome maps, marker positions, numerical values, gene labels, trait assignments, and quantitative plots were generated from the source data and manually verified by the authors. The authors reviewed and edited all AI-assisted graphical elements and take full responsibility for the accuracy of the published content.
Conflicts of Interest
The authors declare no conflicts of interest.
Abbreviations
The following abbreviations are used in this manuscript:
| BLUP | Best linear unbiased prediction |
| EX | Extractivity |
| FDR | False discovery rate |
| G × E | Genotype-by-environment interaction |
| GCC | Grain cellulose content |
| GLC | Grain lipid content |
| GPC | Grain protein content |
| GSC | Grain starch content |
| GWAS | Genome-wide association studies |
| HMT | Heading-to-maturity time |
| HT | Heading time |
| KbAES | Karabalyk Agricultural Experimental Station |
| KASP | Kompetitive allele-specific PCR |
| KRIAPG | Kazakh Research Institute of Agriculture and Plant Growing |
| LD | Linkage disequilibrium |
| MAS | Marker-assisted selection |
| MTA | Marker–trait associations |
| NKS | Number of kernels per spike |
| NPS | Number of productive spikes |
| PH | Plant height |
| PL | Peduncle length |
| PM | Powdery mildew resistance |
| PT | Productive tillering |
| QTL | Quantitative trait loci |
| RIL | Rachis internode length |
| SD | Spike density |
| SL | Spike length |
| SNP | Single-nucleotide polymorphism |
| SR | Stem rust resistance |
| TKW | Thousand-kernel weight |
| TWL | Grain test weight per liter |
| VP | Vegetation period |
| WKP | Weight of kernels per plant |
| WKS | Weight of kernels per spike |
| YM2 | Grain yield per square meter |
References
- Sakuma, S.; Salomon, B.; Komatsuda, T. The Domestication Syndrome Genes Responsible for the Major Changes in Plant Form in the Triticeae Crops. Plant Cell Physiol. 2011, 52, 738–749. [Google Scholar] [CrossRef] [Scilit]
- Zohary, D.; Hopf, M.; Weiss, E. Domestication of Plants in the Old World: The Origin and Spread of Domesticated Plants in Southwest Asia, Europe, and the Mediterranean Basin; Oxford University Press: Oxford, UK, 2012. [Google Scholar]
- Langridge, P. Economic and Academic Importance of Barley. In The Barley Genome; Springer: Berlin/Heidelberg, Germany, 2018; pp. 1–10. [Google Scholar]
- Newton, A.C.; Flavell, A.J.; George, T.S.; Leat, P.; Mullholland, B.; Ramsay, L.; Revoredo-Giha, C.; Russell, J.; Steffenson, B.J.; Swanston, J.S. Crops That Feed the World 4. Barley: A Resilient Crop? Strengths and Weaknesses in the Context of Food Security. Food Secur. 2011, 3, 141–178. [Google Scholar] [CrossRef] [Scilit]
- Agency for Strategic Planning and Reforms of the Republic of Kazakhstan, Bureau of National Statistics. Available online: https://stat.gov.kz/ (accessed on 24 June 2026).
- Almerekova, S.; Genievskaya, Y.; Abugalieva, S.; Sato, K.; Turuspekov, Y. Population Structure and Genetic Diversity of Two-Rowed Barley Accessions from Kazakhstan Based on SNP Genotyping Data. Plants 2021, 10, 2025. [Google Scholar] [CrossRef] [Scilit]
- Zhunussova, A.S.; Rsaliyev, A.S.; Sarbayev, A.T.; Khidirov, K.R. Evaluation of commercial and collection varieties of barley for resistance to major fungal diseases in field conditions. Izdenister Natigeler 2024, 3, 159–167. [Google Scholar] [CrossRef] [Scilit]
- Genievskaya, Y.; Almerekova, S.; Sariev, B.; Chudinov, V.; Tokhetova, L.; Sereda, G.; Ortaev, A.; Tsygankov, V.; Blake, T.; Chao, S.; et al. Marker-Trait Associations in Two-Rowed Spring Barley Accessions from Kazakhstan and the USA. PLoS ONE 2018, 13, e0205421. [Google Scholar] [CrossRef] [Scilit]
- Almerekova, S.; Sariev, B.; Abugalieva, A.; Chudinov, V.; Sereda, G.; Tokhetova, L.; Ortaev, A.; Tsygankov, V.; Blake, T.; Chao, S.; et al. Association Mapping for Agronomic Traits in Six-Rowed Spring Barley from the USA Harvested in Kazakhstan. PLoS ONE 2019, 14, e0221064. [Google Scholar] [CrossRef] [Scilit]
- U.S. Department of Agriculture (USDA). Available online: https://www.usda.gov/ (accessed on 24 June 2026).
- Mayer, K.; Waugh, R.; Langridge, P.; Close, T.; Wise, R.; Graner, A.; Matsumoto, T.; Sato, K.; Schulman, A.; Muehlbauer, G. A Physical, Genetic and Functional Sequence Assembly of the Barley Genome. Nature 2012, 491, 711–716. [Google Scholar] [CrossRef] [Scilit]
- Mascher, M.; Gundlach, H.; Himmelbach, A.; Beier, S.; Twardziok, S.O.; Wicker, T.; Radchuk, V.; Dockter, C.; Hedley, P.E.; Russell, J.; et al. A Chromosome Conformation Capture Ordered Sequence of the Barley Genome. Nature 2017, 544, 427–433. [Google Scholar] [CrossRef] [Scilit]
- Pasam, R.K.; Sharma, R.; Malosetti, M.; Van Eeuwijk, F.A.; Haseneyer, G.; Kilian, B.; Graner, A. Genome-Wide Association Studies for Agronomical Traits in a World Wide Spring Barley Collection. BMC Plant Biol. 2012, 12, 16. [Google Scholar] [CrossRef] [Scilit]
- Zhu, C.; Gore, M.; Buckler, E.S.; Yu, J. Status and Prospects of Association Mapping in Plants. Plant Genome 2008, 1, plantgenome2008.02.0089. [Google Scholar] [CrossRef] [Scilit]
- Rao, H.; Basha, O.; Singh, N.; Sato, K.; Dhaliwal, H. Frequency Distributions and Composite Interval Mapping for QTL Analysis in ‘Steptoe’x ‘Morex’Barley Mapping Population. Barley Genet. Newsl. 2007, 37, 5–20. [Google Scholar]
- Sehgal, D.; Singh, R.; Rajpal, V.R. Quantitative Trait Loci Mapping in Plants: Concepts and Approaches. In Molecular Breeding for Sustainable Crop Improvement: Volume 2; Springer: Cham, Switzerland, 2016; pp. 31–59. [Google Scholar]
- Huang, X.; Han, B. Natural Variations and Genome-Wide Association Studies in Crop Plants. Annu. Rev. Plant Biol. 2014, 65, 531–551. [Google Scholar] [CrossRef] [Scilit]
- Alqudah, A.M.; Sallam, A.; Baenziger, P.S.; Börner, A. GWAS: Fast-Forwarding Gene Identification and Characterization in Temperate Cereals: Lessons from Barley–a Review. J. Adv. Res. 2020, 22, 119–135. [Google Scholar] [CrossRef] [Scilit]
- Liang, Y.; Liu, H.-J.; Yan, J.; Tian, F. Natural Variation in Crops: Realized Understanding, Continuing Promise. Annu. Rev. Plant Biol. 2021, 72, 357–385. [Google Scholar] [CrossRef] [Scilit]
- Yu, J.; Pressoir, G.; Briggs, W.H.; Vroh Bi, I.; Yamasaki, M.; Doebley, J.F.; McMullen, M.D.; Gaut, B.S.; Nielsen, D.M.; Holland, J.B.; et al. A Unified Mixed-Model Method for Association Mapping That Accounts for Multiple Levels of Relatedness. Nat. Genet. 2006, 38, 203–208. [Google Scholar] [CrossRef] [Scilit]
- Tam, V.; Patel, N.; Turcotte, M.; Bossé, Y.; Paré, G.; Meyre, D. Benefits and Limitations of Genome-Wide Association Studies. Nat. Rev. Genet. 2019, 20, 467–484. [Google Scholar] [CrossRef] [Scilit]
- Tibbs Cortes, L.; Zhang, Z.; Yu, J. Status and Prospects of Genome-wide Association Studies in Plants. Plant Genome 2021, 14, e20077. [Google Scholar] [CrossRef] [Scilit]
- Cockram, J.; White, J.; Zuluaga, D.L.; Smith, D.; Comadran, J.; Macaulay, M.; Luo, Z.; Kearsey, M.J.; Werner, P.; Harrap, D.; et al. Genome-Wide Association Mapping to Candidate Polymorphism Resolution in the Unsequenced Barley Genome. Proc. Natl. Acad. Sci. USA 2010, 107, 21611–21616. [Google Scholar] [CrossRef] [Scilit]
- Comadran, J.; Kilian, B.; Russell, J.; Ramsay, L.; Stein, N.; Ganal, M.; Shaw, P.; Bayer, M.; Thomas, W.; Marshall, D.; et al. Natural Variation in a Homolog of Antirrhinum CENTRORADIALIS Contributed to Spring Growth Habit and Environmental Adaptation in Cultivated Barley. Nat. Genet. 2012, 44, 1388–1392. [Google Scholar] [CrossRef] [Scilit]
- Von Zitzewitz, J.; Cuesta-Marcos, A.; Condon, F.; Castro, A.J.; Chao, S.; Corey, A.; Filichkin, T.; Fisk, S.P.; Gutierrez, L.; Haggard, K.; et al. The Genetics of Winterhardiness in Barley: Perspectives from Genome-Wide Association Mapping. Plant Genome 2011, 4, plantgenome2010.12.0030. [Google Scholar] [CrossRef] [Scilit]
- Long, N.V.; Dolstra, O.; Malosetti, M.; Kilian, B.; Graner, A.; Visser, R.G.F.; Van Der Linden, C.G. Association Mapping of Salt Tolerance in Barley (Hordeum vulgare L.). Theor. Appl. Genet. 2013, 126, 2335–2351. [Google Scholar] [CrossRef] [Scilit]
- Massman, J.; Cooper, B.; Horsley, R.; Neate, S.; Dill-Macky, R.; Chao, S.; Dong, Y.; Schwarz, P.; Muehlbauer, G.J.; Smith, K.P. Genome-Wide Association Mapping of Fusarium Head Blight Resistance in Contemporary Barley Breeding Germplasm. Mol. Breed. 2011, 27, 439–454. [Google Scholar] [CrossRef] [Scilit]
- Mohammadi, M.; Blake, T.K.; Budde, A.D.; Chao, S.; Hayes, P.M.; Horsley, R.D.; Obert, D.E.; Ullrich, S.E.; Smith, K.P. A Genome-Wide Association Study of Malting Quality across Eight U.S. Barley Breeding Programs. Theor. Appl. Genet. 2015, 128, 705–721. [Google Scholar] [CrossRef] [Scilit]
- Maurer, A.; Draba, V.; Jiang, Y.; Schnaithmann, F.; Sharma, R.; Schumann, E.; Kilian, B.; Reif, J.C.; Pillen, K. Modelling the Genetic Architecture of Flowering Time Control in Barley through Nested Association Mapping. BMC Genom. 2015, 16, 290. [Google Scholar] [CrossRef] [Scilit]
- Saade, S.; Maurer, A.; Shahid, M.; Oakey, H.; Schmöckel, S.M.; Negrão, S.; Pillen, K.; Tester, M. Yield-Related Salinity Tolerance Traits Identified in a Nested Association Mapping (NAM) Population of Wild Barley. Sci. Rep. 2016, 6, 32586. [Google Scholar] [CrossRef] [Scilit]
- Dang, V.H.; Hill, C.B.; Zhang, X.-Q.; Angessa, T.T.; McFawn, L.-A.; Li, C. Multi-Locus Genome-Wide Association Studies Reveal Novel Alleles for Flowering Time under Vernalisation and Extended Photoperiod in a Barley MAGIC Population. Theor. Appl. Genet. 2022, 135, 3087–3102. [Google Scholar] [CrossRef] [Scilit]
- Russell, J.; Mascher, M.; Dawson, I.K.; Kyriakidis, S.; Calixto, C.; Freund, F.; Bayer, M.; Milne, I.; Marshall-Griffiths, T.; Heinen, S.; et al. Exome Sequencing of Geographically Diverse Barley Landraces and Wild Relatives Gives Insights into Environmental Adaptation. Nat. Genet. 2016, 48, 1024–1030. [Google Scholar] [CrossRef] [Scilit]
- Bustos-Korts, D.; Dawson, I.K.; Russell, J.; Tondelli, A.; Guerra, D.; Ferrandi, C.; Strozzi, F.; Nicolazzi, E.L.; Molnar-Lang, M.; Ozkan, H.; et al. Exome Sequences and Multi-environment Field Trials Elucidate the Genetic Basis of Adaptation in Barley. Plant J. 2019, 99, 1172–1191. [Google Scholar] [CrossRef] [Scilit]
- Tsai, H.-Y.; Janss, L.L.; Andersen, J.R.; Orabi, J.; Jensen, J.D.; Jahoor, A.; Jensen, J. Genomic Prediction and GWAS of Yield, Quality and Disease-Related Traits in Spring Barley and Winter Wheat. Sci. Rep. 2020, 10, 3347, Correction in Sci. Rep. 2020, 10, 8205. [Google Scholar] [CrossRef] [Scilit]
- Turuspekov, Y.; Ormanbekova, D.; Rsaliev, A.; Abugalieva, S. Genome-Wide Association Study on Stem Rust Resistance in Kazakh Spring Barley Lines. BMC Plant Biol. 2016, 16, 6. [Google Scholar] [CrossRef] [Scilit]
- Genievskaya, Y.; Almerekova, S.; Abugalieva, S.; Chudinov, V.; Blake, T.; Abugalieva, A.; Turuspekov, Y. Identification of SNP Markers Associated with Grain Quality Traits in a Barley Collection (Hordeum vulgare L.) Harvested in Kazakhstan. Agronomy 2022, 12, 2431. [Google Scholar] [CrossRef] [Scilit]
- Genievskaya, Y.; Almerekova, S.; Abugalieva, S.; Abugalieva, A.; Sato, K.; Turuspekov, Y. Identification of SNPs Associated with Grain Quality Traits in Spring Barley Collection Grown in Southeastern Kazakhstan. Agronomy 2023, 13, 1560. [Google Scholar] [CrossRef] [Scilit]
- Genievskaya, Y.; Abugalieva, S.; Turuspekov, Y. Identification of QTLs Associated with Grain Yield-Related Traits of Spring Barley. BMC Plant Biol. 2025, 25, 554. [Google Scholar] [CrossRef] [Scilit]
- Genievskaya, Y.; Zatybekov, A.; Abugalieva, S.; Turuspekov, Y. Identification of Quantitative Trait Loci Associated with Powdery Mildew Resistance in Spring Barley under Conditions of Southeastern Kazakhstan. Plants 2023, 12, 2375. [Google Scholar] [CrossRef] [Scilit]
- Genievskaya, Y.; Chudinov, V.; Abugalieva, S.; Turuspekov, Y. Novel QTL Hotspots for Barley Flowering Time, Plant Architecture, and Grain Yield. Agronomy 2024, 14, 1478. [Google Scholar] [CrossRef] [Scilit]
- Genievskaya, Y.; Maulenbay, A.; Rsaliyev, S.; Abugalieva, S.; Rsaliyev, A.; Zatybekov, A.; Turuspekov, Y. Dissecting Adult Plant Resistance to Stem Rust through Multi-Model GWAS in a Diverse Barley Germplasm Panel. Front. Plant Sci. 2025, 16, 1681398, Correction in Front. Plant Sci. 2026, 16, 1769859. [Google Scholar] [CrossRef] [Scilit]
- Semagn, K.; Babu, R.; Hearne, S.; Olsen, M. Single Nucleotide Polymorphism Genotyping Using Kompetitive Allele Specific PCR (KASP): Overview of the Technology and Its Application in Crop Improvement. Mol. Breed. 2014, 33, 1–14. [Google Scholar] [CrossRef] [Scilit]
- Genievskaya, Y.; Almerekova, S.; Chudinov, V.; Turuspekov, Y.; Abugalieva, S. Validation of KASP Assays Associated with Barley Adaptation and Productivity Traits. Eurasian J. Appl. Biotechnol. 2022, 3, 64–74. [Google Scholar] [CrossRef] [Scilit]
- Amalova, A.; Genievskaya, Y.; Abugalieva, S.; Chudinov, V.; Turuspekov, Y. Validation of marker-trait associations in six-rowed barley lines bred in Kazakhstan. Eurasian J. Appl. Biotechnol. 2022, 4, 40–48. [Google Scholar] [CrossRef] [Scilit]
- Wiles, D.; Gurung, K.; Tongson, E.; Park, R.F.; Cai, Y.; Viradia, B.; Okuda, K.S.; Perovic, D.; Dracatos, P.M. Pangenome-Assisted Development and Validation of a Predictive KASP Marker for the Barley Leaf Rust Resistance Gene Rph7. Front. Agron. 2025, 7, 1670733. [Google Scholar] [CrossRef] [Scilit]
- Komatsuda, T.; Pourkheirandish, M.; He, C.; Azhaguvel, P.; Kanamori, H.; Perovic, D.; Stein, N.; Graner, A.; Wicker, T.; Tagiri, A.; et al. Six-Rowed Barley Originated from a Mutation in a Homeodomain-Leucine Zipper I-Class Homeobox Gene. Proc. Natl. Acad. Sci. USA 2007, 104, 1424–1429. [Google Scholar] [CrossRef] [Scilit]
- Riggs, T.J.; Kirby, E.J.M. Developmental Consequences of Two-Row and Six-Row Ear Type in Spring Barley: 1. Genetical Analysis and Comparison of Mature Plant Characters. J. Agric. Sci. 1978, 91, 199–205. [Google Scholar] [CrossRef] [Scilit]
- Eyshi Rezaei, E.; Webber, H.; Gaiser, T.; Naab, J.; Ewert, F. Heat Stress in Cereals: Mechanisms and Modelling. Eur. J. Agron. 2015, 64, 98–113. [Google Scholar] [CrossRef] [Scilit]
- Alqudah, A.M.; Koppolu, R.; Wolde, G.M.; Graner, A.; Schnurbusch, T. The Genetic Architecture of Barley Plant Stature. Front. Genet. 2016, 7, 117. [Google Scholar] [CrossRef] [Scilit]
- Bretani, G.; Shaaf, S.; Tondelli, A.; Cattivelli, L.; Delbono, S.; Waugh, R.; Thomas, W.; Russell, J.; Bull, H.; Igartua, E. Multi-Environment Genome-Wide Association Mapping of Culm Morphology Traits in Barley. Front. Plant Sci. 2022, 13, 926277. [Google Scholar] [CrossRef] [Scilit]
- Glawe, D.A. The Powdery Mildews: A Review of the World’s Most Familiar (Yet Poorly Known) Plant Pathogens. Annu. Rev. Phytopathol. 2008, 46, 27–51. [Google Scholar] [CrossRef] [Scilit]
- Ames, N.; Dreiseitl, A.; Steffenson, B.J.; Muehlbauer, G.J. Mining Wild Barley for Powdery Mildew Resistance. Plant Pathol. 2015, 64, 1396–1406. [Google Scholar] [CrossRef] [Scilit]
- Novakazi, F.; Krusell, L.; Jensen, J.; Orabi, J.; Jahoor, A.; Bengtsson, T.; on behalf of the PPP Barley Consortium. You Had Me at “MAGIC”!: Four Barley MAGIC Populations Reveal Novel Resistance QTL for Powdery Mildew. Genes 2020, 11, 1512. [Google Scholar] [CrossRef] [Scilit]
- Harder, D.E.; Legge, W.G. Effectiveness of Different Sources of Stem Rust Resistance in Barley. Crop Sci. 2000, 40, 826–833. [Google Scholar] [CrossRef] [Scilit]
- Czembor, J.H.; Czembor, E.; Suchecki, R.; Watson-Haigh, N.S. Genome-Wide Association Study for Powdery Mildew and Rusts Adult Plant Resistance in European Spring Barley from Polish Gene Bank. Agronomy 2021, 12, 7. [Google Scholar] [CrossRef] [Scilit]
- Amouzoune, M.; Rehman, S.; Benkirane, R.; Verma, S.; Gyawali, S.; Al-Jaboobi, M.; Verma, R.P.S.; Kehel, Z.; Amri, A. Genome-Wide Association Study of Leaf Rust Resistance at Seedling and Adult Plant Stages in a Global Barley Panel. Agriculture 2022, 12, 1829. [Google Scholar] [CrossRef] [Scilit]
- Jiang, D.; Dai, T.; Jing, Q.; Cao, W.; Zhou, Q.; Zhao, H.; Fan, X. Effects of Long-Term Fertilization on Leaf Photosynthetic Characteristics and Grain Yield in Winter Wheat. Photosynthetica 2004, 42, 439–446. [Google Scholar] [CrossRef] [Scilit]
- Nadolska-Orczyk, A.; Rajchel, I.K.; Orczyk, W.; Gasparis, S. Major Genes Determining Yield-Related Traits in Wheat and Barley. Theor. Appl. Genet. 2017, 130, 1081–1098. [Google Scholar] [CrossRef] [Scilit]
- Bleidere, M.; Gaile, Z. Grain Quality Traits Important in Feed Barley. In Proceedings of the Latvian Academy of Sciences. Section B. Natural, Exact, and Applied Sciences; Latvian Academy of Sciences: Latvia, Riga, 2012; Volume 66, pp. 1–9. [Google Scholar] [CrossRef] [Scilit]
- Gebeyaw, M. Impact of Malt Barley Varieties on Malt Quality: A Review. Agric. Rev. 2021, 42, 116–119. [Google Scholar] [CrossRef] [Scilit]
- Szűcs, P.; Blake, V.C.; Bhat, P.R.; Chao, S.; Close, T.J.; Cuesta-Marcos, A.; Muehlbauer, G.J.; Ramsay, L.; Waugh, R.; Hayes, P.M. An Integrated Resource for Barley Linkage Map and Malting Quality QTL Alignment. Plant Genome 2009, 2, plantgenome2008.01.0005. [Google Scholar] [CrossRef] [Scilit]
- Berger, G.L.; Liu, S.; Hall, M.D.; Brooks, W.S.; Chao, S.; Muehlbauer, G.J.; Baik, B.-K.; Steffenson, B.; Griffey, C.A. Marker-Trait Associations in Virginia Tech Winter Barley Identified Using Genome-Wide Mapping. Theor. Appl. Genet. 2013, 126, 693–710. [Google Scholar] [CrossRef] [Scilit]
- Pauli, D.; Muehlbauer, G.J.; Smith, K.P.; Cooper, B.; Hole, D.; Obert, D.E.; Ullrich, S.E.; Blake, T.K. Association Mapping of Agronomic QTLs in U.S. Spring Barley Breeding Germplasm. Plant Genome 2014, 7, plantgenome2013.11.0037. [Google Scholar] [CrossRef] [Scilit]
- Fan, C.; Zhai, H.; Wang, H.; Yue, Y.; Zhang, M.; Li, J.; Wen, S.; Guo, G.; Zeng, Y.; Ni, Z.; et al. Identification of QTLs Controlling Grain Protein Concentration Using a High-Density SNP and SSR Linkage Map in Barley (Hordeum vulgare L.). BMC Plant Biol. 2017, 17, 122. [Google Scholar] [CrossRef] [Scilit]
- Li, M.; Geng, L.; Xie, S.; Wu, D.; Ye, L.; Zhang, G. Genome-Wide Association Study on Total Starch, Amylose and Amylopectin in Barley Grain Reveals Novel Putative Alleles. IJMS 2021, 22, 553. [Google Scholar] [CrossRef] [Scilit]
- Mascher, M.; Wicker, T.; Jenkins, J.; Plott, C.; Lux, T.; Koh, C.S.; Ens, J.; Gundlach, H.; Boston, L.B.; Tulpová, Z.; et al. Long-Read Sequence Assembly: A Technical Evaluation in Barley. Plant Cell 2021, 33, 1888–1906. [Google Scholar] [CrossRef] [Scilit]
- Jarquín, D.; Crossa, J.; Lacaze, X.; Du Cheyron, P.; Daucourt, J.; Lorgeou, J.; Piraux, F.; Guerreiro, L.; Pérez, P.; Calus, M. A Reaction Norm Model for Genomic Selection Using High-Dimensional Genomic and Environmental Data. Theor. Appl. Genet. 2014, 127, 595–607. [Google Scholar] [CrossRef] [Scilit]
- Bayer, M.M.; Rapazote-Flores, P.; Ganal, M.; Hedley, P.E.; Macaulay, M.; Plieske, J.; Ramsay, L.; Russell, J.; Shaw, P.D.; Thomas, W. Development and Evaluation of a Barley 50k iSelect SNP Array. Front. Plant Sci. 2017, 8, 1792. [Google Scholar] [CrossRef] [Scilit]
- Milner, S.G.; Jost, M.; Taketa, S.; Mazón, E.R.; Himmelbach, A.; Oppermann, M.; Weise, S.; Knüpffer, H.; Basterrechea, M.; König, P. Genebank Genomics Highlights the Diversity of a Global Barley Collection. Nat. Genet. 2019, 51, 319–326. [Google Scholar] [CrossRef] [Scilit]
- Jayakodi, M.; Padmarasu, S.; Haberer, G.; Bonthala, V.S.; Gundlach, H.; Monat, C.; Lux, T.; Kamal, N.; Lang, D.; Himmelbach, A. The Barley Pan-Genome Reveals the Hidden Legacy of Mutation Breeding. Nature 2020, 588, 284–289. [Google Scholar] [CrossRef] [Scilit]
- Jayakodi, M.; Lu, Q.; Pidon, H.; Rabanus-Wallace, M.T.; Bayer, M.; Lux, T.; Guo, Y.; Jaegle, B.; Badea, A.; Bekele, W.; et al. Structural Variation in the Pangenome of Wild and Domesticated Barley. Nature 2024, 636, 654–662. [Google Scholar] [CrossRef] [Scilit]
- Gasparis, S.; Kała, M.; Przyborowski, M.; Łyżnik, L.A.; Orczyk, W.; Nadolska-Orczyk, A. A Simple and Efficient CRISPR/Cas9 Platform for Induction of Single and Multiple, Heritable Mutations in Barley (Hordeum vulgare L.). Plant Methods 2018, 14, 111. [Google Scholar] [CrossRef] [Scilit]
- Sallam, A.; Endelman, J.; Jannink, J.; Smith, K. Assessing Genomic Selection Prediction Accuracy in a Dynamic Barley Breeding Population. Plant Genome 2015, 8, plantgenome2014-05. [Google Scholar] [CrossRef] [Scilit]
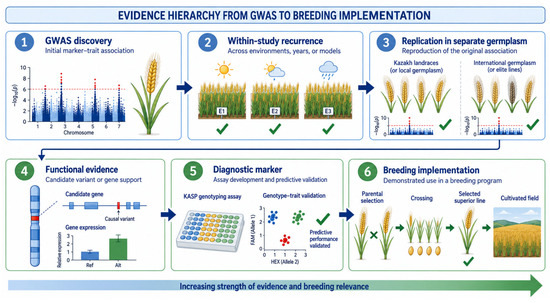
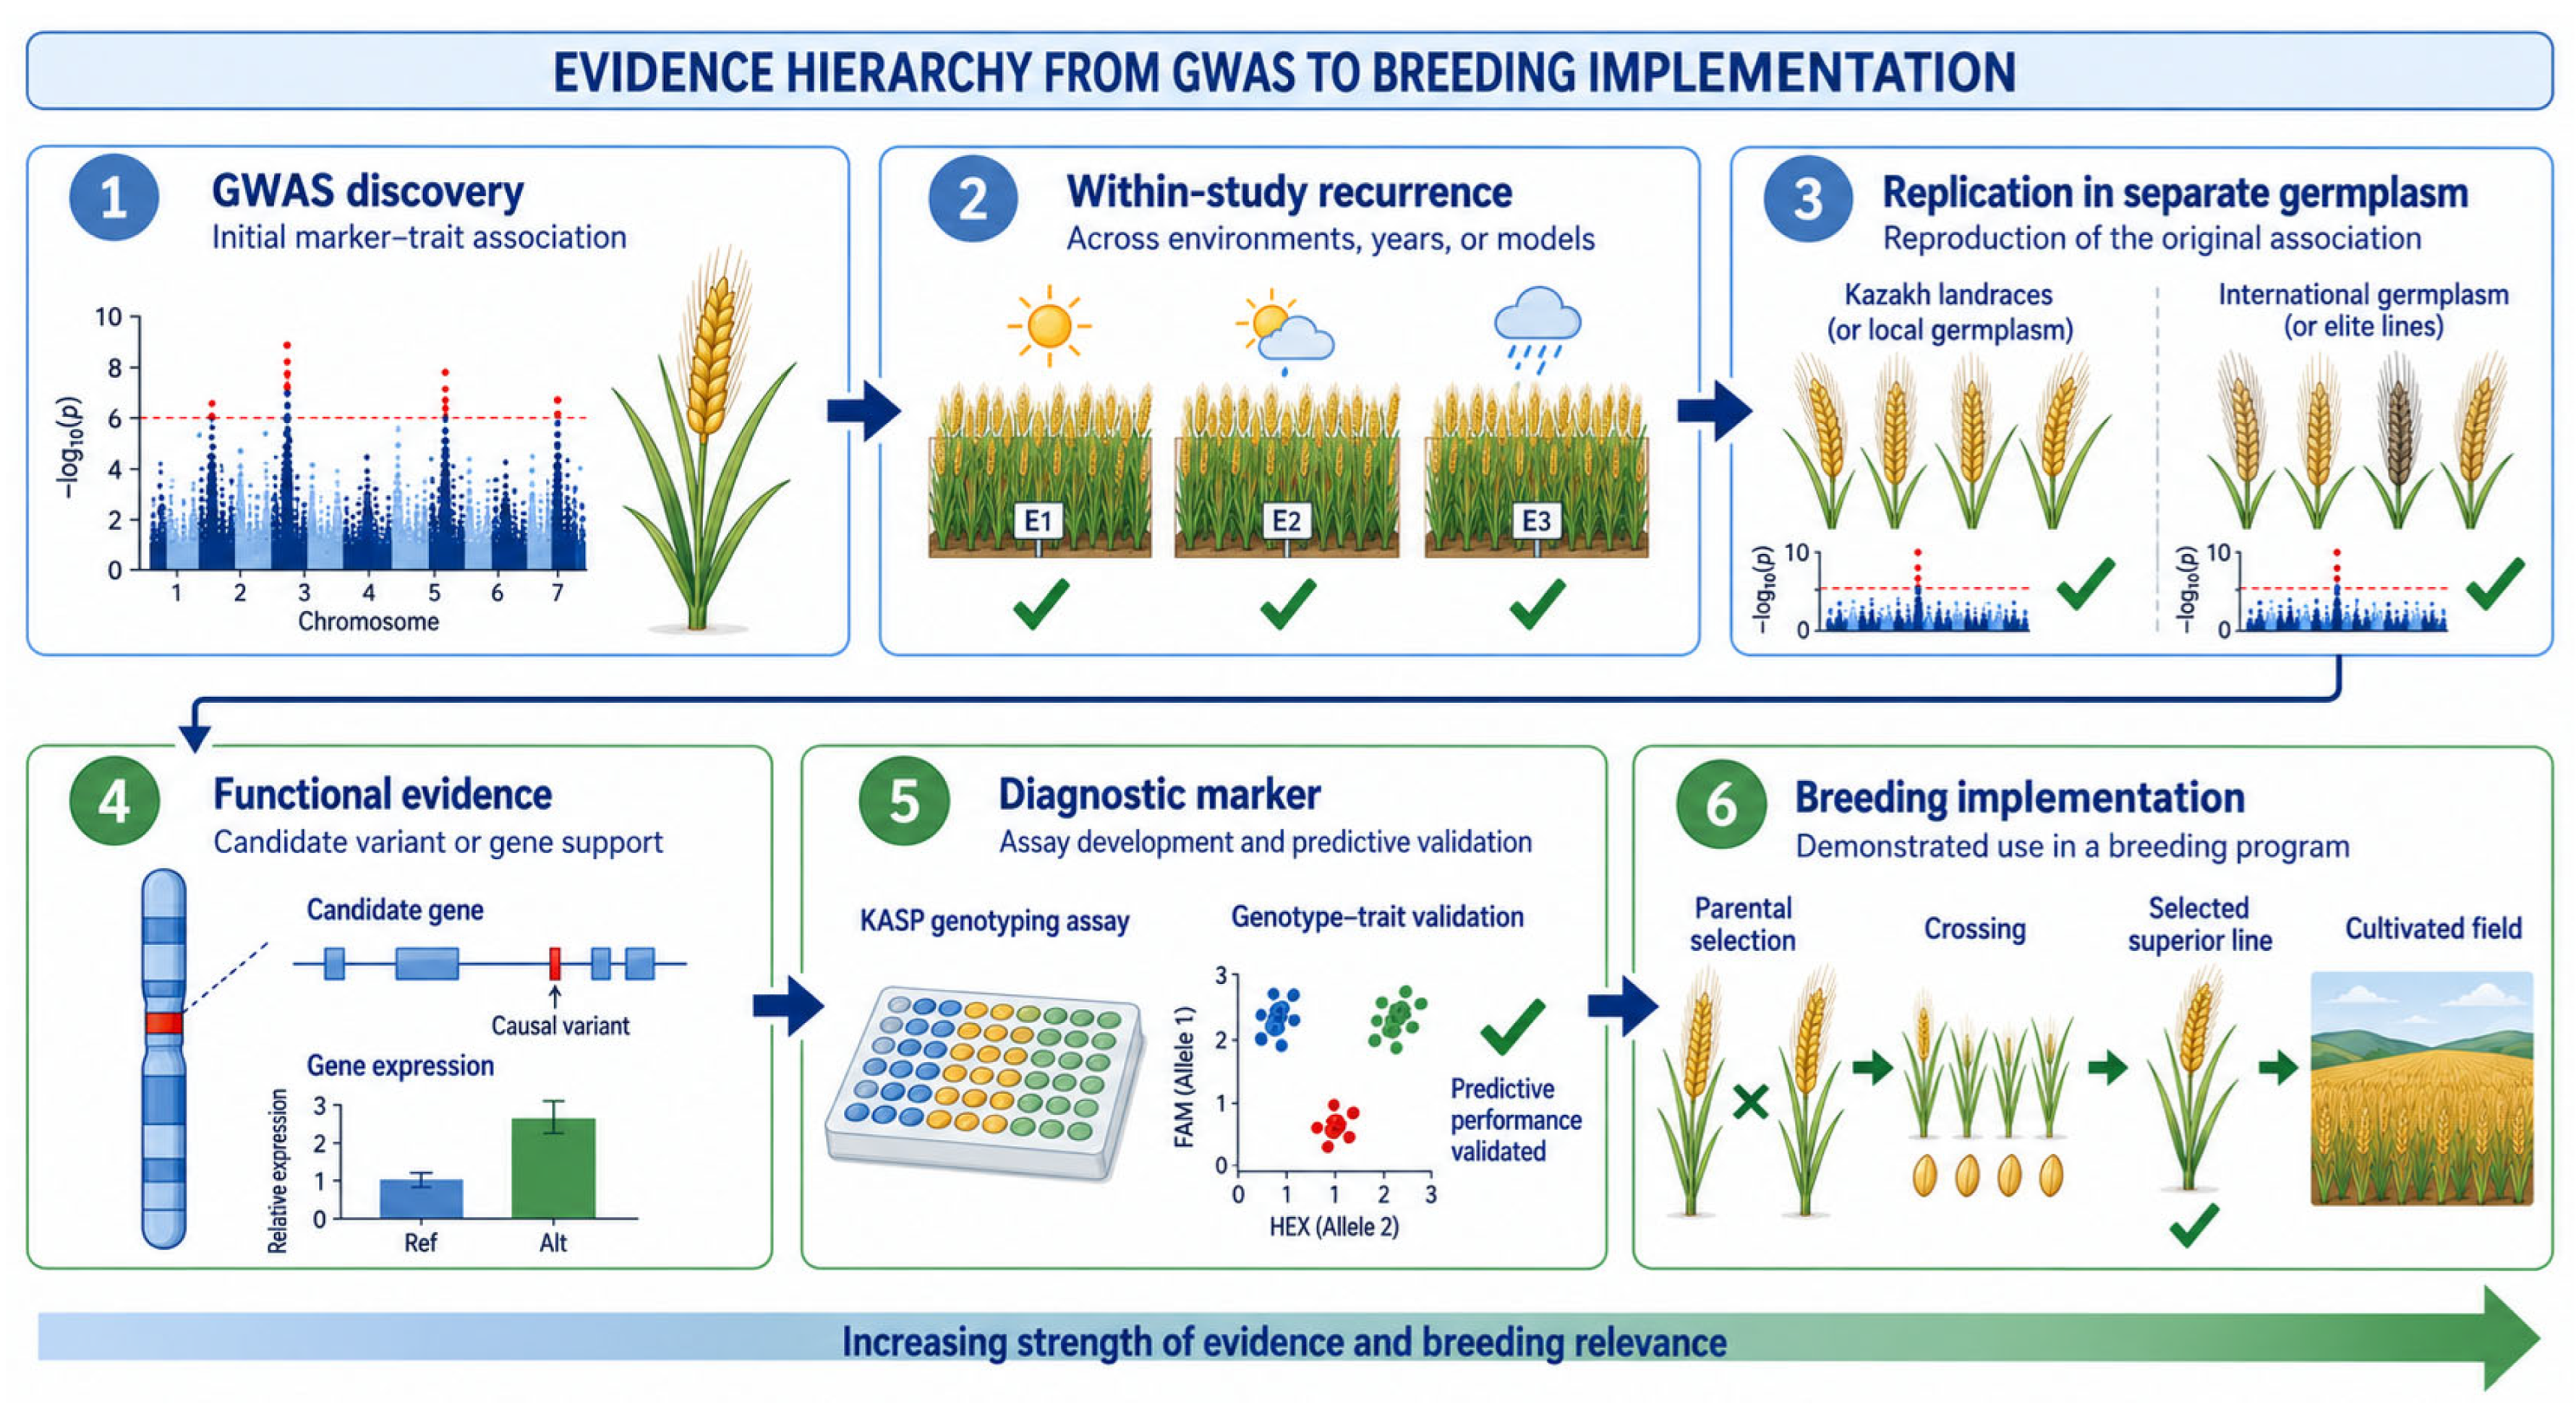
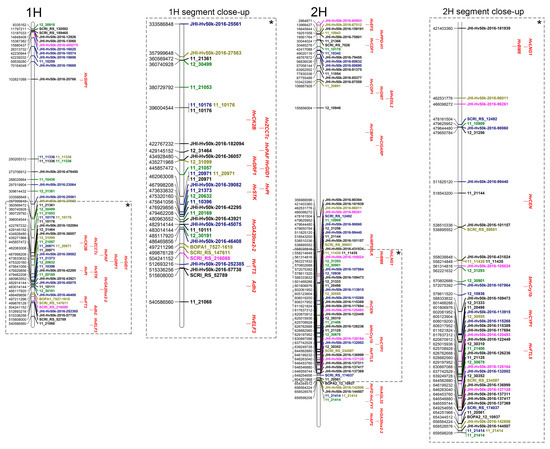
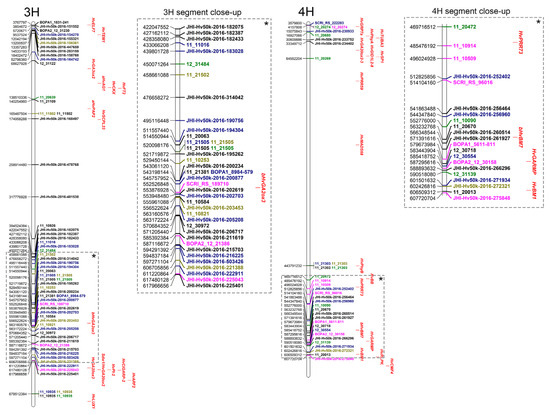
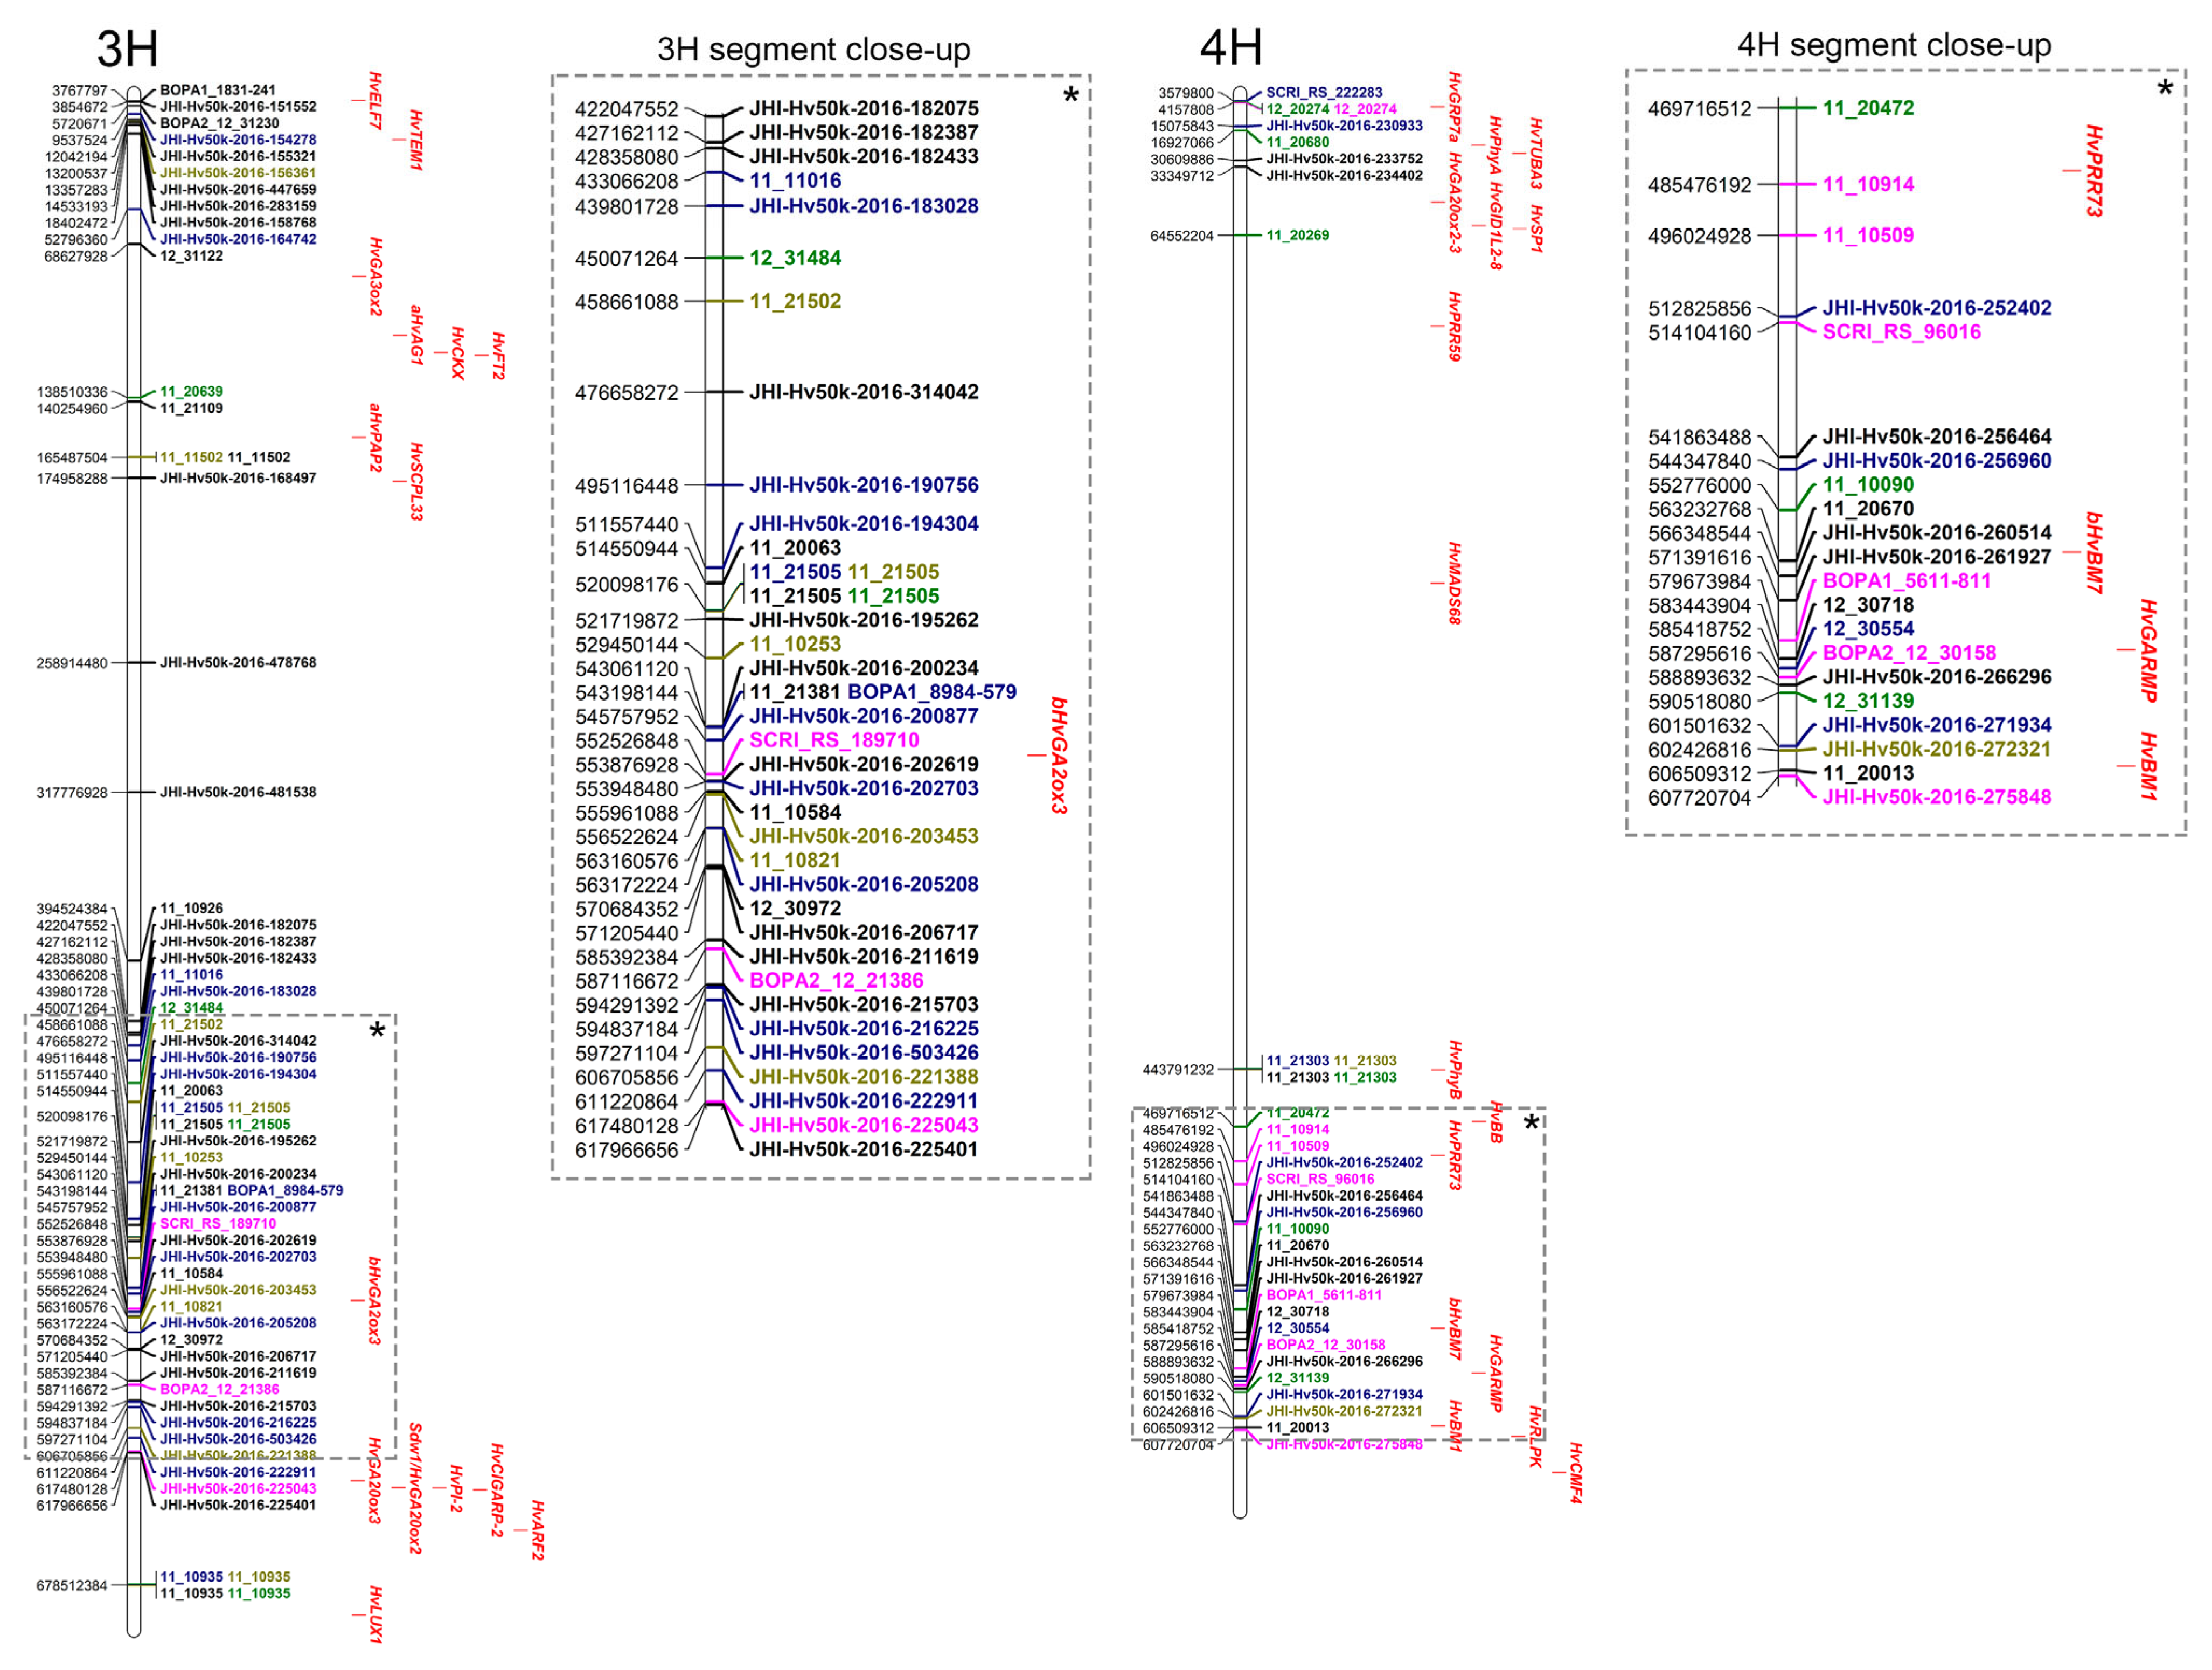
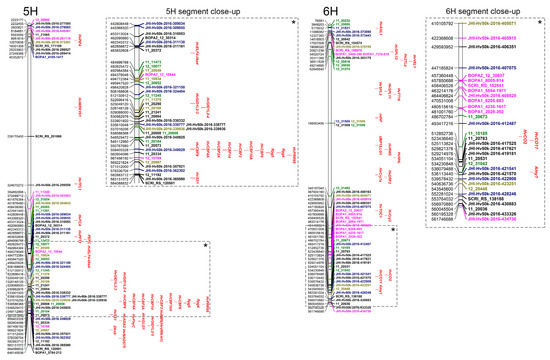
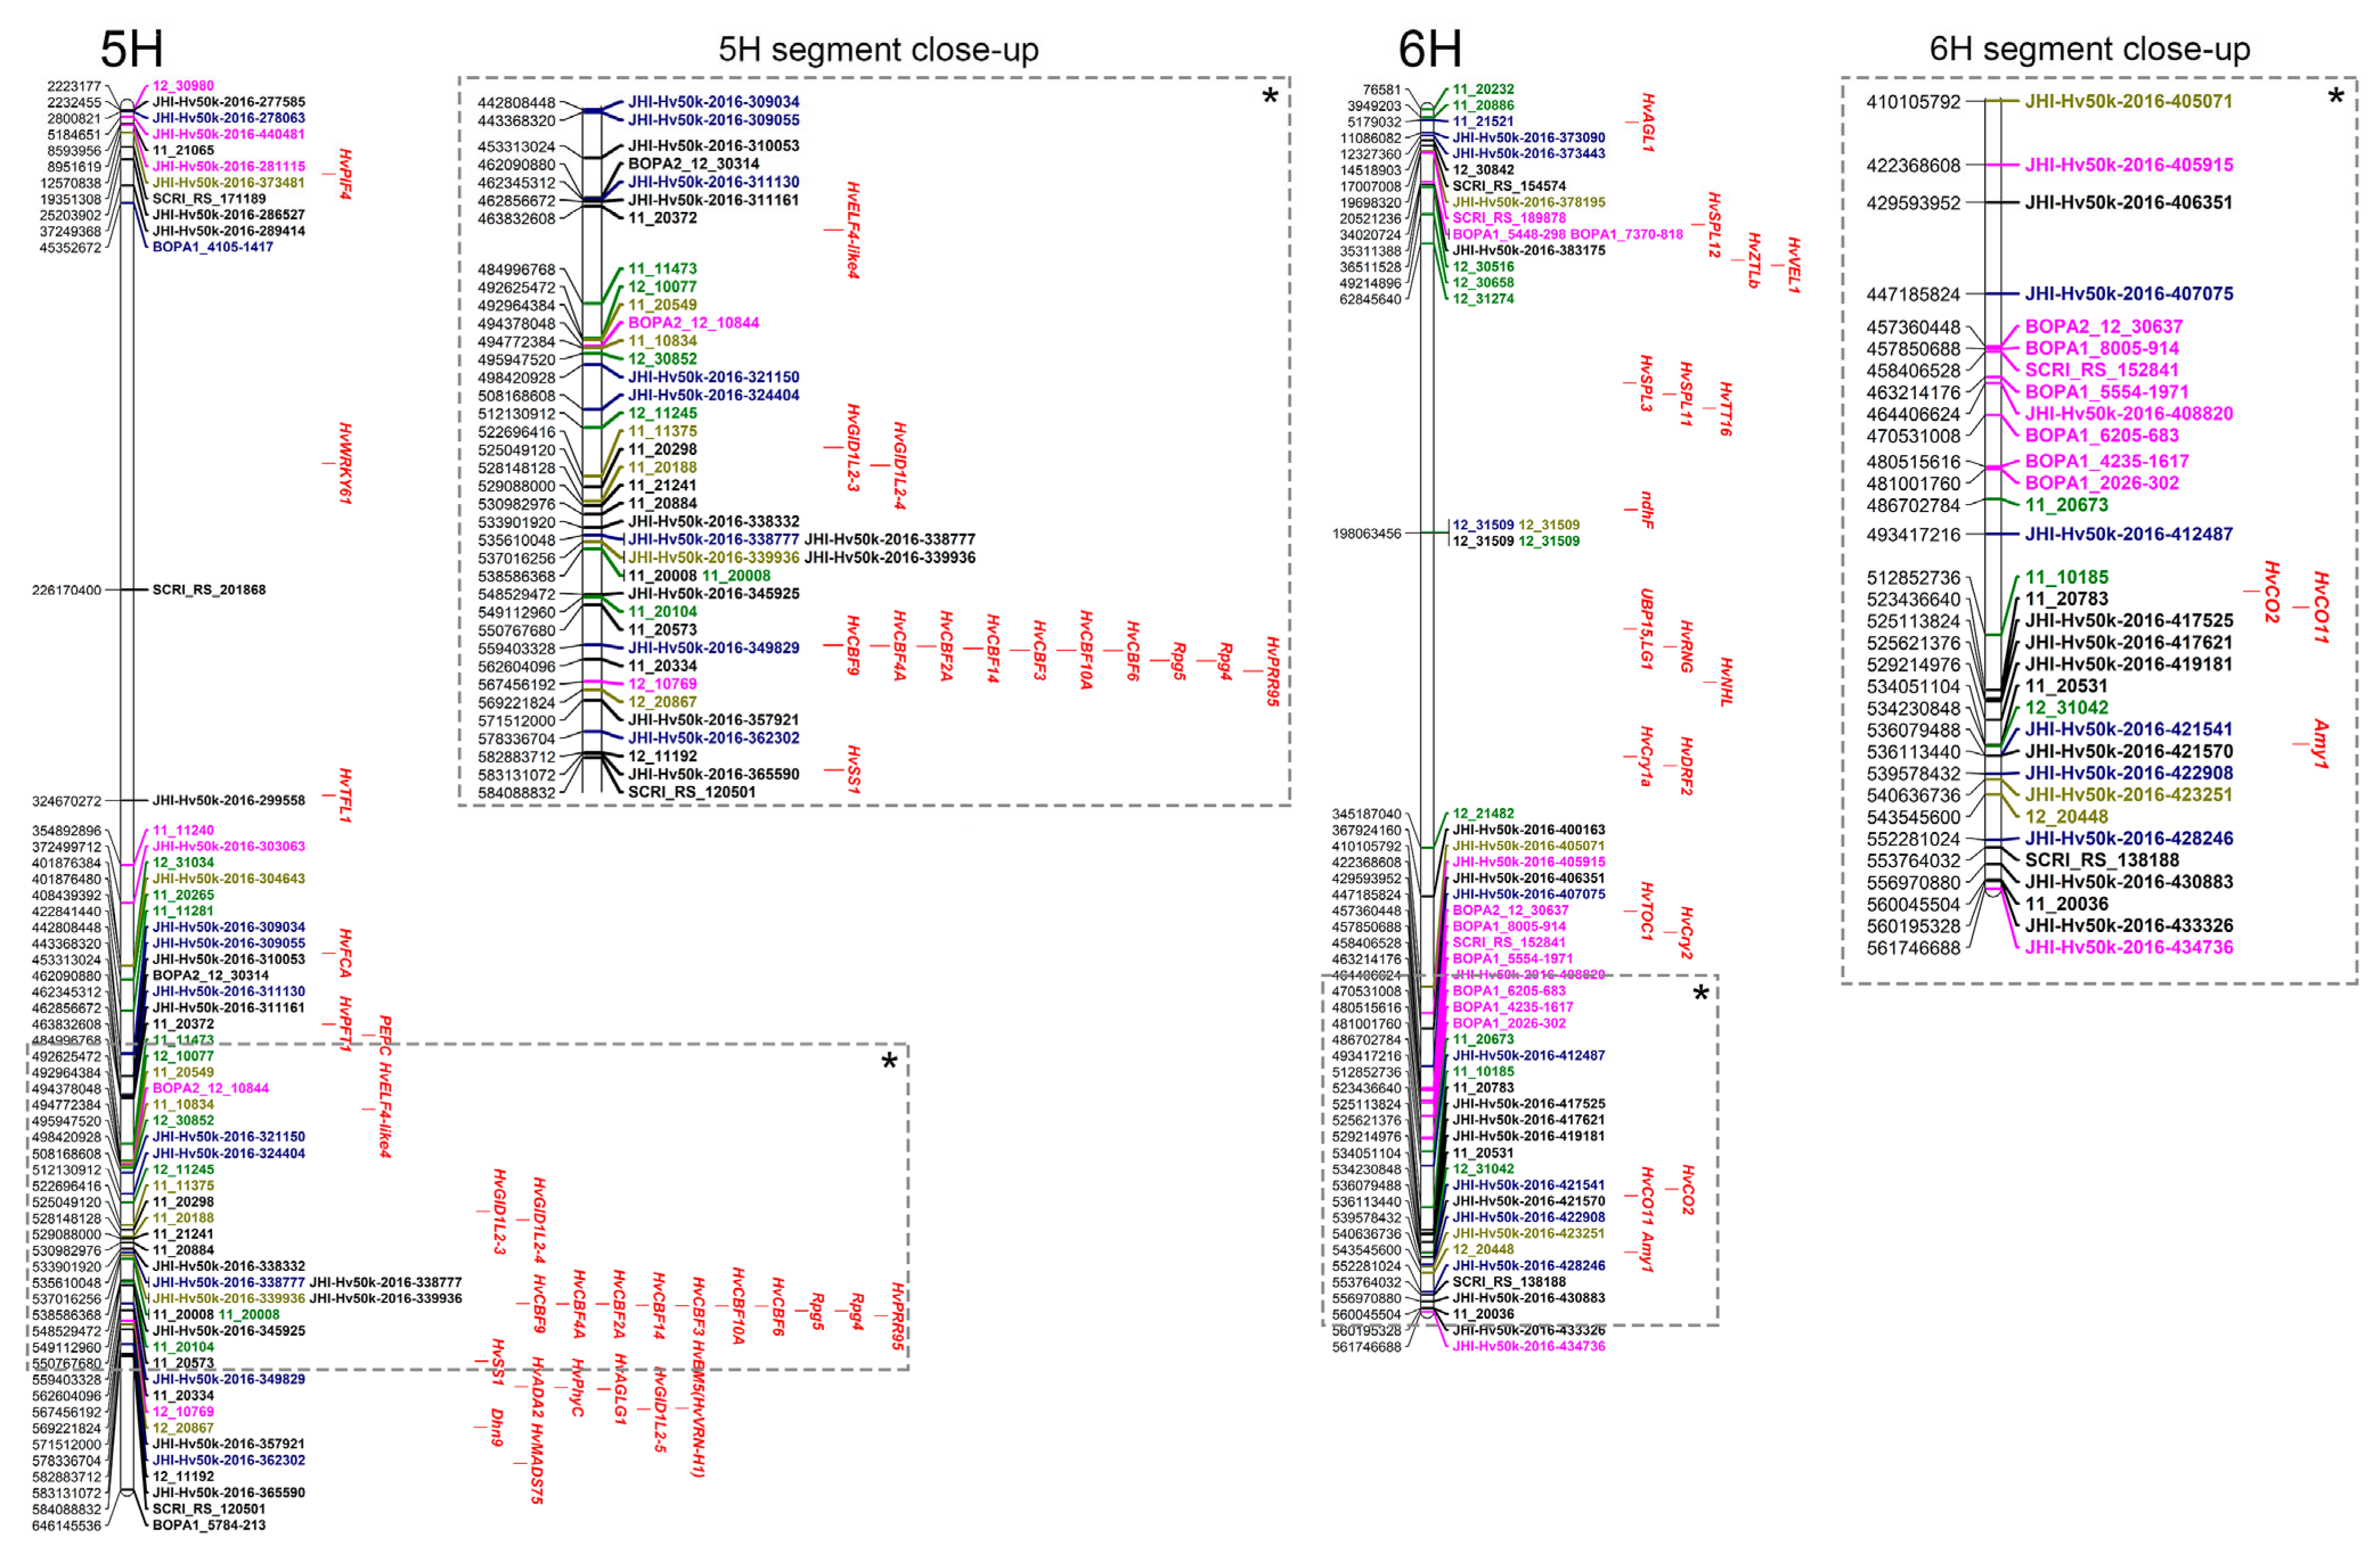
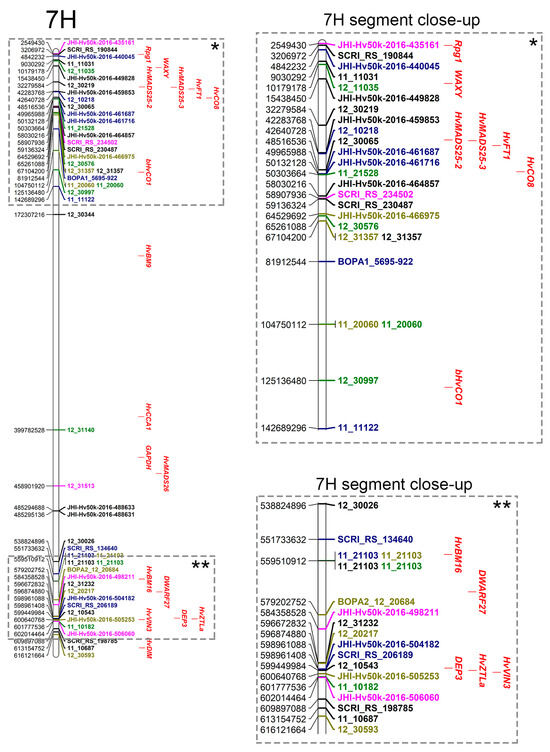
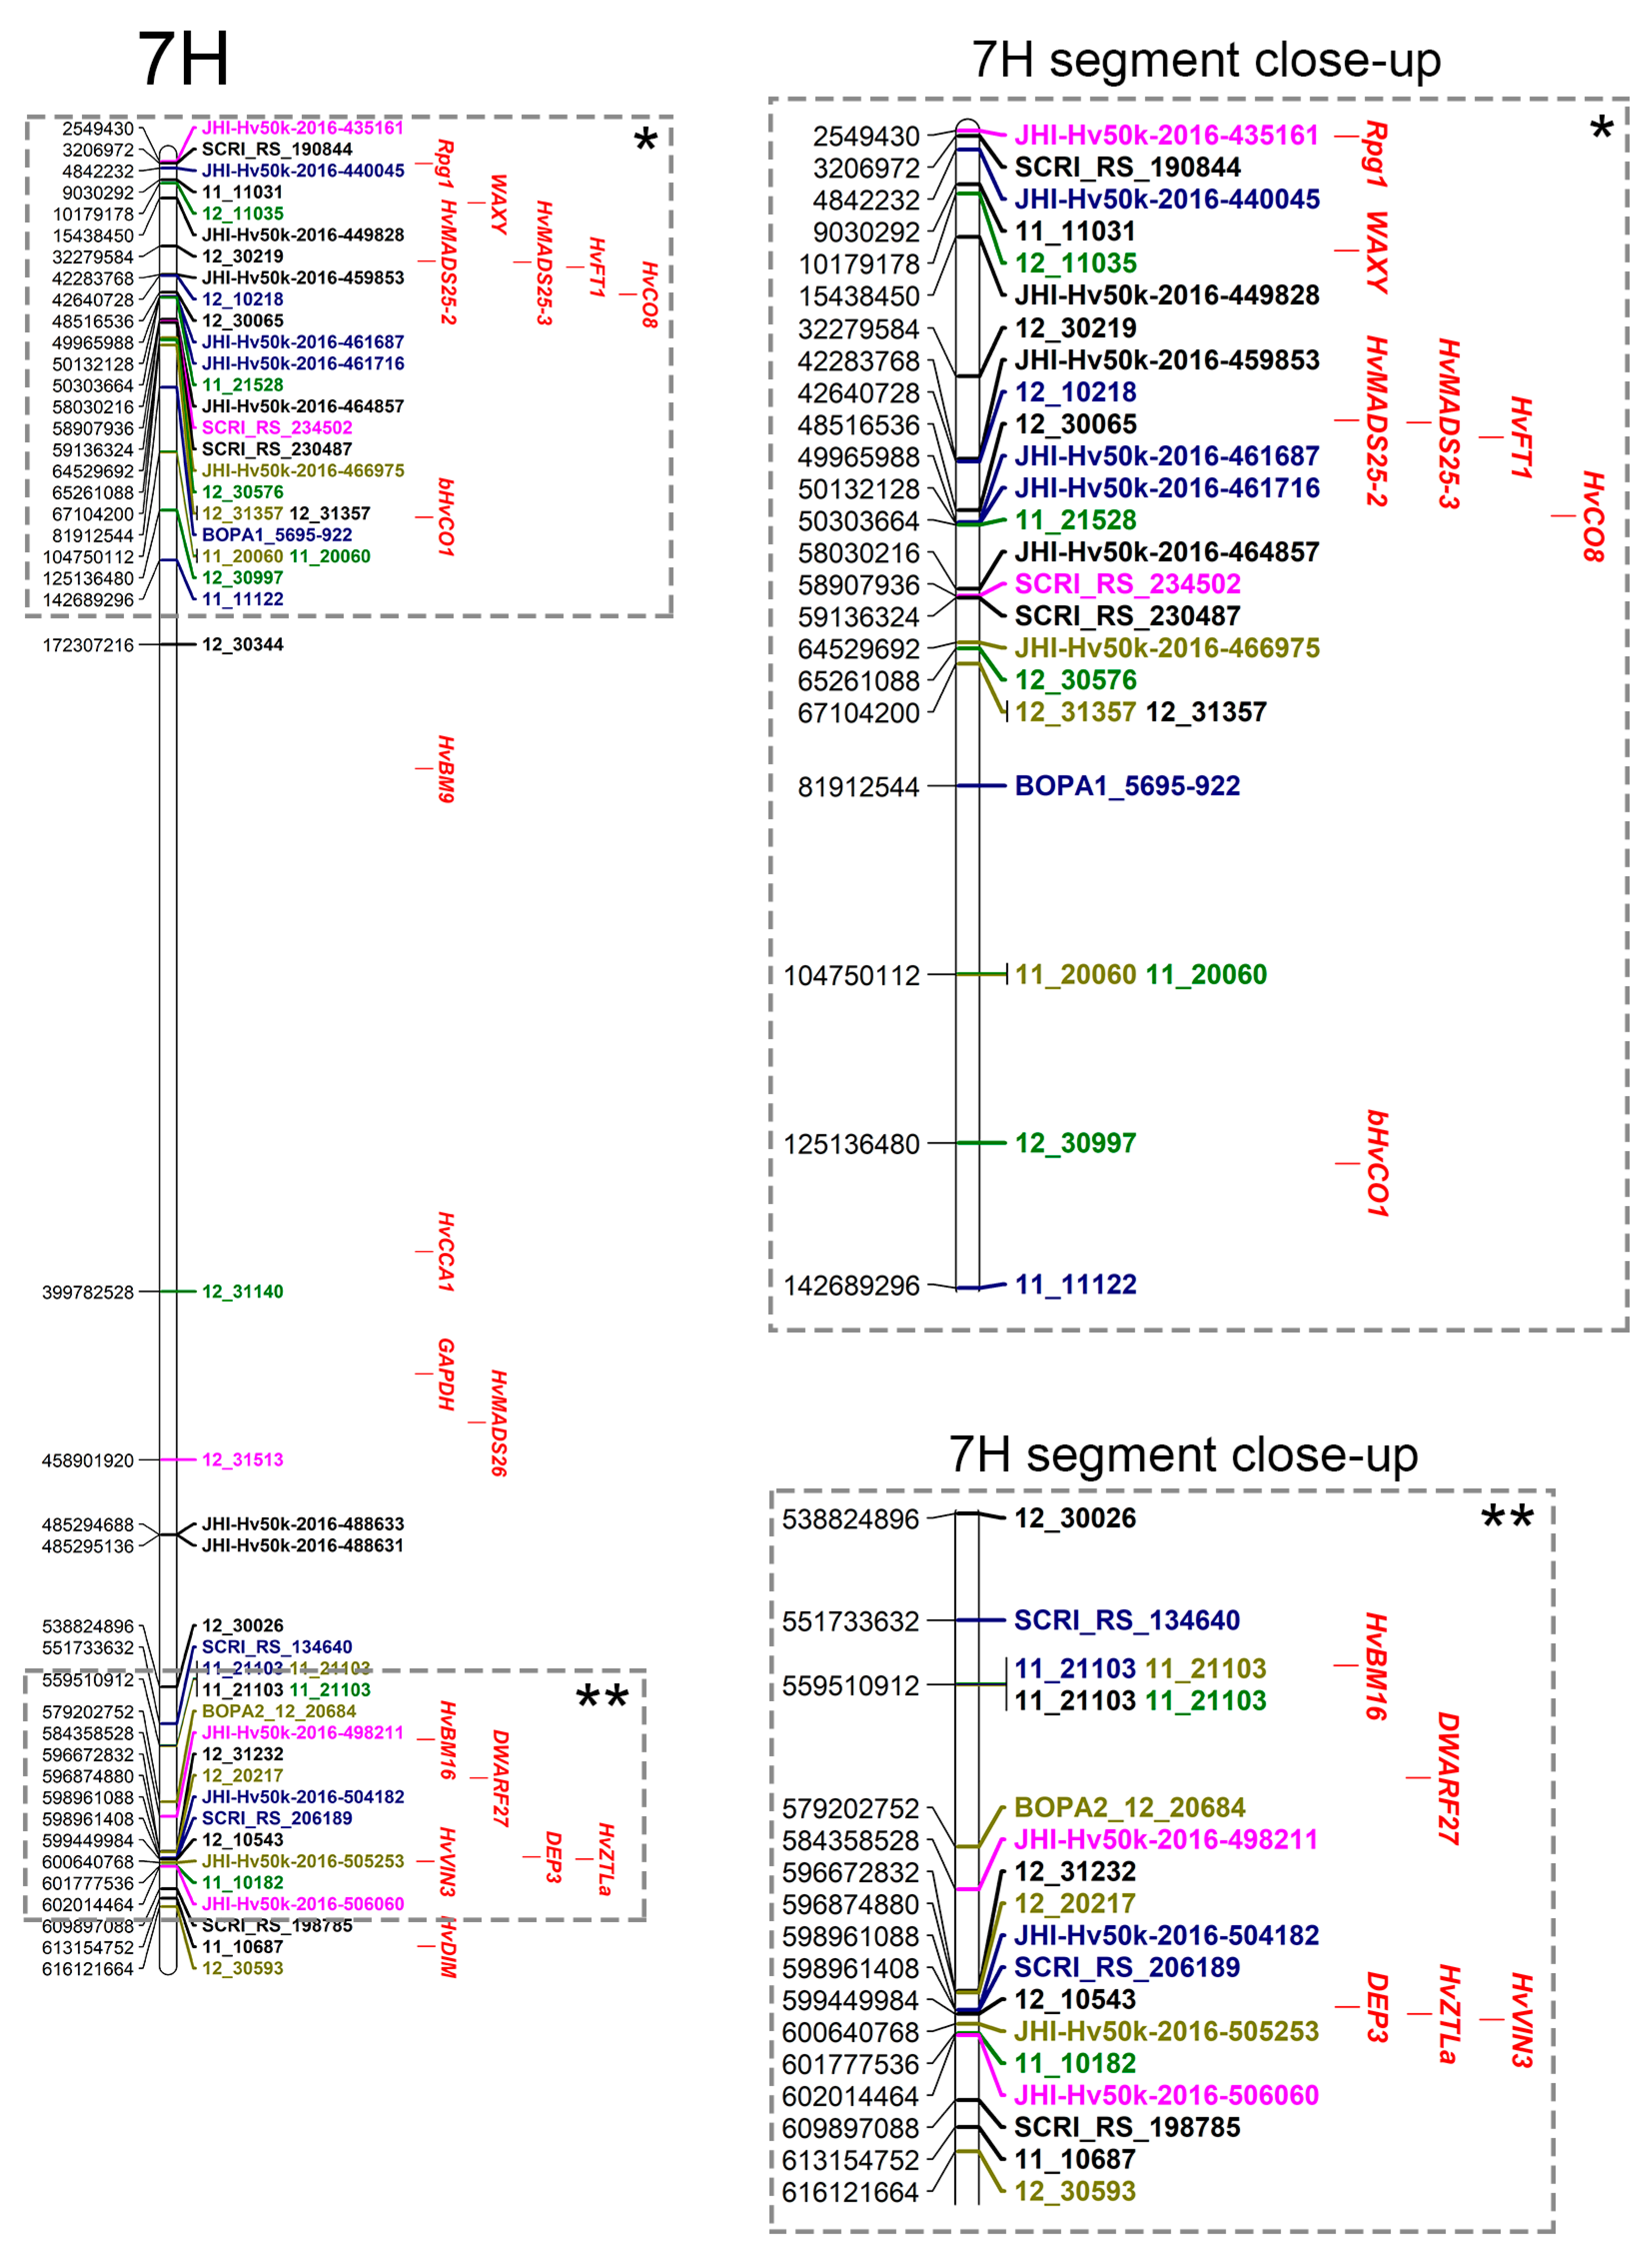
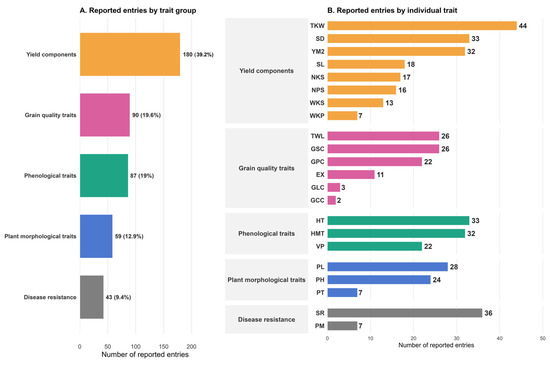
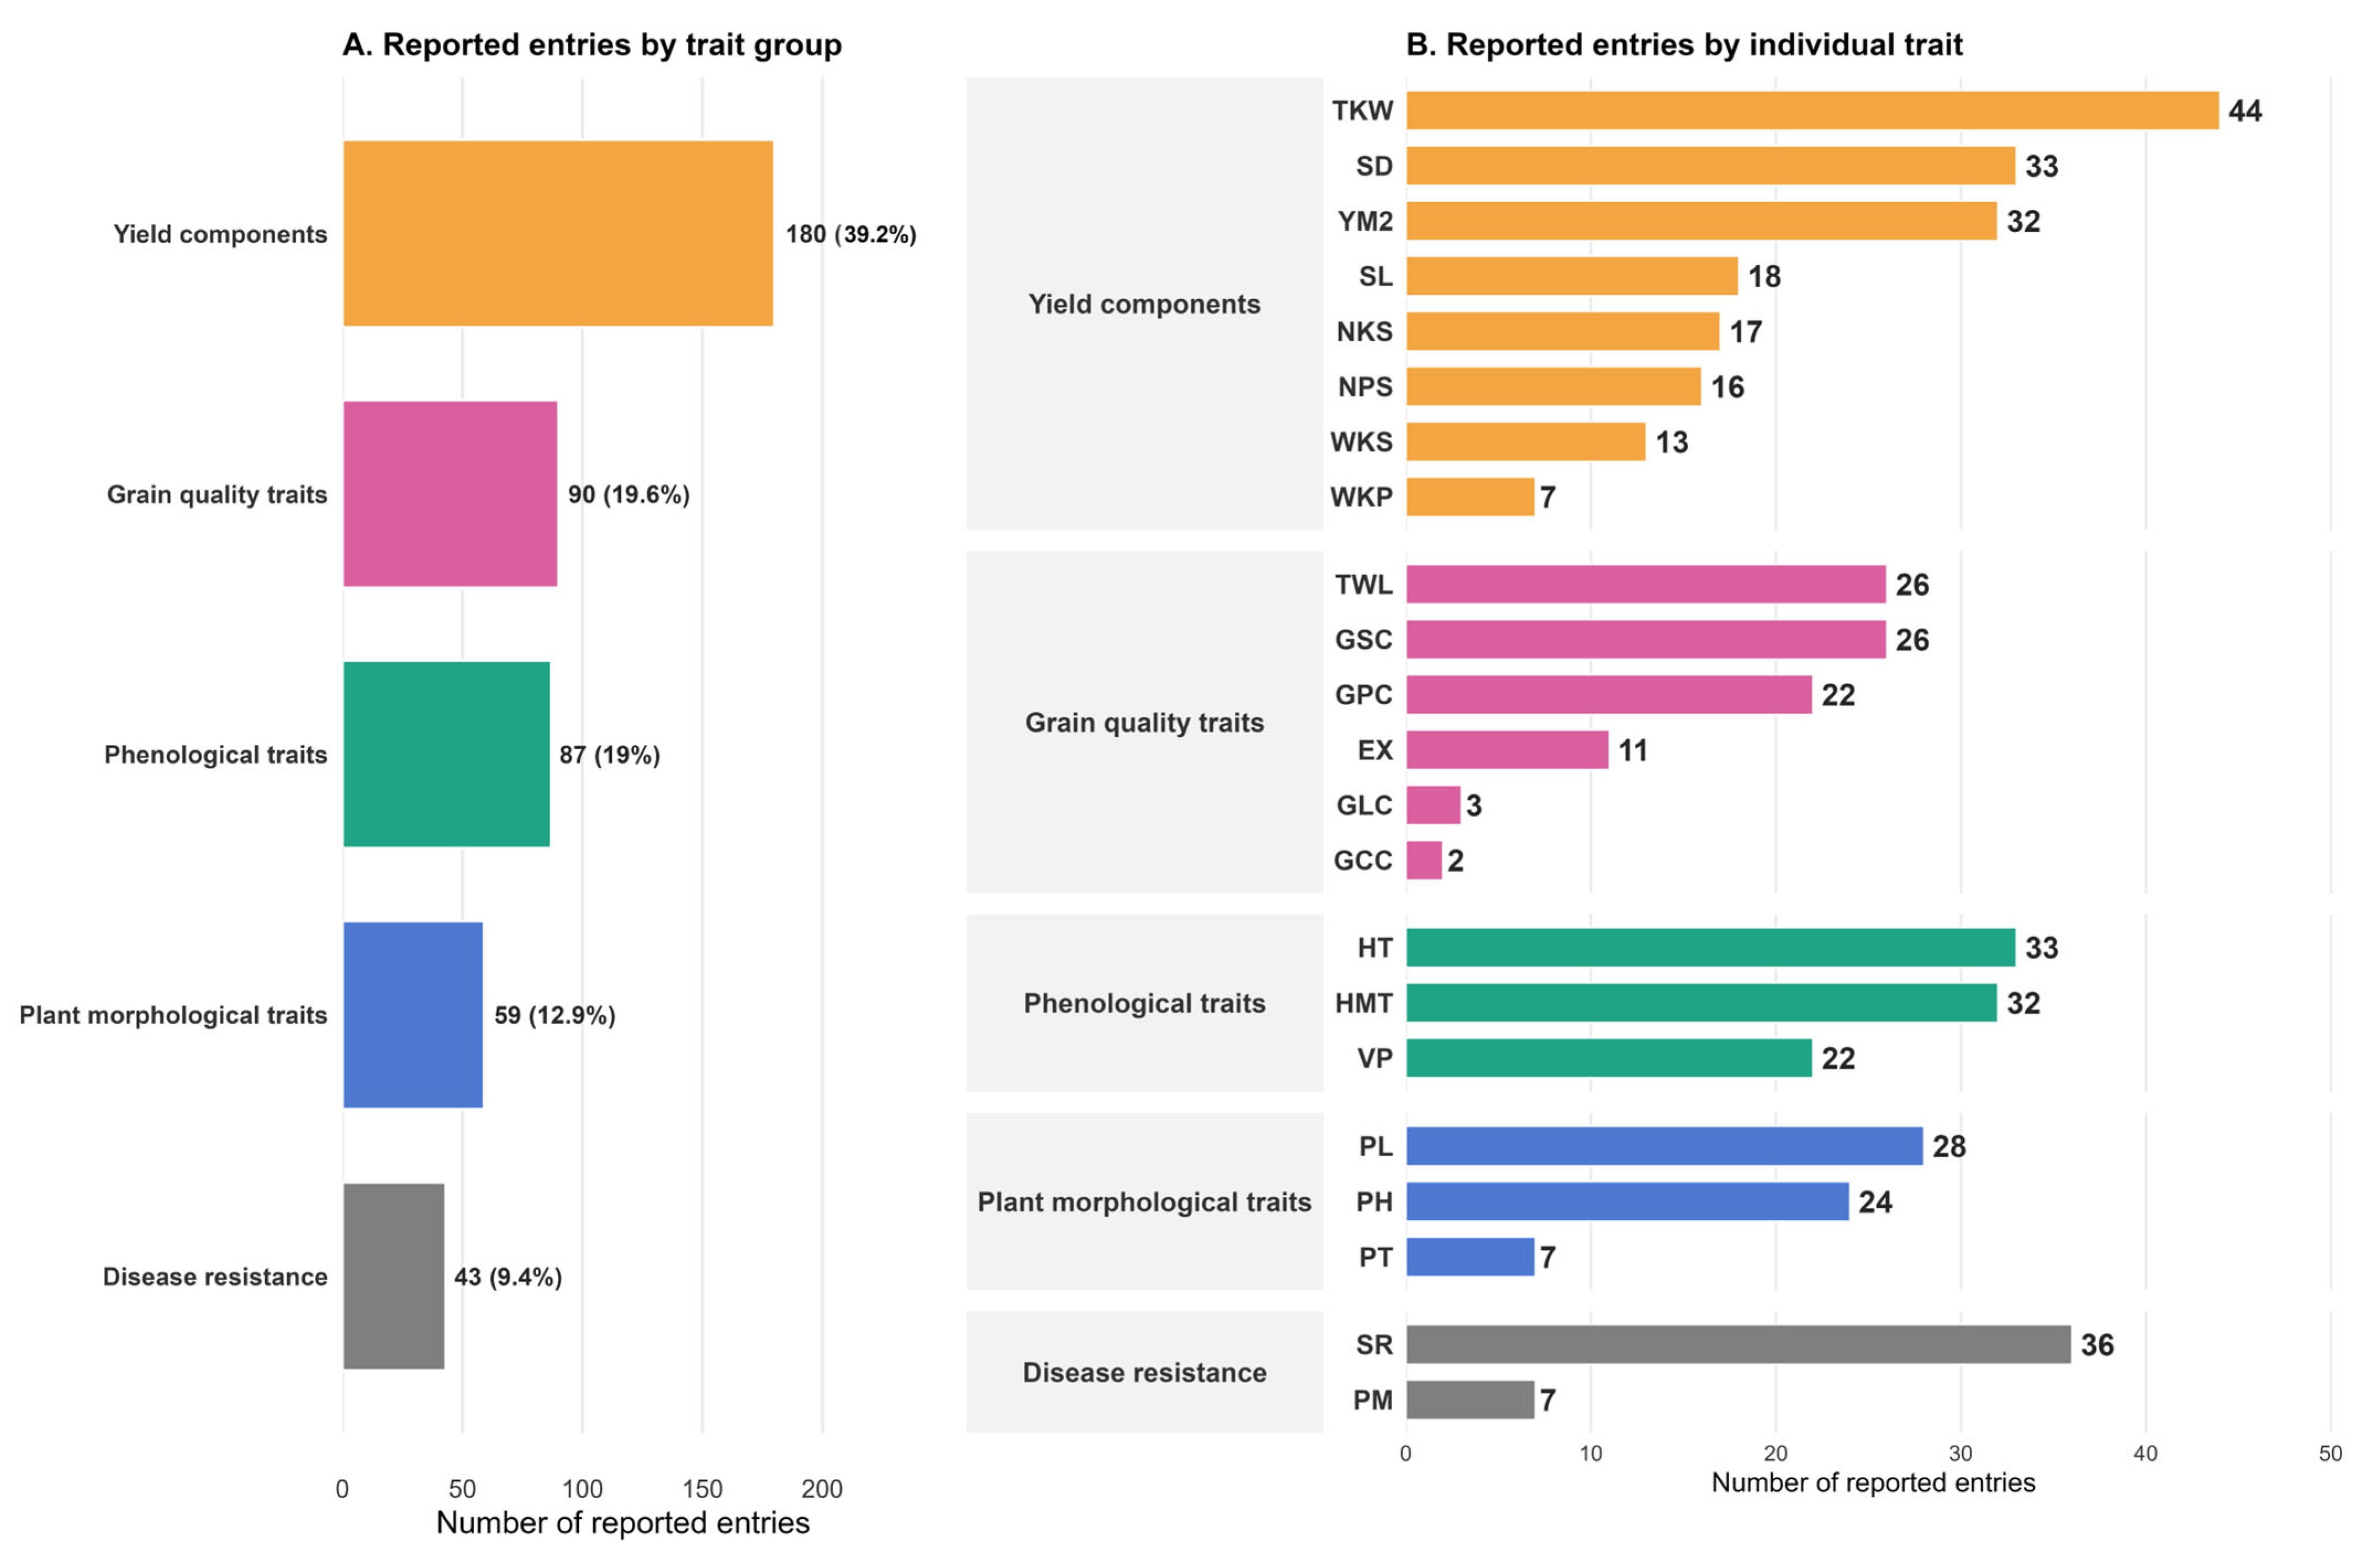

Disclaimer/Publisher’s Note: The statements, opinions and data contained in all publications are solely those of the individual author(s) and contributor(s) and not of MDPI and/or the editor(s). MDPI and/or the editor(s) disclaim responsibility for any injury to people or property resulting from any ideas, methods, instructions or products referred to in the content. |
© 2026 by the authors. Licensee MDPI, Basel, Switzerland. This article is an open access article distributed under the terms and conditions of the Creative Commons Attribution (CC BY) license.