


Abstract
Autumn overseeding with cool-season turfgrass species is a widely adopted practice under Mediterranean climatic conditions to mitigate winter dormancy and loss of green color in bermudagrass (Cynodon dactylon). This study evaluated, over two consecutive winter seasons (2022–2023 and 2023–2024), the performance of five cool-season turfgrass cultivars used for autumn overseeding on bermudagrass (‘Arden 15’) in Valencia, eastern Spain. The cultivars included Lolium multiflorum ‘Upstart’, Lolium perenne ‘CT7’ and ‘Sirtaky’, Poa pratensis ‘Liberator’, and Poa trivialis ‘Dasas’. Turf performance was assessed weekly from December to April using visual green color ratings, normalized difference vegetation index (NDVI) measured with two hand-held sensors (GreenSeeker and CropCircle), and normalized difference red edge index (NDRE). The area under the progress curve (AUPC) was calculated as an integrative indicator of turf performance over time. Winter temperature differences significantly influenced bermudagrass dormancy duration and overseeding response. Among the evaluated cultivars, ‘CT7’ consistently showed the highest winter greenness and vigor but exhibited a darker green color than bermudagrass, potentially reducing visual uniformity. The L. perenne ‘Sirtaky’ and P. pratensis ‘Liberator’ cultivars provided a closer chromatic match, although ‘Liberator’ established more slowly. The NDVI and NDRE measurements supported the visual assessments, though correlations between sensors varied among cultivars and seasons, with the GreenSeeker sensor detecting larger cultivar differences than the CropCircle sensor, particularly during colder winters. In addition, the AUPC proved to be an effective integrative metric for comparing cultivar performance over a defined period. Overall, overseeding effectively reduced winter discoloration of bermudagrass, with ‘Sirtaky’ emerging as the most balanced option for Mediterranean sports overseeding management on C. dactylon (‘Arden 15’).
1. Introduction
Sports fields are among the most intensively managed forms of vegetation in urban and recreational landscapes. They consist of dense and low-growing grasses specifically maintained to ensure safe, uniform, and resilient playing surfaces while also providing functional benefits such as soil stabilization and moderation of surface temperatures under intensive use [1,2]. In warm and dry regions with mild winters—typical of the Mediterranean climate—bermudagrass (Cynodon dactylon) is widely used because of its rapid growth, strong wear tolerance, and good adaptation to heat and moderate drought [3]. These traits make bermudagrass particularly suitable for sports fields and high-traffic public areas where durability is a priority.
However, bermudagrass also presents notable limitations in Mediterranean environments. The most important is winter dormancy, during which turf stops growing when temperatures reach 13 °C and loses its green color once they drop to 10 °C [4]. In addition, bermudagrass exhibits reduced performance under shaded conditions, further affecting visual quality and surface uniformity in shaded sports facilities [3]. To mitigate winter discoloration and maintain green turf cover, managers often implement cultural practices such as adjusting fertilization schedules, modifying mowing height, applying light irrigation, using growth regulators, using pigments, or overseeding with cool-season grasses [5,6,7].
Overseeding is one of the most widely adopted solutions, involving the sowing of cool-season grasses—most commonly perennial or annual ryegrass (Lolium perenne or L. multiflorum)—into bermudagrass turf in early autumn [7]. The cool-season grasses establish quickly and provide a green, dense winter playing surface while bermudagrass remains dormant. Overseeding can enhance winter color, improve turf density, and even sustain playability during the period of highest usage for many Mediterranean sports facilities [8].
Research carried out specifically in Mediterranean and Mediterranean-like climates has deepened the understanding of how overseeding performs under these conditions. Studies in Italy, Spain, and Turkey (southern Europe) show that species selection, cultivar traits, sowing timing, seed rate, and surface preparation all strongly influence establishment and winter quality [9,10,11,12]. For example, comparative trials of multiple cool-season species and cultivars have reported large differences in germination speed, early winter color, mowing quality, and persistence, demonstrating that not all ryegrasses perform equally when overseeded onto bermudagrass in Mediterranean conditions [11]. Other studies indicate that sowing too early increases competition with still-active bermudagrass, while sowing too late reduces establishment due to cooler soil temperatures [10].
These findings indicate that overseeding functions as an integrated turf management system whose effectiveness depends on adaptation to local conditions, including temperature patterns, field use intensity, and soil characteristics. Furthermore, the spring transition—the period when cool-season grasses decline and bermudagrass resumes growth—remains a delicate phase. Strategies such as reducing spring fertility, increasing mowing height, or lightly scalping the turf can facilitate a smoother transition [7]. Ongoing research in Mediterranean climates continues to refine these practices, aiming to balance winter performance with minimal long-term impact on bermudagrass health. Together, the accumulated evidence suggests that overseeding is a valuable and well-researched tool for maintaining high-quality turf surfaces during Mediterranean winters.
The present study evaluated, over two consecutive years in Valencia (eastern Spain), the performance of five cool-season turfgrass cultivars (Lolium multiflorum Lam., Lolium perenne L., Poa pratensis L., and Poa trivialis L.) used for autumn overseeding on bermudagrass (‘Arden 15’). Green color, normalized difference vegetation index (NDVI), and normalized difference red edge index (NDRE) were compared across cultivars from December to April. While NDVI reflects vegetative health of the upper canopy, it may underestimate status in dense turf or high leaf area index conditions [13]. Alternatively, NDRE, incorporating a red-edge band, penetrates deeper into the canopy, providing a more accurate assessment of overall turf vigor [13]. This study also evaluated the consistency of NDVI measurements from two devices and the suitability of the area under the progress curve (AUPC) as an integrative turf quality index. This approach identifies cultivars with the highest winter vigor and visual performance, offering practical guidance for Mediterranean turf management.
2. Material and Methods
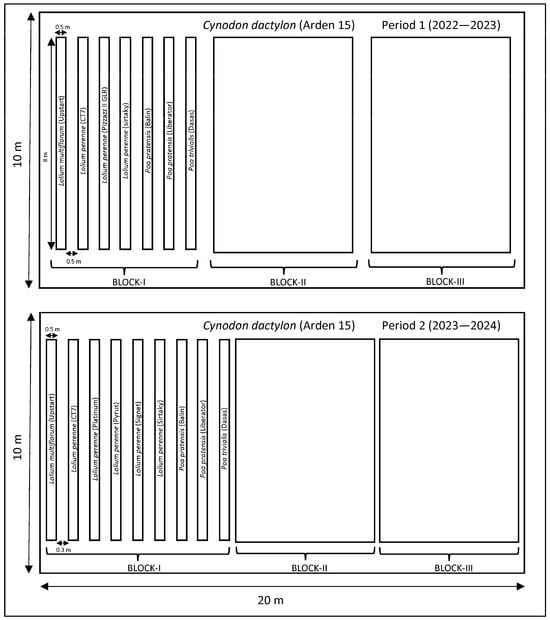
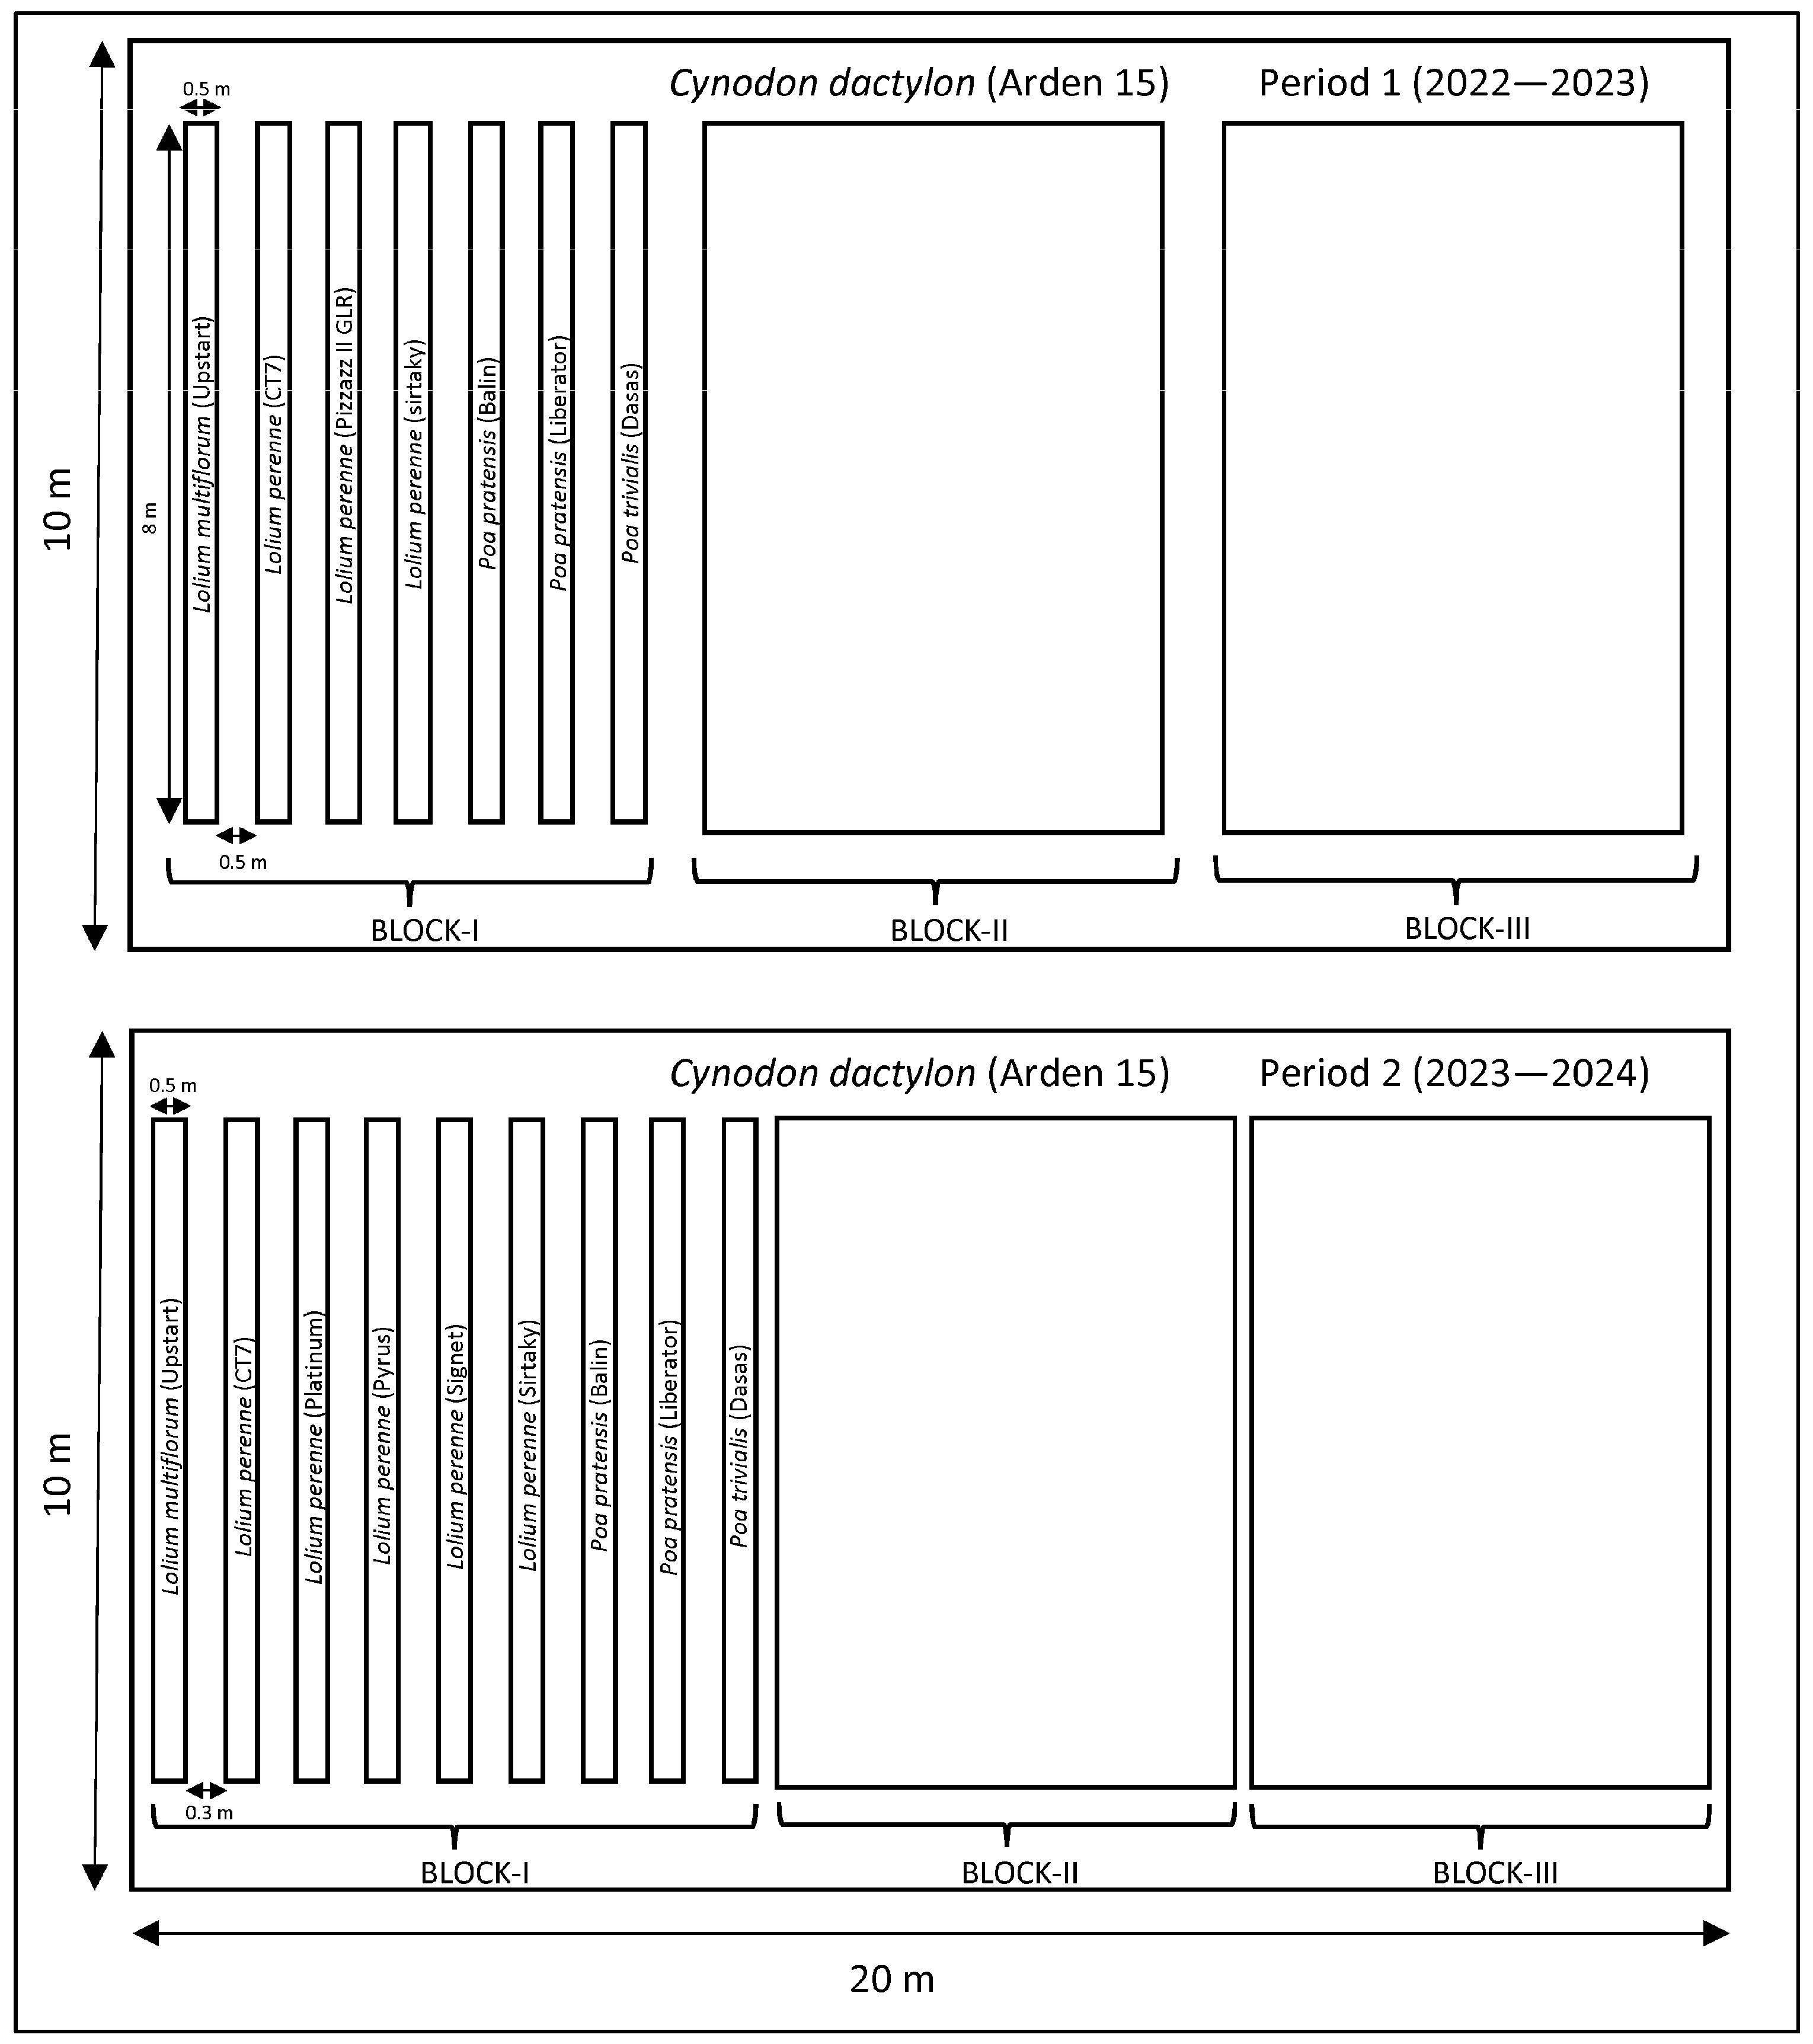
A field trial was conducted in the research farm of the Polytechnical University of Valencia, Valencia, Spain (39°48′ N, 0°34′ W; 5 m asl), to assess the performance of five cool-season turfgrass cultivars overseeded on bermudagrass from December to May during two consecutive periods. The temperature in the experimental site is shown in Table 1, and the soil was an alluvial soil, Calcaric Fluvisols, according to the World Reference Base [14], characterized by a sandy loam texture consisting of 76.7% sand, 13.3% silt, and 10% clay, with only 3% stones. It was alkaline (pH 8.5, 1:2.5 soil/water suspension) and non-saline (EC 0.167 dS m−1, 1:5 soil/water suspension), with low organic matter (2.49%) measured by the wet oxidation method using potassium dichromate in a sulfuric acid medium and a medium content of carbonates (29.6% CaCO3). Bermudagrass (‘Arden 15’) was sown in June 2022 at 10 g·m−2 in a 220 m2 (22 m × 10 m) plot. Subsequently, it was overseeded on 17 November 2022 and 9 November 2023, using different plots each year, with one L. multiflorum cultivar (‘Upstart’) at 80 g·m−2; two L. perenne cultivars (‘CT7’ and ‘Sirtaky’) at 80 g·m−2; one P. pratensis cultivar (‘Liberator’) at 40 g·m−2; and one P. trivialis L. cultivar (‘Dasas’) at 40 g·m−2. The overseeded cultivars were sown in 4 m2 plots (8 m × 0.5 m) with three replicates, using a Ryan 54873-R overseeder (Schiller Grounds Care Inc., Johnson Creek, WI, USA). The experimental design was a randomized complete block design (Figure 1).
Table 1.
Monthly mean air temperatures over the study period at the Polytechnic University of Valencia research farm in Valencia, eastern Spain (39°48′ N; 0°34′ W; 5 m asl).
Figure 1.
Plot layout of two overseeding experiments conducted at the research farm of the Polytechnical University of Valencia, Valencia, Spain (39°48′ N, 0°34′ W; 5 m asl).
Throughout the experimental period, standard turfgrass cultural practices were applied. Irrigation was supplied as needed, fertilization was performed monthly during the growing season with a 24-5-11 + 3CaO complex fertilizer (Sportsmaster CRF Mini High N, AICL, Barcelona, Spain) at 30 g·m−2, and turf was mowed once or twice per week at a height of 3–4 cm with a rotatory mower (Sterwins GCV160, ADEO Services, Ronchin, France). All plots were evaluated weekly: (i) green color on a visual 1–9 scale, with 1 being a light green color and 9 being a dark green color [15,16]; (ii) NDRE index was determined by a CropCircle (CC) sensor, ACS 430 (Holland Scientific, Lincoln, NE, USA), collecting values from 0.00 to 1.00; (iii) NDVI was determined using two different hand-held devices, which were a GreenSeeker (GS) sensor, Model 505 (Trimble Crop., Sunnyville, CA, USA), and the CC sensor, which produces NDVI values ranging from 0.00 to 1.00. Statistical analyses were performed in R version 4.3.2 (Copyright© 2022 by Posit Software, PBC, Boston, MA, USA). A Student’s t-test was applied to compare the temperature between two consecutive periods month by month. The area under the progress curve (AUPC) was calculated using the agricolae [17] package. Data processing and organization were carried out using the dplyr [18] and tidyr [19] packages, and figures were generated with ggplot2 [20]. Finally, all the parameters’ mean comparisons were performed with repeated measures analysis of variance (ANOVA), predictmeans [21] for Fisher’s protected least significance difference test at p = 0.05, and ggstatsplot [22] for obtaining the Pearson’s correlation coefficient between evaluated parameters.
3. Results
The temperature regime differed between the two periods of this study. As shown in Table 1, in the first period, December was, in terms of mean temperature, 2 °C warmer than the second period, whereas January and February in the first period were 4 °C cooler than in the second period. A Student’s t-test (Table 2) was conducted to verify that the two periods differed in terms of temperature. The results indicated that both the mean and minimum temperatures for December, January, and February were significantly different between the two periods. As a result, the analysis of the data obtained in this research is separated into the two periods.
Table 2.
Results of Student’s t-tests comparing the means of temperature between the two periods. A positive value means that the first period was warmer than the second period (* p < 0.05; ** p < 0.01; *** p < 0.001; ns: not significant at the 0.05 probability level).
3.1. Turfgrass Green Color
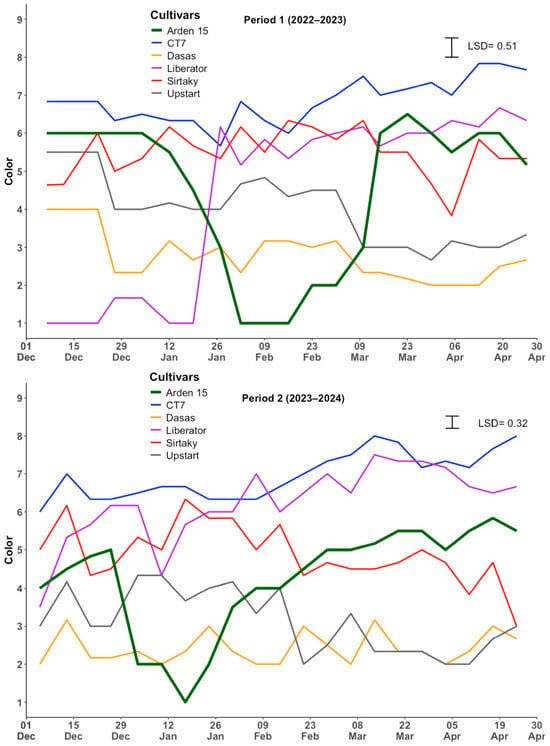
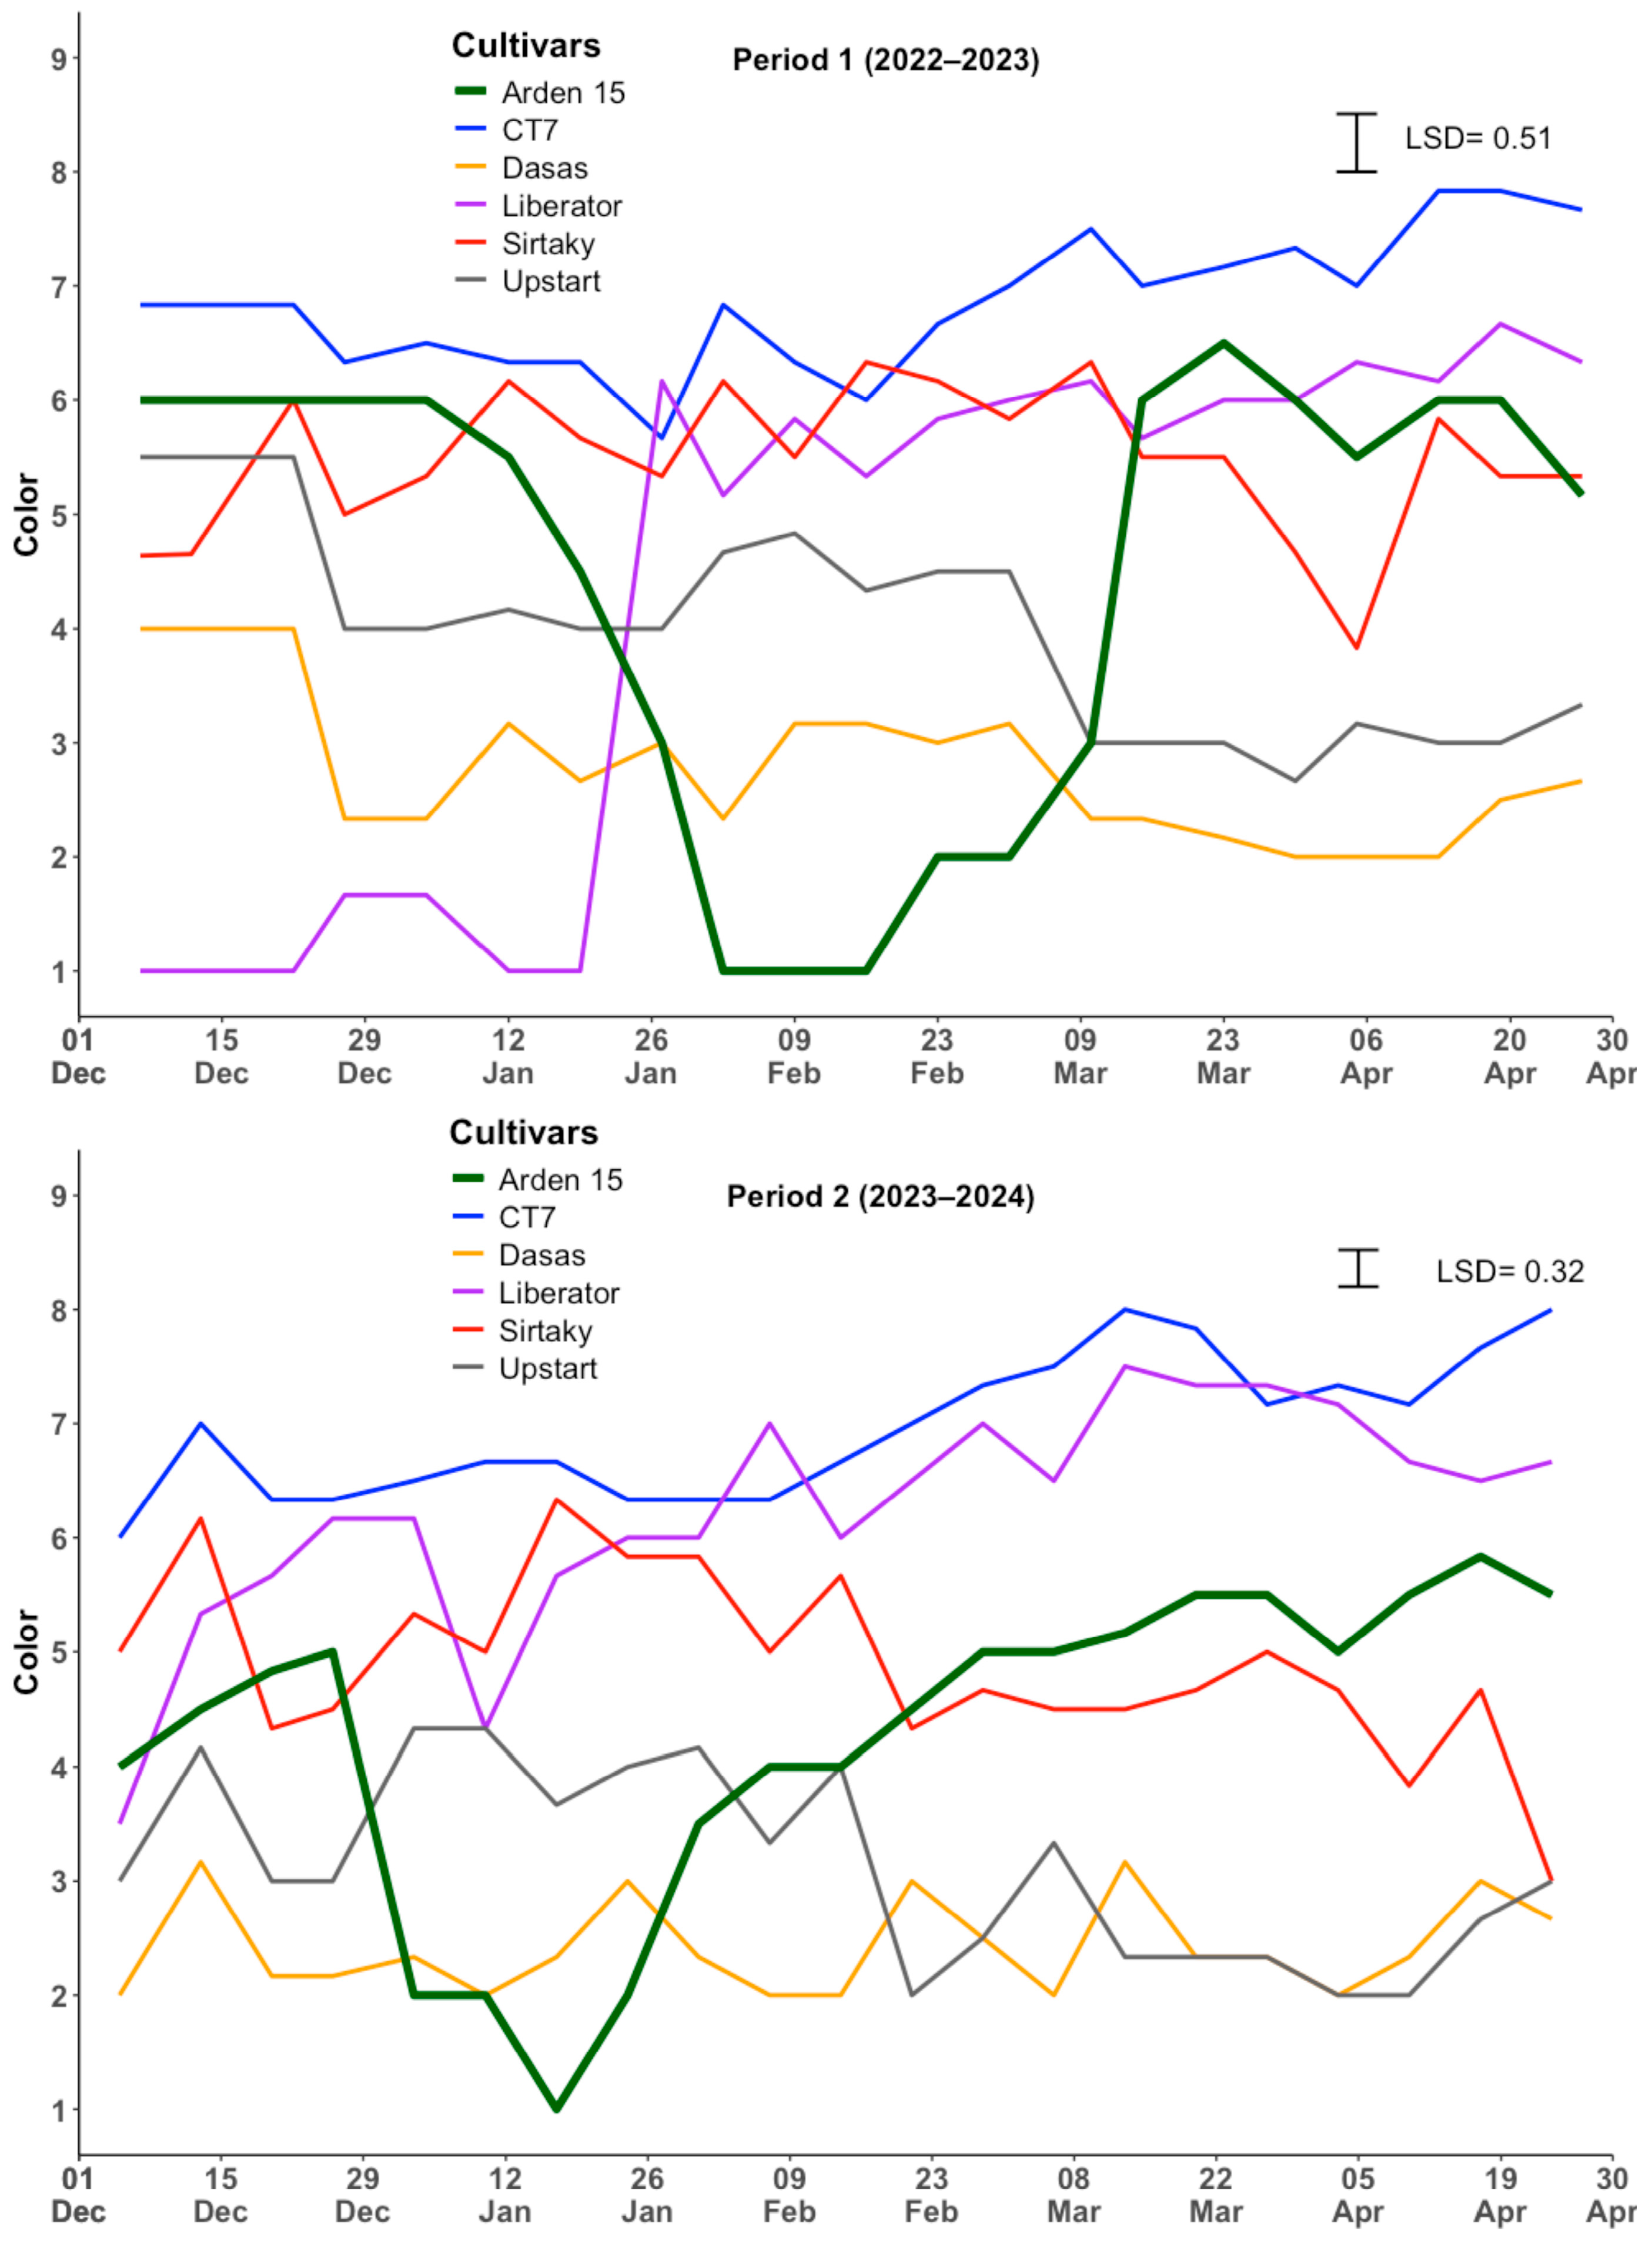
The temporal evolution of the green color of each overseeded cultivar and the bermudagrass cultivar is shown in Figure 2. During the first period, Arden 15 began with a green color of 6. As temperatures declined in January, its green color progressively decreased until reaching a minimum value of 1, marking the onset of its complete dormancy period. This dormancy lasted from late January to mid-February during the first period. As temperatures began to rise, in late February, Arden 15 initiated the spring green-up and recovered its characteristic green color of 6. Cool-season overseeded cultivars exhibited a different behavior. The CT7 cultivar started with a green color of 7 and maintained its dark green color throughout the entire period, even reaching a rating of 8, thereby replacing Arden 15’s color during its dormancy (Figure 2, Period 1). The Sirtaky cultivar started with a rating of 5 and reached approximately 6 during Arden 15’s loss of color; but after the spring green-up, Sirtaky’s color decreased below that of Arden 15. Initially, the Liberator cultivar struggled to establish itself, but once it did, it replaced Arden 15’s color with a rating of 6 and continued with this color during the whole period of this study. In contrast, Dasas and Upstart cultivars did not replace Arden 15’s color at any time, reaching values around 3 and 4, respectively. Moreover, their color decreased further as temperatures increased.
Figure 2.
Green color evolution of five different turfgrass cultivars overseeded on bermudagrass (Arden 15) during two periods. Vertical bars represent the least significant differences (p = 0.05) for comparing means.
In the second period (Figure 2, Period 2), the cultivar’s performance patterns changed due to a warmer winter than in the first period. Arden 15 began with a rating of 4 and increased to 5 before losing color at the end of December. In this period, Arden 15 entered dormancy in mid-January, but one week later, the spring green-up started. It recovered its natural green color at the beginning of March. The CT7 and Sirtaky cultivars again showed similar behavior to the previous period, maintaining their color, with 6.5 and 5.5, respectively, during the dormancy period of Arden 15, while Liberator established earlier than in the first period and reached a rating of 6 during Arden 15’s dormancy period, even increasing to 7 at certain points. All these cultivars replaced Arden 15’s color during its loss of green color. As in the previous period, Dasas and Upstart displayed the same pattern. The Dasas cultivar maintained its color, with a rating between 2 and 3 throughout the entire study, while Upstart showed a color rating of 4 during the dormancy period, which decreased to 2 when temperatures increased.
3.2. NDRE Index
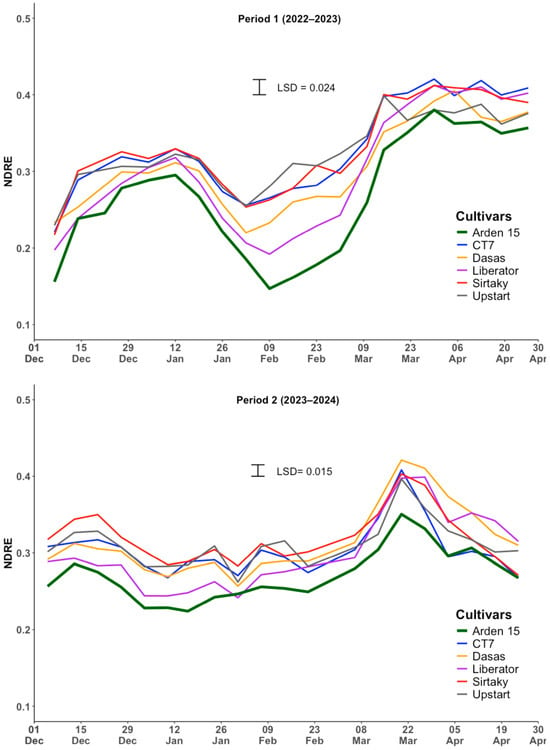
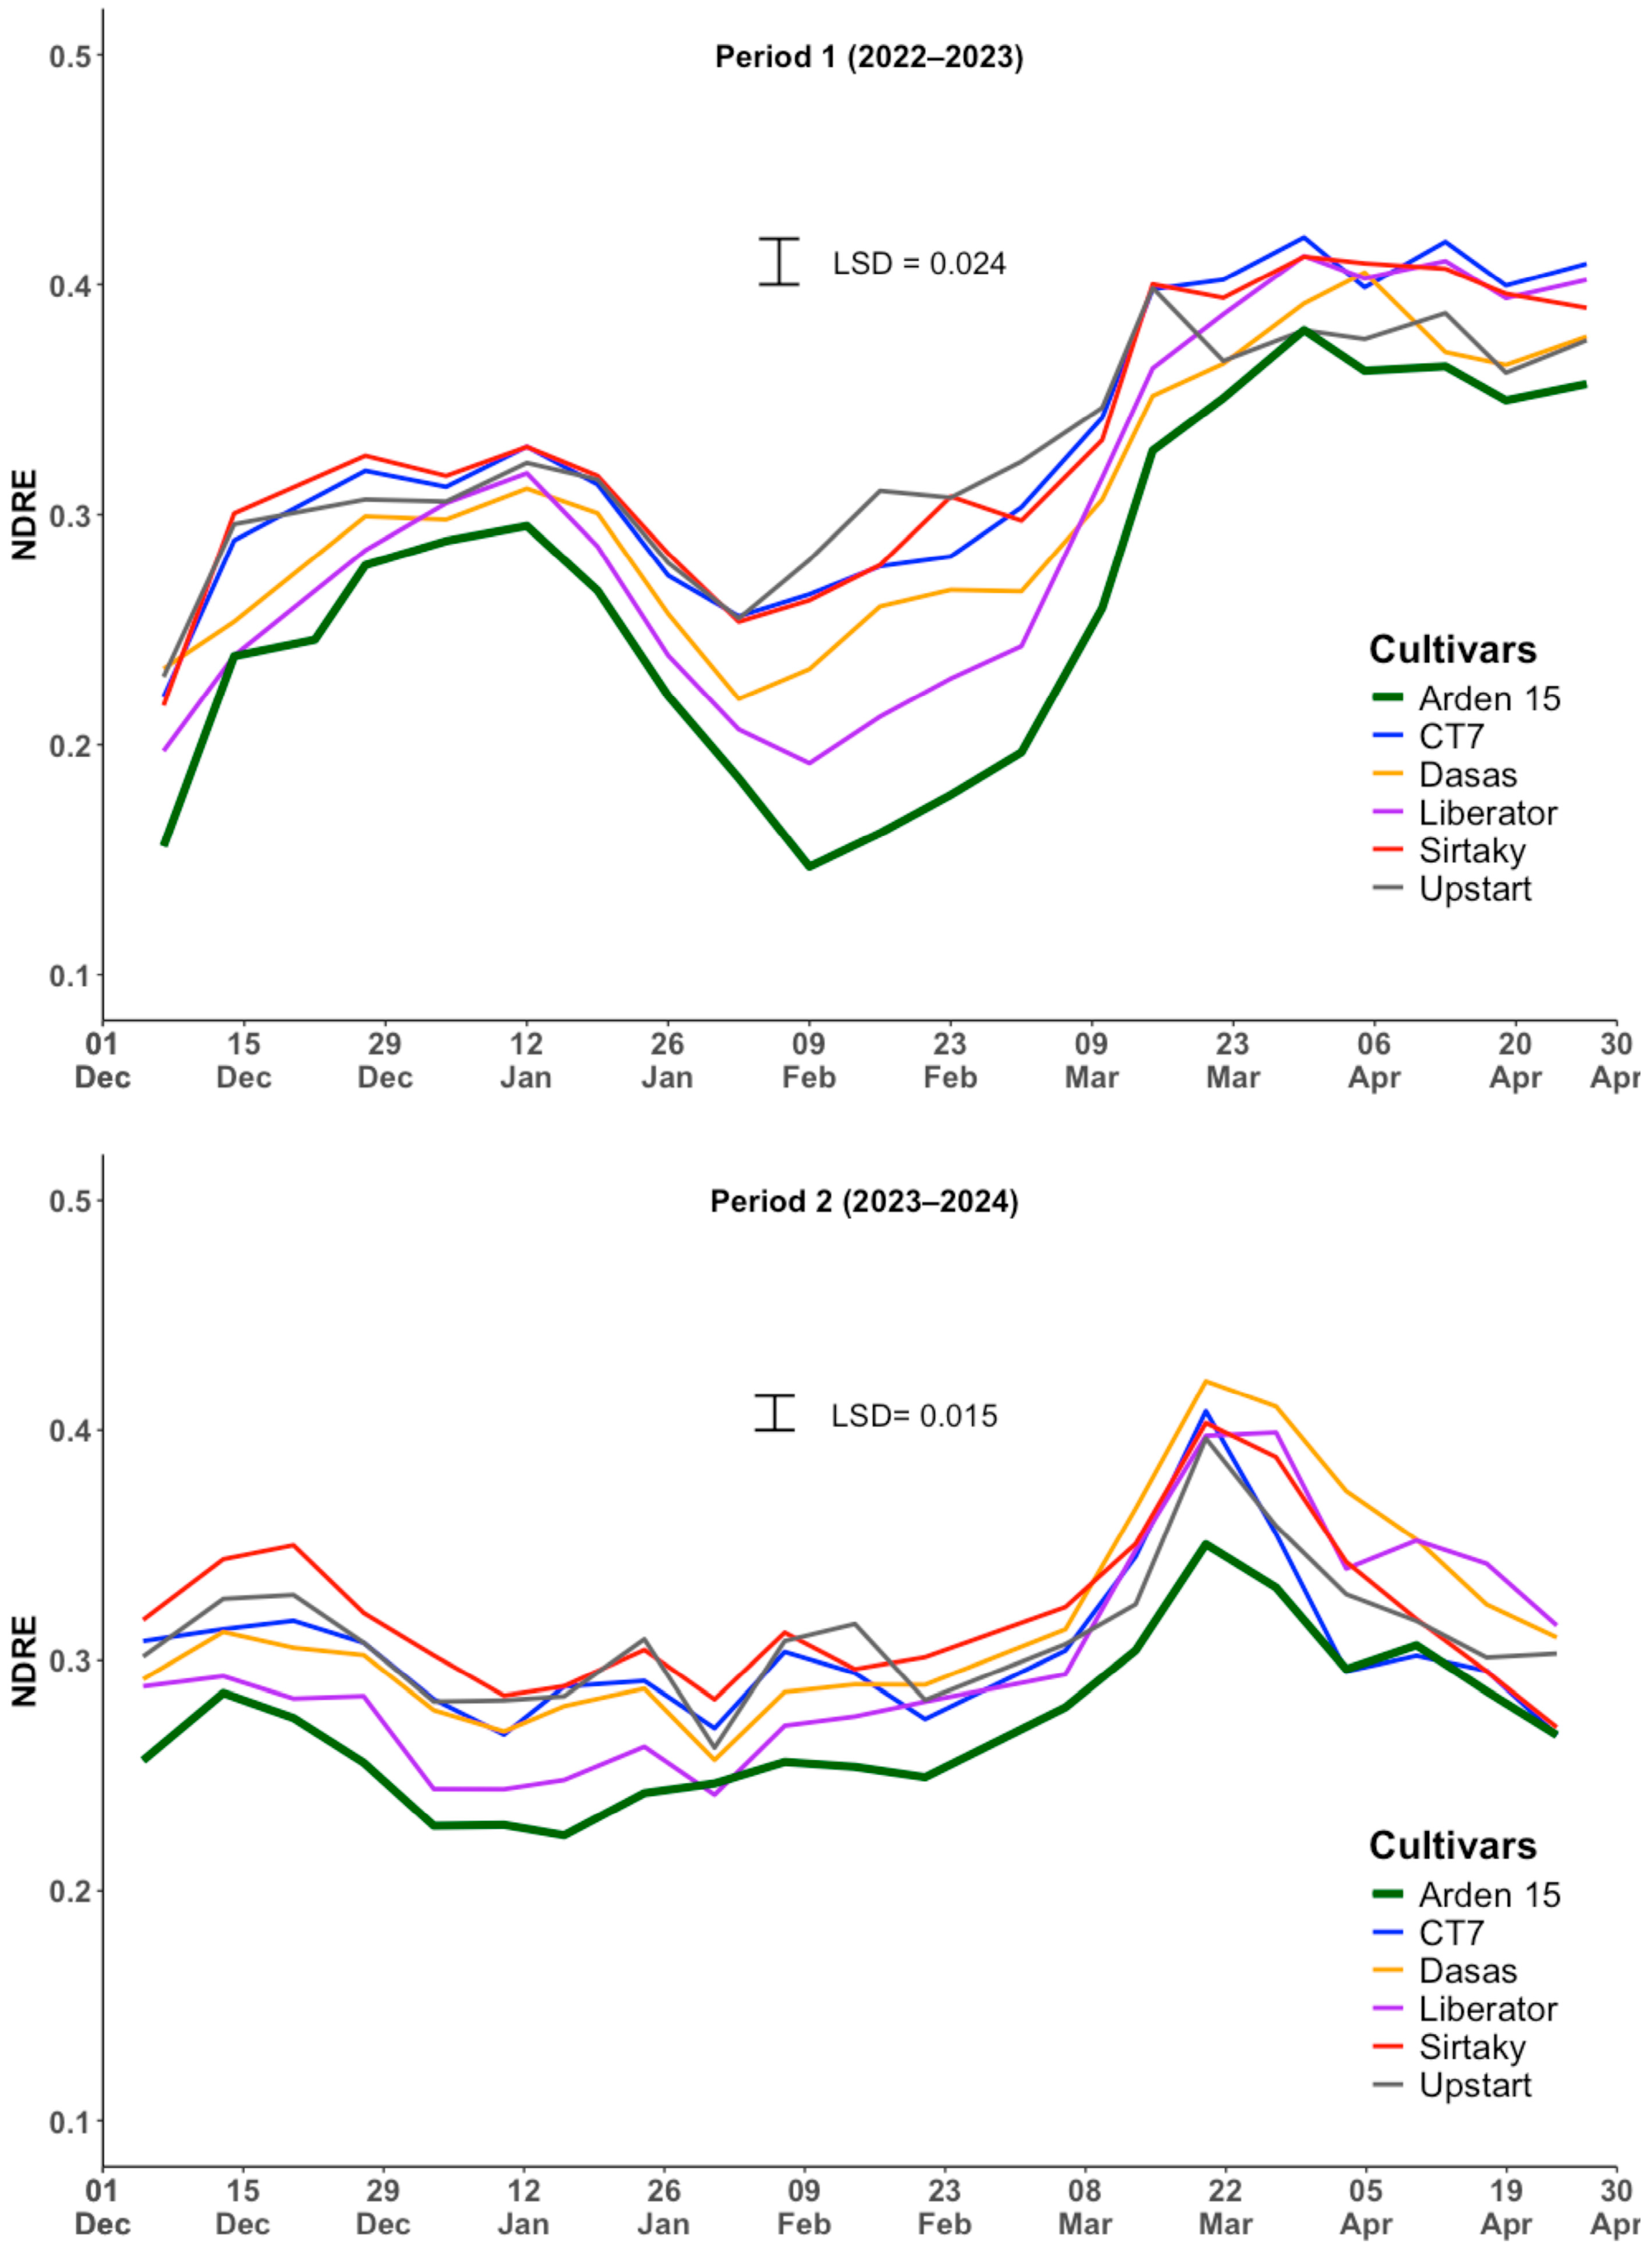
The temporal evolution of the NDRE index for the five overseeded cultivars and the bermudagrass cultivar is presented in Figure 3. During the first period, Arden 15 exhibited an initial NDRE value of 0.15, which increased progressively to 0.29 by early January. From mid-January, coinciding with decreasing temperatures, NDRE values declined, reaching a minimum of 0.14 at the beginning of February. As temperatures subsequently increased, Arden 15 initiated the spring green-up, with NDRE values rising to 0.37 by mid-March and remaining stable thereafter until the end of the evaluation period. Throughout this period, the NDRE values of the overseeded cultivars consistently exceeded those of Arden 15 and showed minimal differences among themselves. The only exception was Liberator, which differed from Arden 15 solely during the latter’s dormancy phase. During the winter months, the overseeded cultivars maintained NDRE values near 0.30. However, with the onset of spring, the NDRE index values of CT7, Sirtaky and Liberator increased to approximately 0.40, showing significant differences relative to Arden 15, while Dasas and Sirtaky increased to 0.37, the same as Arden15.
Figure 3.
Normalized difference red edge index (NDRE) evolution of five different turfgrass cultivars overseeded on bermudagrass (Arden 15) using the CropCircle (CC) during two periods. Vertical bars represent the least significant differences (p = 0.05) for comparing means.
In the second period (Figure 3, Period 2), NDRE values exhibited reduced variability during the winter. As in the first period, Arden 15 maintained lower NDRE values than the overseeded cultivars, remaining near 0.25 until spring green-up, when its values increased to 0.33. Liberator also showed lower NDRE values than the other cultivars during winter, around 0.26, similar to Arden 15, with no detectable differences between them. The remaining cultivars sustained NDRE values around 0.3 until the spring green-up. NDRE values of all overseeded cultivars increased to 0.4 in response to rising temperatures, displaying differences relative to Arden 15.
3.3. NDVI by GreenSeeker
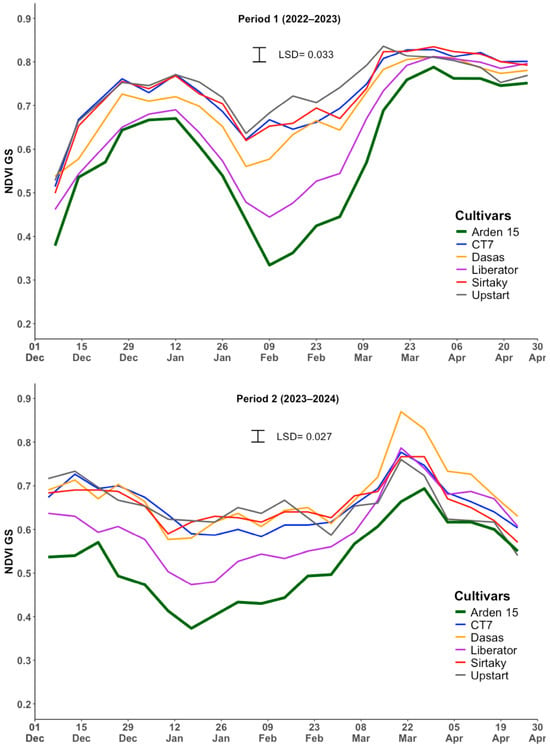
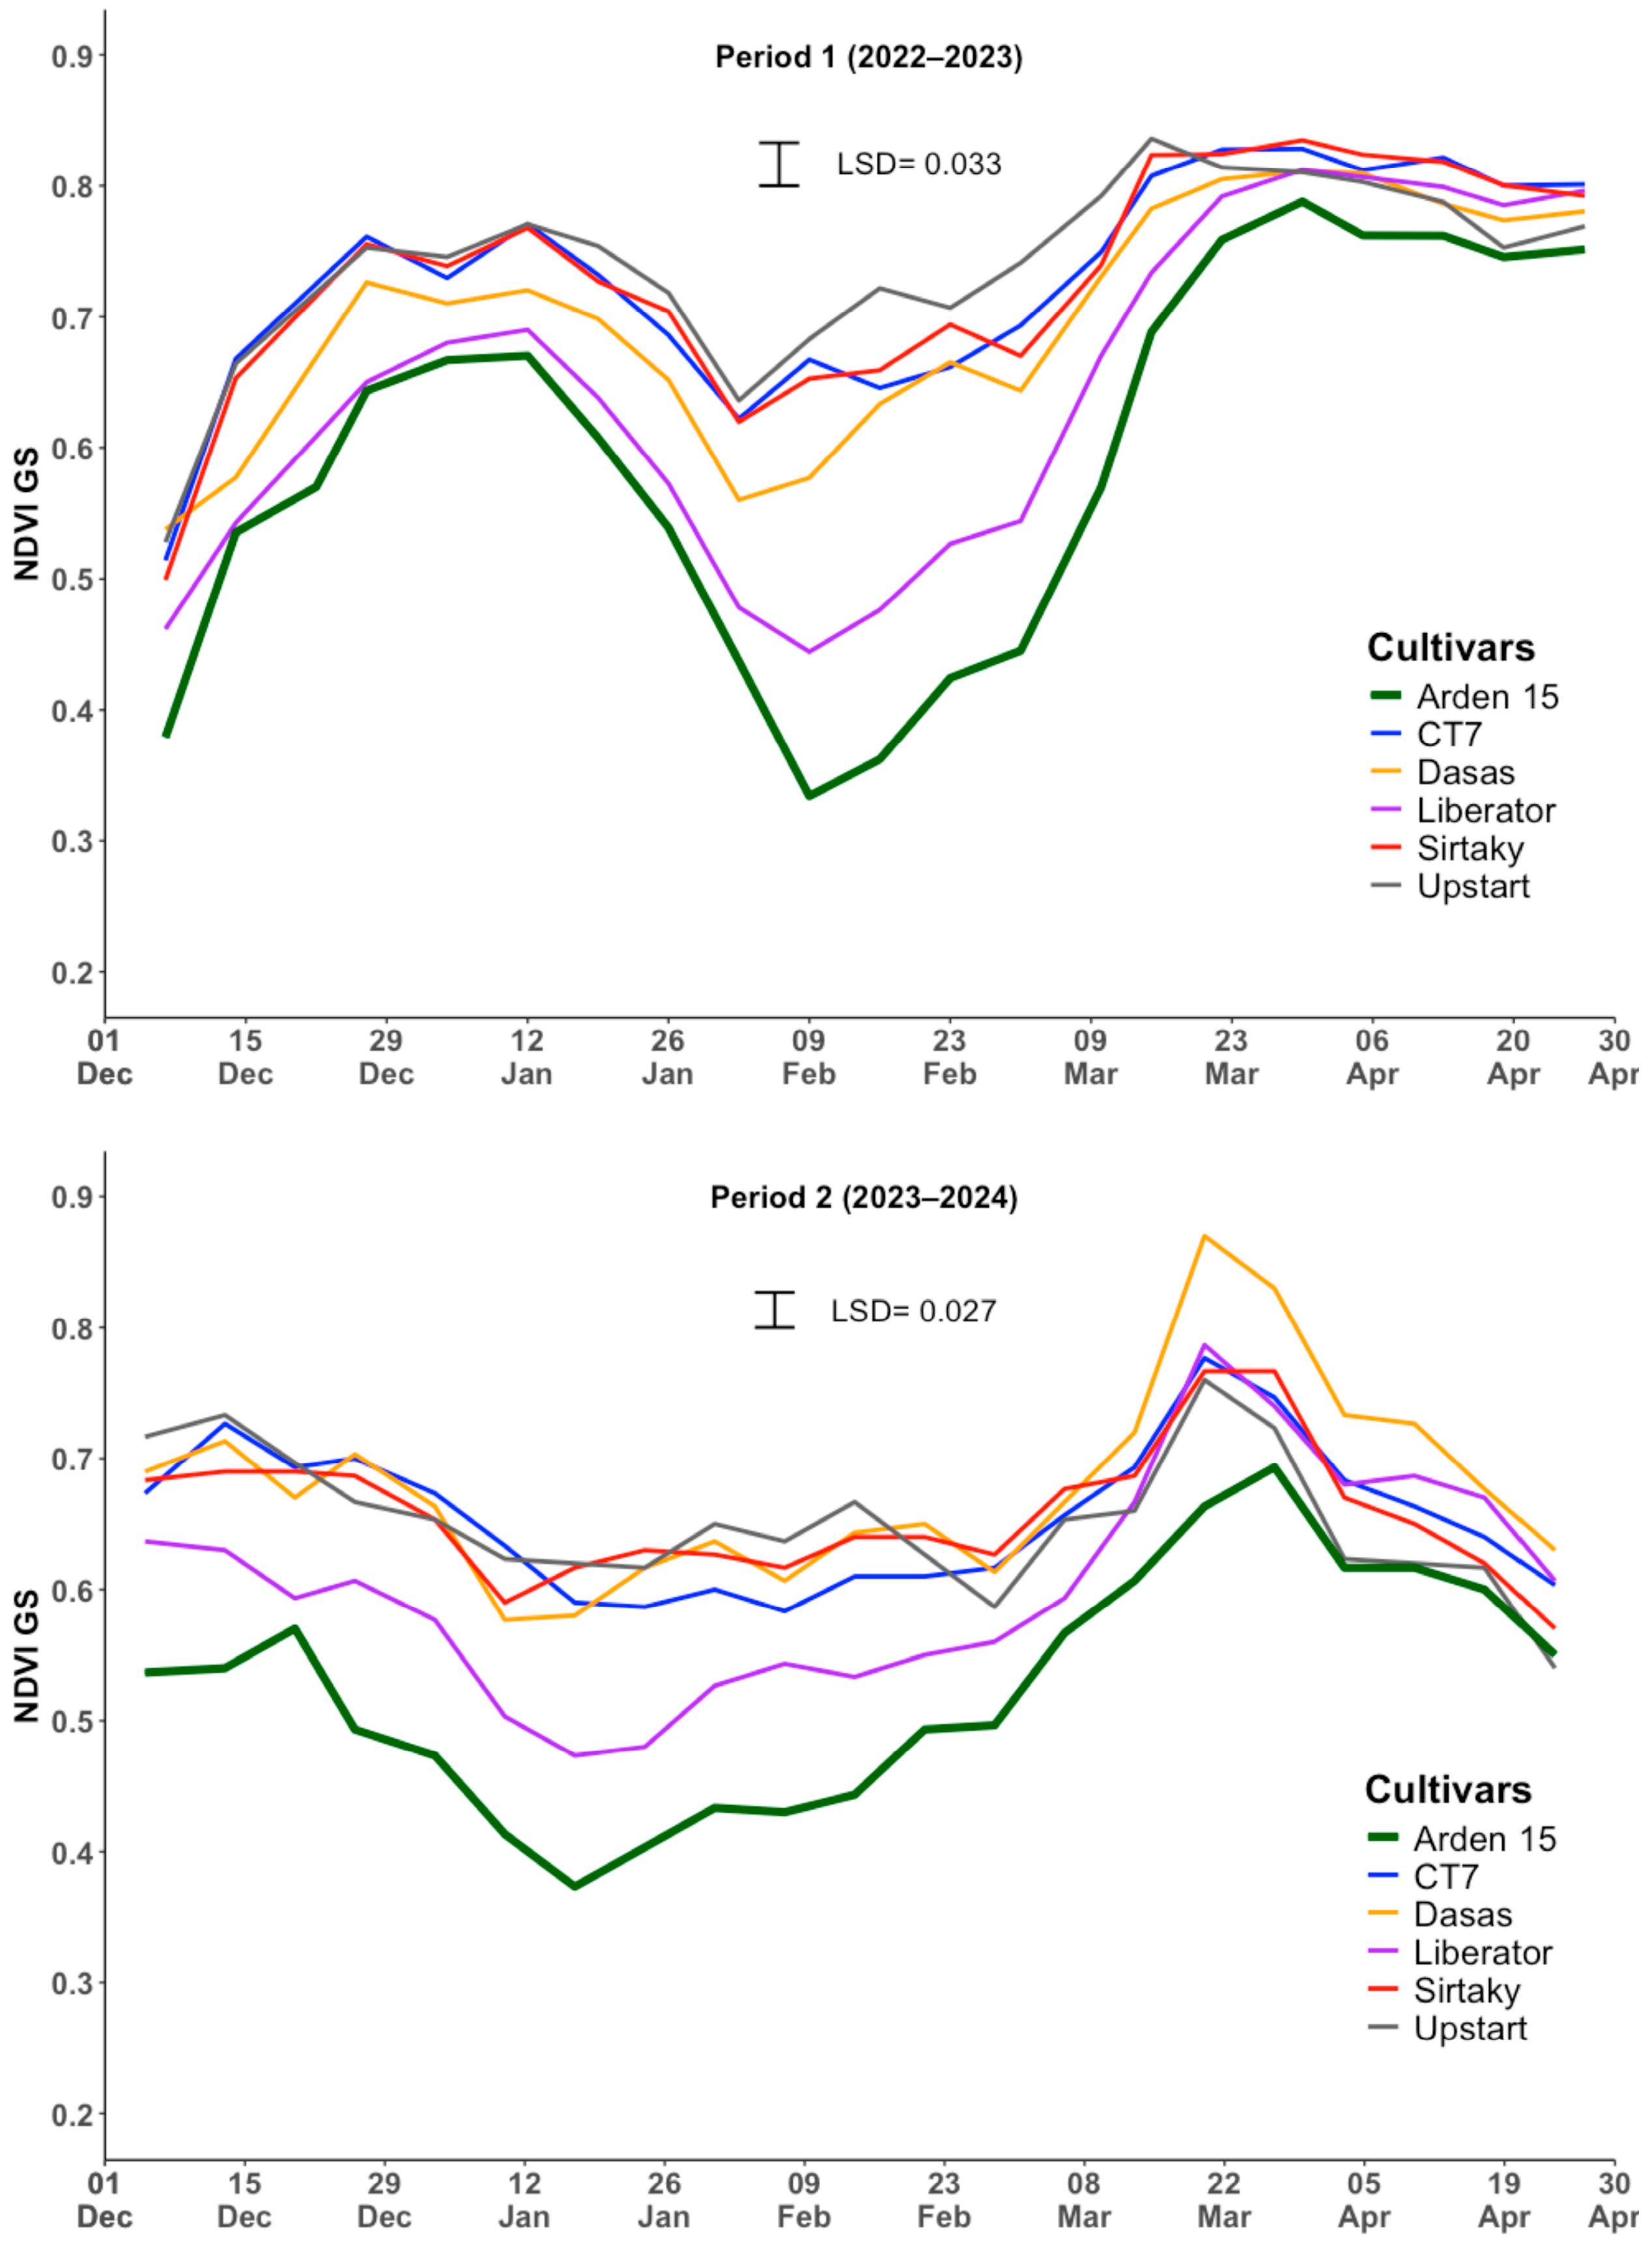
The evolution of the NDVI with the GS sensor is shown in Figure 4. During December of the first period, Arden 15 gradually increased the NDVI value until it reached 0.5. Once the low temperatures arrived, the NDVI of Arden 15 began to decrease until it reached a value of 0.3 in February, entering into a dormancy period. This dormancy lasted a couple of weeks until the temperature rose. With that increase in temperature, it started the spring green-up, reaching NDVI values around 0.7 at the end of March. Liberator had a similar performance to Arden 15 but with NDVI values roughly 0.1 higher. The remaining cultivars (CT7, Dasas, Sirtaky, and Upstart) performed similarly among themselves, outperforming Arden 15 and Liberator. At the beginning of the period, Sirtaky started at 0.55, Dasas started at around 0.7, and CT7 and Upstart started above 0.6. Throughout the rest of the period, all cultivars maintained NDVI values near 0.7. As temperatures rose, Arden 15 and Liberator also reached 0.7, showing no differences compared to the other cultivars.
Figure 4.
Normalized difference vegetation index (NDVI) evolution of five different turfgrass cultivars overseeded on bermudagrass (Arden 15) using the GreenSeeker (GS) sensor during two periods. Vertical bars represent the least significant differences (p = 0.05) for comparing means.
In contrast, during the second period (Figure 4, Period 2), the cultivars showed more uniform performance than in the first period, with only minor differences among them. Arden 15 started with NDVI values around 0.55, which decreased below 0.4 under low temperatures, entering a short dormancy period. This dormancy began in mid-January and lasted only one week. The spring green-up during this period was gradual, with Arden 15 reaching NDVI values above 0.6 by mid-March. Liberator behaved similarly to the previous period, maintaining NDVI values roughly 0.1 higher than Arden 15. The rest of the cultivars, however, exhibited similar NDVI values around 0.7 throughout the period. By the end of winter, all cultivars had comparable NDVI values, although Arden 15 remained approximately 0.1 lower than the overseeded cultivars.
3.4. NDVI by CropCircle
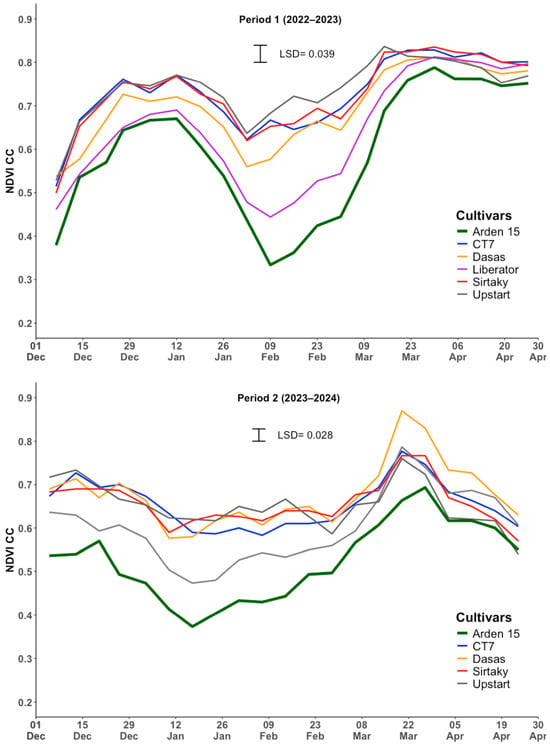
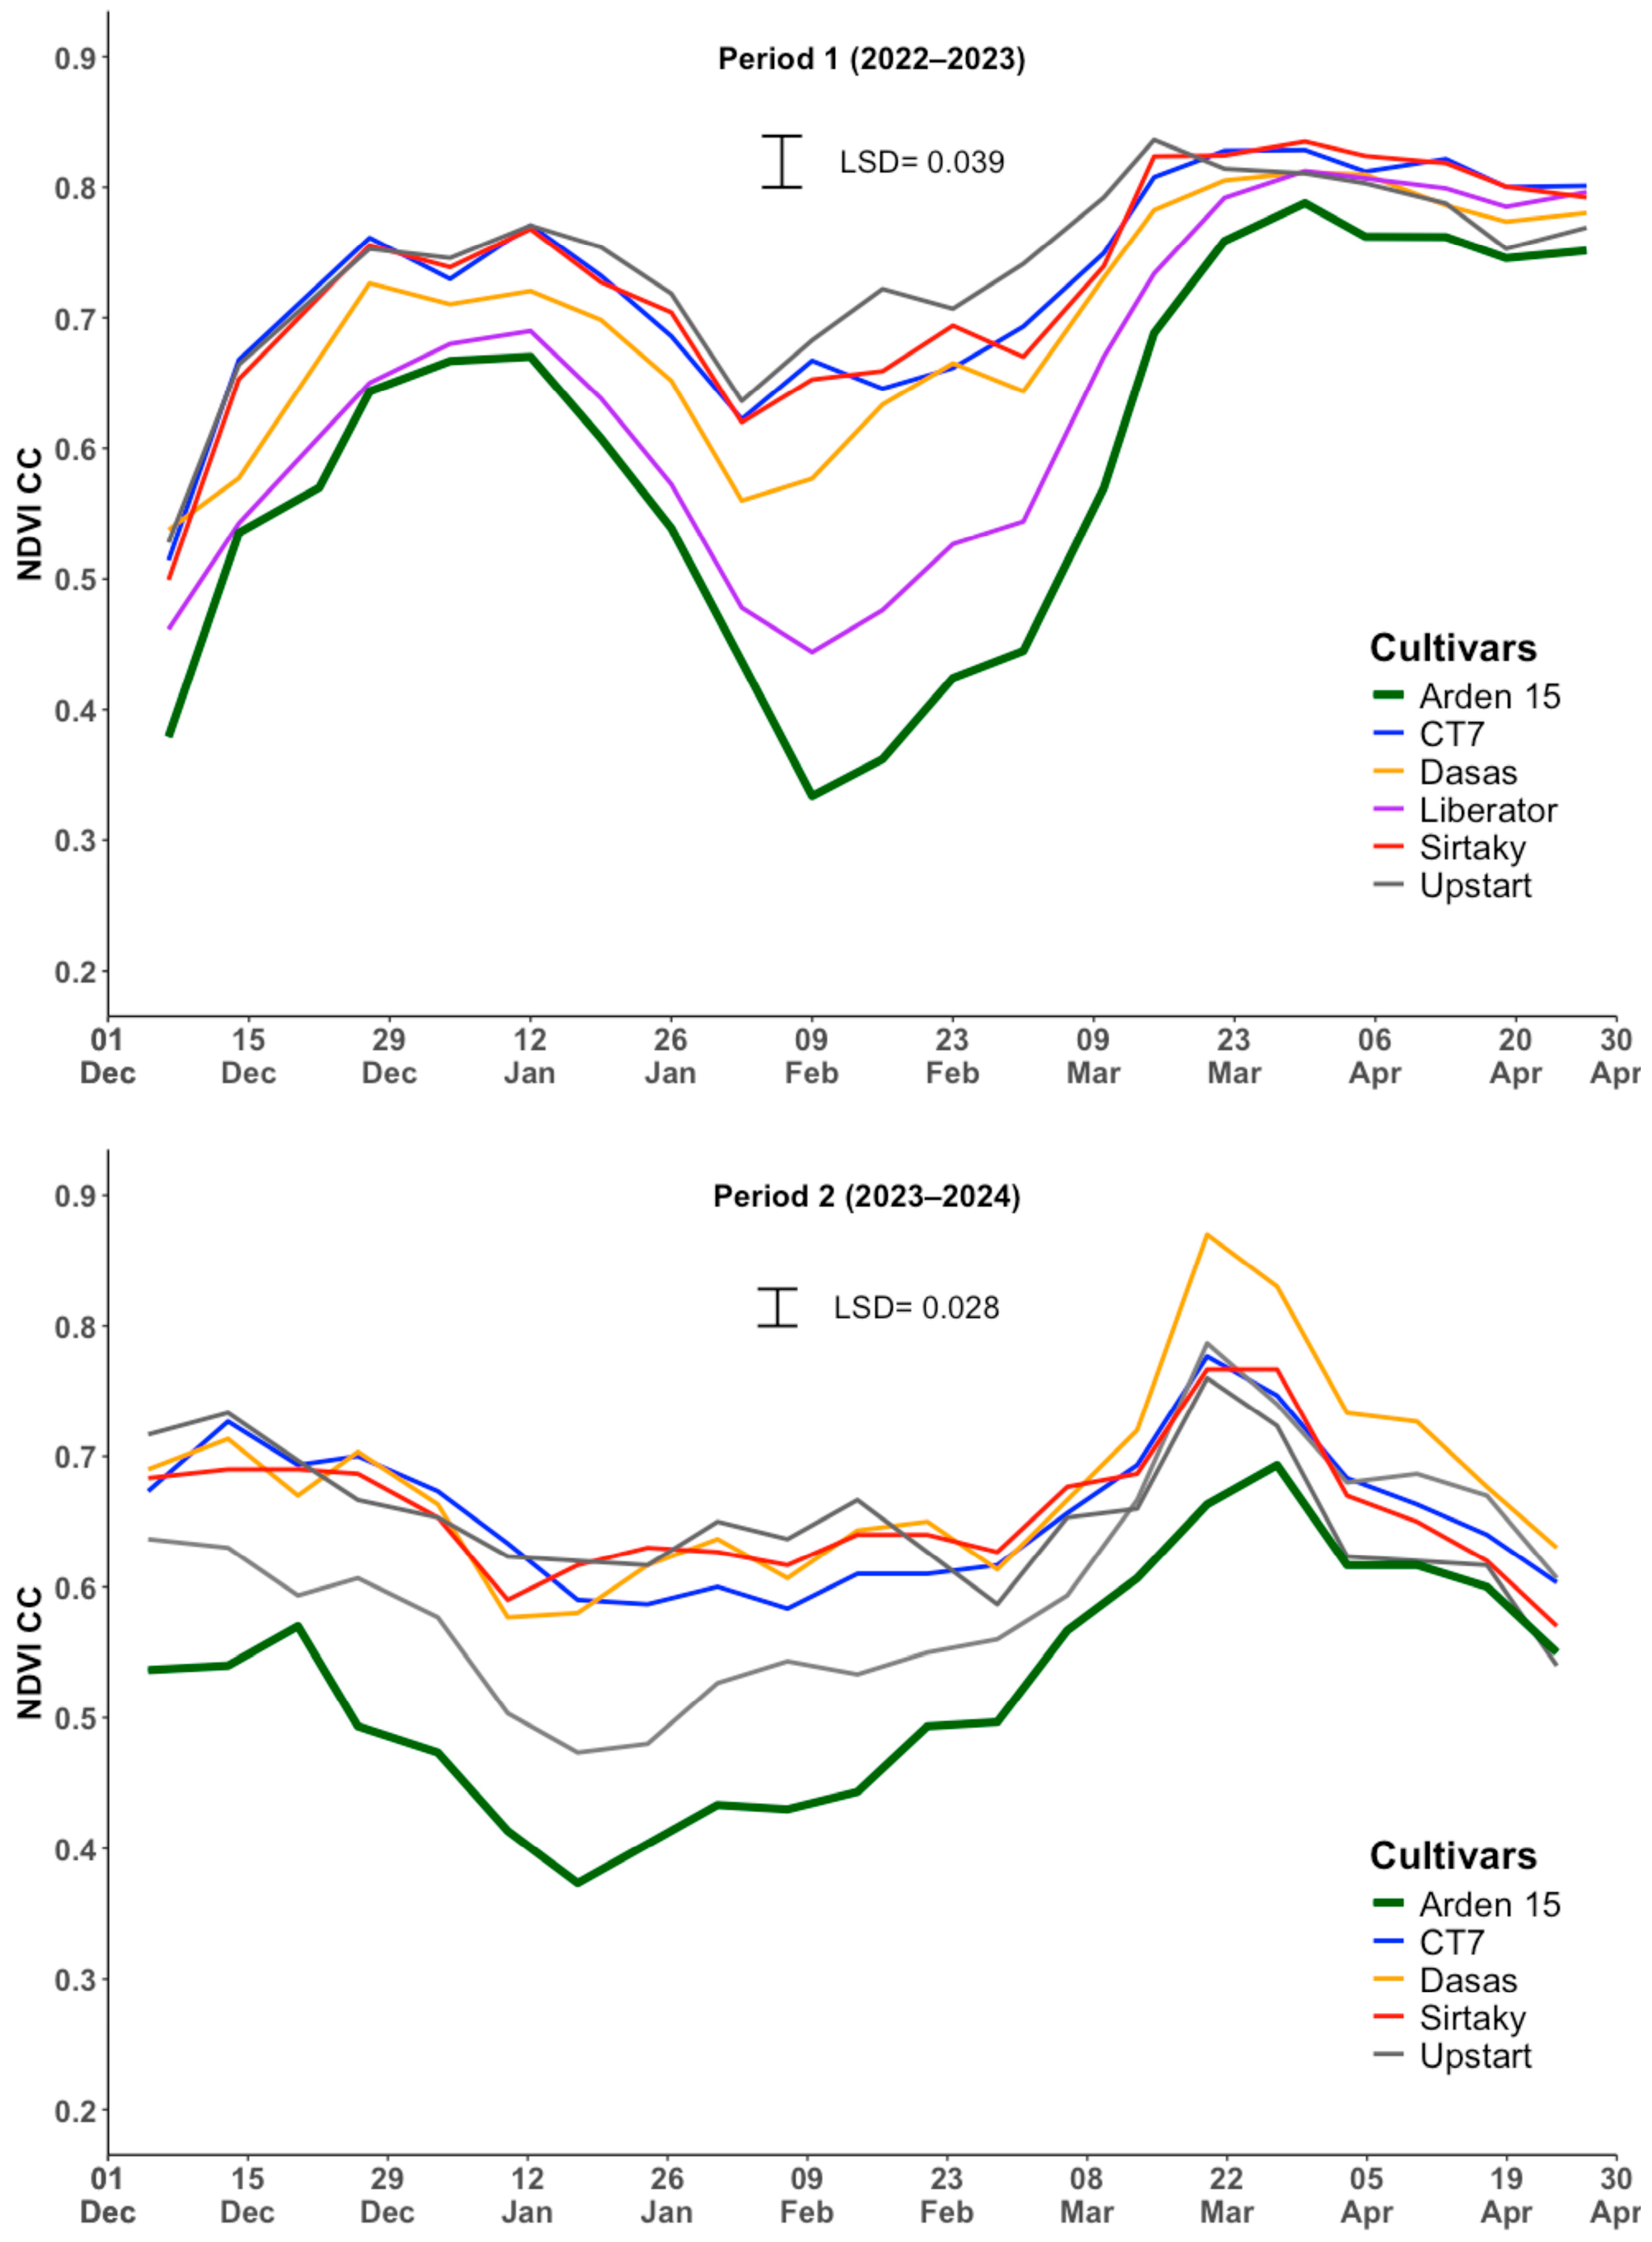
The evolution of NDVI measured with the CC sensor (Figure 5) showed that, in the first period, Arden 15 exhibited values similar to those obtained with the GS sensor, while differences were mainly observed among the other cultivars. Liberator showed no difference compared to Arden 15 until dormancy, after which its NDVI values were over 0.1 higher than Arden 15. The remaining cultivars followed similar trends, starting around 0.5 and increasing to approximately 0.7 during winter. By early spring, all NDVI values converged below 0.8, indicating that Arden 15 was establishing again and effectively competing with the other cultivars.
Figure 5.
Normalized difference vegetation index (NDVI) evolution of five different turfgrass cultivars overseeded on bermudagrass (Arden 15) using the CropCircle (CC) sensor during 2 periods. Vertical bars represent the least significant differences (p = 0.05) for comparing means.
In the second period (Figure 5, Period 2), the pattern differed. NDVI values for Arden 15 and Liberator remained near 0.5 for most of the period. After the spring green-up, NDVI values rose to 0.6 by mid-March, with Liberator approximately 0.1 higher than Arden 15. The other cultivars followed similar trends, maintaining values around 0.6 throughout the evaluated period. Overall, NDVI values increased by 0.1 for all cultivars by mid-March, highlighting the difference with Arden 15.
3.5. NDVI Pearson’s Correlation
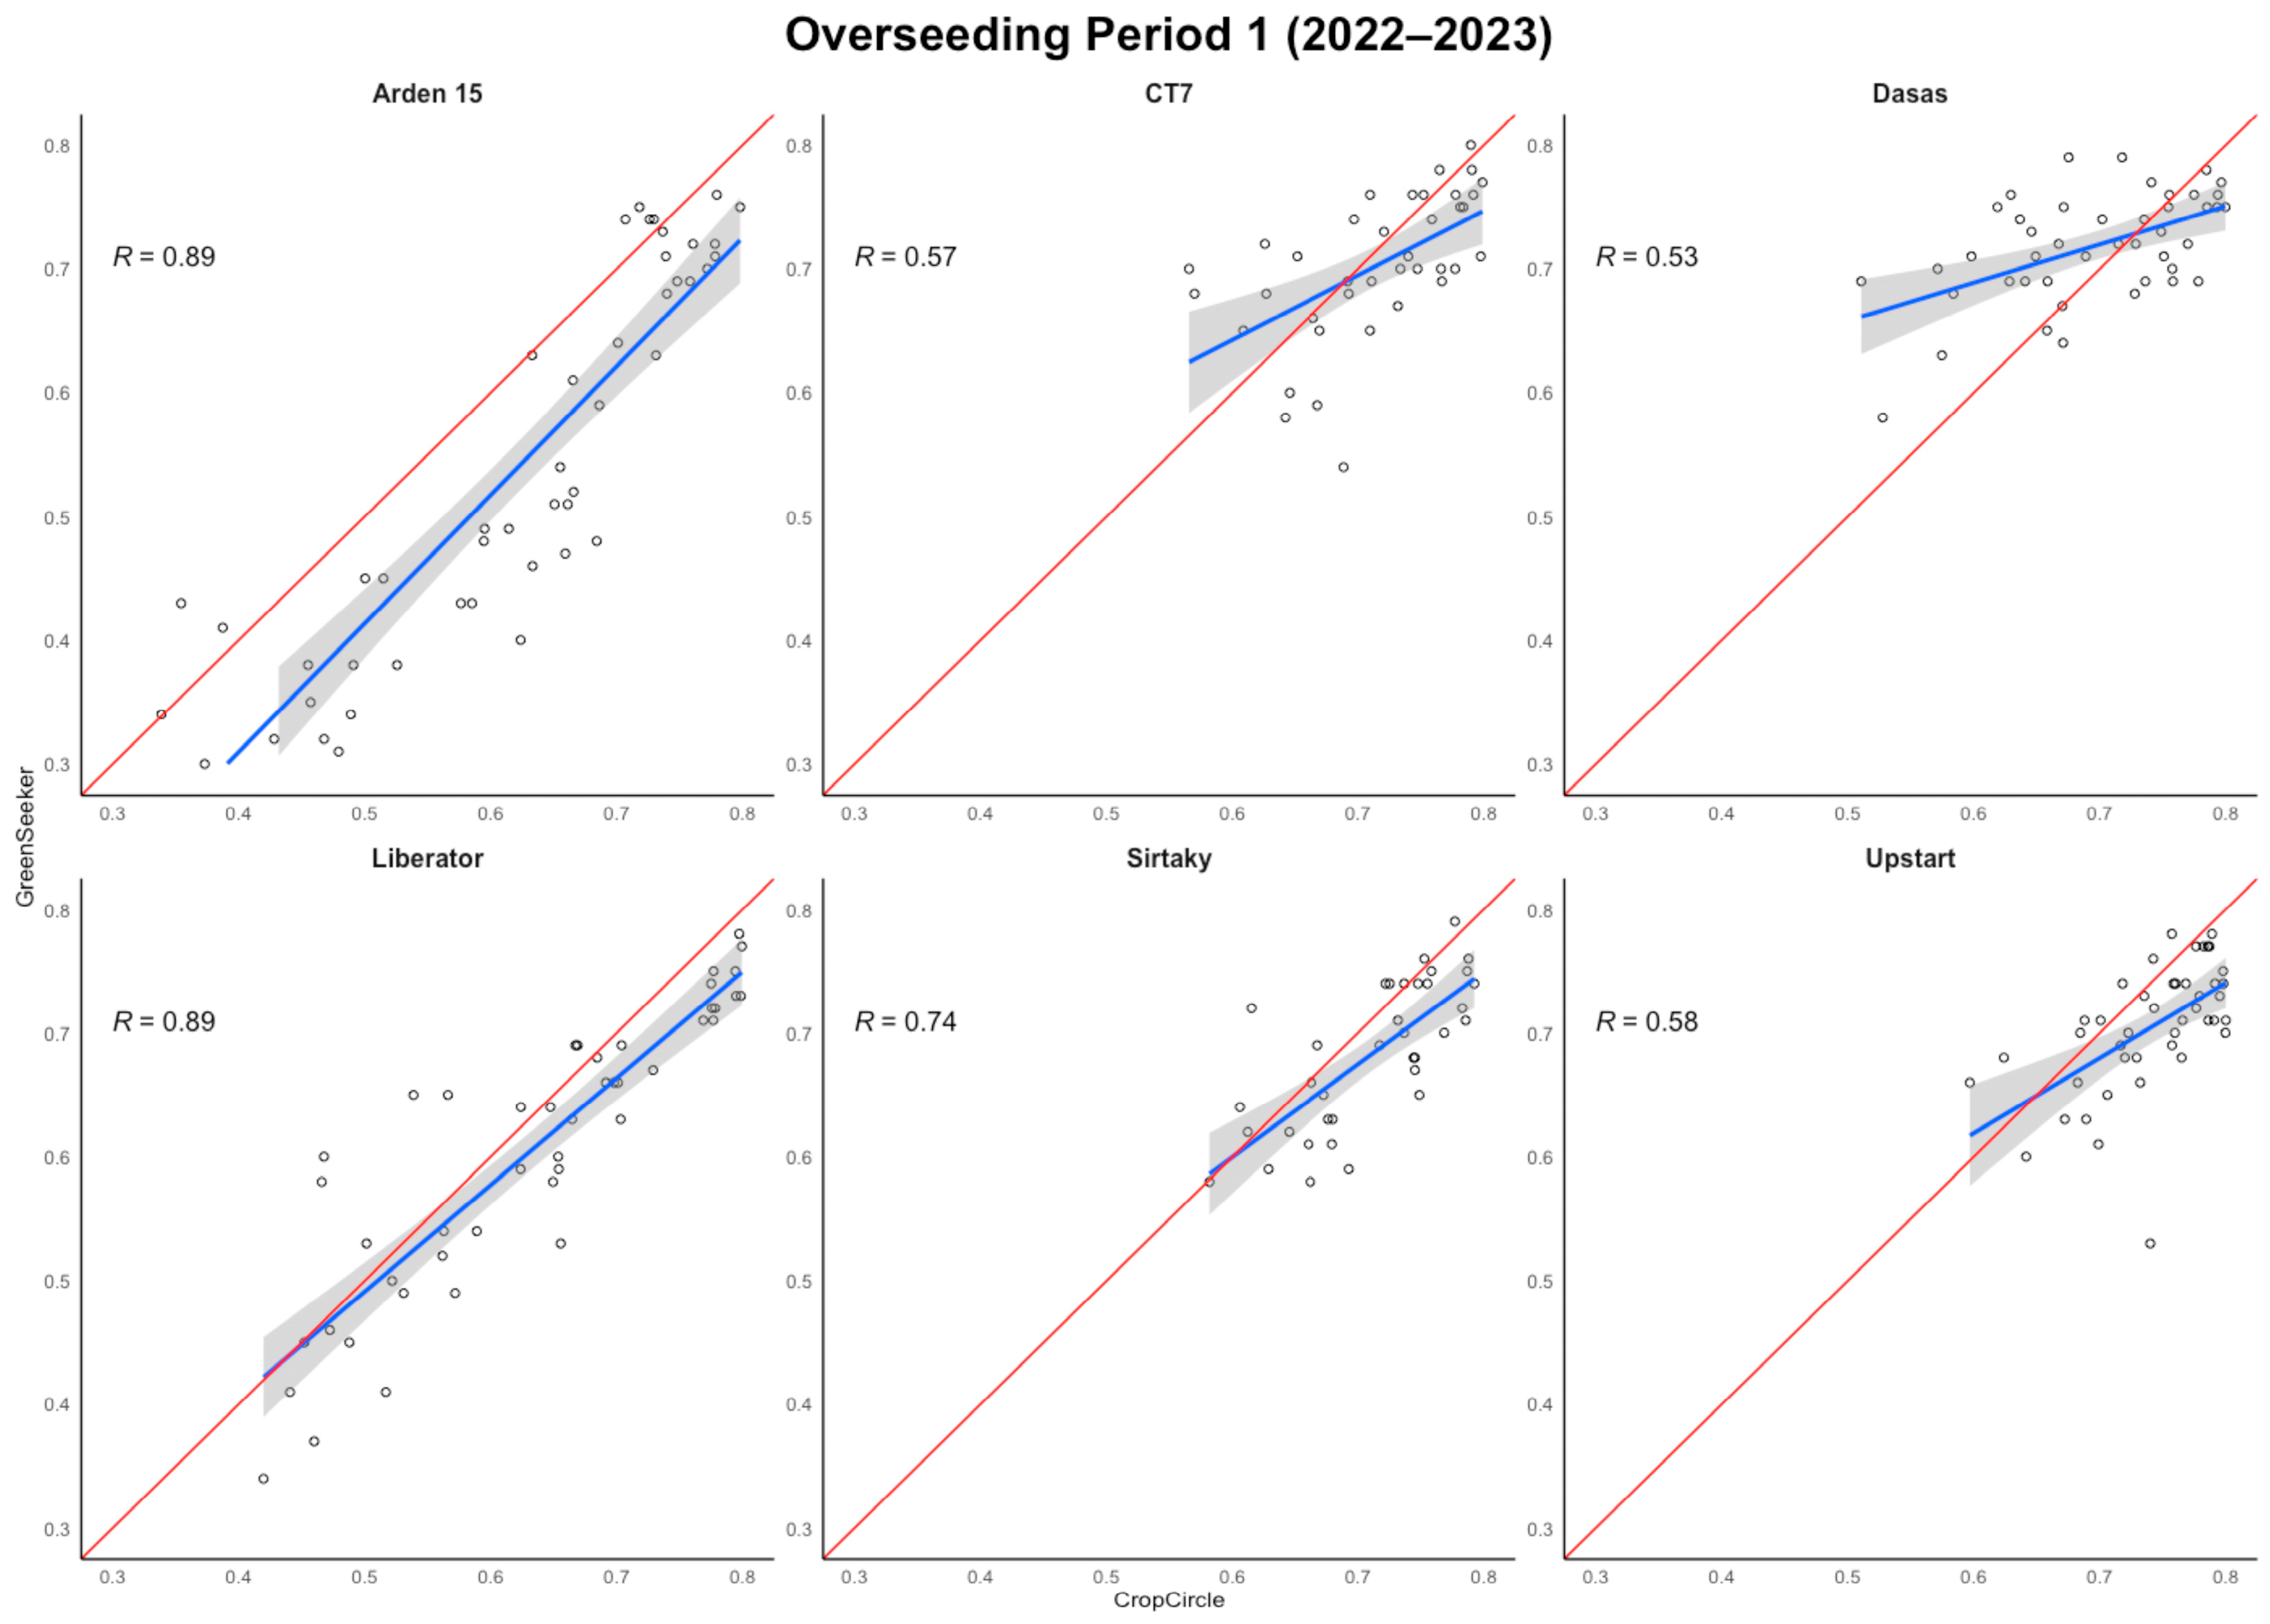
NDVI values were compared between sensors to evaluate the correlation and potential interchangeability of the GS and CC devices. Linear correlations between measurements from the two sensors varied considerably depending on the cultivar, indicating that sensor equivalence cannot be assumed without prior validation.
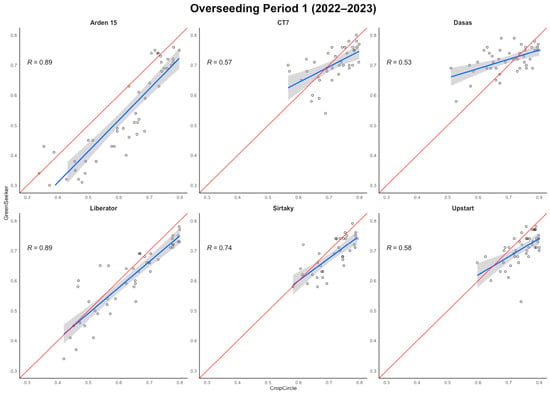
During the first period (Figure 6), certain cultivars, such as Arden 15 and Liberator, exhibited very high correlations (R = 0.89), demonstrating a strong linear relationship. This suggests that both sensors provide highly consistent and reliable measurements for these cultivars and the choice of sensor would not significantly affect the interpretation of canopy. In contrast, other cultivars, including CT7, Dasas, and Upstart, showed much lower correlations (R < 0.60), indicating weaker agreement between sensors and suggesting that measurements may not be directly comparable without cross-calibration.
Figure 6.
Correlation between the normalized difference vegetation index (NDVI) measured by two different hand-held devices, the CropCircle (CC) sensor and the GreenSeeker (GS) sensor, over five different cultivars and a bermudagrass cultivar during the first period. R, Pearson correlation coefficient.
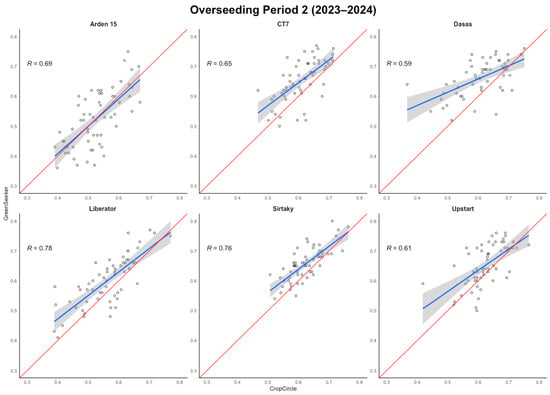
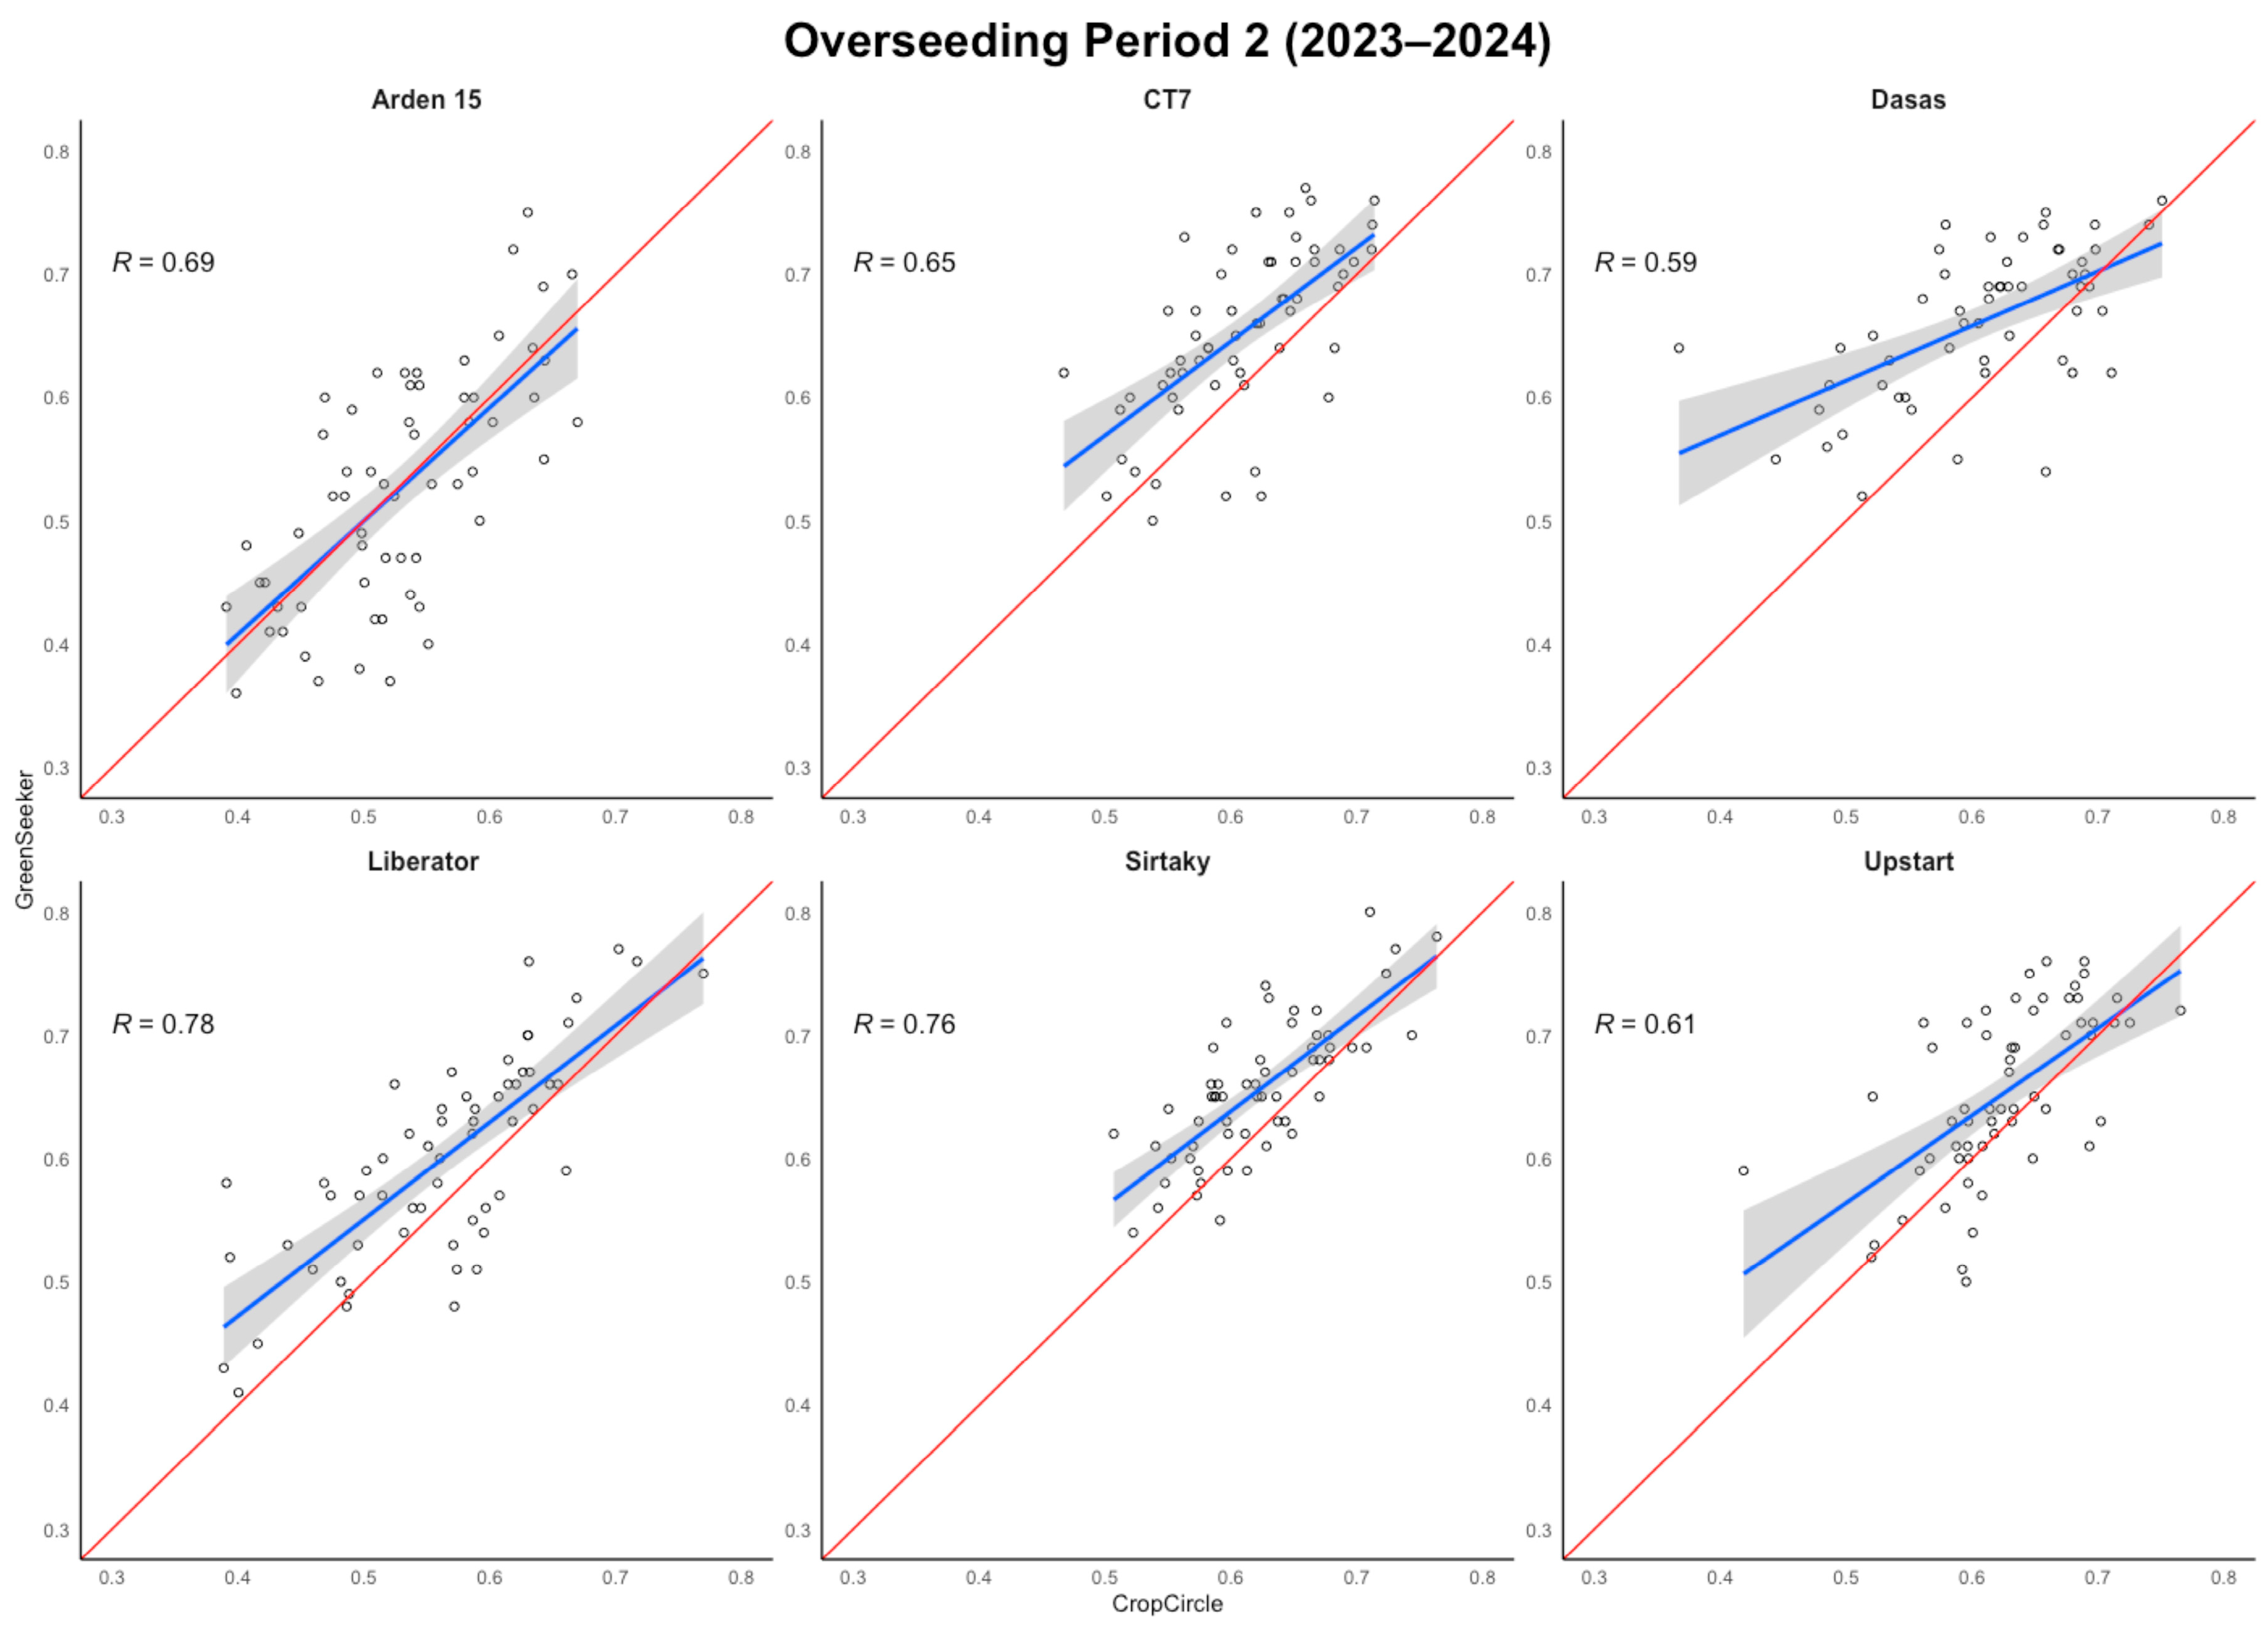
During the second period (Figure 7), notable changes in these correlations were observed. The Sirtaky cultivar maintained high correlations (R = 0.76), confirming strong agreement between sensors for this cultivar. In contrast, CT7 showed moderate correlations (R between 0.57 and 0.65), indicating acceptable consistency that would allow combined use of the devices with appropriate precautions. Conversely, cultivars such as Dasas (R = 0.58) and Upstart (R = 0.61) again exhibited weak correlations. The case of Arden 15 and Liberator is particularly noteworthy; in the first period, they displayed a very high correlation (R = 0.89), which decreased to R = 0.69 and R = 0.78 in the second period, respectively.
Figure 7.
Correlation between the normalized difference vegetation index (NDVI) measured by two different hand-held devices, CropCircle (CC) sensor and GreenSeeker (GS) sensor, over five different cultivars and a bermudagrass cultivar during the second period. R, Pearson correlation coefficient.
3.6. Area Under the Progress Curve (AUPC)
Another simple and reliable approach to comparing the data obtained for each evaluated parameter is through the calculation of the area under the progress curve (AUPC). This metric allows for the identification (Table 3) of which cultivars outperform Arden 15 and are, therefore, more suitable for overseeding. With respect to turf green color, the cultivars CT7, Sirtaky, and Liberator could effectively replace Arden 15, exhibiting higher values throughout this study. The CT7 cultivar achieved the highest AUPC, exceeding 900 cumulative color units (CCU) in both periods, while Sirtaky and Liberator recorded values between 600 and 900 CCU. The remaining cultivars (Dasas and Upstart) did not match Arden 15 in color because their AUPCs were under 590 CCU. For NDVI, all overseeded cultivars showed higher values than Arden 15 across both GS and CC sensors, with CC values exceeding GS in the first period and the trend reversing in the second. For NDRE, all cultivars differed from Arden 15 in the first period, with CT7, Sirtaky, and Upstart obtaining the highest values, while in the second period, CT7, Liberator, and Upstart showed no significant differences compared to Arden 15.
Table 3.
The area under the progress curve (AUPC) of the evolution of four determined parameters (Color, NDVI GS, NDVI CC and NDRE) over the turfgrass canopy. Different letters within a column indicate statistically significant differences (Fisher test, p < 0.05 for comparing means). LSD: least significant differences (p = 0.05) for comparing means.
4. Discussion
The cultivation of C. dactylon for turfgrass under Mediterranean climatic conditions offers substantial agronomic and functional advantages; however, winter dormancy and the associated loss of green color remain a major limitation, particularly in sports turf systems where year-round aesthetic quality is required. The results of this study confirm that the duration and intensity of bermudagrass winter discoloration are strongly temperature-dependent, as previously reported by Gómez de Barreda et al., 2022 [23]. In the present study, the period of gradual color loss and recovery ranged from three months in a warm winter to three and a half months in a colder year, whereas complete discoloration was limited to a relatively short period (1–3 weeks). This contrasts with observations at higher latitudes (43° N), where dormancy may extend for up to seven months, including four months of total green color loss, even under Mediterranean climate conditions [23]. Autumn overseeding with cool-season turfgrass species proved to be an effective strategy to mitigate winter discoloration of bermudagrass, although clear differences among cultivars were observed. All tested cultivars were able to compensate for the loss of green color to some extent, but the quality and visual uniformity of the turf varied markedly. Among the Lolium perenne cultivars, CT7 consistently provided excellent green cover during bermudagrass dormancy; however, its markedly darker green color (5.9 to 7.6) during the dormancy compared with bermudagrass (1.0 to 4.9) resulted in noticeable chromatic contrasts during the autumn–spring transition. Similar high green color values for L. perenne during bermudagrass winter dormancy have been reported in other environments [11,24], suggesting that this response is inherent to turf-type perennial ryegrass rather than site-specific. In contrast, the L. perenne cultivar Sirtaky and the P. pratensis cultivar Liberator exhibited green color values more closely aligned with those of bermudagrass, making them more visually compatible for autumn overseeding. Nevertheless, the slower establishment of Liberator may limit its practical applicability where rapid winter cover is required. Other tested cultivars, while capable of maintaining green color, did so either for a limited duration or with excessively light green coloration, which may reduce their suitability for high-quality turf systems. The light green color values (2.1 to 4.8) observed in the L. multiflorum Upstart cultivar during bermudagrass dormancy were consistent with previous findings for forage-type L. multiflorum cultivars [24] and clearly differentiated from the darker turf-type cultivars, highlighting the importance of cultivar selection within species.
Reflectance-based turf quality indices (NDVI and NDRE) supported the visual assessments, indicating generally good winter vigor and health of the overseeded cultivars. The lower values observed for the P. pratensis Liberator cultivar further confirm its weaker winter performance. Although NDVI proved to be a robust indicator of turf quality, its sensitivity was influenced by the measurement device. The GreenSeeker sensor detected larger differences among cultivars than the CropCircle sensor, particularly under colder winter conditions. This suggests that device-specific characteristics should be considered when comparing NDVI values across studies or environments. Alcántara et al. (2025) [25] reported minimal differences in NDVI measurements among six bermudagrass cultivars when using the same devices, and Yule et al., 2011 [26] similarly observed good consistency between the two sensors during the early stages of wheat and ryegrass. However, Jordan et al., 2019 [27] indicated that NDVI measurements in peanut obtained from these two instruments were not interchangeable, and Ferrara et al. (2010) [28], in studies with sugar beet, emphasized that the methodology used for NDVI calculation—not just the choice of device—can influence results. These findings suggest that both instrument selection and calculation approach should be carefully considered when comparing NDVI values across studies. The correlation between NDVI measurements from both sensors was stronger during colder winters. This effect was particularly pronounced in cultivars with greater temporal variability in growth and canopy traits, such as Arden 15 and Liberator, highlighting how environmental stress and genetic factors amplify spectral differences. However, for the other four cultivars, which achieved ground coverage earlier and exhibited more uniform growth over time, the range of NDVI measurements was much smaller. This limited variability amplifies the impact of minor differences between sensors, resulting in weaker correlations.
The use of the area under the progress curve (AUPC) emerged as a particularly valuable approach for integrating temporal changes in turf quality parameters. While AUPC has been widely applied in turfgrass research to assess herbicide injury [29] or disease severity [30], its application to overall turf quality has been limited. The present results, together with those of Benelli et al., 2016 [31], demonstrate that AUPC is a reliable and informative metric for comparing cultivars over extended periods, especially when turf performance varies markedly over time.
Overall, the findings reinforce the well-established rationale for overseeding warm-season turfgrasses to maintain winter color [32]. Among the evaluated species, L. perenne cultivars provided the most consistent and intense green color during bermudagrass dormancy. However, from a practical and aesthetic standpoint, the cultivar Sirtaky appears to represent the most balanced option, as it offers effective winter greening without the excessive dark coloration observed in CT7, thereby enhancing visual uniformity throughout the autumn–winter period.
Author Contributions
Conceptualization, D.G.d.B. and A.L.; Methodology, all.; Software, Ó.A.; Validation, all.; Formal Analysis, all.; Investigation, all.; Resources, all.; Data Curation, all Writing—Original Draft Preparation, Ó.A.; Writing—Review and Editing, all; Visualization, all; Supervision, D.G.d.B.; Project Administration, D.G.d.B.; Funding Acquisition, D.G.d.B. All authors have read and agreed to the published version of the manuscript.
Funding
This research was funded by the Polytechnical University of Valencia and Semillas Dalmau S.L. under the research project entitled Sustainability of Turfgrass Species Management under Mediterranean Climate Conditions (Irrigation and Fertilization).
Data Availability Statement
The data presented in this study are available on request from the corresponding author due to commercial restrictions.
Conflicts of Interest
The authors declare no conflicts of interest.
Abbreviations
ANOVA, Analysis of Variance; ASL, Above Sea Level; AUPC, Area Under Progress Curve; CC, CropCircle sensor; CCU, Cumulative Color Units; GS, GreenSeeker sensor; LSD, Least Significant Difference; NDVI, Normalized Difference Vegetation Index; NDRE: Normalized Difference Red Edge Index; R: Pearson’s correlation coefficient.
References
- Beard, J.B. Turfgrass: Science and Culture; Prentice-Hall: Englewood Cliffs, NJ, USA, 1973. [Google Scholar]
- Turgeon, A.J. Turfgrass Management, 9th ed.; Prentice Hall: Upper Saddle River, NJ, USA, 2011. [Google Scholar]
- Christians, N.E.; Patton, A.J.; Law, Q.D. Fundamentals of Turfgrass Management, 5th ed.; Wiley-Blackwell: Hoboken, NJ, USA, 2017. [Google Scholar]
- McCarty, L.B.; Miller, G. Managing Bermudagrass Turf: Selection, Construction, Cultural Practices, and Pest Management Strategies; John Wiley & Sons: Hoboken, NJ, USA, 2002. [Google Scholar]
- Bauer, S.; Lloyd, D.; Horgan, B.P.; Soldat, D.J. Agronomic and physiological responses of cool-season turfgrass to fall-applied nitrogen. Crop Sci. 2012, 12, 1–10. [Google Scholar] [CrossRef] [Scilit]
- Munshaw, G.C.; Ervin, E.H.; Shang, C.; Askew, S.D.; Zhang, X.; Lemus, R.W. Influence of Late-Season Iron, Nitrogen, and Seaweed Extract on Fall Color Retention and Cold Tolerance of Four Bermudagrass Cultivars. Crop Sci. 2006, 46, 273–283. [Google Scholar] [CrossRef] [Scilit]
- Fry, J.; Huang, B. Applied Turfgrass Science and Physiology; John Wiley & Sons: Hoboken, NJ, USA, 2004. [Google Scholar]
- Thoms, A.W. The Influence of Perennial Ryegrass Overseeding and Grooming on Bermudagrass Varietal Performance. Master’s Thesis, University of Tennessee, Knoxville, TN, USA, 2008. [Google Scholar]
- Magni, S. Bermudagrass adaptation in the Mediterranean climate: Phenotypic traits of 44 accessions. Ann. Di Bot. 2014, 4, 43–52. [Google Scholar]
- Ozkan, S.S.; Kir, B. Impacts of seeding rates of different Lolium species on winter overseeding of seashore paspalum in Mediterranean regions: Turf quality and suitability for football pitches. Ital. J. Agron. 2023, 18, 2180. [Google Scholar] [CrossRef] [Scilit]
- Sciusco, G.; Lazzarin, M.; Volterrani, M.; Magni, S. Performance of Different Cool-Season Species and Cultivars Overseeded on Bermudagrass and Managed with Autonomous Mower. Agronomy 2024, 14, 2611. [Google Scholar] [CrossRef] [Scilit]
- Volterrani, M.; D’Este, A.; Preatoni, D. Bermudagrass autumn overseeding with annual ryegrass. Acta Hortic. 2004, 661, 247–250. [Google Scholar]
- Zhou, Q.; Soldat, D.J. Creeping Bentgrass Yield Prediction with Machine Learning Models. Front. Plant Sci. 2021, 12, 749854. [Google Scholar] [CrossRef] [Scilit] [PubMed]
- Rubio, J.L.; Sánchez, J.; Forteza, J. Mapa de Suelos de la Comunidad Valenciana (Hoja: Valencia 722); Generalitat Valenciana, Consellería d’Agricultura i Mig Ambient: Valencia, Spain, 1996. [Google Scholar]
- Morris, K.N.; Shearman, R.C. NTEP turfgrass evaluation guidelines. In NTEP Turfgrass Evaluation Workshop; Natl. Turfgrass Evaluation Program: Beltsville, MD, USA, 1998; pp. 1–5. [Google Scholar]
- Karcher, D.E.; Richardson, M.D. Quantifying turfgrass colorusing a digital image analysis. Crop Sci. 2003, 43, 943–951. [Google Scholar] [CrossRef]
- de Mendiburu, F. Agricolae: Statistical Procedures for Agricultural Research, R package version 1.3-7; CRAN: Wien, Austria, 2023; Available online: https://CRAN.R-project.org/package=agricolae (accessed on 31 December 2025).
- Wickham, H.; François, R.; Henry, L.; Müller, K.; Vaughan, D. Dplyr: A Grammar of Data Manipulation, R package version 1.1.4; CRAN: Wien, Austria, 2023; Available online: https://CRAN.R-project.org/package=dplyr (accessed on 31 December 2025).
- Wickham, H.; Vaughan, D.; Girlich, M. Tidyr: Tidy Messy Data, R package version 1.3.1; CRAN: Wien, Austria, 2024; Available online: https://CRAN.R-project.org/package=tidyr (accessed on 31 December 2025).
- Wickham, H. Ggplot2: Elegant Graphics for Data Analysis, R package version 3.4.2; Springer: Berlin/Heidelberg, Germany, 2016; Available online: https://cran.r-project.org/package=ggplot2 (accessed on 31 December 2025).
- Luo, D.; Ganesh, S.; Koolaard, J. Predictmeans: Predicted Means for Linear and Semiparametric Models, R package version 1.0.9; CRAN: Wien, Austria, 2023; Available online: https://CRAN.R-project.org/package=predictmeans (accessed on 31 December 2025).
- Kassambara, A. Ggpubr: “Ggplot2” Based Publication Ready Plots, R package version 0.6.0; CRAN: Wien, Austria, 2023; Available online: https://CRAN.R-project.org/package=ggpubr (accessed on 31 December 2025).
- Gómez de Barreda, D.; Azcárraga, C.; Pornaro, C.; Macolino, S. Performance of turf-type bermudagrass cultivars in the upper and lower limits of the European transition zone. Agron. J. 2022, 114, 3544–3553. [Google Scholar] [CrossRef] [Scilit]
- Green, W.T.; Kreinberg, S.T.; McCalla, J.H.; Hutchens, W.J.; Hignight, K.; Hignight, D.; Richardson, M.D. Alternative cool-season turfgrass species for overseeding dormant bermudagrass. Int. Turfgrass Soc. Res. J. 2025, 15, 1185–1191. [Google Scholar] [CrossRef] [Scilit]
- Alcántara Enguídanos, Ó.; Gómez de Barreda Ferraz, D.; Lidón Cerezuela, A. Comparison of normalized difference vegetation index hand-held devices for turfgrass evaluation. Int. Turfgrass Soc. Res. J. 2025, 15, 1169–1173. [Google Scholar] [CrossRef] [Scilit]
- Yule, I.; Mackenzie, J.; Killick, M.; Mackenzie, C. A comparison of crop sensor systems for informing fertilizer placement. In Adding to the Knowedge Base for the Nutrient Manager; Ocassional Report N. 24; Fertilizer and Lime Research Centre, Massey University: Palmerston North, New Zealand, 2011. [Google Scholar]
- Jordan, B.S.; Branch, W.D.; Coffin, A.W.; Smith, C.M.; Culbreath, A.K. Comparison of Trimble GreenSeeker and crop circle (model ACS-210) reflectance meters for assessment of severity of late leaf spot. Peanut Sci. 2019, 46, 110–117. [Google Scholar] [CrossRef] [Scilit]
- Ferrara, R.M.; Fiorentino, C.; Martinelli, N.; Garofalo, P.; Rana, G. Comparison of different ground-based NDVI measurement methodologies to evaluate crop biophysical properties. Ital. J. Agron. 2010, 5, 145–154. [Google Scholar] [CrossRef] [Scilit]
- Brewer, J.R.; Willis, J.; Rana, S.S.; Askew, S.D. Response of Six Turfgrass Species and Four Weeds to Three HPPD-Inhibiting Herbicides. Agron. J. 2017, 109, 1777–1784. [Google Scholar] [CrossRef] [Scilit]
- Powlen, J.S.; Kerns, J.P.; Fidanza, M.A.; Bigelow, C.A. Brown patch severity as affected by cool-season turfgrass species, cultivar, and nitrogen rate. Crop Sci. 2024, 64, 2393–2403. [Google Scholar] [CrossRef] [Scilit]
- Benelli, J.J.; Horvath, B.J.; Brosnan, J.T.; Kopsell, D.A. Plant Health Characteristics of Creeping Bentgrass Affected by Strobilurin Fungicide Applications and Turfgrass Diseases. Crop Sci. 2016, 56, 862–869. [Google Scholar] [CrossRef] [Scilit]
- Rossini, F.; Ruggeri, R.; Celli, T.; Rogai, F.M.; Kuzmanović, L.; Richardson, M.D. Cool-season Grasses for Overseeding Sport Turfs: Germination and Performance under Limiting Environmental Conditions. HortScience 2019, 54, 555–563. [Google Scholar] [CrossRef] [Scilit]

Disclaimer/Publisher’s Note: The statements, opinions and data contained in all publications are solely those of the individual author(s) and contributor(s) and not of MDPI and/or the editor(s). MDPI and/or the editor(s) disclaim responsibility for any injury to people or property resulting from any ideas, methods, instructions or products referred to in the content. |
© 2026 by the authors. Licensee MDPI, Basel, Switzerland. This article is an open access article distributed under the terms and conditions of the Creative Commons Attribution (CC BY) license.