


Abstract
Informal public transportation remains the backbone of urban mobility in many developing cities. While these systems offer flexible and affordable services, they are often associated with safety issues, unreliability, congestion, and environmental impacts. Consequently, transitioning travelers toward formal public transportation is a key objective for sustainable transport planning. This study investigates travelers’ willingness to shift from their current travel modes to a proposed Metro system in Alexandria, Egypt. The analysis uses stated preference data collected through interviews that presented respondents with multiple service scenarios. A correlated random parameters bivariate probit model with heterogeneity in means is estimated to capture interdependence between responses. The results reveal strong and statistically significant cross-equation error correlations, confirming that decisions are not independent and supporting the use of a joint modeling approach. Empirical results indicate that willingness to shift is influenced by socio-demographic characteristics, trip attributes, and current travel conditions. Female travelers are more sensitive to waiting time, while low-income and older individuals are less likely to shift across scenarios. Physical accessibility, especially walkability to and from stations, emerges as the most influential factor in encouraging adoption. These findings provide policymakers with actionable insights for designing inclusive, accessible, and sustainable public transportation systems.
1. Introduction
With the growth of urban populations, reliance on personal vehicles and informal paratransit services has increased, resulting in significant adverse effects, including traffic congestion, increased road safety hazards, and deteriorating air quality [1].
The role of informal public transport has been widely recognized as an important component of urban mobility in many developing cities, particularly under conditions of rapid urbanization, institutional and financial constraints, and limited formal public transport supply.
These systems, including minivans, shared taxis, and similar services, often emerge in response to the unmet travel demand, providing extensive geographical coverage, flexible routes, high service frequencies, and relatively affordable door-to-door services, especially in areas underserved by formal public transport.
Beyond their operational advantages, informal transport services play a critical role in providing welfare-enhancing services to the population, especially low-income groups, by facilitating access to the economy and other public services and often serving as substitutes or complements to formal public transport services [1].
Unplanned urban sprawl pushes travelers in developing countries towards private or informal modes of transport. Informal transit plays a major role in many developing countries, especially mid-sized cities. However, these systems suffer from service unpredictability, congestion, and safety issues, highlighting the urgent need to transition to formal transit to enhance equity and system resilience in congested urban areas [2].
Consequently, city officials and global development organizations are increasingly investing in formal, sustainable public transit systems, including Bus Rapid Transit (BRT) and light rail, to support a transition to more efficient and sustainable transportation [3].
Nevertheless, simply providing infrastructure does not ensure adoption; the effectiveness of these efforts relies heavily on commuters’ willingness to transition from familiar informal modes to organized systems [4].
Bus Rapid Transit (BRT) is a practical and initial formal solution for developing countries to meet growing travel demand, compared with informal modes such as shared taxis and minibuses, which often offer lower service quality [2].
Despite the benefits these services offer, they are often associated with challenges such as safety concerns, service unreliability, traffic congestion, and environmental impacts. In this regard, several transport authorities in different developing cities are increasingly focusing on the need to facilitate a move from informal to formal public transport systems. As noted in [5], such a move is highly aligned with Sustainable Development Goal 11 [6], particularly Target 11.2, which requires development of safe, affordable, accessible, and sustainable transport systems for all by 2030.
Understanding the behavioral drivers behind this modal shift is complex, especially in developing economies where a combination of cost sensitivity, service unreliability, and socio-cultural factors shapes travel habits. Furthermore, although existing research has widely employed discrete choice models to examine mode choice behavior, most of these investigations depend on traditional multinomial logit or basic probit models. These traditional methods often impose restrictive assumptions, particularly the independence of irrelevant alternatives (IIA) in multinomial logit models and the assumption of homogeneous parameters across individuals, thereby neglecting unobserved heterogeneity among commuters [7].
Overlooking the relationship between these joint decisions and the diversity of personal preferences can lead to biased parameter estimates and misleading policy conclusions [8]. To address these methodological limitations, recent advances in econometric modeling highlight the usefulness of mixed discrete choice frameworks that incorporate both random parameters and correlated error structures [9].
Despite these developments, there remains a research gap in applying advanced correlated random parameters frameworks in the context of sustainable transport adoption in developing urban areas.
This study explores the case of Alexandria, Egypt. Alexandria is a major metropolitan area where informal public transport plays an important role in the transport landscape. Similar to other major metropolitan areas in developing countries, it is characterized by a strong reliance on informal public transport, alongside a growing need to expand the existing formal public transport network. This makes Alexandria an interesting and representative case for analyzing travelers’ willingness to shift from their currently used transport modes to a proposed Metro mode under different improvement scenarios.
One of the major challenges in analyzing the case of Alexandria is estimating travelers’ willingness to change from informal to formal transport modes under different service improvement scenarios. This is a complex issue, as the decision to switch from the currently used modes to a proposed new transport alternative depends on multiple factors. A key challenge, however, lies in the interdependence of responses across the proposed scenarios, as individuals’ choices are not independent.
This arises because unobserved behavioral characteristics may simultaneously influence individuals’ willingness to change from their current transport modes to the proposed alternative across different improvement scenarios. Ignoring the interdependence of responses across these scenarios may lead to inefficient parameter estimates and biased inference regarding the factors influencing willingness to shift (WTS) [10].
The remainder of the paper is organized as follows. Section 2 reviews the literature on discrete choice modeling and transit adoption, and Section 3 describes the survey data and scenarios. Section 4 presents the methodology. Section 5 discusses the estimation results, followed by marginal effects in Section 6. Section 7 outlines policy implications, Section 8 highlights limitations and future research, and Section 9 concludes the paper.
2. Literature Review
The rapid growth of motor vehicle ownership and the continued existence of informal transport systems pose significant challenges to sustainable urban mobility in many growing cities. Understanding the propensity of households and individuals to transition from private or informal transportation modes to formal, sustainable public transport increasingly relies on advanced discrete choice models that account for correlated decisions and unobserved heterogeneity, including random parameter bivariate and multivariate probit and logit models.
This section reviews existing research on public transit and mode shift, with special emphasis on the evolution of discrete choice modeling techniques. The review is structured to trace the methodological evolution in the literature, from fixed parameter discrete choice models to the extension of these models to incorporate random parameters, and finally to joint and correlated modeling. At the same time, an in-depth review of studies conducted in Africa and other developing regions is provided to shed light on the contextual factors that affect travel behavior, regardless of the modeling techniques used.
2.1. Traditional and Fixed Parameter Discrete Choice Models
Past studies on travel behavior in urban areas and the adoption of public transportation have mostly relied on the random utility theory, which assumes that travel choices result from utility-maximizing behavior in uncertain situations [11]. Further development of this theory has led to the most widely used fixed parameter discrete choice techniques, including the binary logit, binary probit, and multinomial logit models [12].
Since they are easy to estimate and interpret, fixed parameter models have been widely used in empirical studies to examine individuals’ willingness to use public transit and their sensitivity to travel time, cost, and service attributes [12,13]. These approaches provided important insights into the role of fares, travel time, service frequency, and comfort in shaping public transport demand [14,15]. However, fixed parameter specifications assume homogeneous preferences across individuals and impose restrictive error structures. As discussed in foundational econometric texts [7], these assumptions may lead to biased estimates and misleading policy conclusions when there are substantial variations in travelers’ preferences and perceptions.
As shown in Table 1, several previous studies used different mode choice models including SP data, factor analysis with latent variables, logit and mixed logit models, and spatial equity analysis. Vichiensan, V. et al. [16] found significant heterogeneity in Value of Travel Time (VTT) across different user groups and access modes. Ranjan, R., Sinha, S., and Kumar, N. [17] conclude that transport agencies should prioritize qualitative service attributes (e.g., safety and comfort) alongside quantitative ones (e.g., time and cost) to enhance transit competitiveness against private modes.
Table 1.
Review of transit transformation using discrete choice models.
2.2. Incorporating Preference Heterogeneity: Random Parameter Models
To address the restrictive homogeneity assumption in fixed parameter models, later studies introduced random parameters into the framework of discrete choice models. The mixed logit and random parameters probit models allow the taste coefficients to vary across individuals according to a given statistical distribution, thereby addressing the problem of unobserved preference heterogeneity [8,10,21].
In transportation research, random parameters have been widely used to capture heterogeneity in travelers’ sensitivities to time, cost, comfort, and reliability [22,23]. Empirical evidence consistently shows that commuters value service attributes differently, underscoring the limitations of homogenous model specifications. Recent studies have expanded these approaches to transit policy assessment.
The study by Liu et al. [24], employed a mixed logit model and found significant differences in response variability across socio-demographic groups. Despite the benefits of univariate random parameters models, they are usually limited to modeling a single dimension of the decision. In many situations, traveler choice is best represented as an interrelated decision problem, such as the simultaneous selection of multiple scenarios for service improvement, in which unobservable factors may affect one choice while also influencing other choices. Modeling each decision as a separate single-equation model fails to account for possible correlations among the error terms across equations, leading to inefficient estimates of the model coefficients when decisions are inherently linked [10,23]. Table 2 summarizes the most recent studies on incorporating random parameter models into mode choice models and provides useful conclusions.
Table 2.
Review of incorporating random parameter models in mode choice models.
2.3. Advanced Methodological Developments: Joint and Correlated Models
Individuals are generally assumed to behave rationally when making travel-related decisions, particularly when they are repeatedly exposed to similar choices or required to evaluate multiple alternatives simultaneously. Consequently, researchers have developed more advanced modeling approaches to capture the interdependence among these decisions. For instance, bivariate and multivariate probit models allow researchers to consider unobserved factors that may simultaneously influence multiple choices [10,23].
In transportation studies, such joint modeling frameworks have increasingly replaced traditional single-choice approaches. Rather than assuming independence across decisions, these models explicitly account for the underlying relationships between them. Empirical evidence shows that incorporating such interdependencies improves model fit and yields results that more closely reflect observed behavior. Conversely, ignoring these relationships can lead to mis-specified models and potentially biased conclusions [34,35].
Recently, Eker et al., [36] used a correlated grouped random parameters bivariate probit framework to simultaneously model the willingness to pay and willingness to use flying cars. In their framework, adjacent willingness to pay scenarios were modeled jointly, and willingness to use scenarios for similar and closely related trip purposes were modeled together, effectively capturing cross-equation error correlation. Fu and Chen, [37] applied a random bivariate generalized ordered probit model to examine the correlation between residential relocation and stoppage of motorcycling among older adults in Taiwan.
As shown in Table 3, a summary of joint and correlated mode choice model applications is presented.
Table 3.
Previous studies that applied joint and correlated mode choice.
2.4. Public Transit Adoption in Africa and Developing Countries
There has been growing interest in public transit and travel behavior, particularly in Africa and other developing regions. This interest stems from the rapid development in these regions and the pressing need to establish sustainable mobility solutions to address the environmental and economic challenges posed by urbanization and rising vehicle ownership rates [44,45]. In contrast to the Global North, where public transit systems are typically subject to stronger regulatory control, most commuters in these regions rely on informal transportation services, such as minibuses, share taxis, and other unofficial modes. Although these services play a critical role in ensuring mobility, they are associated with several operational and safety challenges [46].
Alcorn [47] examined how Lagos, Nigeria’s commercial hub, exhibits a complex interaction between informal public transport systems characterized by street-level improvisation and pragmatism and government-led formal transport initiatives. The city faces a “herculean” transportation challenge, as it is projected to become the world’s most populous city by 2100. The study highlights the tension and interdependencies between informal adaptive practices and formally planned transport development from a post-colonial perspective.
Research on African cities indicates that mode choice is primarily influenced by affordability, spatial accessibility, and service reliability, often to a greater extent than in developed economies due to the higher share of household income allocated to transportation [48,49,50]. Structural factors, including income constraints and employment informality, strongly influence commuters’ willingness to shift from informal operators to formal public transport systems. While formal systems generally offer improved safety and comfort, barriers such as higher fares, limited network coverage, and the lack of flexible last-mile connectivity remain key constraints to their adoption [51,52].
Consequently, despite the availability of formal alternatives, a substantial proportion of users continue to rely on informal modes due to their flexibility and immediacy [53]. These findings underscore the limited transferability of results from developed country contexts and highlight the need for context-specific studies that reflect the structural, institutional, and behavioral characteristics of urban environments in the developing world.
Table 4 summarizes related studies on the transformation from informal to formal transit in developing countries, covering methods, data, results, and conclusions.
Table 4.
Previous studies concerning transformation from informal to formal transit in developing countries.
3. Survey and Data
Discrete-Choice Experiments (DCEs), which address various policy issues, are used in mode choice analysis. The minimum sample size, as per DCE’s recommended general guideline, is as follows: The predominant guideline for determining the requisite sample size for a DCE was proposed by [63]. Per the regulation, enough responders must be present to satisfy the inequality as delineated in the following equation.
Let denote the maximum number of levels across all attributes, represent the number of alternatives per choice task (excluding the “None” option), and is the number of choice sets presented to each respondent. The total number of two-way interaction terms in the utility specification corresponds to the maximum product of the number of levels between any two attributes. The survey uses a random sampling technique across different Alexandria administrative districts and interviews at public places.
This stated preferences survey includes 1103 interviews in which respondents evaluated three hypothetical scenarios. It includes socio-economic characteristics of travelers, trip information, and the presented scenarios. The survey primarily investigates the demand for the Metro Abu Qir Extension to Al Agamy, which is expected to attract users from the existing choice environment.
Survey form includes the following sections with related attributes:
- Socio-economic characteristics of travelers, such as gender, age group, car ownership, and income.
- Trip characteristics, including trip purpose, frequency, duration, origin, destination, chosen mode, available modes (private car, taxi, shared taxi, bus, train, and tram), trip cost, travel time, access time, egress time, waiting time, in-vehicle travel time.
- The stated preference section includes scenarios for the extension of the Metro Abu Qir to Al Agamy, with varying travel attributes.
Table 5 presents the descriptive statistics of the raw data across four main variable categories. Key highlights are summarized below:
Table 5.
Raw data descriptive statistics of key variables.
- 61% of the sample are males.
- 56% of samples are in the age group (25–60 Y).
- 70% of travelers are of medium income (6000–20,000 EGP).
- Work and education are the primary trip purposes, with shares of 46% and 23%, respectively.
- 41% of trips occur between 9:00 am and 12:00 pm, indicating that the AM peak period falls within this time range.
- 24% of trips occur at 3:00 pm and 6:00 pm, indicating that the PM peak period falls within this time range.
- Shared taxis account for 88% of current modal share which aligns with this article’s objective of “changing from informal modes to formal modes” as researchers seek this behavior in developing countries and propose ways to achieve sustainable transit.
Table 6 presents the descriptive statistics of key variables. Table 7 reports the percentage distribution of respondents who chose to retain their current mode or shift to the Metro service across the three service improvement scenarios. The results from Table 7 clearly indicate that travelers are more sensitive to travel costs than to time savings.
Table 6.
Descriptive statistics of key variables.
Table 7.
Distribution of mode choice responses (%) across willingness to shift (WTS) scenarios.
As time savings increased from 10% to 25% to 50%, the probability of WTS to metro decreased from 81% to 60% to 31%, respectively, indicating minimal sensitivity to travel time savings. Finally, the mode cost increases from 10 EGP to 20 EGP, then to 30 EGP, while the WTS to Metro decreases in the same manner, indicating that travelers are very sensitive to mode cost rather than time at any level.
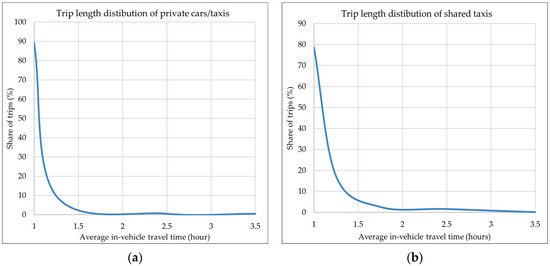
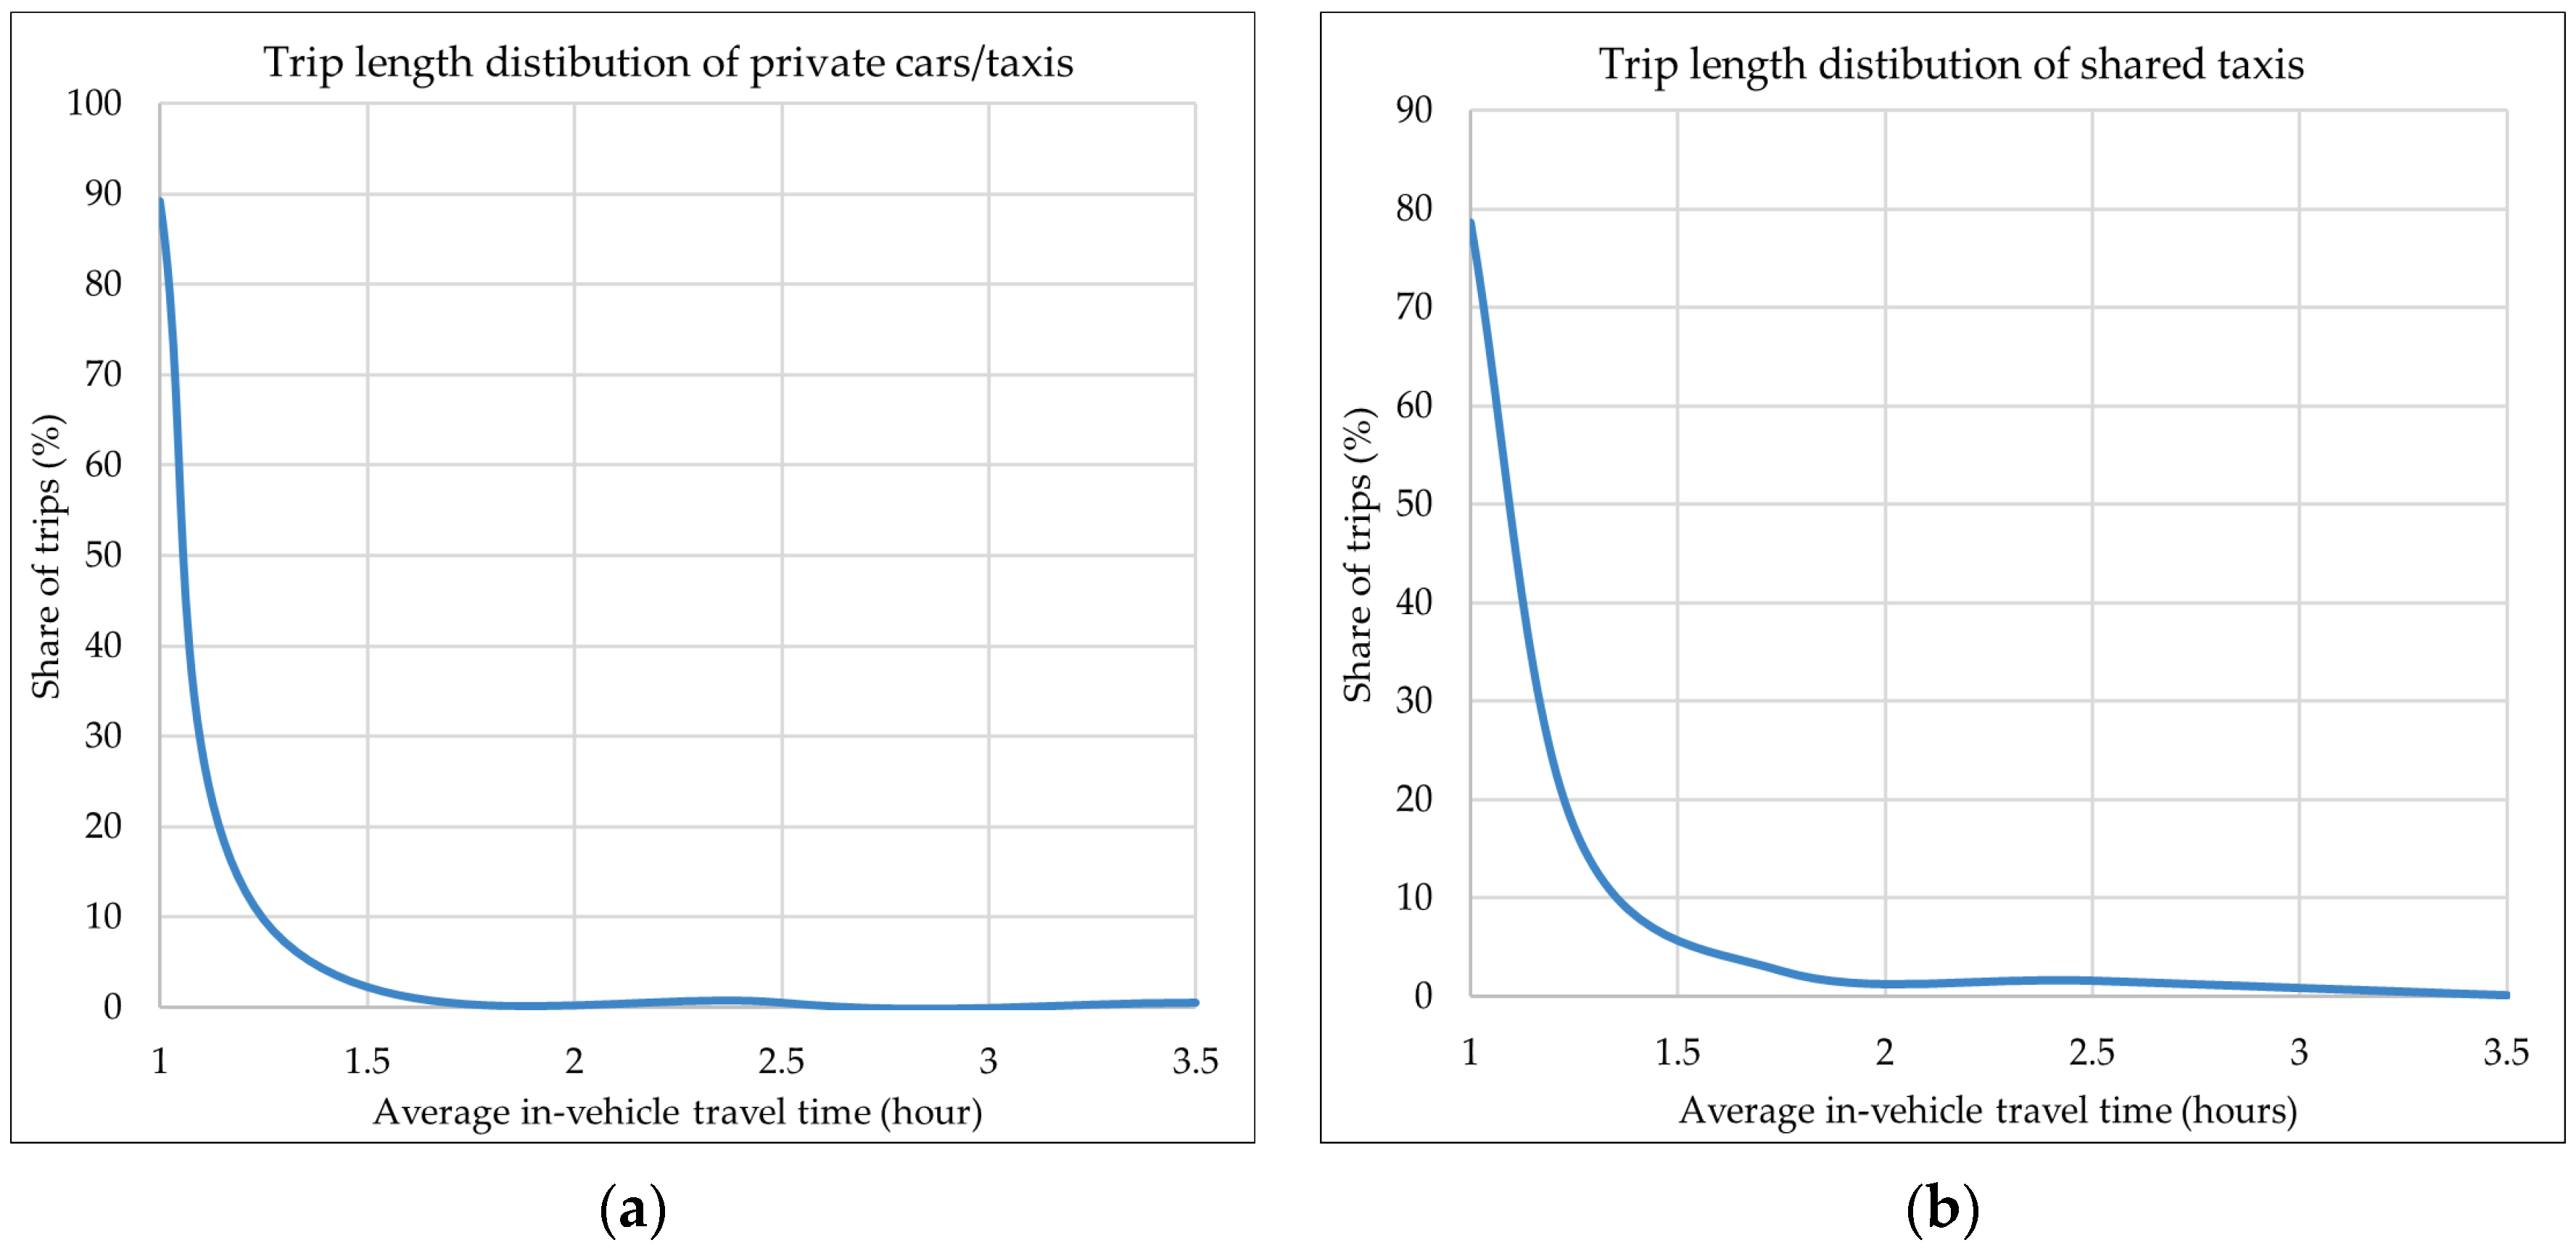
As shown in Figure 1, about 89% of trips by private car/taxi have a total travel time of less than one hour, while about 78% of trips by shared taxis have an in-vehicle travel time of less than one hour. For longer trips (i.e., trips with travel time ranging from 1 to 1.5 h), shared taxis have a higher rate of 17%, whereas private cars have about 10% of trips.
Figure 1.
(a) Trip length distribution of private car/taxi; (b) Trip length distribution of shared taxi.
4. Methodology
The dependent variables were derived from a stated preference survey conducted through interviews. Respondents were presented with a set of hypothetical Metro extension scenarios, each offering improved service attributes at a higher cost. These scenarios represent a sequence of progressive service improvements accompanied by corresponding increase in travel cost. For each scenario, respondents faced a binary choice: (0) retain their current mode of transport, or (1) shift to the new Metro service.
Each respondent evaluated three scenarios, suggesting that unobserved characteristics may simultaneously influence responses across scenarios and induce correlation among the error terms. Ignoring such cross-equation error correlation can lead to inefficient estimation and biased inference [10,64,65]. To address this issue, a bivariate probit framework is employed. The bivariate probit model can be defined as follows [7,35,66].
with the cross-equation correlated error terms being expressed as
where X is a vector of explanatory variables that affect respondents’ WTS to formal public transportation, β is a vector of estimable parameters corresponding to X, y corresponds to integer binary outcome (zero or one for both dependent variables), ε is a normally distributed random error term (with mean equal to zero and variance equal to one), and ρ denotes the cross-equation correlation coefficient of the error terms. The bivariate probit model and its loglikelihood function are defined as [7,36]
and
where (.) is the cumulative distribution function of the bivariate normal distribution, and all other terms are as previously defined.
To further address the unobserved heterogeneity, the mean of the random parameter’s density function is allowed to vary based on independent variables, shifting the peak of the distribution of the betas. Therefore, random parameters can be defined as follows [67],
where β denotes the mean of the random parameter, is a vector of explanatory variables that influence the mean of , λ is a vector of estimable parameters corresponding to , and is a disturbance term with mean equal to zero and variance equal to σ2.
The random parameters model is estimated using simulated maximum likelihood. The integrals over the random parameter distributions are approximated using Halton draws. For each observation, the simulated likelihood is computed by averaging the conditional likelihood over a fixed number of Halton draws for the random parameters.
A trivariate probit framework could be used to jointly model user willingness across all three Metro extension scenarios; however, it introduces substantial computational complexity with limited additional behavioral insight. The estimated unobserved error correlation between non-adjacent scenarios (Scenario 1 and Scenario 3) was weak (ρ < 0.3), while strong correlations were observed between adjacent scenarios (Scenario 1–2: ρ > 0.8; Scenario 2–3: ρ > 0.9). Accordingly, the analysis employs a bivariate random parameters probit model, which ensures interpretability and estimation stability while capturing the dependence across sequential scenarios (Results from exploratory tri-variate probit models are not reported, given their higher computational burden and negligible additional behavioral insight).
These scenarios incrementally improve competitiveness in terms of time efficiency and frequency while increasing fares, reflecting realistic trade-offs in an evolving urban environment where informal transportation modes prevail due to their flexibility and affordability. The design facilitates the analysis of sequential decision-making, with each responder evaluating all scenarios to uncover patterns in adoption thresholds.
Explanatory variables include socio-demographic factors (e.g., age, income, gender), trip features (e.g., purpose such as employment or education), current mode attributes (e.g., waiting time, access time, cost), and Metro expectations (e.g., walking access to stations).
The methodology integrates stated preference survey data from 1103 respondents across three Metro scenarios using two correlated random parameters bivariate probit systems (Scenario 1–2 and Scenario 2–3). The model captures unobserved heterogeneity through random parameters and heterogeneity in means, while accounting for correlated decisions across scenarios through cross-equation error correlation.
5. Model Estimation Results
Two random parameters bivariate binary probit models with heterogeneity in means were estimated to investigate the determinants of individuals’ willingness to shift (WTS) from informal to formal public transportation, where the formal alternative is a Metro system representing a sustainable mobility option. This approach captures differences in preferences across individuals and accounts for correlated unobserved factors that jointly influence responses across multiple stated preference scenarios.
Given the sequential nature of the scenarios, two separate bivariate systems were estimated for adjacent choices: (1) Scenario 1 jointly modeled with Scenario 2, and (2) Scenario 2 jointly modeled with Scenario 3. Each system represents a decision stage along a ladder of progressively improved Metro service scenarios, with reductions in travel time and waiting time accompanied by corresponding increase in fare.
The estimation results reveal significant interdependence between adjacent Scenarios. The estimated cross-equation error correlation for Scenario 1–Scenario 2 model is 0.816 (t-stat = 19.23), while the corresponding estimate for the Scenario 3–Scenario 2 model is 0.912 (t-stat = 31.01) (The cross-equation correlation coefficient (ρ) measures the degree of correlation between the unobserved error terms of the two equations. Values of ρ closer to ±1 indicate very strong correlation.). These highly significant correlation coefficients confirm the presence of shared unobserved factors, thereby validating the use of the joint modeling framework, as independent univariate specifications would provide biased and inefficient estimates [10].
In addition to model fit, the analysis examined potential multicollinearity. Pairwise, correlations among explanatory variables were uniformly low, confirming that multicollinearity is not a concern in the estimated specifications. This ensures that the estimated coefficients can be interpreted reliably and that statistical inference is not distorted by the inclusion of any redundant regressors.
Interpretation of results from estimation focuses on the direction, size, and significance of the key variables in both bivariate models, with a particular emphasis on those variables that vary across scenario pairings. Such variations provide insight into how observed attributes and unobserved heterogeneity interact as Metro service attributes improve. Model estimation results for the Scenario 1–Scenario 2 model are presented in Table 8, and model results for the Scenario 2–Scenario 3 model are presented in Table 9.
Table 8.
Model 1: Correlated random parameters bivariate binary probit model estimation results for Scenario 1 and Scenario 2.
Table 9.
Model 2: Correlated random parameters bivariate binary probit model estimation results for Scenario 2 and Scenario 3.
The estimation results for the Scenario 1–Scenario 2 model indicate that individuals’ WTS to the Metro at the early stages of service improvement is shaped by a combination of socio-economic characteristics, trip characteristics, and attributes of the used modes.
Most of these have a direction and statistical significance consistent with a priori expectations. The socio-demographic effects suggest that those with lower incomes are significantly less likely to switch to Metro in both scenarios. This might suggest some form of ‘vertical equity’ issues where the new service does not have equitable benefit distribution. The results also show those aged 60+ are less likely to switch in Scenario 2. This might be due to a lower inclination to change their routine, or a higher preference for door-to-door travel and proximity to origins and destinations, potentially driven by health-related factors.
Trip purposes are another factor that influences WTS, where trips to work have a lower probability of switching to Metro in Scenario 1, which is the cheapest but least competitive. This indicates that limited service improvements are insufficient to motivate commuters, who place greater importance on reliable and consistent service. In contrast, education and social or entertainment trips are positively associated with WTS in Scenario 2, indicating that non-work travel purposes are responsive to improved service attributes once the Metro becomes more competitive.
The result for the higher overall trip cost, excluding the access and egress costs, which are separately modeled, indicates a positive relationship between WTS to Metro and the two scenarios. This aligns with the intuitive understanding that higher current travel costs increase the willingness to switch. It is also noteworthy that waiting time is included as a random parameter in Scenario 2, reflecting significant individual variation in perceptions of waiting time. In addition, access time is included as a random parameter in Scenario 1 [68].
Gender is incorporated as a heterogeneity-in-means variable that affects the distribution of the waiting time parameter, shifting the peak of the distribution of the βs to the right, in other words, increasing the number of βs above zero. This indicates that women have a higher average disutility from waiting, i.e., are more sensitive to waiting time than men. As waiting time increases, the probability of switching to the Metro also increases, implying that women are more responsive to interventions that reduce waiting time.
Another important factor is expectations regarding access to Metro. Individuals who expect to walk to and from Metro stations exhibit a higher WTS across all scenarios. This suggests that convenient walking access and proximity to origins and destinations enhance the Metro service’s attractiveness.
The estimation results for the Scenario 2 to Scenario 3 system reflect individuals’ WTS to Metro under more advanced service improvements that are examined using the same broad categories of explanatory variables, namely socio-economic characteristics, trip characteristics, and attributes of the currently utilized mode, with coefficient signs and significance generally consistent with theoretical expectations.
Although the specification of Scenario 2 is identical across both bivariate systems, the statistical significance of certain parameters varies depending on the paired scenario. In particular, the indicator for the lowest travel time as the primary rationale for current mode choice is statistically significant when Scenario 2 is jointly estimated with Scenario 1 but becomes insignificant when Scenario 2 is paired with Scenario 3.
This variation stems from the high degree of interdependence captured by the bivariate framework. When Scenario 2 is jointly estimated with Scenario 3, the strong cross-equation error correlation (ρ = 0.912) implies that the unobserved factors driving the choice are almost identical across the two scenarios. In this context, the shared error structure accounts for most of the variation in user preferences, effectively diminishing the explanatory power of the indicator reflecting ‘lowest travel time’ as the primary reason for current mode choice. Consequently, this variable becomes statistically redundant because the strong correlation between the scenarios effectively captures the underlying WTS.
In addition to structural relationships, the results indicate a shift in the composition of Metro users as the service becomes a premium product. In Scenario 2, the low-income marker remains negative and statistically significant, reinforcing the idea that cost remains a barrier for the low-income individuals. Consistent with earlier studies in developing cities, fare affordability remains an important limiting factor in the use of formal services by low-income groups [48,49,52]. In Scenario 3, the high-income indicator becomes positive and statistically significant, suggesting that the substantial time savings associated with higher quality service attract wealthier travelers, who are less sensitive to fare increases and place greater value on speed and service quality.
In Scenario 3, the indicator for respondents younger than 18 is specified as a random parameter. The mean effect is negative (–0.333), indicating that young respondents are less likely to shift; however, there remains a subset for whom the premium Metro service is viewed positively and who are willing to switch under enhanced service conditions. As we look at those 60 and above, resistance increases as service gets better. Note how the coefficient changes from −0.542 in Scenario 2 to −1.15 in Scenario 3. This indicates a strong resistance to changing behavior and a desire to retain the door-to-door benefit of other informal options.
Characteristics of the currently used mode also act as important drivers of mode shift in Model 2, particularly those related to reliability. Consistent with Model 1, the waiting time of the current mode in Scenario 2 is specified as a random parameter, with heterogeneity in means driven by gender.
Results indicate that female respondents are more sensitive to waiting times. This means that, in practice, female respondents are more inclined to switch to the Metro if their current mode has long waiting times. This indicates the potential of formal transit to address female-specific issues of reliability and safety. In addition, the time spent on the currently used mode will only be important in Scenario 3. This shows that the best service offered by the Metro will only attract those who are already accustomed to significantly long waiting times and are willing to pay more for significant time savings.
Considering the results from both Model 1 and Model 2, it is evident that general trends emerge as service scenarios progress. First, Alternative Specific Constants (ASCs) become more negative with scenario progression, from −0.533 to −1.53, indicating that as service scenarios progress and fares increase, respondents are more willing to maintain their current mode of transport. This shows that for respondents to adopt higher service tiers, there should be significant gains in service performance or highly competitive pricing.
As service scenarios evolve, the importance of walking accessibility also changes. While expected access and egress remain positive and statistically significant predictors of Metro adoption across all scenarios, their impact diminishes as service scenarios progress. This shows that walking accessibility to and from Metro stations are more important in less-competitive scenarios where service quality remains low. In contrast, as service scenarios progress and service quality improves, other factors become more important to respondents in adopting the Metro mode of transport. All model results were estimated using a simulated maximum likelihood estimation with 1000 Halton draws.
This number is well above typical values used in the literature, where as few as 200 Halton draws are often sufficient [8,22]. Through experimentation with increasing numbers of draws, this level was found to provide stable and reliable estimation results.
Overall, the results show that travelers respond differently to improvements in Metro service across scenarios. While better service attracts some groups, particularly higher-income and time-sensitive travelers, cost remains a key barrier for others, especially low-income individuals. In addition, behavioral resistance is evident among certain groups, such as older respondents, who prefer to retain their current mode even when service quality improves. At the same time, factors related to reliability, such as waiting time, and accessibility, such as walking access to and from stations, continue to play an important role in influencing decisions. This suggests that improving service alone is not sufficient to encourage a shift. Instead, a balanced approach that combines reasonable pricing, improved reliability, and good accessibility is needed to attract a wider range of users and support the transition from informal to formal transport systems.
From the analysis, it can be concluded that the bivariate models (Scenarios 1–2 and 2–3) show several key factors, including socio-demographic characteristics, trip attributes, current mode attributes, and Metro expectations, influence WTS. Key findings can be summarized as follows:
- Socio-demographics: Low-income individuals (<6000 EGP) are less likely to shift across scenarios (e.g., Coeff. = −0.262 in Scenario 2, t-stat = −3.14), while high-income (>20,000 EGP) are more likely in Scenario 3 (Coeff. = 0.751, t-stat = 3.37). Older adults (60+) show strong resistance, particularly in later scenarios (Coeff. = −1.15 in Scenario 3, t-stat = −3.25). Females are more sensitive to waiting times on current modes (heterogeneity in means: Coeff. = 0.008 for gender interaction, t-stat = 2.57).
- Trip characteristics: Work trips are less likely to shift in early scenarios; education and social/entertainment trips are more responsive in Scenario 2 (Coeff. = 0.357 and 0.214, t-stats = 3.41 and 1.76).
- Current mode attributes: Higher waiting time (random parameter, SD = 0.015, t-stat = 9.21) and increased access time increase WTS, especially if current mode chosen for time savings (Coeff. = 0.246 in Scenario 3, t-stat = 2.83). Total trip time matters more in Scenario 3 (Coeff. = 0.364, t-stat = 4.13).
- Metro expectations: Walking access/egress strongly positive (Coeff. = 0.525 for access and 0.473 for egress in Scenario 3, t-stats = 5.75 and 5.25), but the impact diminishes as service improves.
- Alternative specific constants: ATCs become increasingly negative with scenarios progression (−0.533 to −1.53), indicating that as service improves and fares increase, travelers are more inclined to retain their current modes.
Overall, the model demonstrates decent performance, with high and statistically significant cross-equation error correlations, confirming the interdependence across scenarios.
6. Marginal Effect Analysis
Since the parameter estimates in the bivariate probit model do not directly indicate the effect size of the independent variable on the outcome probabilities, marginal effects are calculated to measure it. Marginal effect analysis is conducted for each equation in the bivariate probit model using the respective parameter estimates. For continuous variables such as travel time and cost, the marginal effect is the rate of change in the outcome probability with respect to the variable at the sample means. In the probit model, the marginal effect is calculated as the product of the standard normal density function and the respective parameter estimate [10,23]:
where is the probability density function of the standard normal distribution, is the vector of estimated parameters, and is the vector of explanatory variables held at their means.
For binary indicator variables (e.g., income status indicator), calculating a derivative is not appropriate. Instead, discrete marginal effects (sometimes referred to as pseudo-elasticities in the transportation econometrics literature) are computed. These effects represent the absolute change in the predicted probability when the variable shifts from 0 to 1, holding all other variables constant [10,36]:
where is the cumulative distribution function of a standard normal distribution; these measures provide a direct estimate of the degree of probability change with respect to a specific attribute.
The sign of the marginal effect indicates the direction of each variable’s influence on the probability of Metro adoption. Specifically, positive marginal effects indicate that an increase in the corresponding variable is associated with a higher probability of adopting the Metro. In contrast, negative marginal effects indicate a decrease in that probability, assuming other factors remain constant.
The marginal effects reported in Table 10 for models 1 and 2 provide an in-depth analysis of the impact of each variable on the probability of adopting the proposed Metro extension. The results show that physical accessibility is the primary factor in determining the probability of adoption. Among all variables, those most significant in positively influencing adoption are related to access to and egress from the Metro stations.
Table 10.
Marginal effects on willingness to shift to Metro.
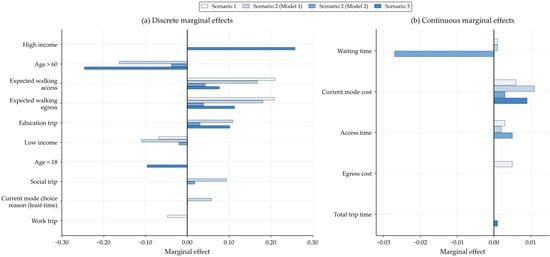
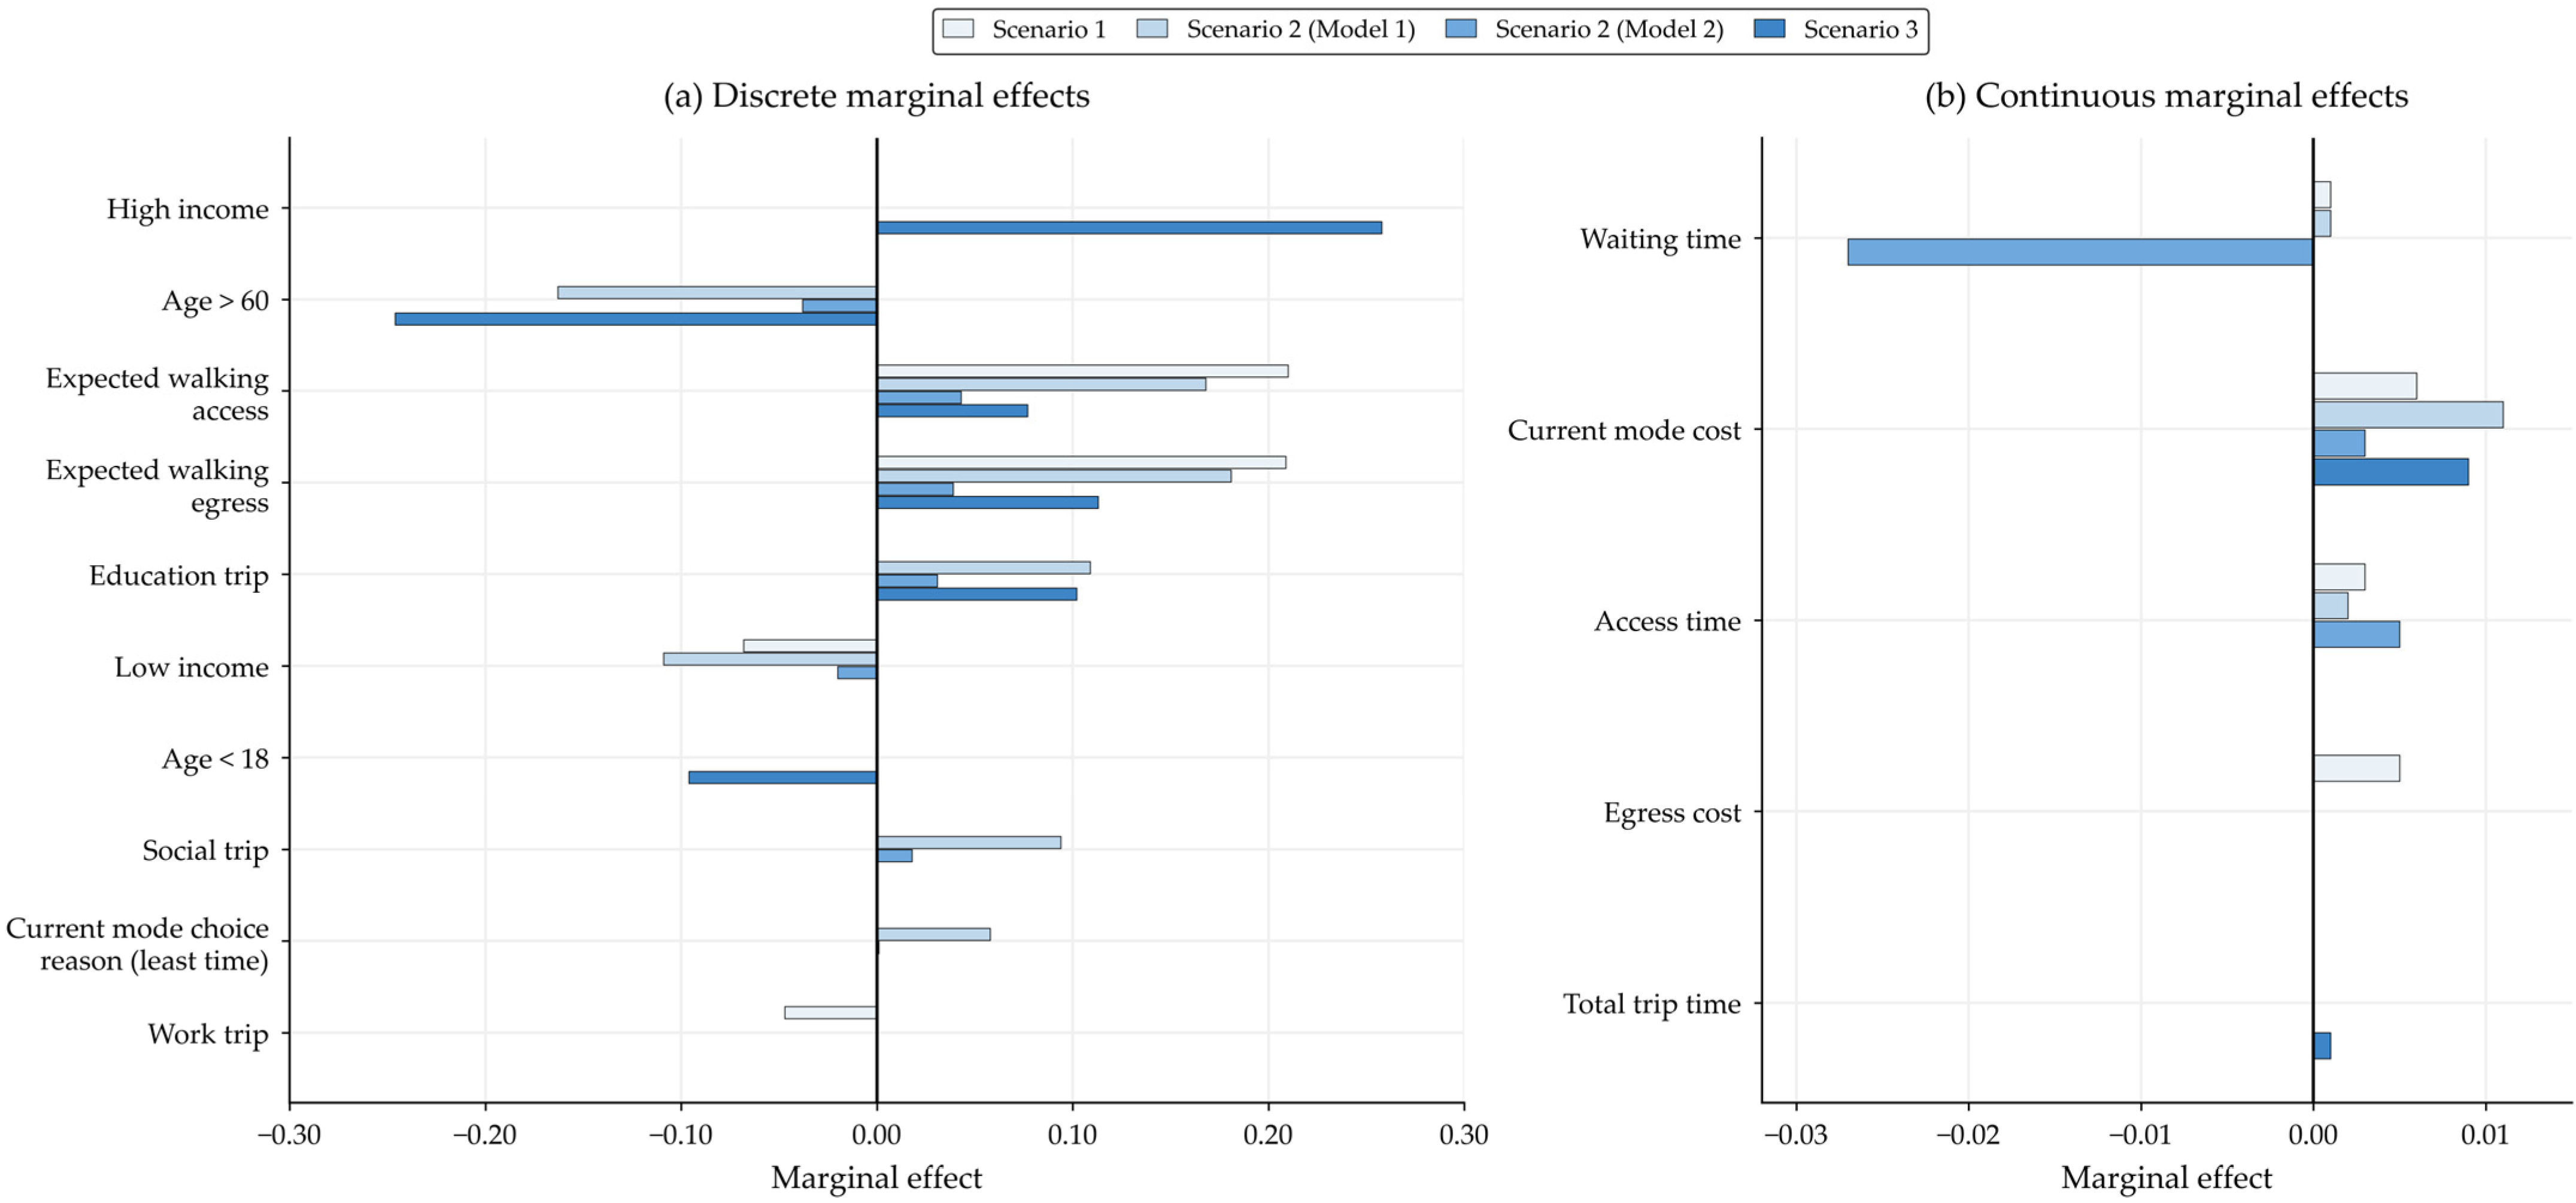
The probability of adoption is particularly high for individuals who expect to access or egress from the Metro on foot. For example, the increase in the probability of adoption due to walking access, as revealed by Model 1 (Scenario 1), is 21.0 percent, while the increase due to walking egress is 20.9 percent.
The high sensitivity of the adoption probability to access to and egress from the Metro underscores the importance of walkability as a primary condition for maximizing Metro utility, as the probability decreases substantially in the absence of walkable access.
The results clearly indicate that age and income strongly influence how people choose their travel modes. Older adults, particularly those over 60, are less likely to switch to the Metro, with negative marginal effects ranging from −3.8% to −24.6%. This pattern is not unexpected, as older travelers often prefer more familiar and comfortable options, such as taxis or private cars, and some may also have concerns about navigating Metro stations or using stairs.
Income also plays an important role. Individuals with lower incomes are less likely to switch, possibly because the proposed Metro fares appear relatively expensive compared with the cost of informal transit. In contrast, higher-income individuals in Model 2, Scenario 3 show a 25.8% greater likelihood of switching. This suggests that when the Metro offers higher quality service, it becomes more attractive to commuters who prioritize faster and more convenient travel over saving money.
However, travel behavior is not only shaped by individual characteristics but also by current travel conditions. As the cost or travel time of the existing mode increases, the Metro becomes more appealing. For each unit increase in the cost of the current mode, the probability of switching to the Metro rises by about 0.3% to 1.1%.
Trip purpose also influences switching behavior, although the effects vary by scenario. In Scenario 1, commuters traveling to work are about 4.7% less likely to adopt the Metro, likely because they rely on stable routines and require dependable travel options, making a basic Metro service less attractive. However, in scenario 2, when service quality improves, students and leisure travelers become much more likely to switch, reflecting greater flexibility. In Scenario 3, even with premium service, education trip travelers continue to show a strong willingness to switch to the Metro, indicating consistent openness to switching across scenarios.
Overall, these results show that willingness to shift is not driven by a single factor, but by a combination of service characteristics and user-specific conditions. While improvements in travel time and reduced costs increase the Metro’s attractiveness, their impact varies across individuals. Accessibility, especially walkability to and from stations, plays a central role, while socio-demographic factors such as age and income shape how different groups respond to these improvements.
Figure 2 presents the marginal effects on the probability of shifting to the Metro across scenarios. Panel (a) illustrates the effects of discrete variables, representing the change in predicted probability when variables shift from 0 to 1. Panel (b) presents the effects of continuous variables, capturing the marginal change in probability associated with a one-unit increase in each variable. Separation between the two panels is necessary because these effects represent different measures and are not directly comparable in magnitude.
Figure 2.
(a) Discrete marginal effects; (b) Continuous marginal effects on the probability of shifting to the proposed Metro system under different service scenarios. Scenario 1 reflects a 10% reduction in total travel time with a fare of 10 EGP; Scenario 2 reflects a 25% reduction with a fare of 20 EGP (Model 1 and Model 2); and Scenario 3 reflects a 50% reduction with a fare of 30 EGP.
It could be concluded from the marginal effect analysis that:
- Accessibility dominates: Walking access increases WTS from 21.0% (Scenario 1) to 10.3% (Scenario 3), while walking egress shows a similar positive effect (20.9% to 9.9%).
- Age and income: Older individuals (60+) are associated with reduced WTS (−3.8% to −24.6%), while low-income individuals are also associated with lower WTS (−6.5% to −8.2%). In contrast, high-income individuals are associated with higher WTS in Scenario 3 (+25.8%).
- Other factors: Younger individuals (<18) exhibit mixed effects, with some positive shifts in higher quality scenarios. Work trips are associated with lower WTS in the early stages, while higher current mode costs are associated with an increase in WTS (0.3% to 1.1%).
Overall, while time or cost influence decisions, walkability emerges as the strongest driver of Metro adoption. Moreover, low-income and older groups face notable barriers, and females are more sensitive to waiting times. As service improves, high-income users are more attracted; however, equity concerns remain without supportive policies such as subsidies or improved integration.
7. Policy Implications
Based on the findings from the estimation of the bivariate random parameter models, several implications for transportation planners and policymakers who aim to facilitate the transition from informal to formal transit in developing urban areas can be established.
First and foremost, the emphasis on walkable access and egress in the marginal effect analysis highlights the importance of accessibility, and first- and last-mile connectivity for the success of the formal transit mode. The analysis indicates that the likelihood of transitioning to the Metro decreases significantly for individuals who cannot walk to and from stations. In the case of Alexandria, where informal modes offer the advantage of door-to-door services, the development of the Metro infrastructure would be insufficient.
Second, the analysis reveals a distinct gender disparity regarding service reliability. The heterogeneity-in-means variable indicated that female travelers are significantly more sensitive to waiting times. Waiting time and service reliability have consistently been shown to impose a disproportionately high disutility relative to in-vehicle travel time in public transport systems [14]. This suggests that reliability improvements and station environment enhancements are not only operational concerns but issues of gender equity. Policymakers should prioritize safety features at stations (e.g., lighting, CCTV surveillance, emergency call buttons) and real-time passenger information systems to reduce perceived wait times and to lower the disutility of waiting for all travelers, particularly female travelers [69].
Third, the evident resistance to change among low-income and elderly groups also points to potential vertical equity issues. When service quality improves (Scenario 3), high-income groups are attracted by time savings, while low-income groups remain resistant due to cost issues across all service levels. To avoid the new Metro service being accessible only by the elite, fare integration strategies or low-income group subsidies need to be incorporated (e.g., fare discounts, monthly pass subsidies, income-based pricing mechanisms). Furthermore, recognizing that elderly users also require door-to-door services implies that informal services will continue alongside Metro services. Thus, these services need to be included in policy frameworks, with an emphasis on their gradual formalization and sustainability, rather than assuming the Metro service will replace them.
The presence of strong, significant cross-equation error correlations suggests that responses in the WTS for sequential service scenarios are, in fact, driven by underlying factors that are not explicitly captured by the data. This implies that travelers who show evidence of an inclination to adopt the Metro at a specific service level exhibit a latent tendency across other service levels, irrespective of the specific service attributes involved. Thus, if each scenario is treated in isolation, the underlying latent structure is not captured, thereby underscoring the need for joint modeling in evaluating service-level changes.
8. Limitations and Future Research
The study makes an important contribution to the body of evidence on WTS; however, several limitations should be noted. Firstly, the study is based on stated preference data. Although stated preference methods are necessary to elicit responses to hypothetical alternatives, they are often criticized for being prone to hypothetical bias, i.e., people may be more willing to engage in hypothetical behavior that is considered socially desirable, such as switching to sustainable transport modes [70]. Moreover, the study could be further strengthened by incorporating revealed preference data once the Metro extension project becomes operational.
Secondly, the study uses a simple choice scenario in which the respondents are asked to choose whether they will continue with the same mode or switch to the Metro in each scenario. Although this type of choice scenario is appropriate for eliciting responses on willingness to shift under hypothetical service improvements, it fails to account for more complex changes in travel behavior.
Finally, the study does not investigate the effect of informal operators’ supply-side responses. In many developing cities, informal operators may lower fares or alter routes in response to new formal competition [1]. Forthcoming research should investigate these competitive dynamics to forecast long-term equilibrium market shares better.
9. Conclusions
This research investigates the factors shaping travelers’ WTS from informal transportation modes to a formal Metro service extension in Alexandria, Egypt. The results indicate that travelers exhibit a moderate willingness to shift from informal transportation modes to the proposed Metro system.
A correlated random parameters bivariate probit model is employed to jointly capture responses across successive service improvement scenarios. The estimated cross-equation error correlations of (0.816 for Scenario 1–2 and 0.912 for Scenario 2–3) are large and highly significant, confirming strong interdependence between decision and supporting the use of a joint modeling framework. Methodologically, these findings validate the use of bivariate approaches over univariate approaches, which would have led to biased results.
Socio-demographic factors play a key role in shaping behavior. Low-income individuals and older adults aged 60 and above are less likely to shift, reflecting affordability constraints and habitual preferences, and suggesting potential vertical equity concerns. Female travelers show greater sensitivity to waiting time, indicating higher responsiveness to service reliability improvements.
While travel time and cost remain important, accessibility and reliability emerge as the most critical determinants of willingness to shift. In particular, walkability to and from stations is identified as the strongest driver of mode shift across most scenarios.
Overall, the results suggest that achieving a successful transition from informal to formal transportation in developing cities requires more than the provision of infrastructure. Enhancing accessibility, reliability, and inclusive design, especially walkable access to and from stations, is essential to encourage adoption and support sustainable urban mobility.
Author Contributions
Conceptualization, Z.S., A.M.D. and M.S.A.; methodology, Z.S., A.M.D. and M.S.A.; software, Z.S., A.M.D. and M.S.A.; validation, Z.S., A.M.D. and M.S.A.; formal analysis, Z.S., A.M.D. and M.S.A.; investigation, Z.S., A.M.D. and M.S.A.; data curation, Z.S., A.M.D. and M.S.A.; writing—original draft preparation, Z.S., A.M.D. and M.S.A.; writing—review and editing, Z.S., A.M.D. and M.S.A.; visualization, Z.S., A.M.D. and M.S.A.; supervision, Z.S., A.M.D. and M.S.A. All authors have read and agreed to the published version of the manuscript.
Funding
This research received no external funding.
Institutional Review Board Statement
Ethical review and approval were waived for this study because such approvals are typically required in Egypt for clinical or medical research involving human subjects. For anonymous survey-based studies that do not involve sensitive information or personally identifiable data, formal IRB approval is generally not required. In our case, the survey was fully anonymous and did not collect any personal or sensitive information from participants.
Informed Consent Statement
Informed consent was obtained from all subjects involved in the study.
Data Availability Statement
The data presented in this study are available from the corresponding author upon request but are not publicly available due to privacy concerns.
Conflicts of Interest
The authors declare no conflicts of interest.
Abbreviations
The following abbreviations are used in this manuscript:
| WTS | Willingness to shift |
| EGP | Egyptian Pounds |
| AIC | Akaike Information Criterion |
| BRT | Bus Rapid Transit |
| DCE | Discrete-Choice Experiment |
| IIA | Independence of Irrelevant Alternatives |
| VTT | Value of Travel Time |
| SP | Stated Preference |
| MaaS | Mobility-as-a-Service |
| UAM | Urban Air Mobility |
| HCM | Hybrid Choice Model |
References
- Cervero, R.; Golub, A. Informal Transport: A Global Perspective. Transp. Policy 2007, 14, 445–457. [Google Scholar] [CrossRef] [Scilit]
- Shahab, H.; Mohammed, H. Formalizing Public Transit in Mid-Sized Developing Cities: A Review of Strategies for Sustainable and Resilient Mobility. ARO-Sci. J. KOYA Univ. 2025, 13, 45–63. [Google Scholar] [CrossRef] [Scilit]
- Hidalgo, D.; Muñoz, J.C. A Review of Technological Improvements in Bus Rapid Transit (BRT) and Buses with High Level of Service (BHLS). Public Transp. 2014, 6, 185–213. [Google Scholar] [CrossRef] [Scilit]
- Beirão, G.; Cabral, J.S. Understanding Attitudes towards Public Transport and Private Car: A Qualitative Study. Transp. Policy 2007, 14, 478–489. [Google Scholar] [CrossRef] [Scilit]
- Tucho, G.T. A Review on the Socio-Economic Impacts of Informal Transportation and Its Complementarity to Address Equity and Achieve Sustainable Development Goals. J. Eng. Appl. Sci. 2022, 69, 28. [Google Scholar] [CrossRef] [Scilit]
- Assembly, G. Resolution Adopted by the General Assembly on 11 September 2015; United Nations: New York, NY, USA, 2015; Volume 14. [Google Scholar]
- Greene, W.H. Econometric Analysis; Pretence Hall: Saddle River, NJ, USA, 2003. [Google Scholar]
- Train, K.E. Discrete Choice Methods with Simulation; Cambridge University Press: Cambridge, UK, 2009. [Google Scholar]
- Fiebig, D.G.; Keane, M.P.; Louviere, J.; Wasi, N. The Generalized Multinomial Logit Model: Accounting for Scale and Coefficient Heterogeneity. Mark. Sci. 2010, 29, 393–421. [Google Scholar] [CrossRef] [Scilit]
- Washington, S.; Karlaftis, M.G.; Mannering, F.; Anastasopoulos, P. Statistical and Econometric Methods for Transportation Data Analysis; Chapman and Hall/CRC: Boca Raton, FL, USA, 2020. [Google Scholar]
- McFadden, D. The Measurement of Urban Travel Demand. J. Public Econ. 1974, 3, 303–328. [Google Scholar] [CrossRef] [Scilit]
- Ben-Akiva, M.E.; Lerman, S.R. Discrete Choice Analysis: Theory and Application to Travel Demand; MIT Press: Cambridge, MA, USA, 1985; Volume 9. [Google Scholar]
- Koppelman, F.S.; Bhat, C. A Self Instructing Course in Mode Choice Modeling: Multinomial and Nested Logit Models. 2006. Available online: https://tfresource.github.io/modechoice/ (accessed on 5 March 2026).
- Paulley, N.; Balcombe, R.; Mackett, R.; Titheridge, H.; Preston, J.; Wardman, M.; Shires, J.; White, P. The Demand for Public Transport: The Effects of Fares, Quality of Service, Income and Car Ownership. Transp. Policy 2006, 13, 295–306. [Google Scholar] [CrossRef] [Scilit]
- Redman, L.; Friman, M.; Gärling, T.; Hartig, T. Quality Attributes of Public Transport That Attract Car Users: A Research Review. Transp. Policy 2013, 25, 119–127. [Google Scholar] [CrossRef] [Scilit]
- Vichiensan, V.; Wasuntarasook, V.; Malaitham, S.; Fukuda, A.; Rujopakarn, W. Willingness to Pay for Station Access Transport: A Mixed Logit Model with Heterogeneous Travel Time Valuation. Sustainability 2025, 17, 6715. [Google Scholar] [CrossRef] [Scilit]
- Ranjan, R.; Sinha, S. Evaluating Commuter Mode Choice Behaviour and Value of Travel Time for Fuel-Based Bus Alternatives in Urban Areas. Innov. Infrastruct. Solut. 2025, 10, 397. [Google Scholar] [CrossRef] [Scilit]
- Bansal, P.; Daziano, R.A.; Achtnicht, M. Extending the Logit-Mixed Logit Model for a Combination of Random and Fixed Parameters. J. Choice Model. 2018, 27, 88–96. [Google Scholar] [CrossRef] [Scilit]
- Bocarejo, J.P.; Urrego, L.F. The Impacts of Formalization and Integration of Public Transport in Social Equity: The Case of Bogota. Res. Transp. Bus. Manag. 2022, 42, 100560. [Google Scholar] [CrossRef] [Scilit]
- Tun, T.H.; Welle, B.; Hidalgo, D.; Albuquerque, C.; Castellanos, S.; Sclar, R.; Escalante, D. Informal and Semiformal Services in Latin America: An Overview of Public Transportation Reforms. 2020. Available online: https://publications.iadb.org/en/informal-and-semiformal-services-latin-america-overview-public-transportation-reforms (accessed on 5 March 2026).
- McFadden, D.; Train, K. Mixed MNL Models for Discrete Response. J. Appl. Econom. 2000, 15, 447–470. [Google Scholar] [CrossRef]
- Bhat, C.R. Quasi-Random Maximum Simulated Likelihood Estimation of the Mixed Multinomial Logit Model. Transp. Res. Part B Methodol. 2001, 35, 677–693. [Google Scholar] [CrossRef] [Scilit]
- Hensher, D.A.; Greene, W.H. The Mixed Logit Model: The State of Practice. Transportation 2003, 30, 133–176. [Google Scholar] [CrossRef] [Scilit]
- Liu, B.; Ma, Z.; Kong, H.; Ma, X. How Incentives Affect Commuter Willingness for Public Transport: Analysis of Travel Mode Shift across Various Cities. Travel Behav. Soc. 2025, 39, 100966. [Google Scholar] [CrossRef] [Scilit]
- Mehbub Anwar, A.; Tieu, K.; Gibson, P.; Win, K.T.; Berryman, M.J. Analysing the Heterogeneity of Traveller Mode Choice Preference Using a Random Parameter Logit Model from the Perspective of Principal-Agent Theory. Int. J. Logist. Syst. Manag. 2014, 17, 447–471. [Google Scholar] [CrossRef] [Scilit]
- Saxena, A.; Rao, K.K.; Sethi, V. Accounting for Mode Choice Heterogeneity under Travel Demand Management Strategies in a Developing Country. J. Transp. Eng. Part A Syst. 2026, 152, 04026020. [Google Scholar] [CrossRef] [Scilit]
- Liu, Y.; Liang, G.; Chen, Z.; Gao, Z. Neural Integrated Choice Model with ParetoTail and Gaussian Copula for Travel Behavior Analysis. Travel Behav. Soc. 2026, 44, 101252. [Google Scholar] [CrossRef] [Scilit]
- Tanwar, R.; Chaudhary, S.; Umare, S. Travel Mode Choice and Time Valuation Differences between Commuters and Non-Commuters in Bhopal. Discov. Civ. Eng. 2026, 3, 10. [Google Scholar] [CrossRef] [Scilit]
- Zhang, H.; Xue, X.; Zhai, G.; Yang, H.; Lu, X.; Cherry, C.R. Choice Preferences for Urban Air Mobility: A Latent Class Discrete Choice Model with Mixed Logit Extensions. Travel Behav. Soc. 2026, 43, 101229. [Google Scholar] [CrossRef] [Scilit]
- Vichiensan, V.; Wasuntarasook, V.; Malaitham, S.; Fukuda, A.; Rujopakarn, W. Revealing Preferences for Bangkok Metro Station Access Modes through Perceptions of Safety, Walkability, and Service Quality: A Hybrid Choice Modeling Approach. IATSS Res. 2026, 50, 680–690. [Google Scholar] [CrossRef] [Scilit]
- Khan, N.A.; Auld, J.A. Modeling Household-Level Party Composition Behavior for Multiparty Activities: A Random Parameter Nested Logit Modeling Approach. Transp. Lett. 2025. [Google Scholar] [CrossRef] [Scilit]
- Qi, Q.; Rasouli, S.; Feng, T. Modeling the Effects of Additional Crowd-Sourced Delivery Service on Transportation Mode Choice in Mobility-as-a-Service. Travel Behav. Soc. 2026, 42, 101159. [Google Scholar] [CrossRef] [Scilit]
- Tang, H.; Feng, T. Modeling Heterogeneous Individual Choices for Multi-Person Household MaaS Bundles. Transp. Res. Part A Policy Pract. 2026, 203, 104758. [Google Scholar] [CrossRef] [Scilit]
- Anastasopoulos, P.C.; Karlaftis, M.G.; Haddock, J.E.; Mannering, F.L. Household Automobile and Motorcycle Ownership Analyzed with Random Parameters Bivariate Ordered Probit Model. Transp. Res. Rec. 2012, 2279, 12–20. [Google Scholar] [CrossRef] [Scilit]
- Sarwar, M.T.; Anastasopoulos, P.C.; Golshani, N.; Hulme, K.F. Grouped Random Parameters Bivariate Probit Analysis of Perceived and Observed Aggressive Driving Behavior: A Driving Simulation Study. Anal. Methods Accid. Res. 2017, 13, 52–64. [Google Scholar] [CrossRef] [Scilit]
- Eker, U.; Fountas, G.; Anastasopoulos, P.C. An Exploratory Empirical Analysis of Willingness to Pay for and Use Flying Cars. Aerosp. Sci. Technol. 2020, 104, 105993. [Google Scholar] [CrossRef] [Scilit]
- Fu, C.; Chen, C.-Y. Studying Older Adults’ Willingness to Relocate and Change Transport Mode with the Random Bivariate Generalized Ordered Probit. Transp. Res. Part A Policy Pract. 2025, 191, 104322. [Google Scholar] [CrossRef] [Scilit]
- Liu, S.; Yamamoto, T.; Yao, E. Joint Modeling of Mode Choice and Travel Distance with Intra-Household Interactions. Transportation 2022, 50, 1527–1552. [Google Scholar] [CrossRef] [Scilit]
- Keya, N.; Anowar, S.; Eluru, N. Joint Model of Freight Mode Choice and Shipment Size: A Copula-Based Random Regret Minimization Framework. Transp. Res. Part E Logist. Transp. Rev. 2019, 125, 97–115. [Google Scholar] [CrossRef] [Scilit]
- Ermagun, A.; Samimi, A. Mode Choice and Travel Distance Joint Models in School Trips. Transportation 2018, 45, 1755–1781. [Google Scholar] [CrossRef] [Scilit]
- Ermagun, A.; Rashidi, T.H.; Samimi, A. A Joint Model for Mode Choice and Escort Decisions of School Trips. Transp. A Transp. Sci. 2015, 11, 270–289. [Google Scholar] [CrossRef] [Scilit]
- Seyedabrishami, S.; Izadi, A. A Copula-Based Joint Model to Capture the Interaction between Mode and Departure Time Choices in Urban Trips. Transp. Res. Procedia 2019, 41, 722–730. [Google Scholar] [CrossRef] [Scilit]
- Bilal, M.; Son, S.; Jang, K. Traveler’s Interactive Decision-Making Behavior between Itinerary and Mode Choice Using Copula-Based Discrete-Count Joint Modeling. Transportation 2023, 52, 1249–1266. [Google Scholar] [CrossRef] [Scilit]
- Cervero, R. Linking Urban Transport and Land Use in Developing Countries. J. Transp. Land Use 2013, 6, 7–24. [Google Scholar] [CrossRef] [Scilit]
- Un-Habitat. Financing Urban Shelter: Global Report on Human Settlements 2005; Routledge: London, UK, 2013. [Google Scholar]
- Kumar, A.; Barrett, F. Stuck in Traffic: Urban Transport in Africa; AICD Background paper; World Bank: Washington, DC, USA, 2008; Volume 1. [Google Scholar]
- Alcorn, L.G. Informal Transit Integration with Planned Transit Systems in Lagos, Nigeria. Master’s Thesis, The University of Texas at Austin, Austin, TX, USA, 2019. [Google Scholar]
- Carruthers, R.; Dick, M.; Saurkar, A. Affordability of Public Transport in Developing Countries. 2005. Available online: https://openknowledge.worldbank.org/entities/publication/a6cc89e1-abc1-5db7-8eee-dd7928fdbb82 (accessed on 5 March 2026).
- Gwilliam, K.M. Cities on the Move: A World Bank Urban Transport Strategy Review; World Bank Publications: Washington, DC, USA, 2002. [Google Scholar]
- Salon, D.; Gulyani, S. Mobility, Poverty, and Gender: Travel ‘Choices’ of Slum Residents in Nairobi, Kenya. Transp. Rev. 2010, 30, 641–657. [Google Scholar] [CrossRef] [Scilit]
- Abane, A.M. Travel Behaviour in Ghana: Empirical Observations from Four Metropolitan Areas. J. Transp. Geogr. 2011, 19, 313–322. [Google Scholar] [CrossRef] [Scilit]
- Behrens, R.; McCormick, D.; Mfinanga, D. Paratransit in African Cities: Operations, Regulation and Reform; Routledge: London, UK, 2016. [Google Scholar]
- Venter, C. The Lurch towards Formalisation: Lessons from the Implementation of BRT in Johannesburg, South Africa. Res. Transp. Econ. 2013, 39, 114–120. [Google Scholar] [CrossRef] [Scilit]
- Flores-Dewey, O.; Zegras, C. The costs of inclusion: Incorporating existing bus and paratransit operators into Mexico City’s BRT. In Proceedings of the Conference on Advanced Systems for Public Transport, Santiago, Chile, 23–27 July 2012. [Google Scholar]
- Agbiboa, D.E. ‘No Condition IS Permanent’: Informal Transport Workers and Labour Precarity in Africa’s Largest City. Int. J. Urban Reg. Res. 2016, 40, 936–957. [Google Scholar] [CrossRef] [Scilit]
- Pojani, D.; Stead, D. Sustainable Urban Transport in the Developing World: Beyond Megacities. Sustainability 2015, 7, 7784–7805. [Google Scholar] [CrossRef] [Scilit]
- Cervero, R. Informal Transit: Learning from the Developing World. Access Mag. 2001, 1, 15–22. [Google Scholar]
- Kumar, A.; Zimmerman, S.; Arroyo Arroyo, F. Myths and Realities of Informal Public Transport in Developing Countries; World Bank: Washington, DC, USA, 2021. [Google Scholar]
- Cervero, R. Informal Transport in the Developing World; Un-Habitat: Nairobi, Kenya, 2000. [Google Scholar]
- Kassa, F. Informal Transport and Its Effects in the Developing World: A Case Study of Addis Ababa, Ethiopia. J. Transp. Lit. 2014, 8, 113–133. [Google Scholar] [CrossRef] [Scilit]
- Jauregui-Fung, F.; Kenworthy, J.; Almaaroufi, S.; Pulido-Castro, N.; Pereira, S.; Golda-Pongratz, K. Anatomy of an Informal Transit City: Mobility Analysis of the Metropolitan Area of Lima. Urban Sci. 2019, 3, 67. [Google Scholar] [CrossRef] [Scilit]
- Yanar, T. An Examination of the Rise of Informal Public Transport Systems in Developing Countries and the Critiques about Bus Rapid Transit Systems as a Desired Solution. Trafik Ve Ulaşım Araştırmaları Derg. 2023, 6, 80–95. [Google Scholar] [CrossRef] [Scilit]
- Assele, S.Y.; Meulders, M.; Vandebroek, M. Sample Size Selection for Discrete Choice Experiments Using Design Features. J. Choice Model. 2023, 49, 100436. [Google Scholar] [CrossRef] [Scilit]
- Anastasopoulos, P.C. Random Parameters Multivariate Tobit and Zero-Inflated Count Data Models: Addressing Unobserved and Zero-State Heterogeneity in Accident Injury-Severity Rate and Frequency Analysis. Anal. Methods Accid. Res. 2016, 11, 17–32. [Google Scholar] [CrossRef] [Scilit]
- Anastasopoulos, P.C.; Mannering, F.L. The Effect of Speed Limits on Drivers’ Choice of Speed: A Random Parameters Seemingly Unrelated Equations Approach. Anal. Methods Accid. Res. 2016, 10, 1–11. [Google Scholar] [CrossRef] [Scilit]
- Pantangi, S.S.; Fountas, G.; Sarwar, M.T.; Anastasopoulos, P.C.; Blatt, A.; Majka, K.; Pierowicz, J.; Mohan, S.B. A Preliminary Investigation of the Effectiveness of High Visibility Enforcement Programs Using Naturalistic Driving Study Data: A Grouped Random Parameters Approach. Anal. Methods Accid. Res. 2019, 21, 1–12. [Google Scholar] [CrossRef] [Scilit]
- Ahmed, S.S.; Cohen, J.; Anastasopoulos, P.C. A Correlated Random Parameters with Heterogeneity in Means Approach of Deer-Vehicle Collisions and Resulting Injury-Severities. Anal. Methods Accid. Res. 2021, 30, 100160. [Google Scholar] [CrossRef] [Scilit]
- Wardman, M. Public Transport Values of Time. Transp. Policy 2004, 11, 363–377. [Google Scholar] [CrossRef] [Scilit]
- Loukaitou-Sideris, A. Fear and Safety in Transit Environments from the Women’s Perspective. Secur. J. 2014, 27, 242–256. [Google Scholar] [CrossRef] [Scilit]
- Louviere, J.J.; Hensher, D.A.; Swait, J.D. Stated Choice Methods: Analysis and Applications; Cambridge University Press: Cambridge, UK, 2000. [Google Scholar]

Disclaimer/Publisher’s Note: The statements, opinions and data contained in all publications are solely those of the individual author(s) and contributor(s) and not of MDPI and/or the editor(s). MDPI and/or the editor(s) disclaim responsibility for any injury to people or property resulting from any ideas, methods, instructions or products referred to in the content. |
© 2026 by the authors. Licensee MDPI, Basel, Switzerland. This article is an open access article distributed under the terms and conditions of the Creative Commons Attribution (CC BY) license.