


Abstract
University mobility in medium-sized cities faces increasing challenges arising from traffic congestion, urban sprawl, and the limited availability of sustainable transport options. In this context, the bicycle represents an efficient and environmentally low-impact alternative, provided that safe and connected infrastructure exists to facilitate its adoption. This study assesses the potential for bicycle use in the Andean city of Loja, Ecuador, taking as a case study the university community of the Universidad Técnica Particular de Loja (UTPL). Geographic Information Systems (GIS) tools, origin–destination (OD) matrices, and logistic models were integrated to analyze the relationship between three key variables: terrain slope, minimum travel time, and the percentage of protected cycling infrastructure. The results show that protected cycling infrastructure shows the strongest positive association with the modeled probability of use, while slopes greater than 15% and trips longer than twenty minutes are associated with lower modeled probabilities. The geospatial analysis identified priority corridors where improvements in cycling protection would yield higher modeled modal returns. It is concluded that strengthening cycling connectivity and the continuity of protected routes may inform scenario-based planning to support active university mobility, offering a replicable framework for medium-sized cities with similar topographic conditions.
1. Introduction
Sustainable urban mobility represents one of the most pressing challenges in modern cities, particularly in medium-sized cities where population growth and territorial expansion are not always accompanied by transport planning aligned with sustainability, equity, and efficiency criteria. In this context, universities not only act as trip-generating hubs but also as privileged spaces for implementing active mobility policies, given their formative role and the high proportion of young people open to new forms of travel [1].
Among the most promising alternatives to conventional transport, the bicycle has become a low-cost, environmentally friendly option with positive effects on public health [2,3]. However, its widespread adoption is conditioned by a set of structural and perceptual factors: road safety, available infrastructure, terrain slope, travel time, and the degree of segregation from motorized traffic [4,5,6]. These variables are particularly relevant in Andean cities such as Loja, Ecuador, where rugged topography and road networks historically focused on automobiles hinder the daily use of bicycles as an urban transport mode.
The Latin American experience in this field has been diverse. Programs such as Ciclovía Recreativa have shown positive impacts on bicycle use, although mainly for recreational purposes and not necessarily as a structural mobility solution [7,8]. At the urban level, cities such as Bogotá, Quito, and Mexico City have demonstrated that investment in protected bikeway networks can significantly increase the probability of use, especially when implemented along continuous corridors with strong intermodal connectivity [9].
In university contexts, evidence also indicates that physical environment, distance, and the design of the cycling network are critical variables for fostering adoption [10,11]. In medium-sized cities such as Loja, where residential dispersion and limited bikeway coverage prevail, these barriers are more evident [12]. Recent studies in Ecuador have emphasized the need to integrate topographic and accessibility criteria into the planning of university bikeways, proposing analytical frameworks that combine Geographic Information Systems (GIS), mode choice models, and spatial analysis techniques [1,13].
The Propensity to Cycle Tool (PCT) methodology, widely validated in Europe, stands out for incorporating variables such as hilliness and distance to estimate cycling potential [14], but its application in Latin American cities requires local adaptations due to the complexity of road networks and urban variability. Logit models applied with GPS data have shown systematic preferences for protected routes and severe penalization of steep slopes, although they require intensive data and may exhibit self-selection bias [15,16].
Therefore, there is a need to generate local evidence using predictive and scenario-based approaches to quantify the potential for bicycle use in medium-sized Andean cities, particularly in contexts where observed cycling data are limited or unavailable. In this line, the present study analyzes the case of the Universidad Técnica Particular de Loja (UTPL), exploring the relationship between three critical factors: average slope, travel time, and the proportion of protected infrastructure along routes from residential areas to the university campus.
This study is explicitly framed as a predictive modeling exercise, in which the estimated probability represents a proxy for potential or willingness to use the bicycle, rather than observed or revealed cycling behavior. This methodological approach integrates GIS tools (QGIS, QNEAT3), raster analysis for slope estimation, and logistic modeling in RStudio 2024.12.1 (Build 563) to estimate usage probabilities under different scenarios. Accordingly, the resulting probabilities should be interpreted as comparative indcators across scenarios, not as validated predictions of actual cycling demand. The evidence gathered aims not only to support specific interventions in Loja but also to offer a replicable analytical framework for other medium-sized cities with similar characteristics. At the same time, this study contributes to the international literature on cycling mobility, particularly in non-metropolitan urban contexts where evidence-based planning remains incipient [17,18].
Thus, this work aligns with the need to advance toward more resilient and sustainable transport systems, where the bicycle can be considered not as a marginal option but as a complementary strategic component and a central axis of urban planning, especially in university environments where the potential for modal change is high. The findings should be understood within the scope of this predictive framework and do not imply causal relationships.
2. Materials and Methods
This study adopts a cross-sectional, scenario-based and predictive modeling design with a quantitative approach, whose main objective was to estimate the potential probability (propensity) of bicycle use in university mobility in the city of Loja, Ecuador. The academic community of the Universidad Técnica Particular de Loja (UTPL) was selected as the case study, as it represents a major trip-attraction node due to its high density of students, the spatial dispersion of residences, and the peripheral location of the university campus. This approach allows the assessment of how structural, spatial, topographic, and infrastructural route conditions shape modeled cycling potential under alternative scenarios.
The study population included students, faculty, and administrative staff of UTPL. Residential information was provided by the institution in anonymized form through official channels, ensuring confidentiality and the protection of personal data. Addresses were processed in the format of street intersections and geocoded into UTM coordinates (WGS84, zone 17S), following spatial anonymization protocols recommended in urban and mobility research [19]. The final sample included 2088 valid residential origin points within the urban area of Loja, adequately representing the spatial diversity of the university community.
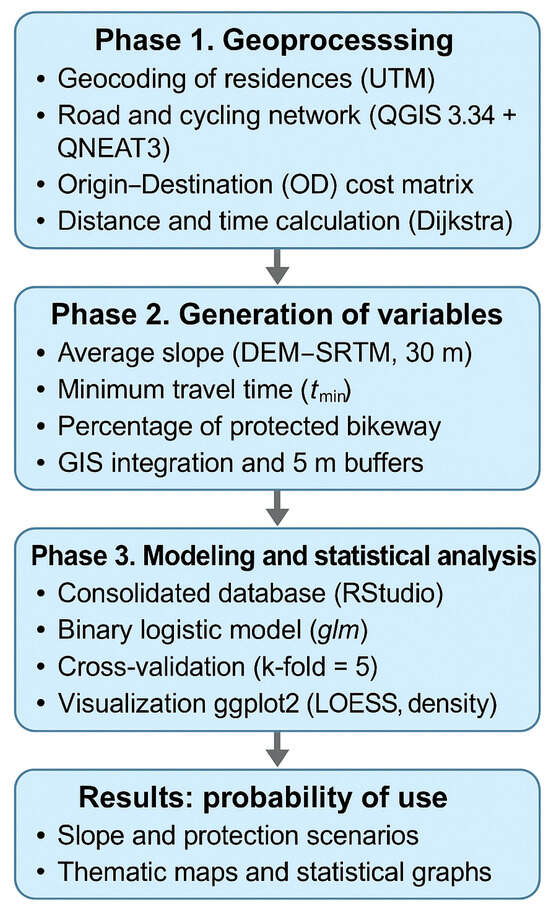
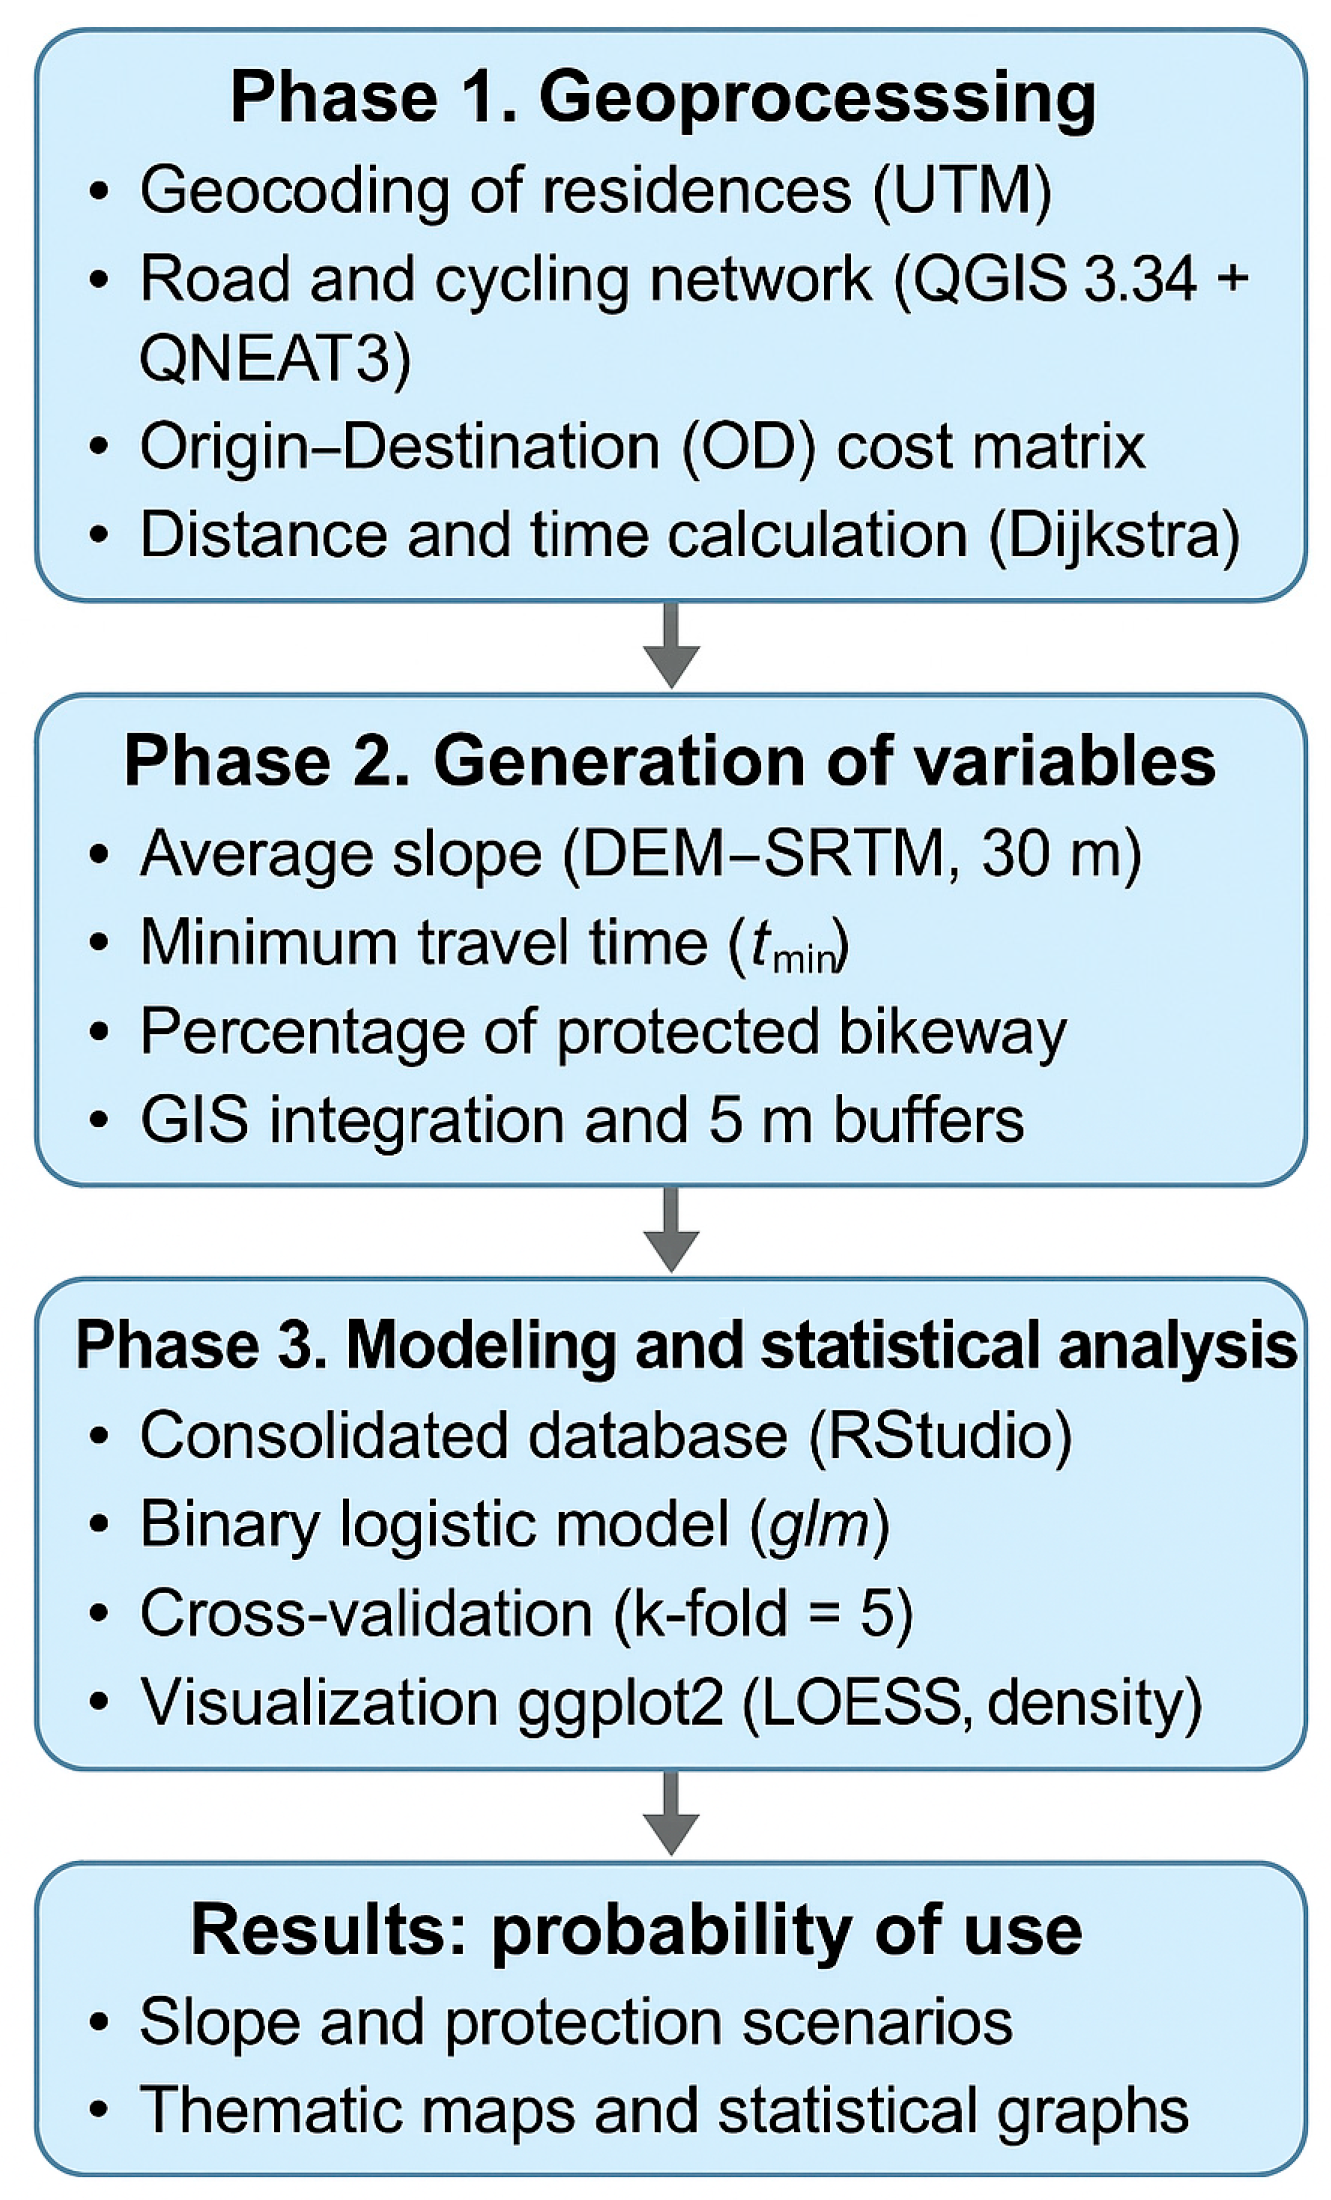
The methodological process was structured into three main phases (Figure 1), aimed at ensuring traceability, reproducibility, and transparency of the analysis.
Figure 1.
General scheme of the methodology used for the development of the research.
The study was developed following a structured protocol in three main phases to ensure the traceability and replicability of the results.
2.1. Phase 1. Origin–Destination Geoprocessing
First, residential addresses were geocoded and converted into UTM coordinates (WGS84, zone 17S). Subsequently, a cycling transport network was constructed within the QGIS 3.34 (Prague) environment using official road axes, complemented with information on existing and planned cycling infrastructure obtained from the open data portal of the local administration of Loja.
Using the QNEAT3 plugin, the origin–destination (OD) cost matrix was calculated, estimating the minimum in-network travel time and distance covered by bicycle from each origin point to the UTPL campus. This procedure provides network-based accessibility under explicit topological constraints (e.g., connectivity and directionality), rather than Euclidean distances [20].
The OD cost matrix was computed on the cycling network under a deterministic shortest-path assumption: for each origin point, the minimum generalized cost route to the UTPL campus was identified by minimizing travel time on the network. Travel time was defined at the edge level as a function of segment length and an assumed cycling speed when no speed attribute was available. This formulation follows standard time-based network impedance definitions where link travel time is derived from length and speed parameters [20].
A constant reference cycling speed was assumed for edges without an explicit speed attribute (i.e., the “default speed” parameter). This speed is used exclusively to convert network distances into travel time in the OD computation and does not incorporate physiological effort, comfort effects, or behavioral preferences.
Directional constraints were respected by encoding edge directionality through a direction field (forward/backward/both), allowing one-way links to be traversed only in the permitted direction while two-way edges remained fully traversable. Where direction attributes were missing, the default direction setting was applied.
The OD travel time represents in-network traversal time derived from link costs and does not explicitly model intersection control delays (e.g., signal timing, stop/yield compliance) or stochastic congestion effects. Consequently, the resulting travel times should be interpreted as baseline network times under free-flow assumptions.
Terrain slope was not embedded in the OD cost function. Instead, slope was treated as an independent explanatory variable in the probabilistic model. This separation allows the OD matrix to represent baseline accessibility (time-distance) while slope captures additional physical impedance effects on cycling propensity that may not be reflected in free-flow travel time estimates.
2.2. Phase 2. Explanatory Variable Generation
From the network model, three main variables were generated, widely recognized as determinants of bicycle use: (i) Minimum travel time (): Accessibility indicator calculated as the shortest travel time from the origin point to the campus. (ii) Average slope (): Derived from a freely accessible Digital Elevation Model (DEM) (SRTM, 30 m resolution) [21], reprojected to the UTM system to estimate the average slope per route. (iii) Proportion of protected cycling infrastructure (): Obtained by creating route buffers around each simulated route and intersecting them with the layers of segregated bikeways.
2.2.1. Minimum Travel Time (t_Min)
Minimum travel time () was obtained directly from the OD cost matrix results and represents the baseline shortest-path time between each residence and the UTPL campus, computed under the network impedance assumptions described in Section 2.1.
2.2.2. Average Slope (Slope_Mean): DEM Processing and Route-Level Aggregation
Route slope was computed from an SRTM DEM (30 m). The DEM was reprojected to UTM (WGS84, zone 17S) and converted into a slope raster (percentage). The use of satellite-derived elevation models and geospatial processing workflows follows established remote sensing methodologies for terrain and land-surface analysis [22]. To compute route-level , slope values were sampled along each simulated route and aggregated into a single summary statistic per route.
A length-weighted approach was applied, where slope samples associated with longer route segments contribute proportionally more to the route average. This procedure aims to reflect the overall terrain impedance experienced along the full route rather than isolated maximum gradients. As part of methodological robustness, a sensitivity check can be implemented by comparing alternative slope aggregation strategies (e.g., unweighted mean vs. length-weighted mean) and reporting whether conclusions remain stable.
2.2.3. Proportion of Protected Infrastructure (Pct_Protected): Buffer Definition and Overlap Computation
Protected cycling infrastructure coverage was estimated by intersecting each route with mapped segregated bikeways. A 5 m buffer was created around each simulated route to account for geometric misalignment between route polylines and infrastructure layers, as well as minor positional uncertainty in the network representation.
To strengthen methodological justification, a sensitivity analysis can be conducted using alternative buffer widths (e.g., 2 m, 5 m, and 10 m), evaluating how changes and whether relative route ranking and model conclusions remain consistent. Infrastructure layers included existing and planned segregated bikeways; these layers are used to define scenarios and must be interpreted accordingly. Where results refer to “existing conditions,” only existing layers are considered; where results refer to “policy scenarios,” planned layers are included as scenario inputs. The year and source metadata of each layer should be documented in the data dictionary (see reproducibility statement).
2.2.4. Dependent Variable Definition and Interpretation (Y)
In this study, no observed or self-reported mode-choice variable is available. Instead, cycling propensity is operationalized through a parameterized logistic function that maps route attributes (minimum travel time, average slope, and proportion of protected infrastructure) into a bounded probability . Thus, represents a latent construct, and should be interpreted as a scenario-based indicator of structural suitability for cycling, rather than as an empirically estimated behavioral response.
The dependent variable was not derived from surveys, stated preferences, or observed travel behavior. Instead, it was constructed using objectively measured route attributes like minimum travel time, average slope, and proportion of protected cycling infrastructure, commonly applied in accessibility and cycling potential studies. This approach allows for the evaluation of structural conditions that may favor or hinder bicycle adoption, independently of individual behavioral or attitudinal factors.
Table 1 presents the variables considered in the construction of the logistic model, which constitute the basis for the analysis and estimation of the associated effects in the study.
Table 1.
Variables used in the logistic model.
In order to enhance methodological transparency and ensure full traceability between the GIS processing stage and the statistical computing environment, Table 2 presents the structure of the analytical dataset used in the RStudio environment for the propensity modeling procedure.
Table 2.
Structure and descriptive statistics of the dataset used for propensity modeling (n = 2088).
The table details the variable names as implemented in the dataset, their measurement scale, units, observed range, and descriptive statistics. This structured presentation clarifies how route-level attributes derived from QGIS (QNEAT3 network analysis and DEM processing) were organized prior to applying the logistic propensity function.
All explanatory variables included in the analytical dataset were continuous, and no missing values were detected in the final database (n = 2088 routes).
2.3. Phase 3. Probabilistic Modeling and Statistical Analysis
With the processed data, an analytical database was structured in RStudio (version 2024.09). Exploratory and descriptive procedures were carried out using the dplyr, readr, and ggplot2 libraries. Frequencies, slope and time categories, and graphical distributions were generated through histograms, boxplots, and kernel density plots.
Although logistic regression is traditionally applied to binary observed outcomes, in this study, it is employed as a probabilistic modeling framework to estimate continuous values bounded between 0 and 1. The objective is not the classification of observed mode choice, but the estimation of relative cycling propensity under varying spatial and infrastructural conditions.
This methodological choice is consistent with studies that model cycling potential, accessibility, and route attractiveness using logistic formulations without relying on revealed or stated mode choice data. Logistic regression provides an interpretable structure to capture potentially non-linear relationships between route characteristics and modeled cycling propensity.
The logistic model was formulated as follows (Equation (1)).
where represents the modeled probability (propensity) of bicycle use under the latent construct defined in Section 2.2; is the intercept; and are the specified coefficients associated with the independent variables in the parameterized propensity function.
Based on the conceptual framework and existing literature, the following hypotheses were defined: (H1) an increase in minimum travel time is associated with a decrease in the probability of bicycle use; (H2) higher average route slope negatively affects cycling propensity; and (H3) a greater proportion of protected cycling infrastructure along the route increases the probability of bicycle use.
In this study, the logistic formulation is implemented as a parameterized propensity function rather than a statistically estimated regression model based on observed mode-choice outcomes. Therefore, the coefficients are not interpreted as estimated parameters with inferential statistics; instead, they represent a literature-consistent scenario specification used to map route attributes into a bounded propensity value between 0 and 1. To ensure transparency and reproducibility, Table 3 reports the numerical values used for the intercept and the three route-level predictors in the propensity function.
Table 3.
Numerical specification of the logistic propensity function and dataset characteristics.
2.4. Reporting Scope and Robustness Checks
Because the propensity model is implemented as a parameterized logistic mapping (Table 3) and does not use observed binary mode-choice outcomes, inferential statistics (e.g., p-values, confidence intervals from estimation) and model fit metrics tied to behavioral prediction (e.g., AIC, pseudo-, ROC-AUC) are not applicable within the scope of this study. Robustness is instead addressed through sensitivity checks on key GIS-derived inputs (e.g., slope aggregation strategy and buffer width used to compute protected infrastructure coverage), verifying whether the spatial prioritization patterns remain stable under alternative assumptions.
3. Results
The statistical analysis made it possible to evaluate the relationship between minimum travel time, average segment slope, and the percentage of protected cycling infrastructure with the modeled (estimated) probability of bicycle use. The results are structured into five sections: routes and access nodes, descriptive statistics, probability distribution of use, and the influence of the three analyzed factors. All results presented correspond to modeled probabilities derived from the logistic formulation described in Section 2, and do not represent observed travel behavior.
3.1. Routes and Access Nodes
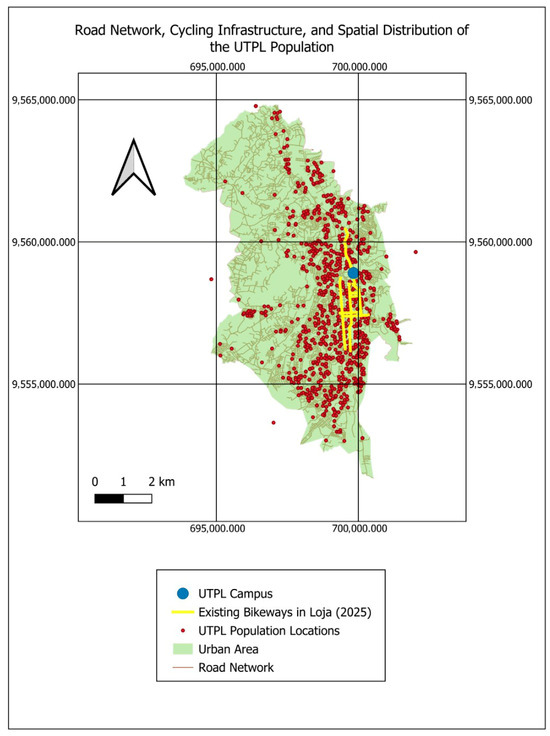
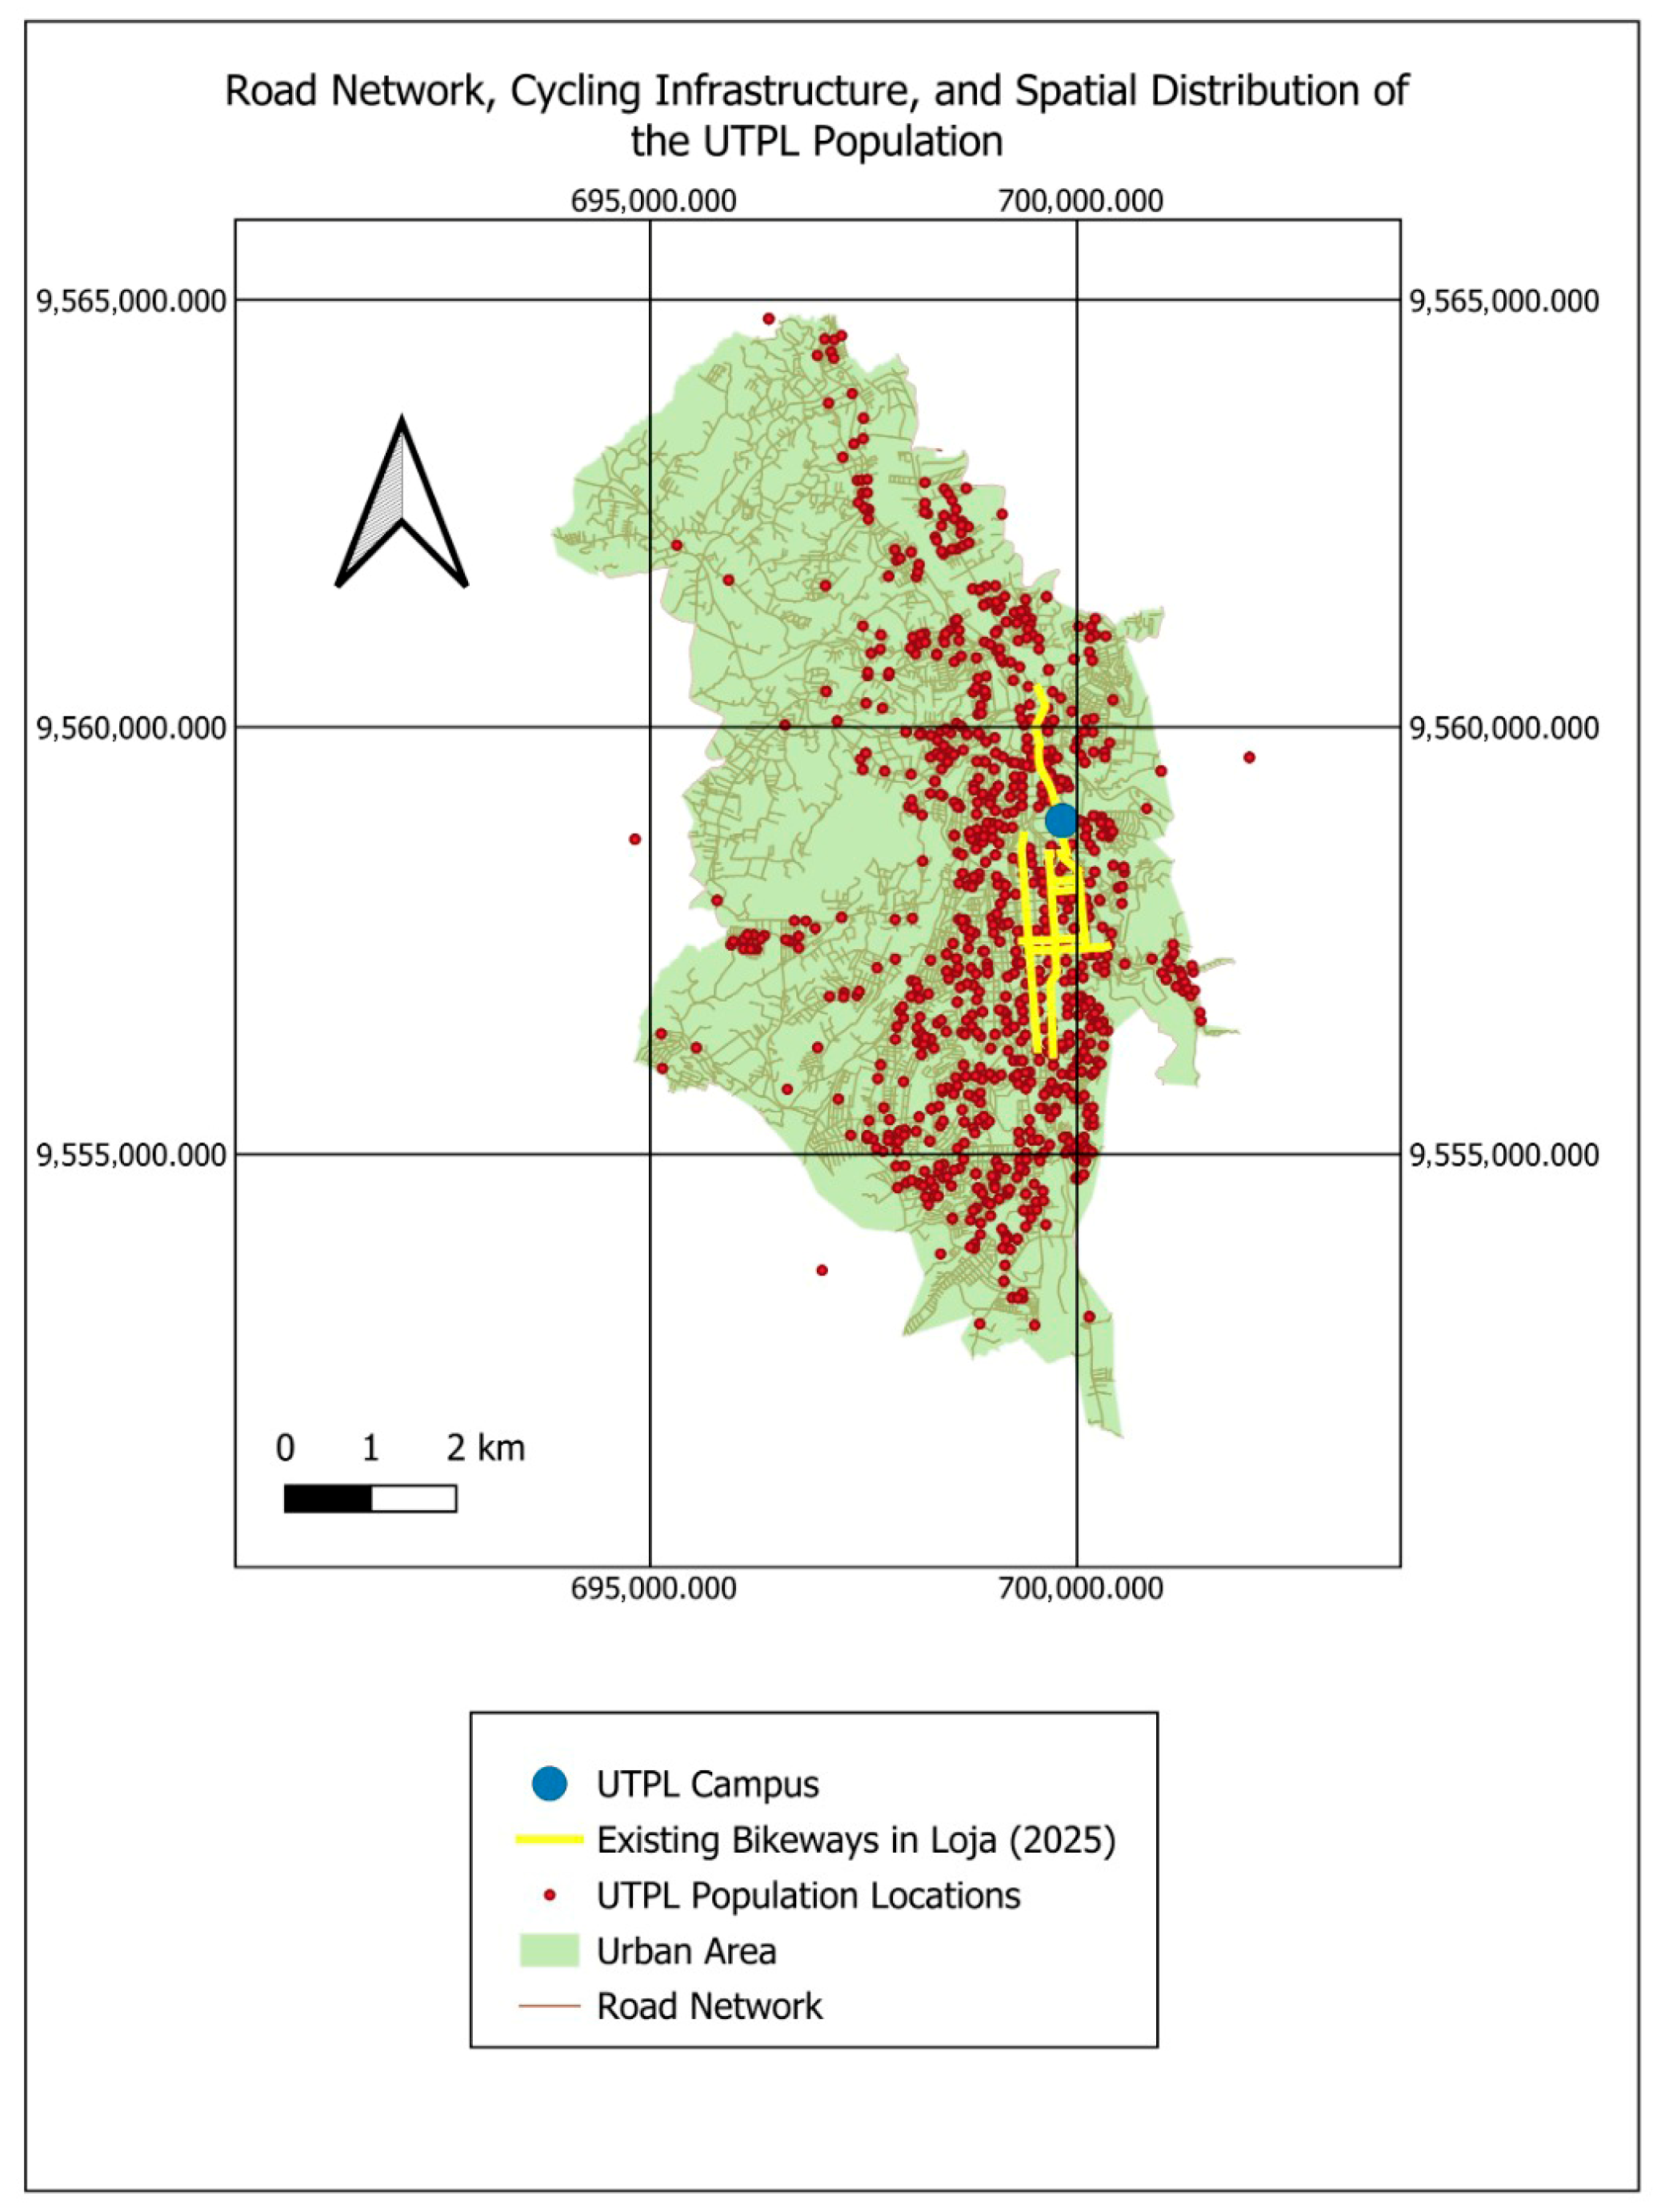
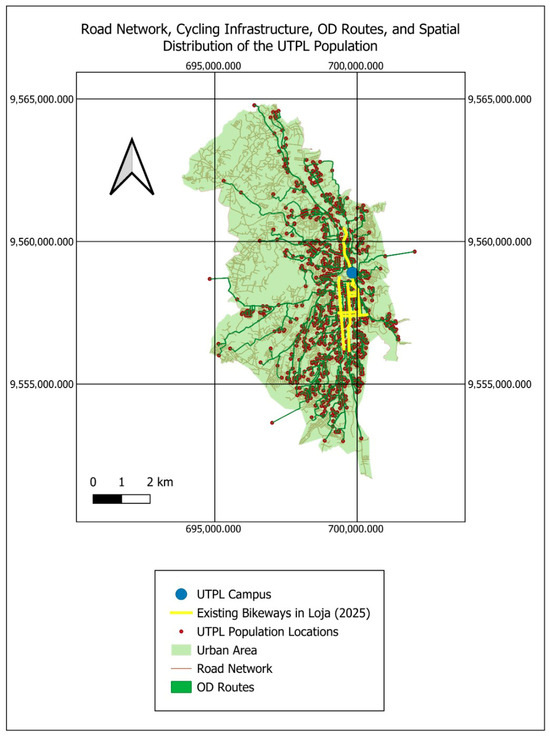
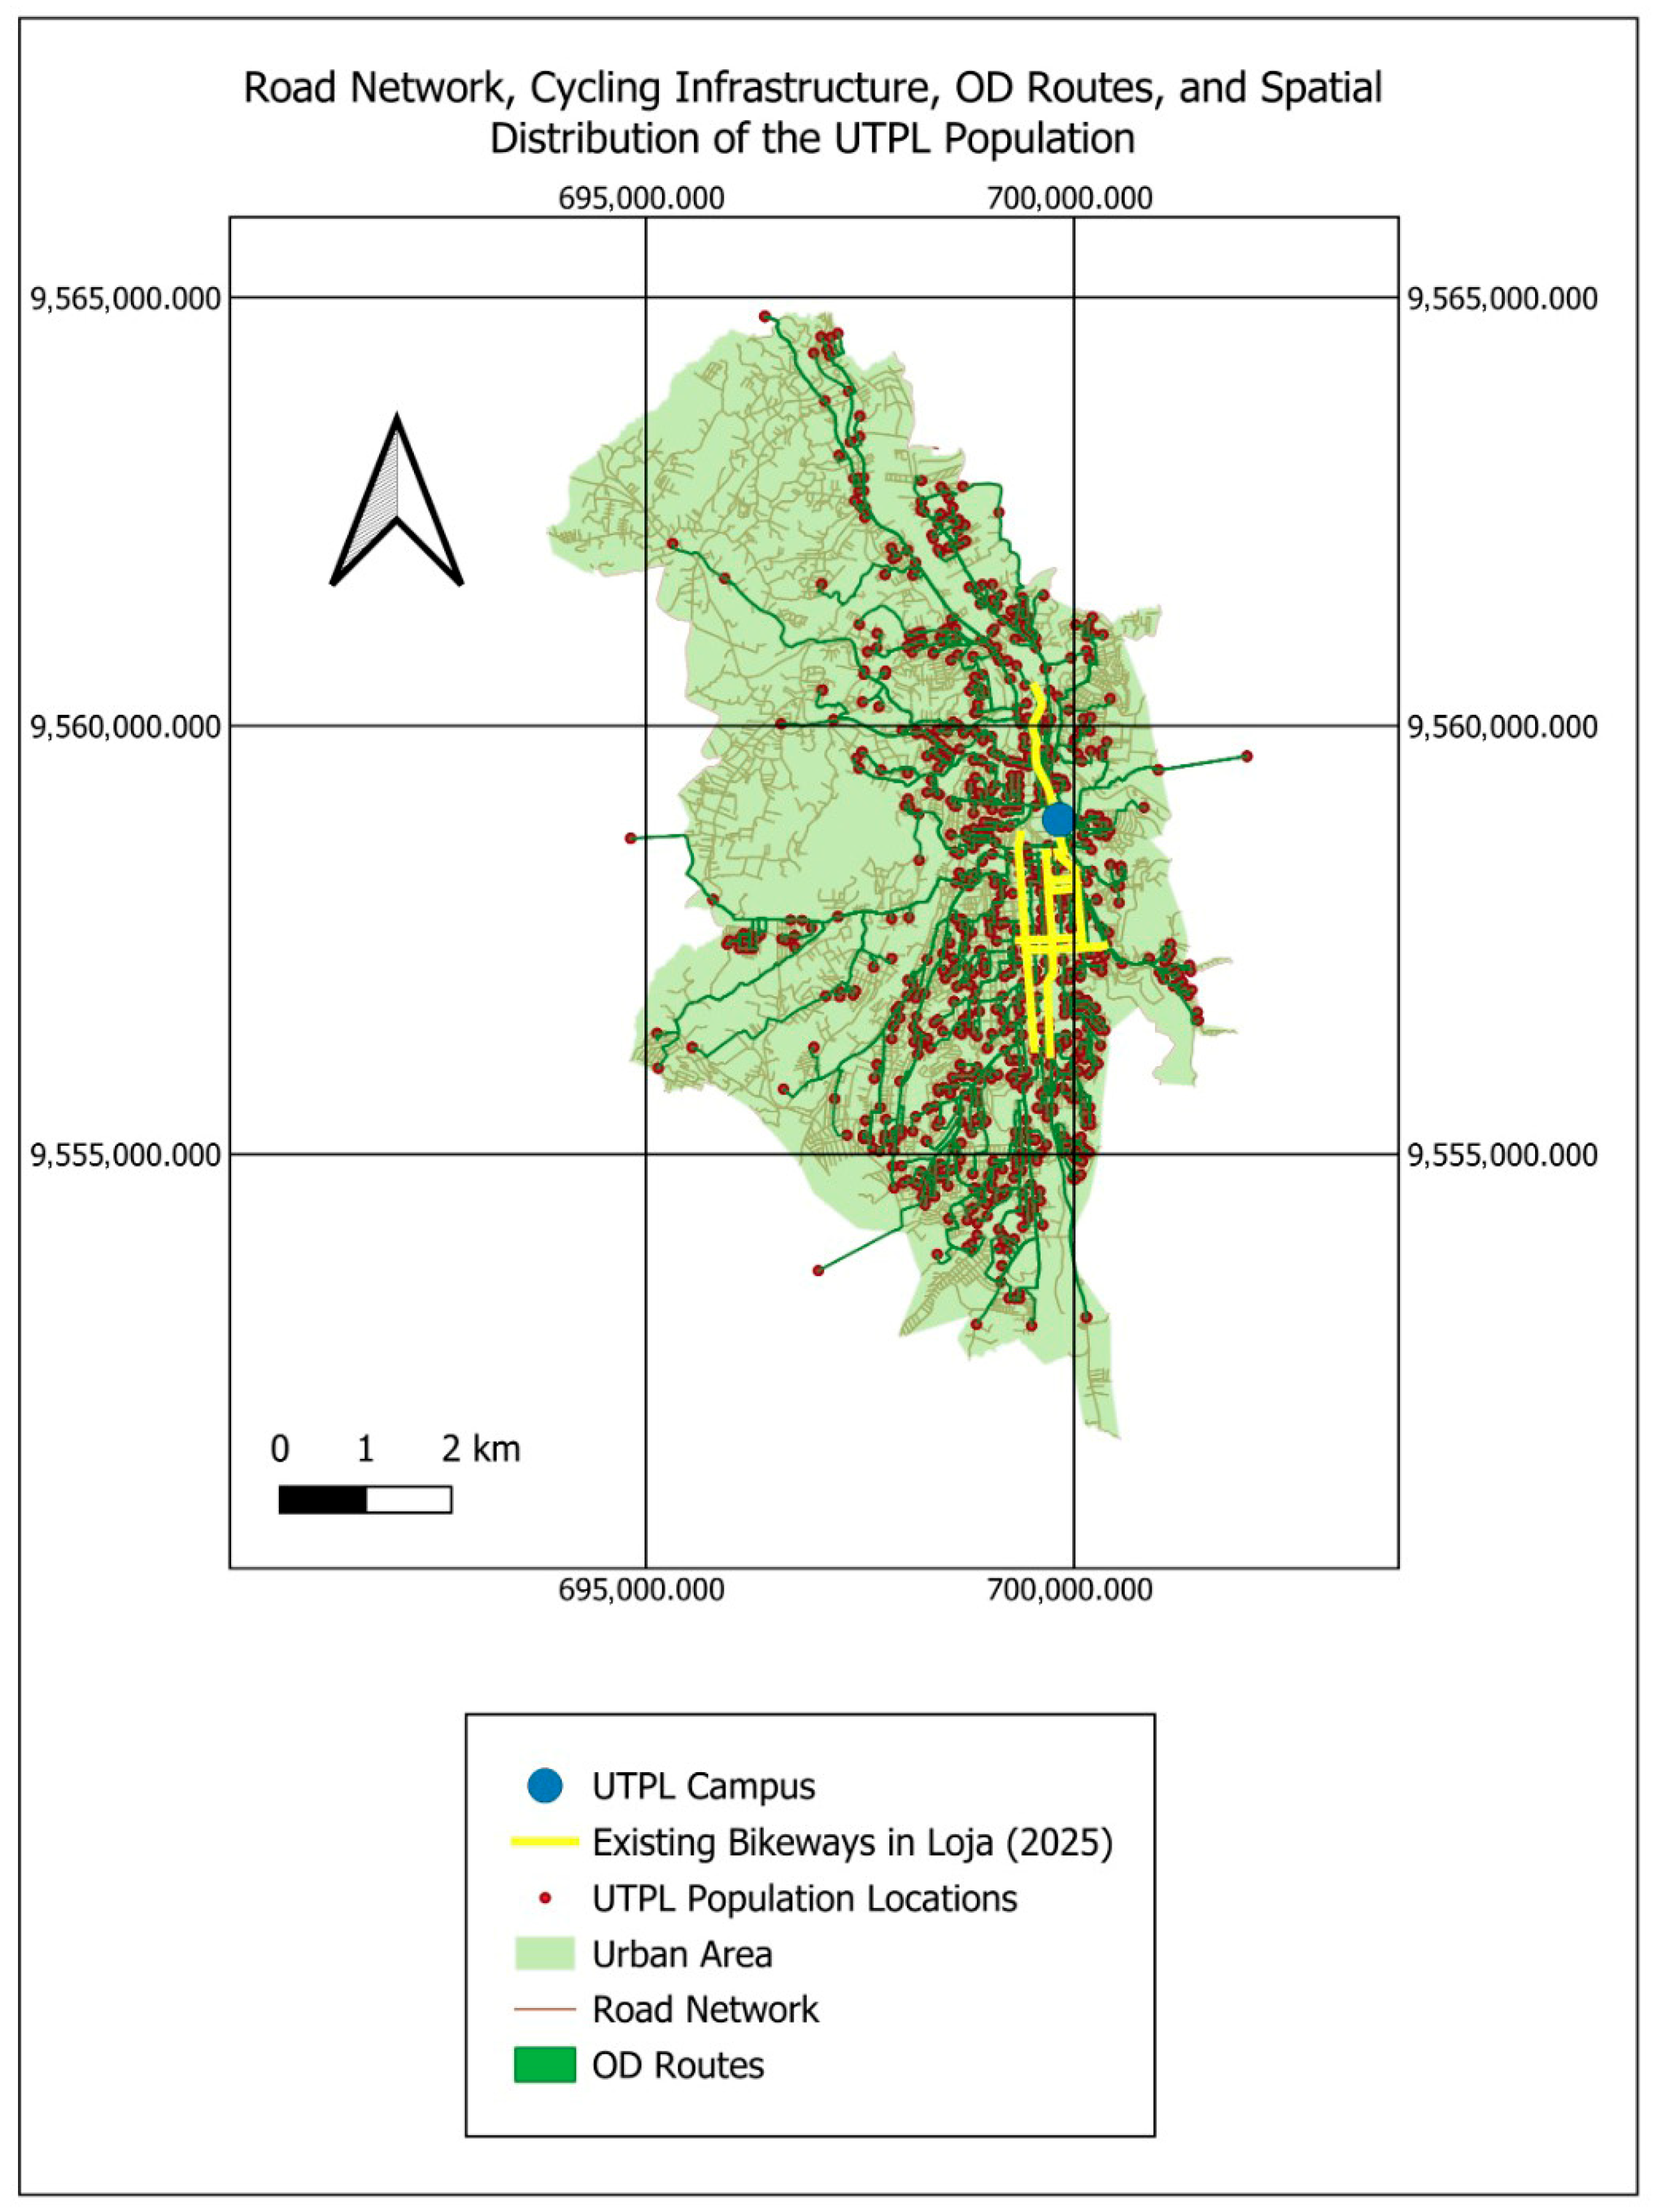
The geospatial accessibility model generated a route map representing the routes originating from the residential points of students, faculty, and administrative staff toward the UTPL Campus (Figure 2 and Figure 3). In the visualization, origin nodes are shown as brown circles, connected by green lines symbolizing the shortest-path routes under the defined network impedance toward the central destination (blue circle).
Figure 2.
Spatial distribution of georeferenced residential points of university personnel (students, faculty, and administrative staff) with destinations to the UTPL campus.
Figure 3.
Route map toward the UTPL campus.
The spatial pattern obtained reveals a strong concentration of trips along the main corridors of the urban area, particularly in the north–south and east–west axes, with progressive dispersion toward the peripheral zones. This pattern reflects the spatial distribution of modeled shortest-path routes under baseline network assumptions.
3.2. Descriptive Statistics
The dataset included a total of n = 2088 observations corresponding to routes originating within the urban core of Loja. The mean modeled probability of bicycle use was 0.611, ranging from 0.36 to 0.96 (Table 2). The average slope of the segments was mostly within the 5–15% range, and the protected percentage of routes varied between 0 and 80%.
Sensitivity checks using alternative buffer widths (2 m, 5 m, and 10 m) and slope aggregation strategies (unweighted vs. length-weighted mean) yielded consistent corridor prioritization patterns, supporting the numerical stability of the propensity mapping.
3.3. Distribution of the Probability of Use
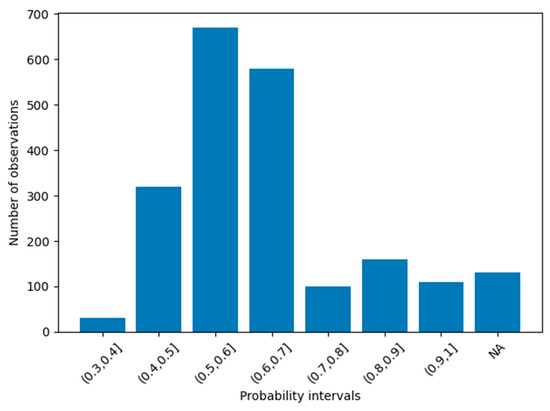
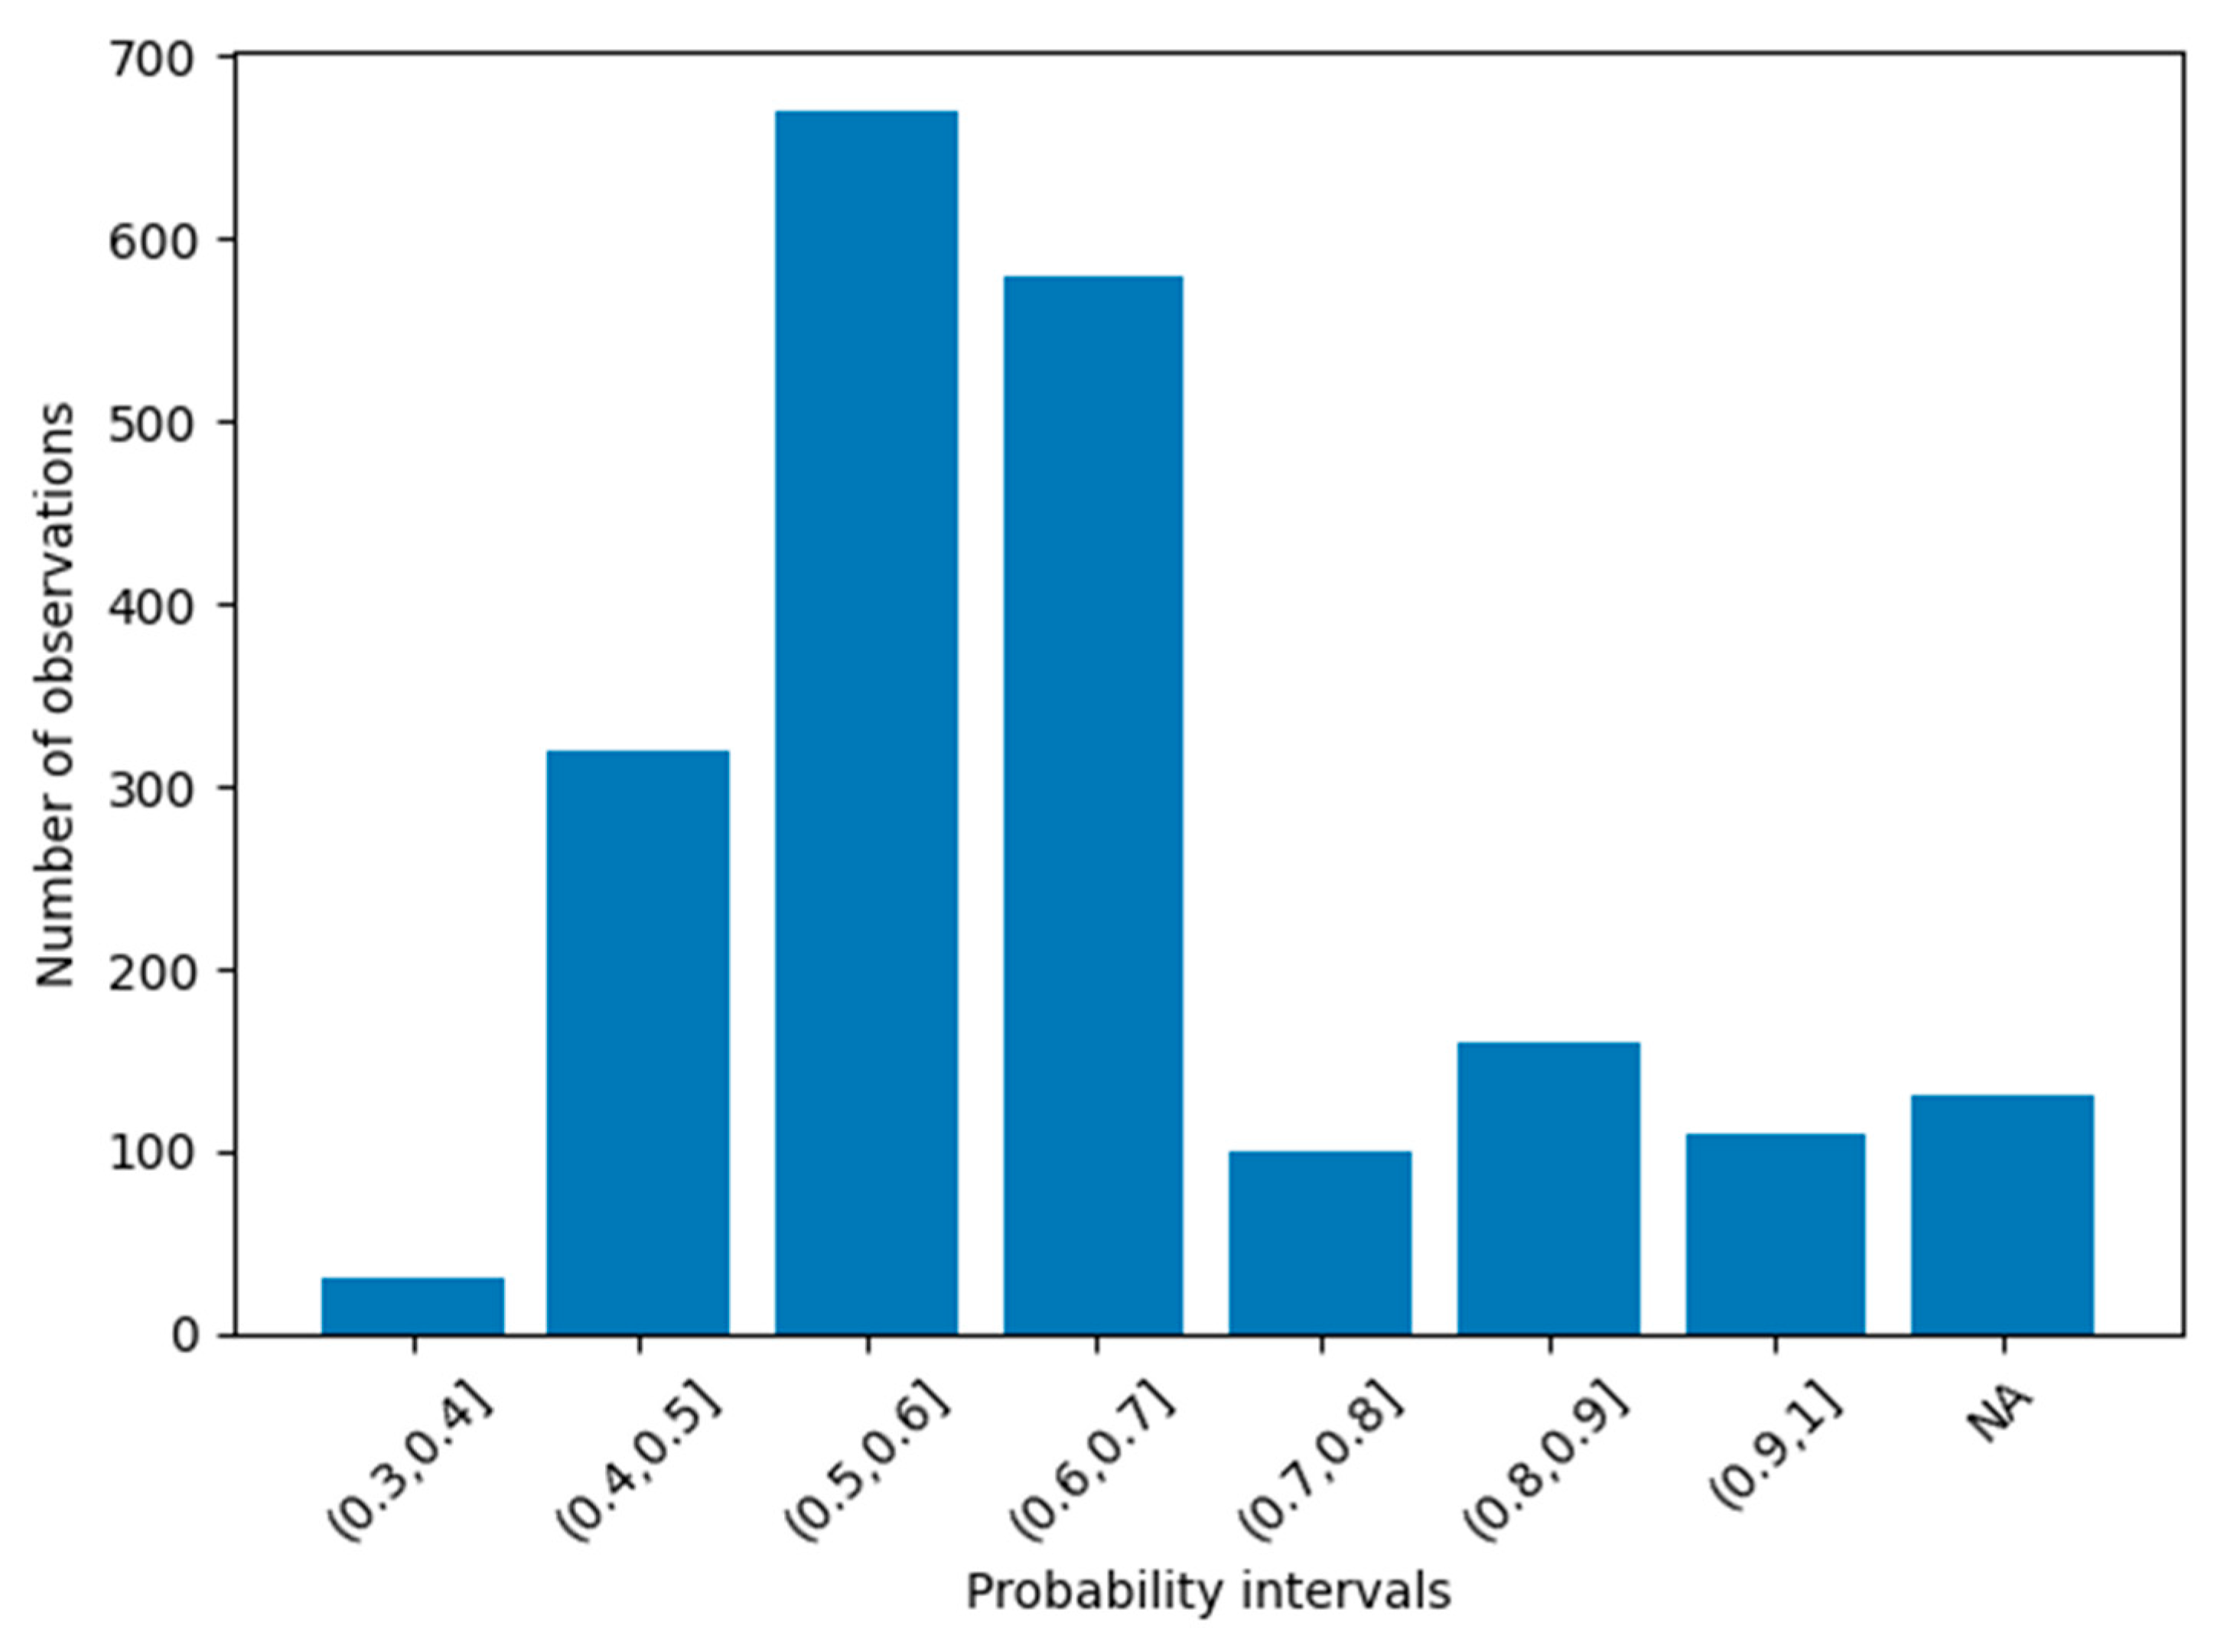
Figure 4 presents the grouped frequency of the modeled probability of bicycle use. The greatest concentration of observations is found between the 0.5 and 0.7 intervals, indicating that most simulated trips present a moderate-to-high estimated propensity to use the bicycle as a mode of transport under the defined network assumptions.
Figure 4.
Grouped frequency of the probability of bicycle use.
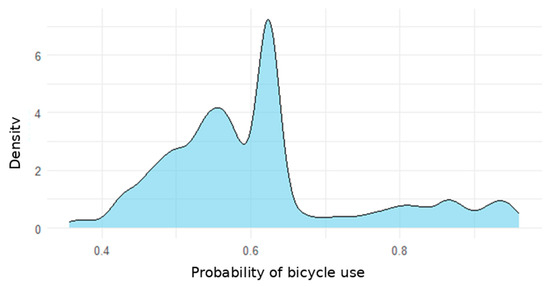
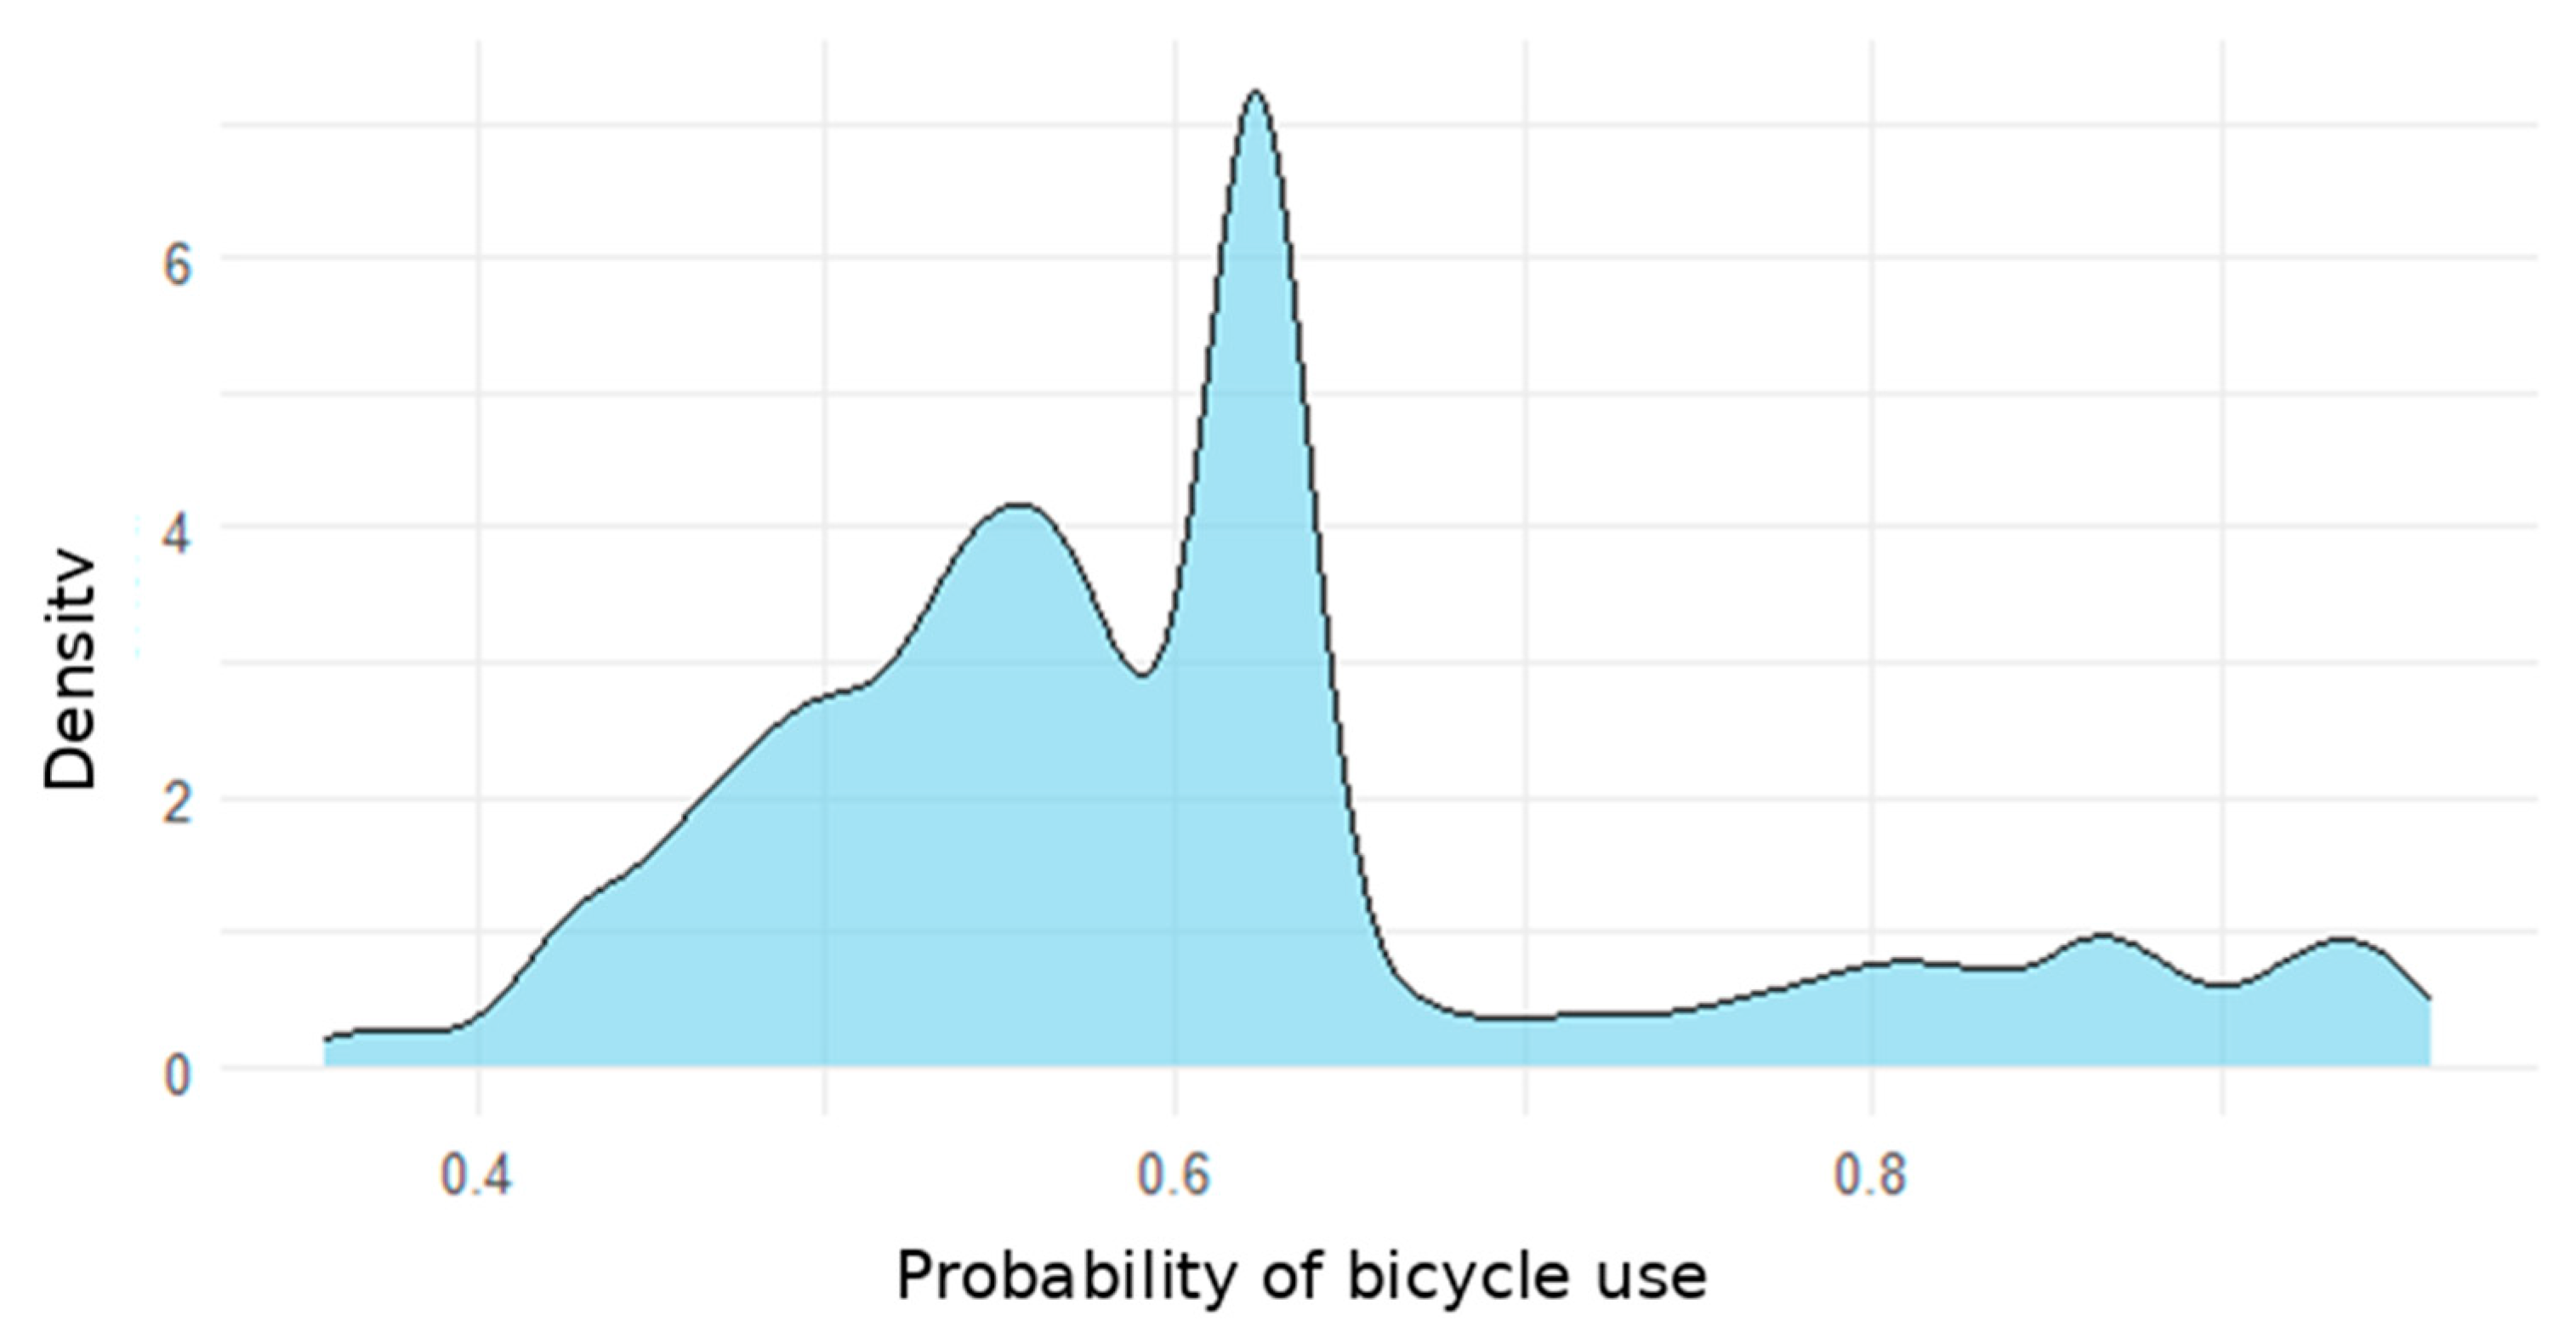
Figure 5 shows the density distribution of the probability of use. The values tend to cluster around 60%, with secondary peaks in higher intervals.
Figure 5.
Density distribution of the probability of bicycle use.
3.4. Probability of Use and Slope Categories
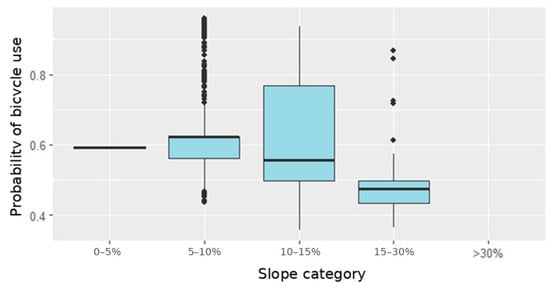
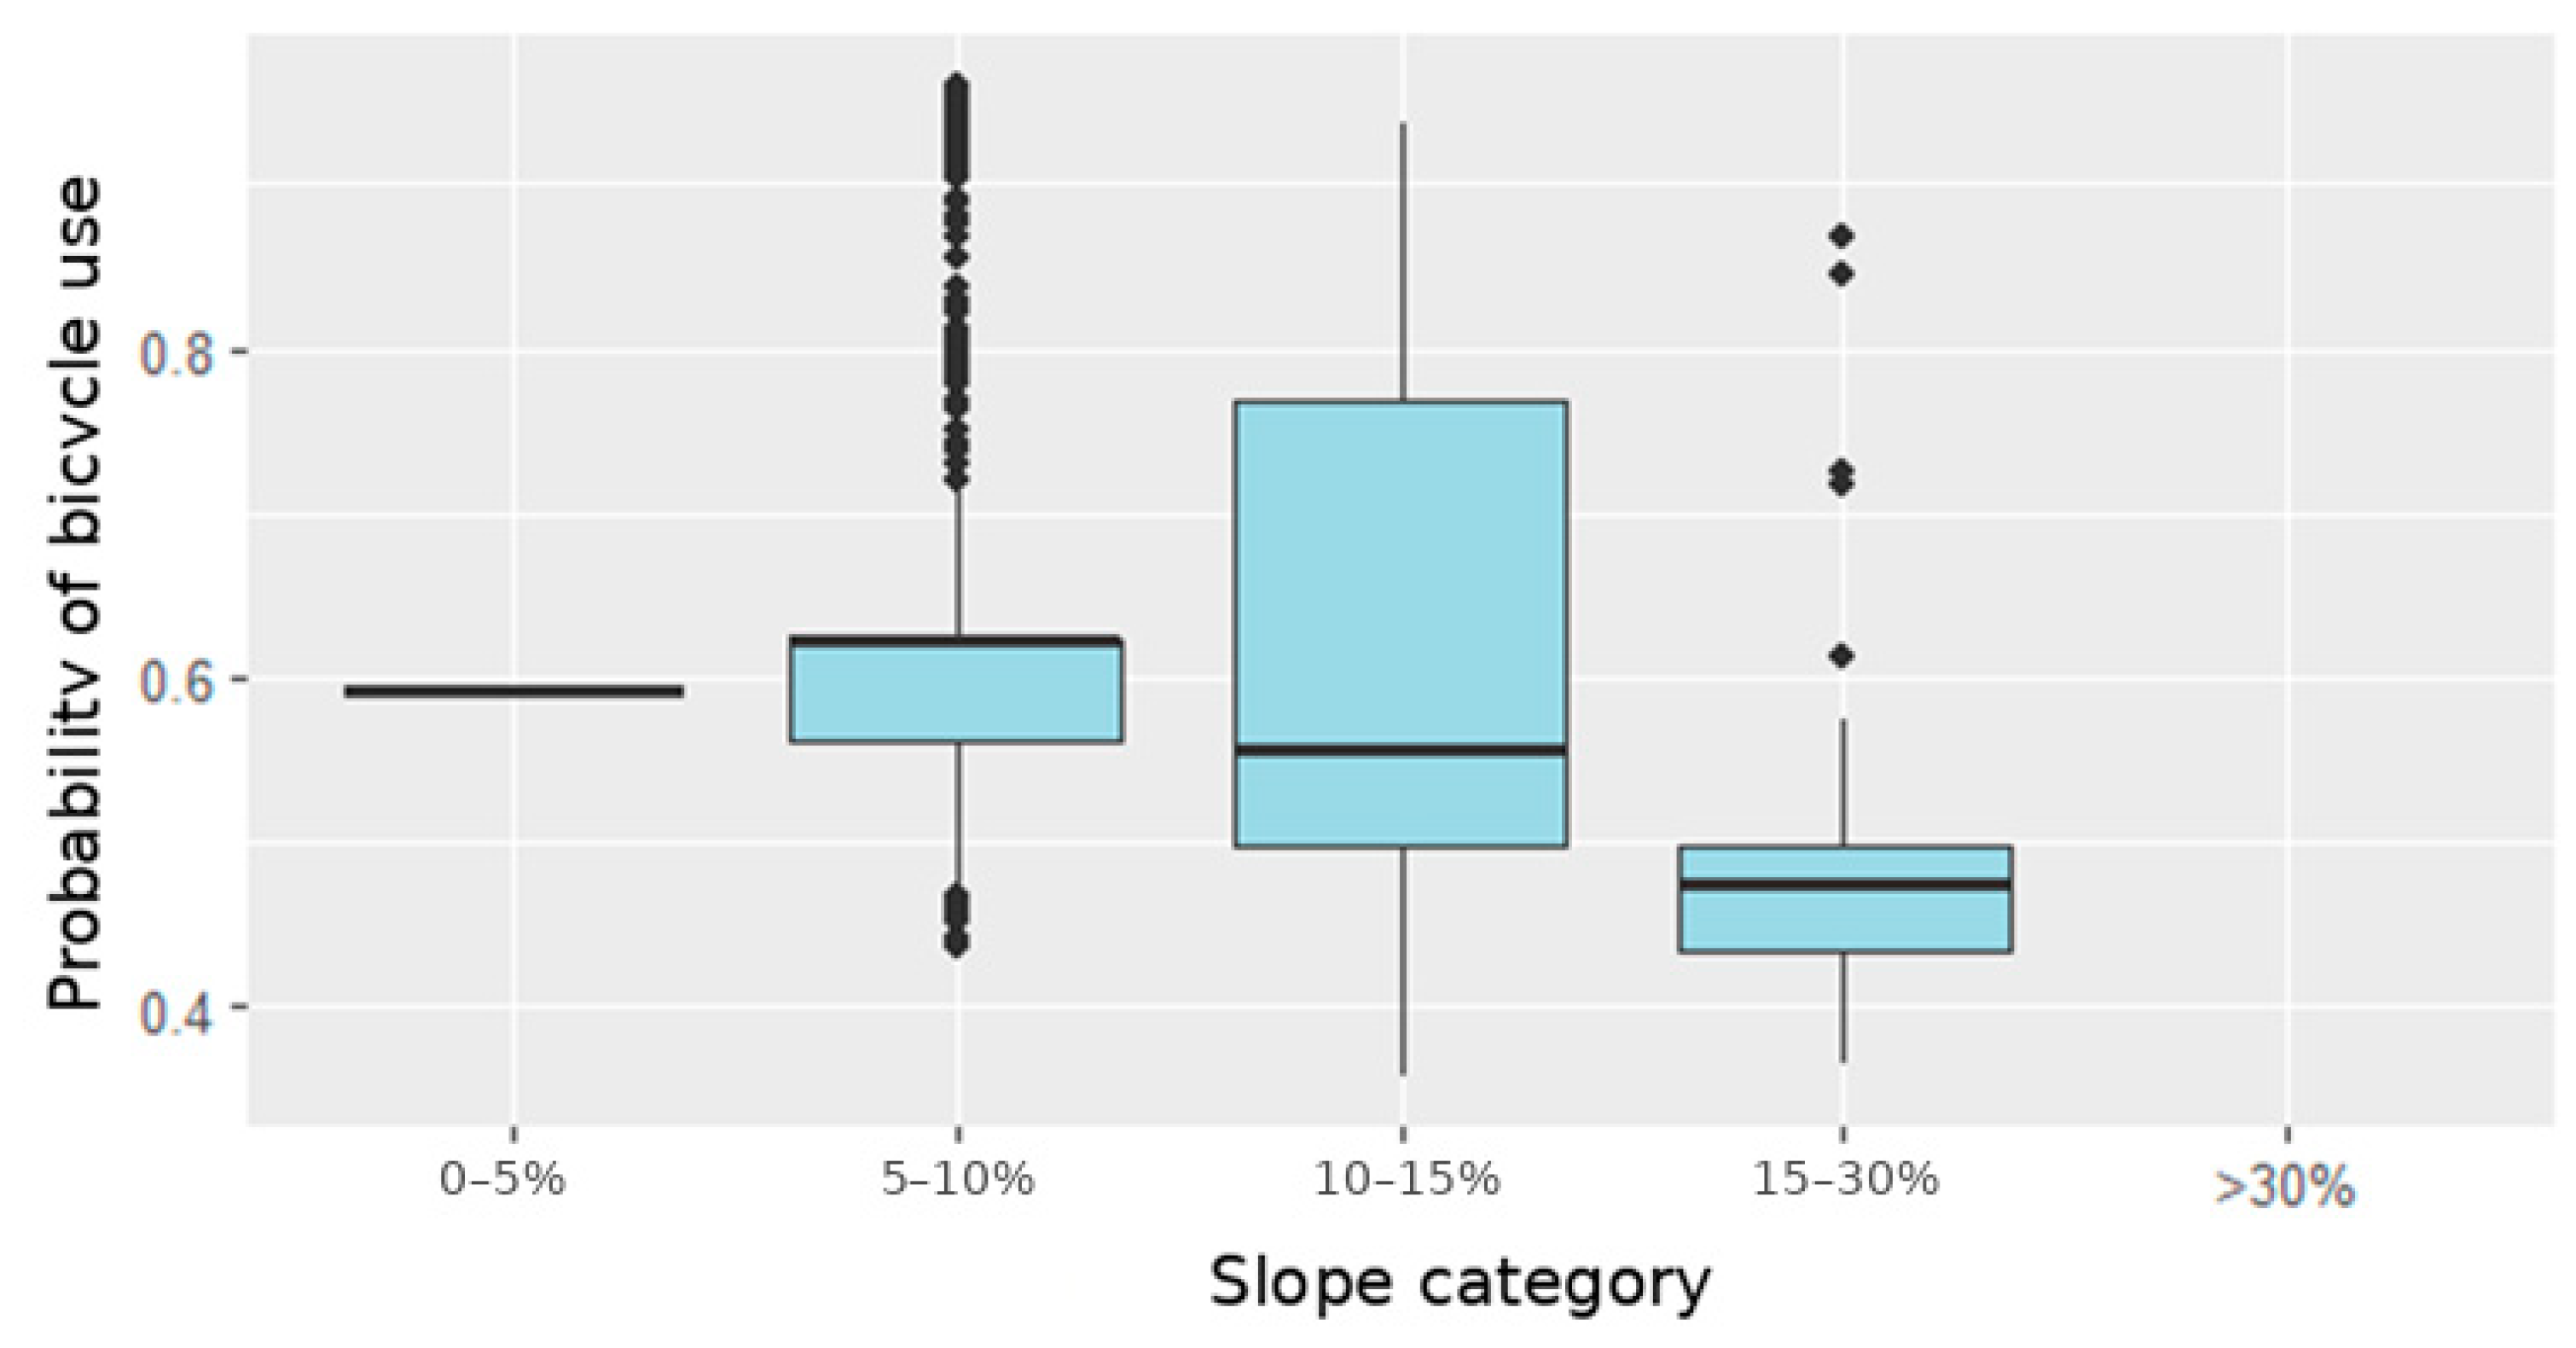
Average slope emerged as one of the most influential variables within the propensity function mapping. Figure 6 shows a boxplot where the probability of use is grouped by slope categories.
Figure 6.
Modeled probability of use according to slope categories.
Segments with slopes between 5–15% exhibit greater dispersion and higher central values, while slopes above 15% are associated with lower modeled probabilities of use.
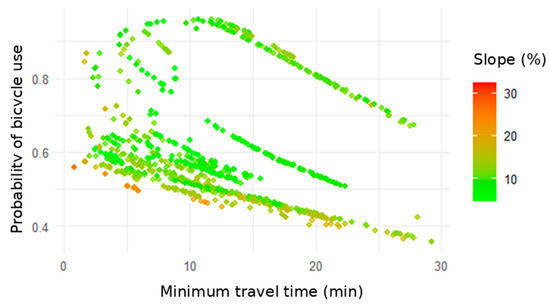
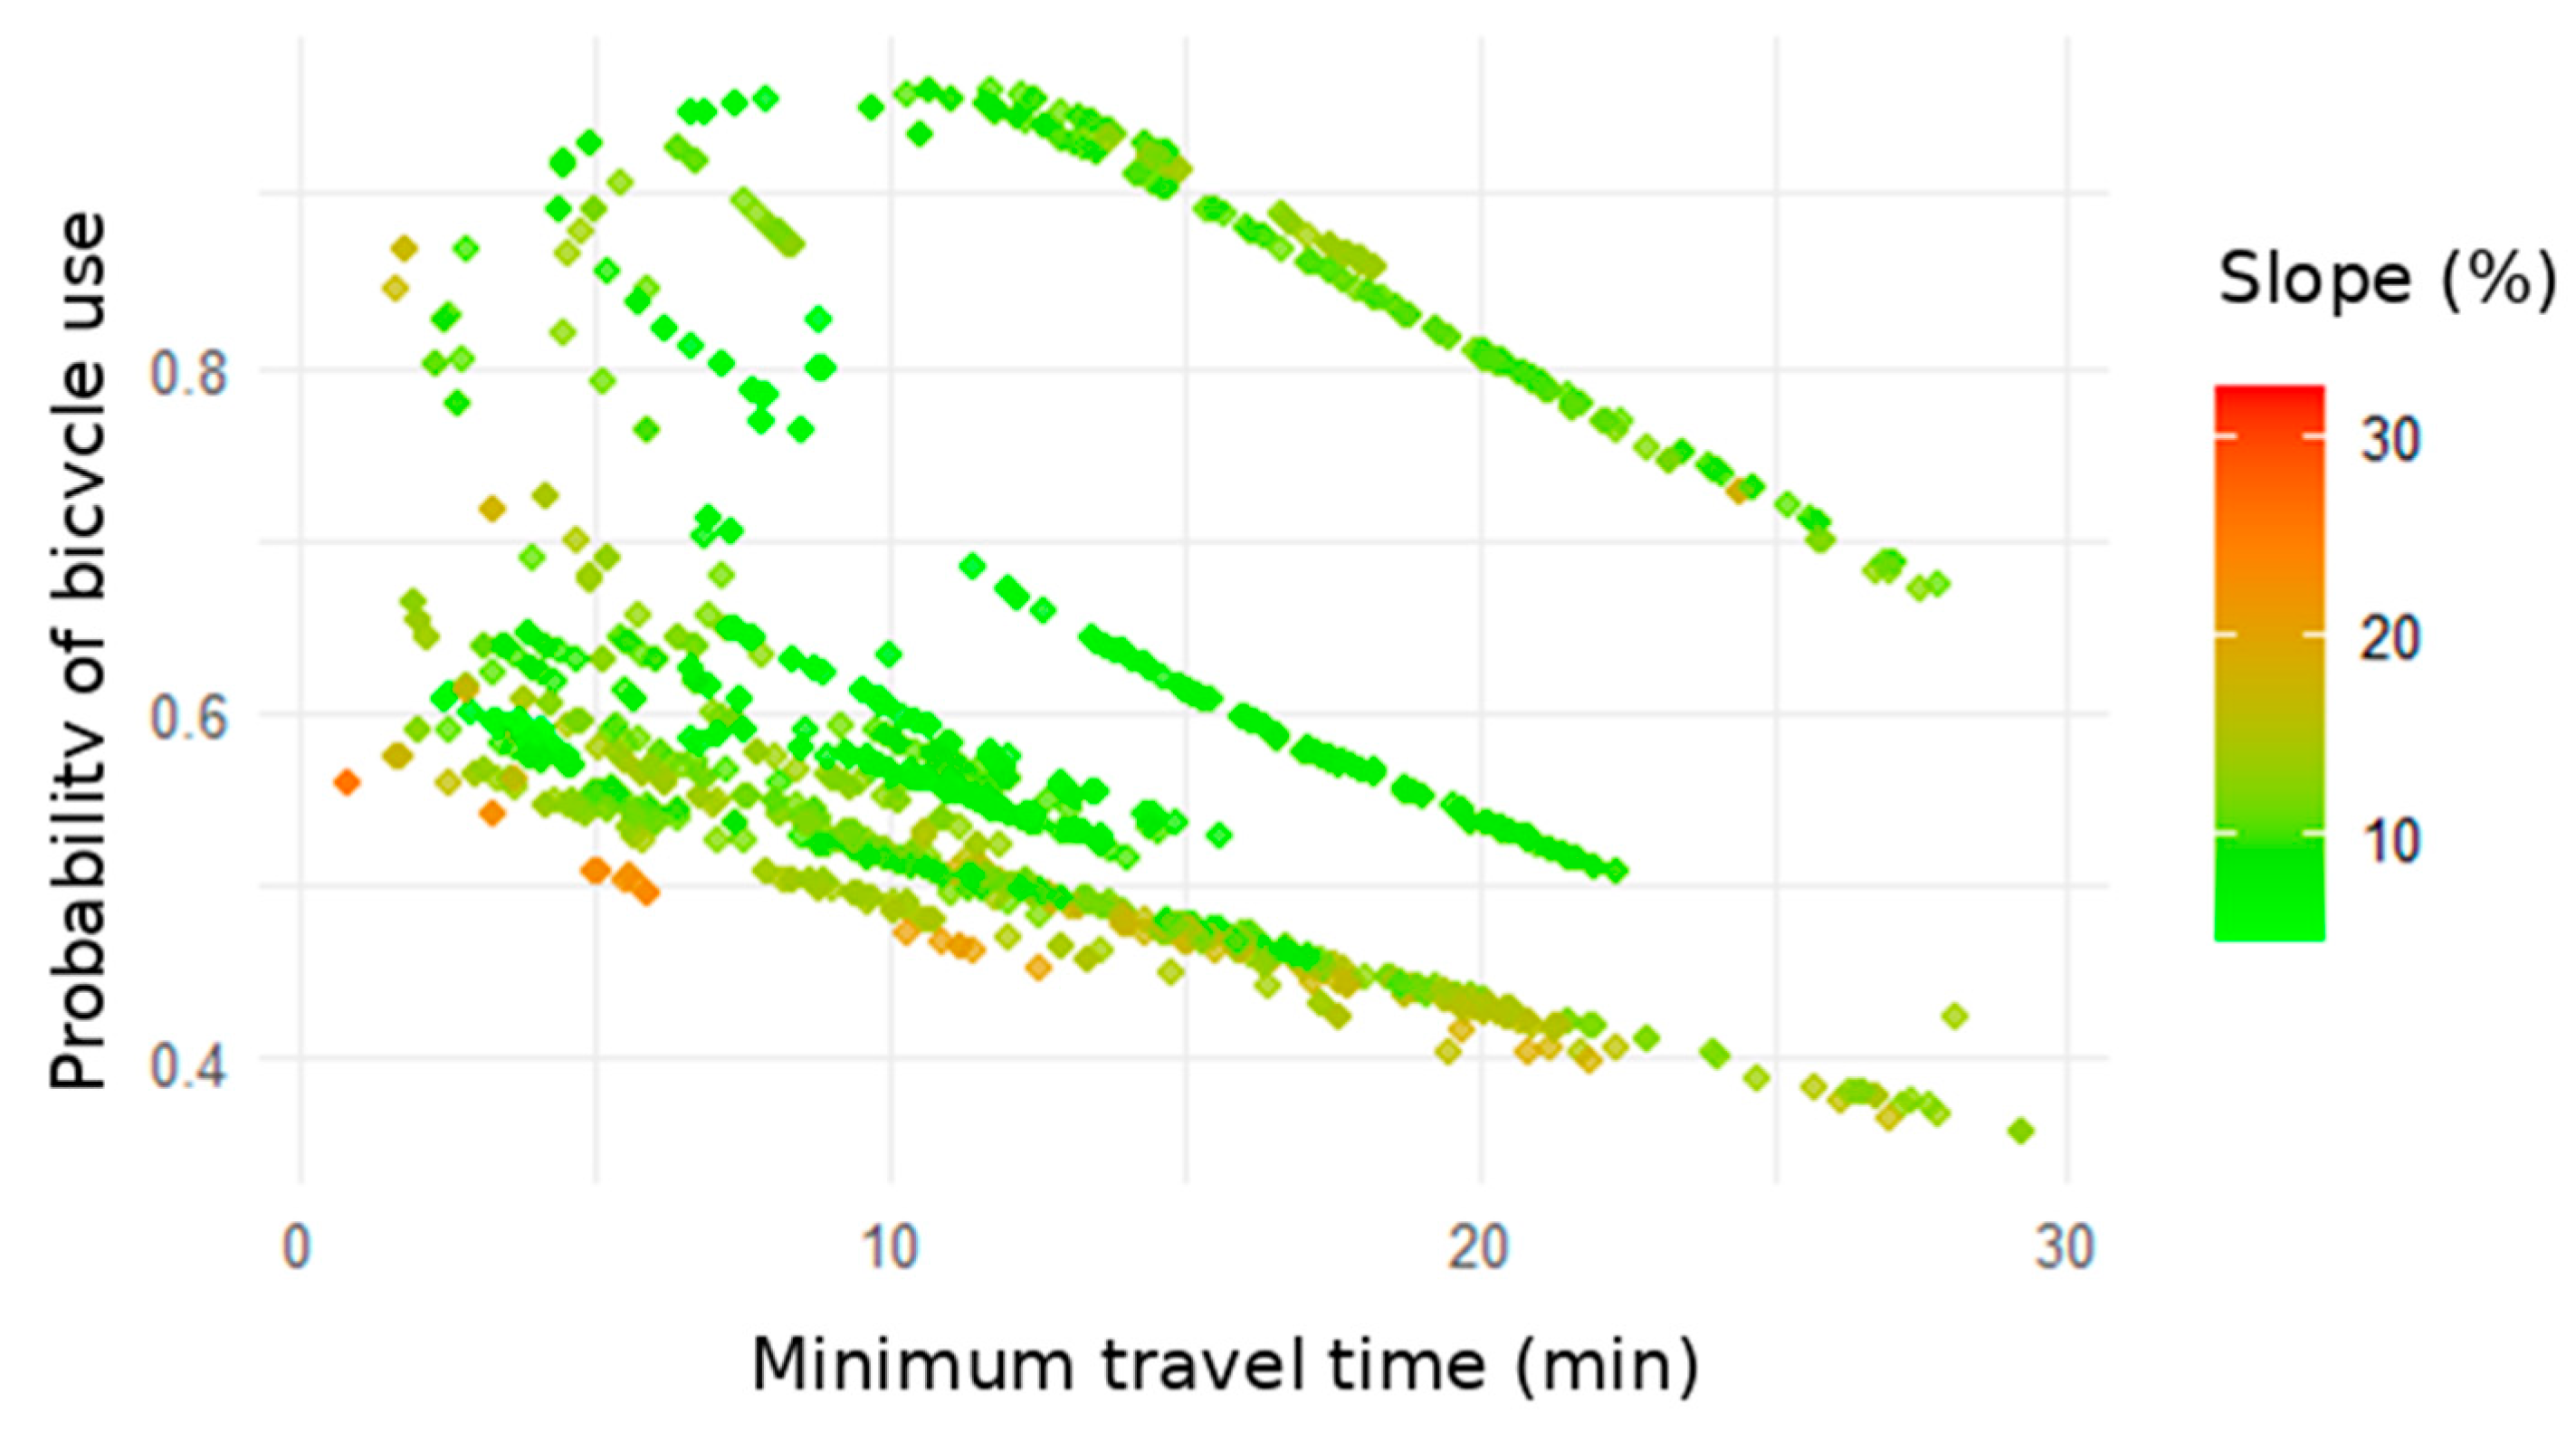
Figure 7 explores the interaction between slope, travel time, and probability of use. It is observed that although time exerts a gradual influence, steep slopes (>15%) are associated with lower estimated probabilities even for short trips.
Figure 7.
Modeled Probability of use as a function of travel time and slope (%).
3.5. Influence of Travel Time
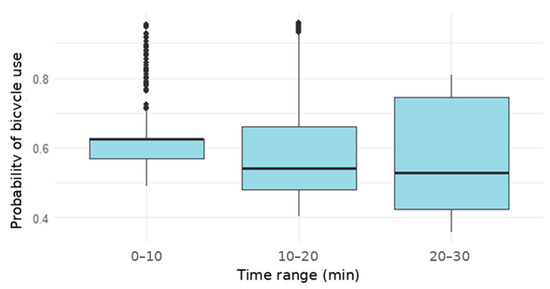
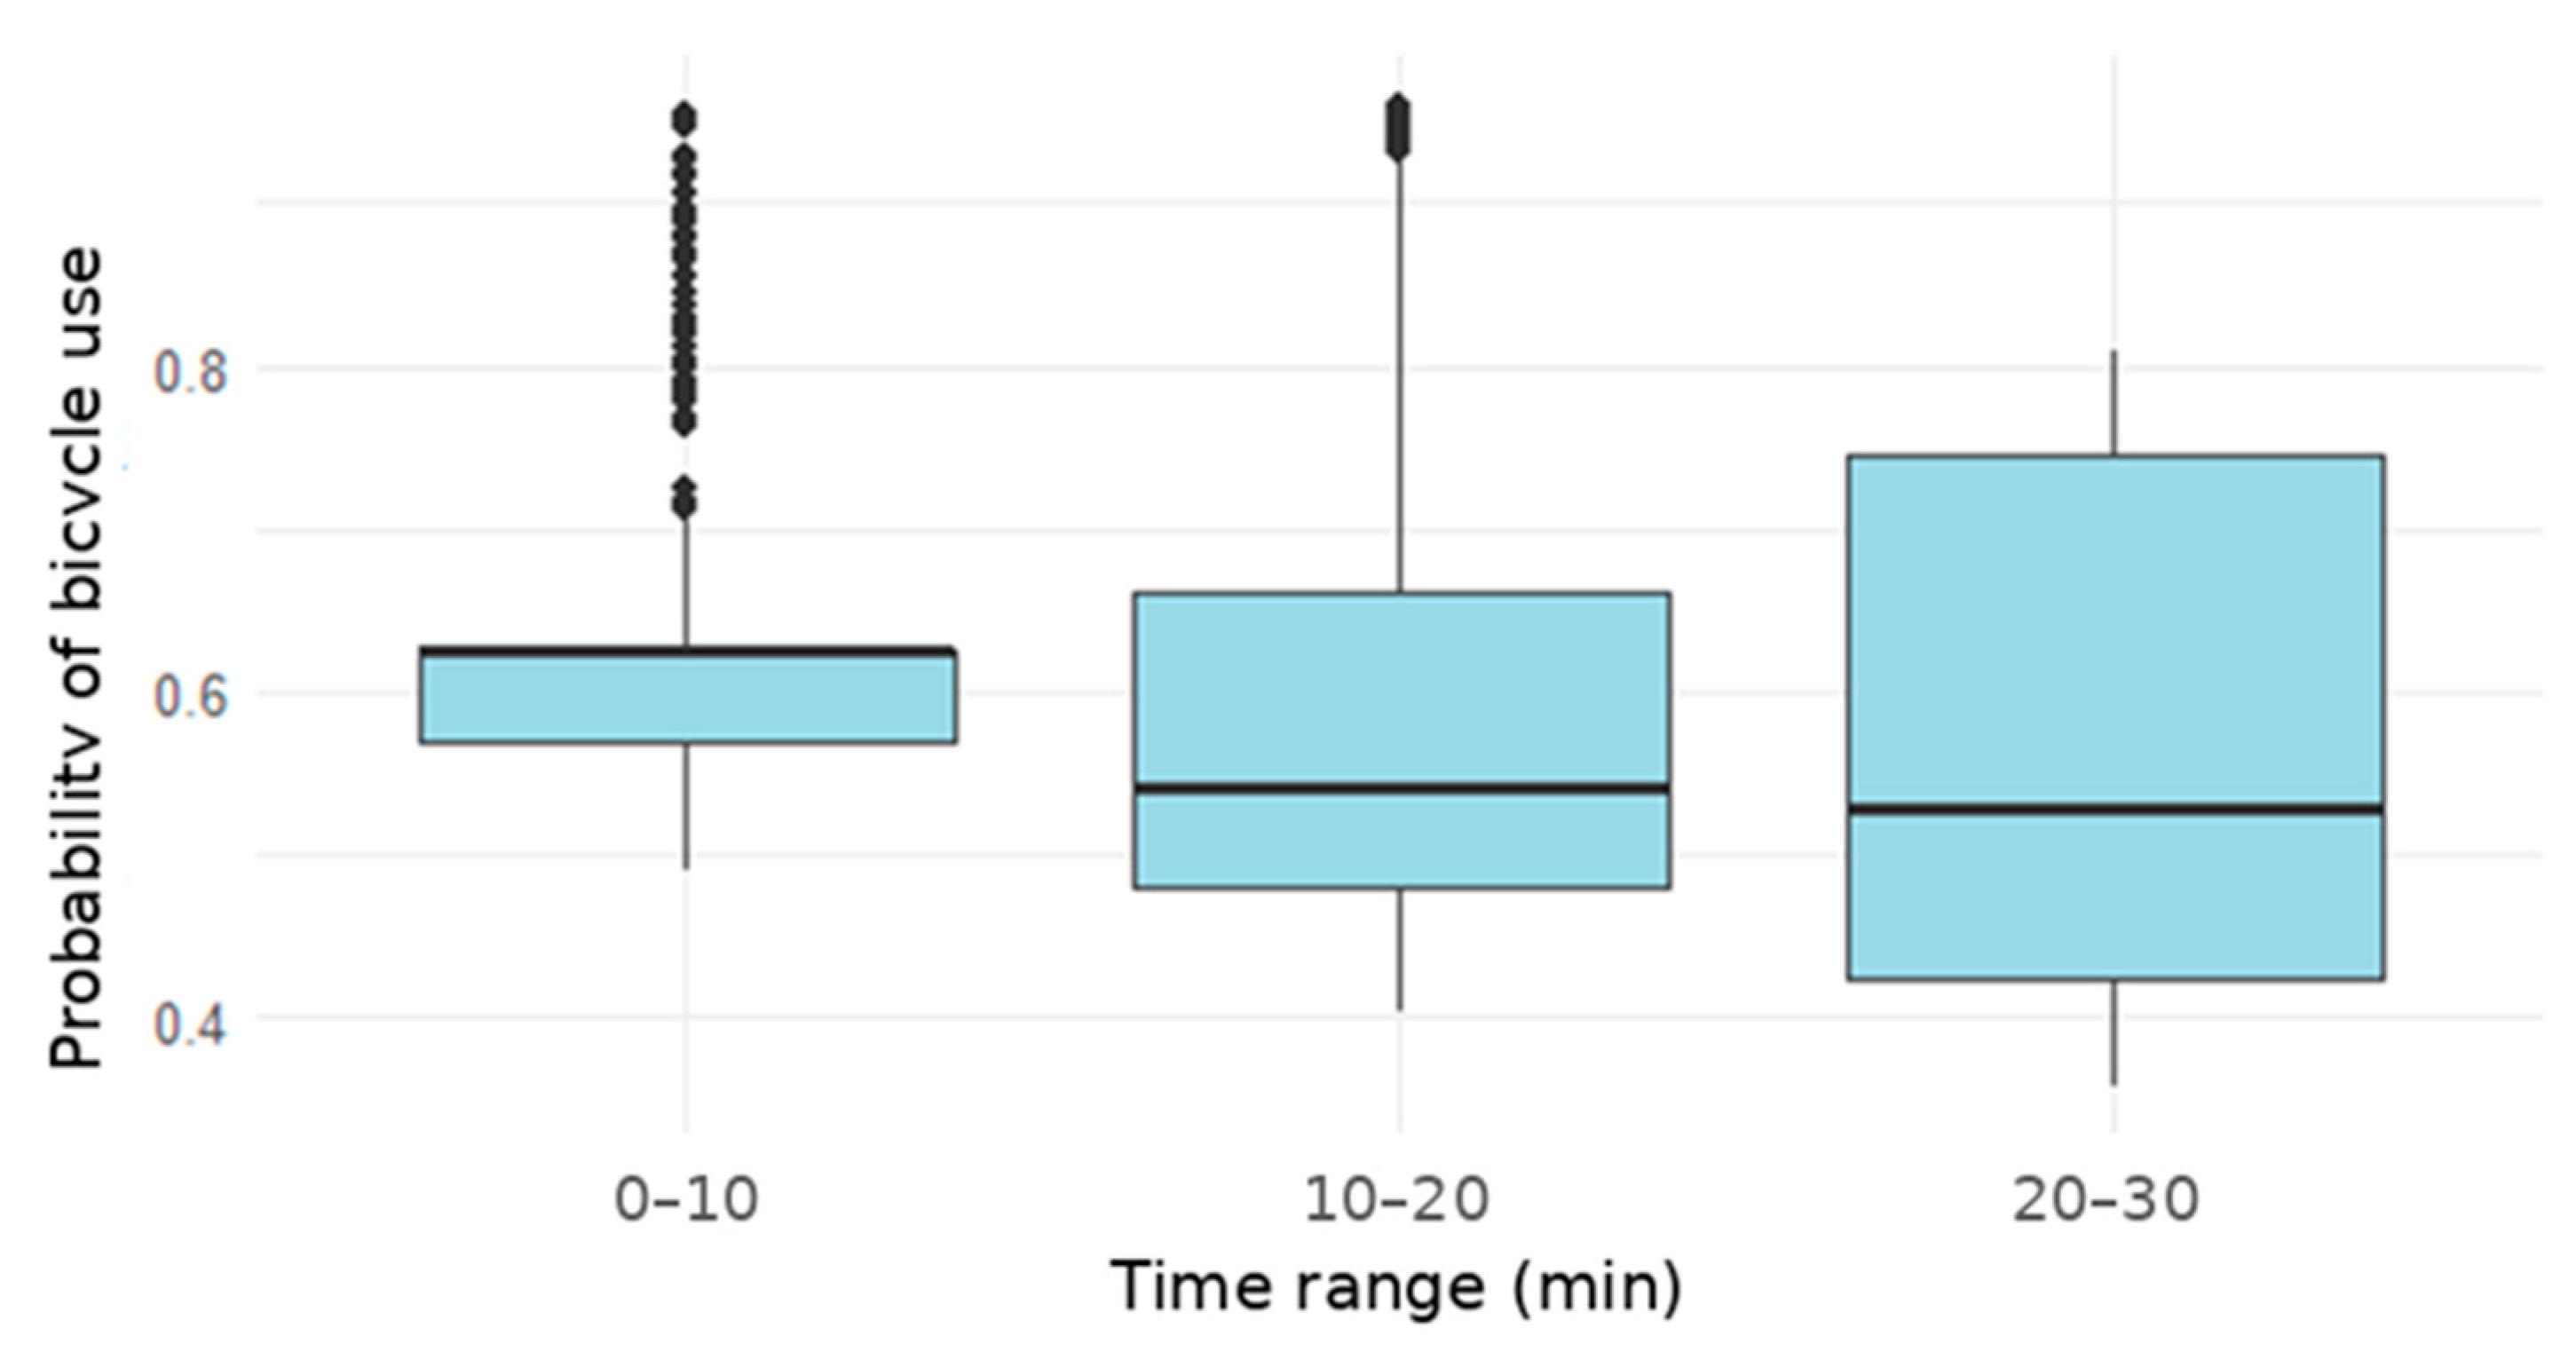
Minimum travel time showed a consistent negative association within the modeled propensity framework. Figure 8 shows that trips of 0–10 min present an average probability of 0.65, whereas trips longer than 20 min reduce the probability to values close to 0.5.
Figure 8.
Probability of use according to travel time categories.
3.6. Influence of the Percentage of Protected Infrastructure
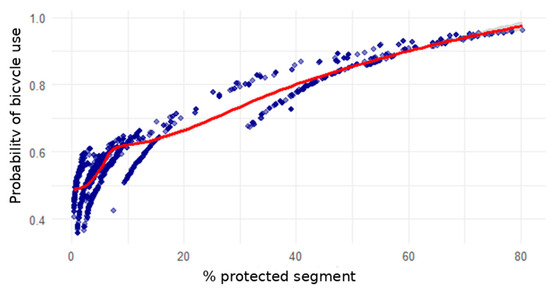
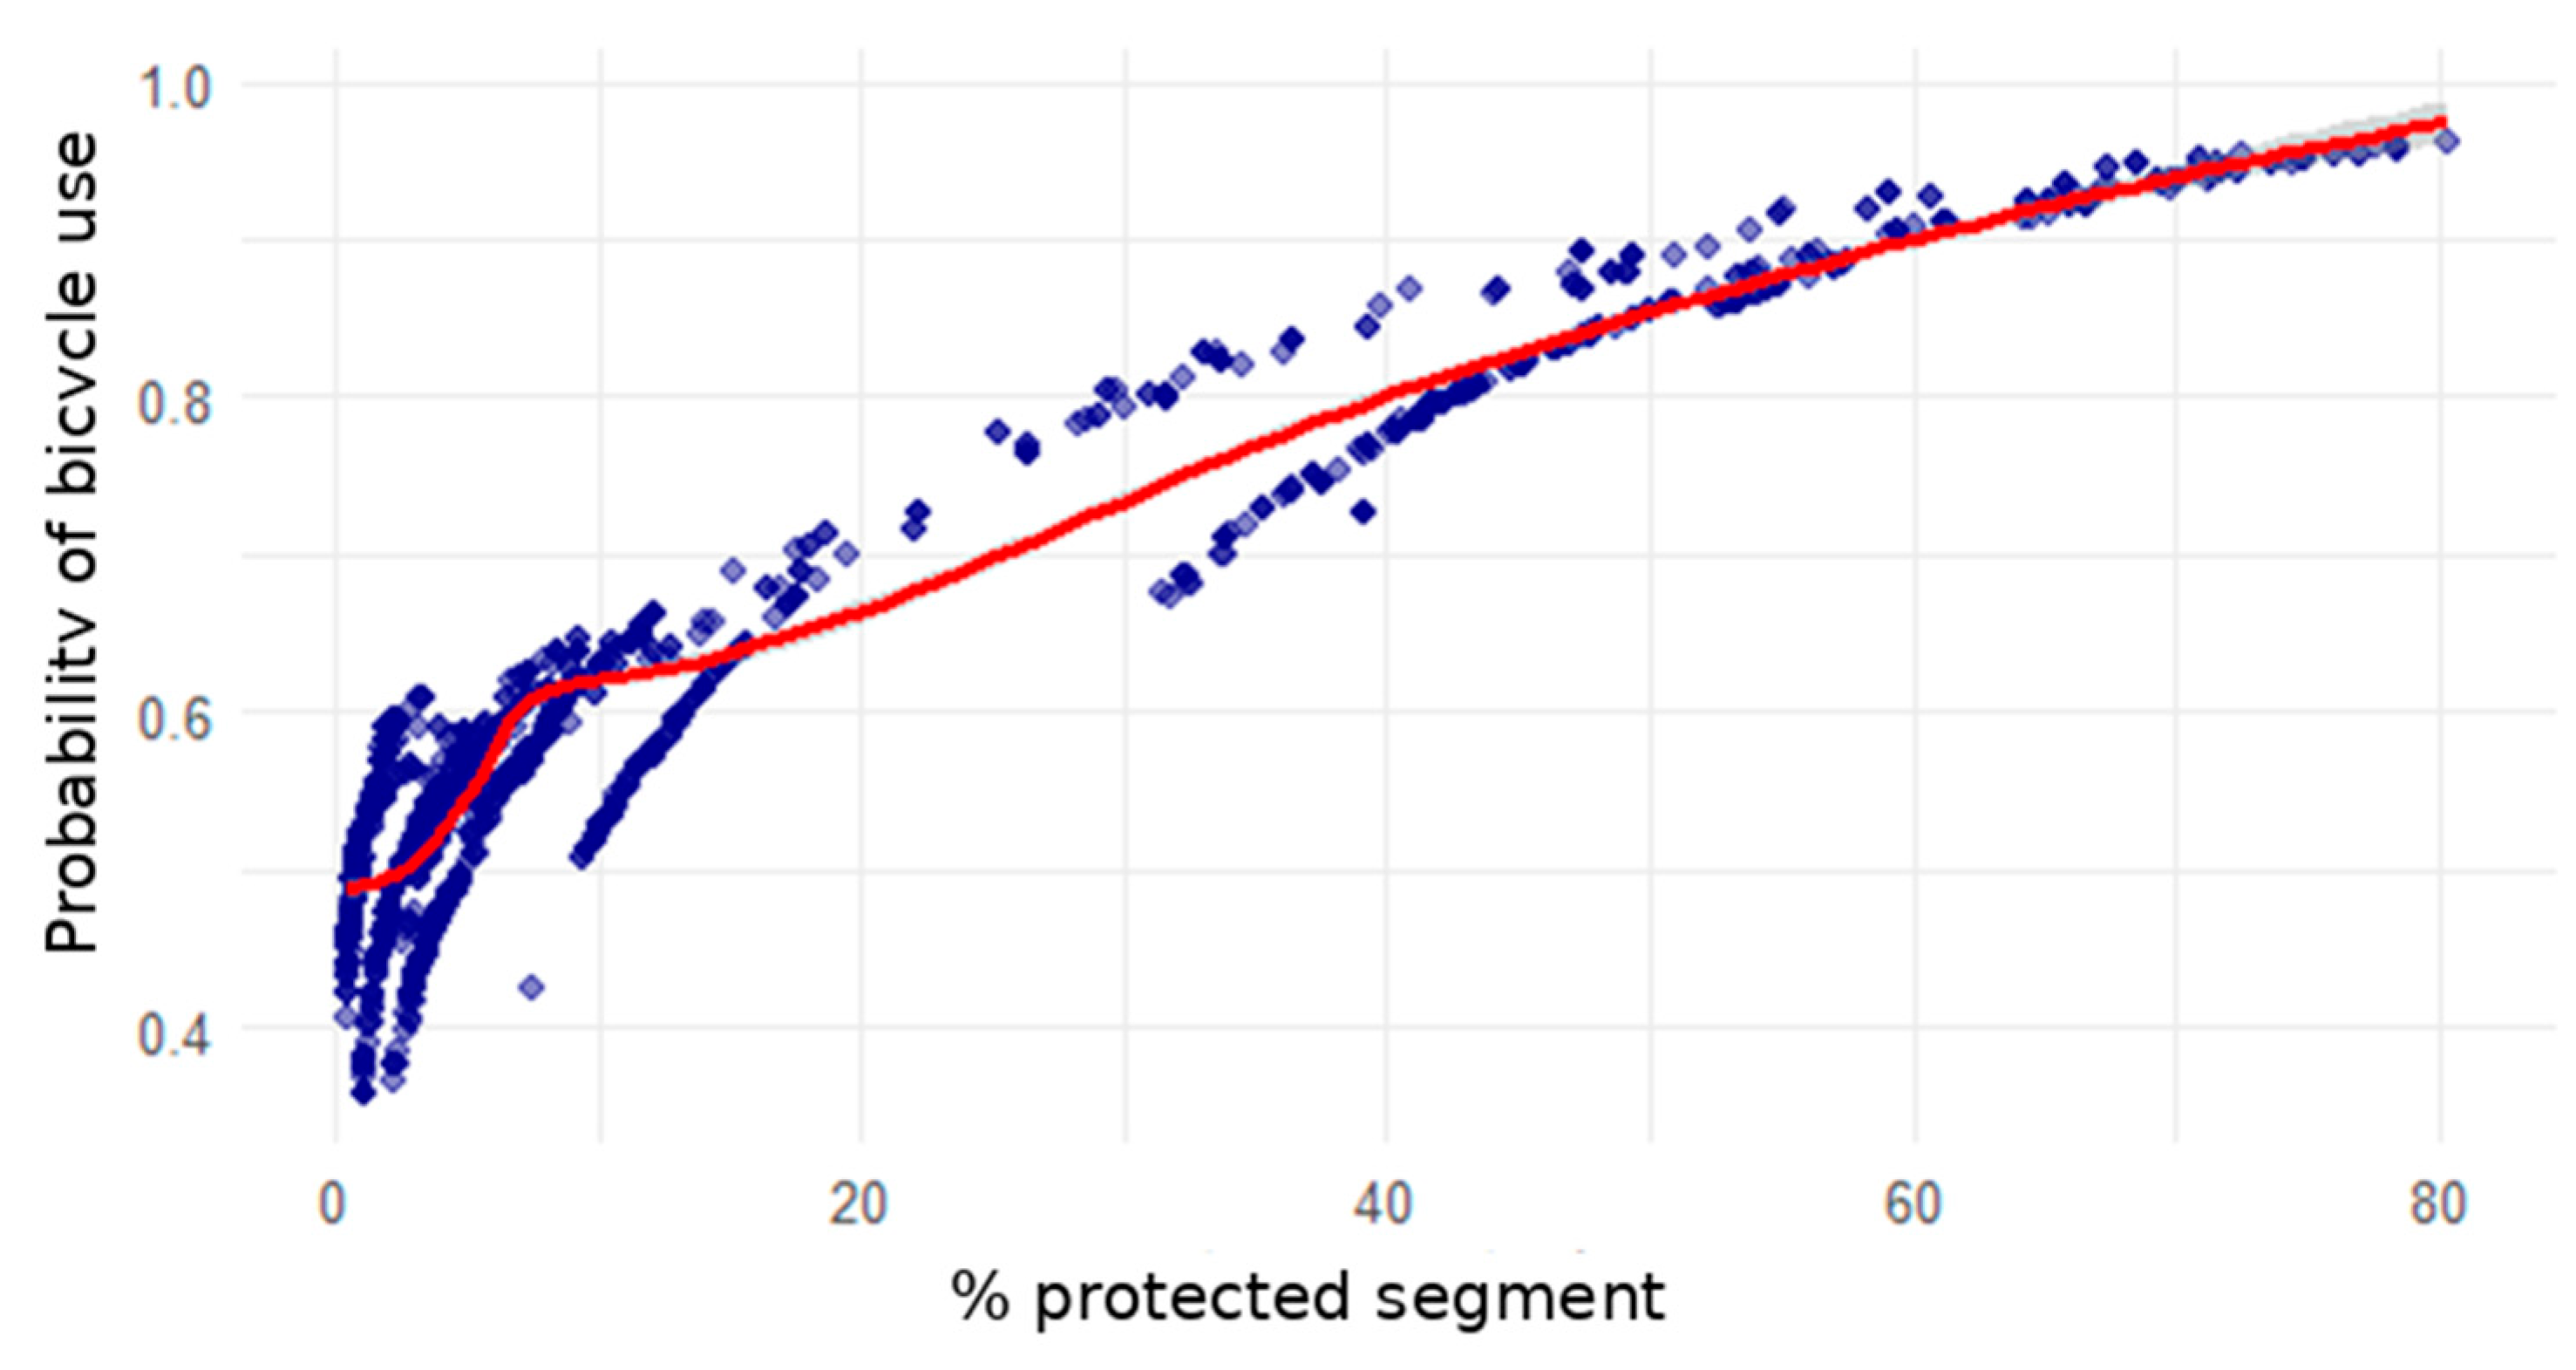
Figure 9 shows the direct relationship between the percentage of protected cycling infrastructure and the modeled probability of use. A nearly linear trend is observed: segments with 70–80% protection reach modeled probabilities close to 0.90–0.95 under the defined specification, whereas those with scarce infrastructure (<10%) are associated with values below 0.6.
Figure 9.
Relationship between the percentage of protected cycling infrastructure and the probability of use.
4. Discussion
This study analyzed the relationship between three key determinants of bicycle use—slope, travel time, and protected infrastructure—in university mobility within the city of Loja, Ecuador. The results indicate, within a predictive and route-level probabilistic framework, a pattern widely documented in the literature: protected cycling infrastructure shows the strongest positive association with the modeled probability of use, while slope and travel time operate as limiting factors. This behavior coincides with previous evidence from intermediate Latin American cities, where road network fragmentation and topographic conditions constrain the adoption of urban cycling [12,17,24].
It should be emphasized that these findings refer to modeled cycling propensity derived from structural route attributes and do not represent observed modal behavior.
4.1. Protected Infrastructure as a Driver of Modal Shift
The almost linear effect observed between the proportion of protected infrastructure and the estimated probability of bicycle use suggests that even moderate increases in the coverage of segregated bikeways are associated with higher modeled cycling propensity under comparable accessibility conditions. This result aligns with recent evidence emphasizing perceived safety and traffic segregation as essential determinants of modal shift toward cycling [25,26].
Studies in university contexts confirm that the perception of safety plays a decisive role among young adults, especially in urban environments with high motorized traffic [27,28]. Likewise, recent research shows that continuous protected corridors can double cycling participation in medium-sized cities when they exceed the threshold of 50% effective route protection [29,30].
This finding is particularly relevant in Loja, where the cycling network still exhibits discontinuities and limited coverage. The identification of segments with high marginal potential—that is, routes with gentle slopes and short travel times but low protection—may support the prioritization of investments within a scenario-based planning framework, consistent with evidence-based planning approaches applied in Ljubljana, Slovenia [31].
The integration of cycling infrastructure with speed management measures, advanced signaling, and traffic calming amplifies the positive effect on modal adoption [32]. In university cities, where distances are short and the demographic profile is favorable, protected infrastructure not only promotes daily bicycle use but also reinforces long-term sustainable behaviors [4,33].
Nevertheless, the magnitude of these associations should be interpreted in light of the assumptions and robustness procedures described in Section 2.4.
4.2. Slope and Travel Time: Topographic and Spatial Barriers
The average slope emerges as the most restrictive physical factor. Routes with slopes above 15% show marked reductions in the probability of use, a phenomenon consistently reported in cities with mountainous morphology [17,34,35]. This pattern reflects both the physical exertion and the perception of effort, which discourage regular trips even when good infrastructure is available [36].
In turn, minimum travel time exhibits a gradual decline in modal propensity starting at 15–20 min, coinciding with the perceived fatigue threshold reported by [37,38]. Within the modeled framework adopted in this study, this interval corresponds to lower estimated cycling probabilities rather than to empirically validated behavioral cutoffs.
This reinforces the idea that cycling mobility policies should focus on short and medium-length trips, articulated with public transport. Bike–bus or bike–tram integration experiences at universities in Spain and Chile have demonstrated remarkable improvements in sustainable mobility indicators [39,40].
The interaction between slope and time suggests that even short trips are penalized when slopes exceed 10–12%, highlighting the need for complementary interventions such as low-slope alternative routes, electric bicycle systems, or tariff incentives [11,41,42].
4.3. Methodological Contributions and Replicability
Methodologically, this study contributes a reproducible integration between spatial analysis and statistical modeling, combining QGIS, QNEAT3, and RStudio to generate accessibility and probability metrics. This approach, comparable to the “Propensity to Cycle Tool” proposed by [14], has proven effective for prioritizing urban investments in cities with limited resources [43,44].
The application of the logistic model to individual routes represents an advance over aggregated approaches, as it captures micro-spatial variations in topography and cycling coverage. Recent studies in Latin America have begun to replicate similar frameworks, confirming their usefulness for active mobility planning [45,46].
Furthermore, the use of open and reproducible data strengthens the transparency and updatability of the model, facilitating its adoption by local authorities. This responds to the need for technical tools that support evidence-based decision-making, a gap that still persists in intermediate Latin American cities [1,24].
However, it is important to acknowledge that the model estimates structural cycling potential and does not incorporate attitudinal, socioeconomic, or temporal behavioral variables.
4.4. Implications for Urban Planning
The results suggest that corridors with slopes below 10% and travel times shorter than 15 min constitute priority areas for investment in protected infrastructure. This type of high modal-return approach aligns with the guidelines of UN-Habitat and the Inter-American Development Bank (IDB) on sustainable urban transport [47,48].
Moreover, empirical evidence suggests that incremental improvement of the network—for example, increasing the proportion of protected routes from 30% to 50%—can raise the probability of bicycle use by more than 15%, even in topographically complex contexts [44,49].
Therefore, the following actions are recommended: i. Consolidate continuous protected corridors between peripheral areas and the university campus. ii. Implement road safety measures at intersections, where crashes are concentrated [50,51]. iii. Promote incentives for electric bicycles to compensate for steeper slopes. iv. Integrate empirical monitoring (GPS, counting sensors, surveys) to validate predictive models.
These recommendations should be interpreted as planning-oriented implications derived from modeled scenarios rather than as direct causal prescriptions.
4.5. Limitations and Future Research Directions
The cross-sectional design of this study prevents establishing direct causality between variables. The calculated probabilities represent potential scenarios, not observed data. Future research should include cyclist counts, GPS tracking, and stated-preference surveys to estimate marginal effects and variable interactions [16,52].
Likewise, perceptual variables such as subjective safety, lighting, and pavement quality could be incorporated through mixed methods, combining spatial analysis with citizen participation [6,53]. Extending the model to other urban destinations—hospitals, commercial zones, or educational centers—would allow generalization of conclusions and strengthen cycling planning in intermediate Latin American cities.
Additionally, given that the study focuses on a university population, caution is required when extrapolating the findings to the broader urban population with different demographic and trip-purpose characteristics.
5. Conclusions
The results of this study indicate, within the predictive framework adopted, that the probability of bicycle use in the Andean city of Loja is structurally associated with three factors: the proportion of protected cycling infrastructure, minimum travel time, and terrain slope. Among these, protected infrastructure emerges as the component with the greatest positive association, with modeled probabilities approaching values close to 0.90–0.95 when route protection exceeds 70%, whereas routes with limited protection (<10%) are associated with probabilities below 0.60. Likewise, slopes above 15% and travel times exceeding 20 min are associated with noticeable reductions in modeled cycling propensity. These findings refer to estimated route-level probabilities derived from a logistic specification and do not represent observed modal behavior or empirically validated behavioral thresholds.
From a practical perspective, the results suggest that segments characterized by slopes below 10–12% and travel times shorter than approximately 15 min exhibit higher modeled cycling propensities and therefore may constitute priority candidates for further technical and economic evaluation. However, the present study does not include cost–benefit analysis, equity assessment, or traffic impact evaluation, and thus its findings should be interpreted as a decision-support input rather than as a prescriptive investment directive. In addition, the incorporation of complementary measures such as integration with public transport, the promotion of electric bicycle use in hilly contexts [41,42], and improvements in intersection safety [50,51] may enhance the structural conditions for cycling, although their effectiveness would require empirical validation in the local context.
Methodologically, the combination of geospatial analysis (GIS) and probabilistic modeling applied in this work provides a reproducible framework for assessing cycling potential in medium-sized cities. The model integrates route-level accessibility (t_min), topographic impedance (slope_mean), and infrastructure coverage (pct_protected) into a bounded probability function, allowing comparative scenario evaluation under explicit assumptions. Nevertheless, the framework estimates structural cycling potential rather than actual demand and does not incorporate attitudinal, socioeconomic, or temporal behavioral variables. While its structure may be adaptable to other urban contexts with similar morphological characteristics, external validation would be required before extrapolating results beyond the university case study analyzed.
At a strategic level, the study highlights that cycling can represent a complementary component within integrated mobility systems, particularly in university-centered environments characterized by relatively short distances. In this specific case, the mean modeled probability of 0.61 suggests moderate structural feasibility for cycling under current network conditions, subject to infrastructural and topographic constraints. University mobility constitutes a controlled and data-rich setting in which predictive models can be tested and refined, potentially generating local evidence to inform sustainable mobility strategies aligned with SDG 11 (Sustainable Cities and Communities).
This work establishes a methodological basis for future research aimed at empirically validating modeled propensities through cyclist counts, GPS tracking, or revealed-preference surveys [15,16,52]. Extending the analysis to other urban attractors—such as hospitals, commercial areas, or administrative zones—would enable testing the robustness and transferability of the model. By explicitly distinguishing between modeled structural conditions and observed behavior, this study contributes technical evidence to the growing literature on cycling mobility in intermediate Andean cities while acknowledging the need for empirical calibration, economic assessment, and broader demographic analysis before drawing generalized policy conclusions.
Despite its contributions, this study presents several limitations. The model estimates structural cycling potential based on route attributes and does not incorporate observed behavioral data, attitudinal factors, socioeconomic characteristics, or dynamic traffic conditions. Furthermore, the cross-sectional and scenario-based design prevents causal inference. Therefore, the results should be interpreted as comparative planning indicators rather than demand forecasts or validated behavioral predictions.
Author Contributions
Conceptualization, F.D.-M. and X.M.-V.; methodology, F.D.-M.; software, F.D.-M. and X.M.-V.; validation, F.D.-M. and X.M.-V.; formal analysis, F.D.-M.; investigation, F.D.-M.; resources, F.D.-M. and X.M.-V.; data curation, X.M.-V.; writing—original draft preparation, F.D.-M.; writing—review and editing, F.D.-M. and X.M.-V.; visualization, F.D.-M.; supervision, X.M.-V. All authors have read and agreed to the published version of the manuscript.
Funding
This research was funded by Universidad Técnica Particular de Loja, grant number POA VIN-56.
Institutional Review Board Statement
Not applicable.
Informed Consent Statement
Not applicable.
Data Availability Statement
The original contributions presented in this study are included in the article. Further inquiries can be directed to the corresponding author.
Acknowledgments
The authors thank the Universidad Técnica Particular de Loja (UTPL) for institutional support and for providing data for research purposes. During the preparation of this manuscript, the authors used ChatGPT (OpenAI GPT-5, ScholarGPT version) exclusively to improve linguistic clarity and English translation. The authors reviewed and edited the generated content and take full responsibility for the final version of the text.
Conflicts of Interest
The authors declare no conflicts of interest.
Abbreviations
The following abbreviations are used in this manuscript:
| UTPL | Universidad Técnica Particular de Loja |
| GIS | Geographic Information Systems |
| OD | Origin–Destination |
| DEM | Digital Elevation Model |
| SRTM | Shuttle Radar Topography Mission |
| PCT | Propensity to Cycle Tool |
| AI | Artificial Intelligence |
| IA-G | Generative Artificial Intelligence (from Inteligencia Artificial Generativa) |
| SDG | Sustainable Development Goal |
| UN-Habitat | United Nations Human Settlements Programme |
| IDB | Inter-American Development Bank |
References
- Solórzano-Barreto, S.; Villegas-Gorozabel, E.; Delgado-Gutiérrez, D.; Macías-Sánchez, L. Integración de una ciclovía en la movilidad interna de la Universidad Técnica de Manabí, Portoviejo. Rev. Cient. INGENIAR Ing. Tecnol. Investig. 2022, 5, 18–37. [Google Scholar]
- Fishman, E. Bikeshare: A Review of Recent Literature. Transp. Rev. 2016, 36, 92–113. [Google Scholar] [CrossRef] [Scilit]
- Mitáš, J.; Cerin, E.; Reis, R.S.; Conway, T.L.; Cain, K.L.; Adams, M.A.; Schofield, G.; Sarmiento, O.L.; Christiansen, L.B.; Davey, R.; et al. Do Associations of Sex, Age and Education with Transport and Leisure-Time Physical Activity Differ across 17 Cities in 12 Countries? Int. J. Behav. Nutr. Phys. Act. 2019, 16, 121. [Google Scholar] [CrossRef] [Scilit]
- Garrard, J.; Rose, G.; Lo, S.K. Promoting Transportation Cycling for Women: The Role of Bicycle Infrastructure. Prev. Med. 2008, 46, 55–59. [Google Scholar] [CrossRef] [Scilit]
- Dill, J.; Carr, T. Bicycle Commuting and Facilities in Major U.S. Cities: If You Build Them, Commuters Will Use Them. Transp. Res. Rec. 2003, 1828, 116–123. [Google Scholar] [CrossRef] [Scilit]
- Winters, M.; Brauer, M.; Setton, E.M.; Teschke, K. Built Environment Influences on Healthy Transportation Choices: Bicycling versus Driving. J. Urban Health 2010, 87, 969–993. [Google Scholar] [CrossRef] [Scilit]
- Sarmiento, O.L.; Díaz del Castillo, A.; Triana, C.A.; Acevedo, M.J.; Gonzalez, S.A.; Pratt, M. Reclaiming the Streets for People: Insights from Ciclovías Recreativas in Latin America. Prev. Med. 2017, 103, S34–S40. [Google Scholar] [CrossRef] [Scilit] [PubMed]
- Mejia-Arbelaez, C.; Sarmiento, O.L.; Vega, R.M.; Castillo, M.F.; Truffello, R.; Martínez, L.; Medina, C.; Guaje, O.; Ortiz, J.D.P.; Useche, A.F.; et al. Social Inclusion and Physical Activity in Ciclovía Recreativa Programs in Latin America. Int. J. Environ. Res. Public Health 2021, 18, 655. [Google Scholar] [CrossRef] [Scilit]
- Medina, C.; Romero-Martinez, M.; Bautista-Arredondo, S.; Barquera, S.; Janssen, I. Move on Bikes Program: A Community-Based Physical Activity Strategy in Mexico City. Int. J. Environ. Res. Public Health 2019, 16, 1685. [Google Scholar] [CrossRef] [Scilit]
- Broach, J.; Dill, J.; Gliebe, J. Where Do Cyclists Ride? A Route Choice Model Developed with Revealed Preference GPS Data. Transp. Res. Part A Policy Pract. 2012, 46, 1730–1740. [Google Scholar] [CrossRef] [Scilit]
- Reckermann, H.; Gutjar, M.; Kowald, M. Studying Shared Bike Route Choice Behavior Using a Bike-Sharing System in Germany. J. Cycl. Micromobility Res. 2024, 2, 100017. [Google Scholar] [CrossRef] [Scilit]
- Sotomayor Muñoz, V.; Betancourt, D.; Sangurima, W.J. Diseño de Ciclovías Para Ciudades Intermedias, Una Propuesta Para La Ciudad de Loja. INNOVA Res. J. 2016, 1, 11–22. [Google Scholar] [CrossRef] [Scilit]
- Kodukula, S. Integrating Land Use Planning and Urban Transport for Low Carbon Cities. In Proceedings of the Intergovernmental Eleventh Regional Environmentally Sustainable Transport (EST) Forum in ASIA, ULAANBAATAR, Mongolia, 2–5 October 2018. [Google Scholar]
- Woodcock, J.; Aldred, R.; Lovelace, R.; Strain, T.; Goodman, A. Health, Environmental and Distributional Impacts of Cycling Uptake: The Model Underlying the Propensity to Cycle Tool for England and Wales. J. Transp. Health 2021, 22, 101066. [Google Scholar] [CrossRef] [Scilit]
- Hood, J.; Sall, E.; Charlton, B. A GPS-Based Bicycle Route Choice Model for San Francisco, California. Transp. Lett. 2011, 3, 63–75. [Google Scholar] [CrossRef] [Scilit]
- Łukawska, M.; Paulsen, M.; Rasmussen, T.K.; Jensen, A.F.; Nielsen, O.A. A Joint Bicycle Route Choice Model for Various Cycling Frequencies and Trip Distances Based on a Large Crowdsourced GPS Dataset. Transp. Res. Part A Policy Pract. 2023, 176, 103834. [Google Scholar] [CrossRef] [Scilit]
- Avila-Palencia, I.; Sarmiento, O.L.; Gouveia, N.; Jáuregui, A.; Mascolli, M.A.; Slovic, A.D.; Rodríguez, D.A. Bicycle Use in Latin American Cities: Changes over Time by Socio-Economic Position. Front. Sustain. Cities 2023, 5, 1055351. [Google Scholar] [CrossRef] [Scilit] [PubMed]
- van Nijen, N.; Baran Ulak, M.; Veenstra, S.; Geurs, K. Exploring Factors Affecting Route Choice of Cyclists: A Novel Varying-Contiguity Spatially Lagged Exogenous Modeling Approach. J. Transp. Land Use 2024, 17, 557–577. [Google Scholar] [CrossRef] [Scilit]
- Cabrera Venegas, A.F. Análisis de Demanda de Viajes Hacia Una Comunidad Universitaria a Partir de Datos Recolectados Con Una Aplicación Móvil; Universidad del Azuay: Cuenca, Ecuador, 2024. [Google Scholar]
- QGIS Project QGIS User Guide (Version 3.40): Network Analysis. Available online: https://docs.qgis.org/3.40/en/docs/user_manual/processing_algs/qgis/networkanalysis.html (accessed on 13 February 2026).
- Farr, T.G.; Rosen, P.A.; Caro, E.; Crippen, R.; Duren, R.; Hensley, S.; Kobrick, M.; Paller, M.; Rodriguez, E.; Roth, L.; et al. The Shuttle Radar Topography Mission. Rev. Geophys. 2007, 45, RG2004. [Google Scholar] [CrossRef] [Scilit]
- Man, C.D.; Nguyen, T.T.; Bui, H.Q.; Lasko, K.; Nguyen, T.N.T. Improvement of Land-Cover Classification over Frequently Cloud-Covered Areas Using Landsat 8 Time-Series Composites and an Ensemble of Supervised Classifiers. Int. J. Remote Sens. 2018, 39, 1243–1255. [Google Scholar] [CrossRef] [Scilit]
- Goodman, A.; Lovelace, R.; Aldred, R.; Woodcock, J. Propensity to Cycle Tool (PCT) User Manual: Methods for the Commuting Layer; University of Leeds: Leeds, UK, 2020. [Google Scholar]
- Toni-Llerena, R.; Loayza-Muñoz, E.; Zeballos-Velarde, C. Challenges in the Implementation of Bike Lane Networks in Intermediate Latin American Cities. The Case of Arequipa Peru. In Greening Our Cities: Sustainable Urbanism for a Greener Future; Advances in Science, Technology and Innovation; Springer: Cham, Switzerland, 2024; pp. 33–48. [Google Scholar] [CrossRef] [Scilit]
- Knight, A.; Charlton, S.G. Protected and Unprotected Cycle Lanes’ Effects on Cyclists’ Behaviour. Accid. Anal. Prev. 2022, 171, 106668. [Google Scholar] [CrossRef] [Scilit]
- Pearson, L.; Page, M.J.; Gerhard, R.; Clarke, N.; Winters, M.; Bauman, A.; Arogundade, L.; Beck, B. Effectiveness of Interventions for Modal Shift to Walking and Bike Riding: A Systematic Review with Meta-Analysis. Transp. Rev. 2025, 45, 482–513. [Google Scholar] [CrossRef] [Scilit]
- Battistini, R.; Nalin, A.; Simone, A.; Lantieri, C.; Vignali, V. How Do University Student Cyclists Ride? The Case of University of Bologna. Appl. Sci. 2022, 12, 11569. [Google Scholar] [CrossRef] [Scilit]
- Martín-López, I.M.; García-Taibo, O.; Aguiló, A.; Borràs, P.A. Understanding Factors Influencing Cycling Behaviour Among University Students and Staff: A Cross-Sectional Study. Soc. Sci. 2025, 14, 261. [Google Scholar] [CrossRef] [Scilit]
- Bonham, J.; Koth, B. Universities and the Cycling Culture. Transp. Res. Part D Transp. Environ. 2010, 15, 94–102. [Google Scholar] [CrossRef] [Scilit]
- Moran, M.; Salman, M.; Yabe, T. Causal Impacts of Protected Bike Lanes on Cycling Behavior with Demographic Disparities. arXiv 2025, arXiv:2507.04936. [Google Scholar] [CrossRef] [Scilit]
- Trček, I.S.; Rijavec, R. Strategic Evaluation of Cycling Infrastructure in Emerging Contexts: A Case Study of High-Capacity Corridors in Ljubljana, Slovenia. 2025. Available online: https://www.researchsquare.com/article/rs-7346285/v1 (accessed on 16 March 2026).
- Carter, D.L.; Hunter, W.W.; Zegeer, C.V.; Stewart, J.R.; Huang, H. Bicyclist Intersection Safety Index. Transp. Res. Rec. 2007, 2031, 18–24. [Google Scholar] [CrossRef] [Scilit]
- Buehler, R.; Pucher, J. Trends in Walking and Cycling Safety: Recent Evidence From High-Income Countries, With a Focus on the United States and Germany. Am. J. Public Health 2017, 107, 281–287. [Google Scholar] [CrossRef] [Scilit]
- Heinen, E.; van Wee, B.; Maat, K. Commuting by Bicycle: An Overview of the Literature. Transp. Rev. 2010, 30, 59–96. [Google Scholar] [CrossRef] [Scilit]
- Meeder, M.; Aebi, T.; Weidmann, U. The Influence of Slope on Walking Activity and the Pedestrian Modal Share. Transp. Res. Procedia 2017, 27, 141–147. [Google Scholar] [CrossRef] [Scilit]
- Eldeeb, G.; Mohamed, M.; Páez, A. Built for Active Travel? Investigating the Contextual Effects of the Built Environment on Transportation Mode Choice. J. Transp. Geogr. 2021, 96, 103158. [Google Scholar] [CrossRef] [Scilit]
- Marín-Figuera, M.; Manjarréz-Zambrano, N. University Bonding: Learning from the Community. Rev. Científica Multidiscip. 2022, 7, 70–78. [Google Scholar]
- Nelson, N.M.; Foley, E.; O’Gorman, D.J.; Moyna, N.M.; Woods, C.B. Active Commuting to School: How Far Is Too Far? Int. J. Behav. Nutr. Phys. Act. 2008, 5, 1. [Google Scholar] [CrossRef] [Scilit]
- Mora, R.; Miranda-Marquez, S.; Truffello, R.; Sadarangani, K.P. Bikesharing and Ordinary Cyclists from Chile: Comparing Trips, Attitudes, and Health-Behaviours. J. Transp. Geogr. 2024, 116, 103826. [Google Scholar] [CrossRef] [Scilit]
- Hidalgo-González, C.; Rodríguez-Fernández, M.P.; Pérez-Neira, D. Energy Consumption in University Commuting: Barriers, Policies and Reduction Scenarios in León (Spain). Transp. Policy 2022, 116, 48–57. [Google Scholar] [CrossRef] [Scilit]
- Behrendt, F.; Cairns, S.; Raffo, D.; Philips, I. Impact of E-Bikes on Cycling in Hilly Areas: Participants’ Experience of Electrically-Assisted Cycling in a UK Study. Sustainability 2021, 13, 8946. [Google Scholar] [CrossRef] [Scilit]
- Arning, L.; Kaths, H. Will E-Bikes Revolutionize Urban Mobility? Development and Application of a Transport Model Differentiating between Conventional and Electric Bicycle Traffic. Eur. Transp. Stud. 2025, 2, 100029. [Google Scholar] [CrossRef] [Scilit]
- Terh, S.H.; Cao, K. GIS-MCDA Based Cycling Paths Planning: A Case Study in Singapore. Appl. Geogr. 2018, 94, 107–118. [Google Scholar] [CrossRef] [Scilit]
- Żochowska, R.; Jacyna, M.; Kłos, M.J.; Soczówka, P. A GIS-Based Method of the Assessment of Spatial Integration of Bike-Sharing Stations. Sustainability 2021, 13, 3894. [Google Scholar] [CrossRef] [Scilit]
- Larrañaga, A.M.; de Ortúzar, J.D.; Oviedo, D.; Ruiz-Padillo, A. Active Mobility, Equity and Inclusion. Lat. Am. Transp. Stud. 2025, 3, 100040. [Google Scholar] [CrossRef] [Scilit]
- Folco, P.; Gauvin, L.; Tizzoni, M.; Szell, M. Data-Driven Micromobility Network Planning for Demand and Safety. Environ. Plan. B Urban Anal. City Sci. 2022, 50, 2087–2102. [Google Scholar] [CrossRef] [Scilit]
- ONU-Hábitat The Value of Sustainable Urbanization; Optical Network Unit (ONU): New York, NY, USA, 2020.
- Banco Interamericano de Desarrollo BID Ciclo-Inclusión En América Latina y El Caribe: Guía Para Impulsar El Uso de La Bicicleta. Banco Interam. de Desarro. 2015, 91, 1–38.
- Makahleh, H.Y.; Taamneh, M.M.; Dissanayake, D. Promoting Sustainable Transport: A Systematic Review of Walking and Cycling Adoption Using the COM-B Model. Future Transp. 2025, 5, 79. [Google Scholar] [CrossRef] [Scilit]
- Wang, J.; Chen, Y.; Chen, D. Analyzing Safety Concerns of (e-) Bikes and Cycling Behaviors at Intersections in Urban Area. Sustainability 2022, 14, 4231. [Google Scholar] [CrossRef] [Scilit]
- Skoczyński, P. Analysis of Solutions Improving Safety of Cyclists in the Road Traffic. Appl. Sci. 2021, 11, 3771. [Google Scholar] [CrossRef] [Scilit]
- Lee, J.; Kim, J. An Integrated Approach to Identify Functional Areas for Bicycle Use with Spatial–Temporal Information: A Case Study of Seoul, Republic of Korea. Land 2025, 14, 2069. [Google Scholar] [CrossRef] [Scilit]
- Lagarias, A.; Prastacos, P.; Dimelli, D.; Delgado-Jiménez, A. Integrating Spatial Analysis and Regional Science to Guide Urban Planning (Editorial for Special Issue Reprint). Land 2025, 14, 2037. [Google Scholar] [CrossRef] [Scilit]

Disclaimer/Publisher’s Note: The statements, opinions and data contained in all publications are solely those of the individual author(s) and contributor(s) and not of MDPI and/or the editor(s). MDPI and/or the editor(s) disclaim responsibility for any injury to people or property resulting from any ideas, methods, instructions or products referred to in the content. |
© 2026 by the authors. Licensee MDPI, Basel, Switzerland. This article is an open access article distributed under the terms and conditions of the Creative Commons Attribution (CC BY) license.