


Abstract
Background: Depression is a common mental disorder, and early and objective diagnosis of depression is challenging. New advances in deep learning show promise for processing audio and video content when screening for depression. Nevertheless, the majority of current methods rely on raw video processing or multimodal pipelines, which are computationally costly and challenging to understand and create privacy issues, restricting their use in actual clinical settings. Methods: Based solely on spatiotemporal 3D face landmark representations, we describe a unique, totally visual, and lightweight deep learning approach to overcome these constraints. In this paper we introduce, for the first time, a pure visual deep learning framework, based on spatiotemporal 3D facial landmarks extracted from clinical interview videos contained in the DAIC-WOZ and Extended DAIC-WOZ (E-DAIC) datasets. Our method does not use raw video or any type of semi-automated multimodal fusion. Whereas raw video streaming can be computationally expensive and is not well suited to investigating specific variables, we first take a temporal series of 3D landmarks, convert them to pseudo-images (224 × 224 × 3), and then use them within a CNN-LSTM framework. Importantly, CNN-LSTM provides the ability to analyze the spatial configuration and temporal dimensions of facial behavior. Results: The experimental results indicate macro-average F1 scores of 0.74 on DAIC-WOZ and 0.762 on E-DAIC, demonstrating robust performance under heavy class imbalances, with a variability of ±0.03 across folds. Conclusion: These results indicate that landmark-based spatiotemporal modeling represents the future of lightweight, interpretable, and scalable automatic depression detection. Second, our results suggest exciting opportunities for completely embedding ADI systems within the framework of real-world MHA.
1. Introduction
Depression, a common psychiatric illness, considerably impairs quality of life. More than 280 million people around the world suffer from depression according to the World Health Organization, as of the current date. Traditional diagnosis largely relies on clinical interviews and self-report questionnaires, which are intrinsically subjective and are associated with patients’ mood at a given time point.
This limitation has motivated the development of automated, objective, and scalable approaches to evaluating mental health.
With documented connections to neural system dysfunctions, depression is a complex illness involving neurobiological, genetic, and environmental factors. Furthermore, suicidal thoughts and attempts are far more common in those who suffer from depression.
Recent advances in deep learning have shown promising developments in non-invasive multimodal (primarily video) depression detection. In these strategies, facial expressions play an important role as they are strong indicators of depression. Studies have consistently shown that people who are depressed tend to show decreased facial expressiveness and more variable gaze and head movement—all signals on the face that can be well captured by modern computer vision. The widely recognized dataset DAIC-WOZ [1] and its extension E-DAIC-WOZ [2] set the benchmark in this field. These datasets include aligned audiovisual recordings of interviews along with Clinical Depression scores (PHQ-8), and provide a strong computational framework through which to study visible symptoms of depression. Most related studies, however, have focused on multimodal fusion of audio–text–video. Few studies have sought to investigate the potential of utilizing 3D facial landmarks exclusively, although they are advantageous regarding privacy protection, computational requirements, and interpretability.
A few recent studies on promising structural methods for surveillance and depression detection using video have been published in the literature. Wang et al. proposed the FacialPulse RNN for learning the temporal dynamics of facial landmarks and achieved noteworthy improvements in classification accuracy [3]. Liu et al. proposed PRA-Net, which uses attention to emphasize discriminative facial regions [4]. Guo et al. showed improvements in fusing informative visual features [5]. Wei et al. proposed a sub-attentional fusion mechanism to facilitate multimodal information fusion [6].
Additionally, He et al. designed a spatiotemporal attention network using both spatial and temporal clues for the task of depression recognition [7]. 3D convolutions (i.e., three-dimensional convolutional neural networks) have also been demonstrated to be effective in modeling spatiotemporal relations in video data, as illustrated by P. Pan et al. [8]. Transformer-based video models (e.g., Depress former) have more recently surpassed conventional CNNs in this setting [9]. Tao et al. further developed this area, using CAIINET-integrated context-aware attention mechanisms and information interaction to improve the detection result [10].
The present study formulates a video-centric framework for depression detection using 3D facial landmarks derived from the DAIC-WOZ and E-DAIC datasets. These facial landmarks are converted to pseudo-image matrices, which serves as the primary input for a synthesized CNN-LSTM architecture. Unlike previous multimodal frameworks, our method relies solely on geometric landmark information, introducing a novel pseudo-image representation that enables deep spatiotemporal learning while remaining lightweight and privacy-preserving. This framework is designed to consider the spatial relationships between facial features and the temporal changes which occur through the duration of the recording.
Unlike previous studies that have often used multimodal data fusion, this study zooms in on what the video data adds to and when it would be used (or not). This contrast highlights the novelty of our work: it shows that reliable depression detection can be achieved merely based on 3D facial landmarks with privacy preservation and computational efficiency. The proposed approach achieved classification accuracies of 76% and 77% on the DAIC-WOZ and E-DAIC datasets, respectively, along with macro-average F1-scores of 0.74 and 0.762. These F1-scores were stable across folds, indicating consistent performance and reliable predictions under heavy class imbalance. The results suggest that depression symptom detection can be effectively supported using solely video-based facial landmark dynamics, even in challenging imbalanced settings.
These results, which come from our research, show that a purely vision-based strategy utilizing 3D face landmarks can offer a trustworthy and understandable substitute for multimodal depression detection techniques. The framework decreases computational requirements, protects privacy, and emphasizes the potential of facial behavior analysis as an objective tool for mental health assessment by concentrating only on geometric aspects. To the best of our knowledge, this study establishes the groundwork for future research on lightweight, video-centric models in real-world and clinical contexts.
2. Related Work
Automatic approaches for depression detection have been explored using various modalities such as audio, video and text. In the following, we categorize the discussion into three areas: audio-oriented, video-oriented and multimodal methods.
2.1. Audio-Based Methods
Early research primarily focused on speech signals, with Mel-frequency cepstral coefficients (MFCCs) and recurrent neural networks (RNNs) for automatic detection of depressive states [11]. These acoustic-based methods can capture prosodic and paralinguistic cues correlated to depression severity [12]. Newer work has introduced attention mechanisms and more sophisticated temporal modeling in order to better recognize depressive states from speech [13,14]. With the recent popularity of deep learning, it has been a growing trend to use multimodal frameworks which exploit complementary information among audio, video and text. Dham et al. [15] presented a multimodal approach using Fisher vector encoding and statistical descriptors, which outperforms depression scale recognition. Another paper on audio/video fusion was presented in [16].
2.2. Video-Based Methods
Attention-aware fusion has been conducted for audio and video signals together, also proving the significance of cross-modal features with added information. Video-based studies have received much attention because these external facial expressions and head movements are visually rich in information. For example, spatiotemporal feature extraction methods such as LBP-TOP were used to encode temporal variations in facial micro-expressions [17]. More recently 3D facial landmarks and graph-based representations have been used, where Graph Convolutional Networks (GCNs) were also introduced to retain the structural properties of facial geometry [18,19].
Deep learning-based CNNs and LSTMs are still used as the mainstay for video sequence modeling. For instance, He et al. [20] reviewed the development of deep learning for depression detection, revealing the new appearance attention mechanisms in order to focus on informative spatio-temporal features. Furthermore, Transformer-based models have been applied to model long-range dependencies in facial videos and achieved preliminary evidence for performance improvements [21].
Recent advances have demonstrated the critical need for effective local and global facial feature fusion. Another proposed method [22] combined ResNet34 for local feature extraction, Swin-Transformer for global features, and BiLSTM and multihead attention modules with the aim to learn expressive representations from them, which demonstrate superior classification accuracy on DAIC-WOZ. More recent work in video-centric approaches with 3D landmark input (TCEDN) [23], attention-based hybrid multi-head networks [21], and temporal angle feature methods [19] has validated the usefulness of structured, lightweight models for depression detection.
2.3. Multimodal Approaches
In addition to handcrafted and deep features, multimodal datasets such as DAIC-WOZ (which has been extended by the E-DAIC dataset) have represented major benchmarks. A recent work in Electronics [24] leveraged both audio and video modalities to predict depression severity, confirming the superiority of multimodal systems over unimodal ones. Multimodal systems refer to models that leverage multiple data types simultaneously, such as audio, video, and text, to improve depression detection performance compared to unimodal approaches [16].
Despite these advances, several challenges remain, including the limited size of labeled datasets, data imbalance, and the generalizability of models across diverse populations and cultures [16,25]. Addressing these issues is critical for deploying real-world depression detection systems.
3. Materials and Methods
Effective depression detection from face videos requires capturing both spatial and temporal facial information while correcting class imbalance in the dataset. To enable reliable and accurate detection, our method uses a CNN-LSTM architecture with an imbalance-aware training strategy.
3.1. The Proposed Approach
In this section, we provide a detailed account of our method for the automatic detection of faces exhibiting depression based on facial videos and how to deal with the strong class imbalance in our dataset. Our method is based on spatiotemporal feature extraction using a CNN-LSTM model and class-imbalance-aware loss function.
3.1.1. Data Preprocessing and Input Representation
We use two different pipelines: (i) a video-centric pipeline where pure 3D facial landmarks are converted to synthetic pseudo-images (224 × 224 × 3) for CNN-LSTM modeling (DAIC-WOZ), and (ii) an OpenFace feature-based pipeline for the E-DAIC dataset, including head pose, gaze, and facial action units. This distinction allows us to evaluate the predictive power of 3D landmarks alone versus richer OpenFace representations, and clarifies how landmark matrices are mapped to CNN-compatible inputs.
Input Data
We employ 3D facial landmark sequences directly extracted from the video frames to represent the spatial and temporal behaviors of the faces. Each video is divided into frames, with each frame containing a set of 3D facial landmarks in the main coordinate system as
where is the total number of frames, is the number of landmarks per frame, and ,, are the 3D coordinates of the -th landmark in frame .
The full sequence is represented as
This representation successfully models dynamic facial motions that are relevant to depression analysis and is consistent with approaches used in previous works [18,26]. Equations (1) and (2) clearly define the frame-level and sequence-level representations used as input to our CNN-LSTM model.
Temporal Segmentation and Frame Sampling
A sequence of 3D facial landmark features from *_CLNF_features3D.txt files is used to represent each participant in DAIC-WOZ. To guarantee a consistent input for the CNN-LSTM, 16 frames are uniformly sampled from each sequence; longer sequences are evenly sub-sampled to preserve the temporal dynamics of the facial landmarks, while shorter sequences are repeated to reach 16 frames.
3.1.2. Model Architecture
As Transformer-based architectures demonstrate competent performance by modeling long-range dependencies, the CNN-LSTM architecture was chosen due to its lower computational requirements and suitability for smaller datasets. CNN-LSTM provides interpretable features and can be deployed in real-time scenarios. Our model comprises two major parts:
- A CNN module to extract the spatial features of each frame.
- An LSTM block to learn the temporal relations between the sequences.
Spatial Feature Extraction (CNN)
Each frame is processed through a CNN to extract spatial features:
where is the CNN function and D is the dimensionality of the feature.
The CNN is a lightweight, customized architecture designed specifically for 3D facial landmark pseudo-images. It is computationally efficient, is suitable for small datasets, and allows real-time deployment, unlike larger state-of-the-art architectures (e.g., ResNet, EfficientNet), which would require more resources and may not be necessary for this task.
The CNN architecture includes the following:
- Convolutional Layers: Utilize 3 × 3 kernels with ReLU activation functions:
- Pooling Layers: Apply max-pooling for subsampling to reduce spatial size:
- Batch Normalization: Normalize activations to accelerate training:
This architecture is used based on prior works showing the effectiveness of CNNs for facial landmark analysis [3]. The CNN architecture consists of three convolutional layers, each followed by a max-pooling layer. All convolutional layers use 3 × 3 kernels with ReLU activation. The output of the final convolutional layer is flattened into a 128-dimensional feature vector, which is provided as input to the LSTM network.
Temporal Modeling (LSTM)
The sequence is input into an LSTM network:
In our architecture, the LSTM consists of two stacked layers, each containing 64 hidden units. At each time step, the LSTM receives the 128-dimensional feature vector generated by the CNN, enabling effective spatiotemporal modeling of facial landmark dynamics.
With initial hidden state the final hidden state encapsulates the temporal information of the sequence. This approach aligns with methodologies that leverage LSTM networks for temporal feature extraction in depression detection [27].
Classification Layer
The final LSTM output is passed through a fully connected layer followed by a softmax activation to obtain class probabilities:
where represents the classes: depressed and non-depressed.
3.1.3. Handling Class Imbalance
Given the dataset’s imbalance, with a predominance of non-depressed samples, we implement strategies to mitigate bias.
Class Weight Computation
Class weights are computed inversely proportional to class frequencies:
where is the number of samples in class , and is the total number of samples.
Weighted Cross-Entropy Loss
The loss function incorporates class weights:
This method has been effective in addressing class imbalance in similar contexts [28].
Focal Loss for Hard Example Mining
To focus on challenging samples, we employ the focal loss
with focusing parameter , typically set to 2. This technique enhances model performance on imbalanced datasets [29].
3.1.4. Training and Optimization
The model is trained end-to-end using the Adam optimizer with the following hyperparameters:
- Learning Rate: 1 × 10⁻⁴;
- Batch Size: 32;
- Number of Epochs: 50;
- Dropout Rate: 0.5 (applied after CNN and LSTM layers).
The reported hyperparameters were selected through manual tuning based on validation set performance. No exhaustive grid search was conducted due to the limited size of the dataset and the risk of overfitting. The number of epochs was chosen empirically. We observed that both training and validation losses converged before 50 epochs, and no significant improvement was obtained with more epochs. Moreover, no signs of overfitting were detected, as validation loss remained stable and did not diverge from the training loss.
This strategy allowed us to obtain a stable configuration while maintaining computational efficiency.
To address class imbalance, the final classification threshold was calibrated using the validation set only, without using test set data, in order to avoid information leakage. The threshold was selected by maximizing the macro-averaged F1-score on the validation set. It is important to note that threshold calibration does not affect the CNN-LSTM architecture, but only influences the final decision boundary applied to the model outputs.
The Adam update rule for each parameter is
where and are bias-corrected first and second moment estimates.
3.1.5. Architectural Overview
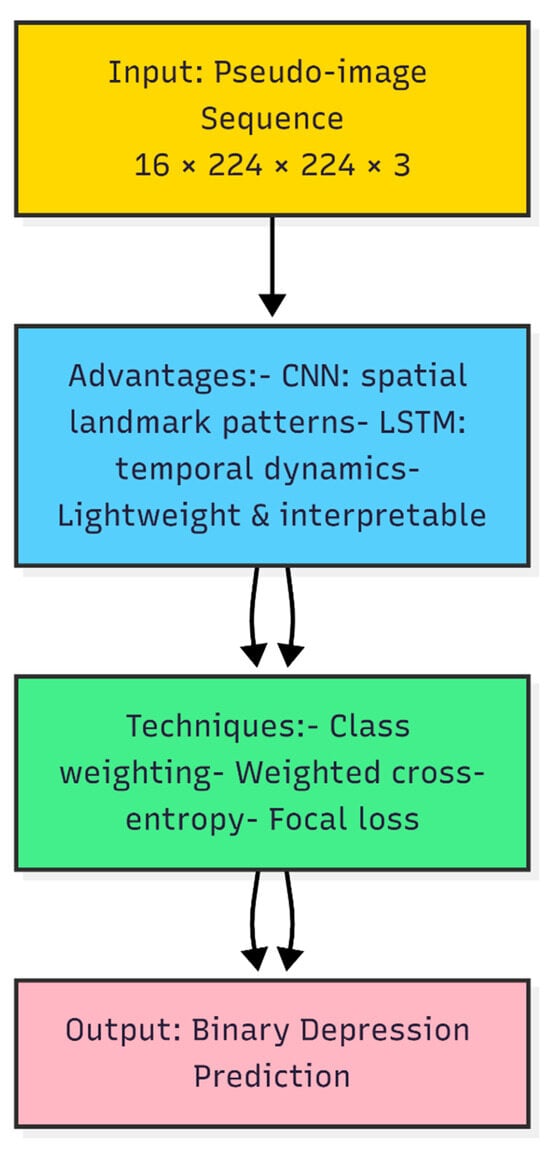
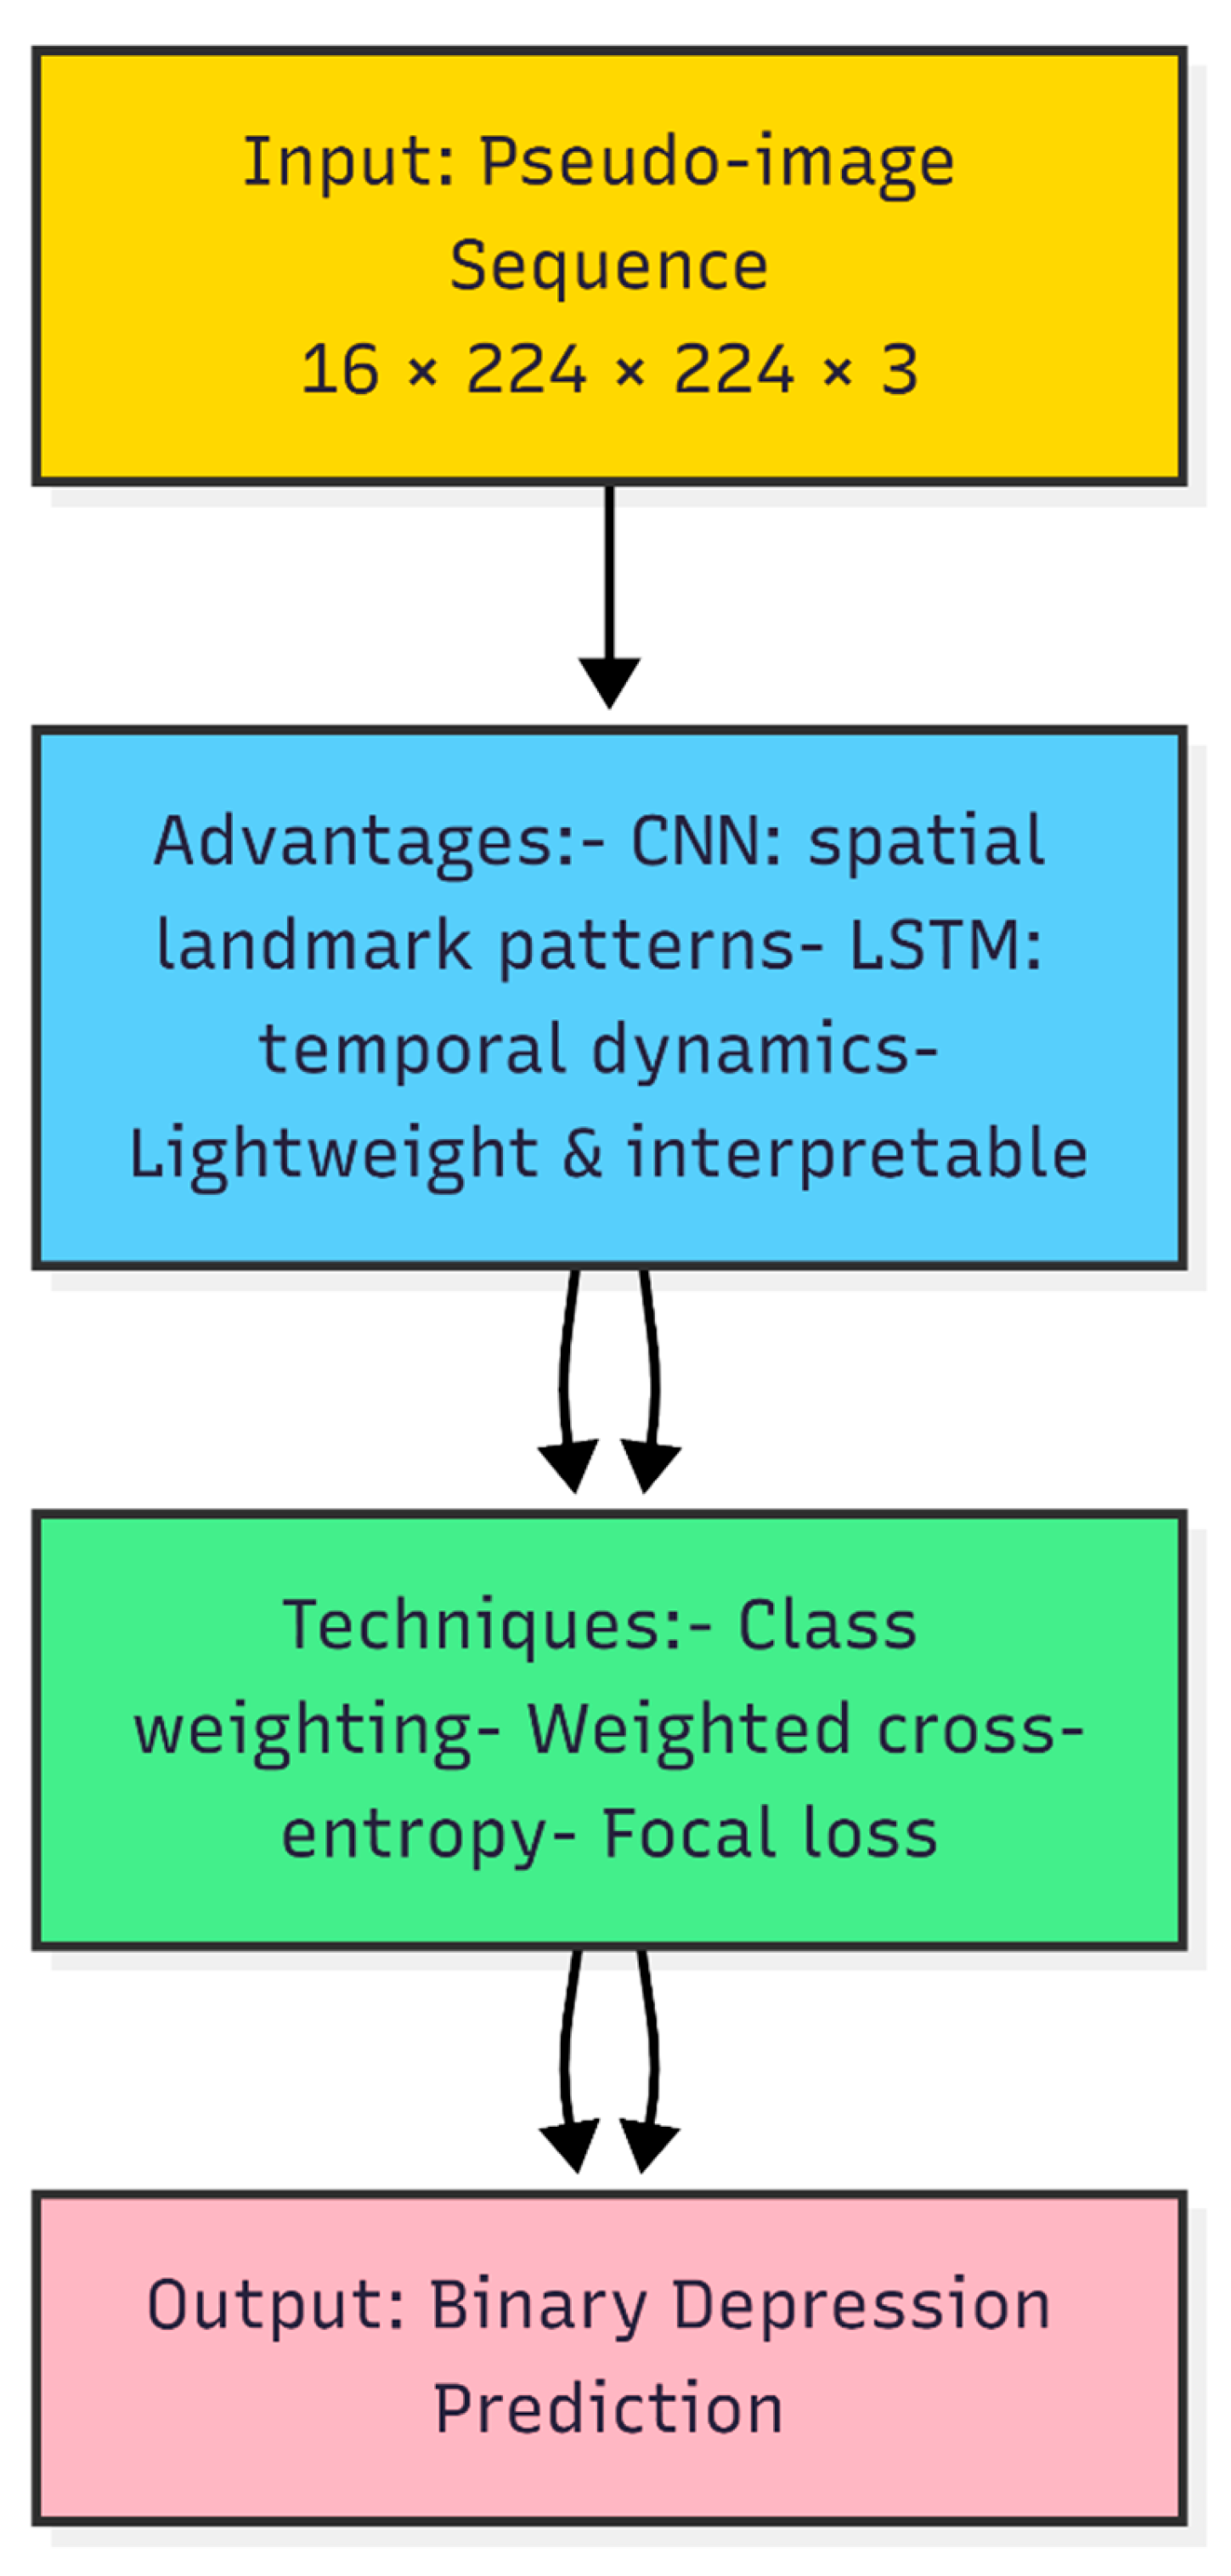
Advantages of CNN-LSTM
Using pseudo-images created from 3D face landmarks, the CNN-LSTM architecture (Figure 1) offers a strong, lightweight, and comprehensible framework for depression identification. While LSTM layers model temporal dynamics across frames, CNN layers record spatial patterns of the facial landmarks inside each frame, allowing the system to identify minute changes in facial activity across time. Additionally, the model is resilient to skewed label distributions that are frequently found in clinical datasets by utilizing class imbalance-handling strategies such class weighting, weighted cross-entropy, or focal loss.
Figure 1.
CNN-LSTM architecture and class imbalance techniques.
DAIC-WOZ
- DAIC-WOZ Pipeline
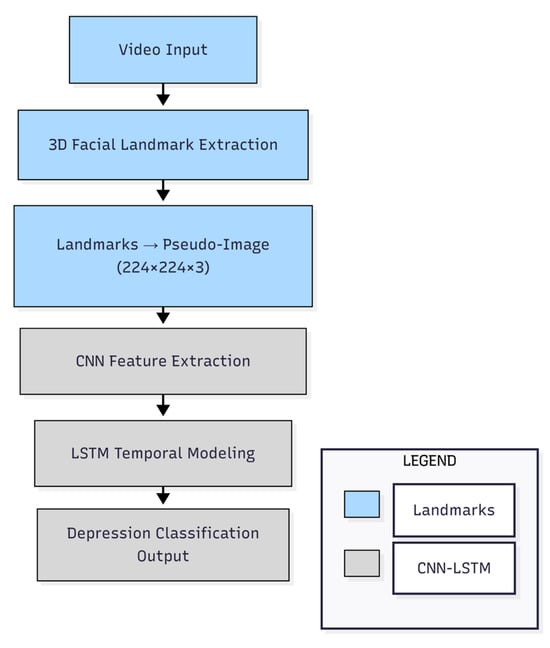
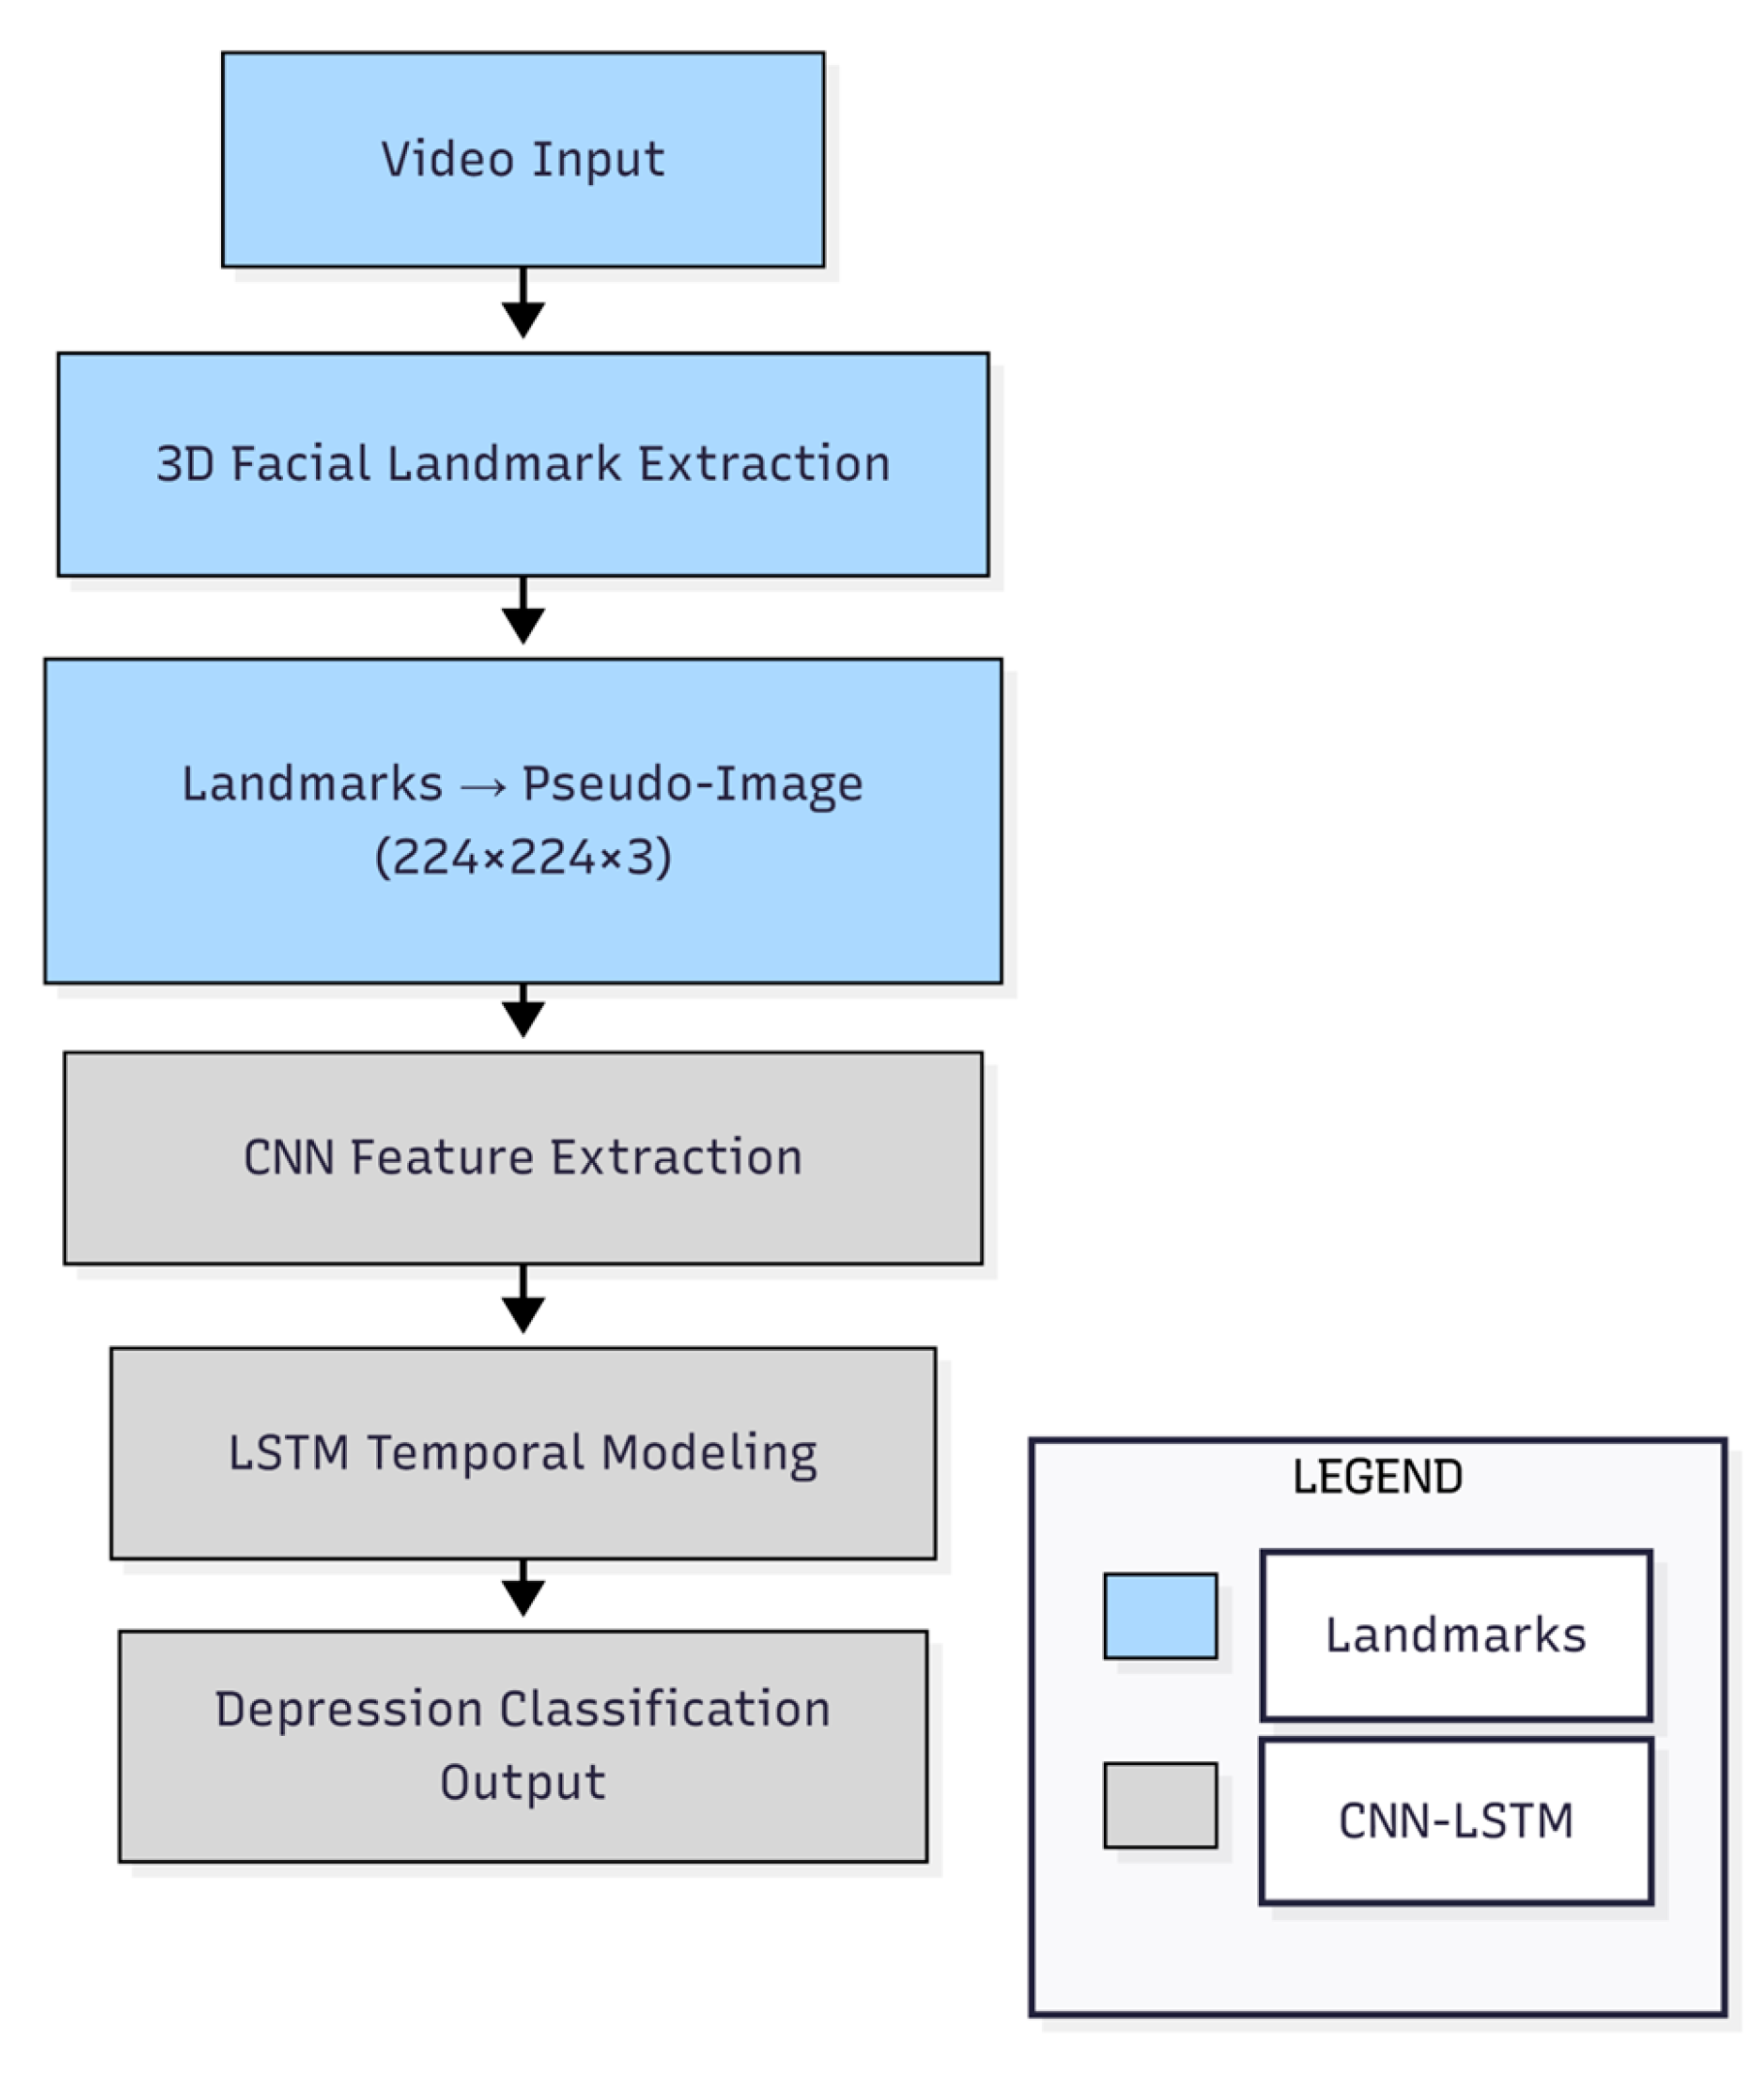
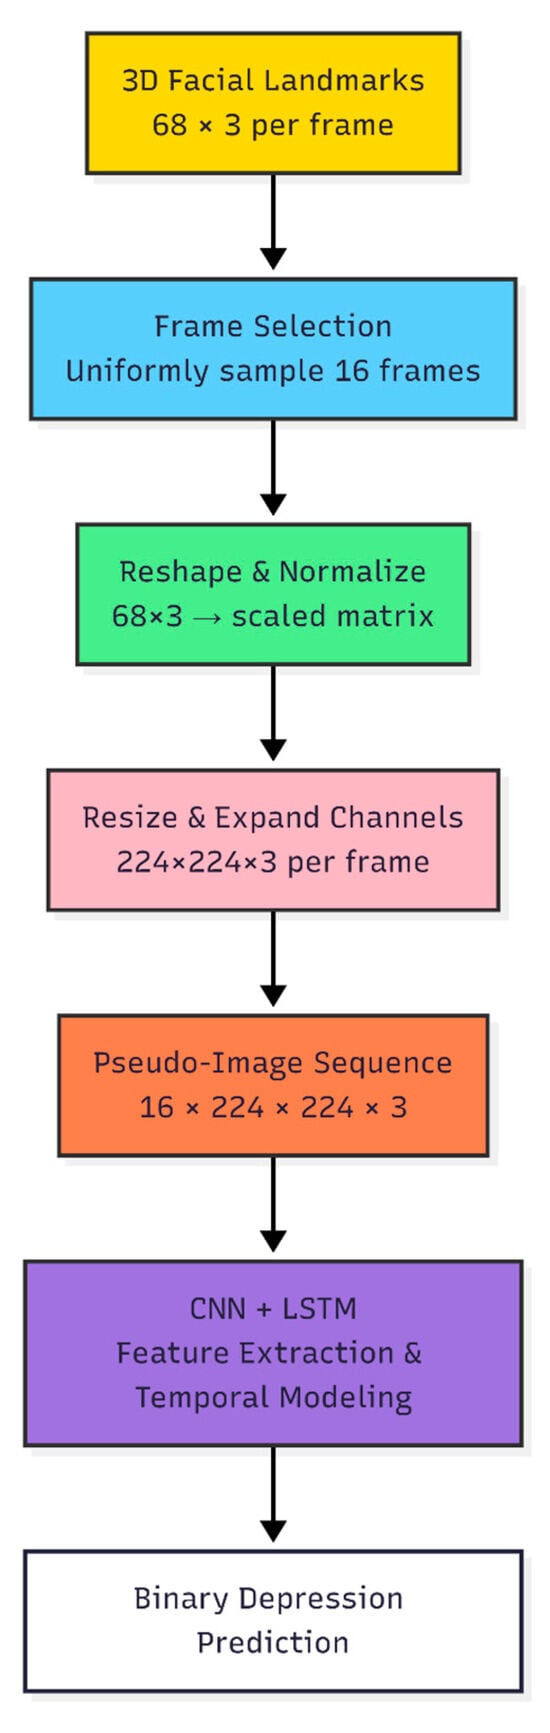
Figure 2 demonstrates the pipeline for the DAIC-WOZ dataset. The first step is preprocessing, which consists of the extraction and normalization of 3D facial landmark sequences from video. These landmarks are translated as pseudo-images that can be processed by CNNs. The CNN module extracts spatial features from each frame to learn the critical facial structures associated with depression. These features are then passed through an LSTM module to capture temporal dependencies between frames. Lastly, the classification layer is established to predict depression states. To alleviate class imbalance, class weighting, focal loss and threshold adjustment are each used.
Figure 2.
Proposed video-based depression detection pipeline for DAIC-WOZ.
- Pseudo-Image Generation from 3D Facial Landmarks
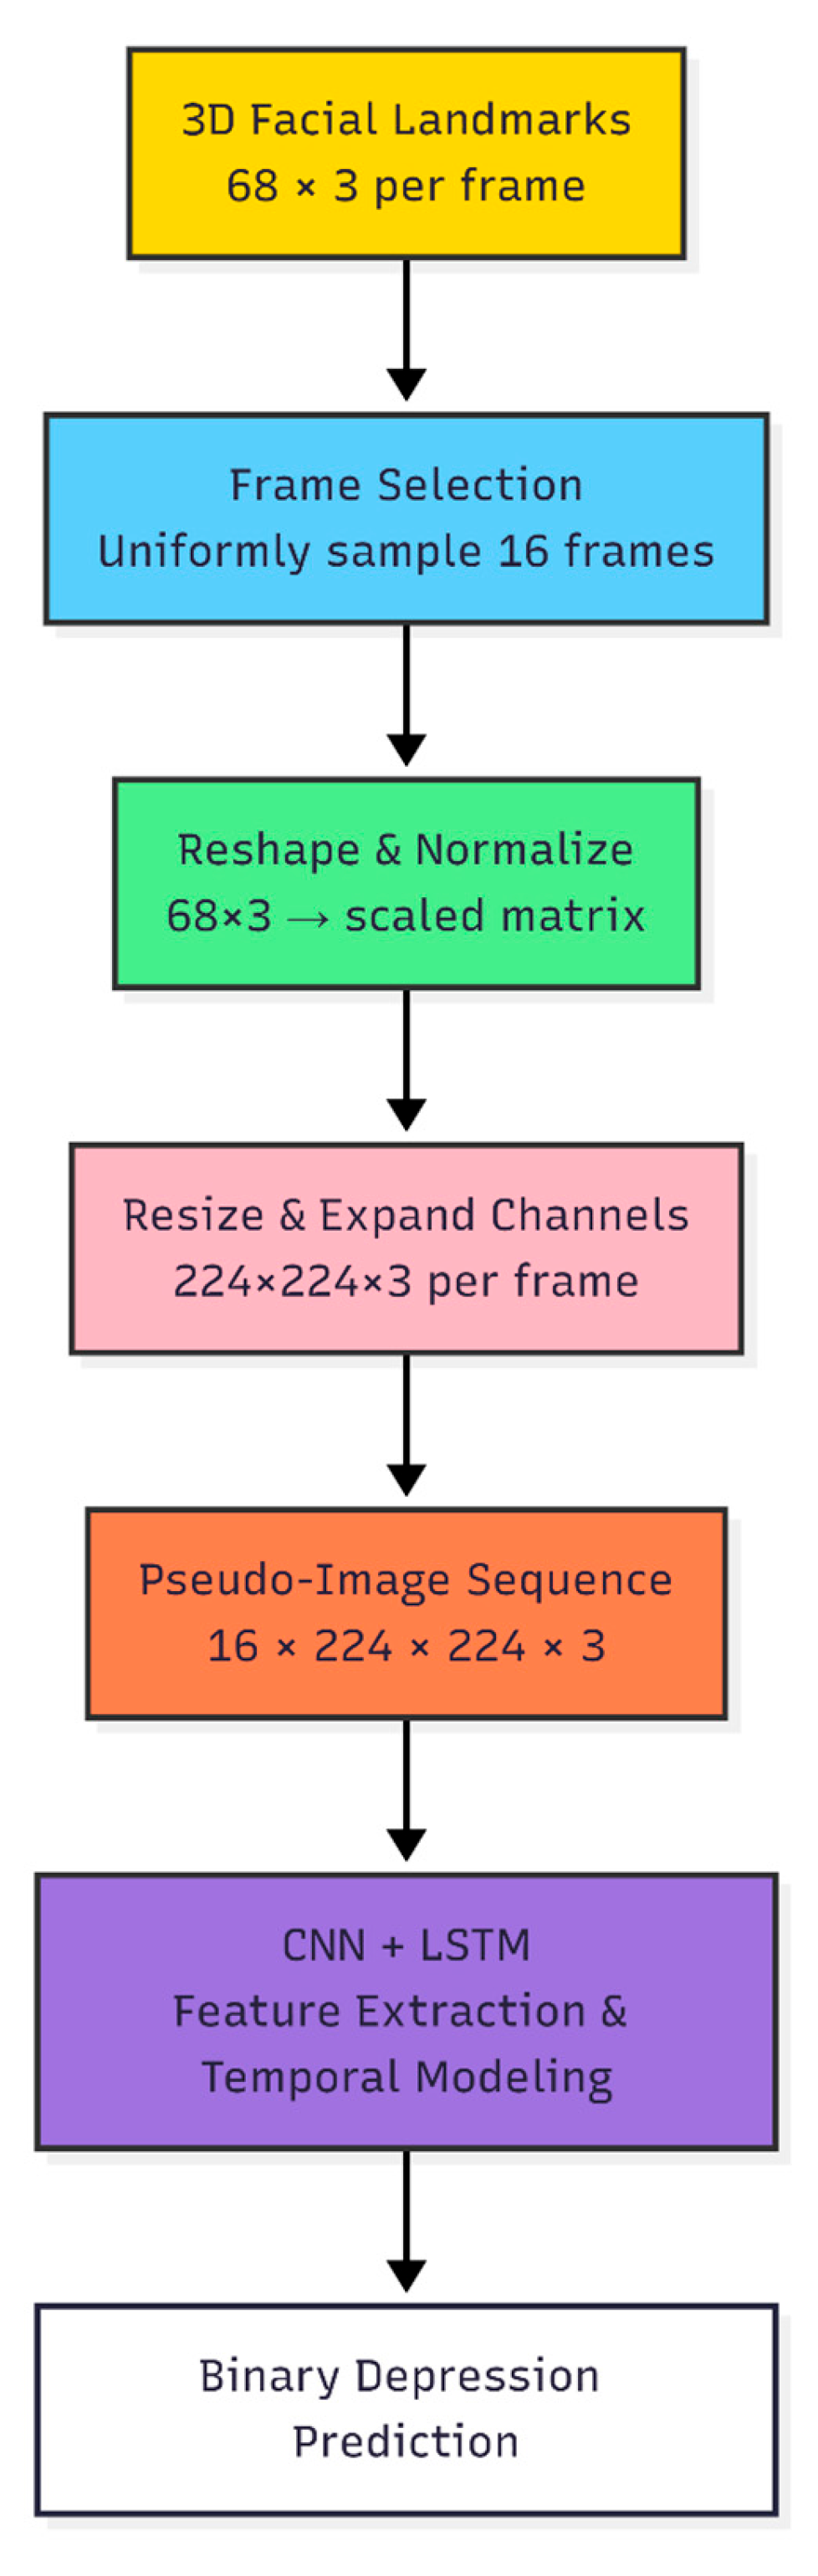
Video frames are represented by a 68 × 3 matrix (3D facial landmark coordinates), in as much that one treats the matrix itself as a highly structured geometric picture instead of any physical spatial imaging. Each landmark matrix is interpolated to the fixed resolution of 224 × 224 to make it compatible with standard CNN architectures. The representation is then replicated three times (channels) to fit the dimension of a CNN input. Although the RGB channels are not orthogonal coordinates, this encoding enables CNNs to learn spatial relations in the location of landmarks. Figure 3 provides a schematic diagram of this pseudo-image generation process and how the matrices are prepared for CNN input.
Figure 3.
Schematic diagram showing the pipeline.
E-DAIC-WOZ Pipeline
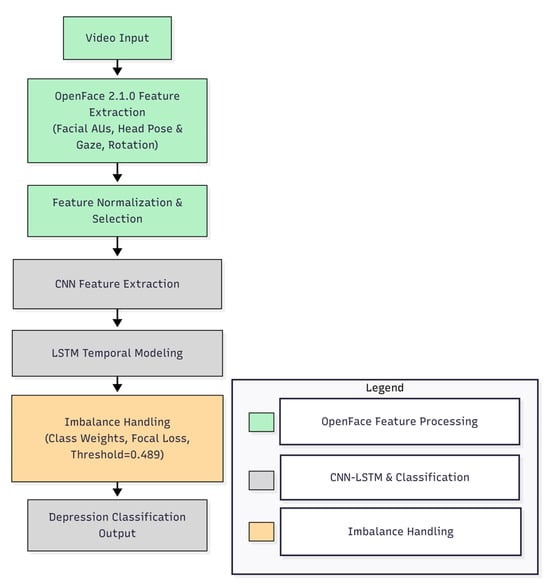
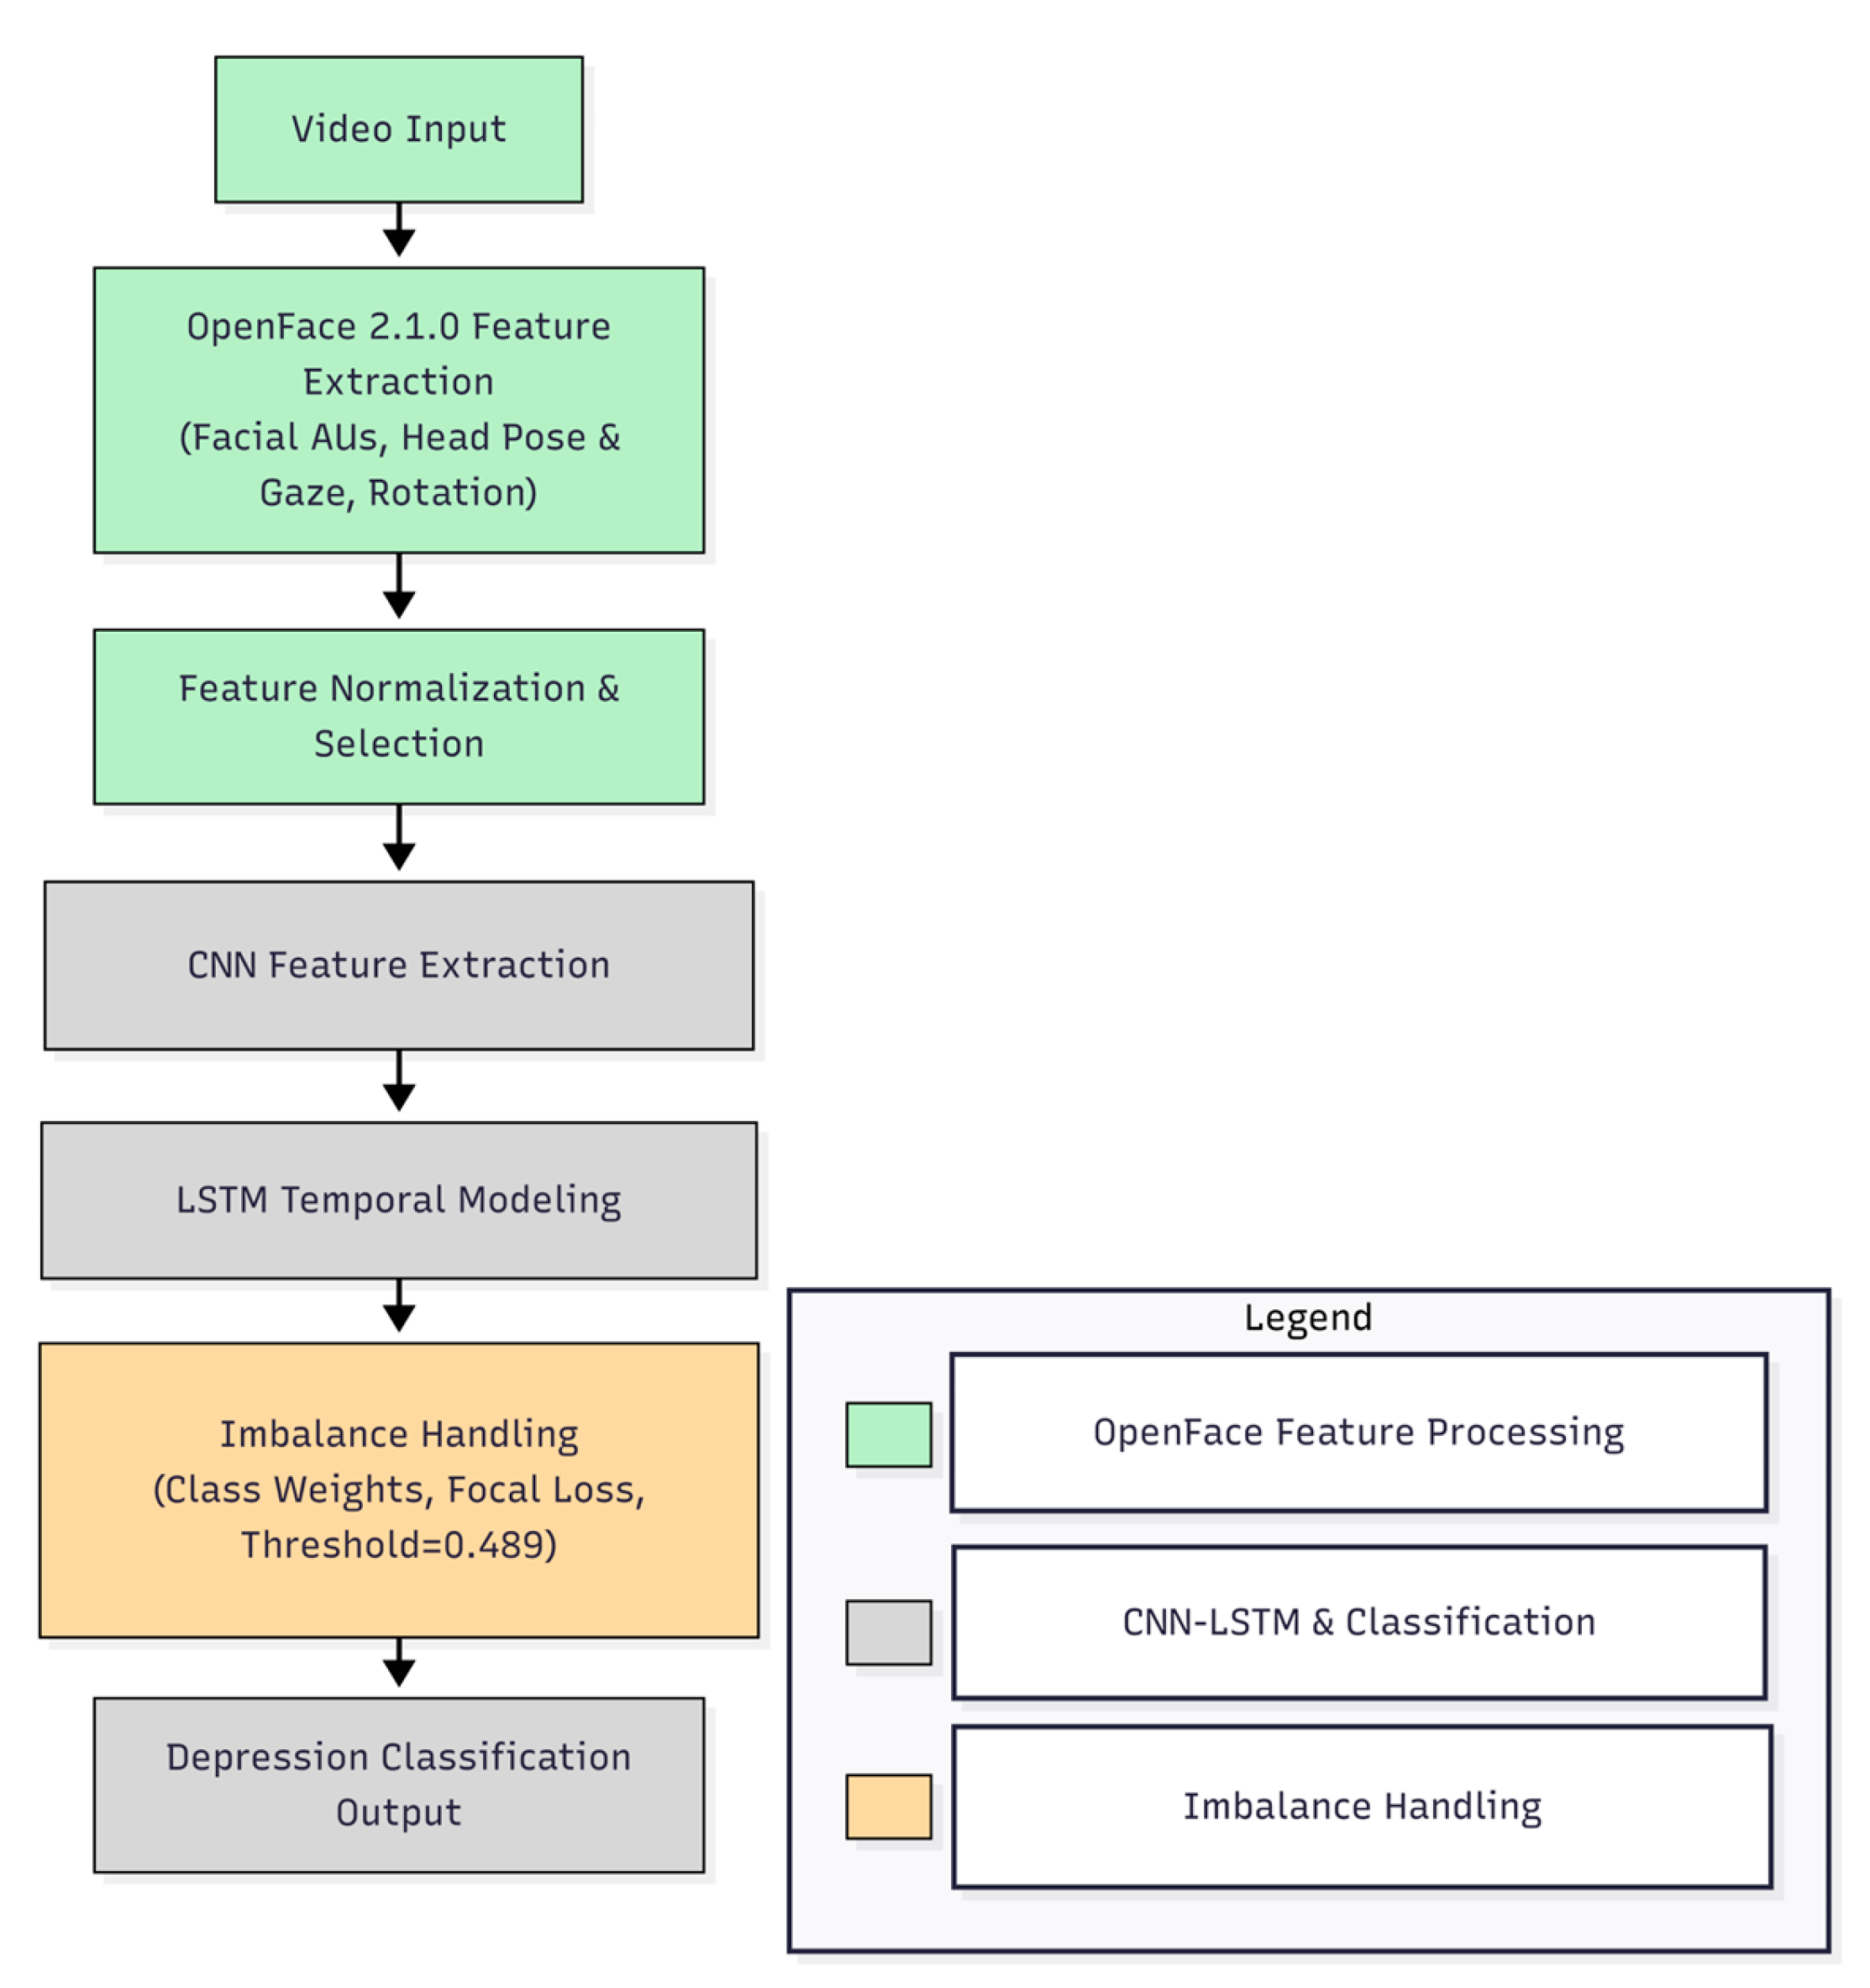
The work flow of the E-DAIC dataset is shown in Figure 4. In contrast to DAIC-WOZ, this pipeline utilizes OpenFace features that include pose, gaze and facial AUs. Then, the features’ optional selection and aggregation are applied after preprocessing and normalization of information feeding into the CNN module to obtain spatial representations. Temporal feature dynamics are then modeled by the LSTM module, and depression predictions are generated by our final classification layer. The strategies of handling class imbalance—weighted loss, focal loss, and thresholding—are also utilized to enhance accuracy and generalization capabilities.
Figure 4.
Proposed video-based depression detection pipeline for E-DAIC-WOZ.
3.1.6. Datasets
DAIC-WOZ
In the field of depression identification via audiovisual data, the Distress Analysis Interview Corpus—Wizard of Oz (DAIC-WOZ) is a reputable benchmark dataset. Participants talk about their everyday struggles and mental health history during semi-structured clinical interviews conducted by a virtual interviewer. Along with comprehensive transcriptions, the dataset contains synced audio, video, and 3D face landmark data. Reliable ground truth labeling is provided by annotating each recording with depression severity values derived from the PHQ-8 questionnaire. The dataset is appropriate for multimodal machine learning models aimed at mental health analysis since it encompasses a wide demographic profile with a range of speech patterns and facial emotions [1].
Extended-DAIC (E-DAIC) Dataset
The Extended-DAIC (E-DAIC) dataset is an extension of the DAIC-WOZ corpus, including more recordings and 275 participants, which provides a more diverse and representative sample. New sessions capture a broader range of depressive symptoms and behavioral cues, allowing for more thorough testing of automated depression detection systems across different interview scenarios and subtle emotional variations. The E-DAIC dataset provides OpenFace-extracted features (head pose, gaze, and facial action units), along with synchronized audio tracks and transcriptions, serving as multimodal resources for developing robust deep learning models in affective computing and clinical psychology [2].
For our experiments, we used only the pre-extracted features provided by the datasets, rather than the raw video files. Specifically, 3D facial landmarks were employed for DAIC-WOZ, and OpenFace features (head pose, gaze, and facial action units) were used for E-DAIC. The DAIC-WOZ dataset contains 189 interviews, and E-DAIC contains 275 interviews, following the original training, validation, and test splits defined by the dataset authors. Since raw video lengths are variable and not directly used, all features were processed into fixed-length pseudo-image segments (16 frames) as input to the CNN-LSTM model.
Feature Representations and Pipeline Differences
The two datasets differ in the available feature representations. DAIC-WOZ sequences are represented as 3D facial landmarks, which we convert into pseudo-images (224 × 224 × 3) for CNN-LSTM processing. In contrast, E-DAIC sequences are provided as pre-extracted OpenFace features. Despite this methodological difference, the same CNN-LSTM architecture is applied to both datasets for temporal modeling. This approach ensures that each dataset uses the best available representation while maintaining consistency in the model design, and it is fully documented to ensure transparency and reproducibility.
4. Results
All reported performance metrics are reported as mean ± standard deviation across folds, which reflects the variability and stability of model performance across different data splits.
It is important to note that the reported mean ± standard deviation values describe performance variability across folds rather than formal statistical confidence intervals. No hypothesis testing or statistical significance testing was performed due to the limited size of the dataset.
4.1. On the DAIC-WOZ Dataset
Our CNN-LSTM model, which interprets 3D facial landmark sequences as pseudo-images and processes them, has reached an F1-score of 0.74 on the DAIC-WOZ validation set. A very important point is that this outcome was achieved not by using the usual 0.5 classification threshold value, but after an adjustment to 0.306. Such a threshold setting significantly lifted the performance of the model in terms of its precision–recall trade-off.
The detailed performance metrics on the DAIC-WOZ test set are summarized in Table 1.
Table 1.
Comprehensive performance indicators for each class of the CNN-LSTM model with imbalance handling.
These results are noteworthy, as the model achieves a recall of 73% ± 3% for detecting depressed individuals (the minority class). Importantly, the model maintains a good precision rate alongside this recall, indicating a relatively low number of false positives.
Because of the small sample size and the use of predefined dataset splits, formal statistical significance testing was not performed; therefore, results are reported as mean ± standard deviation across folds to reflect performance variability.
4.1.1. Evaluation of Model Variants in Comparison
The performance of various model variants on the same validation set is compiled in Table 2 to highlight the benefits of the CNN-LSTM architecture and the impact of imbalance handling.
Table 2.
Comparison of model variants showing the benefits of temporal modeling (LSTM) and imbalance handling.
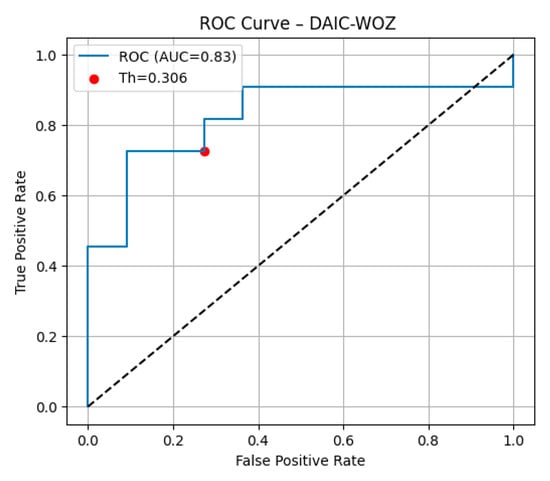
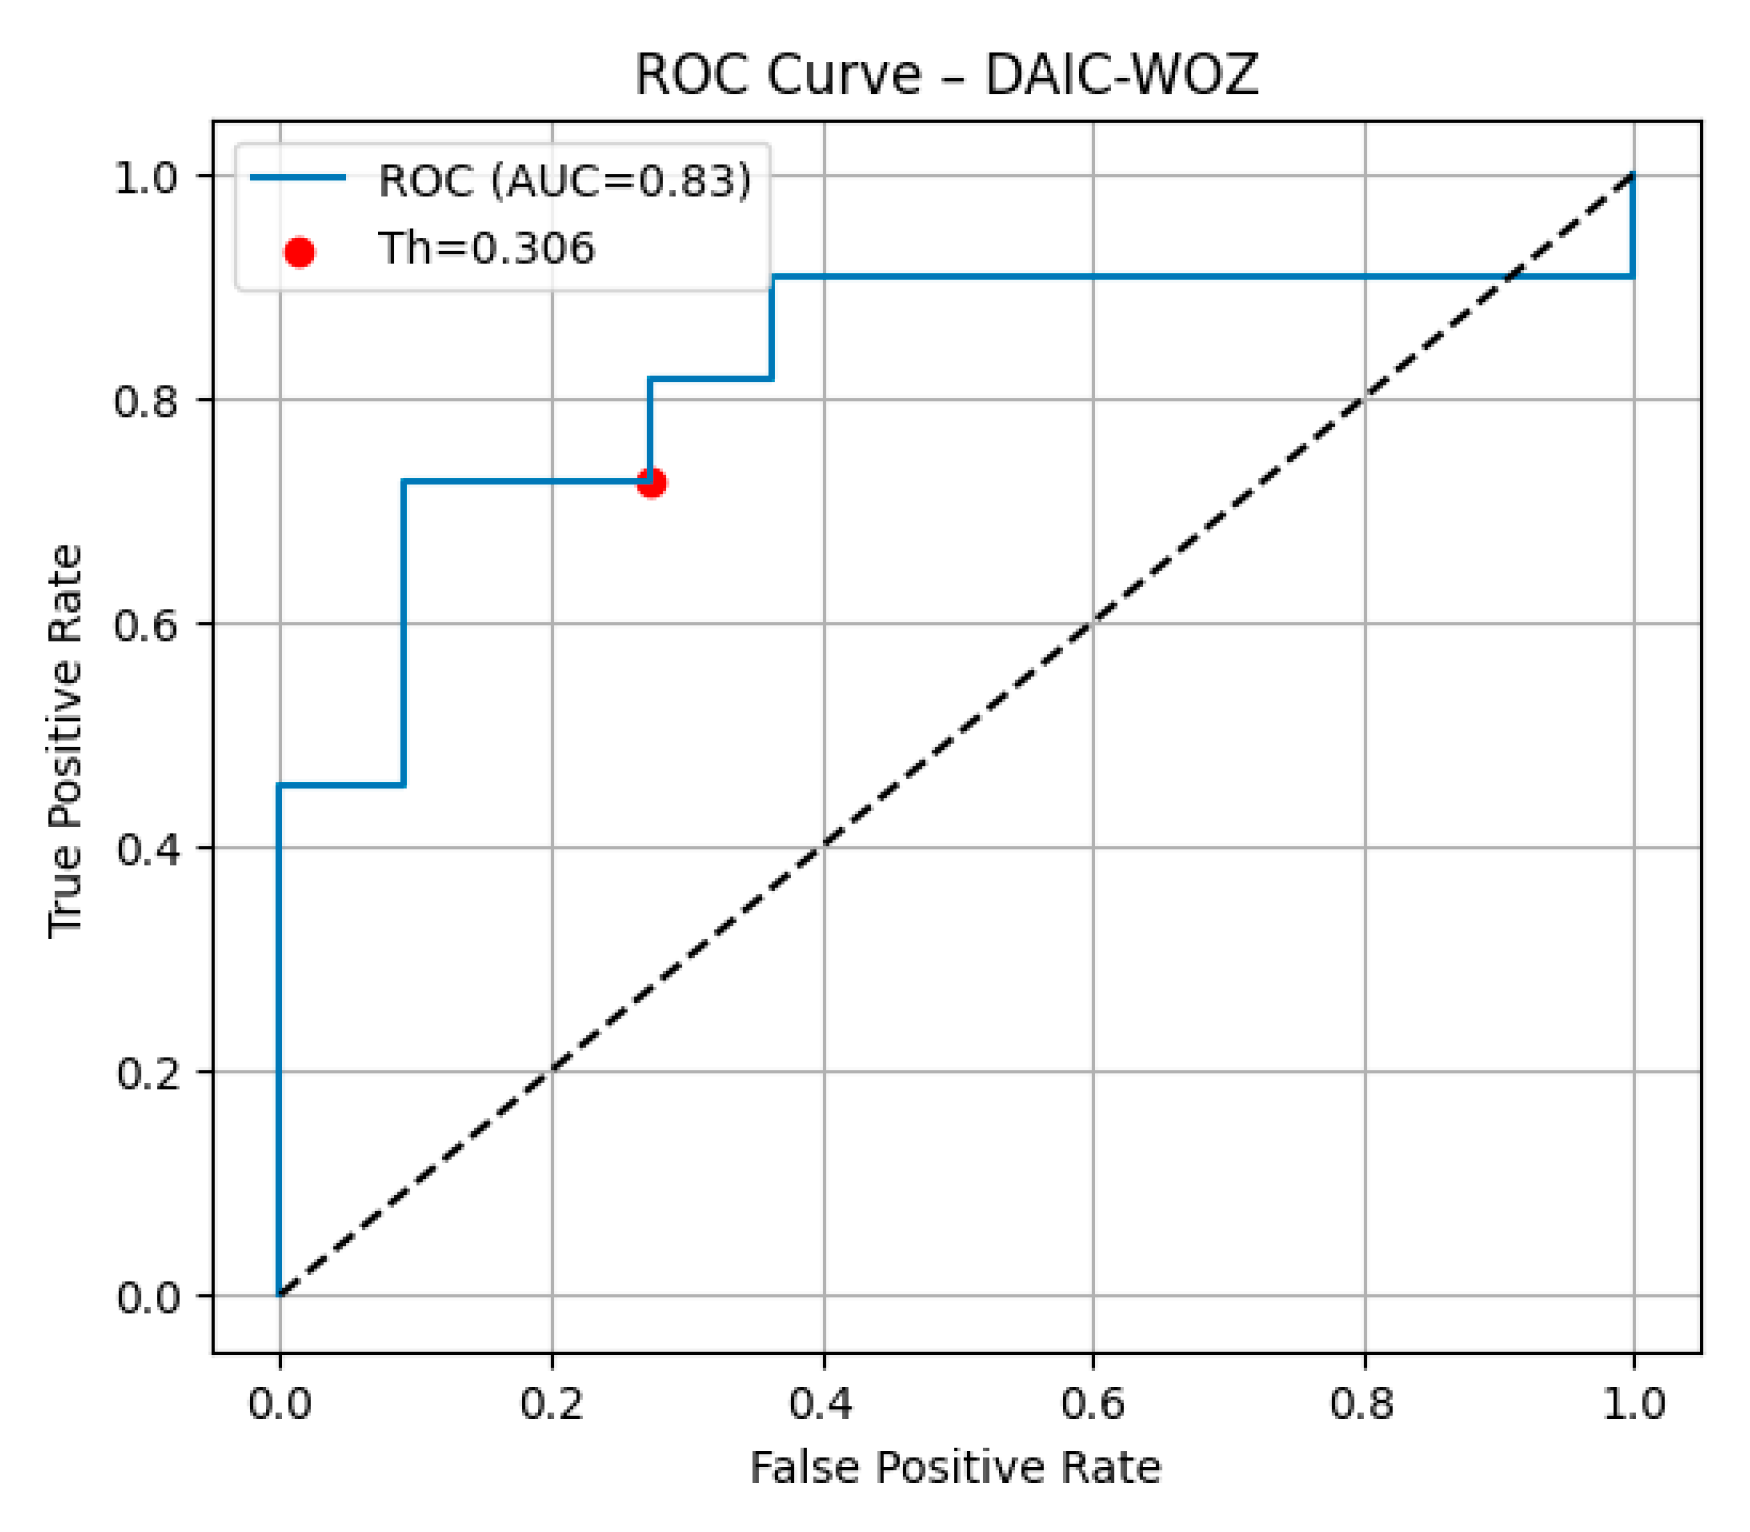
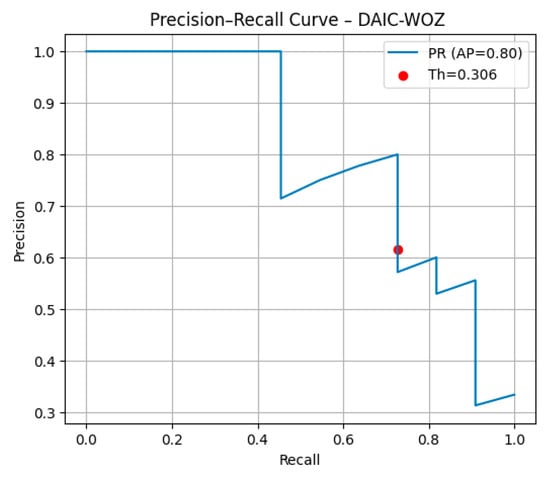
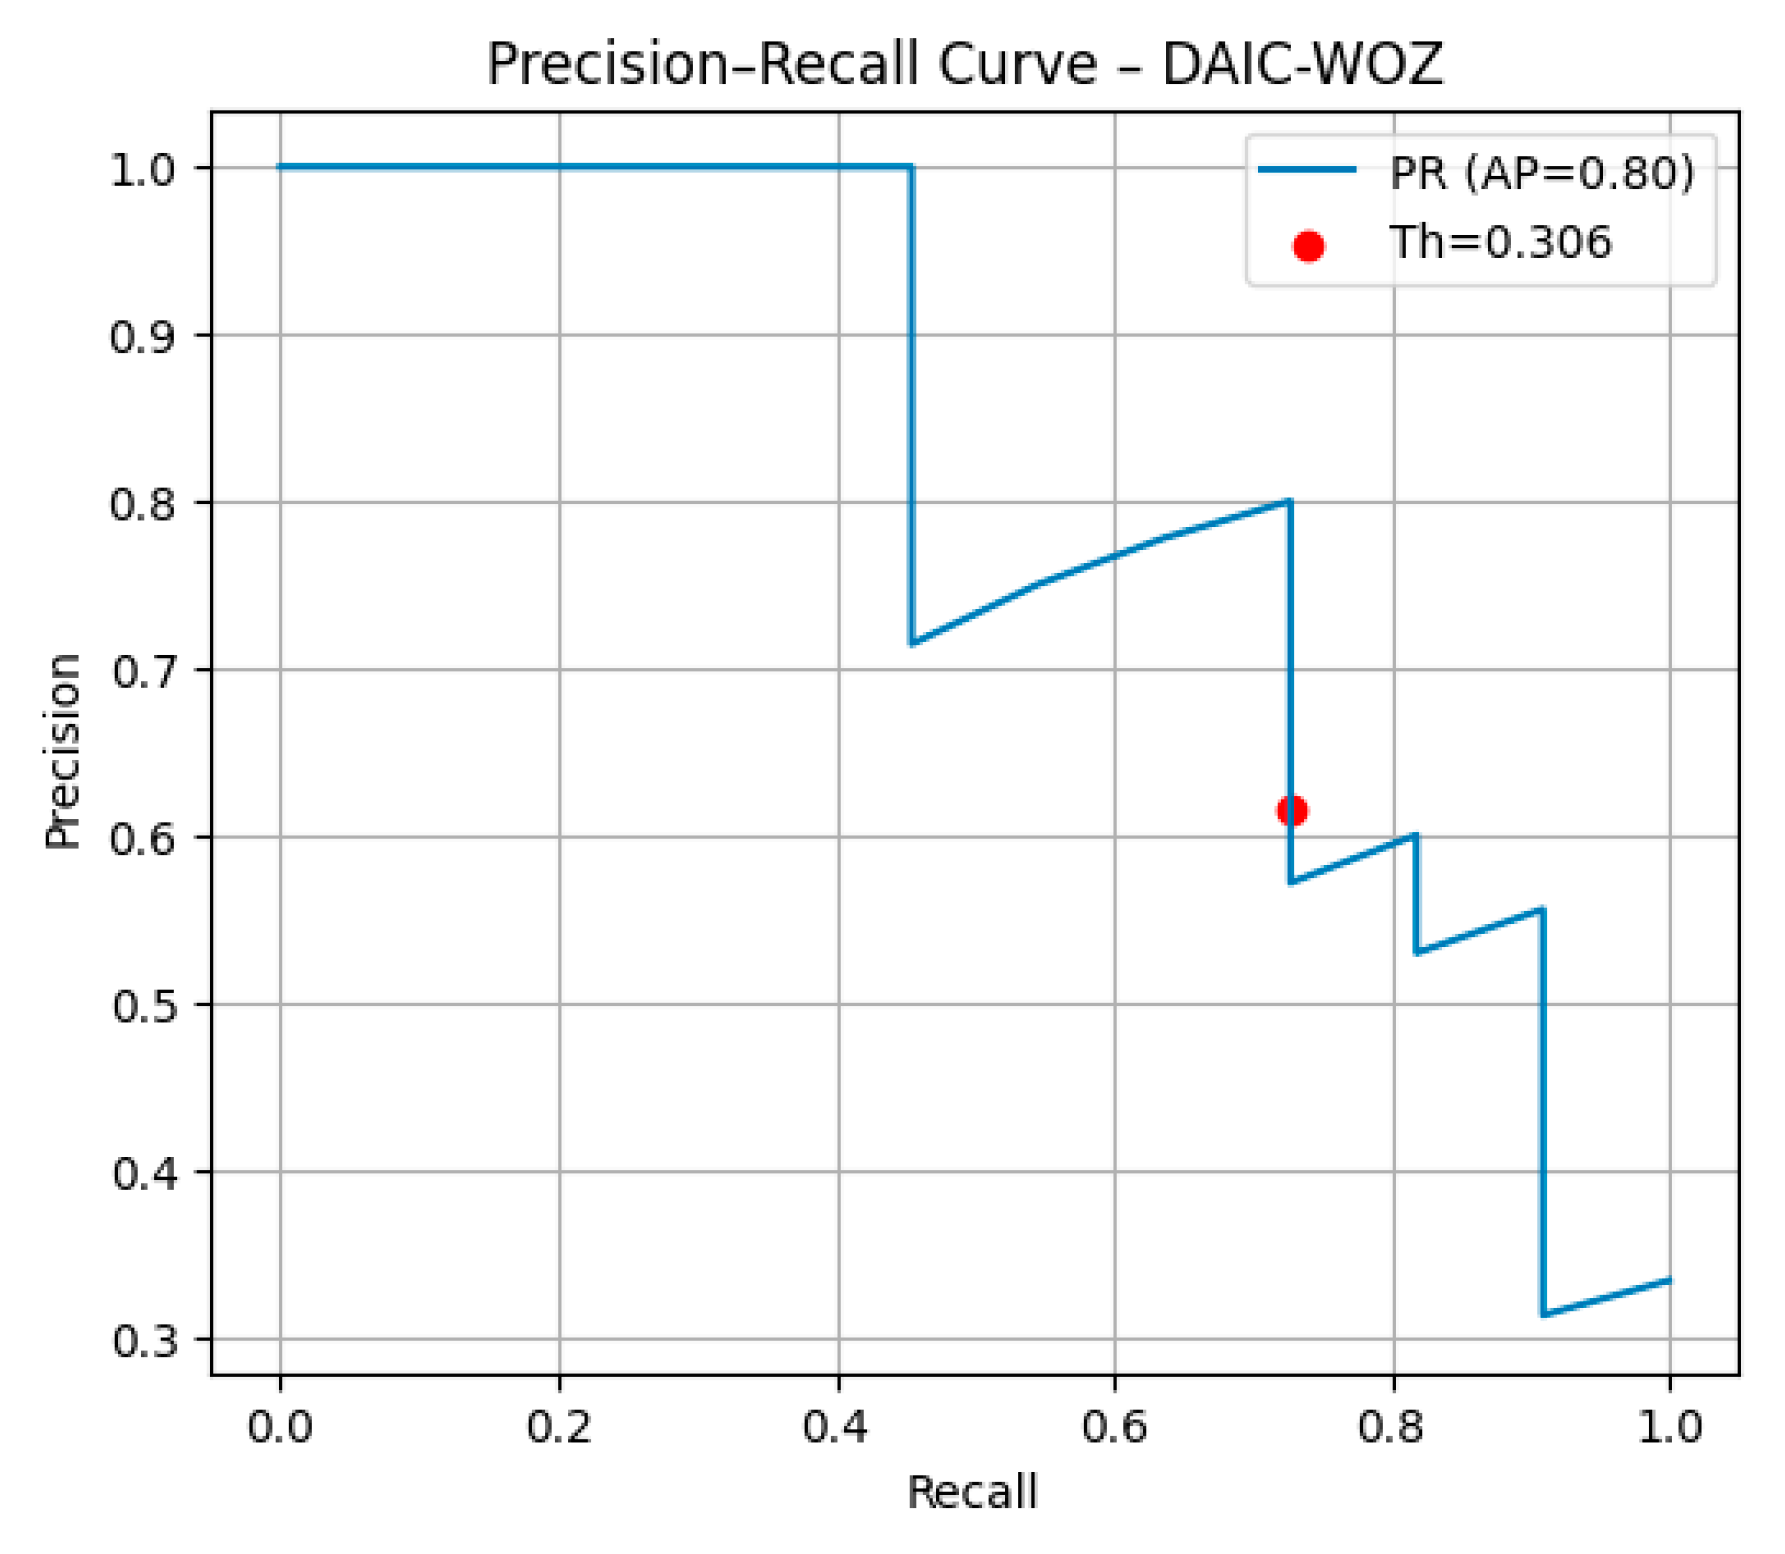
To provide additional clarity on class-wise performance, Table 2 reports precision, recall, and F1-score for our model and its variants. For the minority (depressed) class, while precision is moderate (62%), the higher recall (73%) ensures that most depressed individuals are correctly identified, which is critical in clinical screening. This trade-off aligns with the objective of minimizing false negatives in healthcare applications. In addition, overall accuracy, ROC-AUC, and PR-AUC are also reported (Figure 5 and Figure 6), offering a balanced interpretation of model performance and complementing the F1-based comparison provided in Table 3.
Figure 5.
ROC curves for Daic-Woz.
Figure 6.
Precision–recall (PR) curve for Daic-Woz.
Table 3.
Comparison with state-of-the-art approaches.
Figure 5 illustrates the Receiver Operating Characteristic (ROC) curve of our CNN-LSTM model on the DAIC-WOZ validation set. The area under the curve (AUC) reaches 0.83, indicating that the model effectively distinguishes between depressed and non-depressed participants, even under class imbalance. The ROC curve demonstrates a consistent sensitivity across various thresholds.
Similarly, the precision–recall (PR) curve (Figure 6) shows an average precision (AP) of 0.80, highlighting a balanced trade-off between precision and recall. This confirms that the adjusted classification threshold (0.306) enhances the model’s ability to correctly identify depressed individuals while reducing false positives.
4.1.2. Impact of Imbalance Handling Techniques
Optimal Classification Threshold: A methodical search for an appropriate threshold value resulted in very important improvements in F1-score. The threshold value of 0.306 is more sensitive to the depressed class (which is very vital in medical use) and it is not so compromised in terms of precision in that it experiences a negligible amount of precision loss.
Class Weights: When more weights are given to the minority class examples, the bias towards the majority non-depressed class is eliminated, which in turn ensures that the learning is balanced.
Focal Loss: Such a loss function changes the sample contributions on the basis of the difficulty, focusing on the difficult-to-classify cases and, thus, improving the minority class detection.
Clarification of threshold optimization: To correct class imbalance and maximize the precision–recall trade-off, the classification threshold is adjusted as a calibration step. The constant gains across model versions indicate that architectural changes, such as temporal modeling with LSTM and explicit imbalance handling procedures, are primarily responsible for the observed performance improvements rather than threshold tuning alone.
4.1.3. Major Methodological Strengths
Spatiotemporal Feature Extraction through CNN-LSTM: A TimeDistributed CNN is employed to capture spatial features from each frame, while LSTM layers are used to model temporal dependencies that manage to represent the subtle facial expressions and changes that are associated with depression.
Breakthrough 3D Landmark Visualization: The conversion of 3D landmark sequences into pseudo-images allows for better utilization of convolutional networks even when the most important geometric features remain intact.
Stable Imbalance Handling: The blending of class weighing and focal loss as the two main tasks has a great influence on finding under-represented classes, which is directly related to the model stability.
4.1.4. Comparison with Related Work Across Different Modalities
It should be mentioned that the given performances are not directly comparable because Table 3 contains methods based on several input modalities (text, audio, video, and multimodal). This comparison aims to place our method in the context of the larger depression detection research rather than to assert state-of-the-art performance across all modalities. Despite depending on a single modality and a very small dataset, our strategy obtains competitive performance when limited to video-based algorithms that solely use facial landmarks.
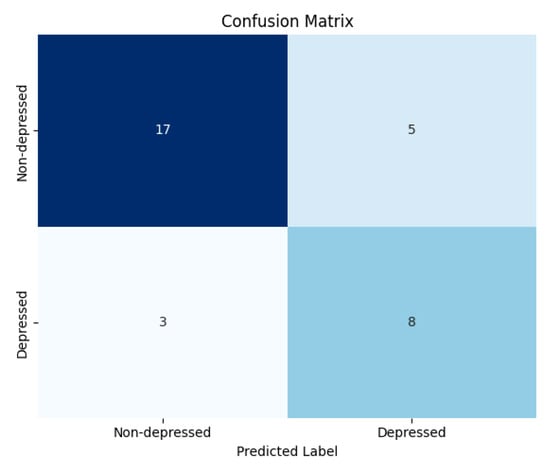
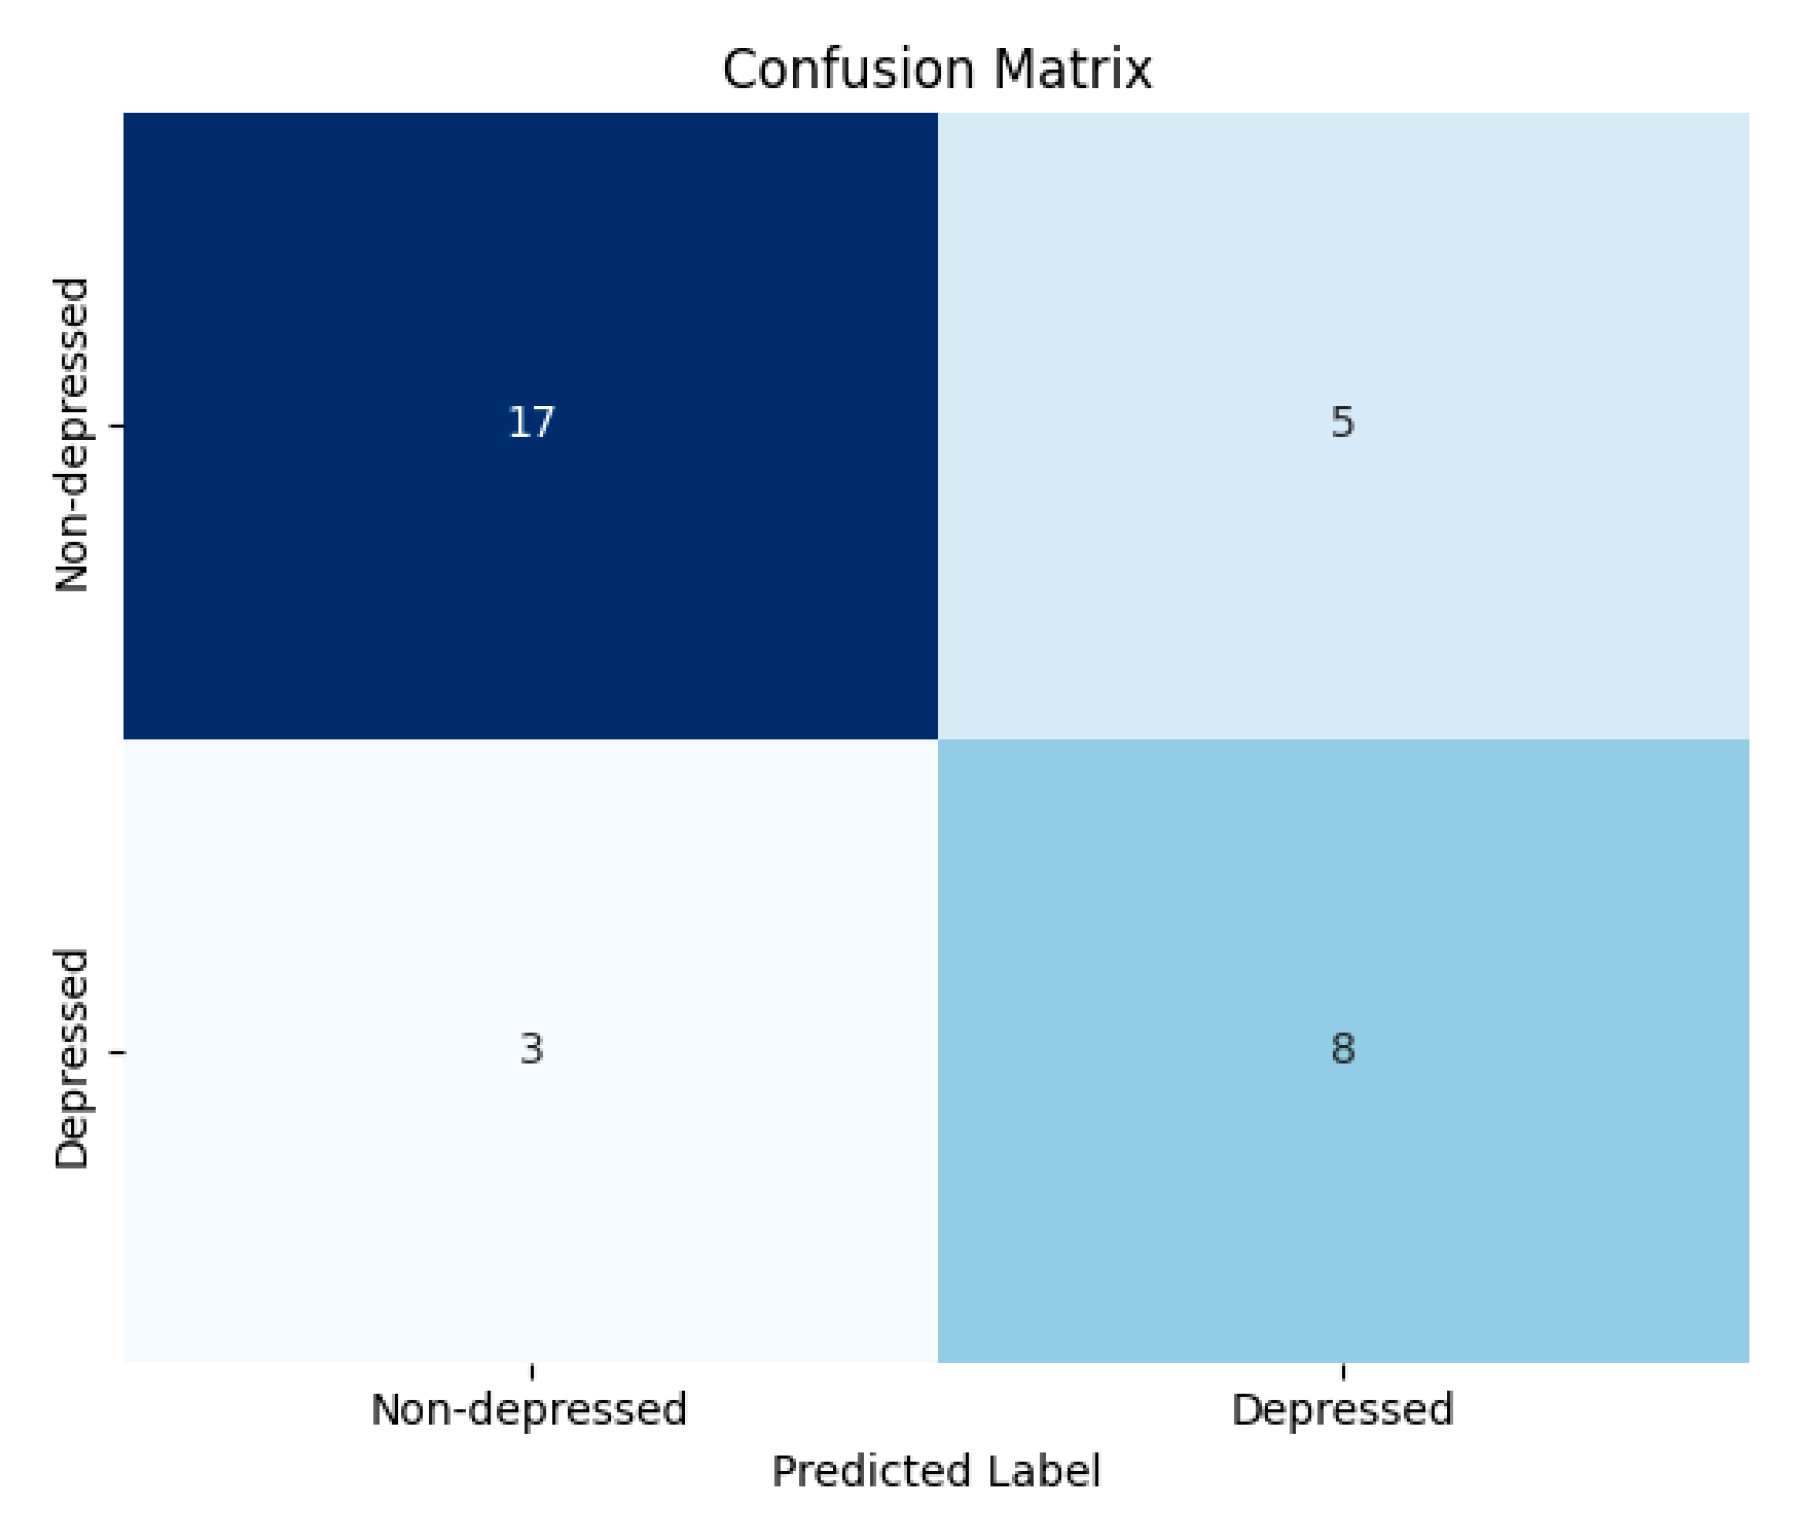
Our method is to apply the 3D facial landmark sequences derived from OpenFace and represent them as pseudo-images, which are then fed into a deep learning model, CNN-LSTM, that jointly models spatial structure and temporal dependencies of facial expressions corresponding to depressive symptoms. Despite class imbalance and a lack of other modalities, the model attains an F1-score of 0.74 ± 0.03, indicating that fully vision-based frameworks can accurately encode subtle behavioral cues while retaining interpretability, robustness and ease of computation. We emphasize that this comparison is contextual: our model performs competitively among video-only approaches, while also offering advantages in privacy and lightweight computation. Figure 7 shows the confusion matrix for our CNN-LSTM model, which uses 3D facial landmarks. It shows how well the model sorts depressed people from those who are not based on the test data.
Figure 7.
Performance of the CNN-LSTM model on E DAIC WOZ: confusion matrix based on 3D facial landmarks.
4.2. On the Extend-DAIC-WOZ Dataset
To assess the robustness and scalability of our method, we extended our experiments to the more challenging E-DAIC-WOZ dataset. Unlike DAIC-WOZ, this dataset is significantly larger and more diverse, exhibiting a stronger class imbalance, posing additional challenges for automatic depression detection.
In our approach, we decomposed each participant’s video session into individual visual frames, from which we extracted two distinct yet complementary types of features:
- High-level semantic features from each frame using a pretrained VGG16 network.
- Low-level behavioral descriptors including facial action units (AUs), head pose, and eye gaze using OpenFace 2.1.0.
Each sequence was constructed using 16 consecutive frames (corresponding to approximately 0.5–1 s of video), preserving the short-term temporal dynamics of facial behavior. These frame-level sequences were then processed through a CNN-LSTM pipeline, enabling the model to learn both spatial and temporal cues relevant to depressive states. Table 4 summarizes the classification results on the E-DAIC-WOZ.
Table 4.
Performance metrics on E-DAIC-WOZ (frame-level classification).
The model obtained a macro-average F1-score of about 0.76 ± 0.03, revealing good performance even with the challenges posed by the E-DAIC-WOZ dataset, such as its size, diversity, and class imbalance. Importantly, the model kept a recall rate of approximately 74% ± 3% for the depressed class. This is crucial in mental health screening tasks where reducing false negatives is most important.
4.2.1. Evaluation of Model Variants on E-DAIC-WOZ
We tested three model variations on the E-DAIC-WOZ validation set in order to emphasize the benefits of the CNN-LSTM architecture and the significance of imbalance handling. Table 5 provides a summary of the findings.
Table 5.
Comparison of CNN and CNN-LSTM model variants on E-DAIC-WOZ.
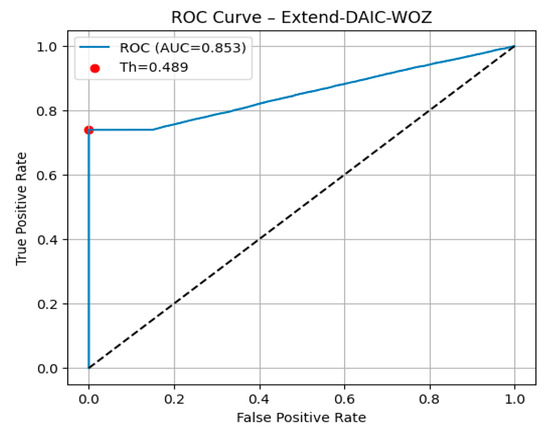
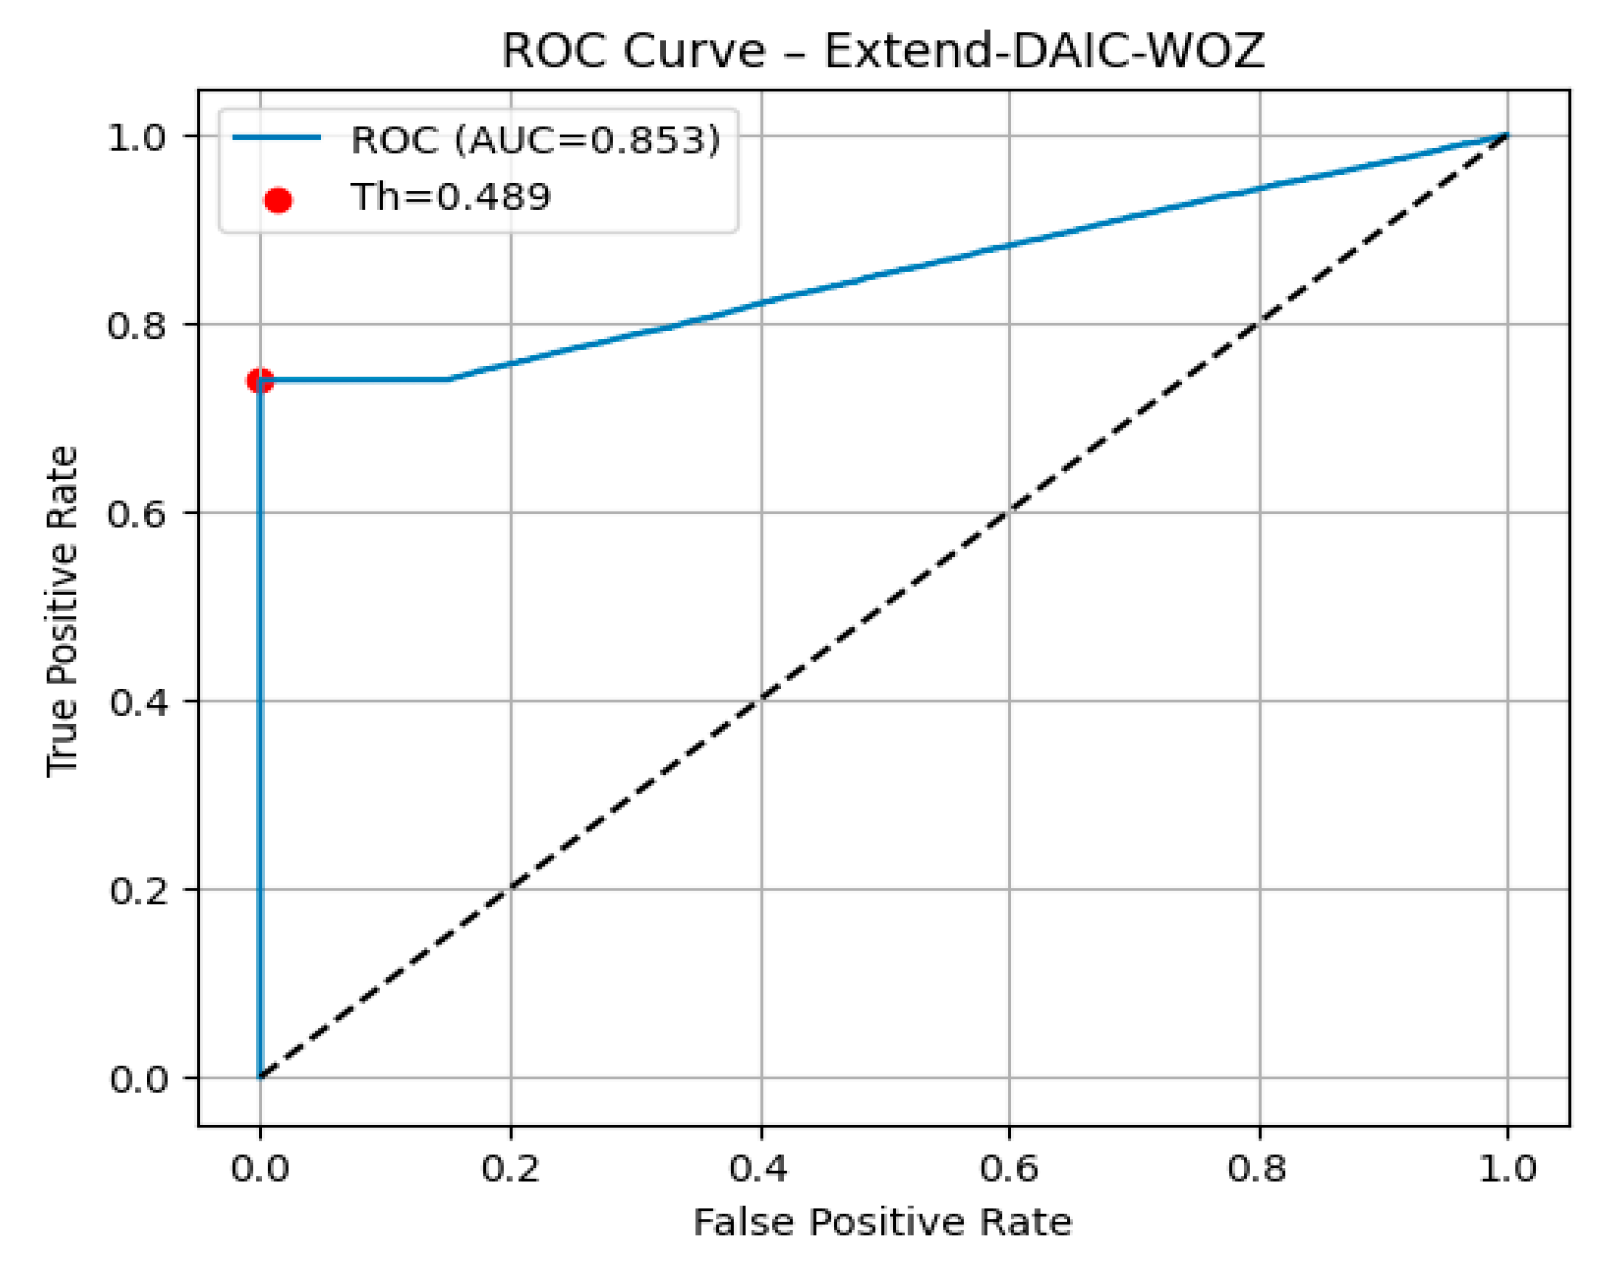
The AUC is 0.853, which means that the model effectively separates depressed and non-depressed participants even though there is large variability in facial expressions and class imbalance in the dataset. This strong performance shows that adding facial landmarks derived from OpenFace helps the model pick up small affective signals related to depression behavior. In addition, the ROC curve demonstrates stable sensitivity across a wide array of decision thresholds; this indicates that the classifier will be stable and trustworthy even under difficult real-world screening conditions (Figure 8).
Figure 8.
Receiver Operating Characteristic (ROC) curve of our CNN-LSTM model trained on OpenFace features derived from the E-DAIC-WOZ dataset.
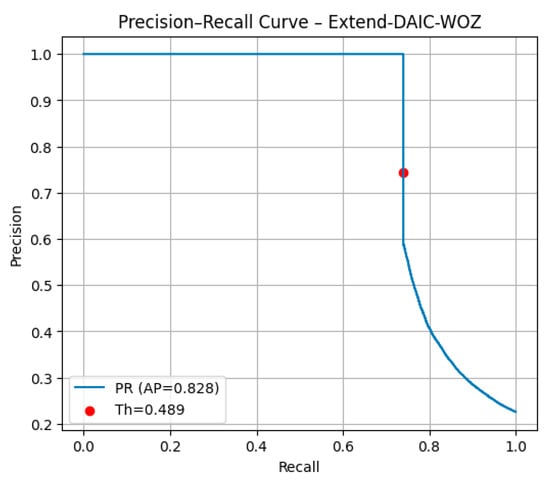
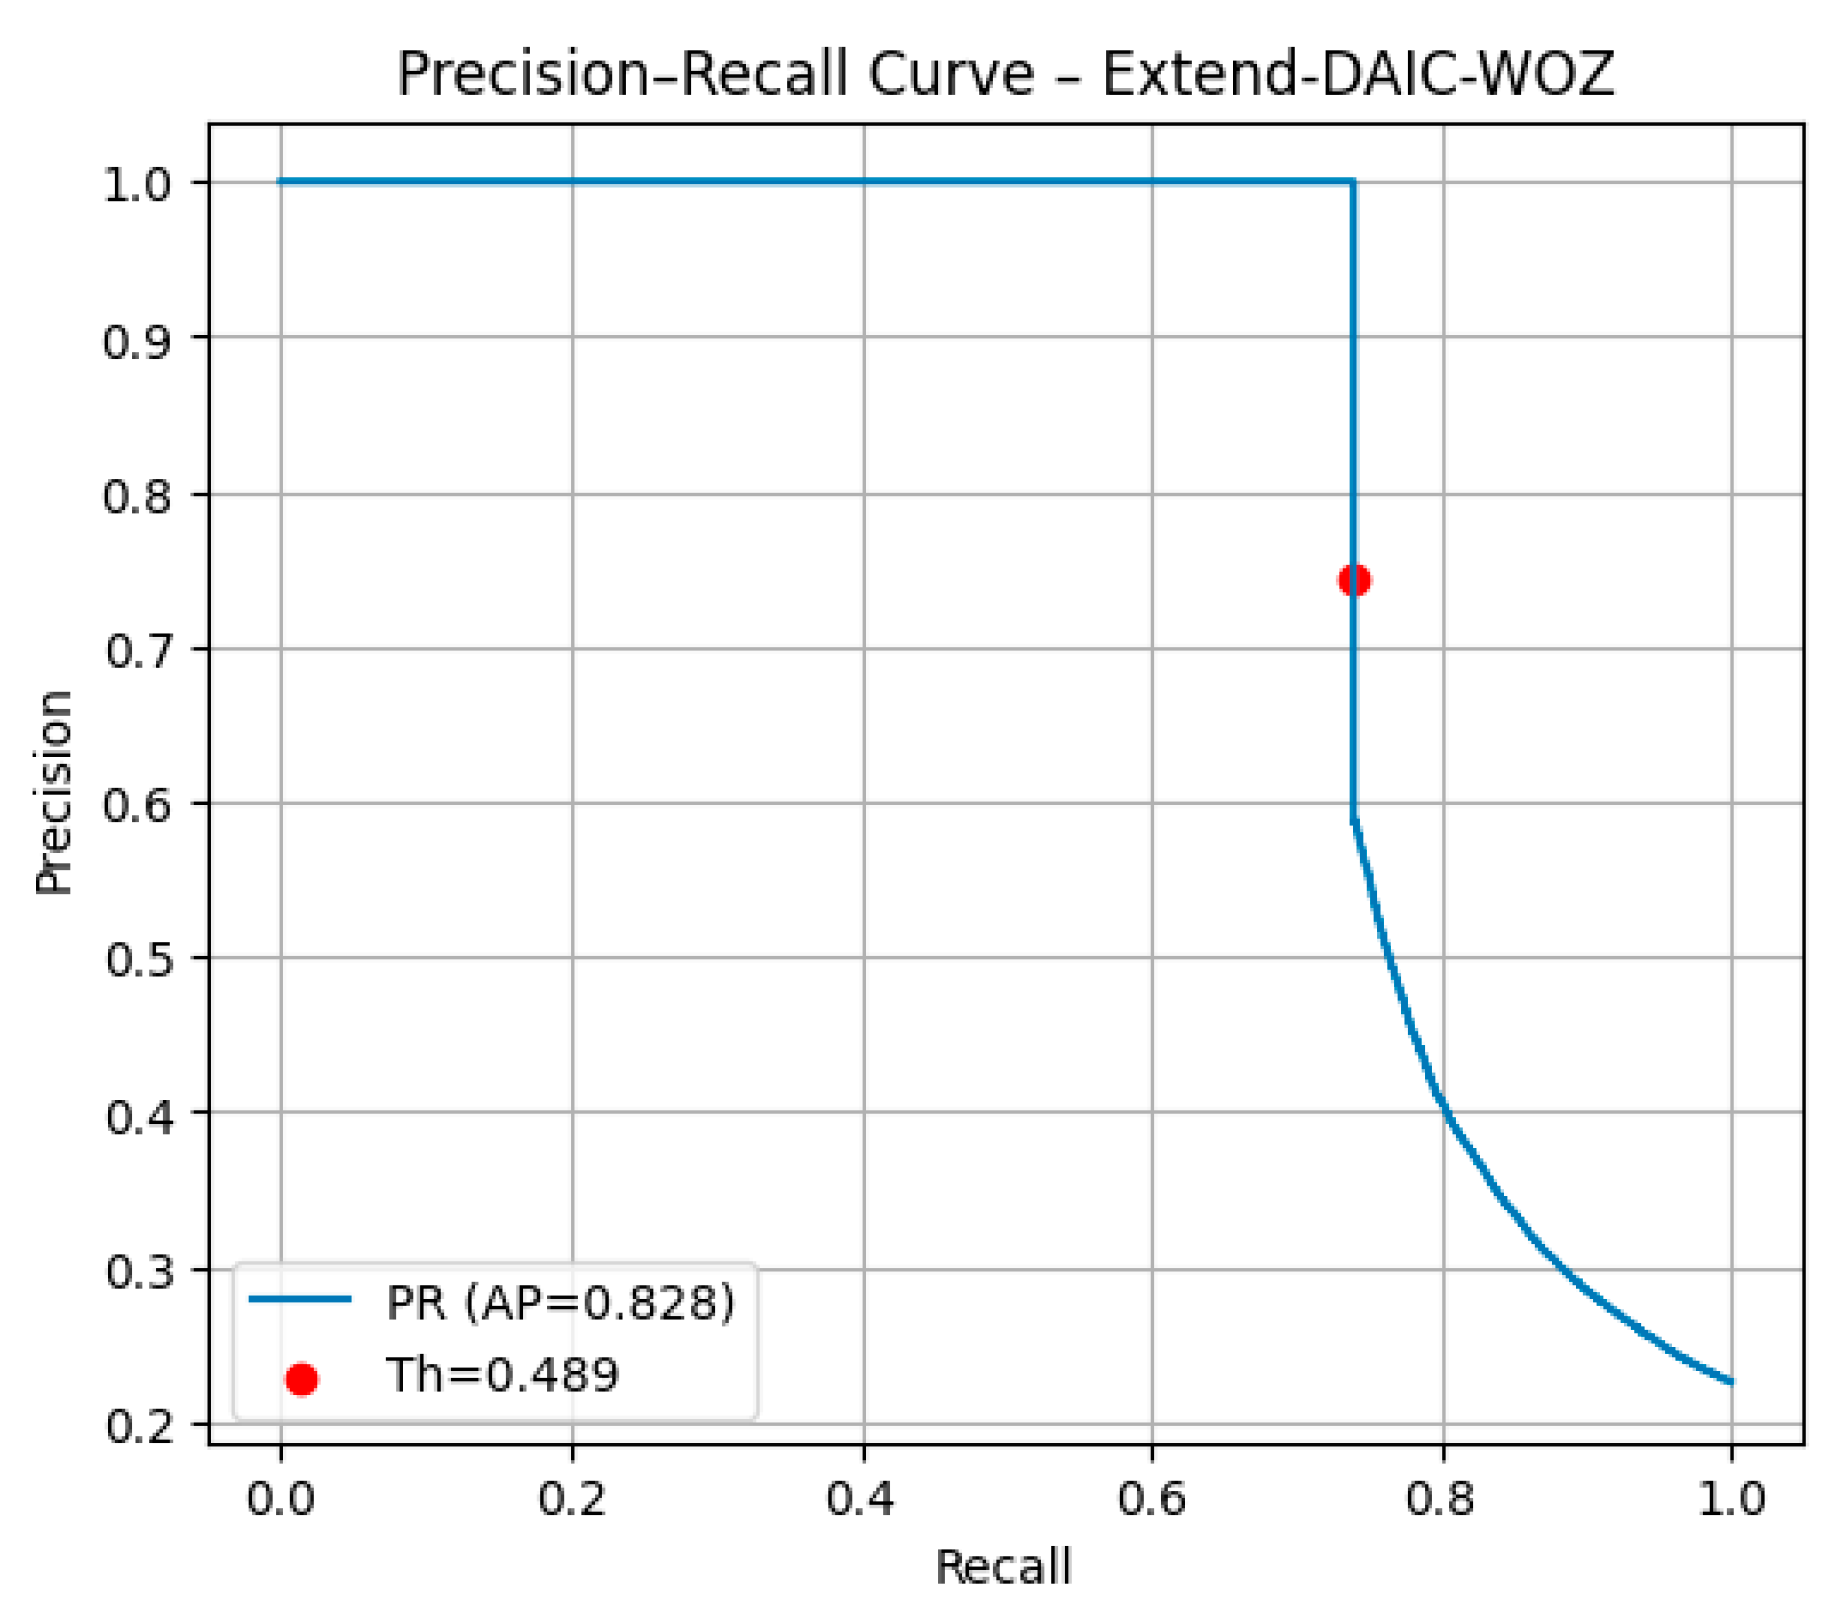
The model scores an AP of 0.828, demonstrating a good balance between precision and recall despite the dataset’s strong class imbalance. The PR curve shows that by adjusting the decision threshold (0.489), the model’s ability to spot depressed individuals improves while keeping false alarms low. This result indicates that OpenFace-based representations can reliably find subtle signs of depression and may contribute to improve screening for this serious mental health condition using real-world data. Figure 9 shows the precision–recall (PR) curve of our CNN-LSTM model.
Figure 9.
The precision–recall (PR) curve of the CNN-LSTM model trained on OpenFace features derived from the E-DAIC-WOZ dataset.
4.2.2. Contributions and Impact of Frame-Based Modeling
This work constitutes one of the first efforts to apply frame-level analysis on the E-DAIC-WOZ dataset using a combination of deep and handcrafted features. By treating short sequences of frames as temporal units, we enabled the model to detect micro-expressions, gaze aversion, and other fine-grained behavioral patterns indicative of depression. Furthermore, our pipeline remains lightweight and adaptable to real-time settings, with frame-wise processing allowing for early detection during short video segments. The use of focal loss and class weighting, combined with threshold tuning (optimal threshold = 0.489), played a key role in enhancing the model’s sensitivity to minority samples.
4.2.3. Major Methodological Strengths on E-DAIC-WOZ (AUs, Pose and Gaze Features)
Multidimensional Behavioral Representation from OpenFace Features
Our model leverages temporal sequences of action units (AUs), head pose, and gaze features extracted by OpenFace 2.1.0. These cues encode rich affective and behavioral signals, capturing subtle muscular activations, head dynamics, and eye contact patterns—all of which are highly relevant for depression assessment.
Temporal Modeling of Nonverbal Dynamics via LSTM
We utilize a bidirectional LSTM to process time-series data of facial features, enabling the model to learn temporal patterns and behavioral changes over time. This is crucial to capture depressive signals such as reduced expressiveness, gaze avoidance, or head droop.
Noise-robust Preprocessing and Sequence Regularization
To handle real-world recording inconsistencies (e.g., missing frames, jitter), we applied temporal interpolation, sequence padding, and normalization. This ensures stable learning while preserving discriminative temporal dynamics.
Addressing Class Imbalance in Behavioral Sequences
Given the imbalance in the number of depressed vs. non-depressed participants in E-DAIC, we combined class weighting with focal loss to enhance the sensitivity to underrepresented depressive patterns in the training data.
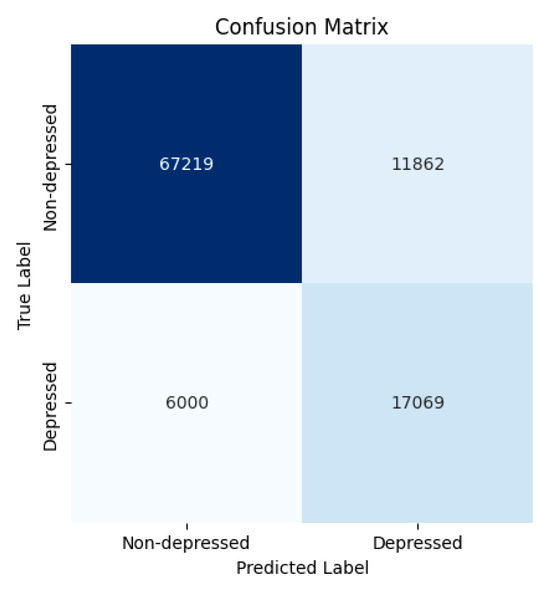
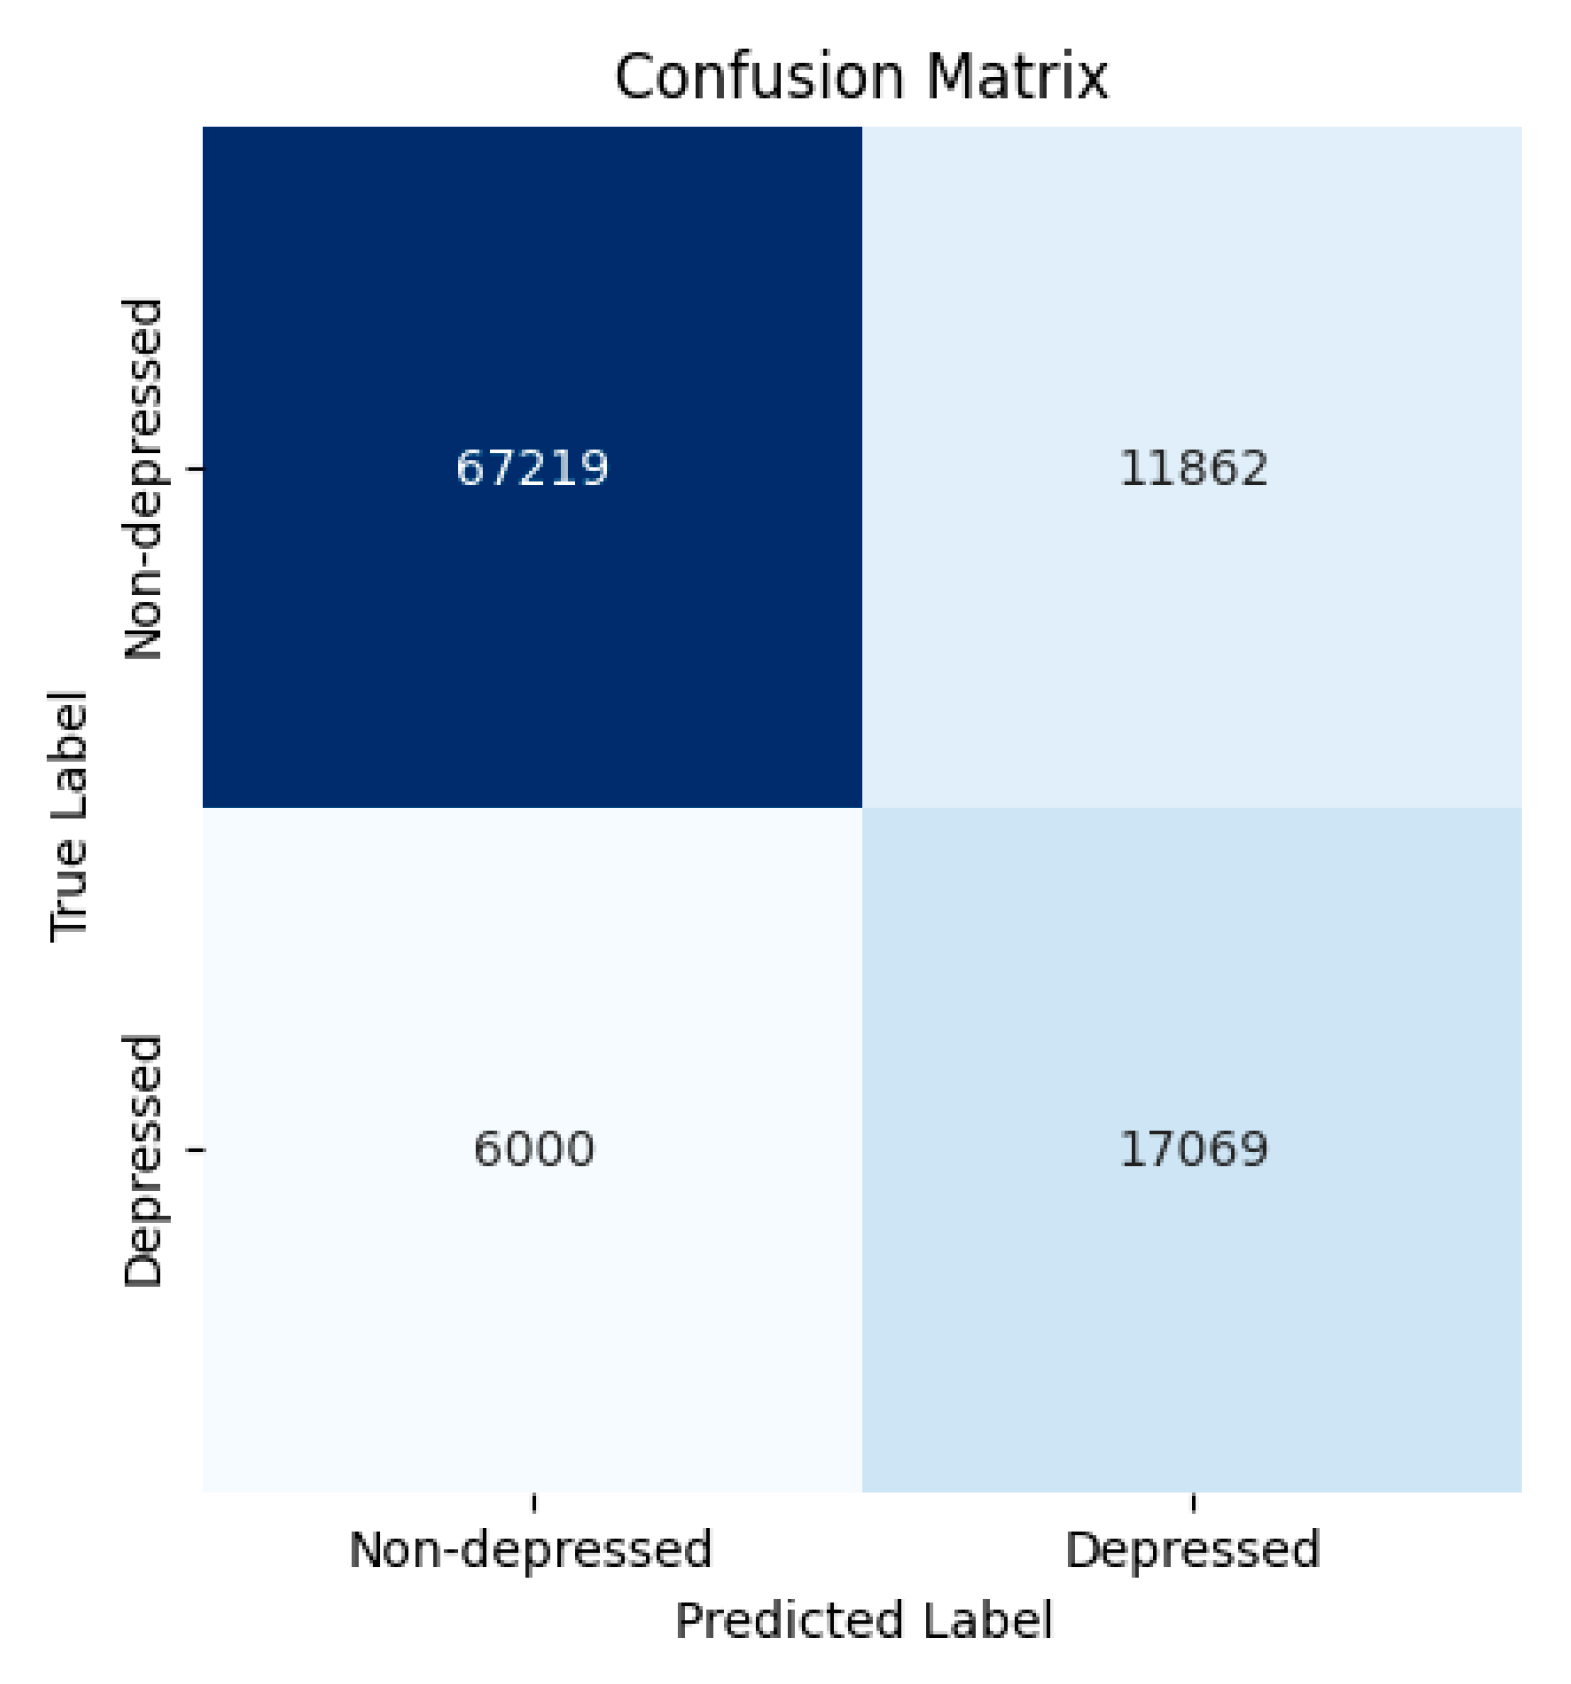
To this end, we present the confusion matrix of our CNN-LSTM model based on OpenFace for the E-DAIC-WOZ dataset. This matrix illustrates the model’s classification performance on the validation/test set and highlights its ability to effectively discriminate between depressed and non-depressed participants (Figure 10).
Figure 10.
Performance of the CNN-LSTM model on E-DAIC-WOZ: confusion matrix based on 3D facial landmarks.
5. Discussion: Key Contributions, Practical Considerations, and Limitations
The findings of this study indicate that visual cues, particularly 3D facial landmarks, have a high potential for automatic depression detection. Our latent model of the predicted attention state, which took an average between different folds to improve robustness to overfitting and obtain more reliable results, produced average F1-scores of 0.74 ± 0.03 on DAIC-WOZ and 0.762 ± 0.03 on E-DAIC. These results indicate stable performance across folds, suggesting consistent internal representations across different recording conditions and subject populations. One main novelty of this work is the reliance solely on 3D facial landmarks as structured temporal information. Rather than using 2D landmarks or raw RGB frames in previous methods, the 3D formulation models the depth dimension and micro-geometric variations, which are essential for analyzing subtle expressive expressions. These depth-derived features can assist the model to detect subtle behavioral details, such as the degree of expressivity, asymmetry in muscle movements or sustained downward gaze, all of which are strong indicators for depression affect.
When sequences of 3D facial landmarks are transformed into image-like representations, the main purpose is to provide CNNs with a format they are familiar with. It is a bit of a hack, yet this allows the network to learn about the spatial arrangement of the points while still considering how these arrangements change from one frame to another. As shown, in practice this sort of data generation ends up being handy for several reasons.
And first off, the amount of data remains quite small, so processing is significantly lighter than transformer-based architectures or passing raw video frames directly. This later makes the entire pipeline easier to manage. As another important advantage, particularly for clinical or mobile scenarios, landmarks do not reveal the identity of a person, so privacy is naturally better preserved. And because we are working with coordinates rather than pixel values, the method is also far less susceptible to noise due to the typical issues of lighting and camera you see in real recordings. What really improves the model, however, is when these geometric sequences are combined with the behavioral information extracted by OpenFace—things like action-unit activity, gaze orientation, or head movements. Putting these two types of cues together gives a more complete picture of how the face behaves over time. The model can pick up small muscle changes but also broader behavioral patterns, and this mix is what ends up helping the system distinguish between different cases more reliably across the datasets.
From an optimization perspective, the ability to handle the class imbalance carefully was critical for the voiceprint system reliability. By applying class weighting, focal loss, and adaptive decision thresholds of 0.306 for DAIC-WOZ and 0.489 for E-DAIC, the model struck an equilibrium between precision and recall. The depression class is prioritized for recall, so that the system tends to avoid false negatives, a characteristic feature of mental health screening systems. Last but not least, the suggested method is lightweight, interpretable and clinically feasible. The approach of CNN-LSTM, applied to low-dimensional structured inputs, offers a lightweight and privacy-preserving alternative and performs competitively among video-only/landmark-based approaches. This therefore is a practical and ethical solution for real-life applications, where it is crucial that privacy, interpretability and efficiency are met.
The DAIC-WOZ and E-DAIC datasets have strict privacy and data-sharing restrictions, which prevent the publication of raw frame sequences. Therefore, sample 16-frame sequences cannot be shown in this paper. Future work may consider using anonymized or synthetic landmark sequences to illustrate behavioral differences between depressed and non-depressed subjects.
6. Conclusions
In this paper, we set out to see if we could automatically detect signs of depression by looking at how a person’s face moves over time. Instead of using raw video, which is computationally heavy and raises privacy concerns, we worked with 3D facial landmarks—essentially, a simple, moving wireframe of the face. We fed sequences of these landmarks, along with behavioral features like facial muscle activations (action units) and head pose extracted by OpenFace, into a CNN-LSTM model. One of the biggest hurdles was the class imbalance inherent in this kind of data; there are far more healthy controls than depressed individuals in our datasets. To tackle this, we did not just rely on a standard loss function. We experimented with a combination of class weighting and focal loss (which focuses on harder-to-classify examples), and even optimized the classification threshold post-training. Using this combination of techniques was key to making sure our model worked well in real-life situations, where it is important to catch as many true cases as possible without generating too many false alarms. We were really pleased with how it performed. Our method achieved a macro-average F1-score of 0.74 ± 0.03 on the DAIC-WOZ benchmark and 0.762 ± 0.03 on the Extended-DAIC dataset; more importantly, the model proved its ability to pick up on the subtle, often fleeting nonverbal cues like micro-expressions and slight shifts in gaze or head motion that are thought to be hallmarks of depressive states. By analyzing the face frame-by-frame, we believe we are capturing a richer, more alive picture of behavior. A key advantage of our approach is its efficiency. It is lightweight enough to be potentially deployed in real-time settings, paving the way for integration into future clinical tools or even mobile mental health applications for early screening. Looking back, we feel this work is a solid step forward. It not only contributes a robust technical framework for depression detection but also lays the groundwork for what comes next. We are particularly excited about integrating other modalities, like vocal tone and speech content, to create a truly multimodal system that could further improve accuracy and reliability in the messy, complex reality of clinical practice.
Author Contributions
A.J. designed the research framework, developed the preprocessing pipeline for generating 3D facial landmark pseudo-images, implemented the CNN-LSTM architecture, performed the experiments, conducted the analysis, and wrote the manuscript. M.A.S. supervised the research, provided technical guidance, contributed to the conceptual design of the system, and reviewed the manuscript. A.Y. and A.A. provided academic and administrative support throughout the development of this work. All authors have read and agreed to the published version of the manuscript.
Funding
This research did not receive any specific grant from public, commercial, or not-for-profit funding agencies.
Institutional Review Board Statement
This study relied exclusively on publicly available datasets (DAIC-WOZ and E-DAIC), which contain pre-extracted audiovisual features intended for research use. No new data were collected from human participants by the authors, and no personal, clinical, or sensitive information was handled. In accordance with Moroccan Law No. 28–13 (2015) on the Protection of Participants in Biomedical Research, and given that the study involved no medical interventions, biological sampling, or data collection, formal ethical approval was not required.
Informed Consent Statement
Not applicable. All participants in the DAIC-WOZ and E-DAIC datasets provided consent through procedures managed by the original dataset administrators.
Data Availability Statement
The DAIC-WOZ dataset is available through the University of Southern California (USC) upon request. The E-DAIC dataset can be accessed by eligible researchers through its official administrators. All source code and preprocessing scripts used in this study are publicly available on GitHub at https://github.com/JALLAGLAG/lightweight-depression-detection-3d-landmarks/ (accessed on 29 January 2026).
Acknowledgments
The authors would like to express their sincere gratitude to the anonymous reviewers for their constructive comments and valuable suggestions, which helped improve the quality of this manuscript. The authors also wish to thank the maintainers of the DAIC-WOZ and E-DAIC datasets for making these resources available to the research community. During the preparation of this manuscript, the authors used ChatGPT (OpenAI, 2025 version) solely to improve the clarity and structure of the English language. All content has been thoroughly reviewed and edited by the authors, who assume full responsibility for the final version of the manuscript.
Conflicts of Interest
The authors declare that the research was conducted in the absence of any commercial or financial relationships that could be construed as a potential conflict of interest.
References
- Gratch, J.; Artstein, R.; Lucas, G.; Stratou, G.; Scherer, S.; Nazarian, A.; Wood, R.; Boberg, J.; DeVault, D.; Marsella, S.; et al. The Distress Analysis Interview Corpus of Human and Computer Interviews (DAIC-WOZ). In Proceedings of the Ninth International Conference on Language Resources and Evaluation (LREC’14), Reykjavik, Iceland, 26–31 May 2014. [Google Scholar]
- Gratch, J.; Artstein, R.; Morency, L.-P.; Nazarian, A.; Stratou, G.; Scherer, S. Extended Distress Analysis Interview Corpus (E-DAIC-WOZ). 2019. Dataset Available from the DAIC and Extended DAIC Resources, University of Southern California Institute for Creative Technologies. Available online: https://dcapswoz.ict.usc.edu/ (accessed on 29 January 2026).
- Wang, R.; Huang, J.; Zhang, J.; Liu, X.; Zhang, X.; Liu, Z.; Zhao, P.; Chen, S.; Sun, X. FacialPulse: An Efficient RNN-Based Depression Detection via Temporal Facial Landmarks. In Proceedings of the 32nd ACM International Conference on Multimedia, Melbourne, VIC, Australia, 28 October 2024; ACM: New York, NY, USA, 2024; pp. 311–320. [Google Scholar]
- Liu, Z.; Yuan, X.; Li, Y.; Shangguan, Z.; Zhou, L.; Hu, B. PRA-Net: Part-and-Relation Attention Network for Depression Recognition from Facial Expression. Comput. Biol. Med. 2023, 157, 106589. [Google Scholar] [CrossRef] [Scilit]
- Guo, Y.; Zhu, C.; Hao, S.; Hong, R. Automatic Depression Detection via Learning and Fusing Features from Visual Cues. IEEE Trans. Comput. Soc. Syst. 2022, 10, 2806–2813. [Google Scholar] [CrossRef] [Scilit]
- Wei, P.-C.; Peng, K.; Roitberg, A.; Yang, K.; Zhang, J.; Stiefelhagen, R. Multi-Modal Depression Estimation Based on Sub-Attentional Fusion. In Proceedings of the Computer Vision—ECCV 2022 Workshops, Tel Aviv, Israel, 23–27 October 2022. [Google Scholar]
- Pan, Y.; Shang, Y.; Liu, T.; Shao, Z.; Guo, G.; Ding, H.; Hu, Q. Spatial–Temporal Attention Network for Depression Recognition from Facial Videos. Expert Syst. Appl. 2024, 237, 121410. [Google Scholar] [CrossRef] [Scilit]
- De Melo, W.C.; Granger, E.; Lopez, M.B. Facial Expression Analysis Using Decomposed Multiscale Spatiotemporal Networks. Expert Syst. Appl. 2024, 236, 121276. [Google Scholar] [CrossRef] [Scilit]
- He, L.; Li, Z.; Tiwari, P.; Cao, C.; Xue, J.; Zhu, F.; Wu, D. Depressformer: Leveraging Video Swin Transformer and Fine-Grained Local Features for Depression Scale Estimation. Biomed. Signal Process. Control 2024, 96, 106490. [Google Scholar] [CrossRef] [Scilit]
- Zhou, L.; Liu, Z.; Yuan, X.; Shangguan, Z.; Li, Y.; Hu, B. CAIINET: Neural Network Based on Contextual Attention and Information Interaction Mechanism for Depression Detection. Digit. Signal Process. 2023, 137, 103986. [Google Scholar] [CrossRef] [Scilit]
- Rejaibi, E.; Komaty, A.; Meriaudeau, F.; Agrebi, S.; Othmani, A. MFCC-Based Recurrent Neural Network for Automatic Clinical Depression Recognition and Assessment from Speech. Biomed. Signal Process. Control 2022, 71, 103107. [Google Scholar] [CrossRef] [Scilit]
- Rohanian, M.; Hough, J.; Purver, M. Detecting Depression with Word-Level Multimodal Fusion. In Proceedings of the Interspeech 2019, Graz, Austria, 15–19 September 2019; ISCA: Tel Aviv, Israel, 2019; pp. 1443–1447. [Google Scholar]
- Sun, J.; Ma, S.; Fan, Y.; Washington, P. Evaluating Large Language Models for Anxiety and Depression Classification Using Counseling and Psychotherapy Transcripts. arXiv 2024, arXiv:2407.13228. [Google Scholar] [CrossRef] [Scilit]
- Das, A.K.; Naskar, R. A Deep Learning Model for Depression Detection Based on MFCC and CNN Generated Spectrogram Features. Biomed. Signal Process. Control 2024, 90, 105898. [Google Scholar] [CrossRef] [Scilit]
- Dham, S.; Sharma, A.; Dhall, A. Depression Scale Recognition from Audio, Visual and Text Analysis. arXiv 2017, arXiv:1709.05865. [Google Scholar] [CrossRef] [Scilit]
- Zhang, Z.; Zhang, S.; Ni, D.; Wei, Z.; Yang, K.; Jin, S.; Huang, G.; Liang, Z.; Zhang, L.; Li, L.; et al. Multimodal Sensing for Depression Risk Detection: Integrating Audio, Video, and Text Data. Sensors 2024, 24, 3714. [Google Scholar] [CrossRef] [Scilit]
- He, L.; Zhao, J.; Zhang, J.; Jiang, J.; Qi, S.; Wang, Z.; Wu, D. LMTformer: Facial Depression Recognition with Lightweight Multi-Scale Transformer from Videos. Appl. Intell. 2025, 55, 195. [Google Scholar] [CrossRef] [Scilit]
- Niu, M.; Tao, J.; Liu, B.; Huang, J.; Lian, Z. Multimodal Spatiotemporal Representation for Automatic Depression Level Detection. IEEE Trans. Affect. Comput. 2023, 14, 294–307. [Google Scholar] [CrossRef] [Scilit]
- Ding, Z.; Hu, Y.; Jing, R.; Sheng, W.; Mao, J. A Depression Recognition Method Based on the Alteration of Video Temporal Angle Features. Appl. Sci. 2023, 13, 9230. [Google Scholar] [CrossRef] [Scilit]
- He, L.; Niu, M.; Tiwari, P.; Marttinen, P.; Su, R.; Jiang, J.; Guo, C.; Wang, H.; Ding, S.; Wang, Z.; et al. Deep Learning for Depression Recognition with Audiovisual Cues: A Review. Inf. Fusion 2022, 80, 56–86. [Google Scholar] [CrossRef] [Scilit]
- Li, Y.; Liu, Z.; Zhou, L.; Yuan, X.; Shangguan, Z.; Hu, X.; Hu, B. A Facial Depression Recognition Method Based on Hybrid Multi-Head Cross Attention Network. Front. Neurosci. 2023, 17, 1188434. [Google Scholar] [CrossRef] [Scilit]
- Mahayossanunt, Y.; Nupairoj, N.; Hemrungrojn, S.; Vateekul, P. Explainable Depression Detection Based on Facial Expression Using LSTM on Attentional Intermediate Feature Fusion with Label Smoothing. Sensors 2023, 23, 9402. [Google Scholar] [CrossRef] [Scilit]
- Yan, K.; Miao, S.; Jin, X.; Mu, Y.; Zheng, H.; Tian, Y.; Wang, P.; Yu, Q.; Hu, D. TCEDN: A Lightweight Time-Context Enhanced Depression Detection Network. Life 2024, 14, 1313. [Google Scholar] [CrossRef] [Scilit]
- Zhang, L.; Zhang, S.; Zhang, X.; Zhao, Y. A Multimodal Artificial Intelligence Model for Depression Severity Detection Based on Audio and Video Signals. Electronics 2025, 14, 1464. [Google Scholar] [CrossRef] [Scilit]
- Han, M.-M.; Li, X.-Y.; Yi, X.-Y.; Zheng, Y.-S.; Xia, W.-L.; Liu, Y.-F.; Wang, Q.-X. Automatic Recognition of Depression Based on Audio and Video: A Review. World J. Psychiatry 2024, 14, 225–233. [Google Scholar] [CrossRef] [Scilit]
- Guo, W.; Yang, H.; Liu, Z.; Xu, Y.; Hu, B. Deep Neural Networks for Depression Recognition Based on 2D and 3D Facial Expressions Under Emotional Stimulus Tasks. Front. Neurosci. 2021, 15, 609760. [Google Scholar] [CrossRef] [Scilit] [PubMed]
- Xu, J.; Song, S.; Kusumam, K.; Gunes, H.; Valstar, M. Two-Stage Temporal Modelling Framework for Video-Based Depression Recognition Using Graph Representation. IEEE Trans. Affect. Comput. 2021, 16, 161–178. [Google Scholar] [CrossRef] [Scilit]
- Lin, T.-Y.; Goyal, P.; Girshick, R.; He, K.; Dollar, P. Focal Loss for Dense Object Detection. In Proceedings of the 2017 IEEE International Conference on Computer Vision (ICCV), Venice, Italy, 22–29 October 2017; IEEE: Piscataway, NJ, USA, 2017; pp. 2999–3007. [Google Scholar]
- Cui, Y.; Jia, M.; Lin, T.-Y.; Song, Y.; Belongie, S. Class-Balanced Loss Based on Effective Number of Samples. In Proceedings of the 2019 IEEE/CVF Conference on Computer Vision and Pattern Recognition (CVPR), Long Beach, CA, USA, 15–20 June 2019; IEEE: Piscataway, NJ, USA, 2019; pp. 9260–9269. [Google Scholar]
- Wu, P.; Wang, R.; Lin, H.; Zhang, F.; Tu, J.; Sun, M. Automatic Depression Recognition by Intelligent Speech Signal Processing: A Systematic Survey. CAAI Trans. Intel. Tech. 2023, 8, 701–711. [Google Scholar] [CrossRef] [Scilit]
- Lee, Y.-S.; Park, W.-H. Diagnosis of Depressive Disorder Model on Facial Expression Based on Fast R-CNN. Diagnostics 2022, 12, 317. [Google Scholar] [CrossRef] [Scilit]
- Jiang, H.; Hu, B.; Liu, Z.; Wang, G.; Zhang, L.; Li, X.; Kang, H. Detecting Depression Using an Ensemble Logistic Regression Model Based on Multiple Speech Features. Comput. Math. Methods Med. 2018, 2018, 6508319. [Google Scholar] [CrossRef] [Scilit]
- Al Hanai, T.; Ghassemi, M.; Glass, J. Detecting Depression with Audio/Text Sequence Modeling of Interviews. In Proceedings of the Interspeech 2018, Hyderabad, India, 2–6 September 2018; ISCA: Tel Aviv, Israel, 2018; pp. 1716–1720. [Google Scholar]
- Burdisso, S.; Reyes-Ramírez, E.; Villatoro-Tello, E.; Sánchez-Vega, F.; López-Monroy, P.; Motlicek, P. DAIC-WOZ: On the Validity of Using the Therapist’s Prompts in Automatic Depression Detection from Clinical Interviews. arXiv 2024. [Google Scholar] [CrossRef] [Scilit]
- Zhao, X.; Lyu, Y.; Wang, D.; Tang, B. Predicting Depression in Screening Interviews from Interactive Multi-Theme Collaboration. arXiv 2025, arXiv:2502.12204. [Google Scholar] [CrossRef] [Scilit]
- Gan, L.; Huang, Y.; Gao, X.; Tan, J.; Zhao, F.; Yang, T. Multimodal Magic Elevating Depression Detection with a Fusion of Text and Audio Intelligence. arXiv 2025, arXiv:2501.16813. [Google Scholar]
- Patapati, S.V. Integrating Large Language Models into a Tri-Modal Architecture for Automated Depression Classification on the DAIC-WOZ. arXiv 2024, arXiv:2407.19340. [Google Scholar]

Disclaimer/Publisher’s Note: The statements, opinions and data contained in all publications are solely those of the individual author(s) and contributor(s) and not of MDPI and/or the editor(s). MDPI and/or the editor(s) disclaim responsibility for any injury to people or property resulting from any ideas, methods, instructions or products referred to in the content. |
© 2026 by the authors. Licensee MDPI, Basel, Switzerland. This article is an open access article distributed under the terms and conditions of the Creative Commons Attribution (CC BY) license.