


Abstract
High arch dams are structurally efficient hydraulic structures for demanding loading conditions, including extreme loading, and are widely recognized for the transfer mechanism of such loads acting on them. The distinctive performance of these thin concrete structures during their service life is often intriguing and worth investigating. Unlike in the case of concrete gravity dams, in arch dams—especially, thin arch dams—the impact of temperature loads assumes significance due to the geometry and load-transfer mechanism. In this paper, an existing high double-curvature thin concrete arch dam experiencing fluctuations in reservoir levels is analyzed regarding the combined effect of thermal loads and the deflections and stresses caused. Thermal loads arising from continuous exposure of intrados and extrados faces contribute to critical loading scenarios. The FEM-based simulations assisted with field monitoring data and were used to study the structural response under the influence of temperature in steady-state conditions. The study found that the increase in body temperature is a cause of undesirable tensile stresses in the upper parts of the dam body, close to 2.0 MPa, which may cause the development of horizontal cracks. Small areas of upstream heel portion also develop higher tensile stresses due to temperature loads. The dam in its 50-year service life showed apparently aberrant behavior in deflections. The seasonal temperature variation—an increase—can be a cause of the atypical response of the dam. The anomalous nature of the behavior cannot be considered unusual, but the study also found that mitigation measures are effective, suggesting that continuous monitoring is required for sustained healthy functioning.
1. Introduction
Dams facilitate substantial storage capacity, moderating peak inflows during intense rainfall events and thereby reducing downstream flood hazards. Large reservoirs are essential infrastructure supporting water security for much of the world’s urban, agricultural, and industrial sectors [1,2]. Dams and reservoirs are vital for water availability and socio-economic growth. Global evidence indicates a strong link between per capita storage and development metrics such as Gross National Income and the Human Development Index [3]. The 20th century saw a rapid expansion of dammed reservoirs supporting irrigation, hydropower, flood control, and water supply systems worldwide. Reservoirs continue to play a key role in meeting the evolving water, energy, and food security demands [4]. Integrated operation of dams can reduce population exposure to climate-driven flood risks by 13–21%, underscoring their role in climate resilience. Climate change is amplifying hydrological extremes, increasing dam failure risks, especially for aging infrastructure. Nearly 65% of dams in the Global Reservoir and Dam Database (GRanD) v1.3 global database [5,6] are over 50 years old. Many lack reliable design data. The high proportion of large dams (73%) heightens the potential for catastrophic impacts [7]. Dams and reservoirs for hydropower help generate energy on demand, support the integration of solar and wind power, and provide additional benefits already stated. However, they also cause social conflicts, environmental degradation, disrupted ecosystems, reduced biodiversity, and impacts on water quality, etc. Dams facilitate cleaner renewed energy, though there are concerns regarding ecological harm [8,9,10]. As per the database of the International Commission on Large Dams (ICOLD), out of the 62,362 dams, not less than 51% are 50 years or older [11]. Arch dams constitute not more than 4%, and about 44% of them are 50 years old. Figure 1 shows the dispersion of arch dams worldwide considering only the top 20 countries in the list. Approximately 60% of all arch dams are in China, whereas India, with 6281 large dams [12] to its tally, has only one arch dam among the total.
Figure 1.
Distribution of arch dams worldwide (top 20 countries constitute 95.3%). The percentage share of these 20 countries is shown in the pie chart (data source: ICOLD) [11].
Studies by pioneers leveraged the capabilities of concrete as an efficient structural material. This paved the way for thinner arch dam designs at a time when conventional gravity dams were predominant [13]. Various studies elaborate upon the types and classifications [14,15]. Figure 2 shows a plan of a typical double-curvature arch dam. Several constraints in terms of geometry, stress and stability determine the optimum shape for an arch dam in the design stage [16] in terms of achieving optimum quality in various desirables/indicators during construction and operation. Continuous field monitoring of the actual performance of the arch dam for loading that may invoke unusual behavior is vital to ascertaining any potential risks. Cracking in arch dams is a concern, and different scenarios and conditions cause cracking of concrete at various locations [17]. Certain conditions may cause cracking in the galleries of concrete dams. Gallery cracking is attributable to alkali–aggregate reactions, self-weight of concrete, reservoir impoundment, differential foundation deformation, restraint from the foundation or surrounding concrete, inadequate temperature control, insufficient temperature and humidity curing, ambient air temperature fluctuations, and geometric irregularities [18].
Figure 2.
Plan view of the Morrow Point double-curvature concrete arch dam, USA [15].
From a dam safety perspective, investigation of the current condition and future risks of an existing dam is a vital task [19]. Monitoring and surveillance are key to preventing any vulnerabilities and failures [20]. Arch dams require comprehensive monitoring through well-planned instrumentation. This is evident even in arch dams constructed 50 years ago. Strain meters and stress meters for principal/normal stress, rock targets for upstream and downstream displacement, pendulums for upstream and downstream movement, clinometers for upstream downstream rotation, mechanical/electrical joint meters for joint opening and closing, base meters for inward and outward linear deformation between two points, etc., are installed and readings are recorded as per the number, frequency and period required [21]. Important dams worldwide, especially arch dams, have routine instrumentation and monitoring for early detection of anomalies to enable timely interventions such as repairs, reservoir regulation, or evacuation [22].
Objectives of the Study
Arch dams are constructed, after detailed investigation and rigorous design, with stringent quality control. These structures need continuous monitoring of behavior to ensure health and safety over their entire service life. Erratic or unusual behavior is a cause for concern and potential risk to lives and resources. Structural health monitoring through instrumentation and safety inspections is essential to mitigating the risks and failures. There can be undesirable responses inherent to with the dams’ constitution and environment. Studies that couple simulations to investigate the responses against various loads vis-à-vis actual responses are essential to discovering any emergent risk to safety. This is of particular relevance for aging dams. Slenderness, indeterminacy and sensitivity to thermal loads are also important constraints that warrant simulation studies to address the potential risks. Analyses of monitoring reports of such aging dams not located in seismically vulnerable zones, which showed trends of continuous movement in the upstream direction and the presence of horizontal body cracks, led to the present study.
This study investigates the critical factors influencing the structural safety and behavior of concrete arch dams, with emphasis on the thermo-mechanical response of an existing double-curvature thin concrete arch dam against reservoir-level fluctuations. The study systematically evaluates the water-level variations and exposure of dam surfaces to thermal loading to elucidate their effects on structural behavior. An existing double-curvature thin concrete arch dam was selected to study and assess the spatial and structural response—deflections and stresses—at varying reservoir levels and under associated thermal conditions.
The study thus specifically investigates whether the movement of the structure is unusual and also uncovers the effectiveness of rehabilitation measures against extreme thermal loading. Accordingly, before the methodology of the study is presented, the factors influencing the behavior, possible failure modes and how the temperature load affect the structure are outlined.
2. Factors Influencing the Behavior of Arch Dams
Though arch dams are economical compared to gravity dams, their intrinsic behavior is often intricate. The behavior of concrete arch dams depends on multiple factors, viz., geometry, loads acting on the structure, materials and methods of construction, etc. The geometry of arch dams plays a key role in the load transfer, design, construction, economy and behavior. Unlike in gravity dams, the presence of vertical contraction joints, curvature(s) in the vertical and horizontal planes, material properties of concrete and canyon rock, canyon shape, basin characteristics, environmental/climatic conditions and vulnerabilities to seismic action, etc., have distinct influence on the behavior of the arch dam and its safety during its operation. Double-curvature concrete arch dams are capable of resisting loads effectively, facilitating large, high and ultra-high dams. A careful consideration of the above factors governs selection of appropriate design method, construction, monitoring and safety evaluation. All such constraints make studies on probable failure modes, the influence of reservoir level fluctuations, thermal loads and methods of analysis, etc., very relevant for arch dams.
2.1. Potential Failure Modes for Arch Dams
The Association of State Dam Safety Officials (ASDSO), USA, defines ‘dam failure’ as the uncontrolled release from a reservoir that can result in downstream flooding, damage, and loss of life and a ‘potential failure mode’ (PFM) as a realistic physical mechanism by which a dam could fail due to an existing inadequacy or defect—whether in the foundation, design, construction, materials used, operation and maintenance, or aging—that may ultimately result in an uncontrolled release from the reservoir [23]. FERC [24] defines ‘failure’ in a detailed way, including the inability of the project features/components to perform its function or their impairment/compromise. The dam engineers should be able to identify the various PFMs and the events of each mode that would lead to failure. PFMs start with an initializing event, which may be a flood, seismic event or a human error, etc. The adverse events that follow may lead the dam to failure. Appropriate structural analysis and study of the response at the particular node of the event trees forms an integral part [25]. It is worth highlighting that the lack of a regulatory framework for dam safety, lack of flood forecasting, early warning system for preparedness and lack of a system capable of analyzing the hydro-meteorological parameters along with high climate variability, etc., are factors that resulted in the catastrophic dam disasters in Derna, Libya in 2023 [26,27].
Despite structural efficiency, arch dams remain susceptible to multiple failure mechanisms arising from internal stress redistribution and external environmental influences. Material degradation accompanied by excessive cracking within the dam body, often initiated by tensile stress concentrations resulting from abnormal thermal gradients, reservoir level fluctuations, and dynamic loads such as seismic events, are capable to form a critical failure mode. Critical zones may develop cracks, and these cracks can propagate progressively, compromising the monolithic action of the structure, causing localized strength reduction and potentially culminating in global instability if not mitigated. Certain rigorous FEM-based simulations and geo-mechanical studies determined that cracking typically originating in highly stressed zones—notably the upstream heel and downstream toe—is capable of rapidly extending under overload conditions, and this can impair load transfer, reducing the bearing capacity of the dam–foundation system [28]. Apart from internal cracking, arch dams are highly sensitive to the instability that may arise at the dam interfaces with the foundation and abutment. Risk-based studies indicate that high arch dams are susceptible to the failure of abutment rock mass, sliding at the foundation, and even global collapse in extreme scenarios such as major floods, strong seismicity, landslides, and unusual thermal stresses. Seismic events can trigger shear slip along the dam contacts with the rock and weaken interface cohesion, causing increased structural fragility. Probabilistic analyses emphasize that accurate identification of these coupled actions of failure mechanisms is pertinent for effective safety assessment and mitigation planning [29]. Further, the dynamic response of high arch dams is governed by the complex interaction between arch action, cantilever action, and dam–foundation–reservoir coupling, rendering their seismic performance particularly sensitive to abutment behavior and foundation flexibility [30,31], and hence accurate characterization of these load-transfer mechanisms is essential for reliable seismic safety assessment. Assessing the maximum dynamic load concrete can withstand is one of the important challenges in dam engineering. Studies reveal that the deformation and spatial distribution of potential damage area is directly related to the geometry of the dam, though it is not related to the localized damage at the most critical location [32].
Study of the response of arch dams against strong seismicity needs to incorporate structural nonlinearity and dynamic nonlinear analysis. Contraction joints cannot withstand tensile stress, though they are effectively grouted; cyclic opening and closing of these joints result in a nonlinear response. Opening of these joints releases the large tensile stress in the arches, causing a redistribution of forces in the cantilevers, which may result in high stresses and cracks in the monoliths. FEM-based studies on the 240 m high Ertan arch dam with 38 contraction joints showed that earthquake input mechanisms strongly influence response, with massless foundations overestimating dam behavior and different input types yielding varying amplitudes. Water compressibility notably increases displacement in the upper-middle dam and raises downstream tensile stress in linear analysis. Joint opening redistributes stresses: with the added-mass model it increases downstream tensile stress, whereas the tensile stresses on both faces are slightly reduced when water compressibility is accounted for [33]. Contraction joint openings; the linear elastic behavior of concrete; and the infinite mass of canyons, non-uniform boundaries, etc., were discussed in detail with respect to a few high arch dams in China [34].
Failure of the 66.5 m high Malpasset double-curvature arch dam, France, constructed in 1959 facilitated various studies, leading to the development of pertinent hypotheses and suggestions in the design and construction of arch dams [35].
2.2. Influence of Reservoir Water Level
Most of the storage reservoirs experience fluctuations in the water level depending upon the demand as per the purpose(s) envisaged. Often these variations are periodic as per the purpose, extent of demand (outflow) and inflow. Nowadays, unlike in earlier years, all major reservoirs are being operated as per rule curves [36,37,38] for effective water management and dam safety. Still, the high fluctuations in the water level as well as possibilities of overloading above the normal water level (NWL) or full reservoir level (FRL) are also worth studying for their influence on dam behavior. Depletion of the storage to lower levels during summer seasons and filling of the reservoir during rainy or monsoon seasons have influence on structural behavior and need to be studied. Apart from the gravity (dead loads) and hydrostatic loads due to fluctuating water levels, dams are subjected to loads caused by temperature deviations from the arch-closure temperature. The double-curvature geometry of the dam influences the complexity in behavior when it is loaded to various levels during seasonal variations in ambient temperature and solar radiation.
2.3. Influence of Thermal Loads
Influence of temperature loads is an important design consideration as the stresses and displacements it causes are a greater concern than reservoir water loads acting alone. Also, the nature and extent of movements occurring due to the thermal loading can be capricious. The thermal properties of concrete, viz., coefficient of expansion, conductivity, specific heat and diffusivity, etc., are pivotal. The temperature contour in the body of the dam is dependent on ambient air temperature, reservoir water temperature and solar radiation, etc. [39]. Studies on the Karaj double-curvature concrete arch dam in Iran concluded that thermal loads have a considerable impact compared to self-weight and hydrostatic loads on the formation of downstream cracks. The cracked zones on the downstream face correspond to areas that experienced the highest temperatures, attributed to solar radiation. The study highlighted that the increase in temperature due to solar radiation causes the development of tensile stresses and cracks [40].
The temperature distribution within a reservoir is depth-dependent and is frequently incorporated as a boundary condition in thermal studies and mathematical simulations. To estimate water temperatures in deep reservoirs across different climatic settings, Bofang [41] developed an analytical predictive formulation. Reservoir thermal stratification is influenced by multiple factors, including the basin geometry, atmospheric conditions at the water surface—such as wind effects, ambient air temperature, dew point, and ice presence—as well as inflow characteristics and operational practices. Chapra [42] employed a detailed method to model and evaluate temperature stratification in reservoirs. Wang et al. [43] discuss the various methods of prediction of surface water temperature in deep reservoirs. Integrating multidimensional process-based models (PBMs) with data-driven models (DDMs) enhances the accuracy of water temperature simulations in complex environments such as large, deep reservoirs with pronounced spatial heterogeneity [44]. In many large concrete structures, stresses induced by variations in ambient conditions can govern structural behavior; significant seasonal temperature fluctuations often lead to cracking. Malm et al. [45] discussed the results of the ICOLD Benchmark Workshop [46] that dealt with the predictions by various researchers of the cracking and displacements in arch dams due to seasonal variations, with respect to an existing single curvature reinforced concrete arch dam in Sweden. It compared measured displacements, calculated displacements in linear and nonlinear static analyses for a combined consecutive two years with an extreme cold year and extreme warm year in succession. It showed that the maximum crest displacements ranged from 40 to 65 mm (avg. 55 mm) for linear elastic models and 50 to 80 mm (avg. 65 mm) for nonlinear models, with the discrepancy mainly attributed to differences in fracture energy, whereas the maximum measured displacements were slightly over 50 mm for the non-cracked period. The study emphasized the importance of using nonlinear models, transient temperature analyses with Robin boundary conditions and the influence of interaction between concrete and rock. Studies based on the Xiaowan arch dam by Li et al. [47] observed that the computed thermal stress patterns closely matched the locations of observed cracks, indicating that stresses induced by diurnal temperature fluctuations were a significant factor contributing to horizontal cracking on the downstream face.
In a real-world thermal loading scenario, various actions of heat transfer affect the temperature distributions within the dam body and influence the behavior of the arch dam. Thermal conduction, where the transfer of energy is due to temperature gradient between surfaces; thermal convection; and thermal radiation plays their respective roles in deciding the behavior of arch dams in response to the temperature effects. Thermal conductivity, convective coefficient and absorptivity and emissivity of the surface are decisive in those actions. Figure 3 schematically illustrates the heat transfer occurring in the case of concrete arch dams.
Figure 3.
Heat transfer occurring in the case of a concrete arch dam with solar radiation effects and temperature varying with time.
FEM Simulation of Thermal Loading
In order to solve such thermal loading involving various time-dependent thermal actions by the finite element method, appropriate boundary conditions are to be applied, and they assume the following matrix form [48]:
where and are element consistent capacitance matrix, temperature vector, element conductivity matrix, element heat generation vector and element convection (surface) heat flow vector respectively. In a global assembly, Equation (1) becomes
where and are the global capacitance and conductivity matrices respectively.
In this study, the spatial variation over the dam faces as well as the variation in temperature with respect to time were not considered; instead, the field data were directly used in the analyses.
In steady-state analysis the effects of steady thermal loads acting on the system are calculated after diminishing all transient effects. Steady-state analysis is helpful to determining temperatures, temperature gradients, rate of heat flow and heat fluxes caused by thermal loads that do not vary over time.
As per the Fourier law of heat conduction [49], the heat-transfer rate , is given by:
where k is thermal conductivity (W/m °C).
The heat conduction equation for a general 3D case, in Cartesian coordinates is
where k = thermal conductivity (W/m °C);
= density (kg/m3);
= energy generated per unit volume (W/m3);
= specific heat of material (J/kg °C).
When the thermal conductivity is constant in all directions, there is no source of heat (energy) generation in the 50-year-old dam, and there is no variation in temperature with respect to time, Equation (4) reduces to
In the finite element method (FEM), the discretization results in a system of linear equations, the solution of which gives the temperature distribution. In the FEM method, the governing equation for steady state is
where represents the conductivity matrix, , the temperature distribution vector and the temperature load applied as per the boundary condition.
3. Materials and Methods
3.1. Assumptions
In line with the objective, the study underscored thermo-structural simulations by simplifying the complexities. It assumed that the material is not loaded beyond elastic limits, and nonlinearity in the responses was not expected. While the study targeted the effects of extreme variations in the reservoir water level and thermal loads, it also attempted to reduce the complexity by eliminating the spatiotemporal variations occurring on the dam surface; accordingly, it is assumed that the dam surface attains an extreme temperature, and its behavior in such a scenario was studied. This assumption eases the complexity of transient thermal loading to a steady state.
3.2. Loads Acting on the System
Arch dams are generally considered safer in resisting loads than other types of dams. Under normal conditions, reservoir water load alone is not a potential threat that could cause the failure of arch dams. But simultaneous actions of other loads are crucial to the behavior of arch dams and need to be studied. There can be simultaneous actions of gravity, silt, uplift, seismic, wind, wave, ice and temperature loads along with the reservoir water loads. This study emphasizes the assessment of how these high and slender structures respond to thermal actions. To elucidate the difference in behavior due to temperature rise, the response against the reservoir water level up to the brink of the dam was simulated first. Subsequently, the coupled action of variation in thermal loads was simulated. The vertical contraction joints that connect the individual monoliths and three levels of horizontal inspection galleries were incorporated in the model adopted for the study.
Continuous exposure of the intrados and extrados faces to environmental actions will result in cyclic heating and cooling of the concrete. The intrados face is subjected to continuous effects of solar radiation and convection throughout service life, whereas in the case of the extrados, exposure is dependent on the demand for water (in the study case, mainly, power generation). A transient thermal analysis that takes into consideration the temperature variation with respect to time and space can depict such a heat transfer more realistically but with a high degree of complexity and computational load. However, in this study, the simulations did not incorporate such a spatial variation in temperature with respect to time over the dam faces; instead, the historical temperature data from field monitoring were directly applied at the boundaries to interpret the behavior through multiple simulations. In this way the transient thermal state was simplified as a steady-state scenario to study the effects of variation in the water level on structural behavior. In this study, the effects of steady thermal loads acting on the system were calculated. Generally stated, a steady-state analysis may be done before a transient thermal analysis to establish the initial conditions or as the last step of a transient analysis after diminishing all transient effects. Steady-state analysis is helpful to determining temperatures, temperature gradients, rate of heat flow and heat fluxes caused by thermal loads that do not vary over time.
Simulations with temperature at the intrados and extrados—respective boundaries of the domain—provided the thermal distribution. The reservoir water loads were applied as the final step in the thermo-static structural simulations. Gravity loads, temperature loads and reservoir water loads were applied in successive time steps in this thermo-structural analysis.
3.3. Significance of Dam Safety Inspections and Instrumentation
Inspections and instrumentation are essential and inevitable protocols from the perspective of ensuring structural health and safety of dams. The frequency and extent of inspections and the adequacy of instrumentation are dependent on the hazard potential [50,51,52] of those dams. Dam safety inspections in accordance with the prevalent guidelines are the first line of defense for identifying any defects or malfunctioning sufficiently early to ensure the strength, stability, and safe operation of this critical water infrastructure. Instrumentation facilitates continuous, data-driven insights on structural behavior and health, enabling timely decisions and early warning of any potential failures for the enhanced safety of the public and various stakeholders.
Concrete arch dams require extensive inspections and accurate instrumentation. Each country has its own updated protocols for dam safety inspections and instrumentation. International practices of the Federal Emergency Management Agency (FEMA), ICOLD, USBR and the FERC manuals give relevant guidelines. The Central Water Commission (CWC) in India released updated manuals as guidelines on dam inspections as part of their Dam Rehabilitation and Improvement Project (DRIP) [53]. The World Bank (IBRD-IDA) also gives general practice notes for addressing the safety of dams [54].
These inspections, targeted to ensure proper operation and maintenance, help to discover any unsafe conditions and their causes; also, recommendations can be drawn for appropriate remedial or mitigation measures against any deficiency or defect and to safeguard the structure as well as appurtenances. These inspections ensure that the dam meets at least the minimum requirements stipulated by respective authorities.
Instrumentation for performance/health monitoring systems complements visual inspections in assessing the health, structural performance and safety of the dam. Continuous and systematic evaluation of instrument data can facilitate the early detection of anomalous responses and emerging critical conditions. Parameters such as displacement/deformation, strain, stress, joint behavior, uplift pressure, seepage, and temperature can provide valuable evidence of changes in the dam’s structural and environmental response. In other words, consistent instrumentation data and the trends derived from it can confirm that an observed anomaly is non-critical and does not warrant immediate remedial intervention. Installation of adequate number of equipment at the technically relevant locations of the dam and site, its periodical maintenance for accurate results, observation/data collection by trained personnel, frequency of the observations, and analysis and data interpretation are vital [55]. Instrumentation requires extensive planning, appropriate installation and data processing to ensure the sustained safety of dams, and robust guidelines for the dam owners are necessary [56].
Both historic and real-time data from the instrumentation are pertinent in health monitoring. The present study was mooted by the intriguing response of the arch dam observed from the field monitoring data. Movements of the aging arch dam—unusual and not in expected lines—gave impetus to investigate further. The fluctuations in water levels are mostly periodic, and it is expected that the behavior through movements of the dam in response to such fluctuations should also be periodic and elastic. The environmental conditions are unique for each scenario. This necessitated an analysis on field observation data and a set of simulations. The objective of the study was to analyze how existing asymmetrical double-curvature thin concrete arch dams behave with respect to fluctuation of reservoir loads under the influence of temperature loads.
3.4. Instrumentation Data for the Present Study
Extensive instrumentation has been installed during the construction stage and later in the studied dam. They facilitate collection of data such as water level and quality; seepage; horizontal (radial and tangential), vertical and rotational movements; pore pressure and uplift pressure; accelerations from seismic events; temperature (ambient and water); crack width and joint opening/closing; climatological data; and stress and strain. Some of the instruments installed during construction have become dysfunctional or faulty. The instrumentation has been upgraded with state-of-the-art technology for real-time structural health monitoring.
From the plethora of instrumentation data, those corresponding to temperature, water level and movements were drawn for this study. Instrumentation for assessing the movements included five triangulation monuments to control 26 geodetic targets placed on the downstream face of the dam, six pendulums—five from top to bottom and one inverted pendulum—to ascertain the dam movements, three crest collimation stations for ascertaining the crest movements, and a monument triangulation network comprising 10 massive concrete monuments—five monuments located outside the zone of local deformations caused by the reservoir loading and the other five target primary monuments placed immediately downstream of the dam within the zone of probable deformation that were used for the triangulation survey using the targets embedded on the downstream face of the arch dam, etc. Of these the pendulum observations (Figure 4) and crest collimation (Figure 5), which showed consistent trends of movements, were used in the interpretation of the results of this study.
Figure 4.
Pendulum arrangement in the three blocks of the dam (total of 6 pendulums) for recording the movements.
Figure 5.
Crest collimation method to monitor the movement of the dam crest at the three blocks.
3.5. Methodology
An existing double-curvature asymmetric thin concrete arch dam in India, 169 m above the deepest bed level, was selected for the detailed study and simulations. The crest is 381 m long, and the dam is composed of 24 blocks. The adjacent blocks are grouted at the vertical contraction joints for monolithic action. This arch dam along with two other high dams form a major reservoir. This group of dams forming the single reservoir is downstream of the Periyar reservoir, which spills to the same River Periyar (Figure 6). The methodology adopted for the study is detailed in Figure 7. The geometry of the dam with salient features is shown in Figure 8.
Figure 6.
Arch dam and other dams in the adjoining catchments.
Figure 7.
The methodology adopted for the study.
Figure 8.
Geometry of the dam showing (a) plan or top view, (b) front view or elevation from downstream side, and (c) side view showing the height from the deepest foundation. The salient features are also shown.
The inflow into the reservoir from the upper reservoir and in its own catchment are mainly utilized for power generation, though there is marginal consumptive use such as drinking water supply. The water utilization for power generation and spill through the spillway in the concrete gravity dam of the same reservoir are as per the rule curves. The power generation to meet the peak demand often lowers the reservoir levels during the summer period and until monsoon season arrives by the end of May–beginning of June every year. In deficit monsoon rain years or drought years, the upstream face of the reservoir remains exposed until the +710 m (approx.) level from the top of the dam throughout the year, meaning that the severity of solar radiation and elevated ambient temperature affect the considerably large area of the upstream face of the dam. The upstream face of the dam remains exposed to a maximum of 41 m and a minimum of 23 m from the crest line. Figure 9 shows the maximum and minimum water level as well as exposed upstream depth from the crest from the years 1981 to 2024. This shows that a significant portion of the dam faces experience exposure to sunlight, which, in turn, leads to a temperature load at the boundaries. Figure 10 shows the influence of rainfall on the depletion trend, whereas Figure 11 represents the water utilization trend from the reservoir for power generation.
Figure 9.
The variation in water level to the extremes in the reservoir for the water years 1981 to 2024. The figure illustrates that the variation is very wide in most of the years. (Water year = 1st June to 31st May succeeding year).
Figure 10.
Annual rainfall and extent of exposed upstream face of dam (W.Y., 1981 to 2024).
Figure 11.
Water utilization trend for power generation during the years 2015 to 2025.
The illustrations in Figure 6, Figure 7 and Figure 8 unequivocally reveal that rainfall in successive years, energy demand and water utilization from the storage for generation influence the exposition of the upstream face, which in turn facilitates the heating due to solar radiation and ambient air temperature.
3.6. Numerical Study
In this study, the effect of varying water levels on the behavior of the arch dam was studied. The field monitoring data since the 1st year of operation was collected and analyzed. Simulations were done using ANSYS (version 22.1) software. The dam–rock canyon was modeled as per the actual geometry from the project authorities. The model incorporated vertical contraction joints between the 24 blocks. The contraction joints as well as dam–rock contact were assumed to be bonded contacts to maintain the monolithic nature of the dam structure and for proper thermal conduction between adjacent blocks as well as dam and rock. The joint opening and closing occurring during periodic loading such as earthquakes were not considered to make the analysis less complex and save on computer memory and processing time. It was also assumed that the material behavior was within the elastic range in the loading scenarios considered in this study. No spatial variation in properties of rock was assumed in the simulation. Figure 12 shows the virgin gorge in the canyon rock where the arch dam was built.
Figure 12.
The gorge where the arch dam was subsequently built.
Because of the existence of a sensitive upper reservoir in the same river and often a spill from which is routed to the lower one (Idukki)—the arch dam in this study, being one of the three main dams that facilitate the impoundment—the storage and depletion of the lower reservoir are also sensitive. Series of simulations were done at various reservoir levels without assigning any thermal loads for assessing the deflection pattern or stresses at various salient points including rock abutments. Subsequently, to assess the thermal effects, variation in ambient temperature as per the field observation data was studied. The historic data of field monitoring from the year 1974 showed that average monthly maximum and minimum temperature breached 35 °C and fell below 20°C respectively in several instances. The variation was recorded by the automatic thermometer installed near the top (+731.52 m a.m.s.l.) with a 1 h. interval during 1 January 2000 to 31 December 2024 (Figure 13).
Figure 13.
Temperature recorded by automatic thermometer at +2400 ft. (+731.52 m) level. The continuous observations (drawn on x-axis) at 1 h. intervals are for the period from 1 January 2020 00:00:00 to 31 December 2024 22:00:00. The blue dots appearing at top and bottom are the individual 1 h. readings, which when plotted for a large set of observations clearly depict the maximum and minimum of individual hourly readings. The yellow color is the connecting line, which helps in depicting the range of individual 1-h interval automatic readings.
The ambient environment temperature recorded from the Automatic Weather Station (AWS) for the recent four-year period of 2020–2024 is shown in Figure 14. The highest recorded is 36.61 °C, whereas the lowest recoded is 9.91 °C (Figure 14). The automatic thermometer location along with the cantilever blocks, block joints (which are vertical contraction joints), etc., are shown in Figure 15.
Figure 14.
The continuous plot of environment temperature recorded by the installed AWS for the 4-year duration 2020 to 2024.
Figure 15.
The upstream elevation of the dam showing the dam blocks, block joints (vertical contraction joints) and the thermometer at the crown cantilever. The thermometer at the top is at a +731.52 m level.
3.7. Material Properties
The set for material properties—as per the laboratory tests on the cores taken—for the dam and the canyon rock were sourced from the dam owner. The volumetric weight for the concrete and rock was 0.0245 MN/m3 and 0.025 MN/m3 respectively. The sustained modulus of elasticity for concrete and rock considered for this study was 25 GPa and 21 GPa respectively. The thermal conductivity (in W/m °C) of concrete and rock was 2.65 and 3.1 respectively. Poisson’s ratio for concrete and rock considered was 0.2. The compressive and tensile strength of the aged concrete—as per the lab tests on the cores by the project authorities—were found to be 40 MPa and 2.7 MPa respectively. As part of this study, it was also found that the reduction in the modulus of elasticity of rock (Er) with that of concrete (Ec) does not have a significant impact.
3.8. Meshing and Modeling
In this study, simulations on the arch dam with the contraction joints and abutment rocks were run in ANSYS 2022 R1. The sizes of the 10 nodal tetrahedron elements—used to effectively model the complex geometry, facilitating a good balance between computational time and accuracy—are shown in Table 1. Element types of SOLID291 [57,58] and SOLID187 [57,58] (Figure 16a) totaling 649,468 were used for the coupled steady-state thermal and static structural analyses. Apart from that, CONTA174 [57,58], the 3D 8-Node Surface-to-Surface Contact element; TARGE170 [50,51], the 3D Target Segment element (Figure 16b); and SURF154 [57,58], the 3D Structural Surface Effect element, were used in the simulation.
Table 1.
Sizes of the 10-node tetrahedral elements.
Figure 16.
The meshing was done using standard elements from ANSYS library: (a) SOLID187 element [57,58]. (b) Contact elements [57,58].
The simulations for the steady-state thermal analyses coupled with a static structural analysis used 10-noded tetrahedron elements, SOLID187 and SOLID291. The total number of nodes was 959,506, and the total number of elements used for the dam–canyon rock model was 780,923, which comprised 649,468 solid elements and 131,455 contact elements. A finer mesh was used near the inspection gallery areas in the dam. Finer meshing was also adopted at the contact area between the am and rock. Figure 17 shows the meshing for the dam–rock integrated model.
Figure 17.
The dam–rock meshed model (view from upstream). A fine mesh size was adopted for dam elements. The elements were made finer toward the dam–rock interface. The overall dam–rock model size is 1120 m (transverse) × 519 m (vertical) × 450 m (flow direction).
4. Results and Discussion
The principal objective of the study was to ascertain whether double-curvature thin arch dams are significantly affected by the extremities of temperature. The studied high arch dam with a base thickness/height ratio (tb/h) of 0.144 is a true representative of its kind. As per the FEM simulations with the reservoir water and no temperature loads, the dam deflects in the radial downstream directions. The maximum movement occurs in the crown cantilever block, and it is 28.185mm in the radial downstream (X) direction at 33.40 m from the top when the reservoir level is at the dam top level, i.e., +736.09 m a.m.s.l. Though the crown cantilever experiences downstream deflection from top to bottom, the blocks near abutments experience deflection in the upstream direction (Figure 18a,b). It is also found that both the tensile and compressive stresses at the dam body are far below the tensile strength (2.7 MPa) and compressive strength (40 MPa) of concrete. Almost the entire upstream face, except very near the top, experience compressive stress, whereas the downstream face and a very small band near the crest experience tensile stresses less than 0.50 MPa. A line of tensile stress is found to occur at the heel in dam–rock contact area.
Figure 18.
(a) The dam deflects in the radial X-direction at the central cantilevers, whereas the deflection of the blocks near abutments are toward upstream. Maximum radial deflection is 28.185 mm. (b) Deflection of crown cantilever at varying water load levels up to FRL. The block experiences radial downward movement from top to bottom.
The principal stresses are also not alarming, though cases of tensile stresses occur in the downstream face, crest and a line of contact area (heel) of the dam (Figure 19a,b).
Figure 19.
(a) The principal stress at the downstream face is less than 0.5 MPa in the d/s face, while higher values of tensile stress occur at the contact area (heel). (b) The principal stress at the upstream face is less than 0.5 MPa in the d/s face, while higher values of tensile stress occur at the contact area (heel).
These results may apparently lead to an interpretation that the arch dam can withstand even unprecedented flooding, which would not cause overtopping as there is better reservoir control through rule curves and efficient spilling arrangement, with no safety concerns. The model test and FEM analyses conducted by the project authorities before implementation of the project also showed radial deflection in the downstream direction and stresses within limits or not exceeding levels of concern. The dam was completed in 1974, and the project phase I was commissioned in 1975. During the initial service period of the dam, the deflection was in the radial downstream direction and was periodic. But it appeared that the effect of temperature loads simultaneously acting with varying water levels were not often given the necessary due diligence. The study revealed that there are possibilities of unusual effects resulting from heating of the dam body from exposure of the dam faces.
From the latter half of the 1980s the dam showed upstream movement too, and later the deflection showed a continuing trend of upstream movement. This peculiar characteristic of the arch dam also necessitated an investigation on the influence of the temperature load at varying water loads.
4.1. Effect of Temperature Variations
The primary objective of this study was to investigate the influence of extreme thermal loading on the structural response of the double-curvature thin concrete arch dam and to assess the effectiveness of the rehabilitation measures in alleviating potentially detrimental thermo-structural effects. A fully coupled transient thermal analysis which incorporated the complete heating and cooling cycles would be a more representative simulation of the actual thermal regime, but it would require the accurate characterization of numerous spatiotemporally varying parameters, including solar radiation, ambient air temperature, convective heat transfer, surface emissivity, anisotropic thermal properties of concrete, and reservoir–structure heat exchange, etc. The associated uncertainty in defining these parameters, together with the substantially increased computational demand, may necessitate a more elaborate numerical representation, even then without necessarily providing a commensurate increase in the reliability of the predicted structural response. The transient solution would also therefore remain dependent on several idealized assumptions and estimated thermal boundary conditions rather than representing the exact in situ thermal state.
Accordingly, the present study adopted a conservative steady-state thermal loading—a simplified approach—in which the exposed concrete surfaces are assigned with extreme temperature conditions corresponding to the resulting combined influence of intense solar radiation, elevated ambient air temperature and other heating/cooling processes. This idealization substantially reduces the complexity in defining the thermal boundary-condition and the associated computational demand. This simplified methodology enables direct assessment of the structural response in a critical thermal state with much ease. The analysis further assumes that at a given critical instant, the exposed concrete surface attains the specified extreme temperature, while the magnitude of the thermal disturbance progressively attenuates spatially into the dam body owing to the heat-transfer characteristics of concrete. Consequently, the analysis represents a limiting thermal condition intended to evaluate the dam response under an extreme rather than an average or time-history-dependent thermal regime. An analogous limiting condition was adopted for the low-temperature scenario to assess the corresponding structural response.
This idealization in the present study is particularly relevant for thin arch dams located in regions near the equator, where prolonged and intense solar exposure during the summer season can result in substantial heating of the exposed concrete surfaces. Under such environmental conditions, the development of elevated surface temperatures represents a physically plausible thermal loading state rather than a purely hypothetical boundary condition. Accordingly, the methodology adopted is based on a rational and computationally efficient evaluation of structural response of the dam in critical thermal states while avoiding the complexities and estimations associated with the reconstruction of the complete transient thermal history. The resulting predictions are consequently considered to provide a technically defensible and reasonably conservative estimate of the dam’s thermo-structural response under extreme environmental conditions.
Based on the field temperature data collected from the project and the project archives, it was found that the dam experiences a temperature fluctuation from 20 °C to 35 °C. These temperatures are assigned as boundary conditions.
Water levels often reach maximum during the rainy or monsoon season. Monsoon season in the south-west and north-east is from 1st June to 30th November each year, during which period a general temperature drop occurs. However, there can be intervals in the monsoon rains that may result in a rise in temperature, whereas in summer, which extends up to the end of the month of May each year, solar radiation and ambient temperature are high, and the reservoir water generally recedes to the lowest level. These fluctuations in the water level along with corresponding temperature variation are very intrinsic and intricate. The influence of temperature at the intrados (Tintrados) as well as the exposure upstream face depth (Hexposure) at the extrados face were evaluated through the simulations. In Figure 20, it can be seen that Tintrados = 20 °C and Hexposure = 3.66 m. This scenario is expected to occur only during monsoon or rainy season based on the historical data of storage. The results of the simulation for the full dam and low temperature load cases in deflection and stresses were compared and are given in Table 2. On the other hand, the fluctuation in reservoir levels and thermal loads are significant during the non-rainy/non-monsoon summer months. As the demand for power generation often soars during these periods, the water level often decreases. In order to identify the critical scenario of the coupled effect, the temperature at the intrados, Tintrados, varied from 35 °C to 30 °C, while the water level reached +694.94 m, i.e., exposure depth (Hexposure) = 41.15 m (Figure 21). The simulation results for such load coupling—the dam body experiencing a raised temperature—are illustrated in Table 3.
Figure 20.
Loading diagram: Dam full and low temperature load case. Dam during a rainy/monsoon season when the water level is at the FRL. The entire intrados is assumed to experience 20 °C, and the water level is assumed to be at the full reservoir level (FRL) for simulation.
Table 2.
Comparison of effect of introducing temperature conditions as per Figure 16.
Figure 21.
Loading diagram: Dam at low water level and high temperature load case. This condition normally occurs during summer when the demand of power is high.
Table 3.
The influence of variation in temperature on deflection (maximum temperature).
The results show that when the dam experiences maximum inflow—rainy/monsoon season during which time temperatures are minimum—the dam experiences deflection in the radial downstream direction, and stresses at all salient points are not at a concerning level. Figure 22, Figure 23, Figure 24 and Figure 25 show the extreme stresses developing in the dam in such loading scenarios, whereas during summer—when there is maximum depletion due to peak demand of stored water and maximum solar radiation reaching dam faces and an increased ambient air temperature, meaning that exposed dam surfaces heat up—the thin structure is found to deflect toward the reservoir and also develop tensile stresses in the dam body and abutments. The tensile stresses developing in the dam body are addressed to a certain extent by the opening of the contraction joints; however, they are a concern in the horizontal direction due to their potential for the opening of lift joints and formation of horizontal cracks. Development of large tensile stresses and non-functioning of contraction joints to the extent envisaged in design would lead to cracks in dam body. Large tensile stresses at abutments are a cause of cracks and may become a potential cause of the opening of the interface between rock and the dam body and local destabilization of rock. Hence, heating of the exposed dam body is harmful and detrimental to the dam, which is a concern from a safety perspective.
Figure 22.
The maximum principal stress plot for the temperature, minimum case. The water face generally experiences compressive stresses, and a small portion at the heel experience tension.
Figure 23.
The maximum principal stress plot for the temperature, minimum case. The contour shows that the downstream faces and abutments experience tensile stresses.
Figure 24.
Minimum principal stress results for the temperature, minimum case. Almost the entire dam body experiences compressive stress.
Figure 25.
3D view of the stress contour for minimum principal stress for the temperature, minimum case. Almost the entire dam body including the abutments rocks experiences compressive stress.
FEM simulations for various loadings involving reservoir water and temperature of normal operating conditions and extreme scenarios involving the temperature loads arising during operational life were evaluated in order to draw conclusions. These loading scenarios arising from reservoir operations were simulated with the elastic properties of the materials, which often gives conclusive results and indications for decision making. The dam behavior obtained from FEM simulations corroborates well with the monitoring data. Figure 26a–d depict the stresses for T = 31 °C (Table 3 and Table 4).
Figure 26.
(a) X-direction displacement: dam, (b) X-directional deformation: crown cantilever, (c) maximum principal stress, (d) minimum principal stress for T = 31 °C.
Table 4.
Influence of variation in temperature on stresses (maximum temperature case).
When the water level recedes, along with the intrados face, the exposed extrados face is subjected to direct sunlight. Continuous exposure to sun in the hot summer and the resulting solar radiation as well as elevated ambient environment temperature cause these faces to experience a higher temperature. These elevated temperatures at the boundaries are found to cause upstream deflections and elevated tensile stresses at salient points of the dam and the dam–rock interface.
The study is successful in revealing that the structure is efficient in its elastic behavior. When the water level is maximum—which generally occurs during the low-temperature monsoon season—the deflection is toward the stream direction, whereas it reverses when the water level is depleted. The low water level and high temperature cause the dam to deflect in the reverse direction. The analyses of historical instrumentation data revealed that the dam deflected back and forth from the beginning.
The present study emphasizes the impact of temperature loads on arch dams and supports the conclusion of various previous studies in general terms. The numerical study conducted on the Jinping-I super high double-curvature arch dam concluded that the solar radiation effect alone causes 3.84 mm deflection upstream due to continuous exposure on sunny summer days [59], and the impact of solar radiation is to be considered for analyzing the temperature deformation. Studies on the Dez arch dam concluded that thermal loads/solar radiation is to be considered in the analyses as neglecting solar radiation would give erroneous results [60,61]. The present study incorporated the temperature boundary conditions as surface temperature loads resulting from the solar radiation and ambient air temperature, etc., to analyze the effects.
Tensile stresses occurring in arch dams deserve attention as they are a potential cause of cracks. The vertical contraction joints may lessen their impact due to the special behavior of joint opening and closing. If the efficacy of joints is reduced for any reason, the scenario may change. Similarly, during elevated temperatures, the behavior of the arches tending to expand between the restrained abutments is also a concern, resulting in the envisaged mechanism being a complex one. Though the joints facilitate flexibility in the arch direction, the presence of tensile stress at the cantilevers cannot be eliminated. This concerns horizontal lift joints and abutment interface joints as well. However, this study assumed the joints to be bonded in order to facilitate the conduction of the heat as discontinuity between two contact surfaces would not truly simulate heat transfer. From the monitoring data of joint meters analyzed, these joints are found to be functioning, and joint opening was recorded. The opening of the two joints adjacent to the crown block (block 1)—the joint between blocks 1 and 2 (joint 1/2) and joint between blocks 1 and 3 (joint 1/3)—observed during the year 2023 at various water levels is plotted and shown in Figure 27, Figure 28 and Figure 29. However, this is not so when the tensile stresses affect the horizontal lift joints. The unusual tensile stresses may cause continuous horizontal cracks in the arch dam body and may threaten the safety of the existing dam and cause its failure. The increase in ambient temperature through solar radiation and the resulting increase in the body temperature during higher exposure depth conditions are causes of large tensile stresses and hence need to be controlled.
Figure 27.
Joint opening of two adjacent block joints at bottom gallery level (+579.12 m above m.s.l.).
Figure 28.
Joint opening of two adjacent block joints at middle gallery level (+640.08 m a.m.s.l.).
Figure 29.
Joint opening of two adjacent block joints at top gallery level (+701.04 m a.m.s.l).
4.2. Influence of Inspection Galleries
Arch dams are generally constructed with horizontal galleries of respective designated sizes at various levels to meet objectives, viz., facilitating the inspection and monitoring in addition to the advantages during construction time, etc. In this study case there are three horizontal galleries at designated levels. Simulations were done in models with and without galleries. Galleries were modeled with refined meshes around them to achieve better results. It is found that the horizontal galleries have only a marginal influence on the deflection behavior of the dam. The deflection in the radial downstream and upstream directions increase only in very small values, whereas in the case of stresses, the values are observed to be on the conservative side at salient points of the dam. All the simulations with temperature loads were done incorporating horizontal galleries. Table 5 outlines certain pertinent results to illustrate the influence of galleries, with the water level at the full reservoir level (FRL) and when the dam experiences temperatures, toward minimum.
Table 5.
Effects of horizontal inspection galleries on the response of the dam.
4.3. Efficacy of Mitigation Measures
Adverse scenarios of exposure conditions can be minimized by rehabilitation measures. The temperature increase of the dam body is the direct result of exposure and heat absorption. Painting with white reflective coating (Figure 30) is a practical mitigation measure for controlling the adverse boundary condition for thermal loading and was adopted for the case structure to rehabilitate it from adverse effects. Analysis of the historical data from the instrumentation and field monitoring clearly depicts the effect of rehabilitation. Both the data from pendulum readings and crest collimation survey were relied on to interpret the efficacy of the practical mitigation measure adopted. The reflective coating applied on the entire intrados face of the dam was found to be effective in checking the heating of the surface exposed to ambient temperature and solar radiation.
Figure 30.
White reflective coating applied on the entire intrados face of the dam.
4.4. Analysis of Instrumentation Data
The instrumentation data—obtained after the reflective coating on the entire intrados surface during the period 2016– 2017—showed favorable results. The stress meters and strain meter readings could not be relied upon as many of these instruments installed during construction became dysfunctional, and reliability was uncertain. This restricted the study to the analyses of deflection from the pendulum’s readings and crest collimation surveys. The interpretation in causative terms of the reduction in deflection of the cantilever blocks showed a reversing trend. The monitoring results of pendulum readings and crest collimation underscored this interpretation (Figure 31). Figure 32 shows this stabilizing or reversing trend more vividly after the year 2017, which can be attributed to the reduction in heating of dam surfaces, a result of the reflective coating on the intrados face. Similar analysis with respect to the deflections monitored through pendulum readings also gave the same trends before and after rehabilitation but with higher values. The maximum deflection from pendulum observations of 45.7 mm and a maximum of 36.2 mm is observed through crest collimation, both toward upstream.
Figure 31.
Movement (deflection) of blocks 1, 7 and 8 in the radial direction as per the field monitoring data of crest collimation. The positive values of deflection of the dam show a movement toward the reservoir direction (toward upstream). All these three blocks show similar trends. It can be seen that the dam after the early 1990s started its movement upstream.
Figure 32.
The reversing or stabilizing trend in deflection of blocks 1, 7 and 8 commencing in the year 2017, a notable change in behavior from their continuing upstream deflections in the past.
The mitigation measures to rehabilitate and reduce heating of the dam body were found to be effective as evidenced by the analysis of crest collimation results as shown in Table 6, for blocks 1, 7 and 8. A maximum reduction in deflection of 14.87% was found for block 1. The pendulum readings also showed a reduction in deflection but to a lesser extent. But, in either case, it was evident that the continuous trend of peak upstream movement showed a reversing or stabilizing trend after the rehabilitation work, which is credible.
Table 6.
Decrease in the deflection after rehabilitation measures.
5. Conclusions
The study was primarily directed toward assessing the effect of temperature loads on the double-curvature thin concrete arch dam and evaluating whether the structure responds to the measures taken to check the heating of the exposed surface. The authors relied on extensive simulations as well as analyses of large volumes of field monitoring data from the instrumentation deployed. From the FEM simulations coupled with the interpretations of the continuous field monitoring data, the authors arrived at some valuable inferences, which are listed as follows:
- The analyses of thin concrete arch dams should invariably include temperature loads in the various load combinations for design as well as safety evaluations at any instant in the service life. Inclusion of temperature boundary conditions brings has a significant effect on deflection and the development of stresses—especially, tensile stresses—within dam body and dam–rock contact areas.
- Heating of the dam surfaces in summer and the high-demand period of the stored water causes dam to deflect upstream and produce tensile stresses. It is found that the crown cantilever of the dam can deflect up to 40.44 mm upstream if the exposed dam surface uniformly experiences a maximum temperature of 35 °C and the reservoir is depleted to a depth of 41.15 m from the top. High temperature at the intrados face of the dam and high depth of depletion are causes of high tensile stresses in the dam body and certain areas of contacts at the heel.
- The dam continues with its elastic behavior of moving back and forth in the radial direction. The deflection of the dam is toward the stream direction at high water levels and reverses as the reservoir water level depletes, which generally occurs during summer when temperature has an increasing trend.
- A more precise effect of heating of dam surfaces can be ascertained if the temperature is applied at the boundary as per the actual spatial distribution, which is possible through a network of thermometers and readings from them. A transient thermal analysis with temperature loads from this spatial distribution would give more accurate distribution of stresses and deflection pattern.
- Though vertical contraction joint opening may reduce the effect of tensile stress due to temperature loads, the development of high tensile stress is a potential cause for concern with respect to the development of horizontal cracks in the dam body, which may lead to health risks to the dam. The study identified that horizontal cracks can occur at locations near upper gallery, where tensile stresses are predominantly observed.
- The horizontal galleries have only a minimal effect on deflection and stresses developing elsewhere in the dam body.
- Rehabilitation measures such as reflective coating in the entire exposed areas of the dam in its downstream and upstream face reduce the unfavorable deflections in the upstream directions and the development of undesirable scenarios, including the development of detrimental tensile stresses at salient locations of the dam body and contacts.
- Continuous monitoring of the behavior of the dam in response to all critical loadings, especially temperature loads, is essential for the health and safety of the aging dam.
Author Contributions
J.P.K.P.: conceptualization, problem identification, investigation, data collection and curation, methodology, formal analysis, use of software, validation, draft and final manuscript; P.N.; problem identification and review, supervision, refinement of objectives, review of methodology, research design, review of analysis results, validation, visualization, editing the draft manuscript; S.G.T.: conceptualization, methodology and modification refinement of research problem, finalizing objectives, supervision, data collection, review of results. All authors have read and agreed to the published version of the manuscript.
Funding
This research received no external funding.
Data Availability Statement
Restrictions apply to the availability of these data. Required data were obtained from Kerala State Electricity Board Limited. No new data were created or analyzed in this study.
Acknowledgments
The authors are grateful to the Kerala State Electricity Board Limited for facilitating with various data including the instrumentation field data.
Conflicts of Interest
The authors declare no conflicts of interest.
Abbreviations
The following abbreviations are used in this manuscript:
| a.m.s.l. | Above Mean Sea Level |
| ASDSO | Association of State Dam Safety Officials, USA |
| AWS | Automatic Weather Station |
| CWC | Central Water Commission, India |
| DDM | Data-Driven Model |
| DL, HL, TL | Dead Load (Gravity Loading), Hydrostatic Load, Thermal (Temperature) Load |
| DRIP | Dam Rehabilitation and Improvement Project, India |
| FEM | Finite Element Method |
| FEMA | Federal Emergency Management Agency, USA |
| FERC | Federal Energy Regulatory Commission, USA |
| FRL | Full Reservoir Level |
| Ft./ft. | Foot/feet = 0.3048 m |
| GPa | Gigapascal |
| GRanD | Global Reservoir and Dam Database |
| IBRD-IDA | International Bank for Reconstruction and Development–International Development Association (The World Bank, Washington DC) |
| ICOLD | International Commission on Large Dams |
| MPa | Megapascal |
| PBM | Process-Based Model |
| PFM | Potential Failure Mode |
| USBR | The Bureau of Reclamation, United States |
| w.r.t. | With respect to |
| W.Y. | Water Year |
References
- Perera, D.; North, T. The Socio-Economic Impacts of Aged-Dam Removal: A Review. J. Geosci. Environ. Prot. 2021, 9, 62–78. [Google Scholar] [CrossRef]
- Vörösmarty, C.J.; McIntyre, P.B.; Gessner, M.O.; Dudgeon, D.; Prusevich, A.; Green, P.; Glidden, S.; Bunn, S.E.; Sullivan, C.A.; Liermann, C.R.; et al. Global threats to human water security and river biodiversity. Nature 2010, 467, 555–561. [Google Scholar] [CrossRef] [Scilit] [PubMed]
- Berga, L.; Buil, J.M.; Bofill, E.; De Cea, J.C.; Perez, J.A.G.; Mañueco, G.; Polimon, J.; Soriano, A.; Yagüe, J. (Eds.) Dams and Reservoirs, Societies and Environment in the 21st Century: Proceedings of the International Symposium on Dams in the Societies of the 21st Century, ICOLD-SPANCOLD, 18 June 2006, Barcelona, Spain; Taylor & Francis Group: London, UK, 2006; Volume 1. [Google Scholar]
- Schmitt, R.J.P.; Rosa, L. Dams for hydropower and irrigation: Trends, challenges, and alternatives. Renew. Sustain. Energy Rev. 2024, 199, 114439. [Google Scholar] [CrossRef] [Scilit]
- The Global Reservoir and Dam Database. Available online: https://www.globaldamwatch.org/grand#h.kj7xnajgl0sy (accessed on 21 January 2026).
- Lehner, B.; Liermann, C.R.; Revenga, C.; Vörösmarty, C.; Fekete, B.; Crouzet, P.; Döll, P.; Endejan, M.; Frenken, K.; Magome, J.; et al. High-resolution mapping of the world’s reservoirs and dams for sustainable river-flow management. Front. Ecol. Environ. 2011, 9, 494–502. [Google Scholar] [CrossRef] [Scilit]
- Werner, M.; Mohamed, Y. Dams at Increasing Danger of Collapse Due to Climate Change and Conflict. IHE Delft Institute for Water Education. Available online: https://www.un-ihe.org/news/dams-increasing-danger-collapse-due-climate-change-and-conflict (accessed on 19 January 2026).
- Zarfl, C.; Berlekamp, J.; He, F.; Jähnig, S.C.; Darwall, W.; Tockner, K. Future large hydropower dams impact global freshwater megafauna. Sci. Rep. 2019, 9, 18531. [Google Scholar] [CrossRef] [Scilit] [PubMed]
- He, F.; Zarfl, C.; Tockner, K.; Olden, J.D.; Campos, Z.; Muniz, F.; Svenning, J.C.; Jähnig, S.C. Hydropower impacts on riverine biodiversity. Nat. Rev. Earth Environ. 2024, 5, 755–772. [Google Scholar] [CrossRef] [Scilit]
- World Bank Group Supports Sustainable Hydropower Development in Bhutan with Innovative Financing Package. Press Release. 22 January 2026. Available online: https://www.worldbank.org/en/news/press-release/2026/01/22/world-bank-group-supports-sustainable-hydropower-development-in-bhutan-with-innovative-financing-package (accessed on 17 April 2026).
- ICOLD-CIGB. World Register of Dams. Available online: https://www.icold-cigb.org/GB/publications/world_register_of_dams.asp (accessed on 12 April 2026).
- National Register of Large Dams, Central Water Commission, India. September 2023. Available online: https://cwc.gov.in/national-register-large-dams (accessed on 12 April 2026).
- Billington, D.P.; Jackson, D.C. Big Dams of the New Deal Era: A Confluence of Engineering and Politics; University of Oklahoma Press: Norman, OK, USA, 2006. [Google Scholar]
- Pedro, J.O. Safety and Performance of Arch Dams. In Arch Dams; Pedro, J.O., Ed.; International Centre for Mechanical Sciences; Springer: Vienna, Austria, 1999; Volume 367. [Google Scholar] [CrossRef] [Scilit]
- USBR. Design of Arch Dams, Design Manual for Concrete Arch Dams; United States Department of the Interior, Bureau of Reclamation: Denver, CO, USA, 1977. Available online: https://damtoolbox.org/images/3/3b/Design_of_Arch_Dams.pdf (accessed on 20 April 2026).
- Akbari, J.; Ahmadi, M.T.; Moharrami, H. Advances in concrete arch dams shape optimization. Appl. Math. Model. 2011, 35, 3316–3333. [Google Scholar] [CrossRef] [Scilit]
- Conde, A.; Toledo, M.Á.; Salete, E. Cracks in Arch Dams: An Overview of Documented Instances. Appl. Sci. 2024, 14, 7580. [Google Scholar] [CrossRef] [Scilit]
- Lin, P.; Ning, Z.; Shi, J.; Liu, C.; Chen, W.; Tan, Y. Study on the gallery structure cracking mechanisms and cracking control in dam construction site. Eng. Fail. Anal. 2021, 121, 105135. [Google Scholar] [CrossRef] [Scilit]
- Hariri-Ardebili, M.A. Risk, Reliability, Resilience (R3) and beyond in dam engineering: A state-of-the-art review. Int. J. Disaster Risk Reduct. 2018, 31, 806–831. [Google Scholar] [CrossRef] [Scilit]
- Moreno-Rodenas, A.; Mantilla-Jones, J.D.; Valero, D. Age, climate and economic disparities drive the current state of global dam safety. Nat. Water 2025, 3, 284–295. [Google Scholar] [CrossRef] [Scilit]
- Suresh, G. A Study of the Structural Behaviour of Idukki Arch Dam. Master’s Thesis, Water Resources Development and Management, University of Roorkee, Roorkee, India, December 1996. Available online: http://shodhbhagirathi.iitr.ac.in:8081/jspui/handle/123456789/4788?mode=full (accessed on 16 March 2026).
- Chouinard, L.E.; Bennett, D.W.; Feknous, N. Statistical Analysis of Monitoring Data for Concrete Arch Dams. J. Perform. Constr. Facil. 1995, 9, 286–301. [Google Scholar] [CrossRef] [Scilit]
- The Association of State Dam Safety Officials (ASDSO), USA. Available online: https://damfailures.org/glossary (accessed on 17 April 2026).
- FERC. Engineering Guidelines for the Evaluation of Hydropower Projects, Chapter 17, Potential Failure Mode Analysis; Federal Energy Regulatory Commission: Washington, DC, USA, 2021. Available online: https://www.ferc.gov/industries-data/hydropower/dam-safety-and-inspections/eng-guidelines (accessed on 25 April 2026).
- Lewis, L.A. (Ed.) Selecting Analytic Tools for Concrete Dams Address Key Events Along Potential Failure Mode Paths; FEMA P-1016 Manual; Federal Emergency Management Agency: Washington, DC, USA, 2014.
- International Water Power and Dam Construction. When the Dams Broke: Uncovering the Lessons of Libya’s Storm Daniel Tragedy. 17 September 2025. Available online: https://www.waterpowermagazine.com/analysis/when-the-dams-broke-uncovering-the-lessons-of-libyas-storm-daniel-tragedy/ (accessed on 18 April 2026).
- Armon, M.; Shmilovitz, Y.; Dente, E. Anatomy of a foreseeable disaster: Lessons from the 2023 dam-breaching flood in Derna, Libya. Sci. Adv. 2025, 11, eadu2865. [Google Scholar] [CrossRef] [Scilit] [PubMed]
- Tao, Z.; Liu, Y.; Yang, Q.; Wang, S. Study on the nonlinear deformation and failure mechanism of a high arch dam and foundation based on geomechanical model test. Eng. Struct. 2020, 207, 110287. [Google Scholar] [CrossRef] [Scilit]
- Chen, Z.T. Risk-Based Research on Failure Mode of High-Arch Concrete Dam. In Key Engineering Materials; Trans Tech Publications Ltd.: Wollerau, Switzerland, 2008; Volumes 385–387, pp. 269–272. [Google Scholar] [CrossRef] [Scilit]
- ICOLD. Selecting Seismic Parameters for Large Dams; ICOLD Bulletin No. 148; ICOLD: Paris, France, 2011. [Google Scholar]
- Wang, J.-T.; Lv, D.-D.; Jin, F.; Zhang, C. Earthquake damage analysis of arch dams considering dam–water–foundation interaction. Soil Dyn. Earthq. Eng. 2013, 49, 64–74. [Google Scholar] [CrossRef] [Scilit]
- Amin, M.; Salamon, J.; Mazza, G.; Tosun, H.; Xu, B. Advances in Dam Engineering. Infrastructures 2020, 5, 39. [Google Scholar] [CrossRef] [Scilit]
- Wang, J.; Zhang, C.; Jin, F. Chapter 14—Nonlinear Earthquake Analysis of High Arch Dam–Water–Foundation Rock Systems. In Seismic Safety Evaluation of Concrete Dams; Zhang, C., Jin, F., Wang, J., Xu, Y., Eds.; Butterworth-Heinemann: Oxford, UK, 2013; pp. 311–340. [Google Scholar] [CrossRef] [Scilit]
- Zhang, C.; Jin, F. Chapter 3—Seismic Safety Evaluation of High Concrete Dams. In Proceedings of the 14th World Conference on Earthquake Engineering, Beijing, China, 12–17 October 2008. [Google Scholar]
- Wittke, W.; Leonards, G. Modified hypothesis for failure of the Malpasset Dam. Eng. Geol. 1987, 24, 407–421. [Google Scholar] [CrossRef] [Scilit]
- Tang, R.; Zhang, J.; Wang, Y.; Zhang, X. Study on the Basic Form of Reservoir Operation Rule Curves for Water Supply and Power Generation. Water 2024, 16, 276. [Google Scholar] [CrossRef] [Scilit]
- Ilich, N. Dynamic reservoir rule curves—Their creation and utilization. J. Hydrol. X 2023, 22, 100166. [Google Scholar] [CrossRef] [Scilit]
- Ak, M.; Kentel, E.; Savasaneril, S. Operating policies for energy generation and revenue management in single-reservoir hydropower systems. Renew. Sustain. Energy Rev. 2017, 78, 1253–1261. [Google Scholar] [CrossRef] [Scilit]
- United States Department of the Interior, Bureau of Reclamation. Design Criteria for Concrete Arch and Gravity Dams; Engineering Monograph No. 19; United States Department of the Interior, Bureau of Reclamation: Washington, DC, USA, 1977; pp. 1–15.
- Sheibany, F.; Ghaemian, M. Thermal Stress Analysis of Concrete Arch Dams Due to Environmental Action. In Proceedings of the ASME 2004 International Mechanical Engineering Congress and Exposition. Heat Transfer, Anaheim, California, USA, 13–19 November 2004; ASME: New York, NY, USA, 2004; Volume 1, pp. 393–402. [Google Scholar] [CrossRef] [Scilit]
- Bofang, Z. Prediction of water temperature in deep reservoir. Dam Eng. 1997, 8, 13–25. [Google Scholar]
- Chapra, S.C. Surface Water Quality Modeling; Waveland Press, Inc.: Long Grove, IL, USA, 1998; pp. 560–589. [Google Scholar]
- Wang, L.; Xu, B.; Zhang, C.; Fu, G.; Chen, X.; Zheng, Y.; Zhang, J. Surface water temperature prediction in large-deep reservoirs using a long short-term memory model. Ecol. Indic. 2021, 134, 108491. [Google Scholar] [CrossRef] [Scilit]
- Kim, S.; Chung, S. Enhancing Water Temperature Prediction in Stratified Reservoirs: A Process-Guided Deep Learning Approach. Water 2023, 15, 3096. [Google Scholar] [CrossRef] [Scilit]
- Malm, R.; Hellgren, R.; Enzell, J. Lessons Learned Regarding Cracking of a Concrete Arch Dam Due to Seasonal Temperature Variations. Infrastructures 2020, 5, 19. [Google Scholar] [CrossRef] [Scilit]
- Malm, R.; Hassanzadeh, M.; Hellgren, R. (Eds.) Proceedings of the 14th ICOLD International Benchmark Workshop on Numerical Analysis of Dams; KTH Civil and Architectural Engineering, KTH: Stockholm, Sweden, 2018. [Google Scholar]
- Li, H.; Fu, S.; Li, G.; Hu, G. FEA of Effects Induced by Diurnal Temperature Variation on Downstream Surface of Xiaowan Arch Dam. Adv. Civ. Eng. 2020, 2021, 6300387. [Google Scholar] [CrossRef] [Scilit]
- Hutton, D.V. Fundamental of Finite Element Analysis, 1st ed.; Elizabeth A. Jones Ltd.: Houston, TX, USA; McGraw-Hill Companies: New York, NY, USA, 2004. [Google Scholar]
- Holman, J.P. Heat Transfer, 10th ed.; McGraw-Hill Companies: New York, NY, USA, 2010. [Google Scholar]
- Federal Emergency Management Agency (FEMA). Federal Guidelines for Dam Safety, Hazard Potential Classification System for Dams; U.S. Department of Homeland Security Federal Emergency Management Agency: Washington, DC, USA, 2004.
- Central Water Commission. Guidelines for Classifying the Hazard Potential of Dam; Doc. No. CDSO_GUD_DS_09_v1.0; Ministry of Jal Shakti, Department of Water Resources, River Development & Ganga Rejuvenation, Government of India: New Delhi, India, 2023.
- ICOLD-CIGB. Flood Evaluation and Dam Safety; Bulletin 170; ICOLD-CIGB: Paris, France, 2018; Available online: https://www.icold-cigb.org (accessed on 10 August 2026).
- Central Water Commission. Guidelines for Safety Inspection of Dams; Doc. No. CDSO_GUD_DS_07_v1.0; Ministry of Jal Shakti, Department of Water Resources, River Development & Ganga Rejuvenation, Government of India: New Delhi, India, 2018.
- IBRD-IDA. Good Practice Note on Dam Safety, 1st ed.; International Bank for Reconstruction and Development: Washington, DC, USA, 2020; Available online: https://documents1.worldbank.org/curated/en/376861619156795223/pdf/Good-Practice-Note-on-Dam-Safety.pdf (accessed on 10 August 2026).
- The Federal Emergency Management Agency (FEMA). Federal Guidelines for Dam Safety; FEMA P-93; U.S. Department of Homeland Security: Washington, DC, USA, 2023.
- Central Water Commission. Guidelines for Instrumentation of Large Dams; Doc. No. CDSO_GUD_DS_02_v1.0; Ministry of Jal Shakti, Department of Water Resources, River Development & Ganga Rejuvenation, Government of India: New Delhi, India, 2018.
- Ansys Element Library. Chapter 13, Mechanical APDL Theory Reference. Available online: https://ansyshelp.ansys.com/public/account/secured?returnurl=/Views/Secured/corp/v242/en/ans_thry/thy_elemlib.html (accessed on 16 May 2026).
- Ansys Element Library. Chapter 7, Element Reference. Available online: https://ansyshelp.ansys.com/public/account/secured?returnurl=/Views/Secured/corp/v242/en/ans_elem/Hlp_E_SOLID291.html (accessed on 16 May 2026).
- Shao, C.; Zheng, S.; Gu, C.; Tian, S.; Gu, H.; Xu, Y.; Wang, Y. Numerical Analysis of Temperature Deformation Characteristics for Super-High Arch Dams considering Solar Radiation Effects. Struct. Control Health Monit. 2023, 1, 2123241. [Google Scholar] [CrossRef] [Scilit]
- Mirzabozorg, H.; Hariri-Ardebili, M.; Shirkhan, M. Impact of Solar Radiation on the Uncoupled Transient Thermo-Structural Response of an Arch Dam. Sci. Iran. 2015, 22, 1435–1448. [Google Scholar]
- Mirzabozorg, H.; Hariri-Ardebili, M.A.; Shirkhan, M.; Seyed-Kolbadi, S.M. Mathematical Modeling and Numerical Analysis of Thermal Distribution in Arch Dams considering Solar Radiation Effect. Sci. World J. 2014, 1, 597393. [Google Scholar] [CrossRef] [Scilit] [PubMed]
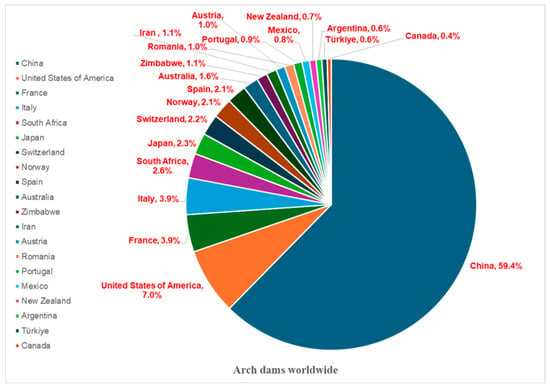
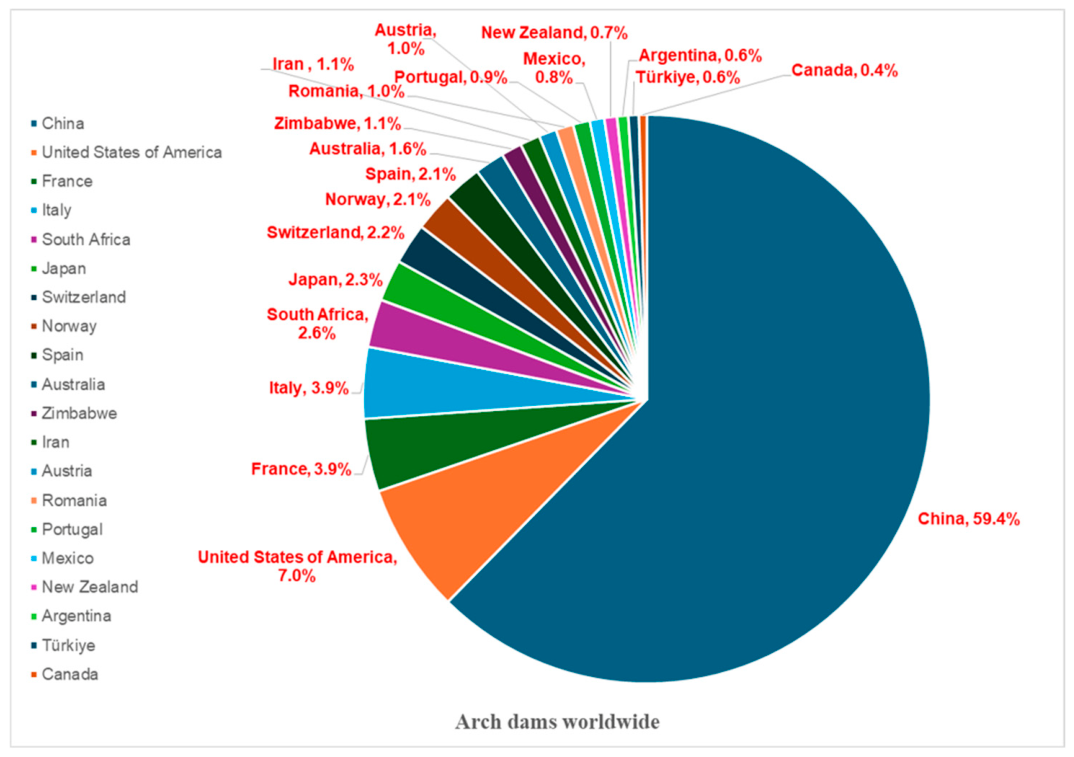
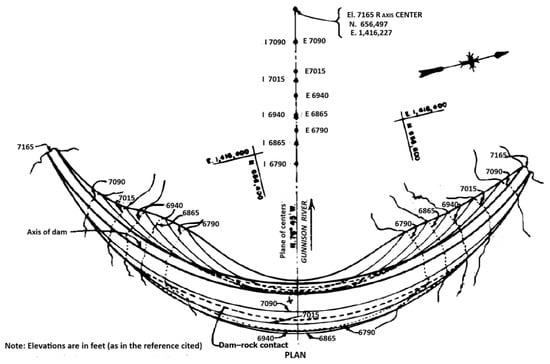
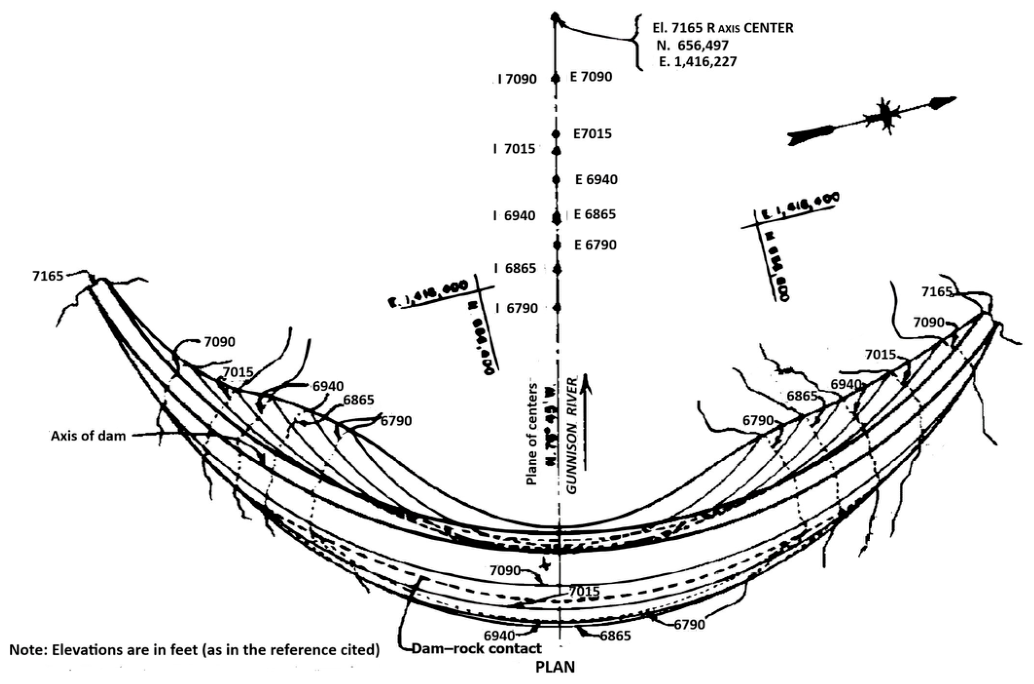
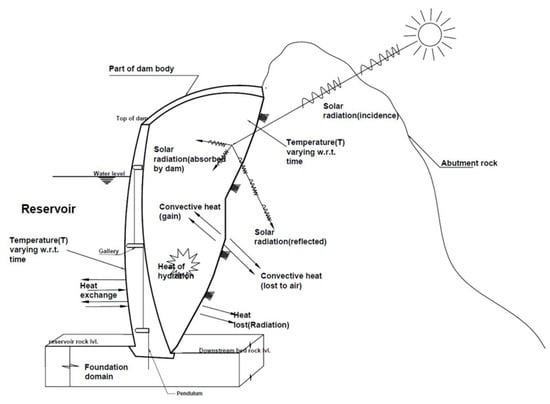
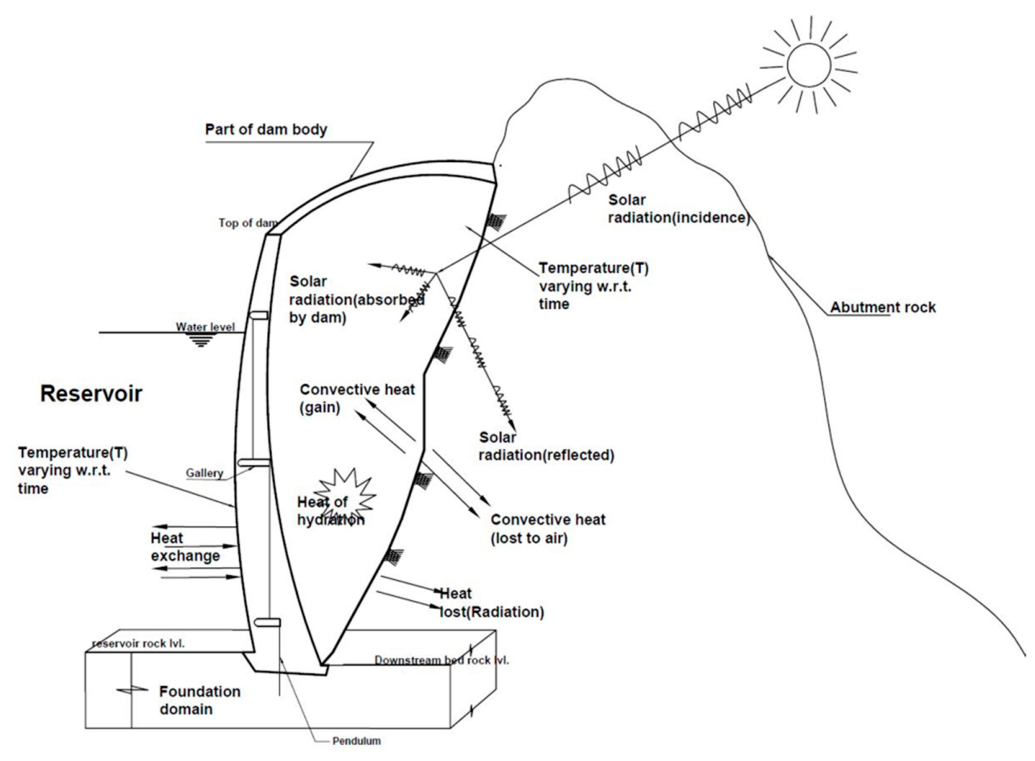
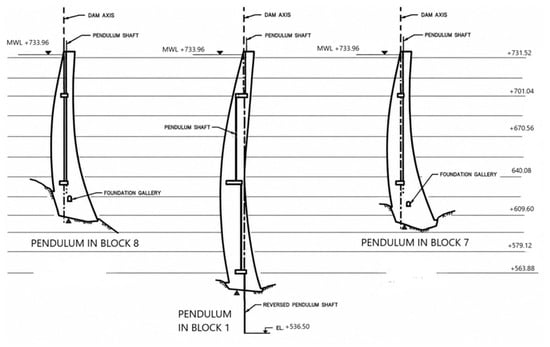
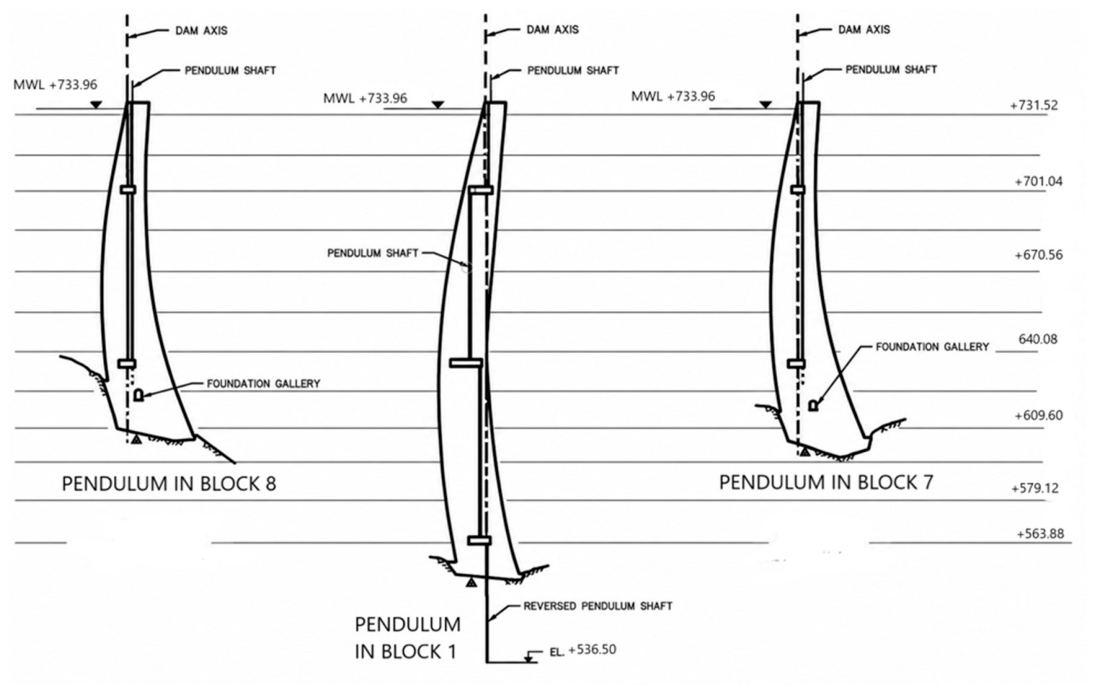
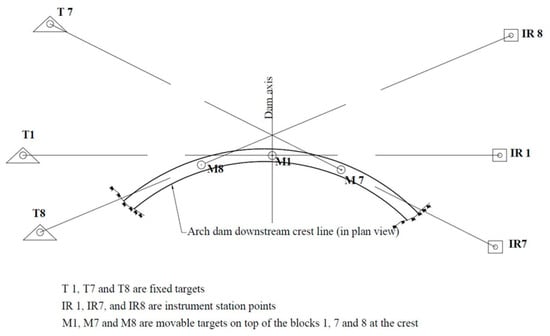
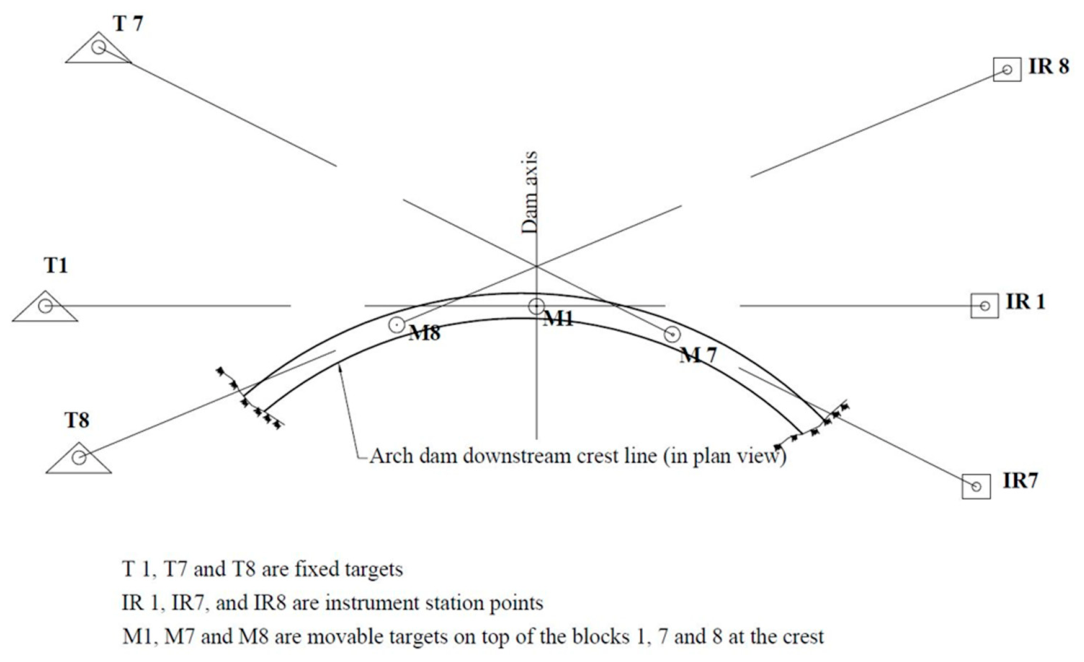
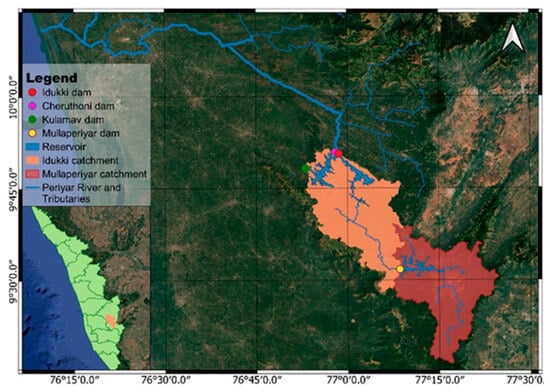
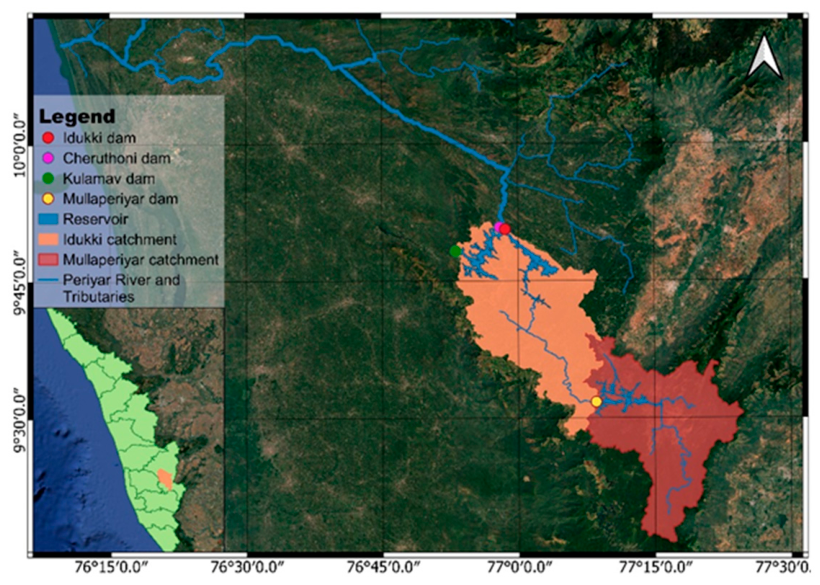
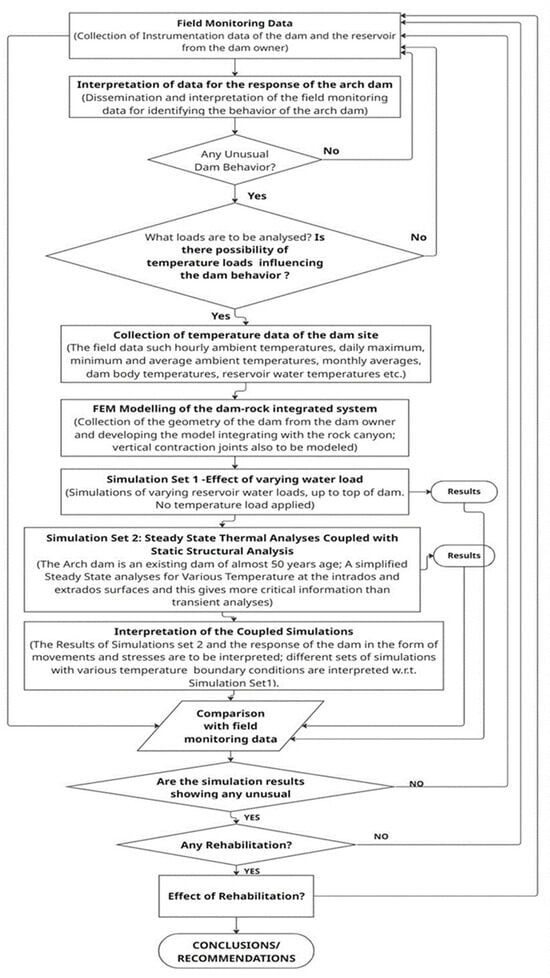
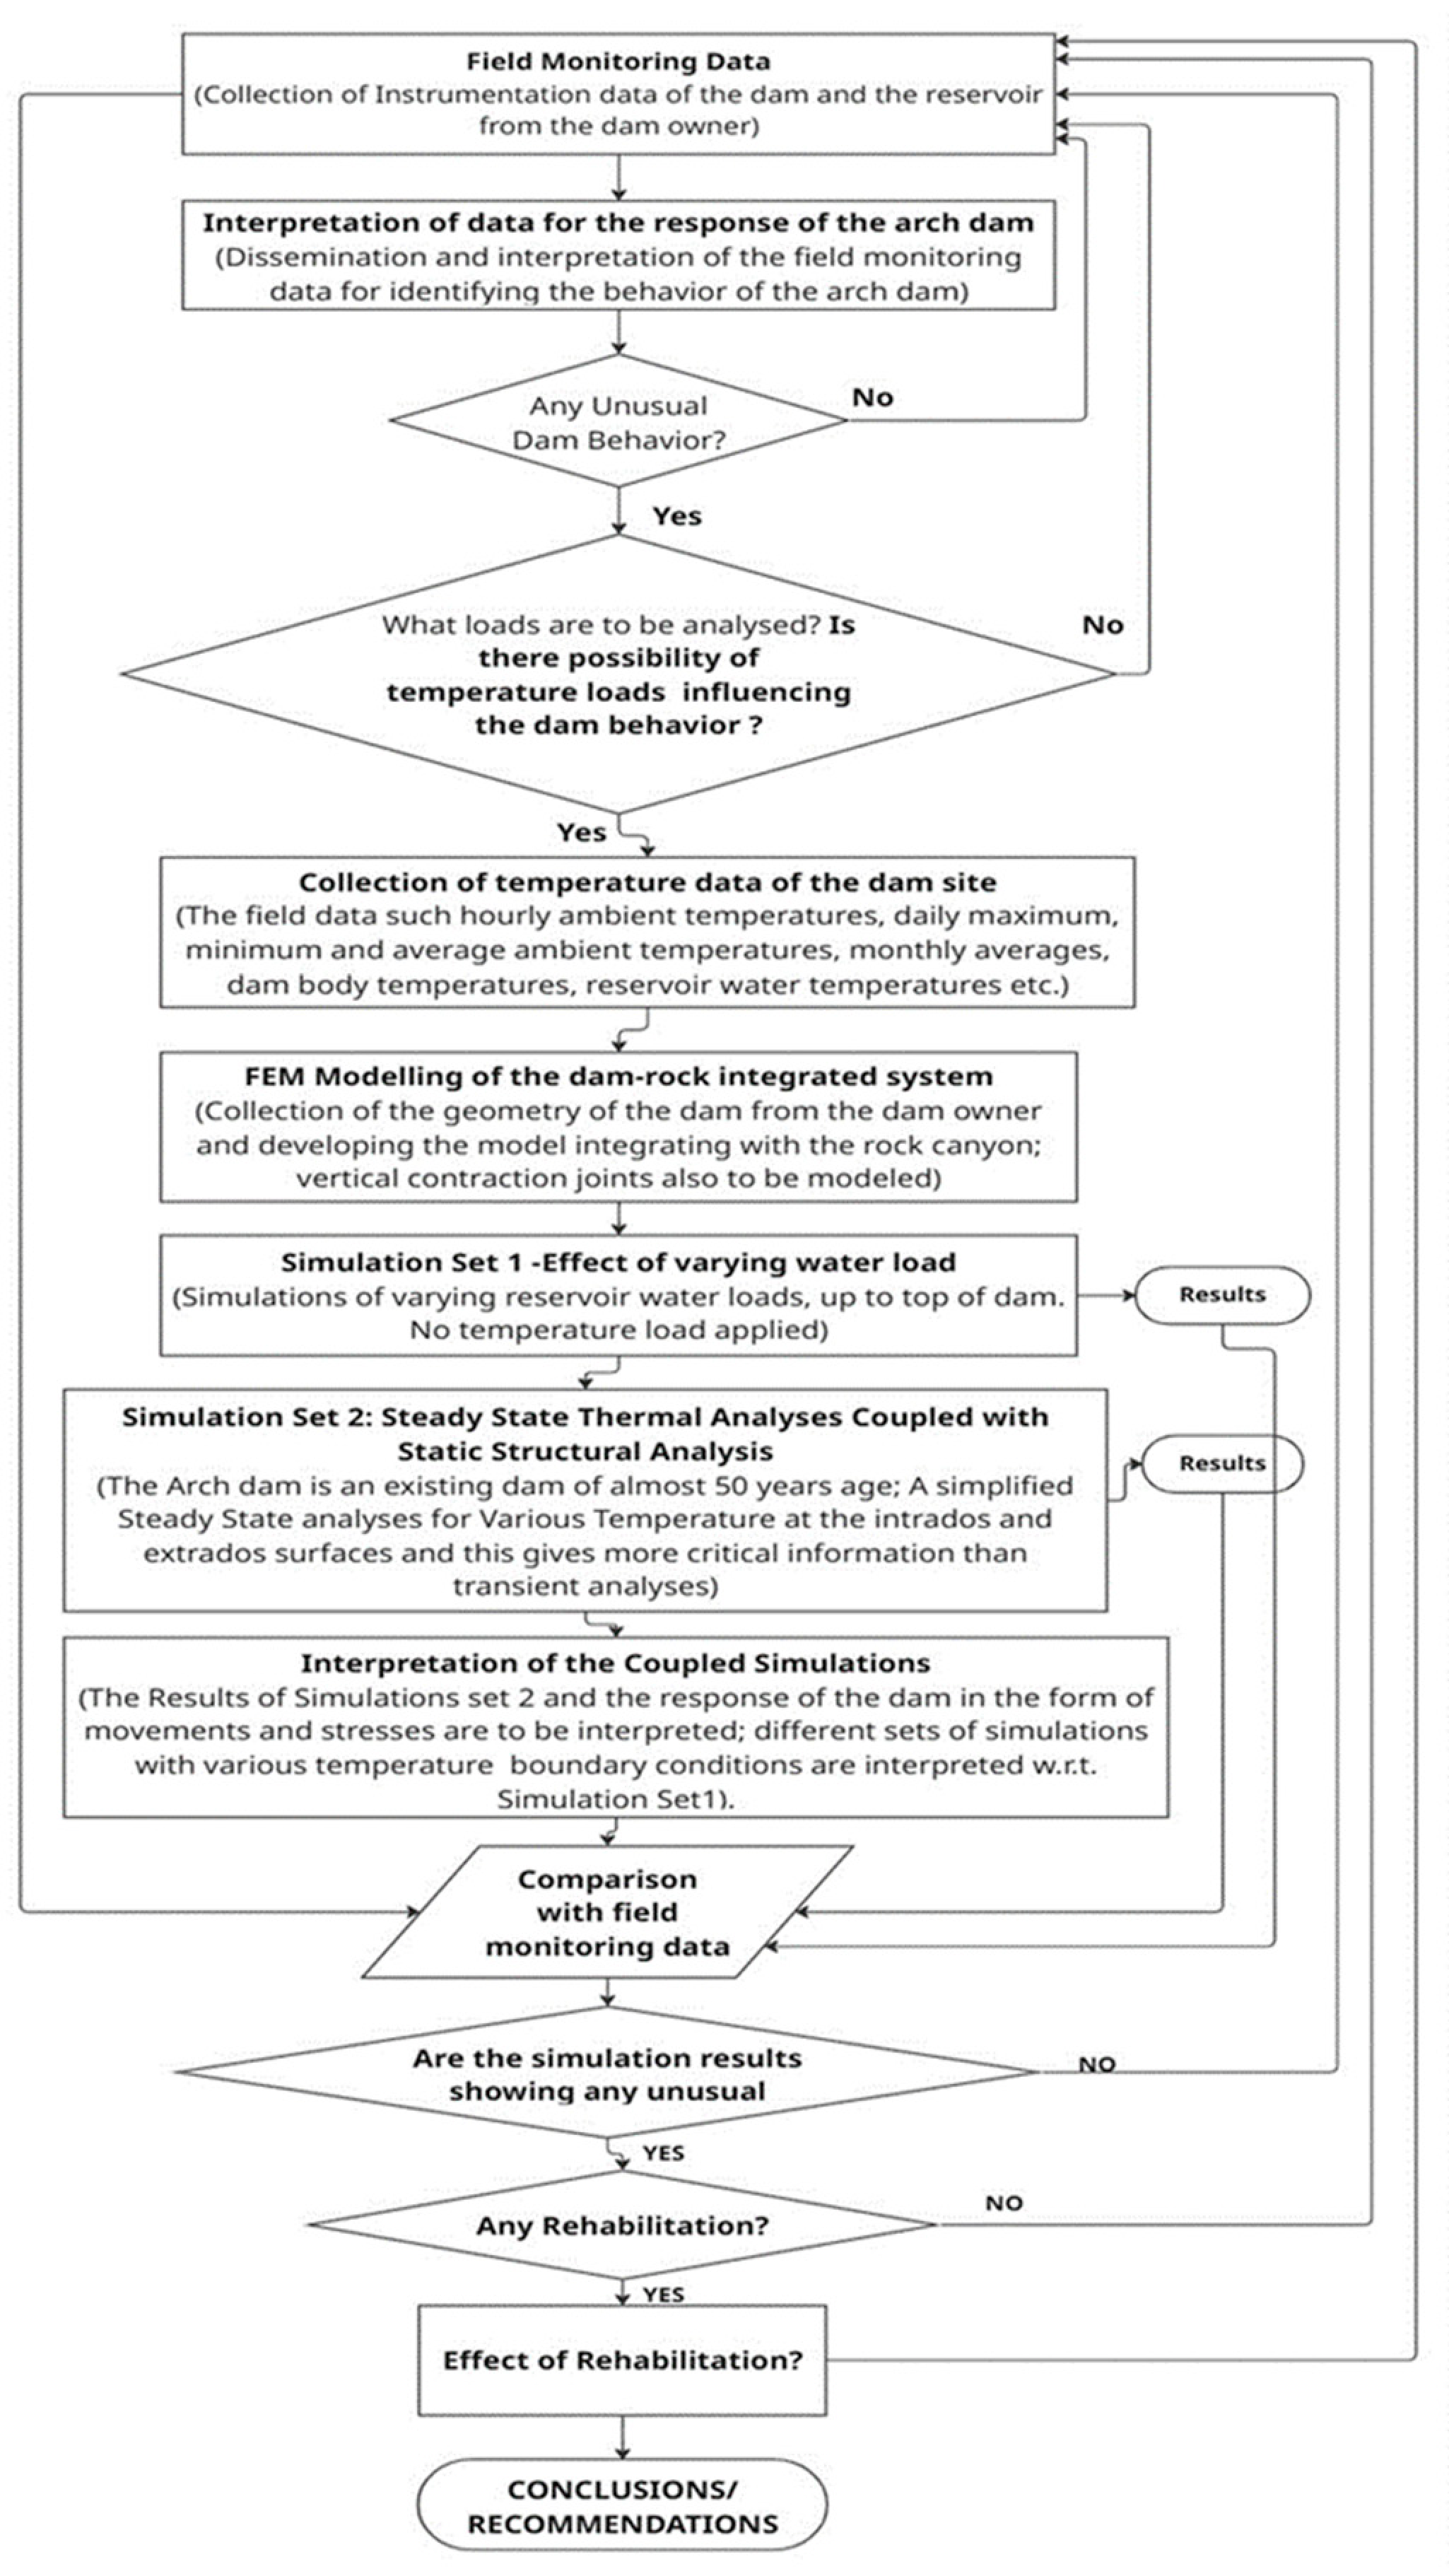
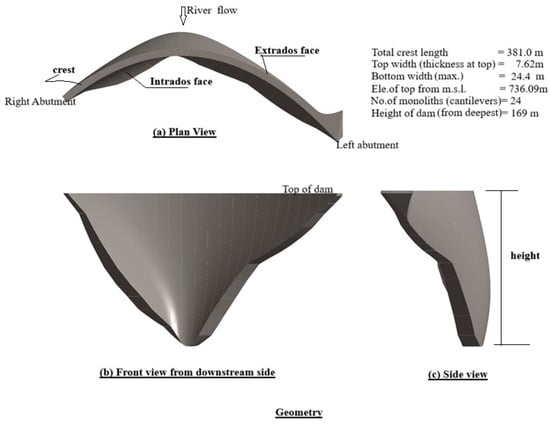
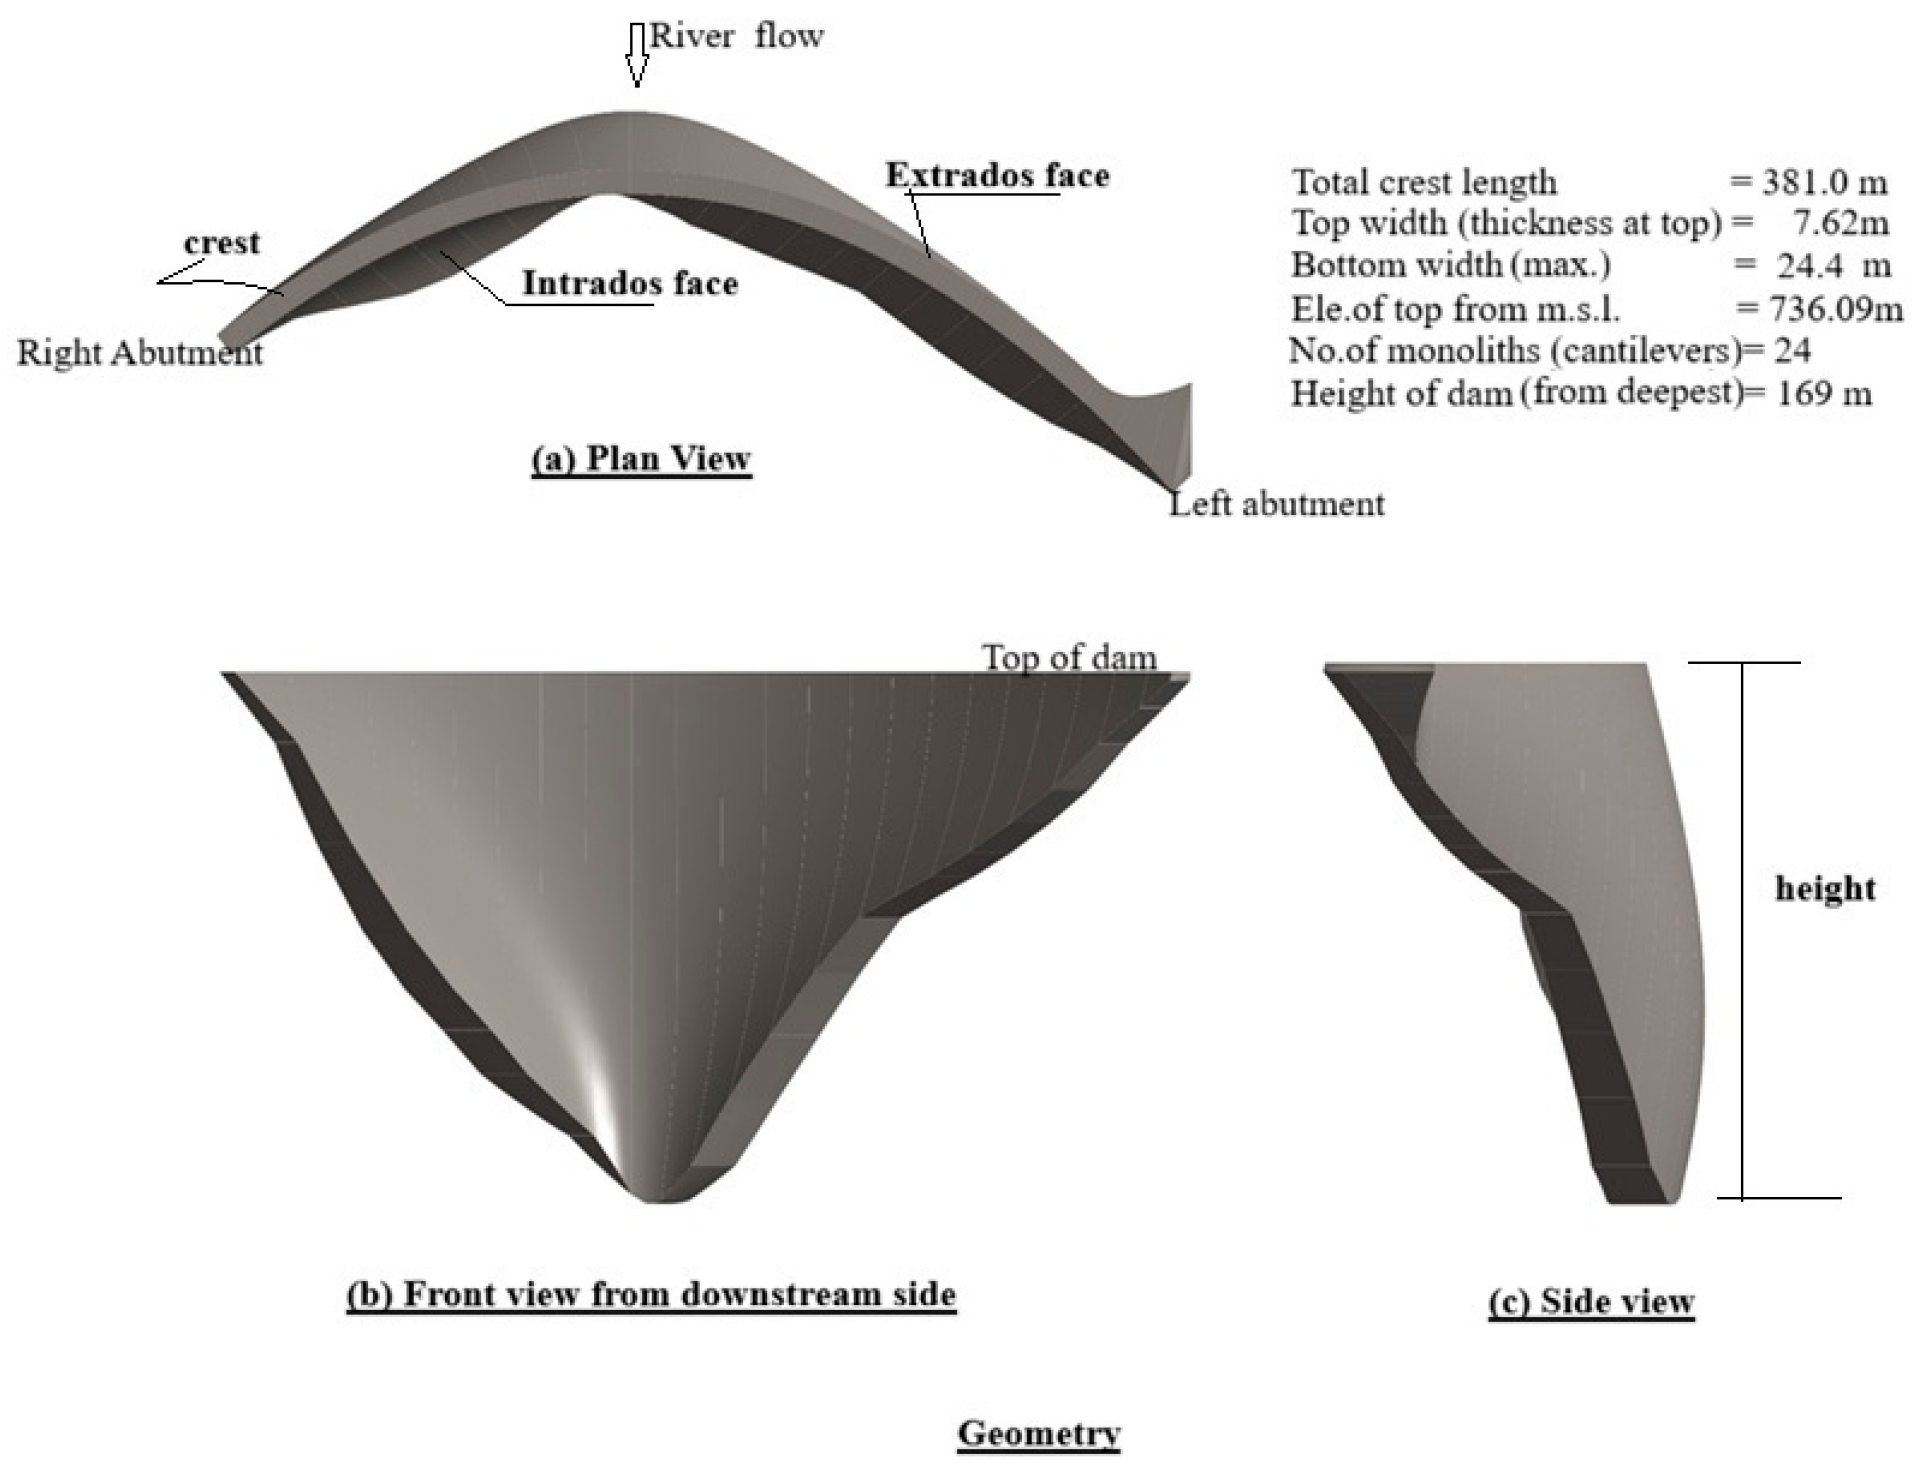
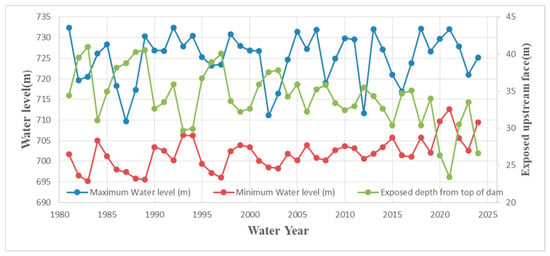
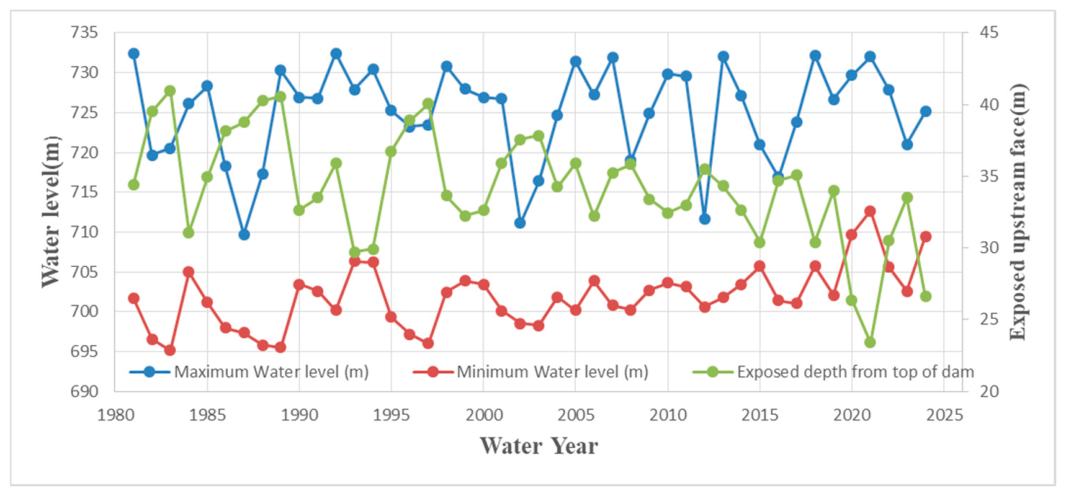
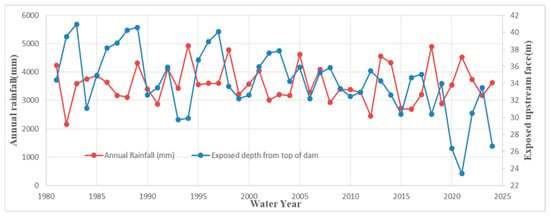
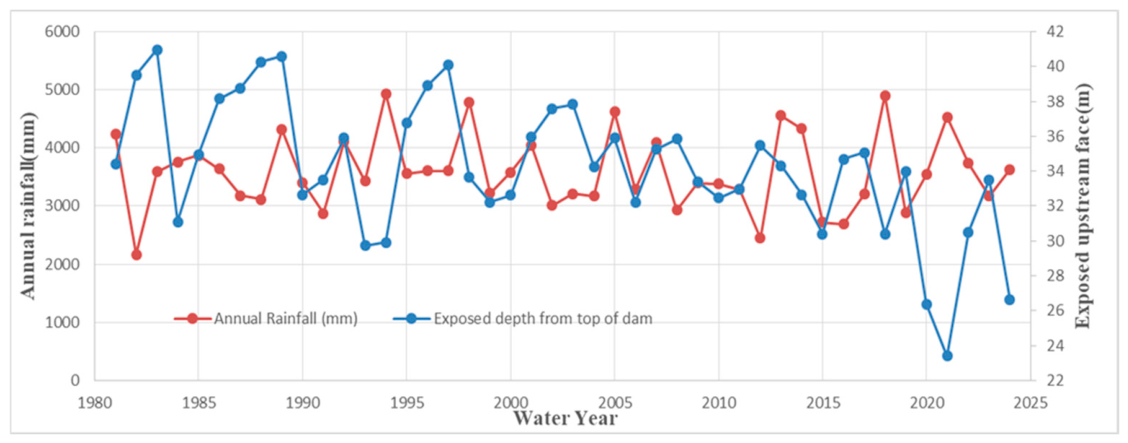
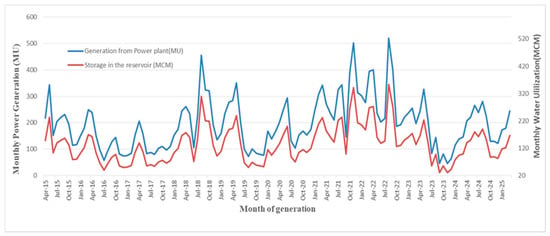
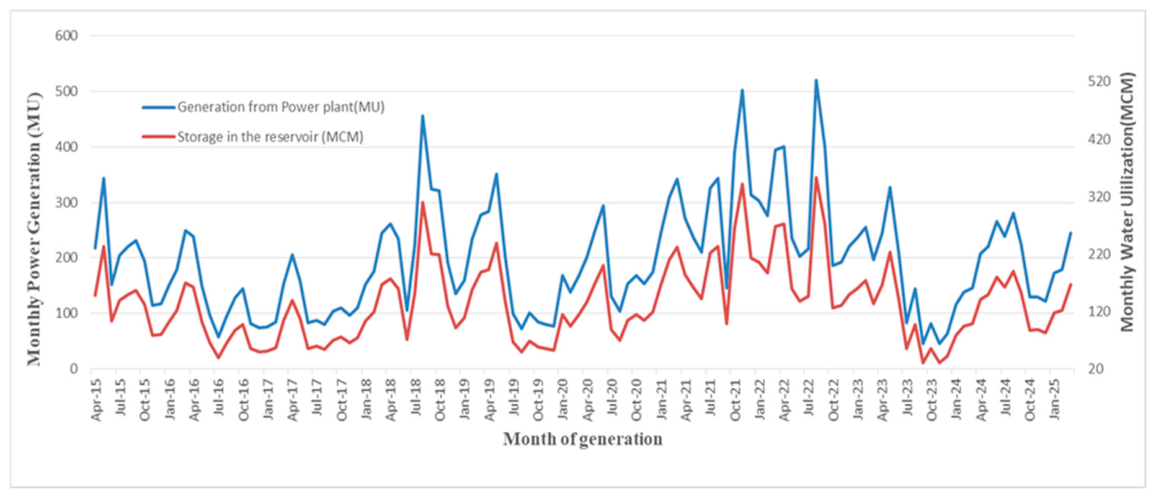
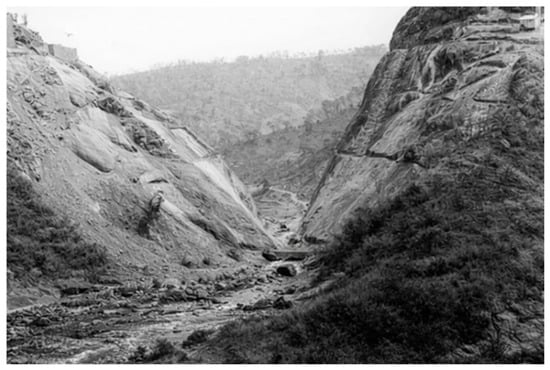
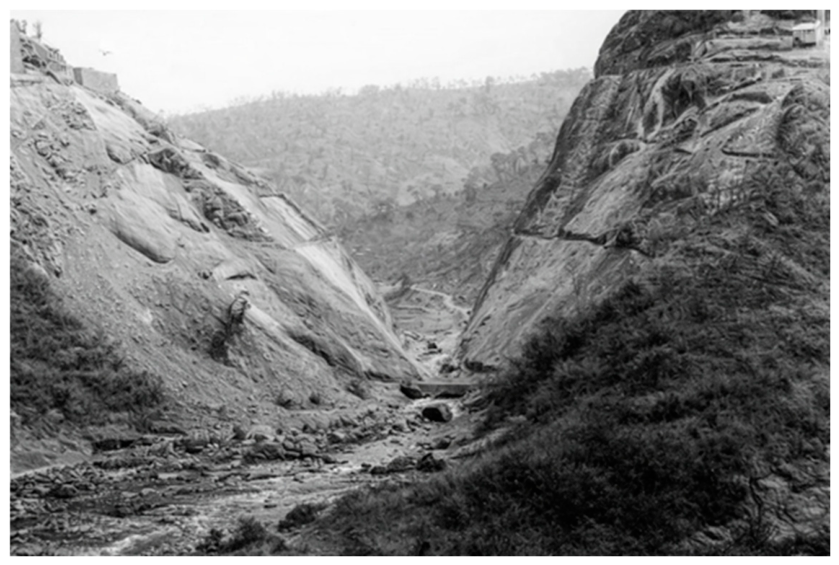
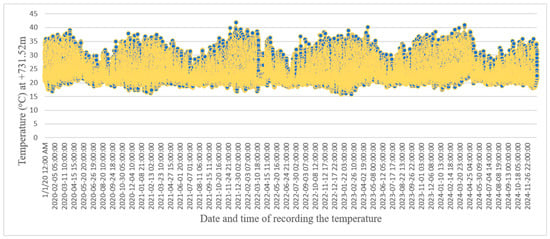
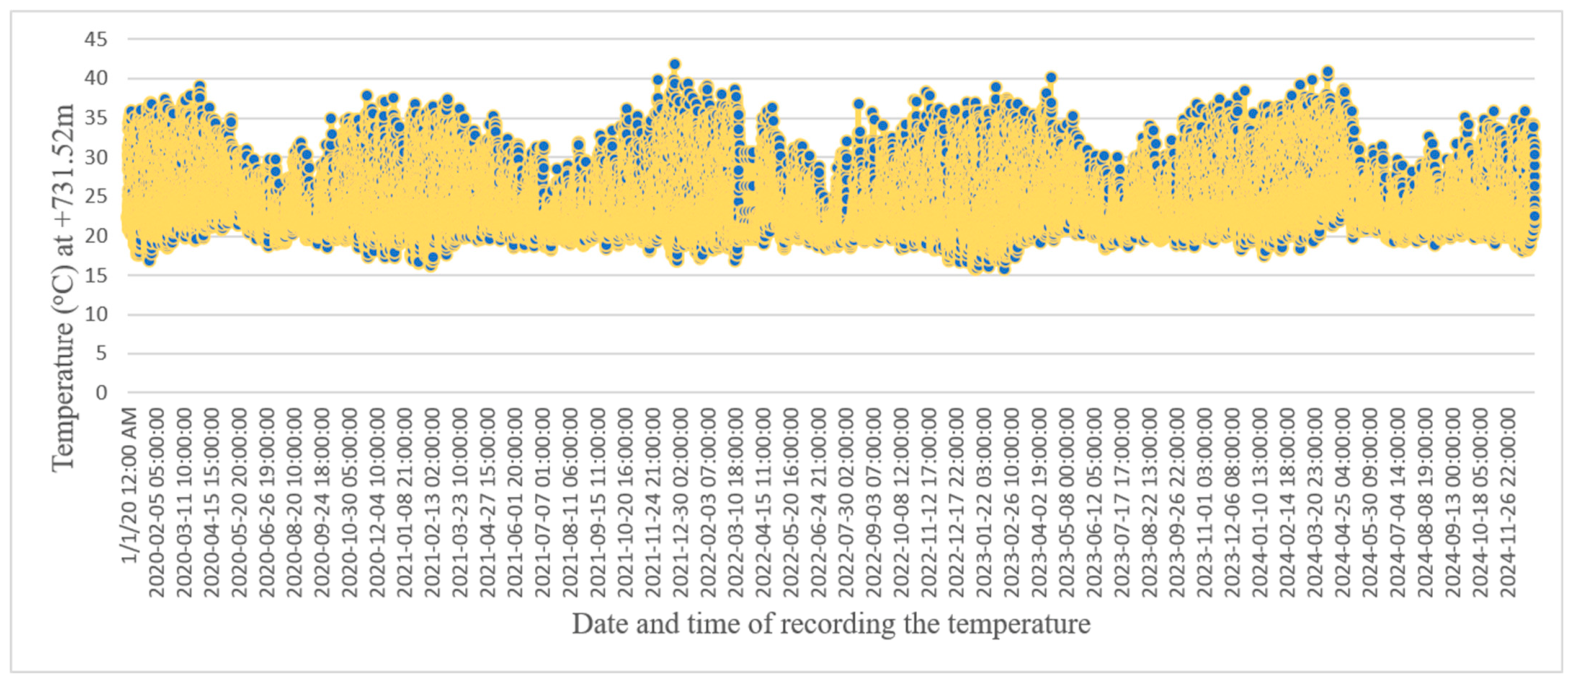
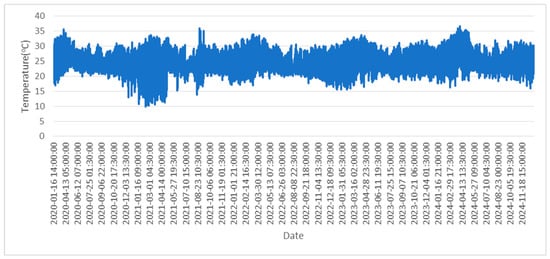
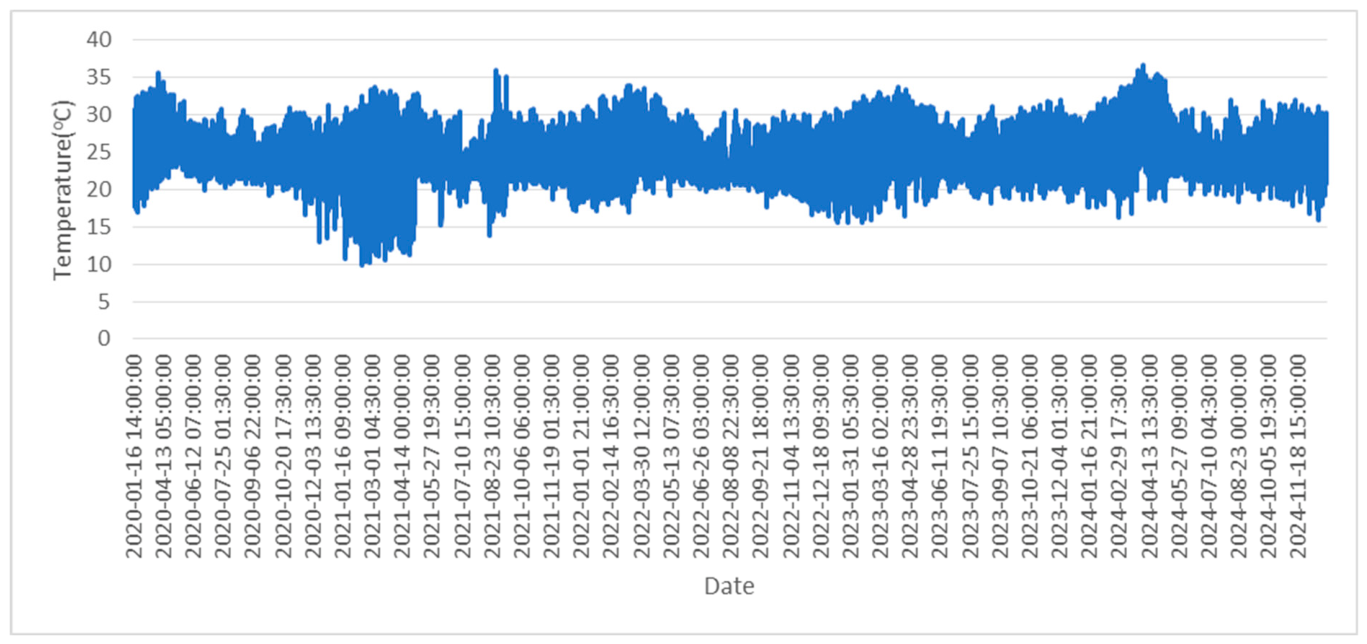
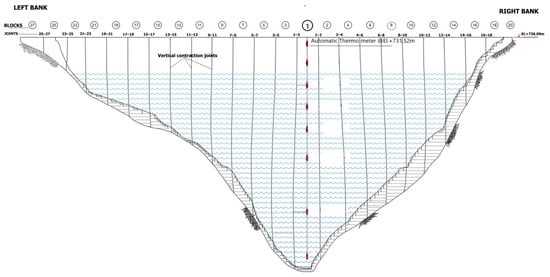
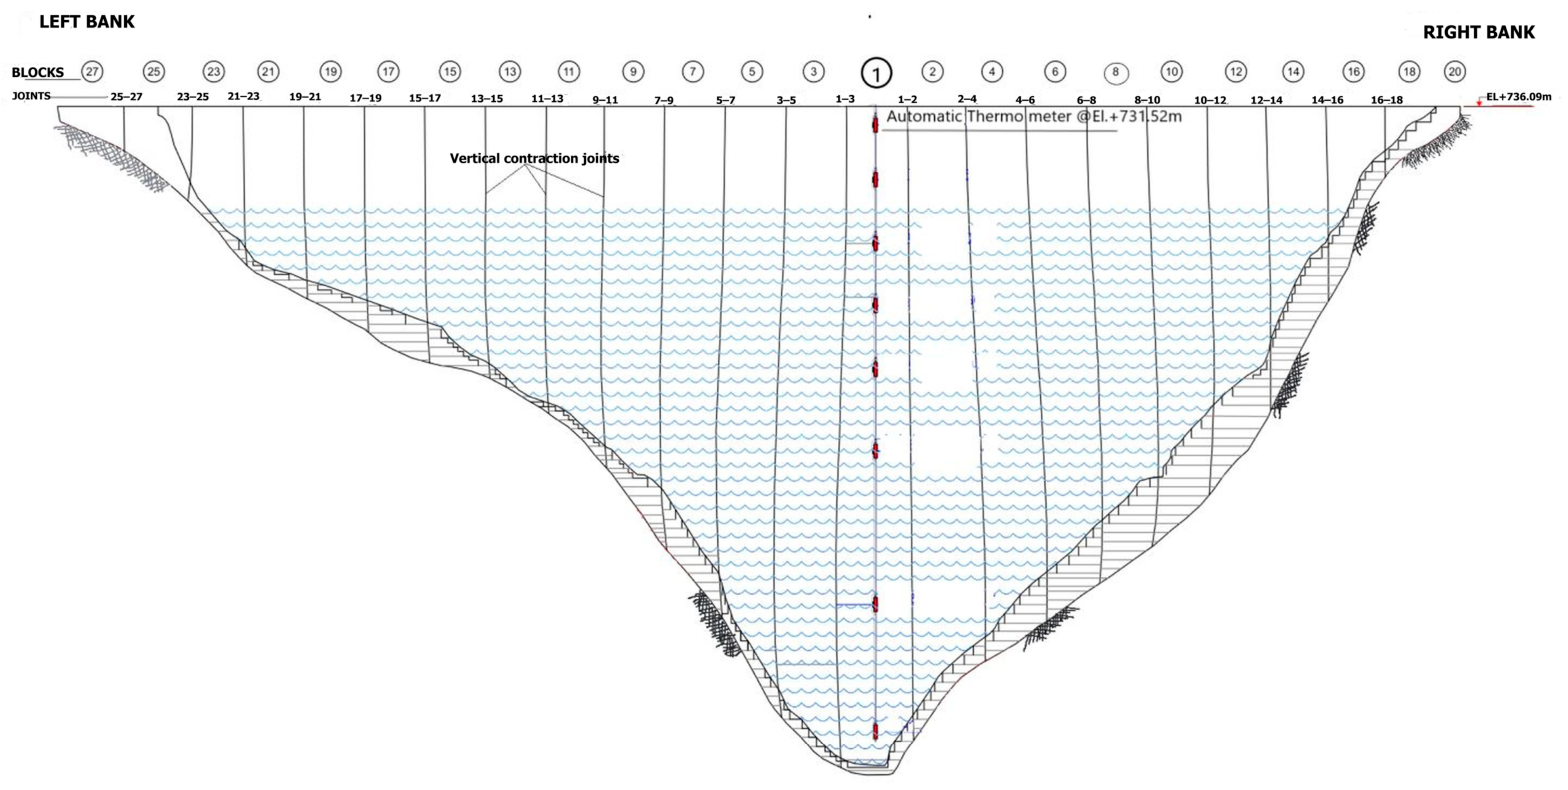
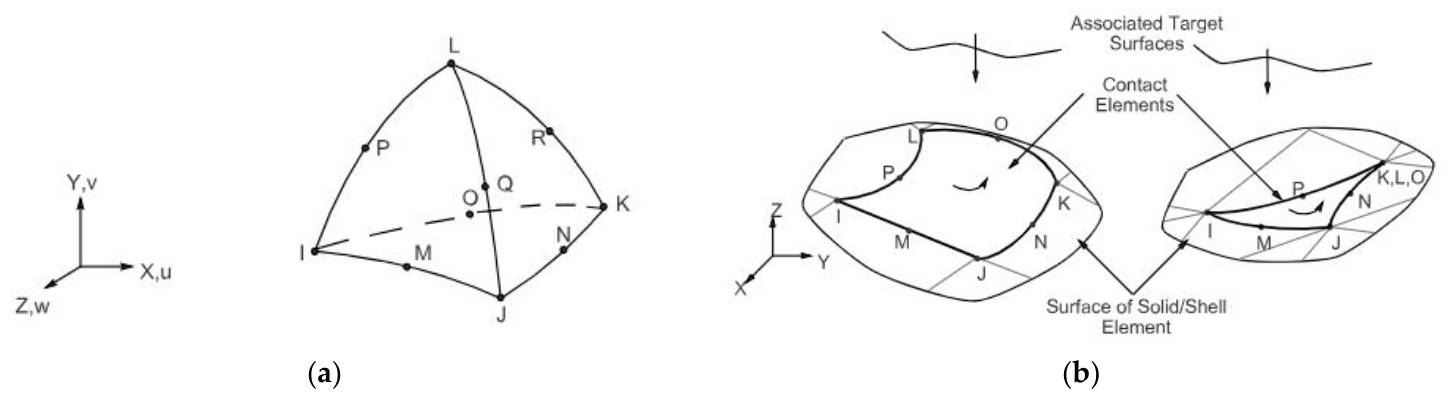
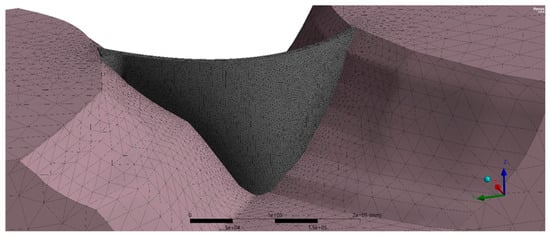
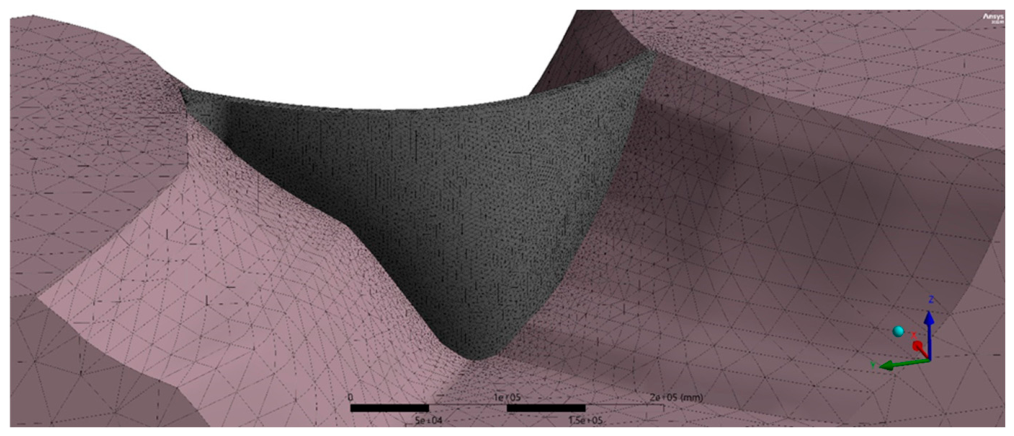
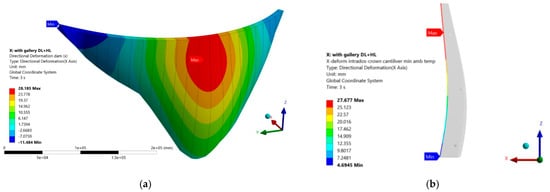
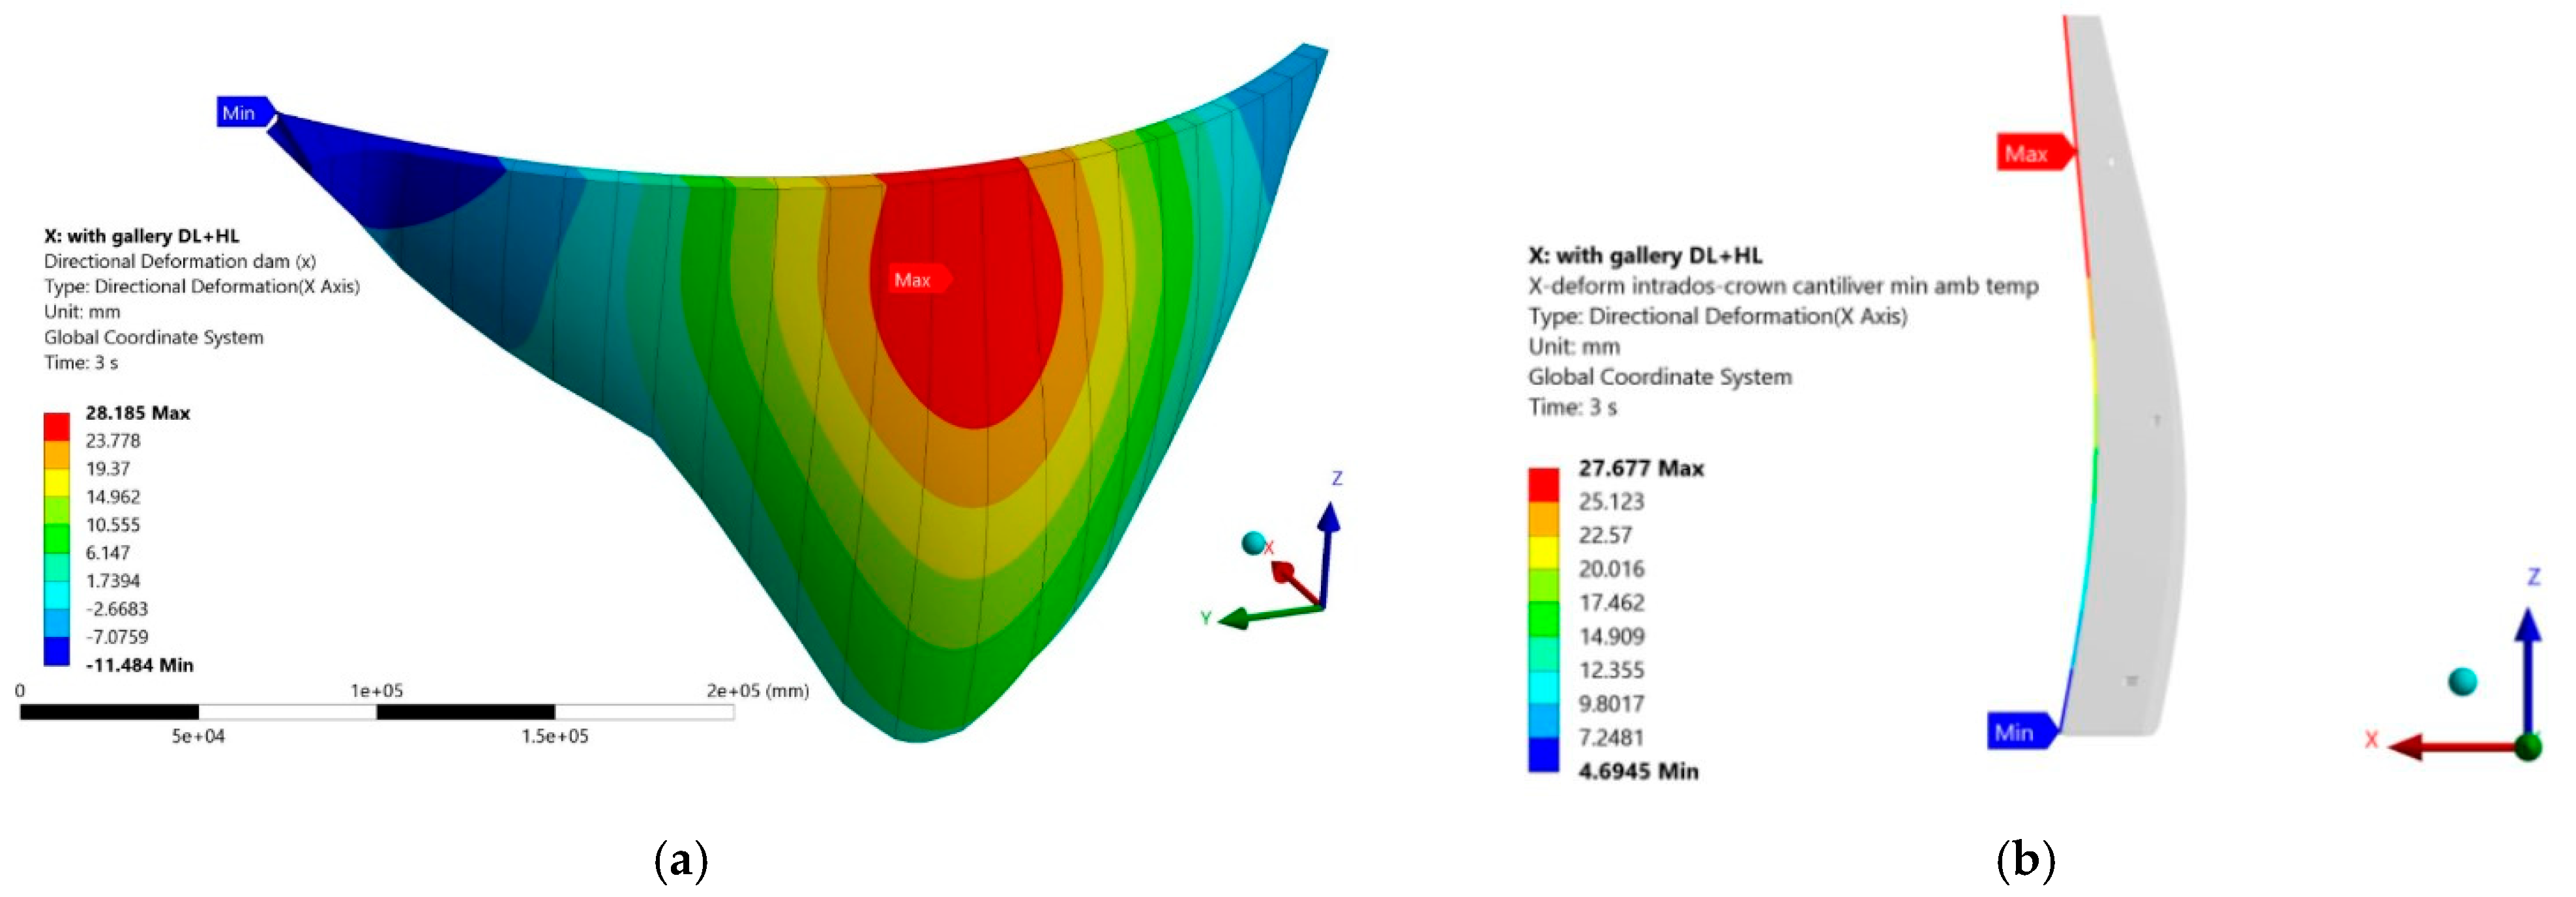
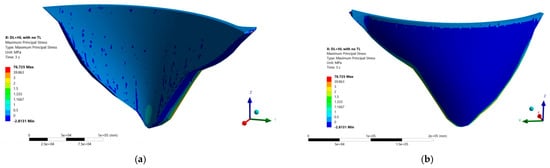
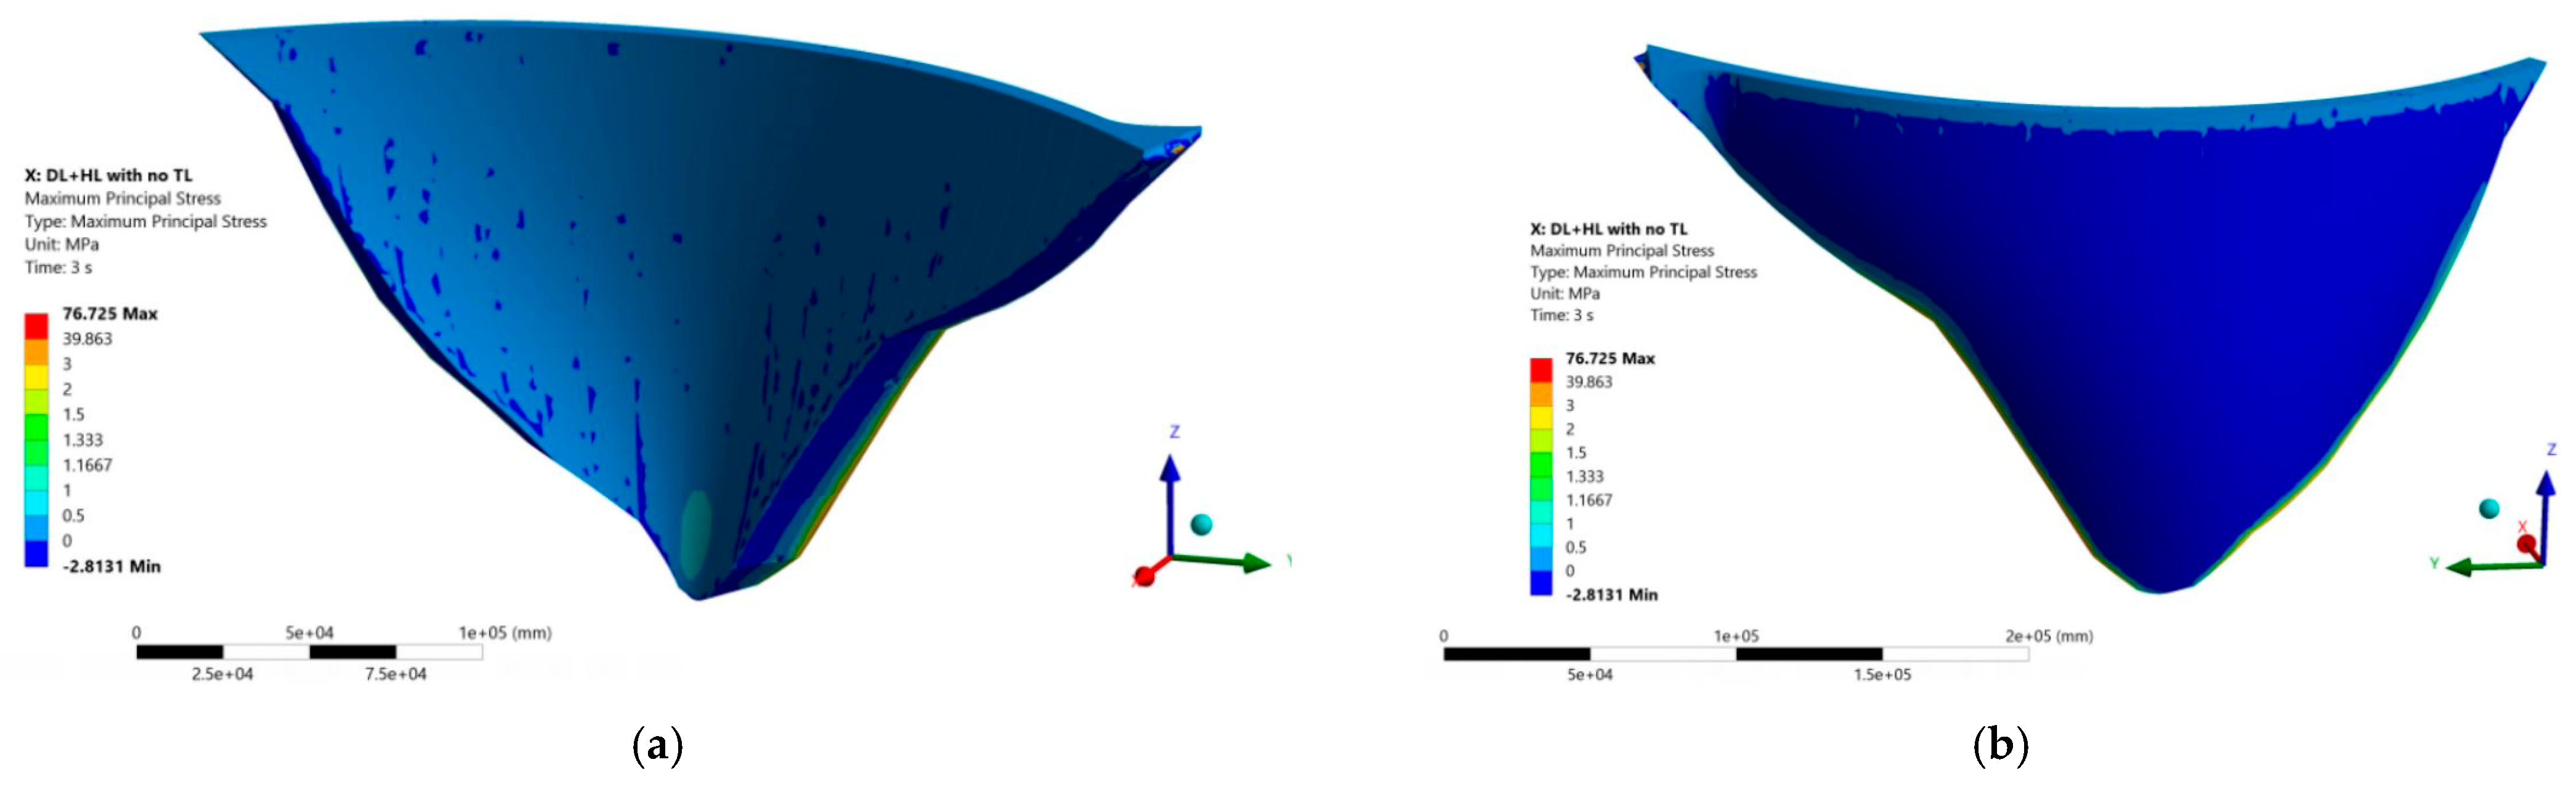
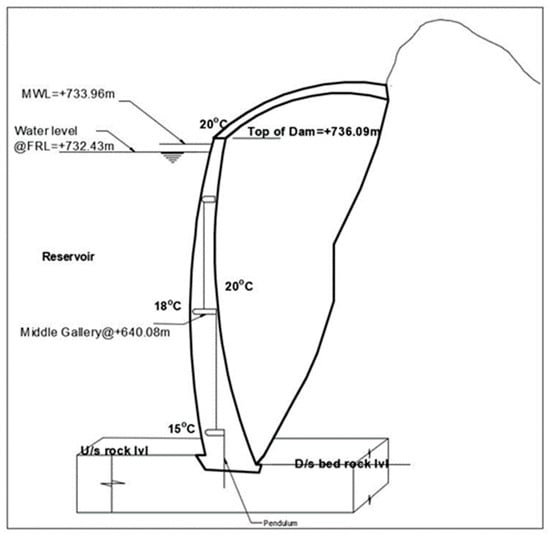
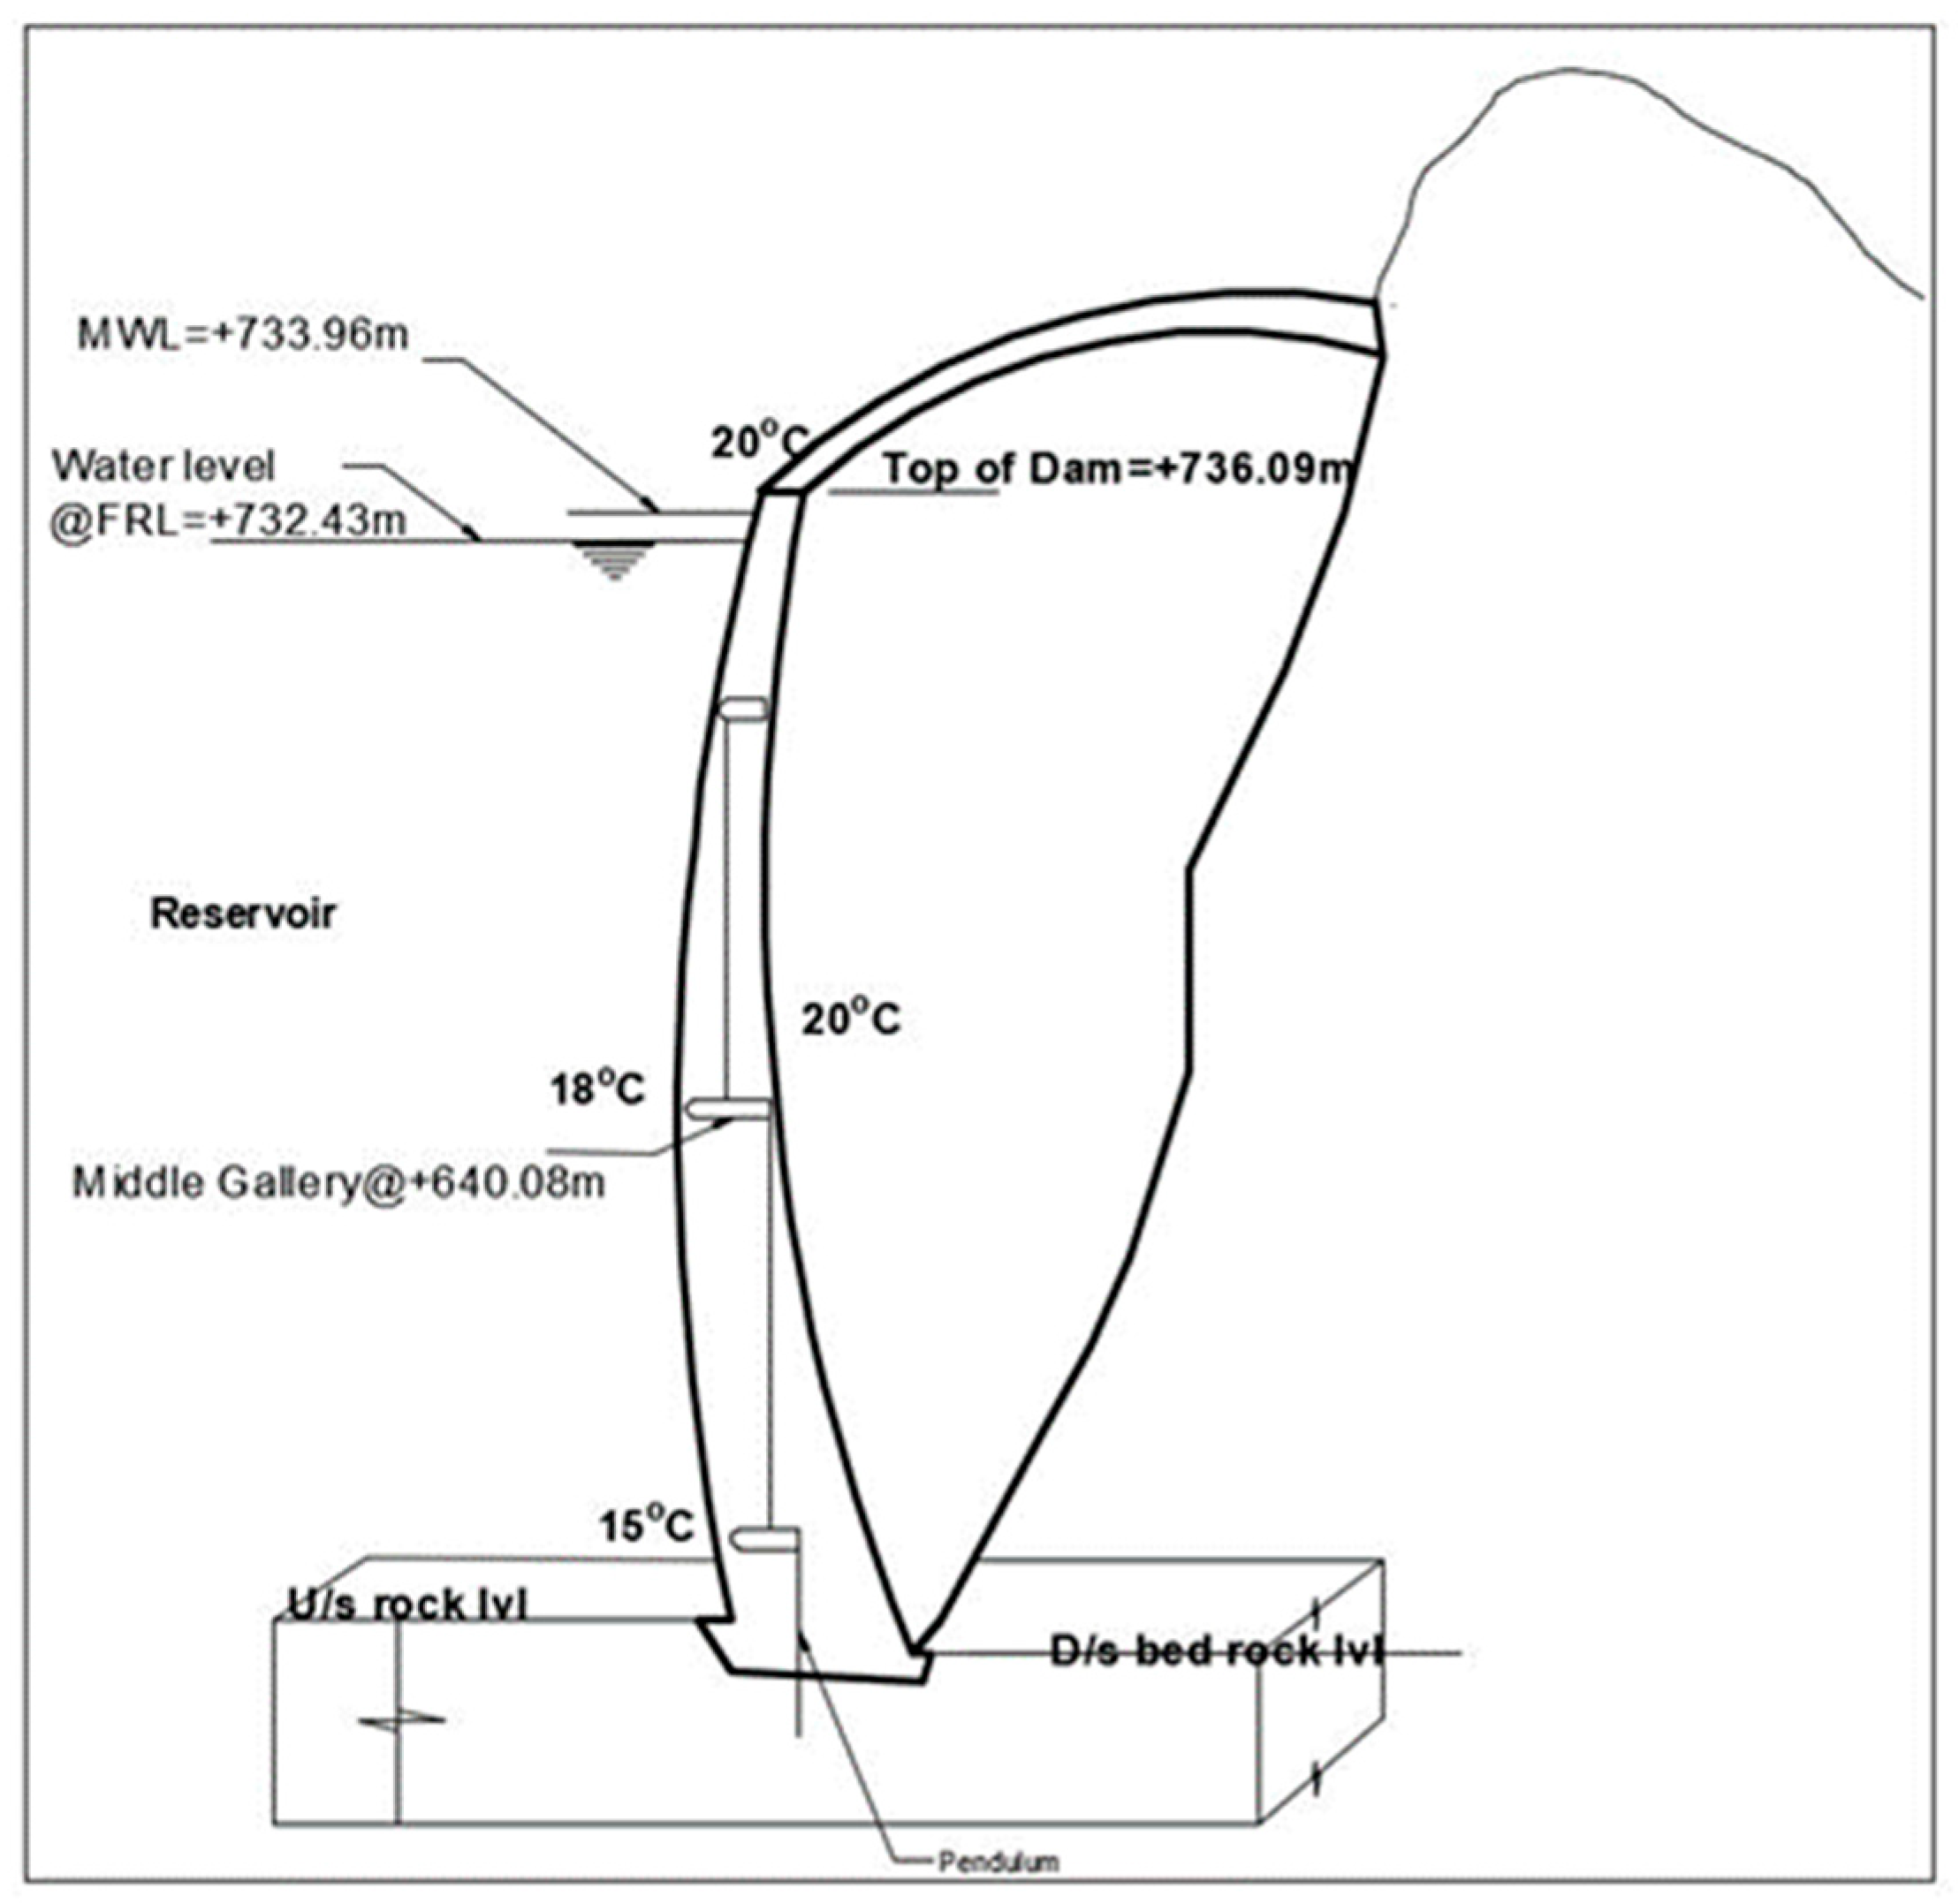
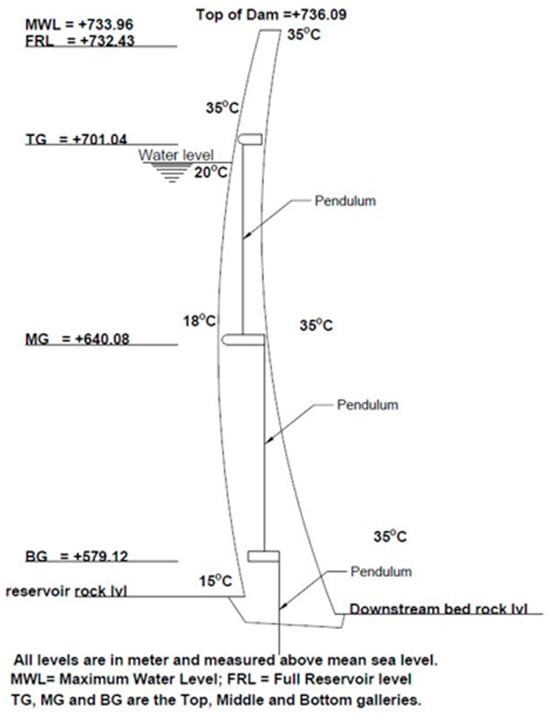
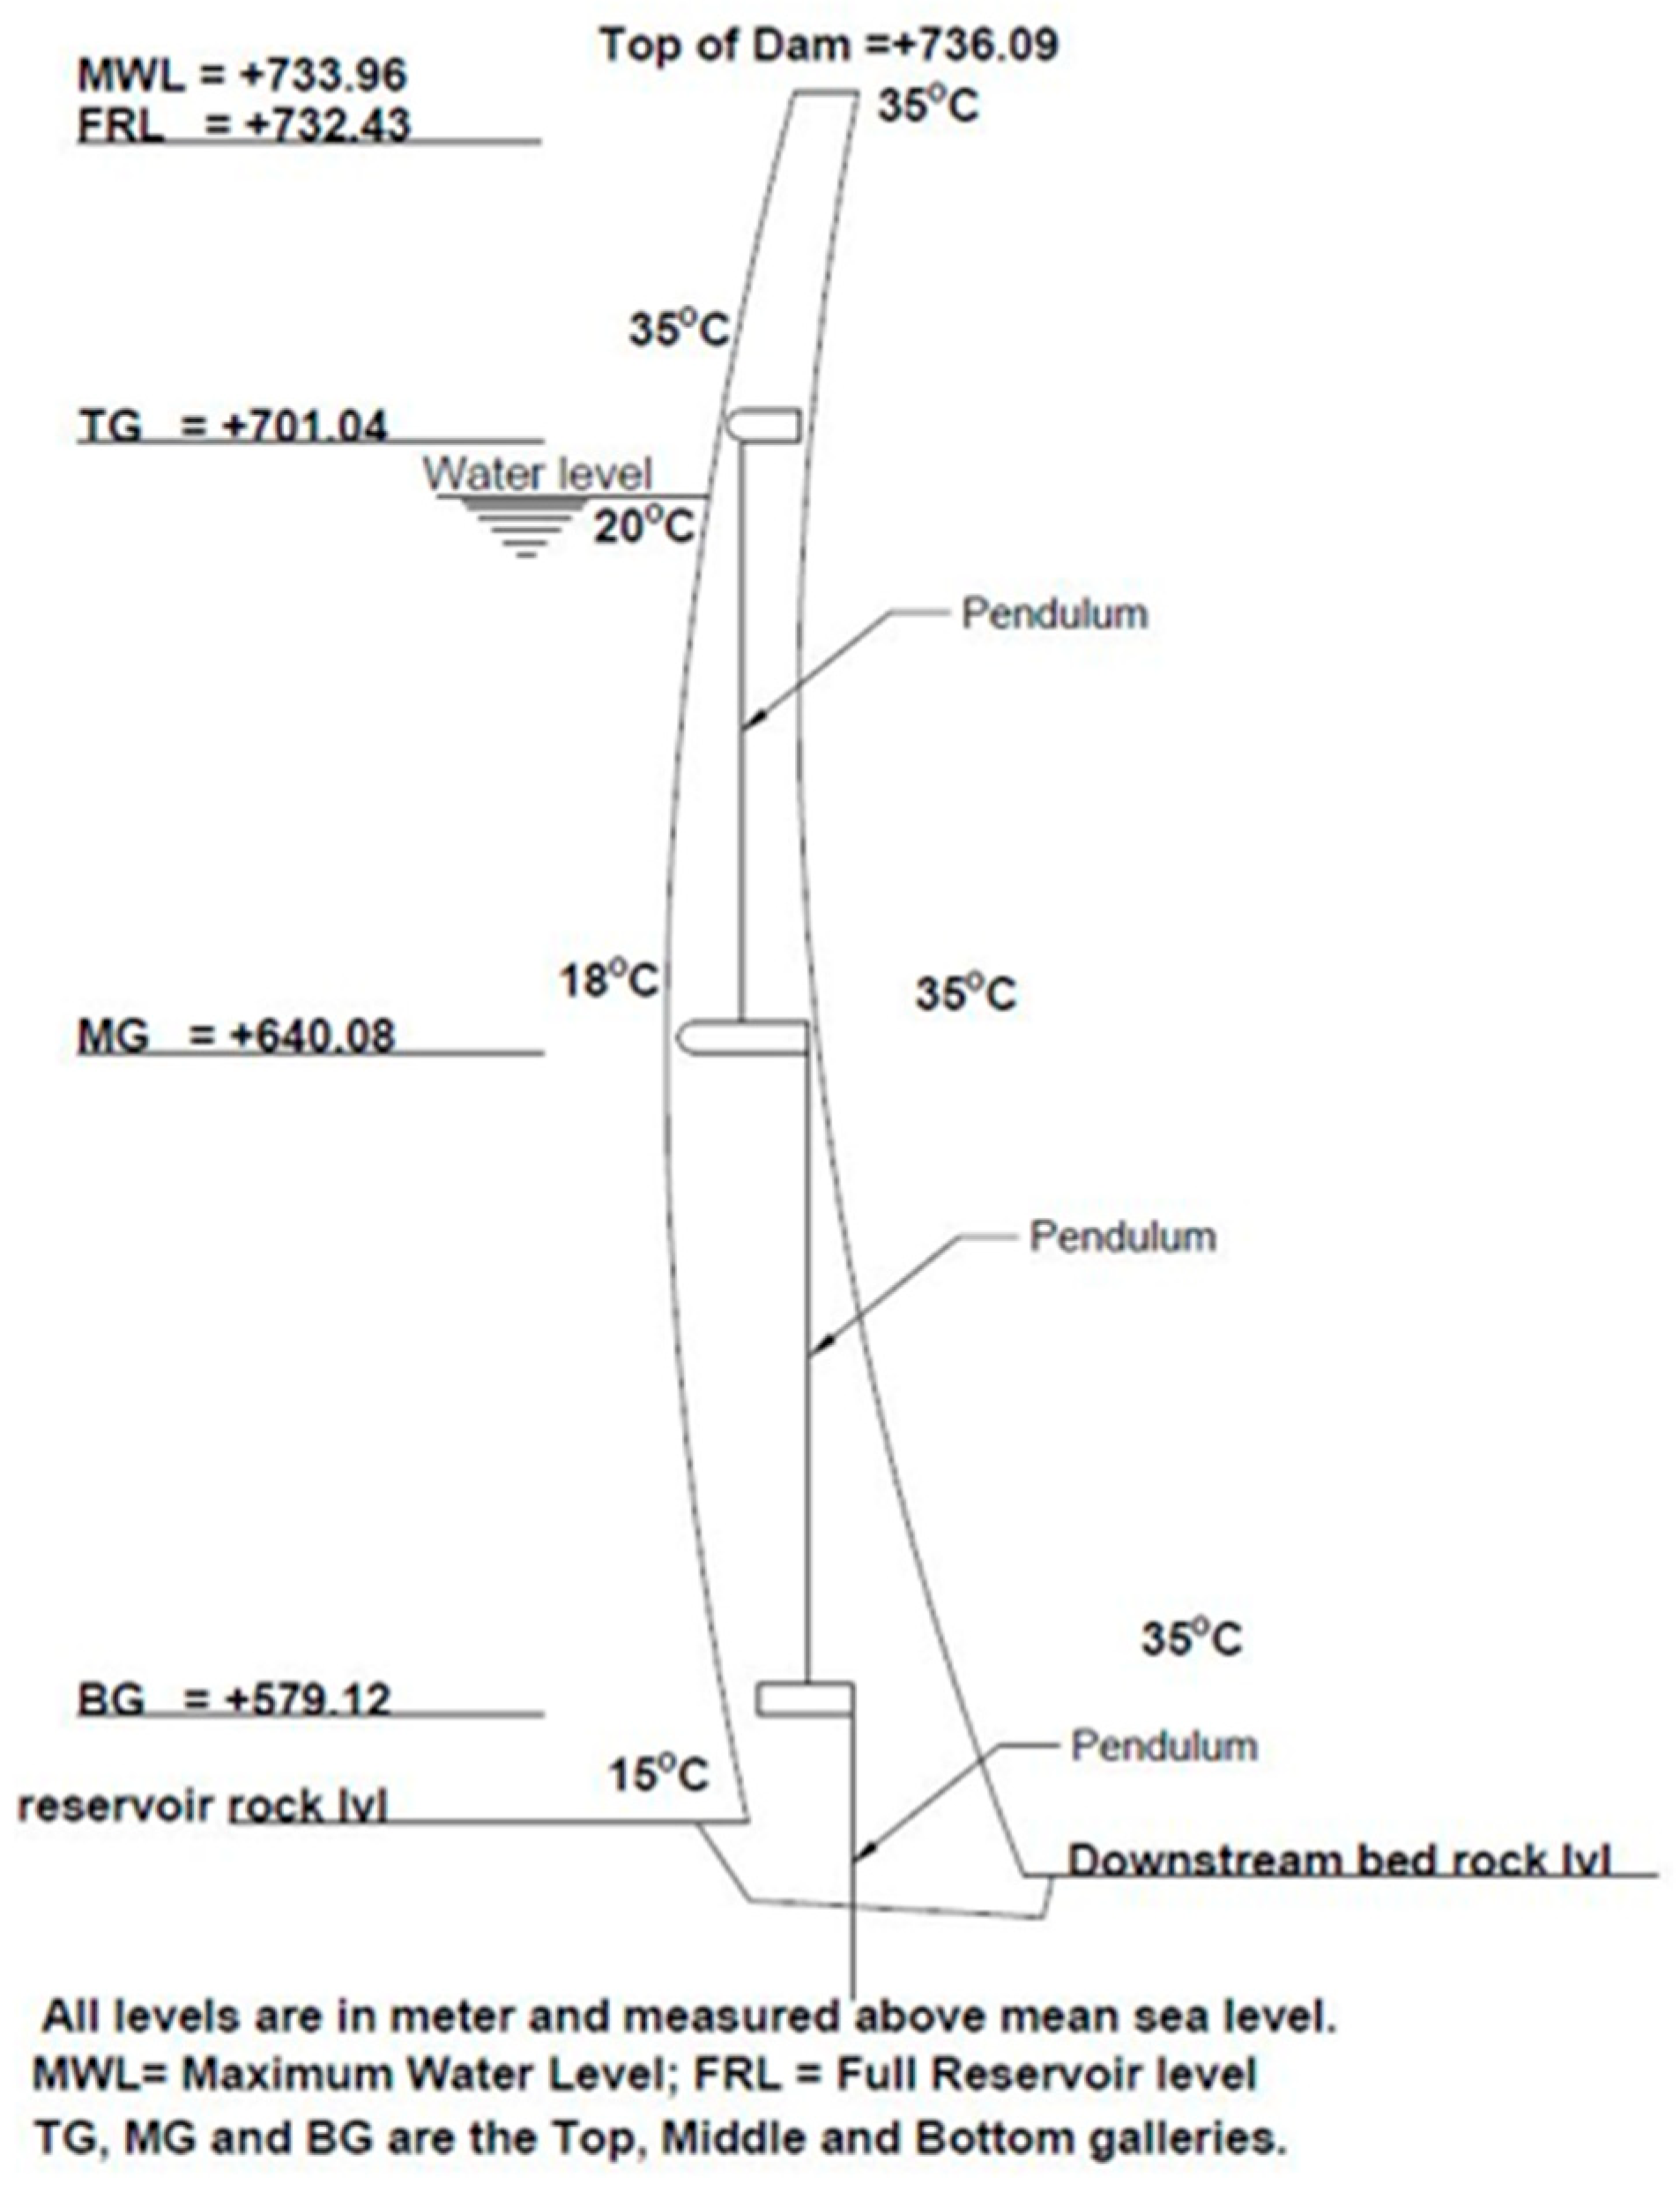
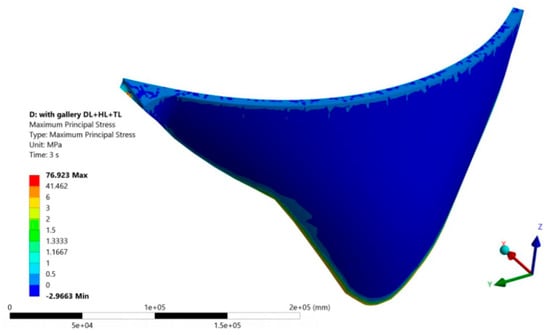
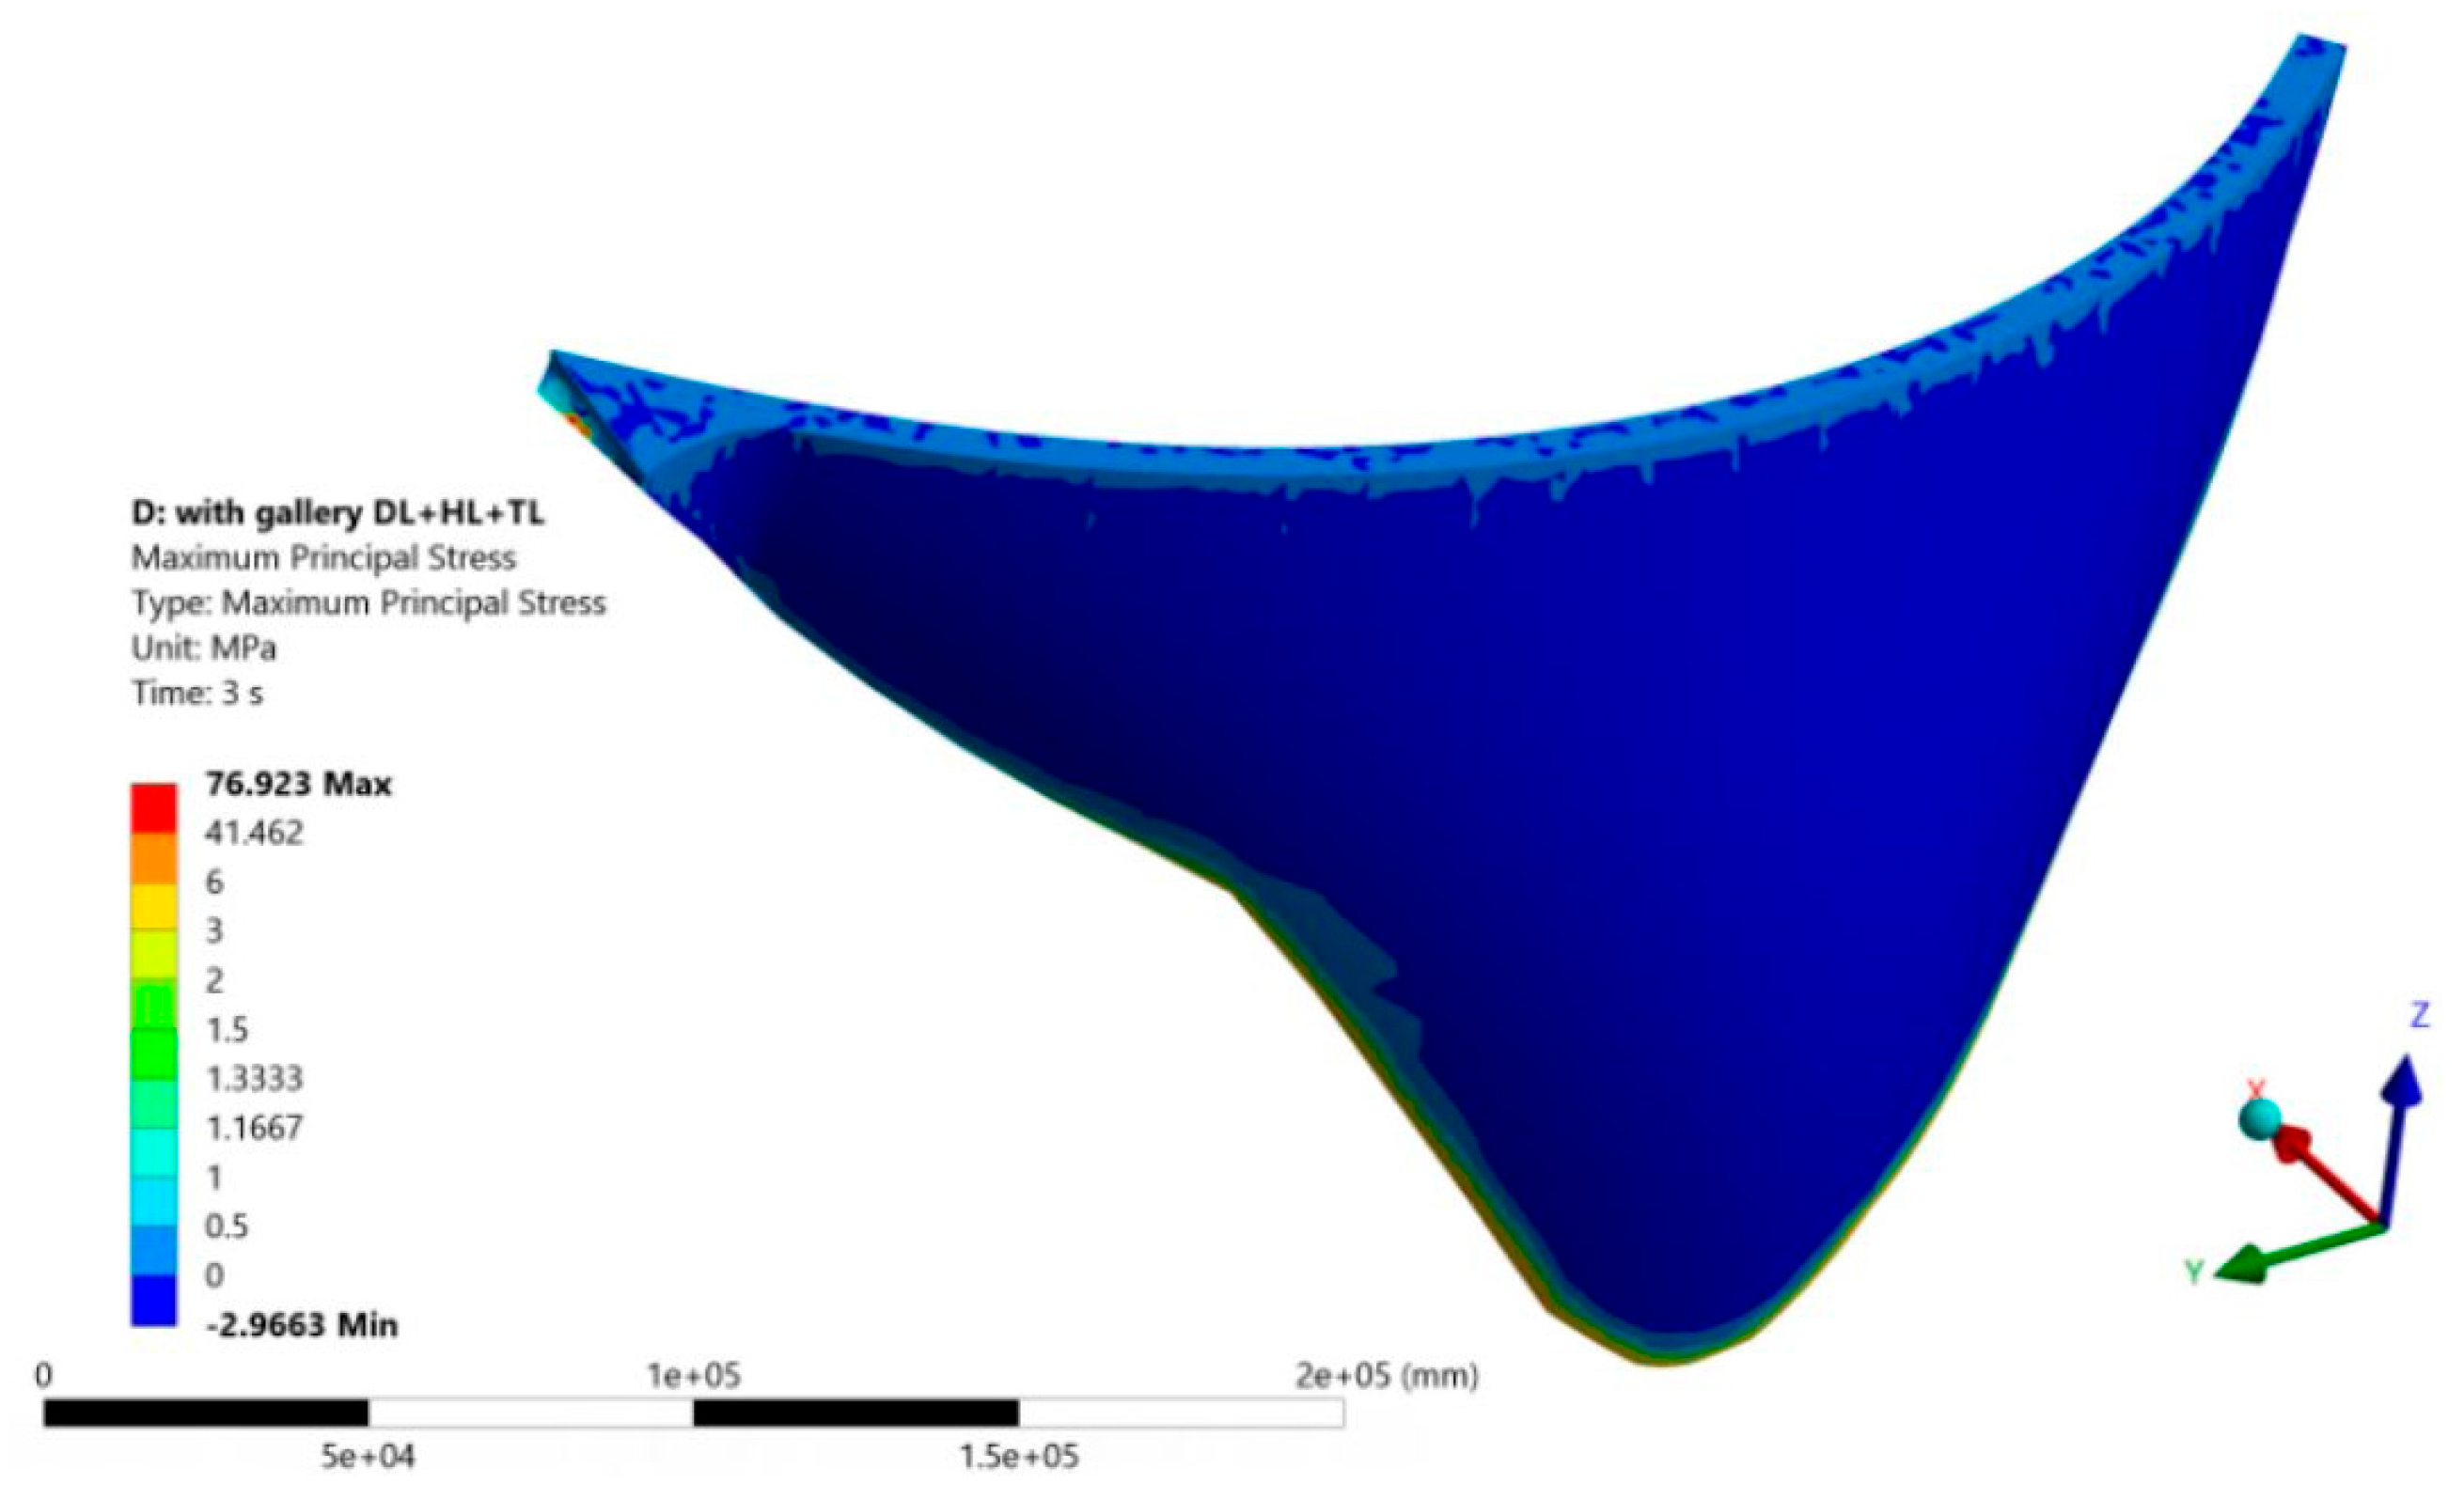
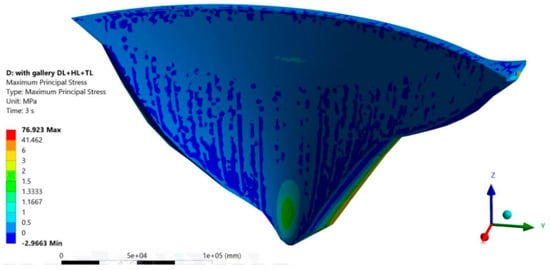
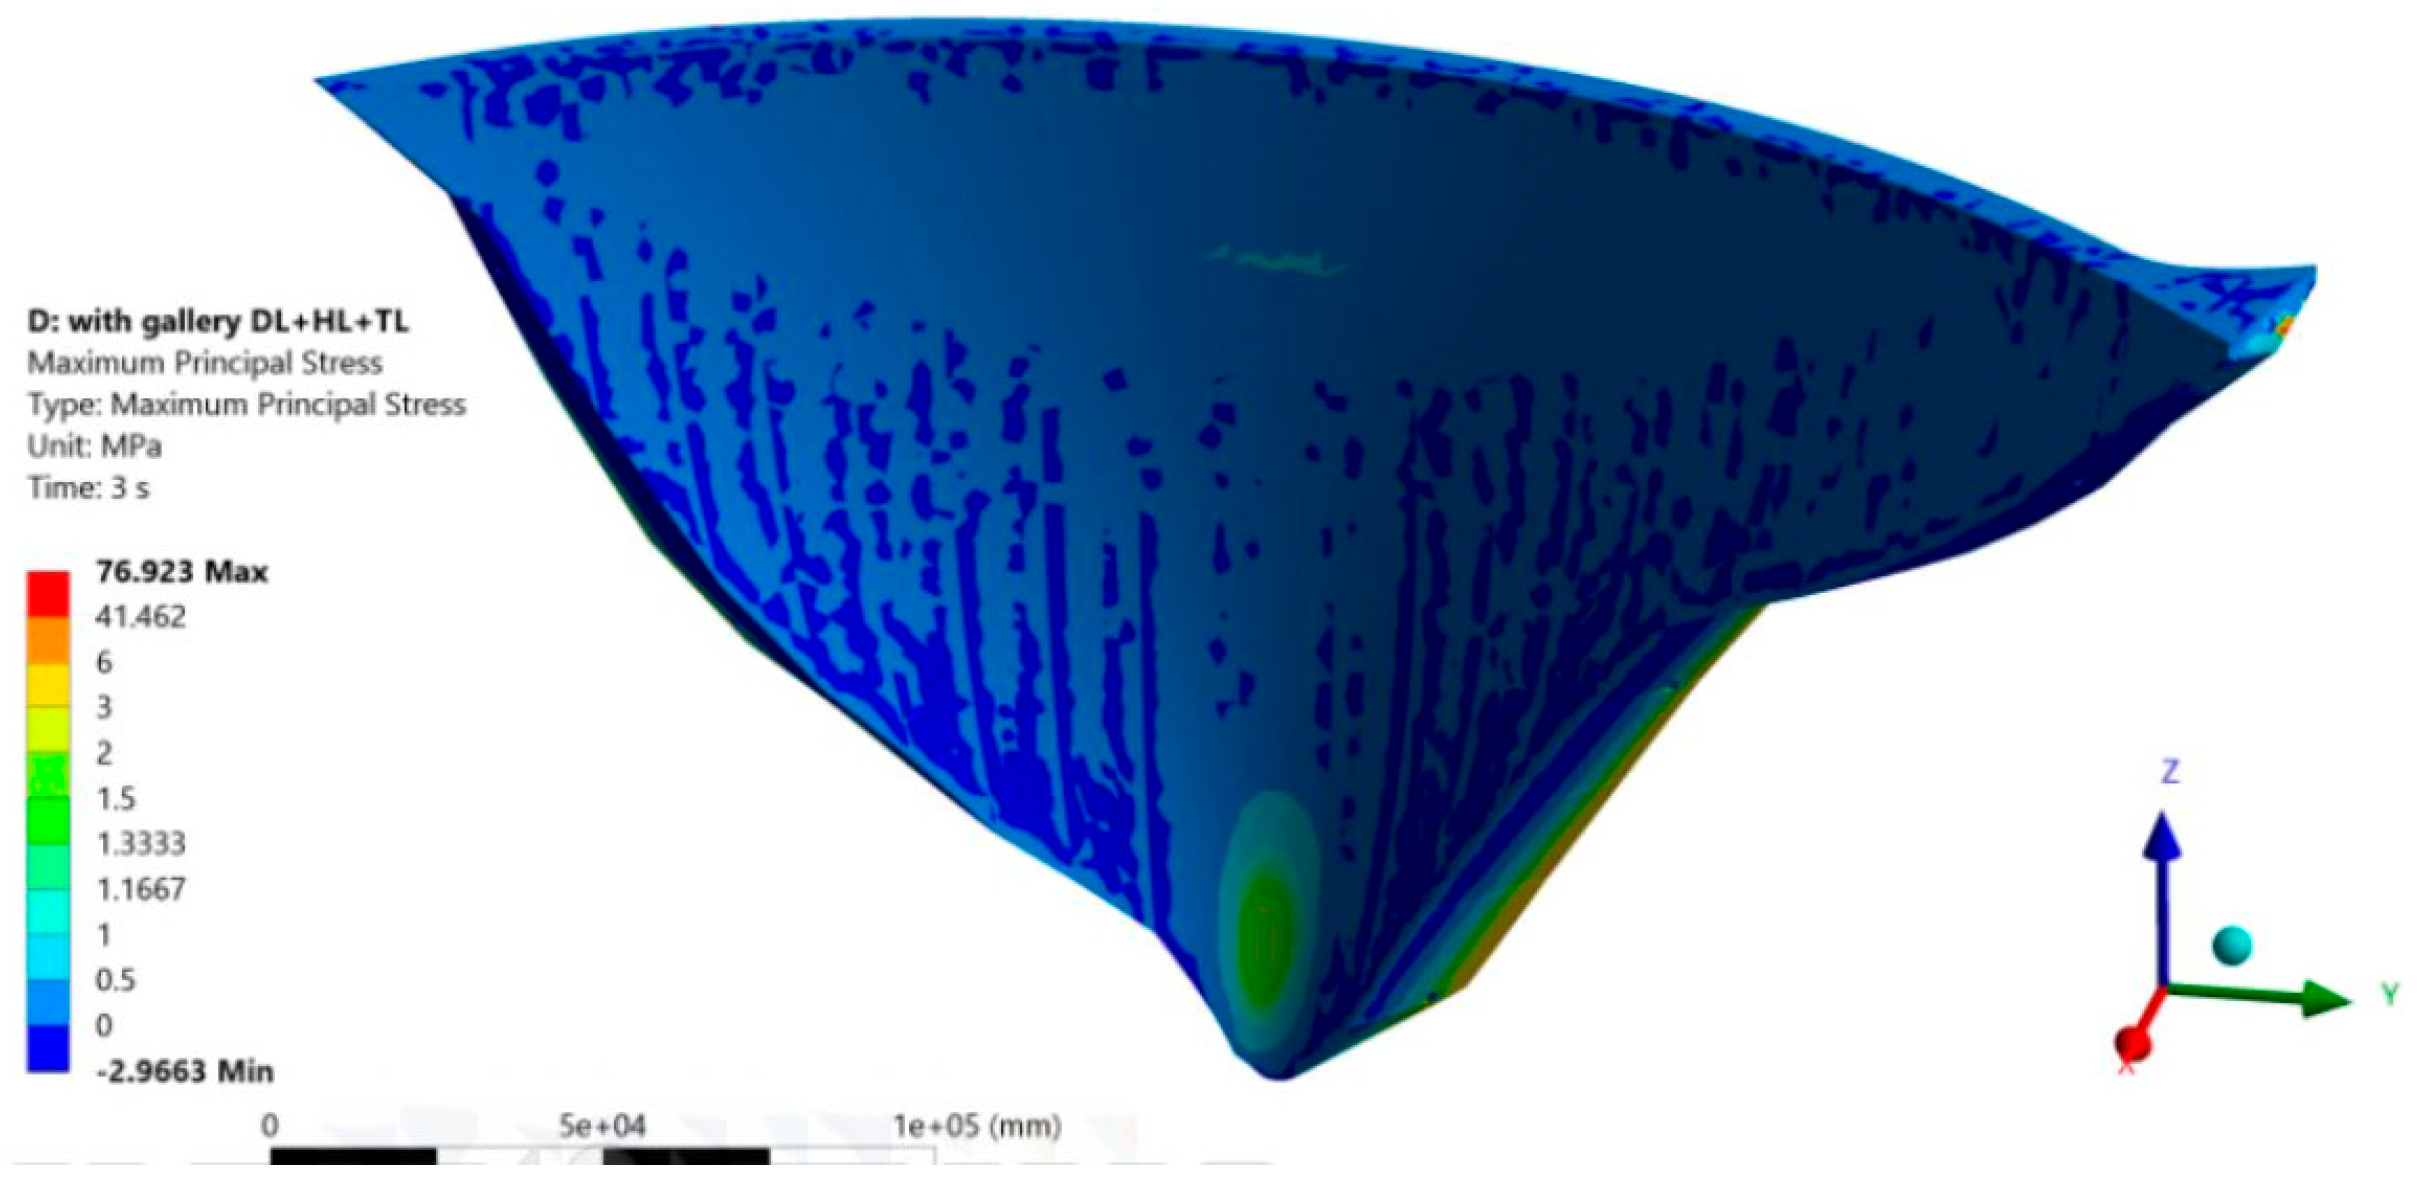
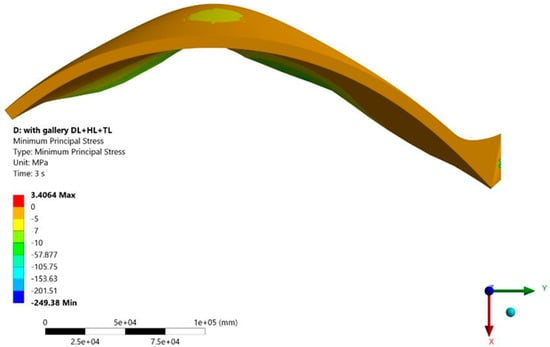
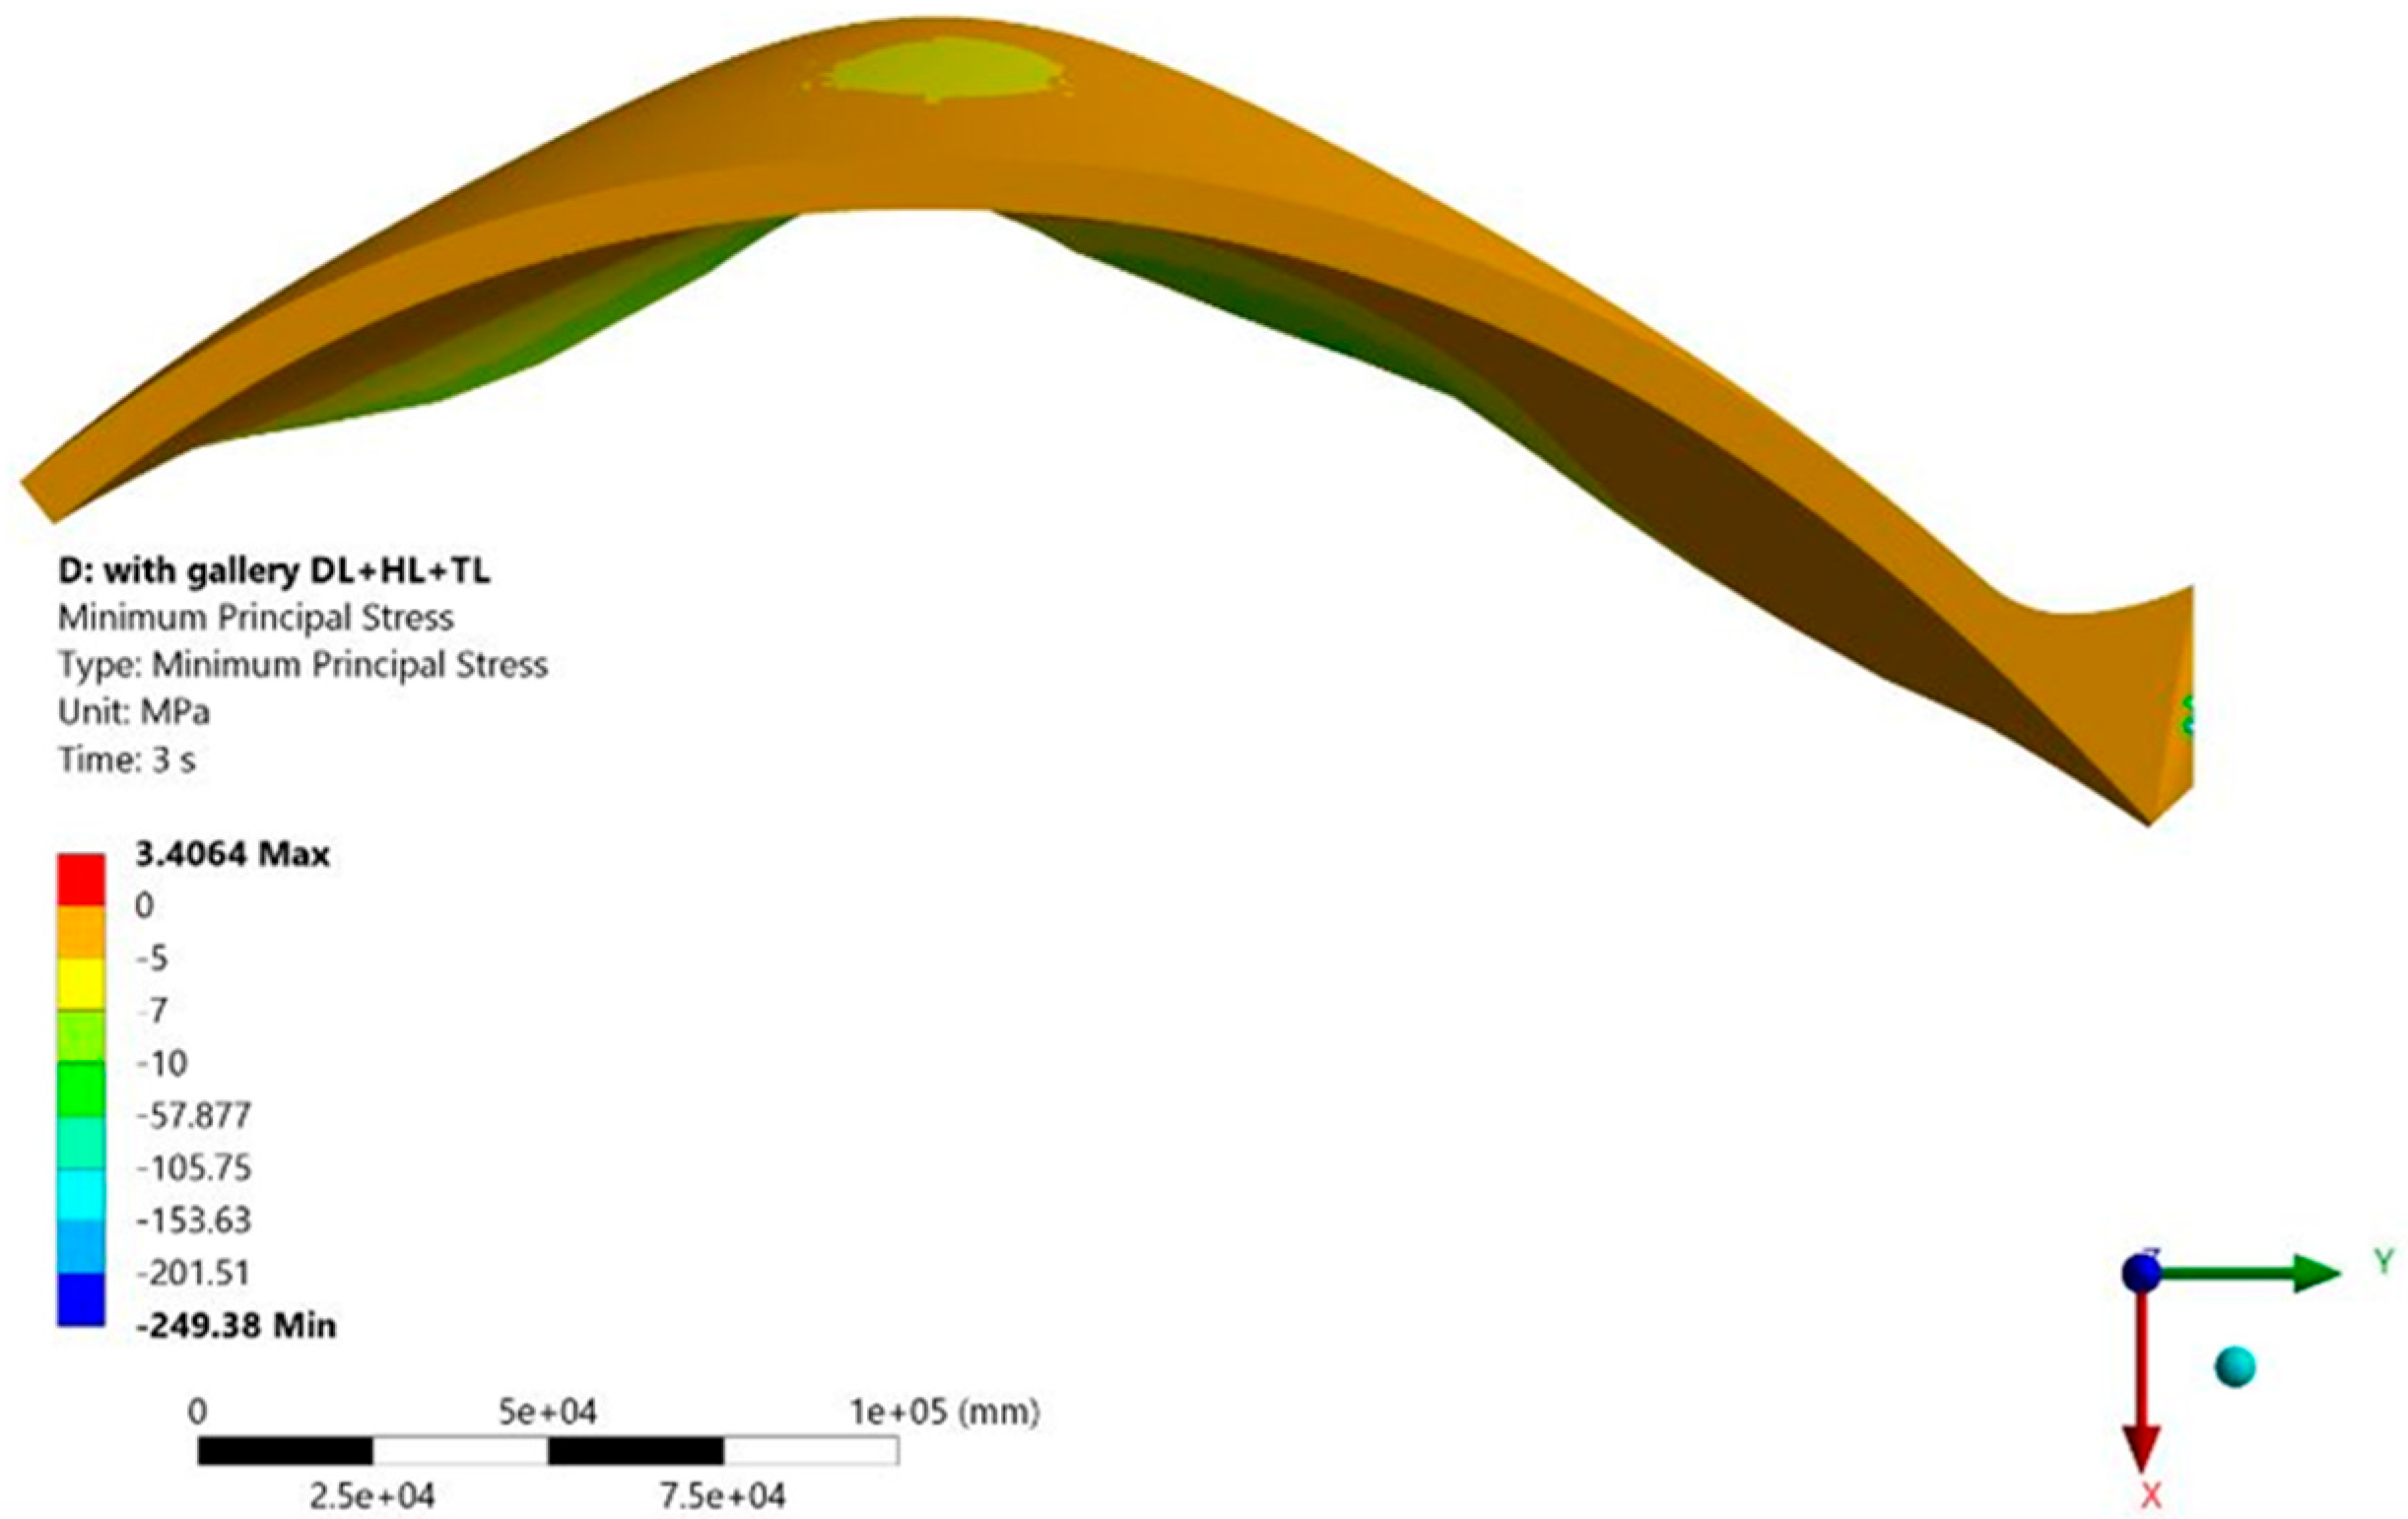
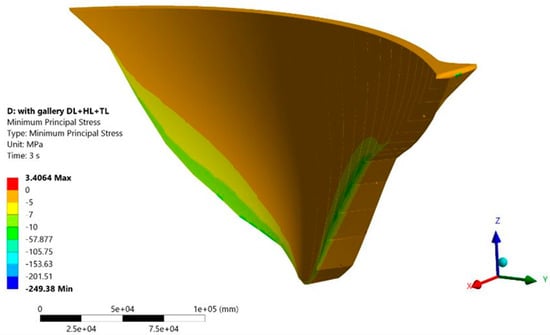
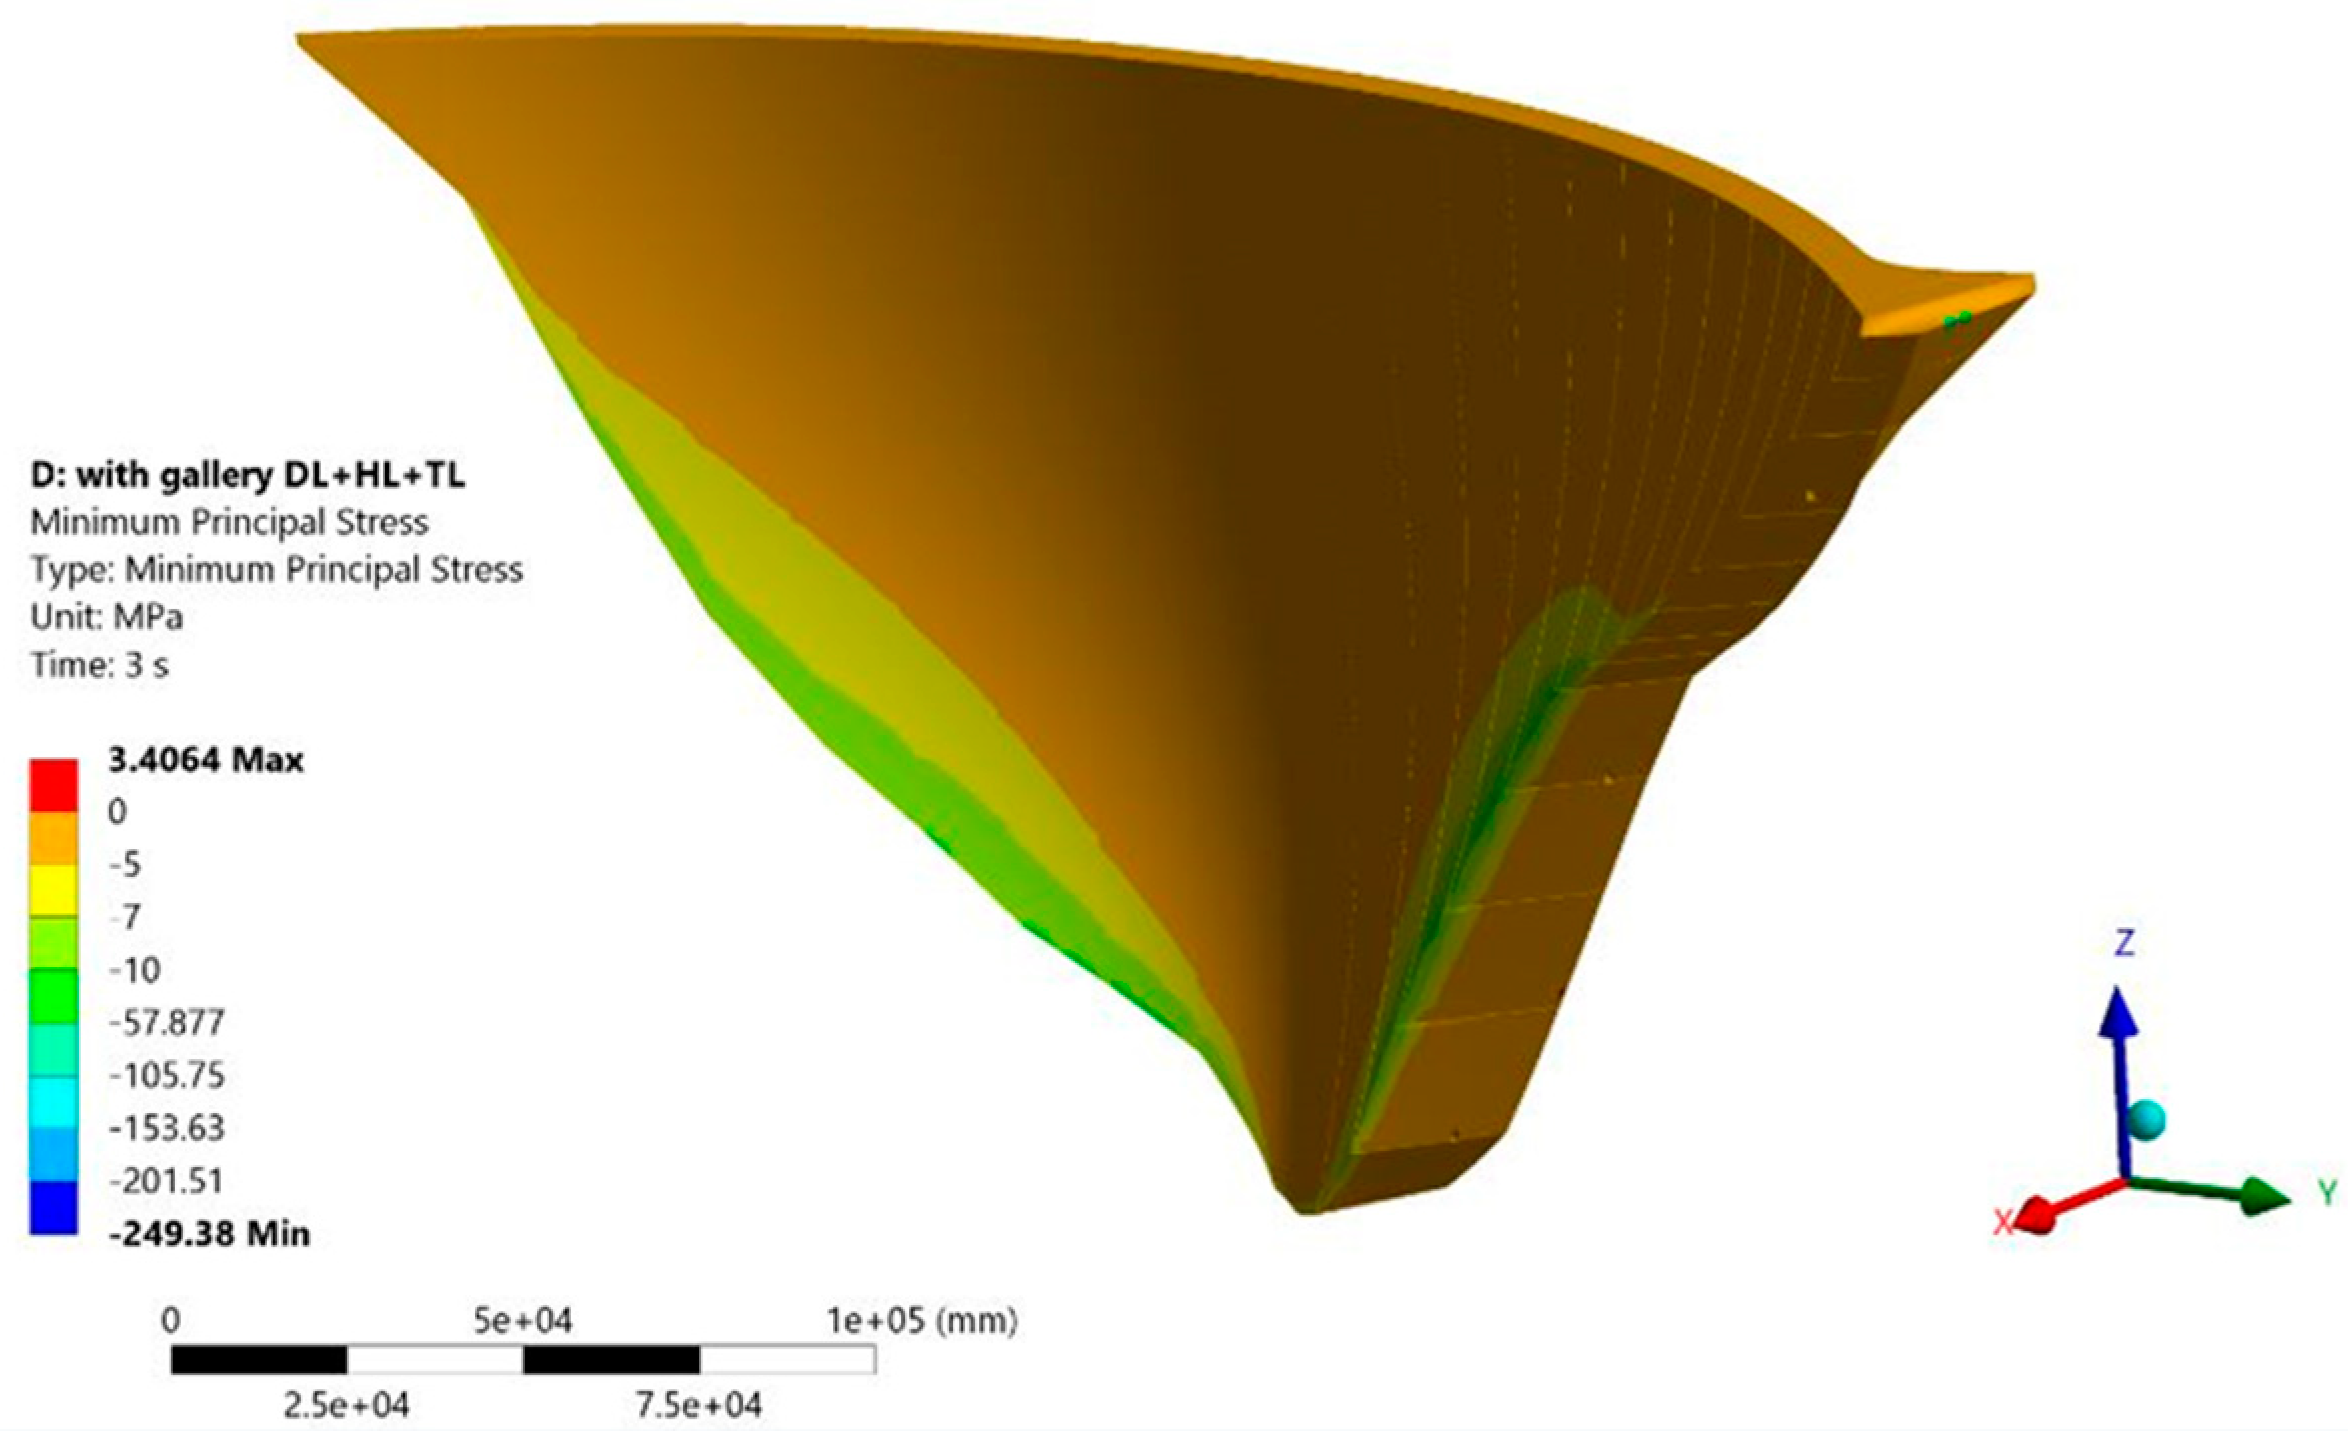
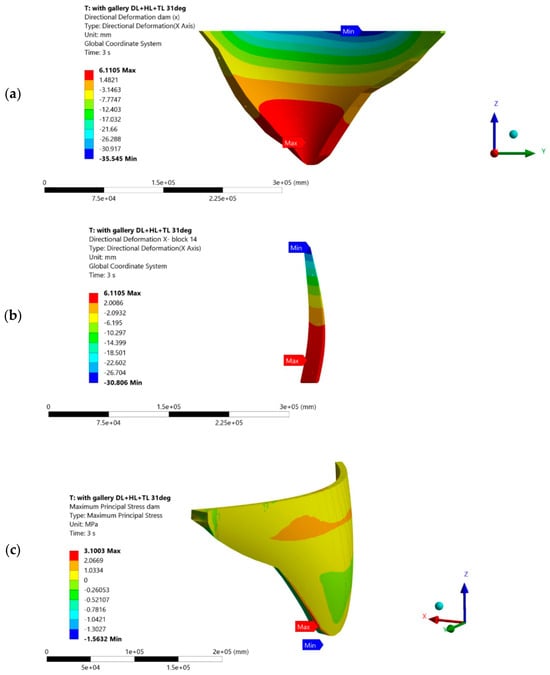
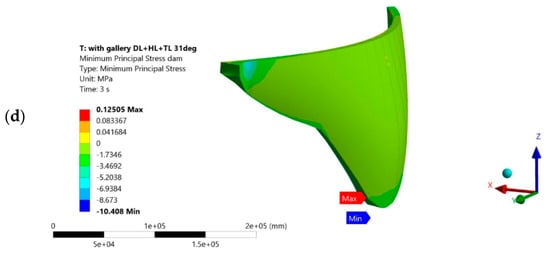
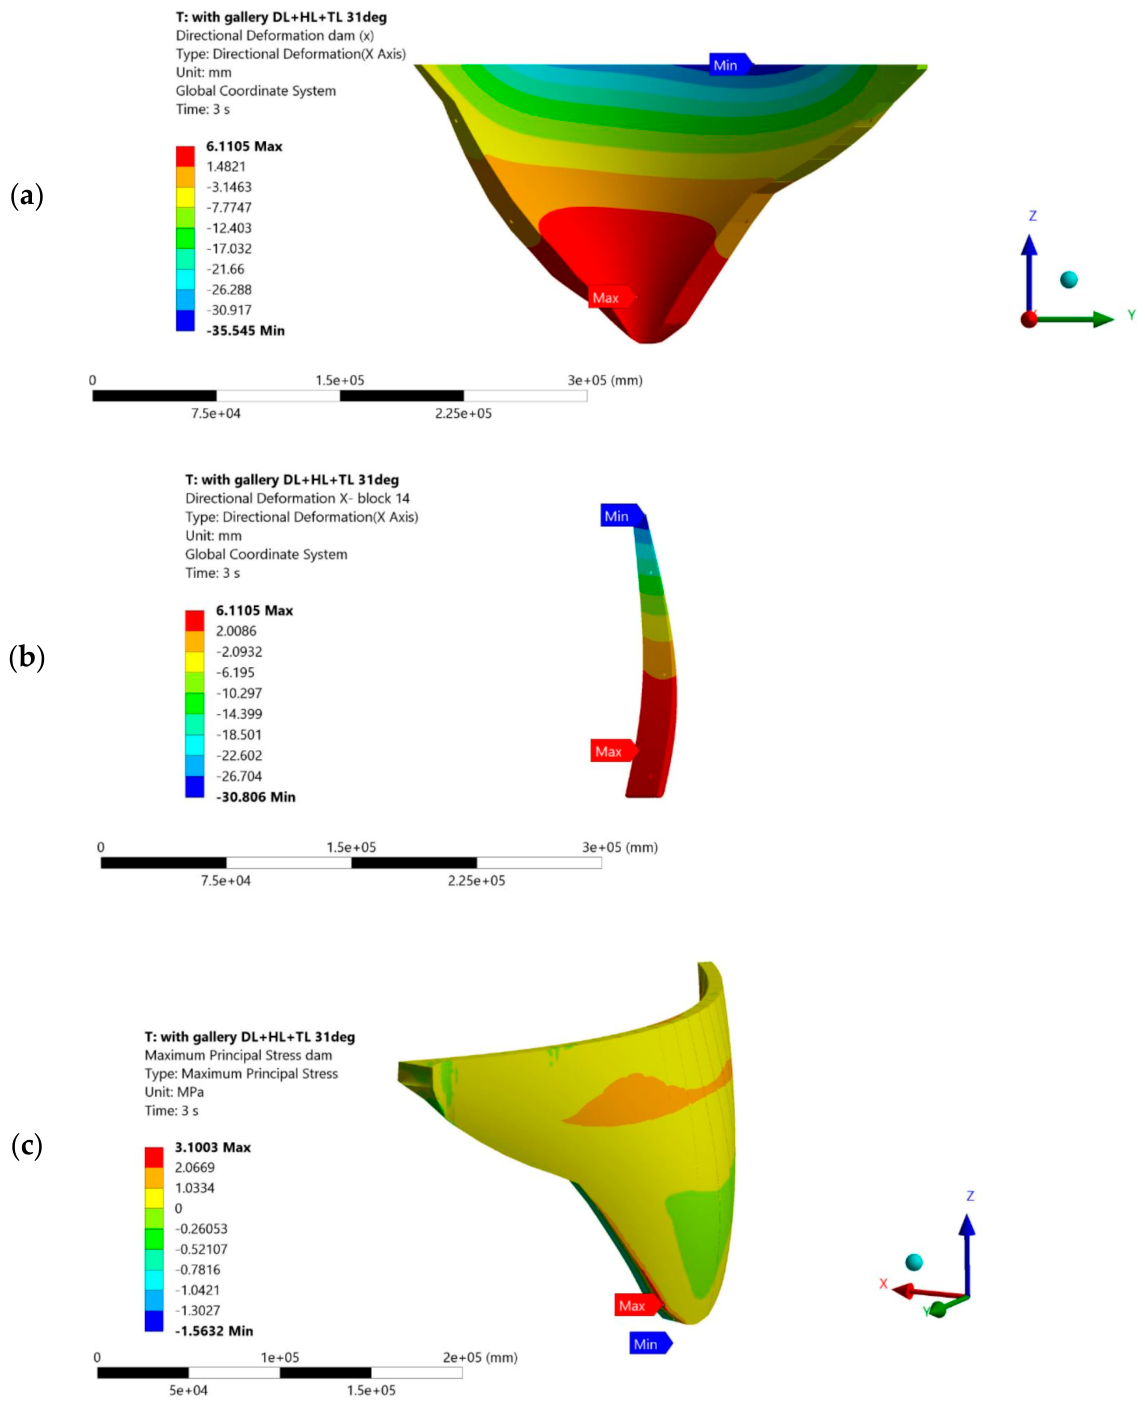
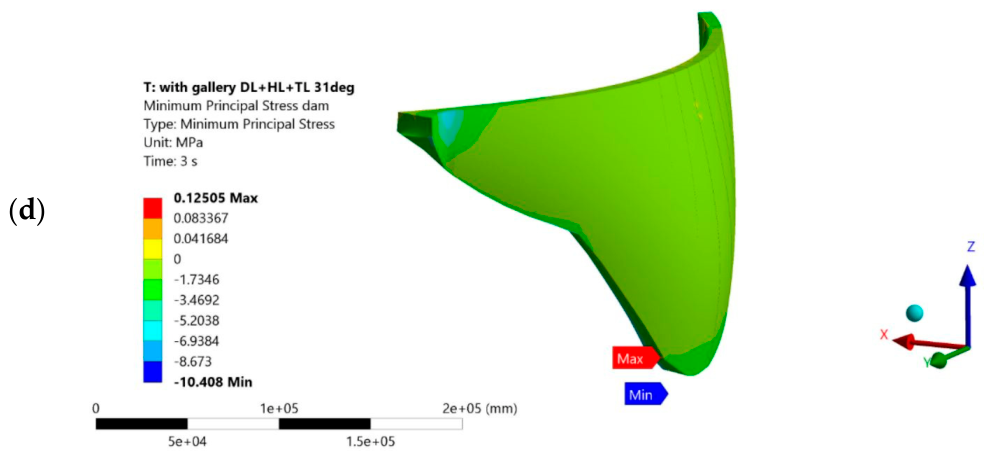
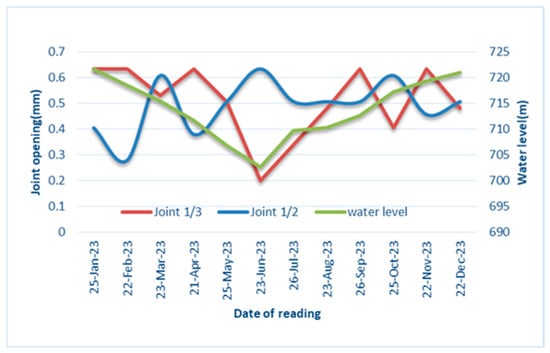
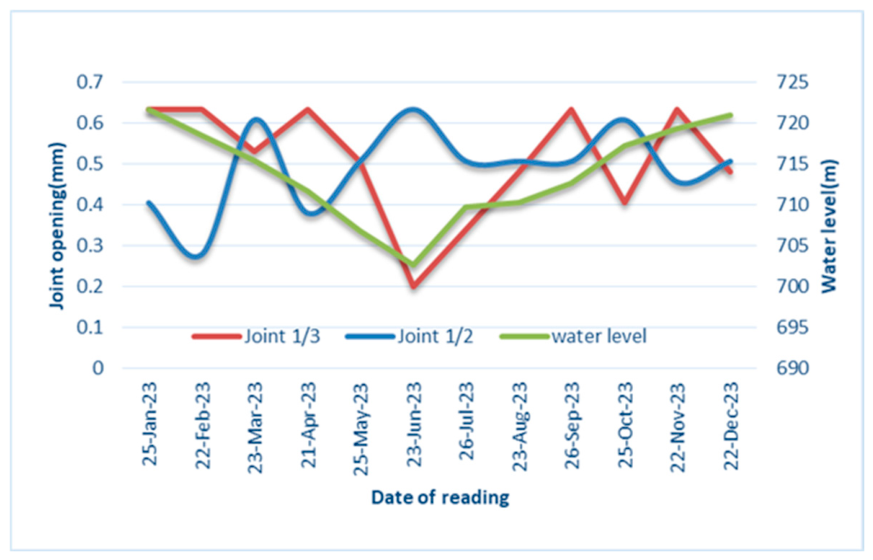
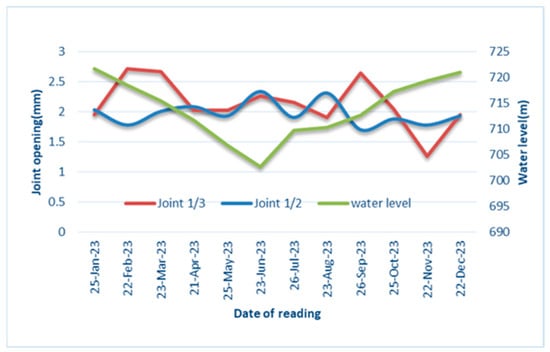
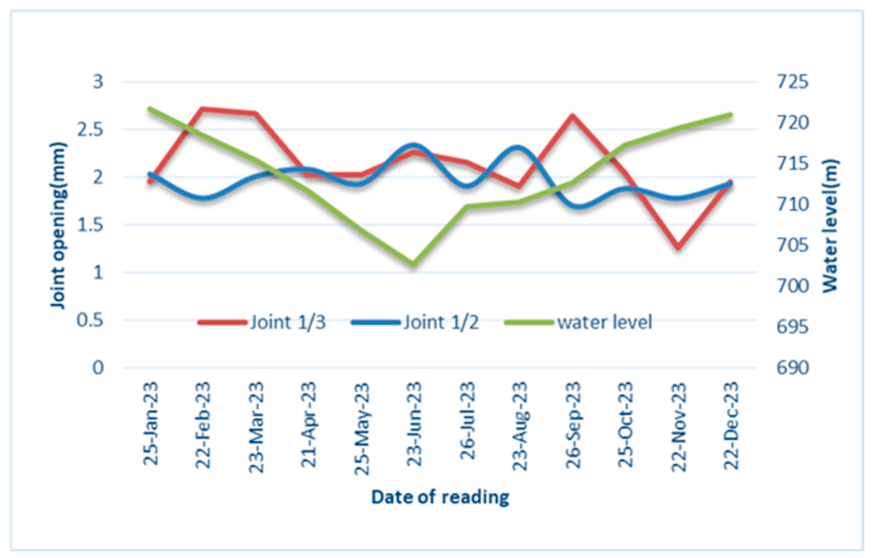
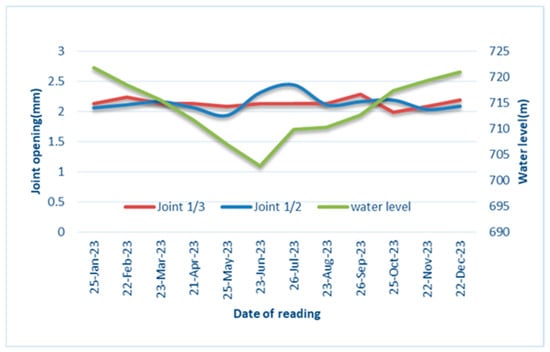
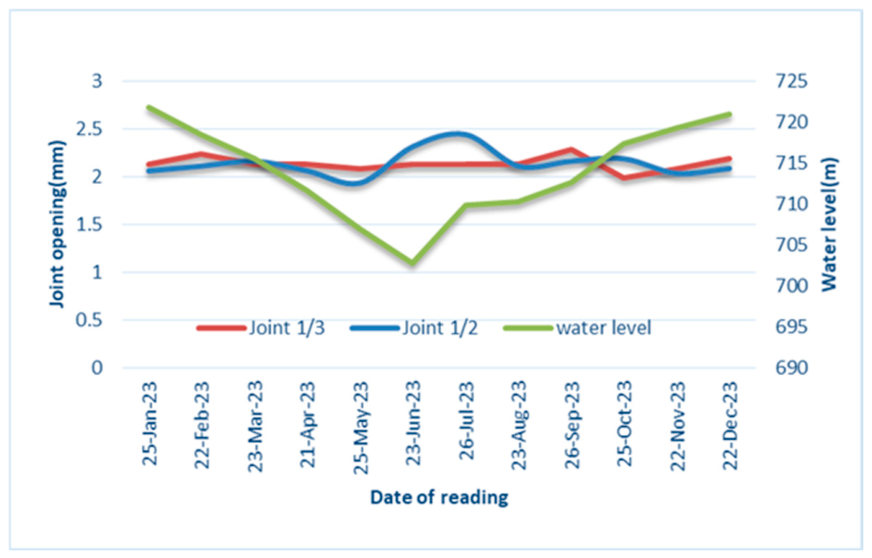
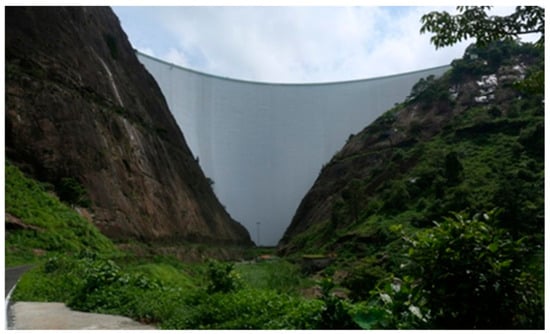
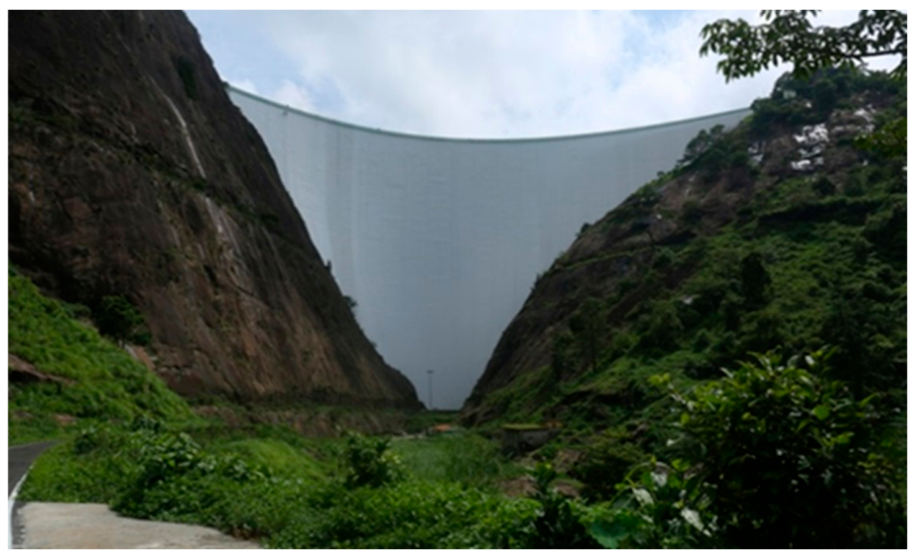
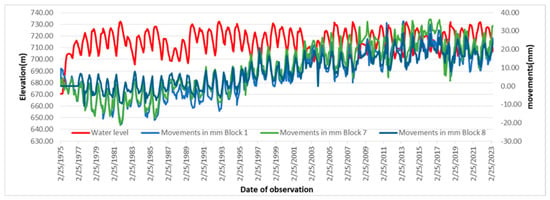
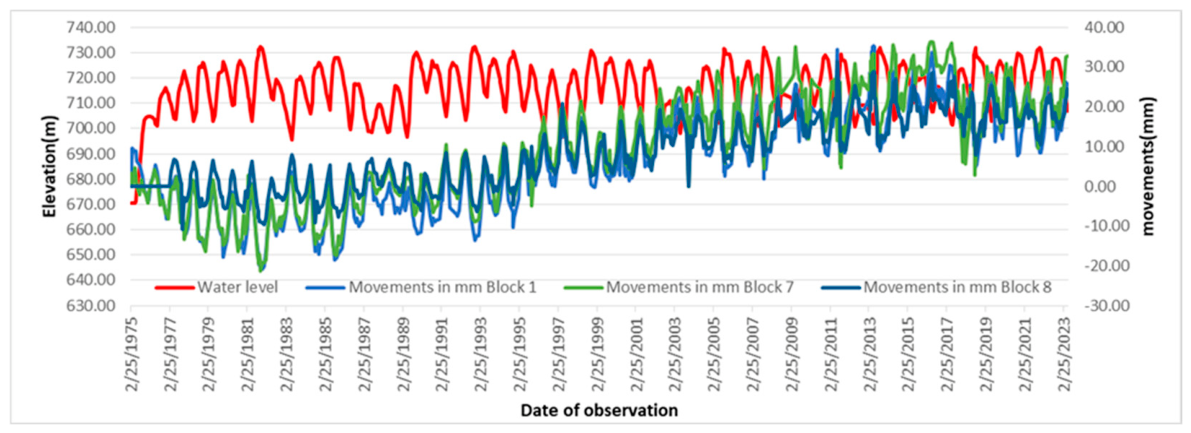
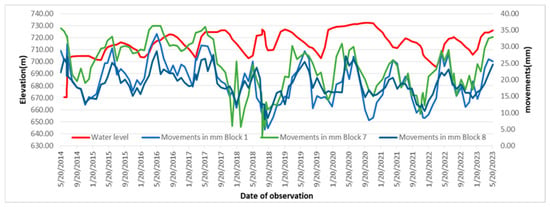
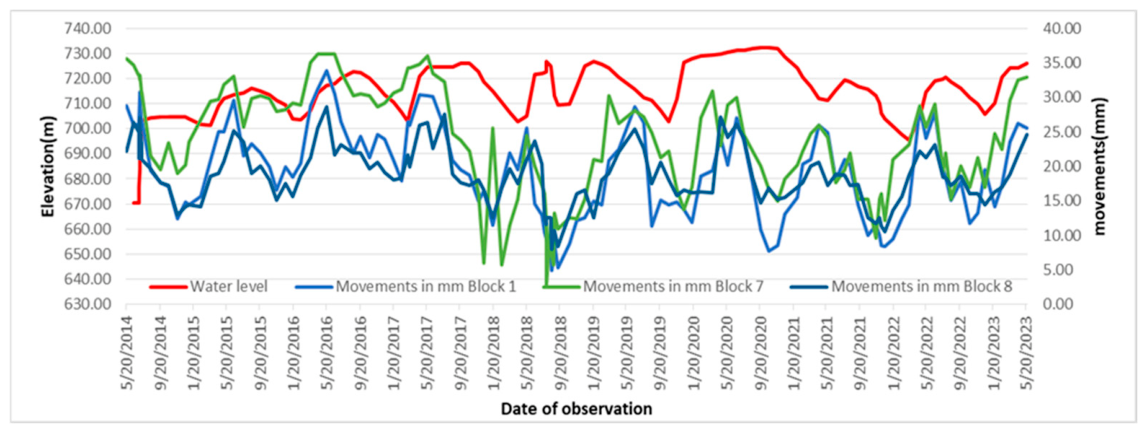

Disclaimer/Publisher’s Note: The statements, opinions and data contained in all publications are solely those of the individual author(s) and contributor(s) and not of MDPI and/or the editor(s). MDPI and/or the editor(s) disclaim responsibility for any injury to people or property resulting from any ideas, methods, instructions or products referred to in the content. |
© 2026 by the authors. Licensee MDPI, Basel, Switzerland. This article is an open access article distributed under the terms and conditions of the Creative Commons Attribution (CC BY) license.