


Abstract
To comply with stringent emission regulations, the deployment of hybridized powertrains is continuously expanding. However, architectures such as plug-in and parallel hybrids intrinsically reduce the overall runtime of the internal combustion engine (ICE). Because the battery state-of-charge (SOC) dictates intermittent engine activation, this operational strategy inevitably induces frequent cold-start events. This study investigates the thermal dynamics of commercial catalyst geometries (300–1200 cpsi, 2–8 mil) via 1D numerical simulations under real-world driving conditions. Without active heating, high-thermal-mass substrates unexpectedly outperform ultra-thin-wall variants by buffering against convective quenching during prolonged idling. However, integrating start–stop functionality halts cold exhaust flow, elevating mean temperatures and marginalizing geometric disparities. Evaluating electrically heated catalysts (EHCs) reveals that discrete preheating is highly inefficient due to rapid heat dissipation. Conversely, continuous closed-loop heating coupled with start–stop functionality sustains operational temperatures for over 90% of the cycle. Under continuous heating, substrate geometry ceases to dictate thermal performance; instead, it governs electrical efficiency. Low-thermal-mass monoliths minimize cumulative energy demand to 213 kJ (versus 277 kJ for high-mass variants), incurring a negligible CO2 penalty. Consequently, future hybrid architectures must integrate lightweight EHCs to ensure sustainable emission control.
1. Introduction
Catalytic converters are indispensable in improving emission treatment efficiency and reducing the environmental footprint of irrespective of their purpose. They enable the conversion of harmful exhaust gas components into less toxic substances under given conditions, making them a cornerstone of modern emission control. However, the thermal challenges associated with mobile systems significantly limit catalyst’s performance, durability, and cost-effectiveness. Mobile applications frequently expose catalysts to rapid thermal cycling and sustained high-temperature operations, which accelerate deactivation processes such as sintering, thermal aging, and phase transformations of the catalytical material.
A significant thermal issue in mobile applications, particularly in the automotive sector, is the achievement of the catalyst’s light-off temperature. This is defined as the minimum temperature at which the catalyst achieves a conversion rate of 50% (). Cold-start conditions, which are prevalent in short trips and urban driving, delay the attainment of this threshold, resulting in disproportionately high emissions during the initial phase of engine operation. This problem is further compounded by increasingly stringent emissions regulations, such as Euro 7 in Europe and Tier 3 in the United States [1,2]. These impose strict limits on total emissions, including those produced during real-driving conditions. The main challenge is the design of catalysts that can swiftly reach and maintain the light-off temperature, even under adverse thermal and operational conditions, without compromising long-term durability. All future standards are focusing on a reduction of nitrogen oxides (NOx), particulate matter (PM), and unburned hydrocarbons (CxHy), with a concomitant emphasis on real-driving emissions (RDEs).
Addressing these challenges necessitates a multi-disciplinary approach, integrating advances in catalyst material science, enhanced thermal management techniques, and innovative system designs. The present study investigates the nature of thermal issues in catalysts for mobile applications, with a particular focus on the light-off temperature. It also evaluates current strategies for surpassing these challenges and proposes pathways to develop thermally robust catalyst technologies capable of meeting future regulatory demands.
2. Problem Statement and Scope of This Study
Irrespective of the catalytic converter type, reaching a minimum operating temperature is imperative. Below this threshold, pollutant conversion efficiency remains inadequate, resulting in elevated tailpipe emissions. Within the context of exhaust aftertreatment thermal management, two fundamental challenges emerge. First, minimize the duration from engine start-up to reaching the light-off temperature (). Second, maintaining the substrate temperature above this critical threshold during unfavorable transient operating conditions, such as extended idling phases.
These challenges are exacerbated by increasingly stringent global emission regulations. The forthcoming Euro 7 standards [1], taking effect for new vehicle platforms in Europe, introduce unprecedented regulatory stringency. Beyond extending particulate number (PN) controls down to 10 nm (PN10), these regulations mandate stricter RDE compliance testing across a broadened ambient temperature boundary of −10 °C to 45 °C. This necessitates the optimization of light-off performance and sustained catalytic efficiency. Furthermore, the legislation mandates enhanced system durability, requiring emission control systems to maintain compliance for a minimum of 10 years or 200,000 km—a substantial extension over previous standards. This ensures lifetime emission robustness.
Modern exhaust architectures integrate multiple catalytic converters to meet these stringent limits. Each monolith acts as a significant thermal mass, strongly influencing the downstream exhaust gas temperature. Consequently, the aftertreatment system exerts a dampening effect on the transient thermal profile of the ICE. The close-coupled (initial) catalyst plays a pivotal role, as it extracts the highest thermal energy from the exhaust stream. Thermal management is particularly critical for diesel engines, as their exhaust gas temperatures are inherently lower than those of stoichiometric spark-ignition (gasoline) engines.
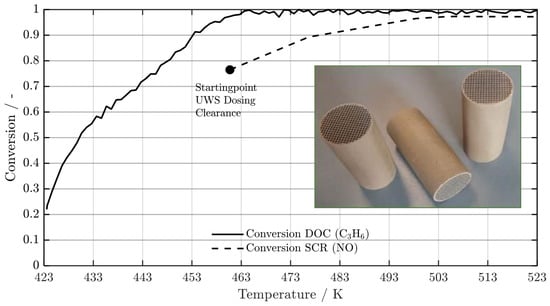
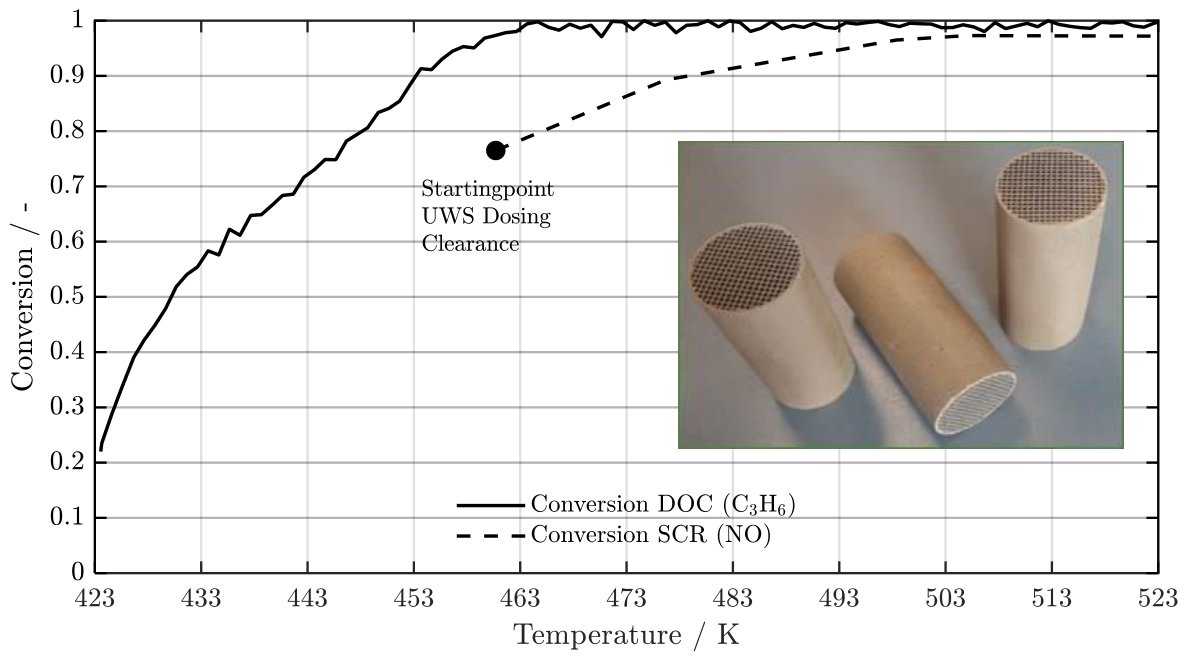
Figure 1 illustrates representative conversion curves for a diesel oxidation catalyst (DOC, targeting C3H6) and a selective catalytic reduction (SCR, targeting NO) catalyst. The core sample, depicted in the photograph, features a 1-inch diameter and a 50 mm length, utilizing a 400 cpsi cell density and a 4-mil wall thickness. The DOC comprises a platinum-group metal (PGM) ratio of 3:1:0 (Pt:Pd:Rh) with a total noble metal loading of 1.41 g/L (40 g/ft3) on an aluminum oxide (Al2O3) support.
Figure 1.
Experimentally measured conversion rate for a DOC and an SCR catalyst at a test scale with a 1-inch diameter.
The SCR catalyst features a washcoat loading of 120 g/L Cu-exchanged ZSM-5 zeolite. Measurements commenced at 423 K due to test bench operational limits. For the SCR, conversion evaluation begins at 458 K, corresponding to the minimum temperature required for urea (AdBlue) thermolysis and hydrolysis. Gas composition for the conversion analysis consisted of 10% H2O, 10% CO2, 6% O2, 500 ppm NO, 150 ppm CO, and 50 ppm C3H6, with synthetic air serving as the balance gas.
A critical metric in catalytic converter analysis is the attainment of 50% conversion efficiency. Derived from the mean of multiple experimental evaluations, a reference light-off temperature of 444 K was established for this study, thereby accounting for catalyst aging effects.
To address these regulatory and thermodynamic challenges, this study investigates the transient thermal behavior of catalytic converters by simulating the fundamental heat transfer processes between the exhaust gas and the solid substrate. The primary objective is to interpret how the geometric properties (cell density, wall thickness, and thermal mass) of the substrate influence thermal management, particularly under highly transient urban driving conditions. Through 1D numerical simulations, the research isolates the effects of substrate thermal mass and geometric surface area (GSA). While the goal is to inform the design of future heating strategies, active internal or external heating measures are excluded from baseline geometric analysis. However, the thermodynamic impact of automatic start–stop functionality is explicitly evaluated.
3. Literature Review
3.1. Significance of Light-Off Performance
Cold-start phases predominantly dictate the emission behavior of modern internal combustion engines. Because engines release up to 80% of regulated hydrocarbon (HC) and carbon monoxide (CO) emissions within seconds of starting—prior to the catalyst reaching operating temperature—optimizing light-off performance is paramount [3]. Alongside washcoat formulation, the geometric design of the ceramic or metallic catalyst substrate—defined primarily by cell density (cells per square inch, cpsi) and wall thickness (mil)—acts as the primary structural lever to minimize thermal inertia and maximize heat transfer. This study focuses on the thermal balance of the diesel oxidation catalyst (DOC) during urban driving, which presents unique thermal management challenges.
3.2. Influence of Cell Density on Transport Phenomena
Increasing cell density from a conventional 400 cpsi to 600 or 900 cpsi substantially expands the substrate’s GSA while reducing the hydraulic diameter of individual flow channels [4]. The resulting smaller channel cross-sections increase the dimensionless Nusselt and Sherwood numbers, thereby enhancing convective heat transfer from the exhaust gas to the substrate and mass transfer of reactants to the catalytically active washcoat layer. Thermodynamically, this accelerates the heating of catalytically active sites. However, increasing cell density at a constant wall thickness inevitably raises structural substrate mass and exhaust flow resistance.
3.3. The Role of Wall Thickness and Thermal Mass
To counteract this mass increase at high cell densities, the automotive industry widely adopted thin-wall (TW, 4–5.5 mil) and ultra-thin-wall (UTW, 2–3 mil) substrates. Reducing wall thickness is the most effective single measure to decrease the monolith’s total thermal capacity [4]. Such substrates extract less thermal energy from the exhaust stream during the critical cold-start phase, producing steeper internal temperature gradients and initiating exothermic reactions earlier. Concurrently, these extremely thin walls compensate for the loss of open frontal area (OFA), restricting undesirable exhaust backpressure to acceptable levels [4].
3.4. The Thermo-Catalytic Limit (The Transport Paradox)
In practice, architectures such as 600/3 (cpsi/mil) and 900/2 have emerged as highly efficient industry standards. However, comprehensive simulation and test-bench studies on three-way catalyst (TWC) design reveal thermodynamic limits to further miniaturization [5]. A direct comparison between an established 900/2 and an experimental 1200/2 substrate illustrates that indefinitely increasing cell density becomes counterproductive. Although the 1200/2 substrate exhibits marginally improved mass and heat transfer, the increased total thermal mass—resulting from the higher number of cell walls per cross-section—almost completely neutralizes this gain during cold starts [5,6]. Consequently, both geometries exhibit nearly identical light-off behavior; thus, the 900/2 substrate is generally preferred for its superior washcoat capacity.
3.5. Mechanical and Fluid Dynamic Trade-Offs
Applying UTW substrates introduces strict mechanical and manufacturing constraints. Ceramic cordierite carriers with 2-mil (approximately 50 µm) wall thicknesses inherently suffer from significantly reduced isostatic strength. This necessitates sophisticated canning methods utilizing intumescent mats to prevent catastrophic crack formation from thermomechanical stresses and engine vibrations [4]. Recent alternative research approaches increase the micro-porosity of conventional cell walls from the standard 35% to over 50%. This reduces thermal mass without thinning the wall structure to a fracture-prone minimum [7].
4. Methodology
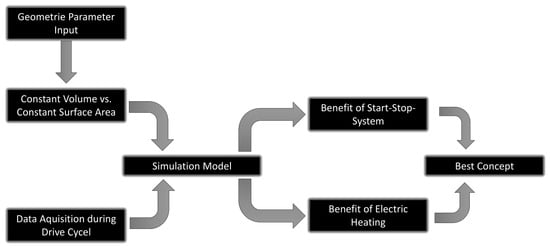
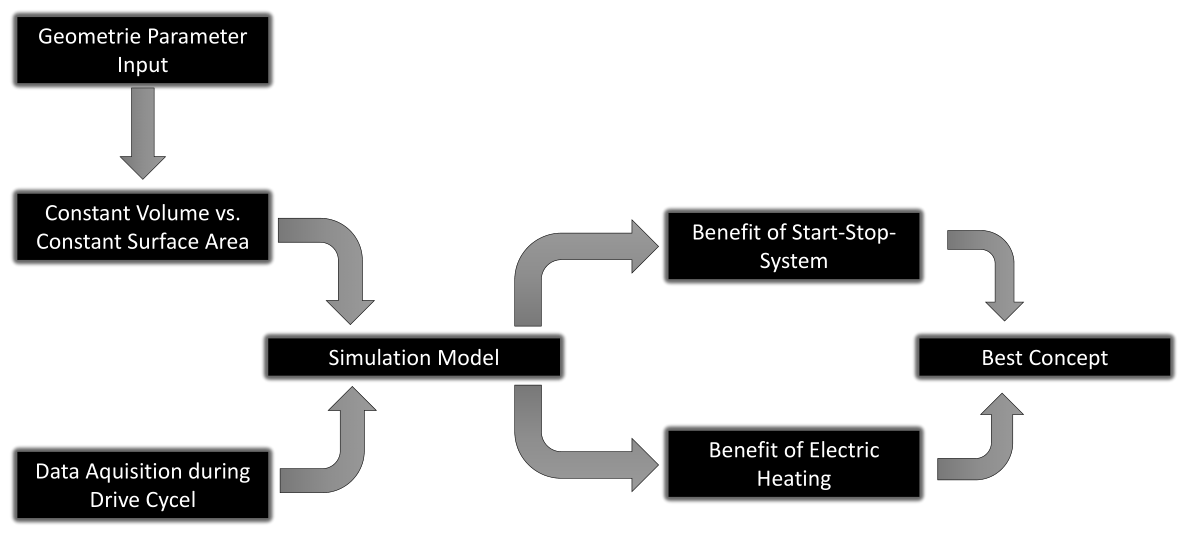
This section outlines the methodological sequence of the investigations (Figure 2). A previously published study examined the thermal behavior of catalytic converters, focusing on the influence of geometric parameters [8]. Variables such as thermal mass, GSA, and open frontal area (OFA) were systematically varied and subjected to detailed analysis. The findings demonstrated that substrate architecture—specifically cell density and wall thickness—significantly dictates the catalyst’s thermal response. Initially, the impact of these geometric properties on the physical characteristics of the monolith was evaluated, followed by an assessment of their influence on transient thermal processes.
Figure 2.
Chronological sequence of investigation.
These thermal dynamics were modeled and compared using a standardized load step. While a load step provides fundamental insights into heating and cooling rates essential for reaching a target light-off temperature, it fails to capture transient behavior under highly dynamic boundary conditions. Consequently, although the initial heating phase could be accurately mapped, the catalyst’s ability to maintain its optimal operating temperature during variable operation remained unaddressed.
To bridge this gap, the current study advances the methodology by simulating a real-world measured driving cycle. A representative urban load profile, derived from empirical test drives, serves as the boundary condition for the subsequent transient calculation of catalytic converter temperatures. Furthermore, the overall thermal management analysis now integrates the critical impacts of an automatic start–stop system and supplementary electrical heating.
This study utilizes commercially available standard honeycomb catalysts. The reference monolith has a diameter of 5.66 in (0.144 m) and a length of 6.0 in (0.152 m). To facilitate comparison across different internal geometries, cell density and associated wall thickness were systematically varied. The baseline monolith features a cell density of 400 cpsi (cells per square inch; 6.2 × 10⁵ cells/m2) and a wall thickness of 4 mil (1.02 × 10⁻⁴ m). The selection of monolith architectures is based on a previously published study, as detailed in Table 1 [8]. This 400/4 geometry serves as the reference configuration for all subsequent analyses. To ensure comparability with established industry standards and pertinent literature, this study retains the customary non-metric units for monolith dimensions.
Table 1.
Overview of the investigated honeycomb geometries.
4.1. Experimental Data Acquisition
To obtain real-world driving data, empirical test drives were conducted within the urban area of Innsbruck, Austria. The resulting speed profile closely aligns with the low-speed segment of the Worldwide Harmonized Light Vehicles Test Procedure (WLTP). The test vehicle served exclusively as an exhaust gas generator to provide realistic boundary conditions for subsequent thermal calculations. The selected vehicle represents a high-volume European platform, featuring an engine widely deployed across the manufacturer’s corporate fleet. The test engine (Table 2) complies with the Euro 5 emissions standard and incorporates several baseline systems for rapid warm-up and catalytic converter heating.
Table 2.
Summary of the test vehicle’s basic data.
Hardware and Architectural Measures:
- Integrated Exhaust Manifold (IEM);
- Split Cooling Architecture;
- Switchable Coolant Pump;
- Close-Coupled Aftertreatment;
- Integrated Intercooler.
Calibration and Software Measures:
- Zero-Flow Coolant Strategy;
- EGR Cooler Bypass;
- Combustion Phasing and Post-Injection;
- Air Path Throttling;
- Elevated Idle Speed;
- Extended Post-Glowing.
Compared to the advanced thermal management required for the Euro 7 standard, this Euro 5 configuration utilizes a relatively limited scope of heating measures. This specific vehicle generation was deliberately selected to serve purely as a baseline exhaust gas source; its built-in thermal management plays a subordinate role, ensuring that highly complex active heating strategies do not obscure the intrinsic thermal comparison of the evaluated catalyst geometries.
To acquire the necessary measurement data, three test drives were conducted. Each run was initiated from a cold engine start. The first two drives were executed with the automatic start–stop system enabled, while the third was conducted with the system deactivated. This methodology allowed for the precise identification of the start–stop activation thresholds and established the baseline parameters for engine idling.
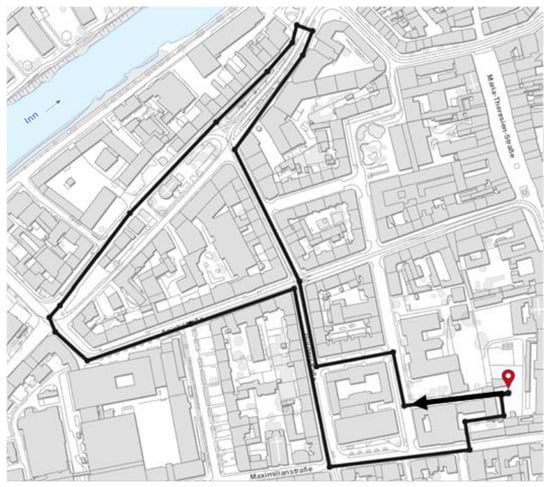
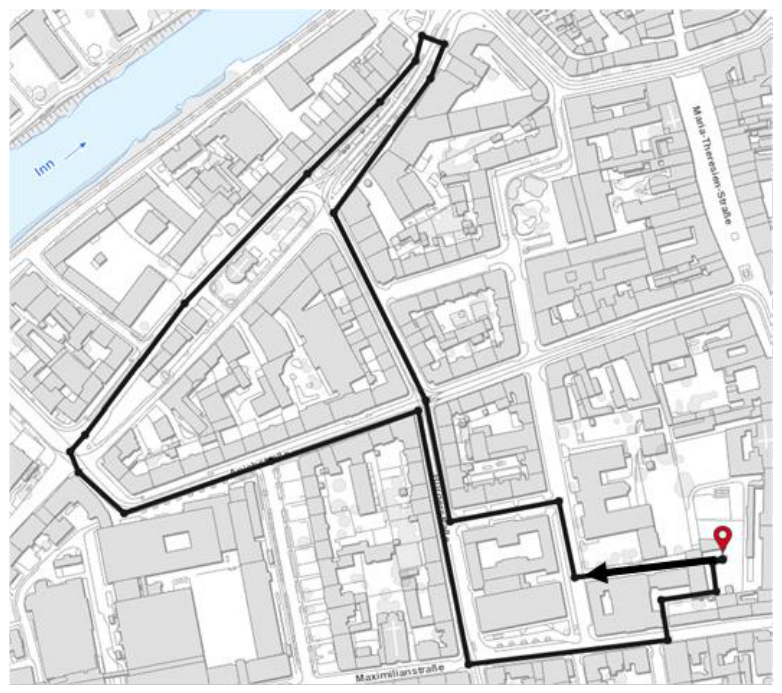
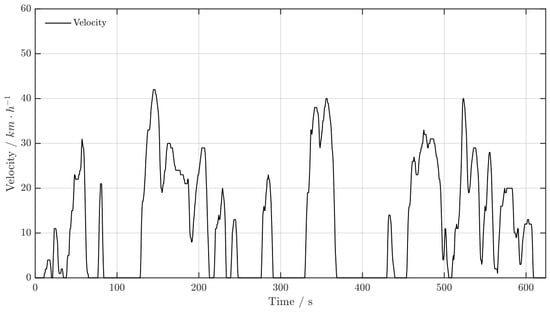
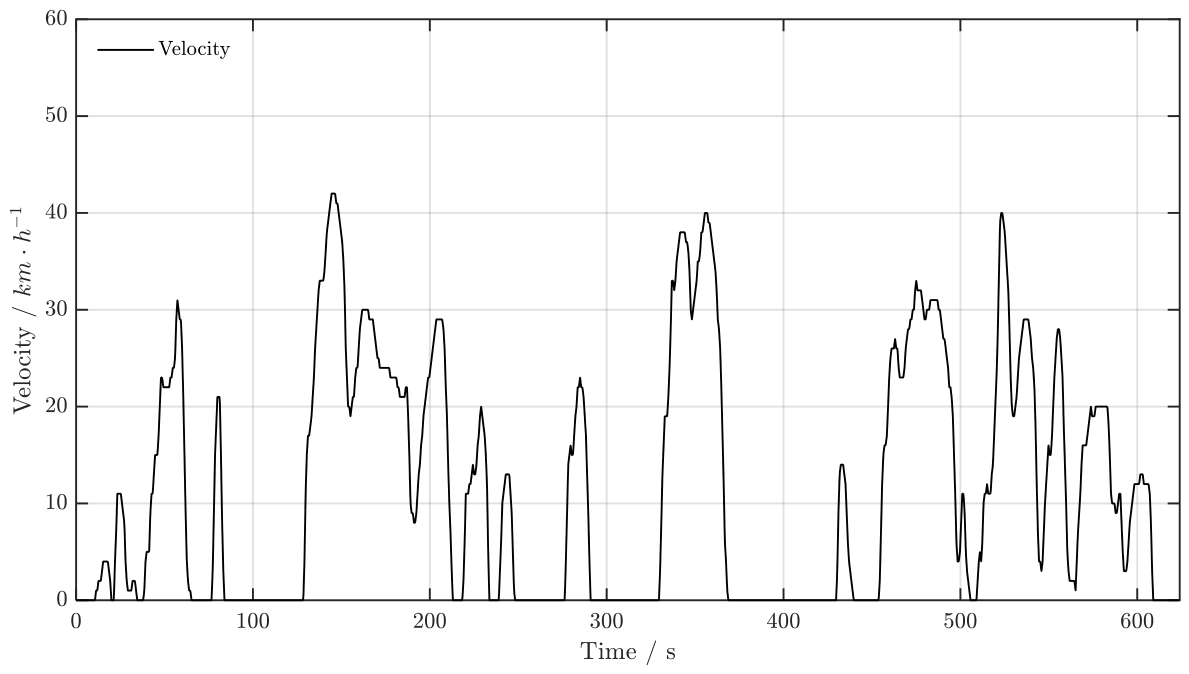
Data were collected using vehicle diagnostic software moDiag (version 3.5, sotima solutions, Bad Salzuflen, Germany) at a sampling rate of 1 Hz. Vehicle speed was independently recorded using an external Global Positioning System (GPS) logger (Garmin Venu® 2, Garmin Ltd., Olathe, KS, USA). The driven route within the urban area of Innsbruck is illustrated in Figure 3, and the corresponding speed profile is shown in Figure 4.
Figure 3.
The route of the test drive has been documented through GPS tracking [9]. The arrow indicates the direction of travel.
Figure 4.
Velocity profile of the driving cycle.
Because the elevation change along this specific test route was negligible, an altitude profile is omitted. The data presented in the subsequent diagrams were recorded on 9 June 2020, at 16:00 local time. The ambient temperature was 16.4 °C, with a barometric pressure of 100,990 Pa.
Urban driving cycles exhibit highly transient velocity profiles, characterized by frequent stops at traffic lights and intersections. Concurrently, the peak velocity remains below the mandatory urban limit of 50 km/h. The speed profile demonstrates very brief durations at maximum speed alongside three extended idling periods.
Exhaust gas temperature is measured upstream of the DOC, with data acquired directly from the engine management system. The exhaust gas mass flow is calculated using fuel volume flow data derived from the injection control parameters. The required fuel quantity depends on dynamic driving conditions and is determined by the engine control unit (ECU) based on engine speed and load. The diagnostic software estimates fuel consumption using the accelerator pedal position. Exhaust mass flow estimation begins by converting the fuel volume flow into fuel mass flow using fuel density, as expressed in Equation (1):
Assuming a constant fuel temperature of 16 °C, a fuel density of 837 kg/m3 was applied. The temperatures recorded by the diagnostic tool were subsequently interpolated to a 0.2 s temporal resolution (5 Hz) for the transient thermal modeling. The total exhaust mass flow was then computed using Equation (2), applying the conservation of mass to the calculated fuel mass flow and the measured intake air mass flow:
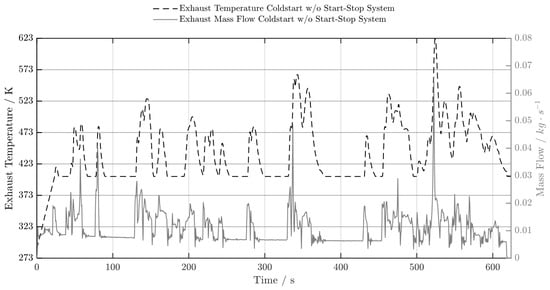
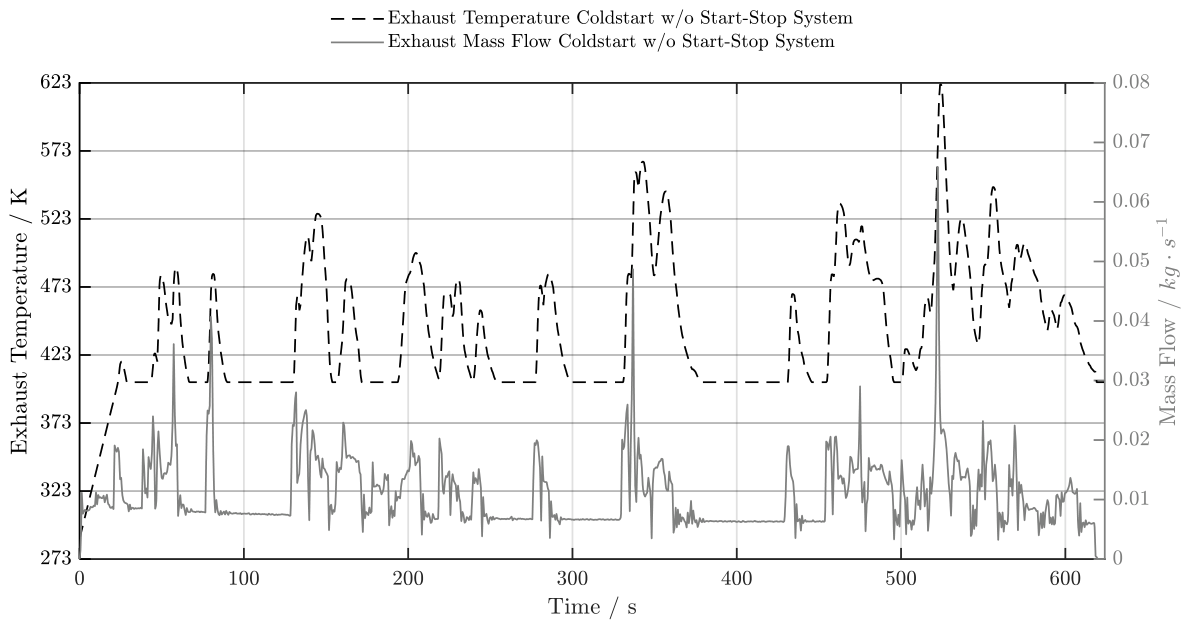
Figure 5 illustrates the transient exhaust gas temperature and the calculated exhaust mass flow. Because this specific cycle was recorded with the automatic start–stop system disabled, the mass flow does not drop to zero during prolonged idle phases.
Figure 5.
Exhaust gas temperature curve and exhaust gas mass flow curve for cold start w/o start–stop system.
4.2. Simulation Model
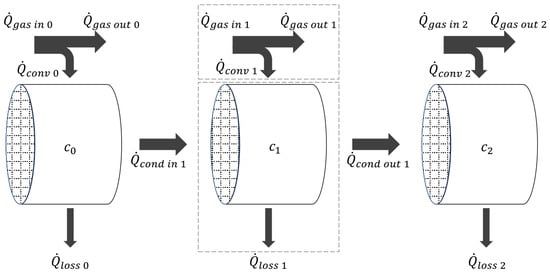
The simulation framework developed by Moeltner et al. [10] is employed to numerically investigate the transient thermal behavior of automotive catalytic converters. The model computes heat transfer processes within the exhaust system using two coupled 1D simulations, accurately capturing the thermal dynamics of both the solid catalyst substrate and the exhaust gas flow. To calculate spatial and temporal temperature distributions, the exhaust system is discretized into uniformly distributed control volumes (Figure 6). The chosen spatial resolution ensures grid-independent results, where further refinement of the cell dimensions yields negligible improvements in computational accuracy.
Figure 6.
Illustration of the cell modelling of the calculation system.
A detailed energy balance of a single cell reveals four distinct heat transfer mechanisms. Equation (3) describes the overall thermal equilibrium, incorporating the conductive heat transfer between adjacent structural cells, the convective heat transfer between the exhaust gas and the solid substrate, and external heat losses.
Heat exchange between the exhaust gas and the catalyst substrate is predominantly governed by forced convection. This convective transfer is driven by the temperature differential between the fluid phase and the solid monolith. Additionally, localized flow characteristics and the geometric surface area dictating the solid-fluid interface are primary determinants of the heat transfer coefficient. Because both the exhaust gas and the solid substrate experience continuous transient temperature variations due to this reciprocal heat exchange, a two-phase thermal model is necessitated, solving separate energy equations for the gas and the solid phases.
The temperature evolution of the exhaust gas is governed by the convective heat emitted or absorbed within a fluid control volume. The representative thermal gradient across this fluid cell is approximated using the logarithmic mean temperature difference , as defined in Equation (4).
The solution to this equation is obtained through an iterative solver, applying the Dirichlet boundary condition at the exhaust gas inlet.
Time-dependent temperatures of both the solid substrate and the exhaust gas are determined by employing the Euler method within the MATLAB, version R2024b (MathWorks, Natick, MA, USA) environment, utilizing a temporal resolution of 10−3 s. The computational model is simplified through the following thermodynamic assumptions:
- The catalyst housing is assumed to be adiabatic, neglecting heat losses to the ambient environment ().
- The substrate is modeled as homogeneous cordierite with isotropic thermophysical properties.
- Ambient pressure remains constant at 101,325 Pa.
- The exhaust gas is treated as an ideal gas with a specific gas constant of R = 287 J/(kg·K).
- Each control volume is isothermal, implying negligible transverse temperature gradients within individual cells.
- Exothermic catalytic reactions are neglected, decoupling chemical kinetics from the thermal fluid dynamics.
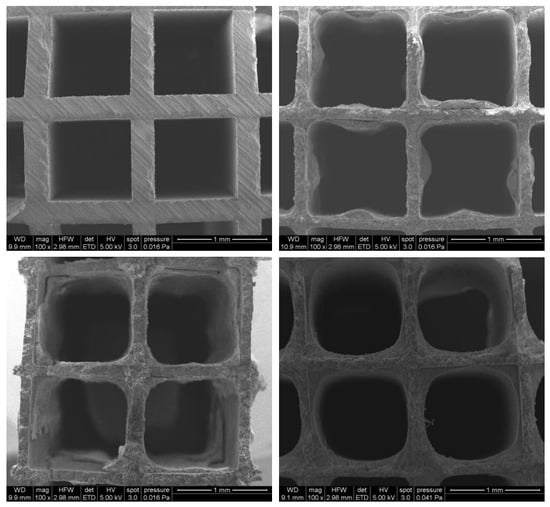
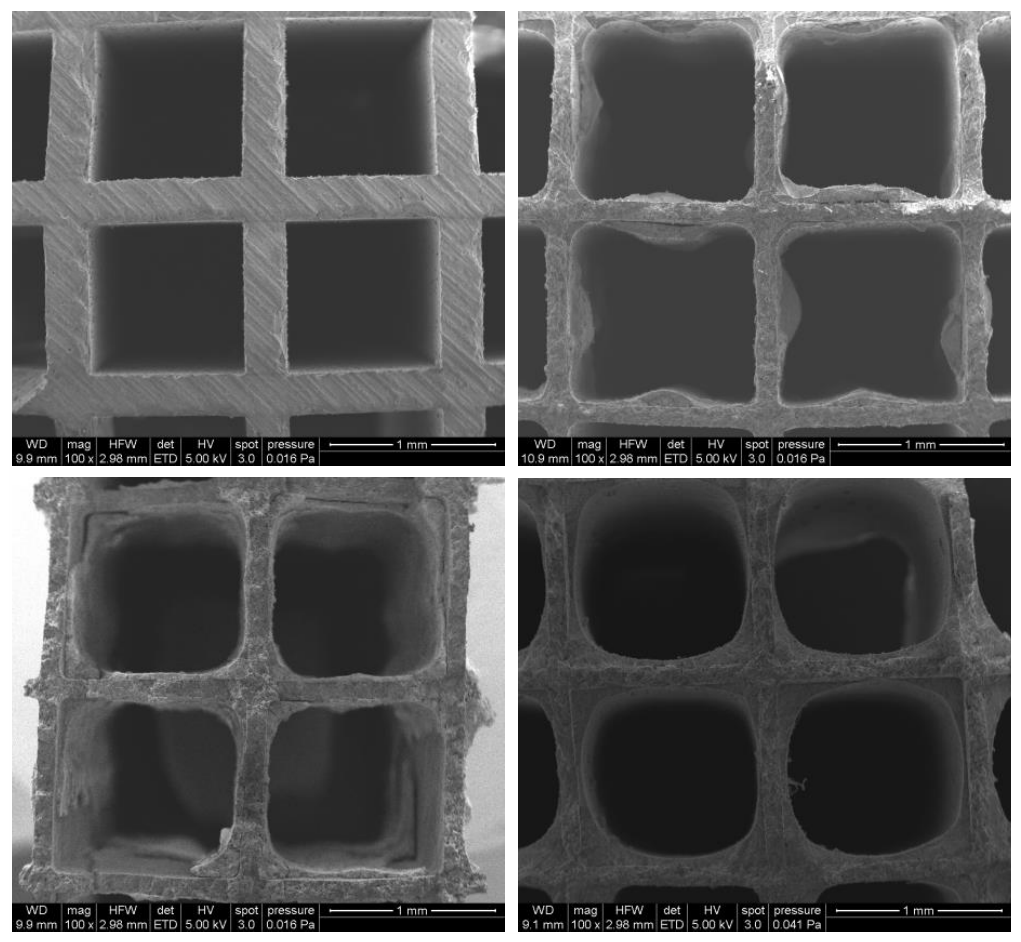
Figure 7 presents scanning electron microscopy (SEM) images of various experimental catalysts. The top-left panel displays a bare, solid extrudate (400 cpsi, 8-mil wall thickness), contrasted with three distinct washcoated substrates, each featuring a baseline architecture of 400 cpsi and a 4-mil wall thickness. These micrographs clearly demonstrate that the washcoat layer exerts a substantial influence on both the free open channel area and the cross-sectional morphology. As is visually evident, this structural alteration is highly contingent upon the manufacturer, the specific coating methodology, and the fundamental substrate geometry (particularly cell density).
Figure 7.
Comparison of SEM pictures between a solid extrudate and three catalysts with different washcoats.
In the computational model, the fluid-dynamic and thermodynamic treatments of this washcoat layer are methodologically decoupled. To simplify the fluid-dynamic calculations, the washcoat’s physical constriction of the channel shape is neglected; consequently, flow characteristics strictly rely on the nominal hydraulic diameter of the bare carrier material. Conversely, for the thermal calculations, the physical mass and resulting thermal capacity of the washcoat are explicitly incorporated. The standard washcoat support material, Al2O3, exhibits a specific heat capacity () closely matching that of cordierite. Assuming a uniform washcoat loading of 120 g/L, this active layer directly and significantly impacts the total thermal inertia of the monolith. For the baseline reference variant, this loading translates to an absolute mass addition of 0.3 kg, representing a substantial 37.2% increase in total structural weight.
Consequently, simulation results involving modifications to the substrate length must be interpreted with caution. Because the washcoat loading is volume-specific (g/L), reducing the monolith volume inherently decreases the absolute catalytic mass, thereby altering the thermal scaling.
The thermophysical properties of the exhaust gas are highly temperature-dependent. Equations (5)–(8) [11] are valid for pressures below 500 kPa and within a temperature range of 223 K to 773 K [11]. Based on kinetic gas theory, the dynamic viscosity and thermal conductivity of ideal gases can be analytically derived. Because the mean free path increases proportionally with decreasing density, the dynamic viscosity and thermal conductivity of these gases remain largely independent of pressure across a wide operational range. Furthermore, the low particle density of ideal gases ensures unrestricted molecular motion, rendering the specific heat capacity effectively independent of pressure.
The empirical polynomial coefficients utilized in Equations (5)–(7) describe the thermophysical properties of standard dry air. Because the investigated urban transient scenarios are characterized by low engine loads and significantly elevated air-to-fuel equivalence ratios (λ >> 1), the exhaust stream is overwhelmingly dominated by diatomic nitrogen () and unburned oxygen (). Under these specific operating conditions, the employment of dry air as a surrogate fluid provides a highly accurate approximation for the gas-phase specific heat capacity, dynamic viscosity, and thermal conductivity. While a detailed multi-species gas evaluation would be strictly required for high-load regimes approaching stoichiometry—due to the increased mass fractions of combustion products such as and —the thermophysical deviations from pure air remain mathematically negligible for the partial-load urban cycles evaluated in this study.
Solid-phase heat conduction within the catalytic substrate, specifically between adjacent cells, is driven by localized temperature gradients. The effective thermal conductivity of the substrate is the dominant parameter, which depends intrinsically on the specific monolith material. To ensure optimal catalytic conversion efficiency, reaching the light-off temperature (T50) and maintaining the requisite gas residence time are critical. This requires maximizing the GSA to enhance convective heat and mass transfer between the exhaust gas and the heated honeycomb structure.
For a rigorous comparative analysis, the subsequent diagrams evaluate the geometric parameters under three distinct boundary conditions: (1) constant reference monolith volume for all cell densities and wall thicknesses, (2) constant GSA, and (3) constant space velocity (SV) across all variants.
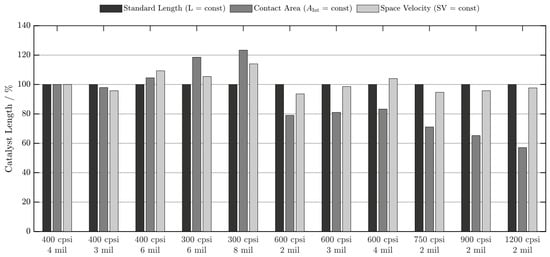
Figure 8 compares the substrate lengths under the three defined boundary conditions. In the configuration where all variants maintain the reference volume, the monolith lengths remain identical. To maintain a constant GSA, variants with higher cell densities necessitate a proportional reduction in length. Conversely, maintaining a constant SV results in only marginal length variations compared to the baseline, driven solely by minor differences in the open frontal area (OFA).
Figure 8.
Effect on monolith length when equalizing the contact area and space velocity.
Under standard dimensions, the GSA increases significantly for models with higher cell densities. This trend is also observed when the SV is kept constant, as the geometric differences in this scenario are minimal.
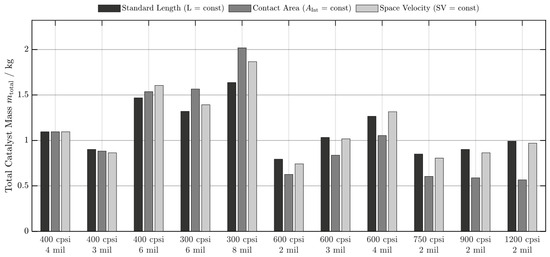
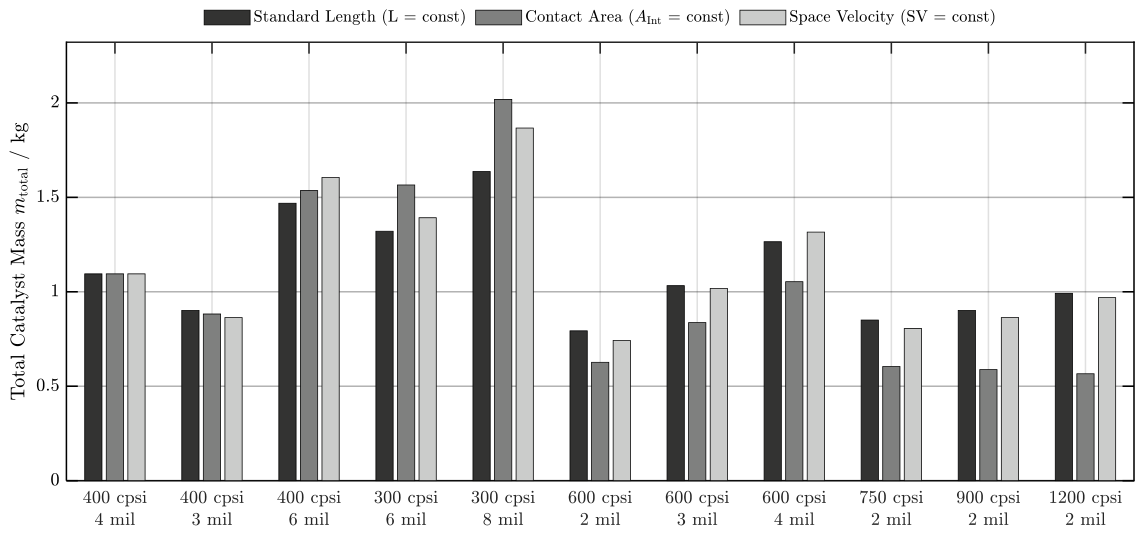
In addition to the contact area, the total thermal mass of the variants is critically relevant to the transient thermal management (Figure 9). Highly varying results are observed here, with wall thickness exerting the dominant influence on thermal inertia, proving significantly more impactful than cell density.
Figure 9.
Overview of the total weight of all variants, including the washcoat, at a loading of 120 g/L.
It must be noted that geometric disparities influence not only the bulk physical properties but also the fundamental convective heat transfer between the exhaust gas and the solid substrate. Assuming the monolith temperature is lower than that of the exhaust gas, a substantial heat flux occurs, dictated by the heat transfer coefficient and the available heat exchange surface area (Aint), as expressed in Equation (9).
The convective heat transfer coefficient (α) depends intrinsically on geometric boundary conditions and fluid properties. For internal flow through square-channeled geometries, α is calculated using the dimensionless Nusselt number (Nu), the channel’s hydraulic diameter (dhydr), and the thermal conductivity of the exhaust gas (λgas), as shown in Equation (10) [12].
The Nusselt number represents the ratio of convective to conductive heat transfer normal to the boundary. Its calculation depends on the specific flow regime, often utilizing a baseline constant for square channels combined with a developing flow function, as generalized in Equation (11) [10].
The Peclet number () characterizes the relative dominance of advection (bulk transport) over diffusion (conduction). It is the product of the Reynolds number and the Prandtl number (Pr). In honeycomb structures, a high indicates convection-dominated heat transfer, whereas a low signifies conduction dominance (Equation (12)).
The Reynolds number (, Equation (13)) dictates the flow regime, representing the ratio of inertial forces to viscous forces within the fluid.
The Prandtl number (Pr) measures the interaction between the momentum and thermal boundary layers. It is defined as the ratio of momentum diffusivity (kinematic viscosity) to thermal diffusivity. Expressing this through dynamic viscosity (ηgas), specific heat capacity (cp gas), and thermal conductivity (λgas) yields Equation (14) [12].
Substituting these dimensionless relationships and incorporating the open frontal area (Aopen) ultimately yields the localized heat transfer coefficient (α) for the investigated monoliths (Equation (15)) [12].
Another critical parameter in the transient thermal analysis of catalytic converters is the temperature uniformity index , as defined in Equation (16). This index quantifies the spatial homogeneity of the temperature distribution across the catalyst. A perfectly isothermal catalyst yields a value of 1.0, with the index decreasing proportionally as thermal inhomogeneity increases.
In evaluating the thermal performance, the cumulative time above the light-off temperature (Time T ≥ T50) is analyzed. However, this metric must be qualified: only the periods during which exhaust gas actually flows from the engine are relevant. When the start–stop system is active, zero exhaust flow occurs; consequently, the catalytic converter’s instantaneous temperature during these stagnant phases has no impact on tailpipe emissions.
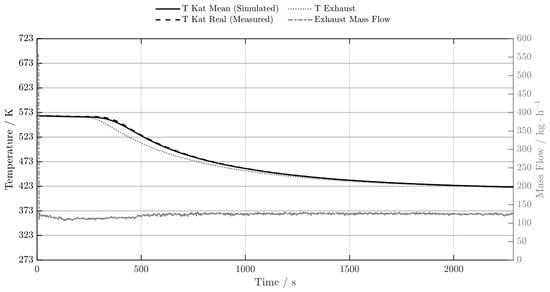
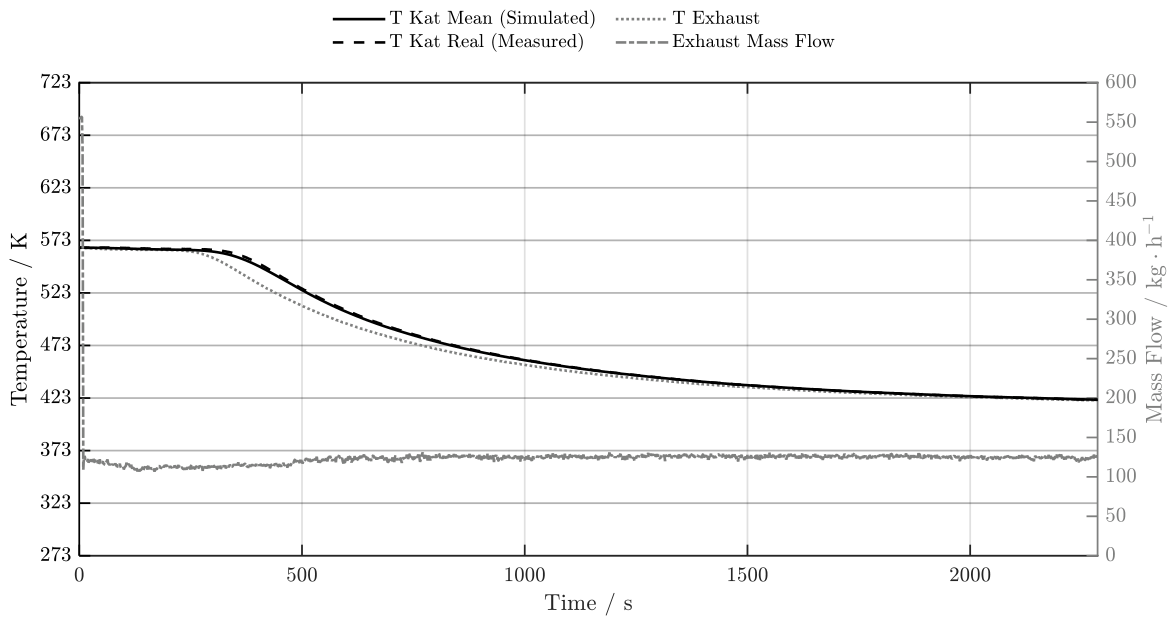
The simulation was validated using real-world measurement data from a commercial vehicle and subsequently adapted to passenger vehicle size. In this process, a measured load step was replicated (Figure 10). Thereby, a mean deviation of 0.54 K was achieved between the measured and the calculated Temperature at the middle position of the monolith.
Figure 10.
Summary of the validation test for a load step from 50 kW to 10 kW. The measurement was conducted on a standard catalyst with a length of 254 mm and a diameter of 267 mm, featuring a cell density of 400 cpsi and a wall thickness of 4 mil.
5. Discussion of Results
The selected honeycomb architectures were initially evaluated to understand their fundamental geometric dependencies. When substrate length is adjusted to maintain a constant SV, the resulting lengths remain nearly identical to the baseline monolith, as the minor variations arise solely from differences in the OFA. Conversely, when the GSA representing the gas–solid contact area is designated as the constant reference parameter, substrate lengths must be proportionally adapted. Consequently, in this constant-GSA scenario, monolith length is strictly dependent on cell density.
5.1. Comparison of Space Velocity and Active Catalytic Surface Area
To evaluate catalytic performance under transient volumetric flow () conditions, this study employs a framework governed by mass transfer rather than relying solely on SV. Given the elevated temperatures typical of automotive exhaust aftertreatment systems, intrinsic chemical reaction rates are exceedingly rapid. Consequently, film diffusion—specifically, the transverse transport of pollutant molecules from the bulk gas phase to the washcoat surface—emerges as the rate-determining step. This mass transfer process is directly proportional to the geometric surface area (Aint) and independent of the gross catalyst volume (Vcat).
To establish a consistent comparative basis amidst the highly transient nature of passenger car engine operation, the experimental design normalizes the available (Aint) across all operational load steps. SV is intrinsically linked to the open frontal area (OFA) and the volumetric exhaust gas flow rate; therefore, it serves merely as a macroscopic metric that fluctuates significantly during real-world driving. By maintaining a constant (Aint), the methodology intrinsically accounts for the underlying diffusion physics: a smaller catalytic converter with a higher cell density features narrower channels, thereby reducing the diffusion length and compensating for the reduced residence time associated with an elevated SV.
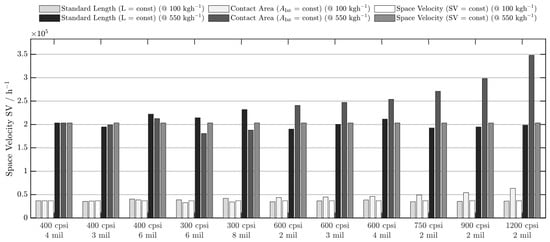
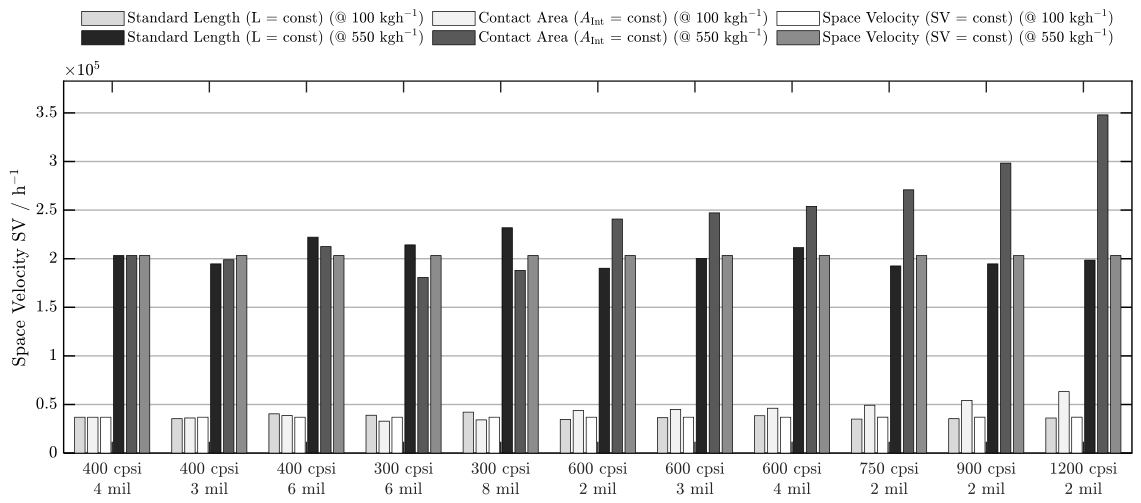
Figure 11 provides a direct comparison of these dynamics. Two representative exhaust mass flow rates (100 kg/h and 550 kg/h) were selected to calculate the corresponding SV values across all geometric variants under three defined boundary conditions: (1) constant reference volume, (2) constant SV, and (3) constant . The data demonstrate that the variance in SV induced by different substrate dimensions is substantially smaller than the variance driven by transient engine loads.
Figure 11.
Comparison of space velocity across all structural variants and length configurations for two representative operating points.
Notably, the selected mass flow rates represent typical continuous operating points rather than the absolute minimum and maximum limits of the engine map. Only the ultra-high-density 1200 cpsi variant, when configured to its shortest length (constant Aint), induces an SV shift comparable in magnitude to the engine load variations. This finding empirically validates the methodological approach of prioritizing Aint over SV as the primary thermal evaluation criterion. Nevertheless, to ensure a comprehensive analysis, all subsequent results systematically report the thermal behavior across all three length configurations.
5.2. Thermal Behavior of the Catalyst in Urban Traffic
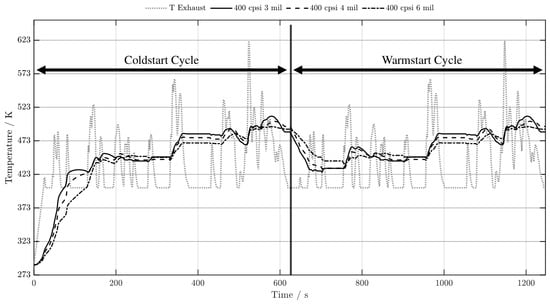
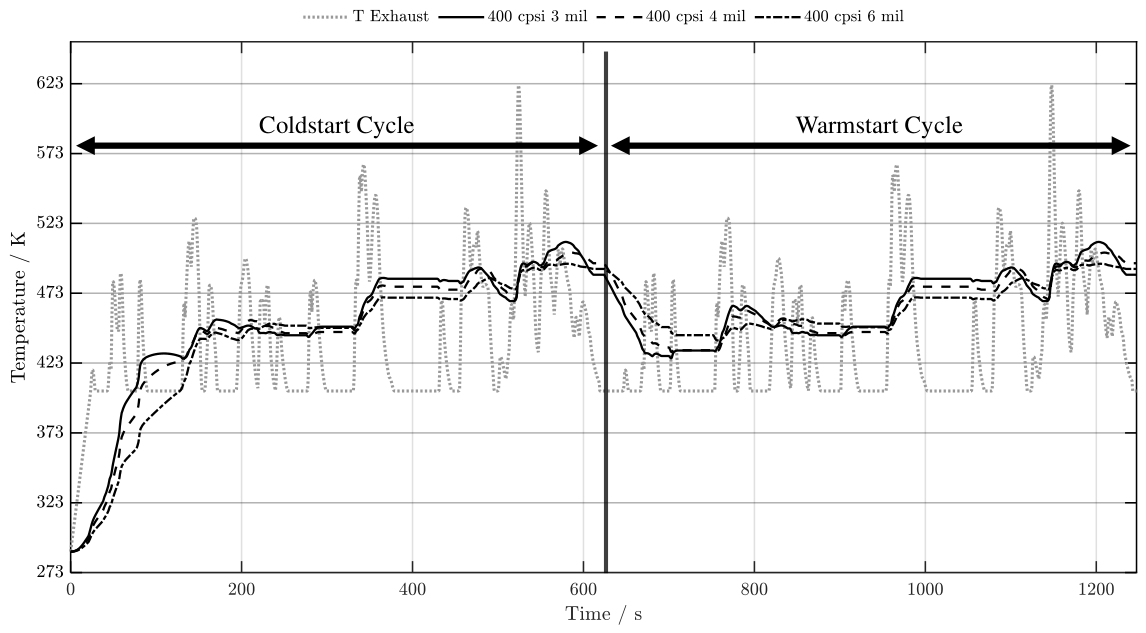
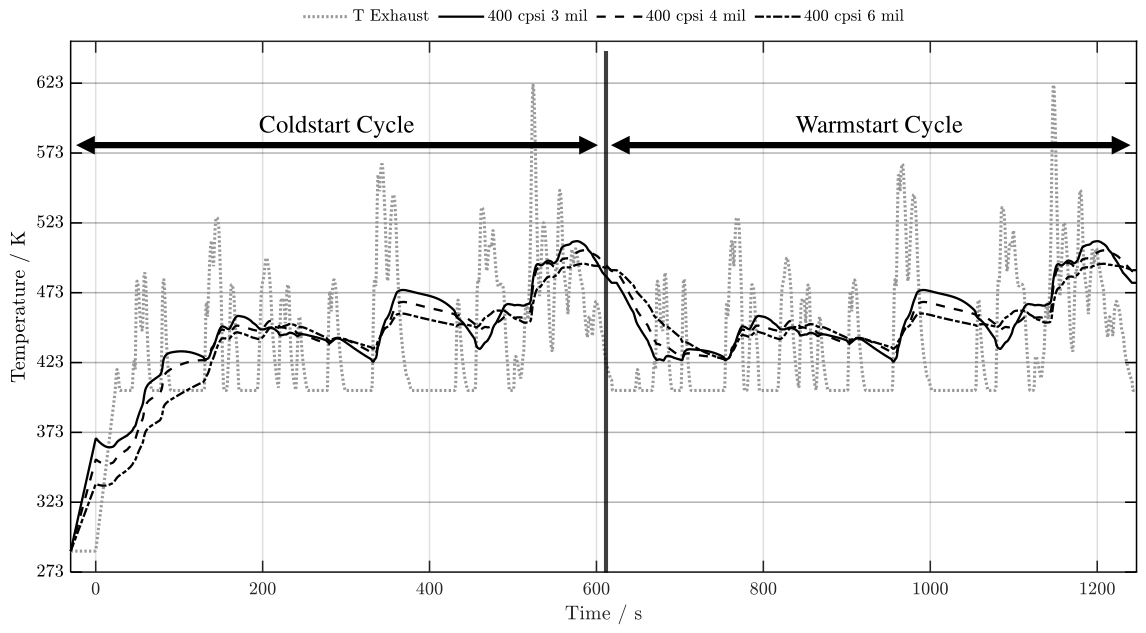
The transient thermal calculations rely on the empirical driving data recorded during the real-world test drives. For the comparative analyses, the urban driving profile illustrated in Figure 4 was applied to the simulation model in two consecutive phases: initially as a cold-start scenario, and immediately thereafter as a fully warmed-up cycle. Both resulting temperature trajectories are plotted in the corresponding diagram.
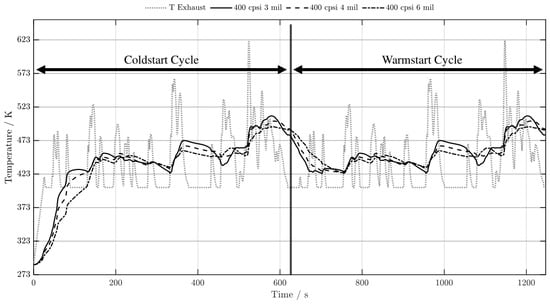
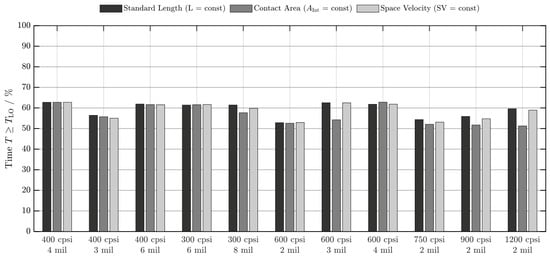
Figure 12 presents the transient simulation results for the 400 cpsi series at the standard reference length. The temperature profiles reported in this and all subsequent figures consistently represent the volumetric mean catalyst temperature. Although Figure 11 exclusively compares variants with an identical cell density, the comprehensive simulation dataset demonstrates that higher cell densities universally facilitate enhanced thermal energy transfer due to the proportionally expanded GSA.
Figure 12.
Simulated thermal response of the 400 cpsi series at the standard baseline length, with the automatic start–stop system deactivated.
Within the specific 400 cpsi series depicted, disparities in the thermal response are highly pronounced during the initial heating phase. Substrate configurations featuring reduced structural mass—specifically, those with thin wall thicknesses—exhibit a distinct initial advantage. During this critical warm-up period, the synergistic effect of minimized thermal inertia and effective convective heat transfer is decisive for accelerating catalytic light-off.
However, while a low thermal mass is highly beneficial during the cold-start phase, it introduces significant thermodynamic penalties during transient operating conditions characterized by low exhaust gas enthalpies. Due to their diminished thermal storage capacity, these ultra-thin-wall variants are highly susceptible to rapid convective quenching. Consequently, their initial thermal advantage cannot be sustained across the entire duration of the test cycle, as they undergo accelerated cooling during extended idling or low-load phases.
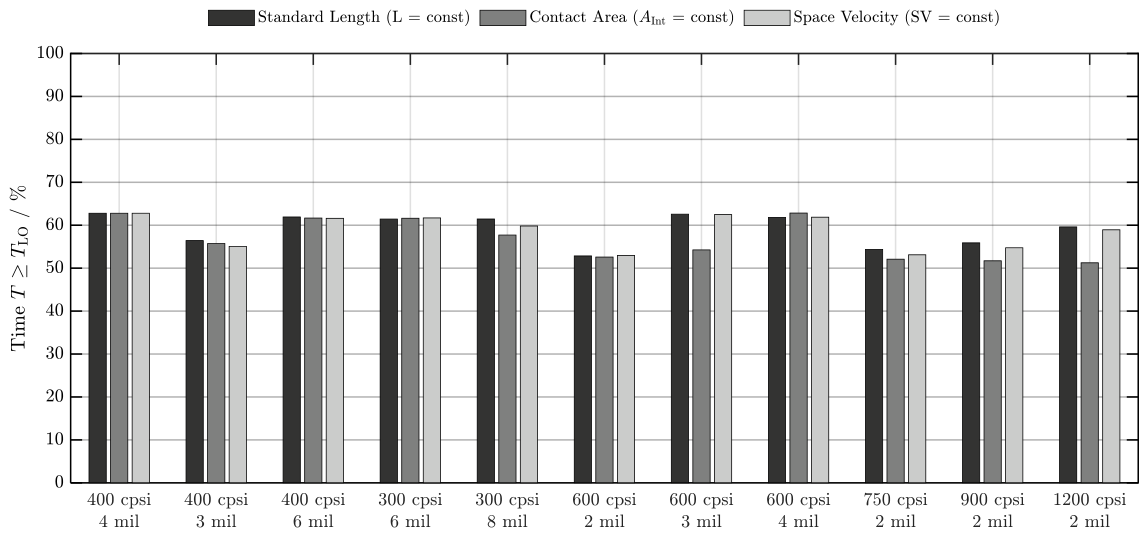
Interestingly, despite these transient cooling effects, the overall disparity in temperature evolution between the cold-start (first half of the cycle) and warm-start (second half) conditions is significantly less pronounced than anticipated. Because of this minimal variance, both operating phases have been consolidated into a unified analysis. This consolidated calculation establishes the baseline for all subsequent comparative evaluations. The primary performance metric employed is the active operational fraction—defined as the ratio of the cycle duration during which the volumetric mean catalyst temperature remains above the designated light-off threshold (T50).
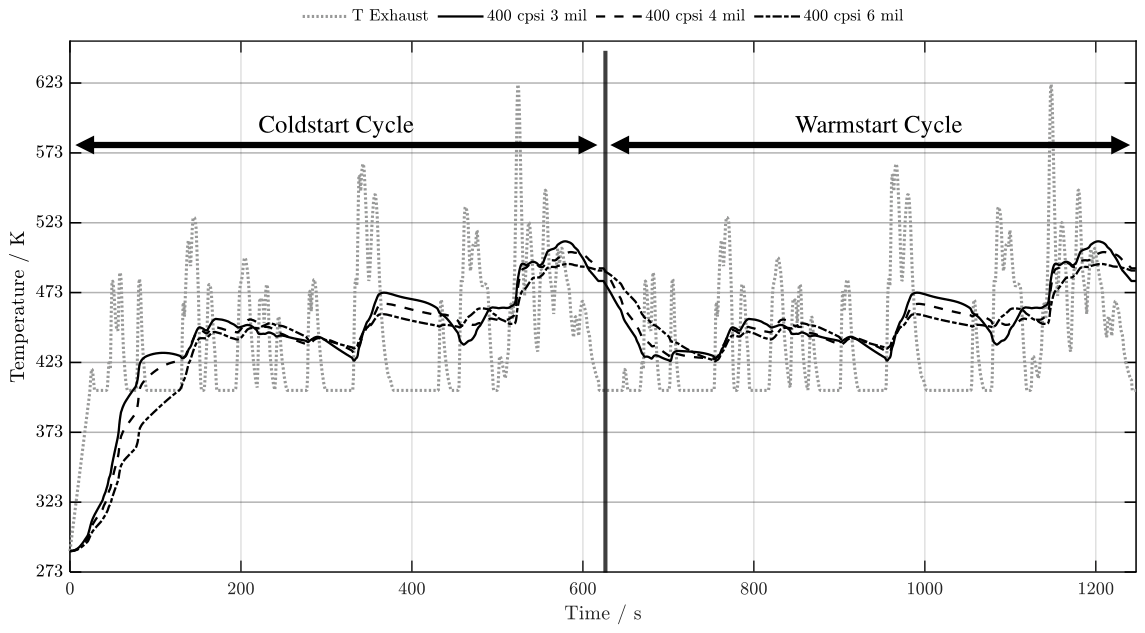
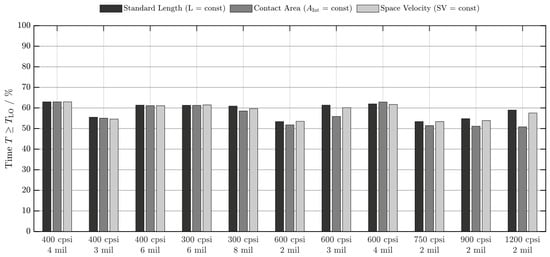
Figure 13 illustrates the active operational fraction ( for all 11 geometric variants across the three investigated length constraints: standard length, contact area, and space velocity. Because the 400 cpsi/4 mil baseline serves as the reference geometry, its dimensions remain constant across all three evaluation scenarios, inherently yielding identical results. Across the entire evaluated simulation matrix, the maximum active operational fraction achieved is 62.83%, whereas the minimum performance drops to 51.25%.
Figure 13.
Aggregated simulation results for the active operational fraction () across all variants, evaluated without a start–stop system.
Analyzing the thermal performance against the total catalyst mass reveals a critical inflection point. Previous assumptions might suggest that higher mass universally prevents cooling during extended idling. Indeed, moderately heavy variants with 4-mil and 6 mil wall thicknesses (e.g., 400/4, 400/6, and 300/6) achieve the peak results (approaching 62.83%). Their substantial thermal capacity acts as a buffer against convective quenching caused by low-temperature idle exhaust flow, allowing them to sustain temperatures above the threshold.
However, the absolute highest-mass variant—the 300 cpsi/8 mil configuration—contradicts this trend. Under the contact area constraint, this variant exceeds a total mass of 2.0 kg, introducing excessive thermal inertia. This massively delays the initial warm-up phase, completely negating any idle-buffering advantage and causing its active operational fraction to drop to approximately 53%.
Conversely, the performance variations among the low-mass ultra-thin-wall architectures (2-mil variants: 600/2, 750/2, 900/2, and 1200/2) highlight their susceptibility to convective quenching. While they show slight performance variations at the standard reference length, applying the constant contact area constraint (Aint) reduces their structural masses to the absolute lowest levels across the study (approximately 0.6 kg). Consequently, their thermal performances collapse to the minimum recorded value of 51.25%, becoming virtually indistinguishable from one another. This demonstrates that without sufficient structural mass, the substrate cannot retain heat during extended idle phases.
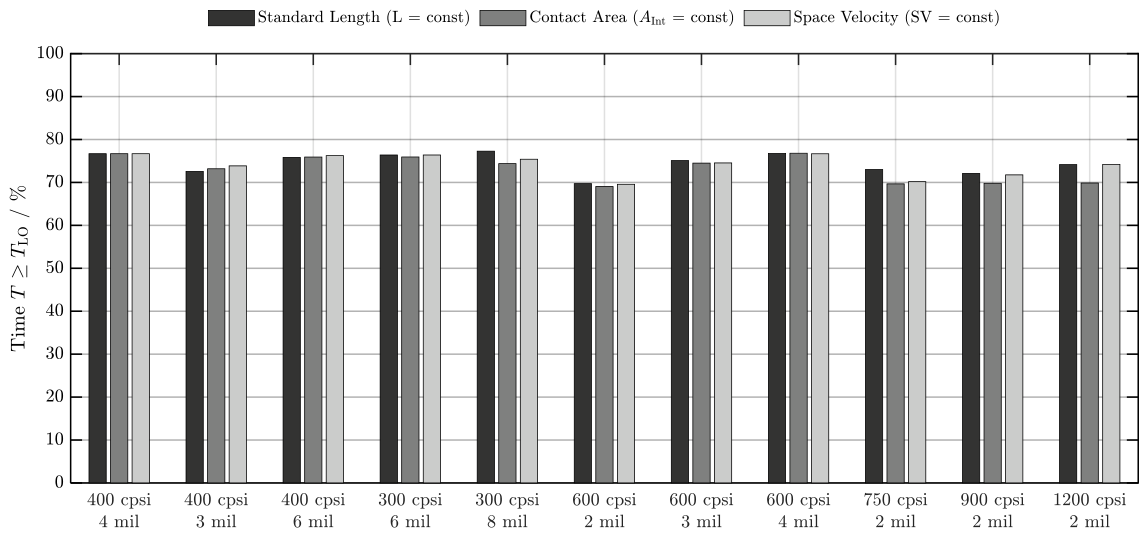
To contrast these findings, a second simulation phase replicates the identical driving cycle, but with the automatic start–stop system enabled. In this configuration, the exhaust gas mass flow is halted during vehicle standstill phases, abruptly eliminating the convective cooling effect when idle.
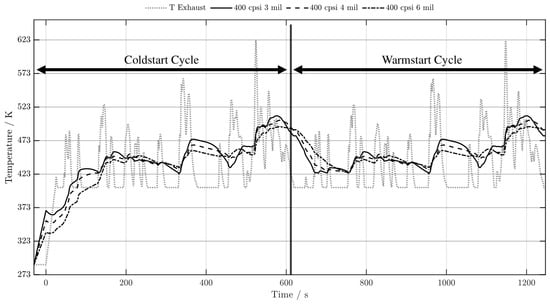
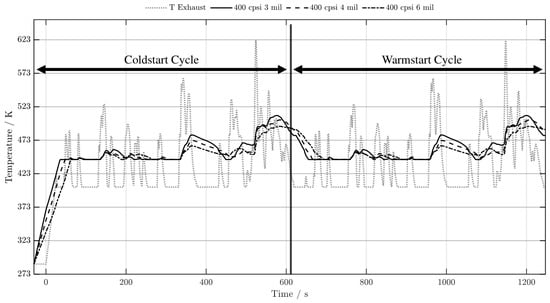
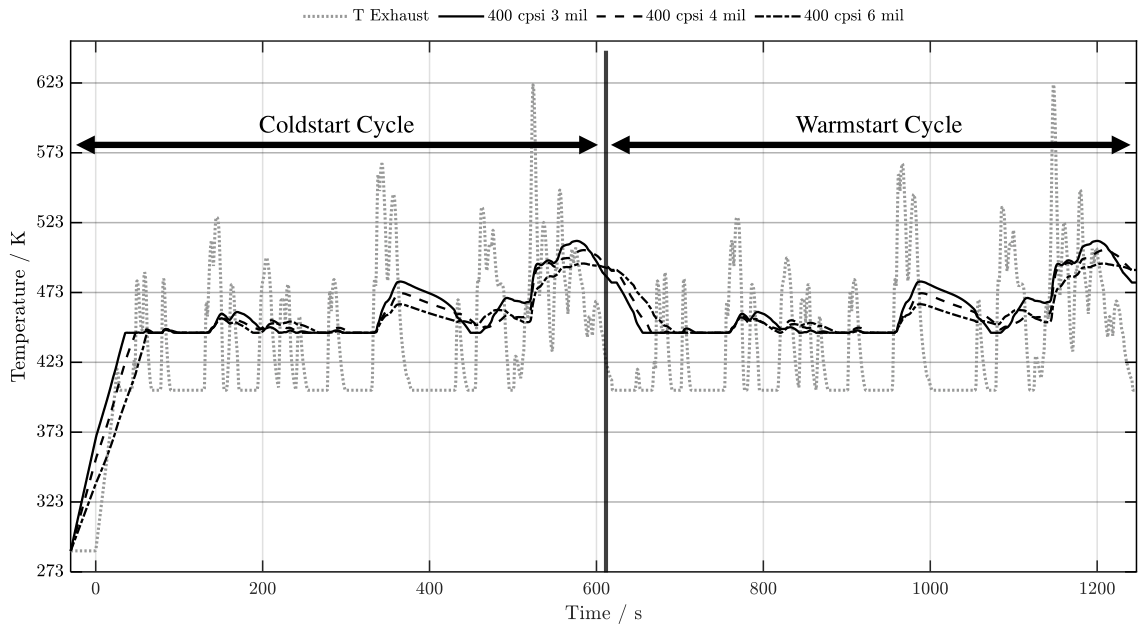
Figure 14 illustrates the transient mean catalyst temperature for the 400 cpsi variants under active start–stop operation. In direct comparison with Figure 12, the thermodynamic impact of the start–stop system is profound. Because convective cooling by cold idle exhaust is eliminated during stationary vehicle phases, transient temperature drops are marginalized, thereby elevating the overall thermal profile of the catalyst throughout the cycle.
Figure 14.
Simulated thermal response of the 400 cpsi series at the standard baseline length, with the automatic start–stop system enabled.
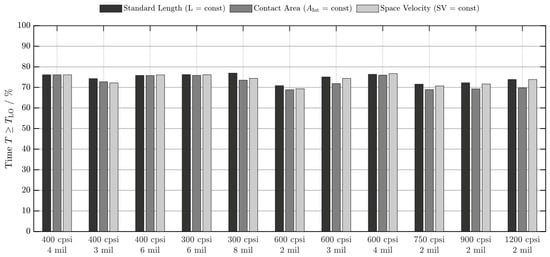
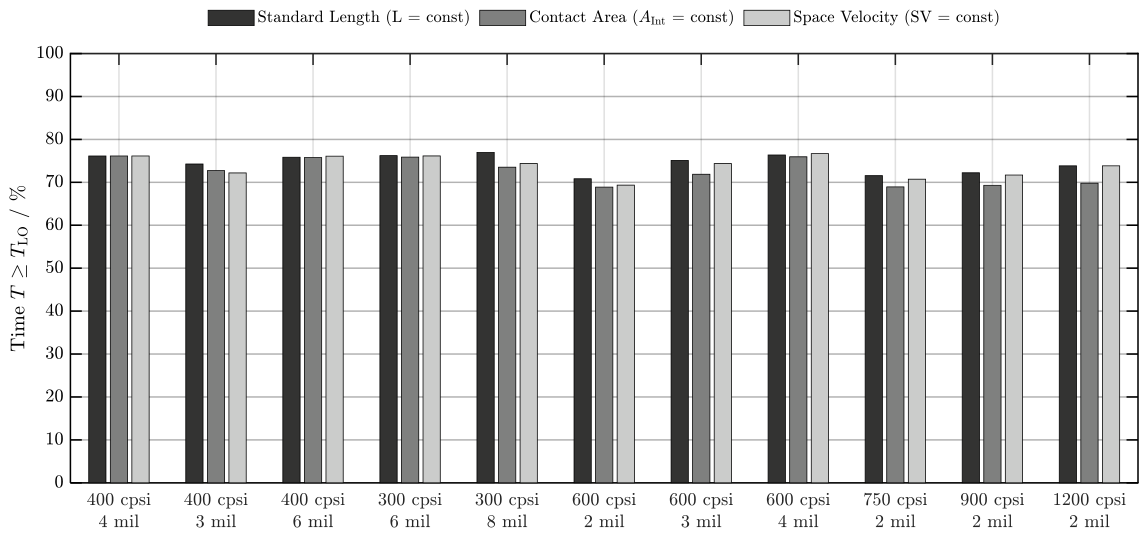
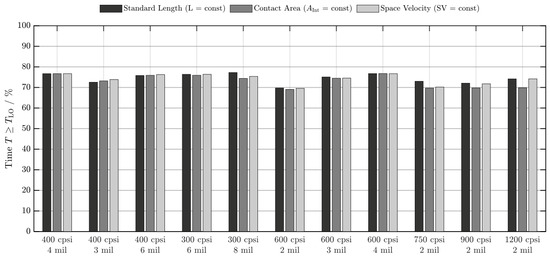
The comprehensive overview of all simulation results utilizing an activated start–stop system (Figure 15) clearly reflects a profoundly elevated temperature profile across the board. The active operational fraction is significantly improved for all investigated architectures, reaching a peak value of 76.98%, with even the lowest-performing variant achieving 68.89%. In direct comparison to the continuous-idling scenario (where performance ranged from 51.25% to 62.83%), the macroscopic thermodynamic effect of halting the cold exhaust mass flow during vehicle standstill fundamentally elevates the entire system’s efficiency. Simultaneously, the performance discrepancies between the various geometries are substantially diminished; the overall variance shrinks to approximately 8 percentage points.
Figure 15.
Aggregated simulation results for the active operational fraction () across all variants, evaluated with an active start–stop system.
However, analyzing the thermal performance against the structural mass reveals that the hierarchy remains heavily dictated by thermal inertia. Contrary to initial expectations for rapid warm-up, the ultra-thin 2-mil variants (such as the 600/2, 750/2, and 900/2 configurations) do not yield the highest active operational fractions. Instead, because their structural masses are severely reduced (dropping to approximately 0.6 kg under constant contact area constraints), they possess minimal thermal storage capacity. Consequently, they cool more rapidly to the environment during engine-off phases, clustering at the lower performance tier near the 68.89% minimum.
Conversely, the thicker 4-mil, 6-mil, and even the high-mass 8-mil substrates (weighing up to 2.0 kg) form the high-performance cluster, consistently exceeding 75%. During engine-off standstill phases, convective quenching by cold exhaust gas is entirely eliminated. Under these conditions, the higher absolute thermal mass effectively acts as a heat reservoir, retaining the operational temperature significantly longer. This demonstrates that when start–stop functionality mitigates forced convective cooling, the geometric thermal mass becomes a pure storage advantage rather than a warm-up penalty.
Given the dominant influence of mitigating convective cooling via start–stop strategies, active electrical heating is investigated as a supplementary optimization measure. Various systems are currently available or under development, primarily categorized into localized preheaters and fully heatable substrates.
One approach utilizes electrically heatable metallic heater discs positioned immediately upstream of the primary catalyst. These discs heat the impinging exhaust gas, which subsequently transfers thermal energy to the downstream substrate via convection. Because the primary catalyst surface is heated indirectly, this architecture is classified as a preheater.
Alternatively, EHC construct the entire active monolith from a conductive material, enabling direct ohmic heating of the catalytic surface. While traditionally relying on metallic substrates, electrically conductive hybrid ceramics have recently emerged as a viable alternative to conventional cordierite [13]. This hybrid ceramic maintains the favorable thermomechanical properties of cordierite but introduces intrinsic electrical conductivity. When integrated into contemporary 48 V vehicle electrical architectures with a targeted substrate resistance of approximately 1 Ω, this configuration can deliver a heating output of 2.3 kW. The material-specific thermophysical parameters incorporated into the simulation model are detailed in Table 3.
Table 3.
Overview of the most important material parameters for cordierite and hybrid ceramic.
Various heating strategies can be deployed with these EHC architectures. A primary strategy involves pre-heating, initiated by unlocking the vehicle or detecting a proximity key fob, aiming to thermally condition the catalyst prior to engine cranking and ensure immediate pollutant conversion. Based on previous empirical studies, a mean pre-heating duration of 30 s is assumed for this investigation. Alternatively, a sustained heating strategy could utilize the vehicle’s standstill (start–stop) phases to periodically inject thermal energy and maintain the requisite conversion temperature.
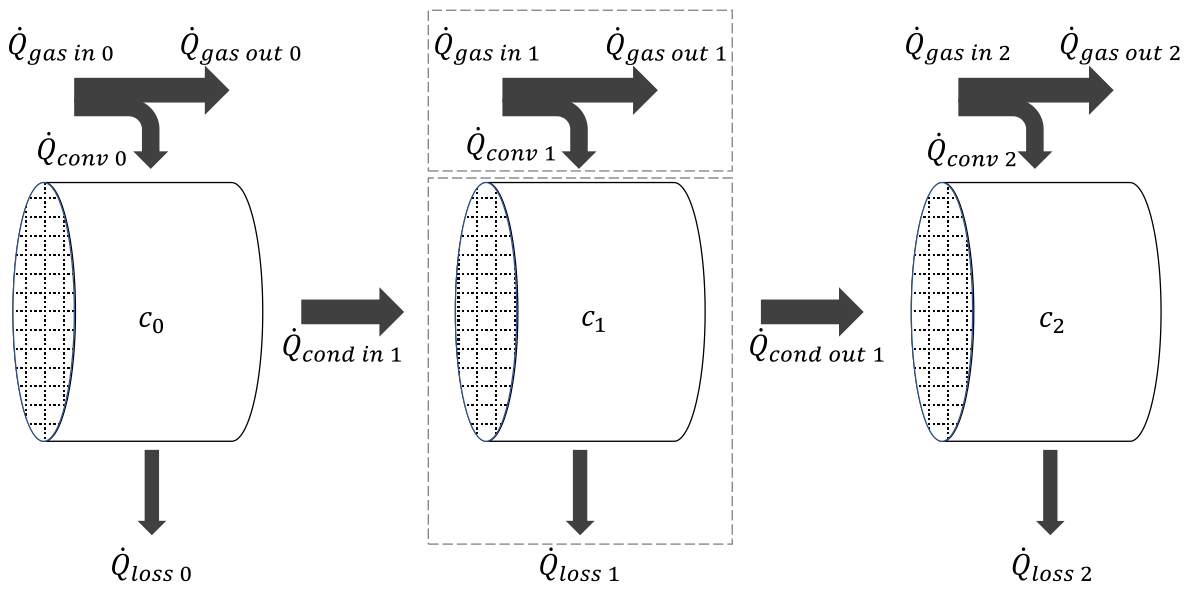
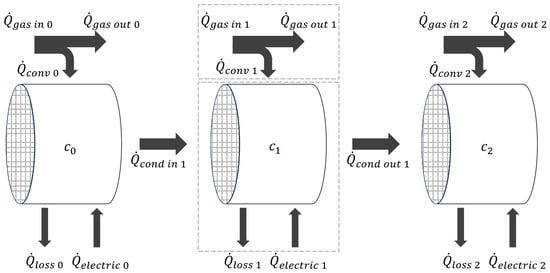
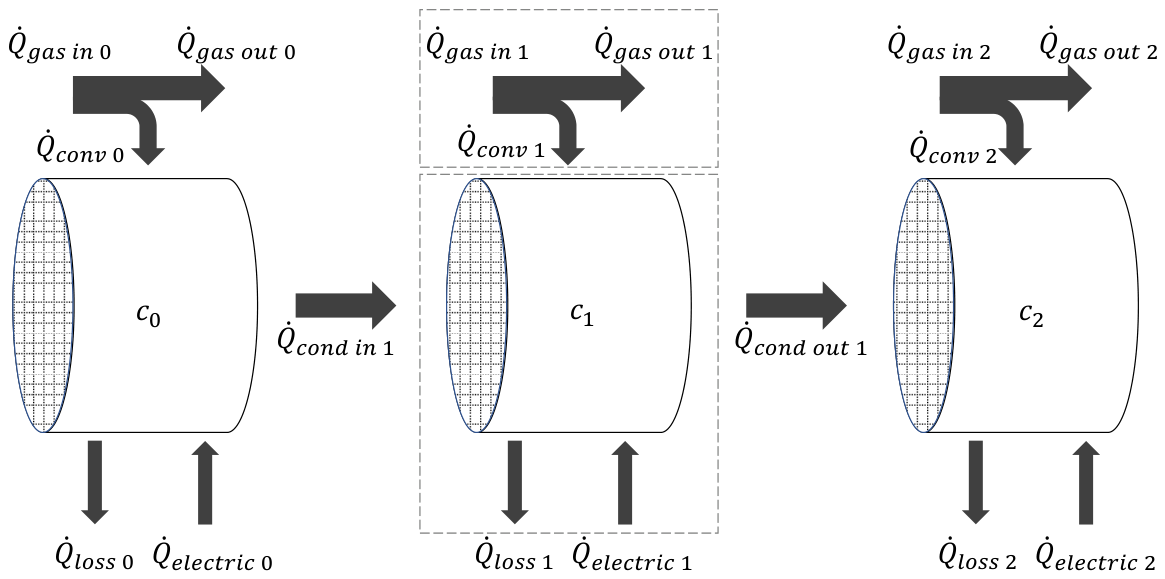
To evaluate these strategies, the baseline 1D thermal simulation model was modified. As illustrated in Figure 16, an additional volumetric energy source term was integrated into the solid-phase energy equation to account for the electrical Joule heating.
Figure 16.
Schematic representation of the discretized 1D control volume model, extended to include the volumetric electrical heating source term.
Figure 17 presents the simulation results for the 400 cpsi series, incorporating the electrically conductive hybrid ceramic material. To ensure temporal alignment and direct comparability with previous thermal profiles, the time axis is shifted to include the 30-s preheating phase immediately preceding engine ignition During this phase, a constant electrical power of 2.3 kW is applied volumetrically across the entire monolith. Due to the varying thermal masses of the geometric configurations, distinct initial temperatures are achieved at the onset of exhaust flow. Crucially, the thermal advantage provided by preheating dissipates rapidly once transient exhaust flow begins. Consequently, this discrete preheating strategy exerts a negligible long-term influence on the overall thermal trajectory.
Figure 17.
Simulated thermal response of the 400 cpsi series (baseline length) utilizing 30 s of 2.3 kW electrical preheating, evaluated without an active start–stop system.
As expected, the 30-s preheating phase establishes significantly improved initial thermal conditions compared to a conventional cold start. However, the use of the electrically conductive hybrid ceramic introduces higher structural masses due to its elevated material density (Figure A1). For instance, the total catalyst mass of the highest-mass variant (300 cpsi/8 mil) under the contact area constraint now approaches 2.5 kg.
Because the applied electrical energy is constant (69 kJ), the peak temperature reached at engine start is inversely proportional to the monolith’s structural mass. Accordingly, low-thermal-mass substrates—such as the 2-mil variants under constant contact area constraints, weighing approximately 0.7 kg—achieve the highest pre-ignition temperatures.
Despite these initial temperature peaks, this thermal buffer is rapidly depleted by convective quenching during the first few idle phases. The aggregated results (Figure 18) without the start–stop system present a counterintuitive conclusion: the isolated application of electrical preheating yields virtually no long-term improvement. Performance fluctuates between a minimum active operational fraction of 50.82% and a maximum of 63.02%. This indicates that a discrete pre-ignition heating strategy is insufficient for urban driving profiles characterized by frequent idling.
Figure 18.
Aggregated simulation results for the active operational fraction () with discrete electrical preheating, evaluated without an active start–stop system.
Furthermore, this limitation is exacerbated by the hybrid ceramic’s higher density (Table 3), which increases the total thermal mass and inherently restricts the maximum temperature delta achievable with the fixed 2.3 kW power input.
Figure 19 presents the aggregated results when this discrete electrical preheating strategy is combined with an active start–stop system. As anticipated, enabling engine shut-off during idle phases yields significant thermal advantages compared to continuous idling, elevating the active operational fraction to a range between 69.04% and 77.27%. However, when comparing these peak values (77.27%) to the previous unheated start–stop baseline (76.98%), the isolated application of electrical preheating demonstrates virtually no supplementary effect. Although marginal improvements are observed for specific geometric configurations, these transient gains are negligible when weighed against the added hardware complexity and energy requirements of EHC technology.
Figure 19.
Aggregated simulation results for the active operational fraction () with discrete electrical preheating, evaluated with an active start–stop system.
During the pre-start phase, the substrate’s structural thermal mass dictates the peak temperature achieved by the fixed 2.3 kW power input. Therefore, designing the monoliths based on a constant GSA—which permits shorter substrates and consequently reduces total thermal mass—initially appears advantageous, as it maximizes the pre-ignition temperature. However, the reduced thermal storage capacity of these shorter, lighter variants causes them to cool down rapidly once convective exhaust flow begins (or during prolonged engine-off phases), completely negating the initial temperature advantage over the full duration of the cycle.
To address this rapid cooling limitation, the simulation framework is subsequently expanded to evaluate a continuous active heating strategy. Under this closed-loop control strategy, whenever the volumetric mean catalyst temperature drops below the light-off threshold (T50), supplementary heating is triggered at a constant electrical power of 2.3 kW. The cumulative electrical energy demand required to sustain this operation is continuously tracked and integrated into the final analysis.
The thermal profile of the 400 cpsi series under active continuous heating (Figure 20) diverges significantly from all previously simulated scenarios. The closed-loop heating strategy almost entirely mitigates transient downward temperature fluctuations. Consequently, the catalyst remains below the target light-off threshold almost exclusively during the initial cold-start phase. Furthermore, the thermodynamic disparities between the various substrate geometries are substantially minimized under this strategy, exerting a practical influence only during this initial warm-up period.
Figure 20.
Simulated thermal response of the 400 cpsi series (baseline length) utilizing continuous active electrical heating, evaluated without a start–stop system.
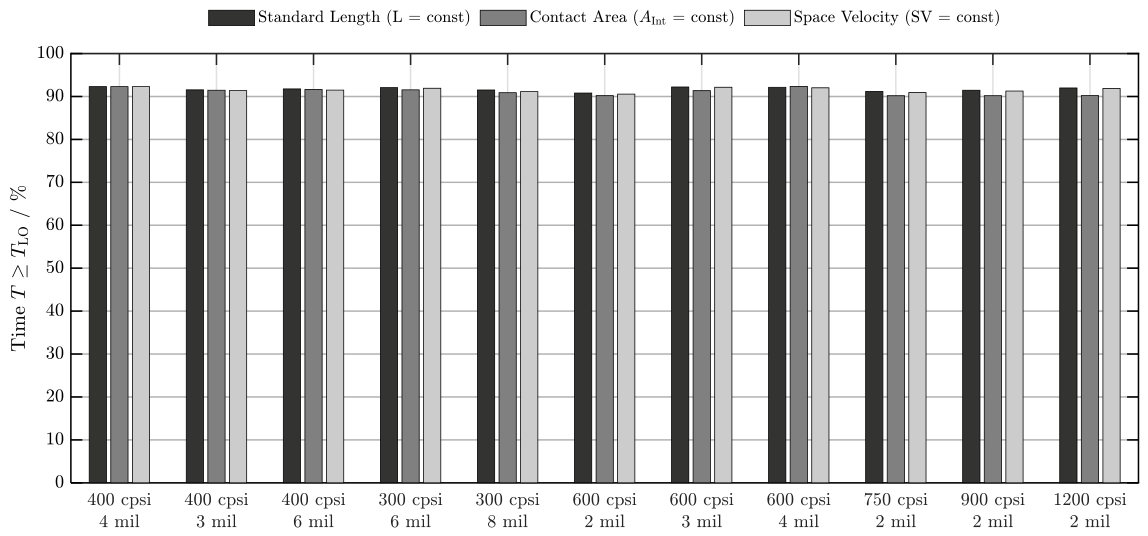
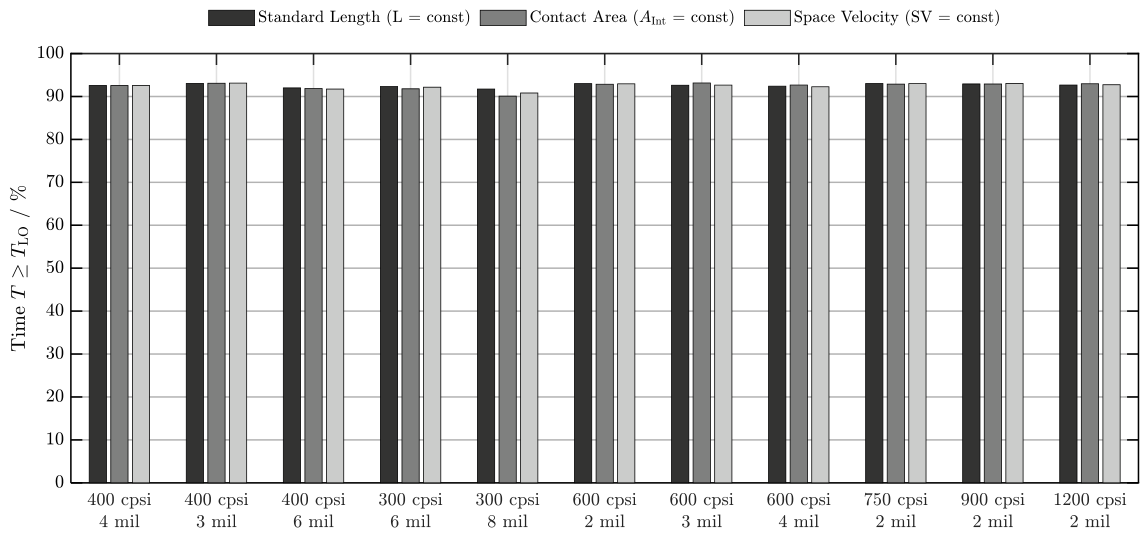
Overall, the continuous heating strategy (Figure 21) yields the most favorable thermal performance observed for urban driving profiles. Active operational fractions ranging from a minimum of 90.17% to a peak of 92.33% are achieved across all investigated variants, even without an active start–stop system. This is a highly relevant scenario, as start–stop functionality is frequently disabled by the ECU during cold-start conditions to protect the battery.
Figure 21.
Aggregated simulation results for the active operational fraction () with continuous electrical heating, evaluated without an active start–stop system.
Under continuous heating, the performance variance across different geometries and length constraints is almost completely eliminated. While the elevated structural mass of the high-density hybrid ceramic slightly delays the very first heat-up phase—which accounts for the remaining ~8 to 10% of the cycle time where the catalyst is below light-off temperature—the geometric dimensions play virtually no role once the operational setpoint is reached.
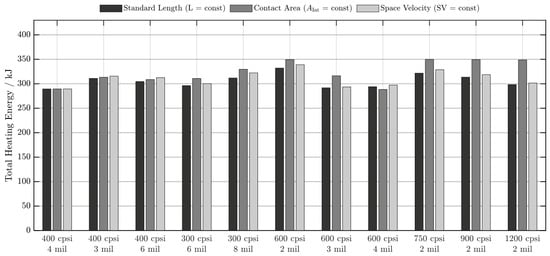
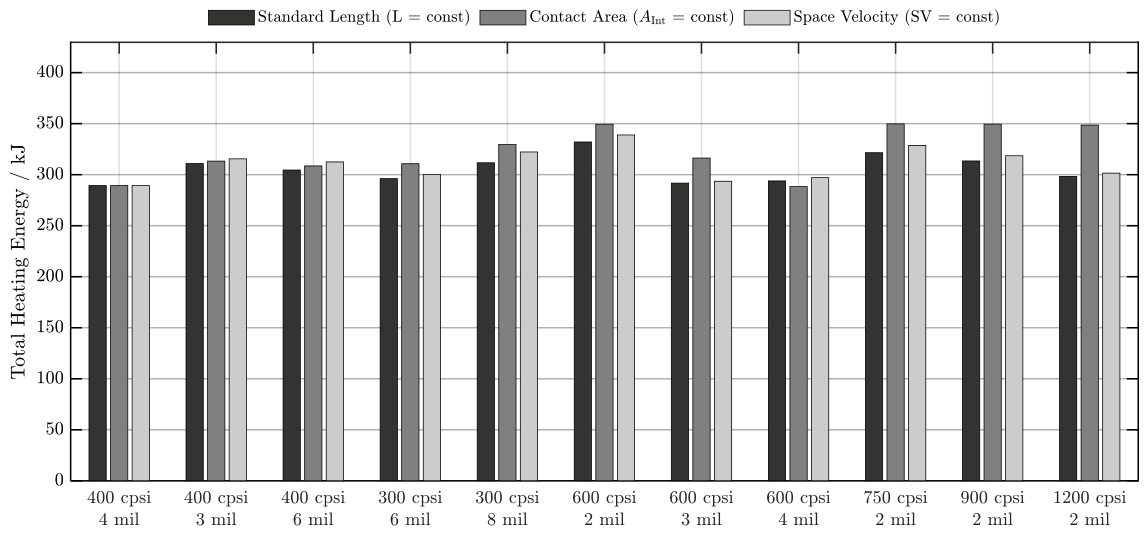
The current control logic activates the heater precisely when the volumetric mean catalyst temperature drops below the light-off threshold (T50). Adopting a more proactive control strategy—such as initiating heating slightly above this threshold to create a thermal buffer and raise the electrical power input—could further optimize the active operational fraction toward 100%. However, the electrical energy demand required for this supplementary heating must be critically evaluated. This energy is ultimately derived from the alternator, increasing engine load and subsequently reducing overall vehicle efficiency. An overview of this cumulative energy demand is presented in Figure 22.
Figure 22.
Cumulative electrical energy demand required for the continuous active heating strategy, evaluated without an active start–stop system.
The maximum cumulative energy demand observed is 349 kJ (0.097 kWh), a load readily supported by modern 48 V vehicle electrical systems. However, this electrical energy is ultimately generated at the expense of increased fuel consumption. Assuming a diesel lower heating value (LHV) of approximately 11.9 kWh/kg and an average engine thermal efficiency of 33%, this energy requirement translates to an additional consumption of 0.025 kg of diesel fuel over the tested cycle. Stoichiometrically, this fuel penalty generates an additional 0.077 kg of CO2 emissions.
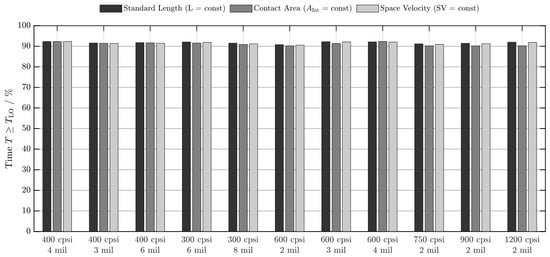
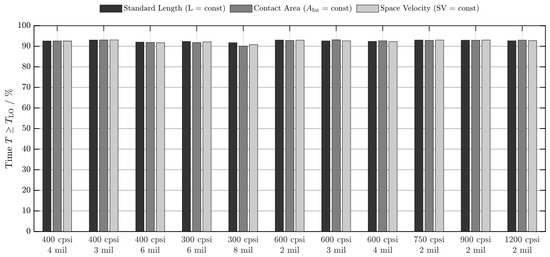
In the final evaluation step, the continuous electrical heating strategy is coupled with an active start–stop system. Given the high active operational fractions already achieved without engine shut-off, the supplementary thermal improvements depicted in Figure 23 are marginal. Performance across all variants now ranges from a minimum of 90.08% to a maximum of 93.14%.
Figure 23.
Aggregated simulation results for the active operational fraction () with continuous electrical heating, evaluated with an active start–stop system.
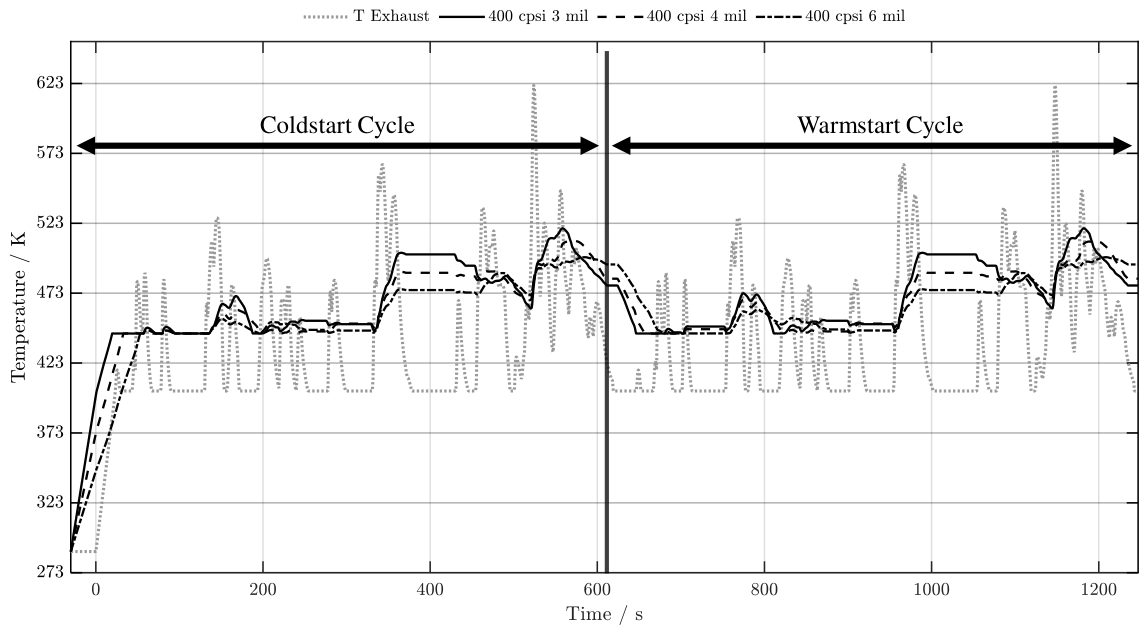
Because continuous active heating effectively prevents convective quenching, the catalyst temperature is maintained well above the threshold regardless of idle exhaust flow, yielding highly comparable thermal profiles in both scenarios. However, activating the start–stop system yields a substantial reduction in the cumulative electrical energy demand. Because the convective cooling effect of the idle exhaust gas is eliminated, the required electrical power input to maintain the target temperature drops significantly, as illustrated in Figure 23.
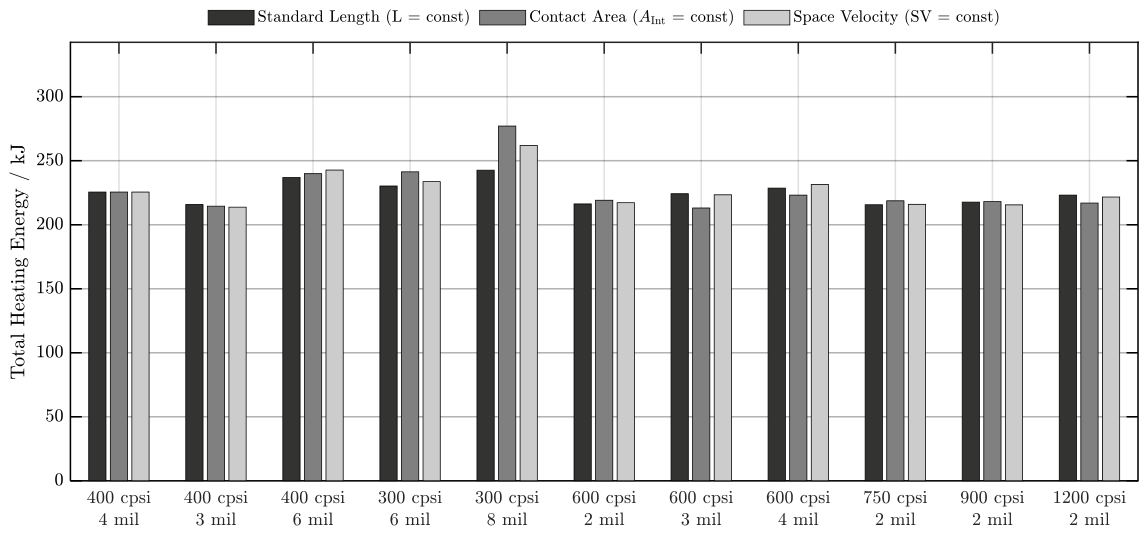
The cumulative electrical energy demand under these combined conditions ranges between 213.1 kJ and 277.1 kJ (Figure 24). This represents a significant overall decrease in energy consumption compared to the baseline without engine shut-off. More importantly, the simulation results clearly demonstrate a fundamental shift in how substrate geometry influences the system: while geometry exerts a negligible impact on thermal performance (the active operational fraction is virtually identical across all configurations), it becomes the primary determinant for heating efficiency. The absolute maximum energy demand of 277.1 kJ is consumed by the heavy, high-thermal-mass 300 cpsi/8 mil variant. Conversely, low-thermal-mass (lightweight) variants exhibit a distinct advantage, requiring a minimum of only 213.1 kJ due to their significantly lower absolute heating requirements.
Figure 24.
Cumulative electrical energy demand required for the continuous active heating strategy, evaluated with an active start–stop system.
Extrapolating the additional energy requirement of this optimal, lightweight variant to a standard driving distance yields an estimated fuel penalty of approximately 0.91 kg of CO2 per 100 km, assuming the vehicle operates exclusively in an urban environment. However, because modern vehicle architectures are increasingly equipped with 48 V mild-hybrid systems, this required electrical energy could be sourced almost entirely from regenerative braking. Consequently, the calculated CO2 penalty represents a theoretical upper limit. Furthermore, this energy penalty applies exclusively to low-load, purely urban driving profiles. Under higher engine loads and extra-urban driving conditions, intrinsic exhaust gas temperatures are sufficient to maintain catalytic light-off, rendering electrical auxiliary heating unnecessary.
6. Conclusions & Outlook
6.1. Study Overview
Meeting stringent emission standards (e.g., Euro 7) requires exhaust aftertreatment systems capable of reliably sustaining catalyst light-off temperatures during highly transient, idle-dominated urban driving. This study utilized 1D numerical simulations to evaluate the transient thermal dynamics of various commercial catalyst geometries, incorporating start–stop engine strategies and electrically conductive hybrid ceramic carriers for active heating.
The results demonstrate that without active continuous heating, the substrate’s geometric thermal mass critically dictates performance. While an active start–stop system eliminates convective quenching by cold exhaust gas during vehicle standstill—thereby universally elevating the temperature profile—a discrete 30-s preheating phase prior to engine ignition proved highly inefficient. The initial thermal buffer is rapidly depleted by the onset of convective exhaust flow. Conversely, a closed-loop continuous heating strategy, activated whenever the catalyst drops below the T50 threshold and coupled with start–stop functionality, successfully maintained target temperatures for over 90% of the driving cycle.
6.2. Paradigm Shift in Geometric Design
A pivotal finding of this study is the altered functional role of substrate geometry. Previously, catalyst design required a stringent compromise between thermal inertia (for rapid warm-up) and washcoat capacity. However, the implementation of a continuous EHC system effectively decouples the thermal transient behavior from structural constraints. The simulation results confirm that under continuous active heating, the macroscopic dimensions of the honeycomb substrate exert virtually no influence on reaching and sustaining the light-off temperature.
This enables a fundamental paradigm shift in catalyst engineering: Because the thermal bottleneck is resolved electrically, the structural geometry can be tailored exclusively to optimize chemical kinetics and mass transfer. Engineers can employ ultra-low-thermal-mass structures to drastically minimize electrical energy demand, while optimizing cell density and substrate length strictly for ideal washcoat distribution and the mitigation of diffusion limitations.
6.3. Outlook and System Integration
Based on these findings, the authors conclude that transitioning to directly heated catalyst carriers is imperative to comply with future, highly transient emission regulations. The deployment of advanced, active thermal management systems is indispensable for upcoming vehicle generations.
Crucially, these technologies represent a necessary functional symbiosis. As the automotive industry increasingly relies on plug-in and parallel hybrid powertrains, the overall operational runtime of the internal combustion engine is significantly reduced. However, because the engine intermittently activates depending on the battery’s state of charge, these architectures induce frequent cold-start events and severe thermal cycling—thereby drastically exacerbating aftertreatment challenges.
Fortunately, these same hybrid platforms concurrently supply the requisite 48-volt or high-voltage architectures and regenerative braking capabilities to operate EHC systems efficiently. The integration of intelligent start–stop functionality, powertrain hybridization, and active electrical auxiliary heating thus forms the essential technological ecosystem required for future-proof, low-emission urban mobility.
These findings are fundamentally applicable to subsequent catalysts within the exhaust aftertreatment architecture, such as the selective catalytic reduction (SCR) system. Furthermore, rapidly achieving the light-off threshold intrinsically accelerates the thermal activation of downstream components during the warm-up phase.
Author Contributions
Conceptualization, T.S. and M.W.; development of methodology, T.S. and M.W.; software and modelling, T.S., V.S. and L.N.; validation, T.S., P.P. and L.N.; formal analysis, T.S., M.W. and P.P.; investigation, T.S., P.P. and M.W.; visualization, T.S. and M.W.; writing—original draft preparation, T.S. and M.W.; writing—review and editing, L.M., V.S. and C.P.; supervision, L.M. and C.P. All authors have read and agreed to the published version of the manuscript.
Funding
This research received no external funding.
Data Availability Statement
The original contributions presented in the study are included in the article; further inquiries can be directed to the corresponding author.
Conflicts of Interest
The authors declare no conflicts of interest.
Abbreviations
The following abbreviations are used in this manuscript:
- Latin Letters
| area | m2 | |
| fluid—solid contact area | m2 | |
| isobaric heat capacity | J∙kg−1∙K−1 | |
| diameter | m | |
| hydraulic diameter | m | |
| length | m | |
| mass | kg | |
| gravimetric flow rate | kg∙s−1 | |
| Nusselt number | - | |
| pressure | Pa | |
| Peclet number | - | |
| Prandtl number | - | |
| heat | J | |
| heat flux | W | |
| specific gas constant | J∙kg−1∙K−1 | |
| Reynolds number | - | |
| temperature | K | |
| Temperature for 50% yield | K | |
| time | s | |
| velocity | m∙s−1 | |
| uniformity index | - | |
| volume | m3 | |
| volumetric flow rate | m3∙s−1 |
- Greek Letters
| heat transfer coefficient | W∙m−2∙K−1 | |
| difference | - | |
| heat conductivity | W∙m−1∙K−1 | |
| dynamic viscosity | kg∙m−1∙s−1 | |
| density | kg∙m−3 |
- Subscripts
| average | |
| air | air |
| catalytic converter | |
| cell | |
| conductive | |
| convective | |
| exhaust | |
| fuel gas | |
| exhaust gas | |
| hydraulic | |
| inflowing | |
| internal | |
| logarithmic | |
| heat loss | |
| light off | |
| mean value | |
| monolith | |
| open | |
| outflowing | |
| ratio of active area to internal area |
- Definitions/Abbreviations
| 1D | one-dimensional |
| BlmSchV | Bundes-Immissionsschutzverordnung |
| C3H6 | propene |
| CO | carbon monoxide |
| CO2 | carbon dioxide |
| cpsi | cells per square inch |
| CxHy | hydrocarbons |
| DOC | diesel oxidation catalyst |
| ECU | engine control unit |
| EHC | electrically heated catalyst |
| EGR | exhaust gas recirculation |
| EURO | European emissions standard |
| FAQA | Federal Air Quality Act |
| GSA | geometric surface area |
| GPS | Global Positioning System |
| H2O | water |
| HC | hydrocarbons |
| ICE | internal combustion engines |
| moDiag | motor diagnostic |
| NO | nitrogen monoxide |
| NOx | nitrogen oxides |
| O2 | oxygen |
| OFA | open frontal area |
| Pd | palladium |
| PM | particulate matter |
| PN | particulate number |
| Pt | platinum |
| RDE | real driving emissions |
| Rh | rhodium |
| SCR | selective catalytic reduction |
| SEM | scanning electron microscopy |
| SV | space velocity |
| SynAir | synthetic air |
| TIER | US emission standard |
| TWC | three-way catalytic converter |
| USA | United States of America |
| USW | ultra-thin-wall |
| WLTP | Worldwide Harmonized Light Vehicles Test Procedure |
Appendix A
Figure A1.
Overview of the total weight of all variants of the electrically conductive hybrid ceramic, including the washcoat, at a loading of 120 g/L.
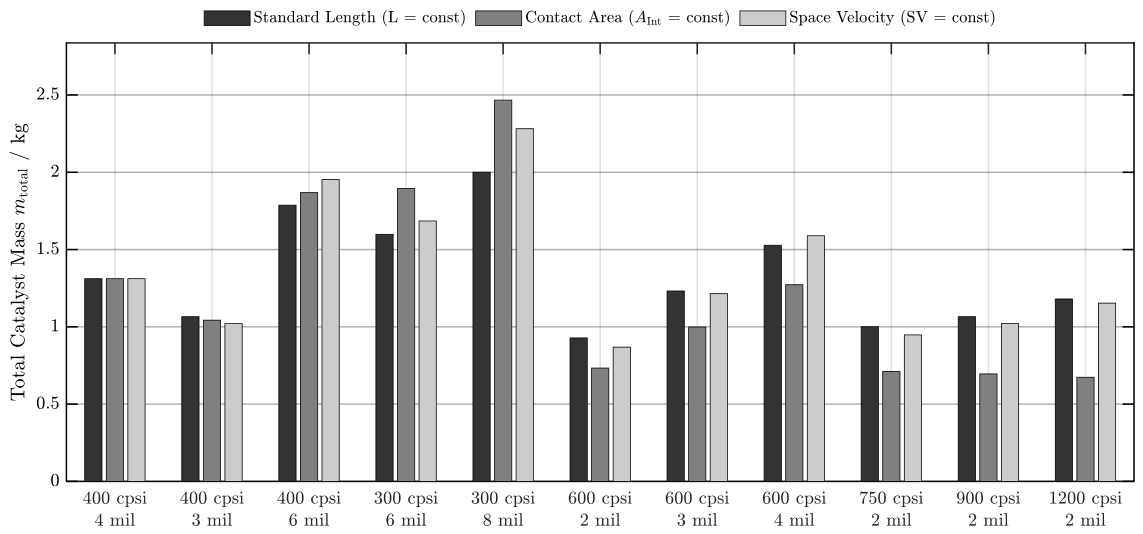
Figure A2.
Simulated thermal response of the 400 cpsi series (baseline length) utilizing 30 s of 2.3 kW electrical preheating, evaluated with an active start–stop system.
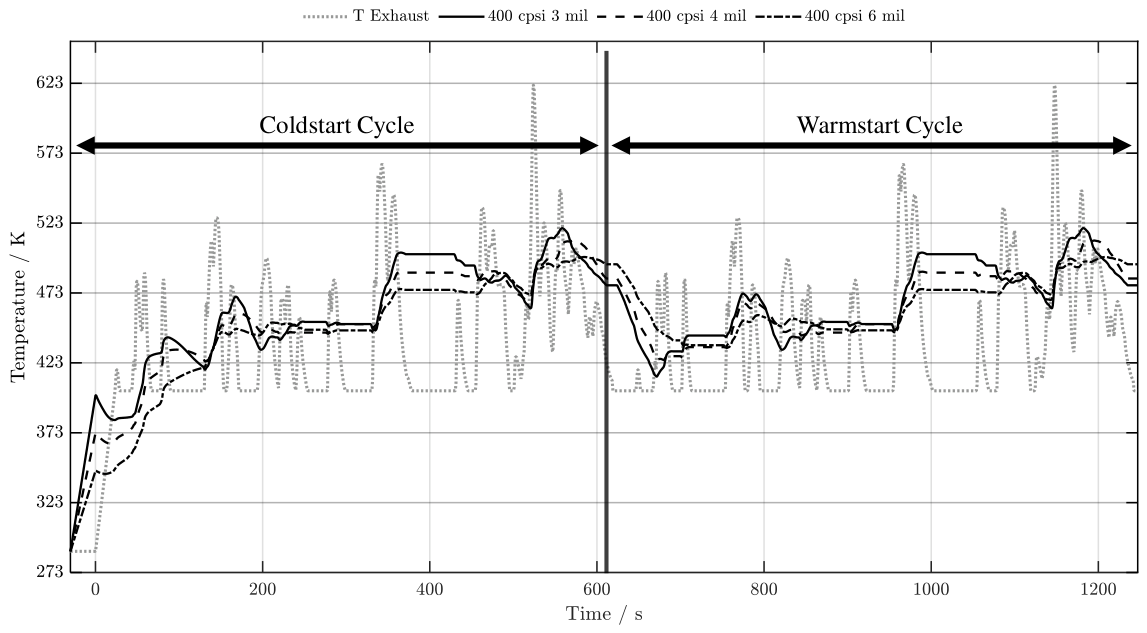
Figure A3.
Simulated thermal response of the 400 cpsi series (baseline length) utilizing continuous active electrical heating, evaluated with a start–stop system.
References
- European Parliament and Council of the European Union. Regulation (EU) 2024/1257 of the European Parliament and of the Council of 24 April 2024 on type-approval of motor vehicles and engines and of systems, components and separate technical units intended for such vehicles, with respect to their emissions and battery durability (Euro 7). Off. J. Eur. Union 2024, 50, 1–49. [Google Scholar]
- U.S. Environmental Protection Agency. Control of Air Pollution From Motor Vehicles: Tier 3 Motor Vehicle Emission and Fuel Standards; Federal Register 2014; U.S. Environmental Protection Agency: Washington, DC, USA, 2014; Volume 79, pp. 16122–16247.
- Heck, R.M.; Farrauto, R.J. Automobile Exhaust Catalysts. Appl. Catal. A Gen. 2001, 221, 443–457. [Google Scholar] [CrossRef] [Scilit]
- Gulati, S.T. Thin Wall Ceramic Catalyst Supports; SAE Technical Paper 1999-01-0269; SAE: Warrendale, PA, USA, 1999. [Google Scholar] [CrossRef] [Scilit]
- Watling, T.C.; Cox, J.P. Factors Affecting Three-Way Catalyst Light-Off: A Simulation Study. SAE Int. J. Engines 2014, 7, 1311–1325. [Google Scholar] [CrossRef] [Scilit]
- Hughes, K.W.; Flörchinger, P. Ultra Thinwall Light-off Performance—Varying Substrates, Catalysts, and Flow Rates; Models and Engine Testing; SAE Technical Paper 2002-01-0352; SAE: Warrendale, PA, USA, 2002. [Google Scholar] [CrossRef] [Scilit]
- Tanner, C.W.; Twiggs, K.; Tao, T.; Bronfenbrenner, D.; Matsuzono, Y.; Otsuka, S.; Suehiro, Y.; Koyama, H. High Porosity Substrates for Fast-Light-Off Applications; SAE Technical Paper 2015-01-1009; SAE: Warrendale, PA, USA, 2015. [Google Scholar] [CrossRef] [Scilit]
- Steiner, T.; Neurauter, D.; Moewius, P.; Pfeifer, C.; Schallhart, V.; Moeltner, L. Heat-Up Performance of Catalyst Carriers—A Parameter Study and Thermodynamic Analysis. Energies 2021, 14, 964. [Google Scholar] [CrossRef] [Scilit]
- Landeshauptstadt Innsbruck. City-Map Innsbruck. Magistrat der Stadt Innsbruck, Austria. Available online: https://city-map.innsbruck.gv.at/stadtplan/client_workspace/FatalError.jsp;jsessionid=D5D860C04CCB6987F2D5BF6FF01D6775?synergis_session=02d2ef88-5742-4502-bf69-7e581dc57f08&tsp=1746781930310 (accessed on 9 September 2025).
- Moeltner, L.; Hohensinner, M.; Schallhart, V. Experimental and Numerical Analysis of Low Temperature NOx—Conversion in Urban Busses; SAE Technical Paper 2016-01-8076; SAE: Warrendale, PA, USA, 2016. [Google Scholar] [CrossRef] [Scilit]
- Moore, W.J.; Hummel, D.O. Physikalische Chemie; De Gruyter: Berlin, Germany; Boston, MA, USA, 2012. [Google Scholar]
- Verein Deutscher Ingenieure (Ed.) VDI-Wärmeatlas: Berechnungsunterlagen für Druckverlust, Wärme- und Stoffübergang, 10th ed.; Springer: Berlin/Heidelberg, Germany, 2006. [Google Scholar]
- Möltner, L.; Schallhart, V.; Berthold, H. Silikatkeramischer Kompositwerkstoff und Anwendungen Davon. Patent No. A 50628/2021, 30 July 2021. [Google Scholar]

Disclaimer/Publisher’s Note: The statements, opinions and data contained in all publications are solely those of the individual author(s) and contributor(s) and not of MDPI and/or the editor(s). MDPI and/or the editor(s) disclaim responsibility for any injury to people or property resulting from any ideas, methods, instructions or products referred to in the content. |
© 2026 by the authors. Licensee MDPI, Basel, Switzerland. This article is an open access article distributed under the terms and conditions of the Creative Commons Attribution (CC BY) license.