


Abstract
The photoreceptor bacteriorhodopsin (HsBR) from Halobacterium salinarum is a model system for studying ultrafast photoinduced reactions in proteins. Recent time-resolved serial femtosecond crystallography (TR-SFX) experiments require high pump energies, raising concerns about nonlinear excitation and multi-photon effects. Here, we systematically investigate the influence of excitation energy, pulse duration and the sign of the chirp on the initial HsBR photo-reaction using femtosecond Vis-pump IR-probe spectroscopy in the retinal C=C stretching region. An acousto-optic programmable dispersive filter enabled independent control of pulse energy and chirp. Within the tested range, the retinal dynamics were independent of pulse duration and chirp, indicating that fluence alone does not fully describe excitation conditions. Increasing excitation energy leads to nonlinear saturation of the retinal signals and the appearance of an additional band near 1550 . However, this band rises linearly with the excitation energy. Hence, the additional band is not directly caused by non-resonant multi-photon absorption. Spectral decomposition reveals two components: a low-energy contribution consistent with the known retinal isomerization dynamics and a high-energy contribution attributed to a small population of photo-damaged HsBR likely formed via a resonant two-photon process. These findings clarify the role of excitation conditions in ultrafast HsBR spectroscopy and suggest that spectral changes at high pump energies mainly arise from damaged species upon resonant two-photon excitation.
1. Introduction
Bacteriorhodopsin from Halobacterium salinarum (HsBR), a light-driven proton pumping membrane protein, is one of the benchmark systems for our understanding of molecular processes in proteins. Upon photoexcitation of light-adapted HsBR, isomerization of the all-trans retinal chromophore to the 13-cis conformation occurs with a time-constant of 0.5 ps [1]. The ground-state intermediates relax on time-scales from picoseconds to milliseconds via the different states J, K, L, M, N, and O. On a time-scale of milliseconds, the parent state with an all-trans retinal chromophore is reestablished. This sequence of reaction processes is called the photocycle of HsBR and it was characterized in detail using various spectroscopic methods over the last decades including time-resolved structures [2,3,4,5]. Hence, it is also one of the first targets for novel methods. Ultrafast spectroscopy in particular [1,6,7,8,9,10,11,12] successfully disentangled the early steps of the reaction, showing that the initial photo-reaction starts with an excited state building up a strong dipole moment within 200 fs followed by isomerization of the retinal photo-receptor on a sub-picosecond time-scale. If and how the protein surroundings of the retinal react to these early changes is still debated, but there is growing spectroscopic evidence that the retinal-isomerization is also accompanied by ultrafast structural changes in the protein [8,13,14,15].
In the last decade, advances in technology led to the application of ultrafast time-resolved serial crystallography (TR-SFX) onto proteins, finally giving us the ability to directly compare structural and spectroscopic changes on a femtosecond time-scale. But, as with most novel methods, there are still open questions and issues: in particular, up to now, all studies, as also summarized by Orville [16], used and required pump-pulse energies in the range of several μJ, which translates into multiple photons per chromophore. In this regime, multi-photon processes are expected. If and how much they influence the resulting structures is not yet clear. Such high energy excitation conditions were also used in the two-femtosecond TR-SFX studies on BR [17,18]. As part of the latter study, we showed that spectroscopic results are drastically affected by using such high energies, in line with earlier studies reporting resonant multi-photon interactions [12,19]. However, high excitation energies are not unique to TR-SFX experiments; e.g., ultrafast time-resolved Raman studies [20] have also used 5 μJ and 20 μJ pulses for excitation.
But direct comparison between different studies is difficult, since the characterization of the excitation conditions is often incomplete, making the identification of the essential properties affecting the reaction impossible. It is not clear yet what quantities are useful descriptions of the excitation conditions. Commonly used are fluence (power/area) and the number of photons per chromophore, with the former depending critically on the temporal pulse length, while the latter is independent of it, but directly depends on the sample concentration. As a corollary, even if the number of photons per chromophore is the critical quantity, we expect different results when the pump-length exceeds the excited-state lifetime.
Therefore, the aim of this paper is to quantitatively explore the effect of the excitation energy and intensity on the photo-reaction of HsBR. From prior studies [18,19,21], it is already known that higher intensities can influence the reaction quite drastically and resonant two-photon absorption is observable. Here, we want to directly measure how much of the reaction is affected at given energies. Since our prior study showed strong changes correlated with the excitation energy in the mid-IR region of the C=C stretching vibration of the retinal [1,18], we are again using fs Vis-pump IR-probe spectroscopy to observe this region. To systematically vary the excitation conditions, we employed a pulse shaper which allows us to change both the energy and the spectral phase of the excitation pulse without any mechanical adjustment. By adding or removing a quadratic phase we can adjust the duration of the pulse. To answer if the fluence or number of photons per chromophore is a better descriptor, we observe the reaction not only for different energies but also for different pulse durations. To fully quantify our conclusions, we document the excitation conditions in detail and explicitly include the calculations of the resulting properties.
To our surprise, we found that observed differences at high energies can be attributed to the contribution of photo-damaged HsBR. The photo-damage likely stems from a two-photon process, but the yield of the process per pump-pulse is likely too low to contribute to the transient data.
2. Methods
The basic layout and the pulse generation of the fs Vis-pump-IR-probe spectrometer are described in detail elsewhere [18,22]. There are two differences in comparison to the linked references: First is the replacement of the 2 × 32-channel MCT-array with an 128 × 128 pixel MCT-array from Phasetec, USA. The second modification is the addition of an acousto-optic programmable dispersive filter (AOPDF, Dazzler, Fastlite, France) into the pump-beam path. The addition of the AOPDF serves two purposes: we can quickly adjust the pump energy without mechanical movement by varying the amplitude of the generated acoustic wave in the AOPDF and we can quickly change the pulse-length by adjusting the introduced second order dispersion. This variability allows us to make use of a scan scheme, which minimizes the influence of sample damage by rapidly varying the excitation settings. Instead of scanning all time-points for each setting sequentially, we cycle through all settings before going to the next time-delay step.
2.1. Excitation Conditions
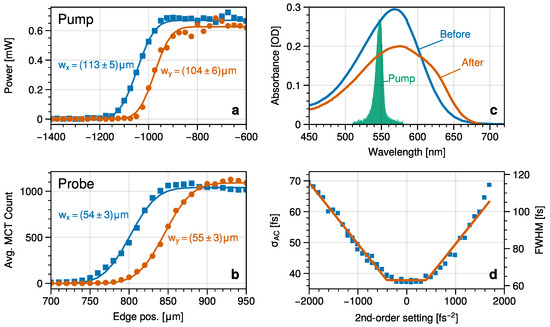
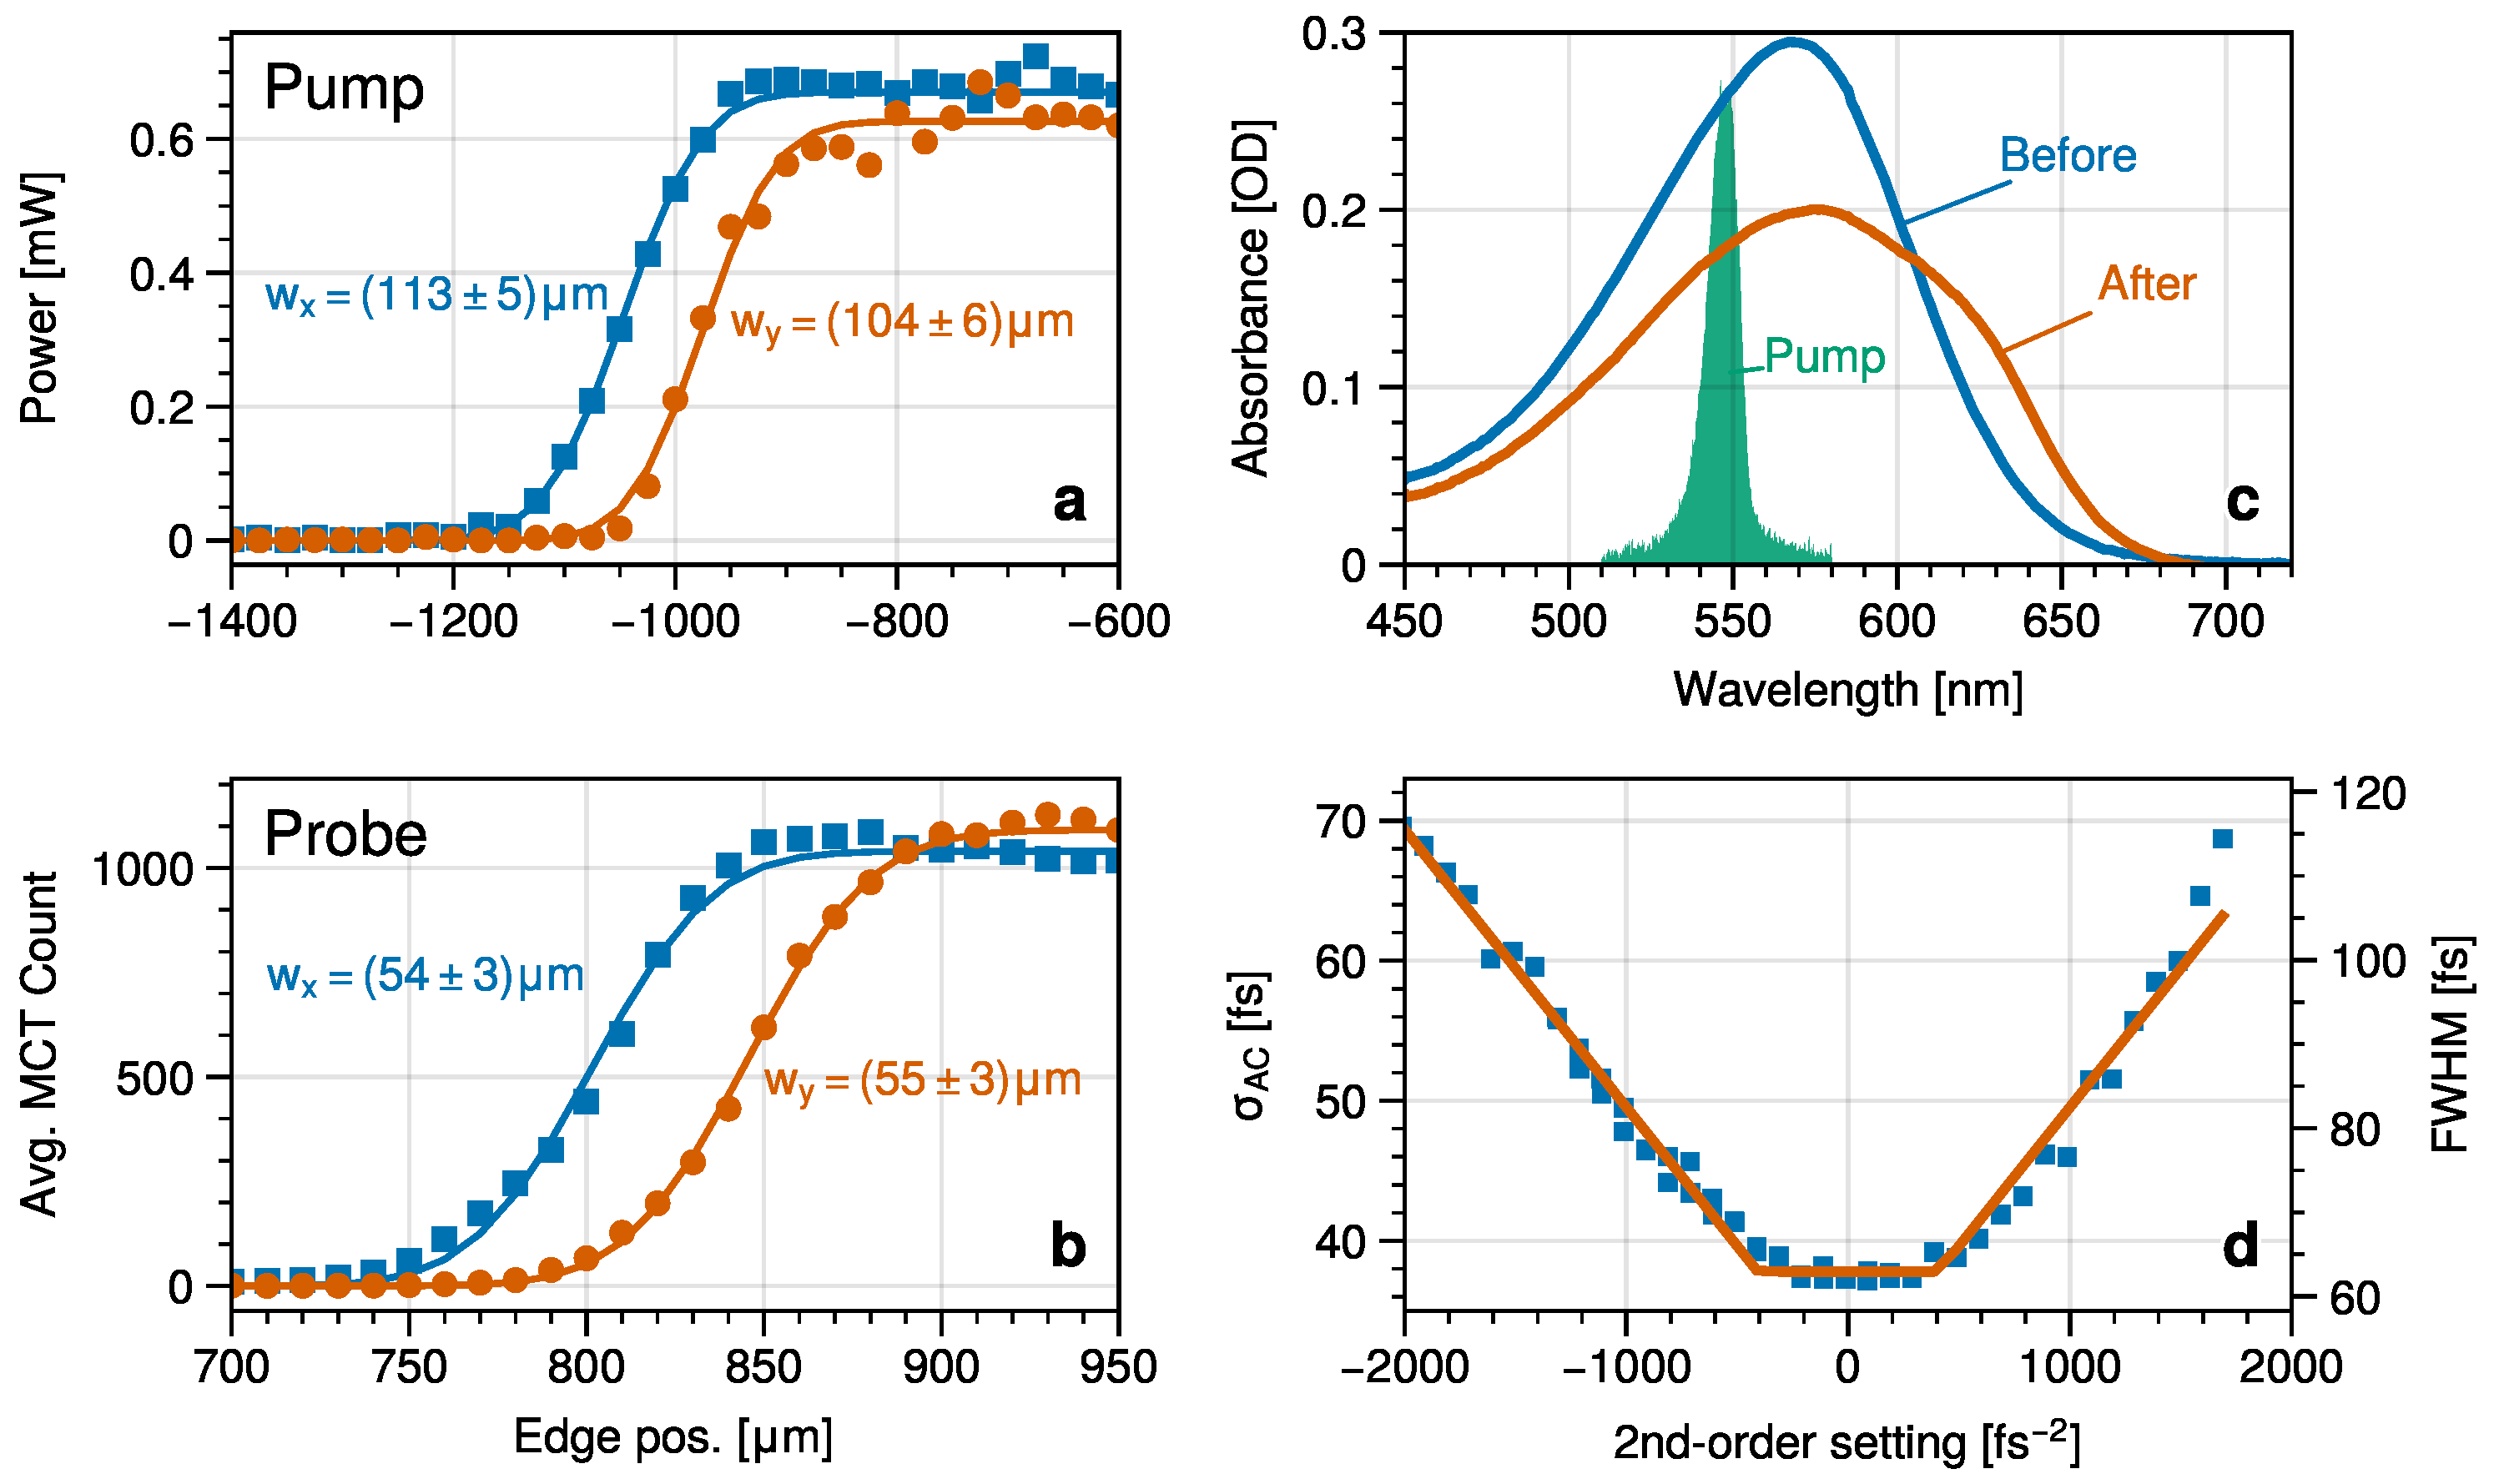
As mentioned in the introduction, a detailed analysis of the excitation conditions is crucial for this study; hence. we measured the beam profiles using the knife-edges method and the pulse duration using an autocorrelator. The results are shown in Figure 1. Further details and derivation of the equations applied are given in the SI. To summarize, we excited HsBR at 548 (FWHM 11 ) with energies ranging from 50 up to 650 . The corresponding number of photons per molecule goes from 0.2 up to 2.8. To investigate the influence of potential multi-photon contributions, we also varied the group velocity dispersion by adding a second-order phase with the pulse shaper. We employed three different phase settings: one which gives the lowest pulse duration (62 ), and two where we added a quadratic phase , both resulting in pulse lengths of 120 . However, one is positively chirped and one is negatively chirped.
Figure 1.
Characterization of the excitation conditions. (a,b) Measured (squares and dots) and fitted (lines) focus-profiles of the pump- and probe-beam using the knife-edges method. The x-values of the measurements are shifted to show x- and y-profiles in a single graph. (c) Visible absorption spectra before and after the measurement and the pump-spectrum. (d) Pump-pulse duration as a function of the AOPDF 2nd-order phase setting (squares), fitted (line) with .
This setup should allow us to distinguish single-photon, two-photon, and sequential two-photon absorption contributions. With the exception of the time resolution, single-photon absorption dynamics should not be affected by the pulse length. Direct two-photon absorption is proportional to the square of the intensity, and hence should be affected by the pulse length but not by the sign of the chirp, while sequential multi-photon absorption should depend on both the sign and the magnitude of the chirp.
2.2. Sample Preparation
The growth and preparation of the proteins is described in detail elsewhere [18]. The protein solution containing a buffer of 50 mM was added to solution and the pD was adjusted to 7.0. Protein samples were placed between two sealed barium fluoride windows with a sample thickness of 25 μm using a Teflon spacer. The initial and final absorptions of the sample are shown in Figure 1c, with an initial absorption of about OD at the excitation wavelength. After the experiment, the absorption maxima is decayed by one third; at the same time, a shoulder appeared at 625 . This spectral change is similar to the two-photon absorption-induced spectral changes observed [23] by Imhof et al. They concluded that the difference is caused by decarboxylation of the glutamate and aspartate in the counter-ion complex.
3. Results and Discussion
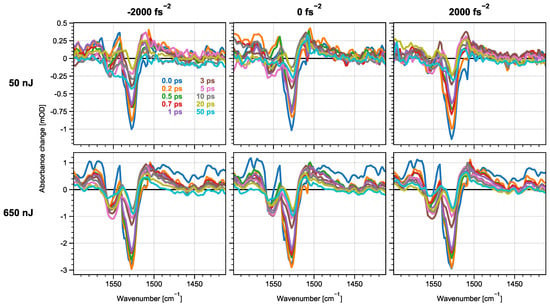
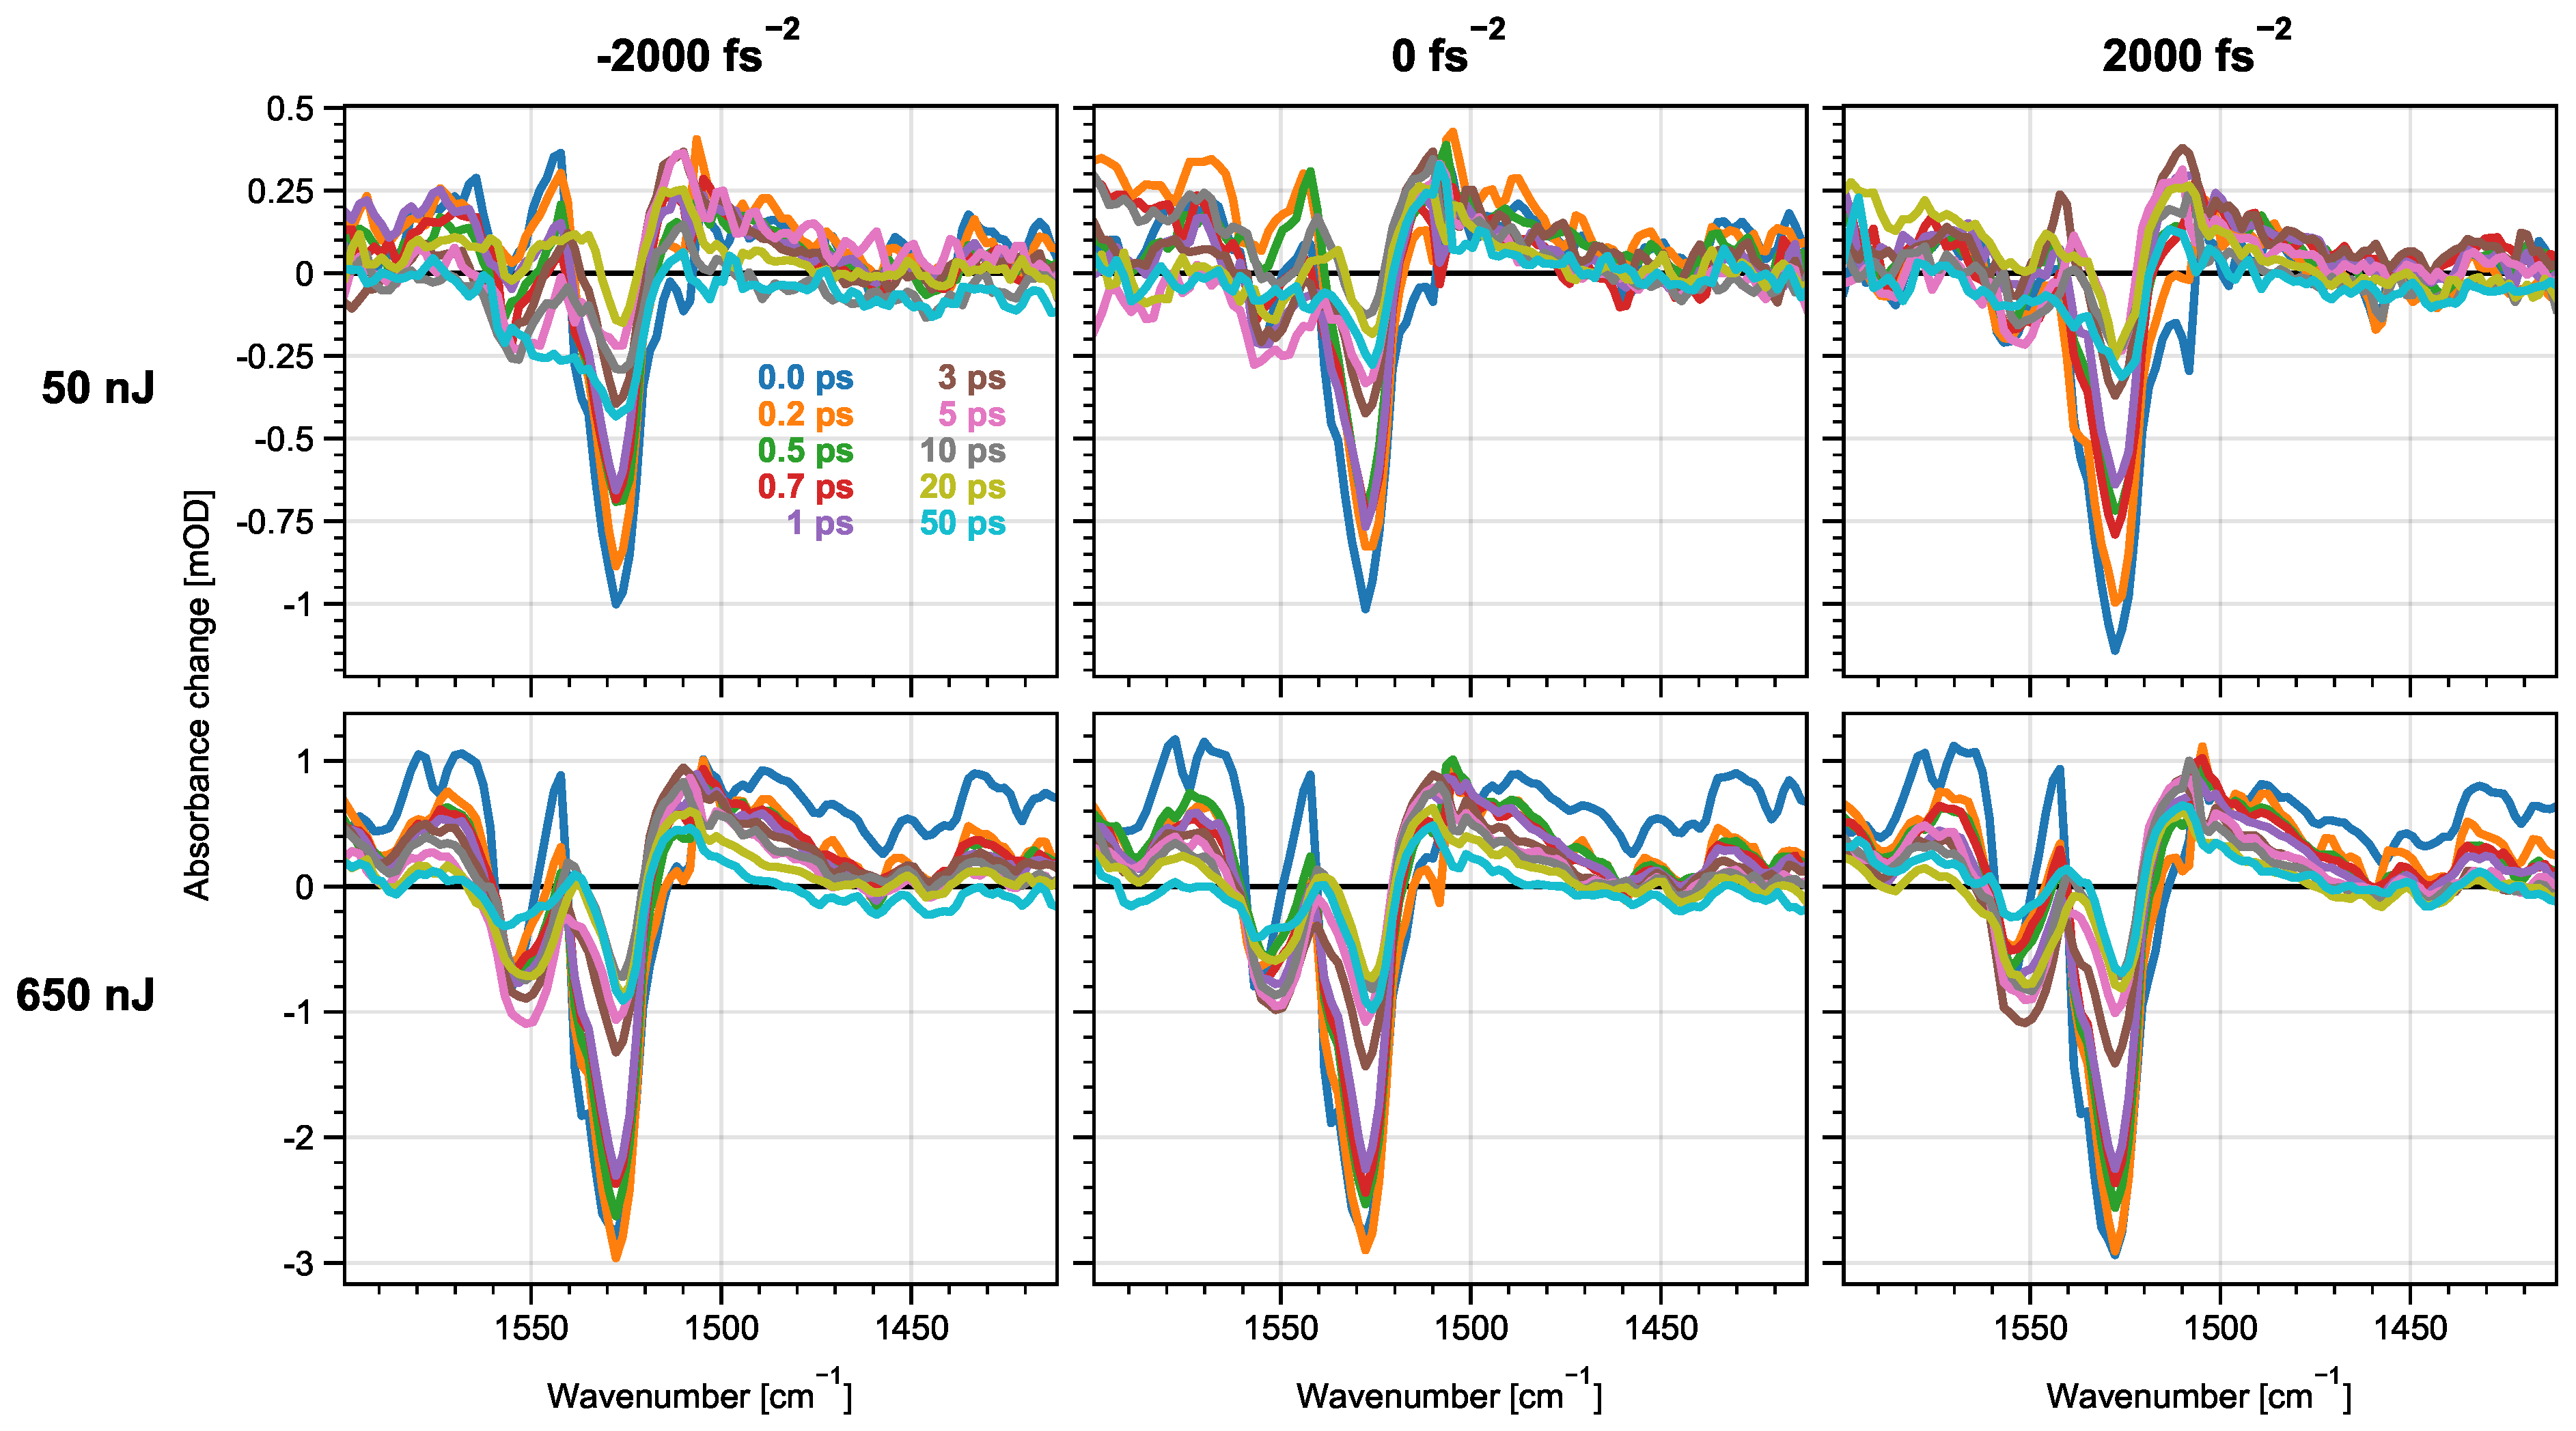
Figure 2 shows the resulting transient spectra for the lowest and highest excitation energies for all three phase settings. All spectra look rather similar, with all sharing three main features: a negative band at 1528 , positive bands at 1510 and 1541 a negative band around 1550 . Closer inspection also reveals another positive band at 1541 in the first hundred . The bands at 1528 cm−1, 1510 cm−1 and 1541 cm−1 are assigned to C=C-stretching modes of the retinal. The dynamics of the ν(C=C)-stretching modes are well described by earlier studies [1,13]: excitation of the retinal leads to bleaching of the ν(C=C)-band. Simultaneously, positive bands at 1542 and 1510 appear. With about , the isomerization of the retinal is complete and the signal partly decayed. Further relaxation dynamics lead to narrowing of the positive peak occurring within . The origin of the 1552 -band is not completely clear, but Gross et al. [13] showed that the band is part of the protein response.
Figure 2.
Isotropic transient spectra for minimal (top) and maximal (bottom) excitation powers for all three dispersion settings. On first inspection, all spectra look quite similar, sharing the same main features. Within the same energy, no difference between the different settings is discernible even at closer inspection. Direct comparison between the different energies reveals clearly non-linear behavior, as the 13-fold increase in energy only leads to a 3-fold increase in signal strength. In addition, the peak at 1550 is clearly more pronounced at higher energies.
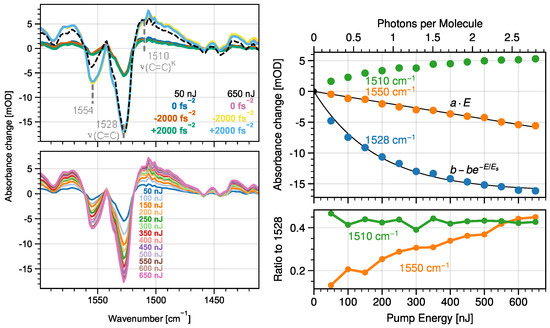
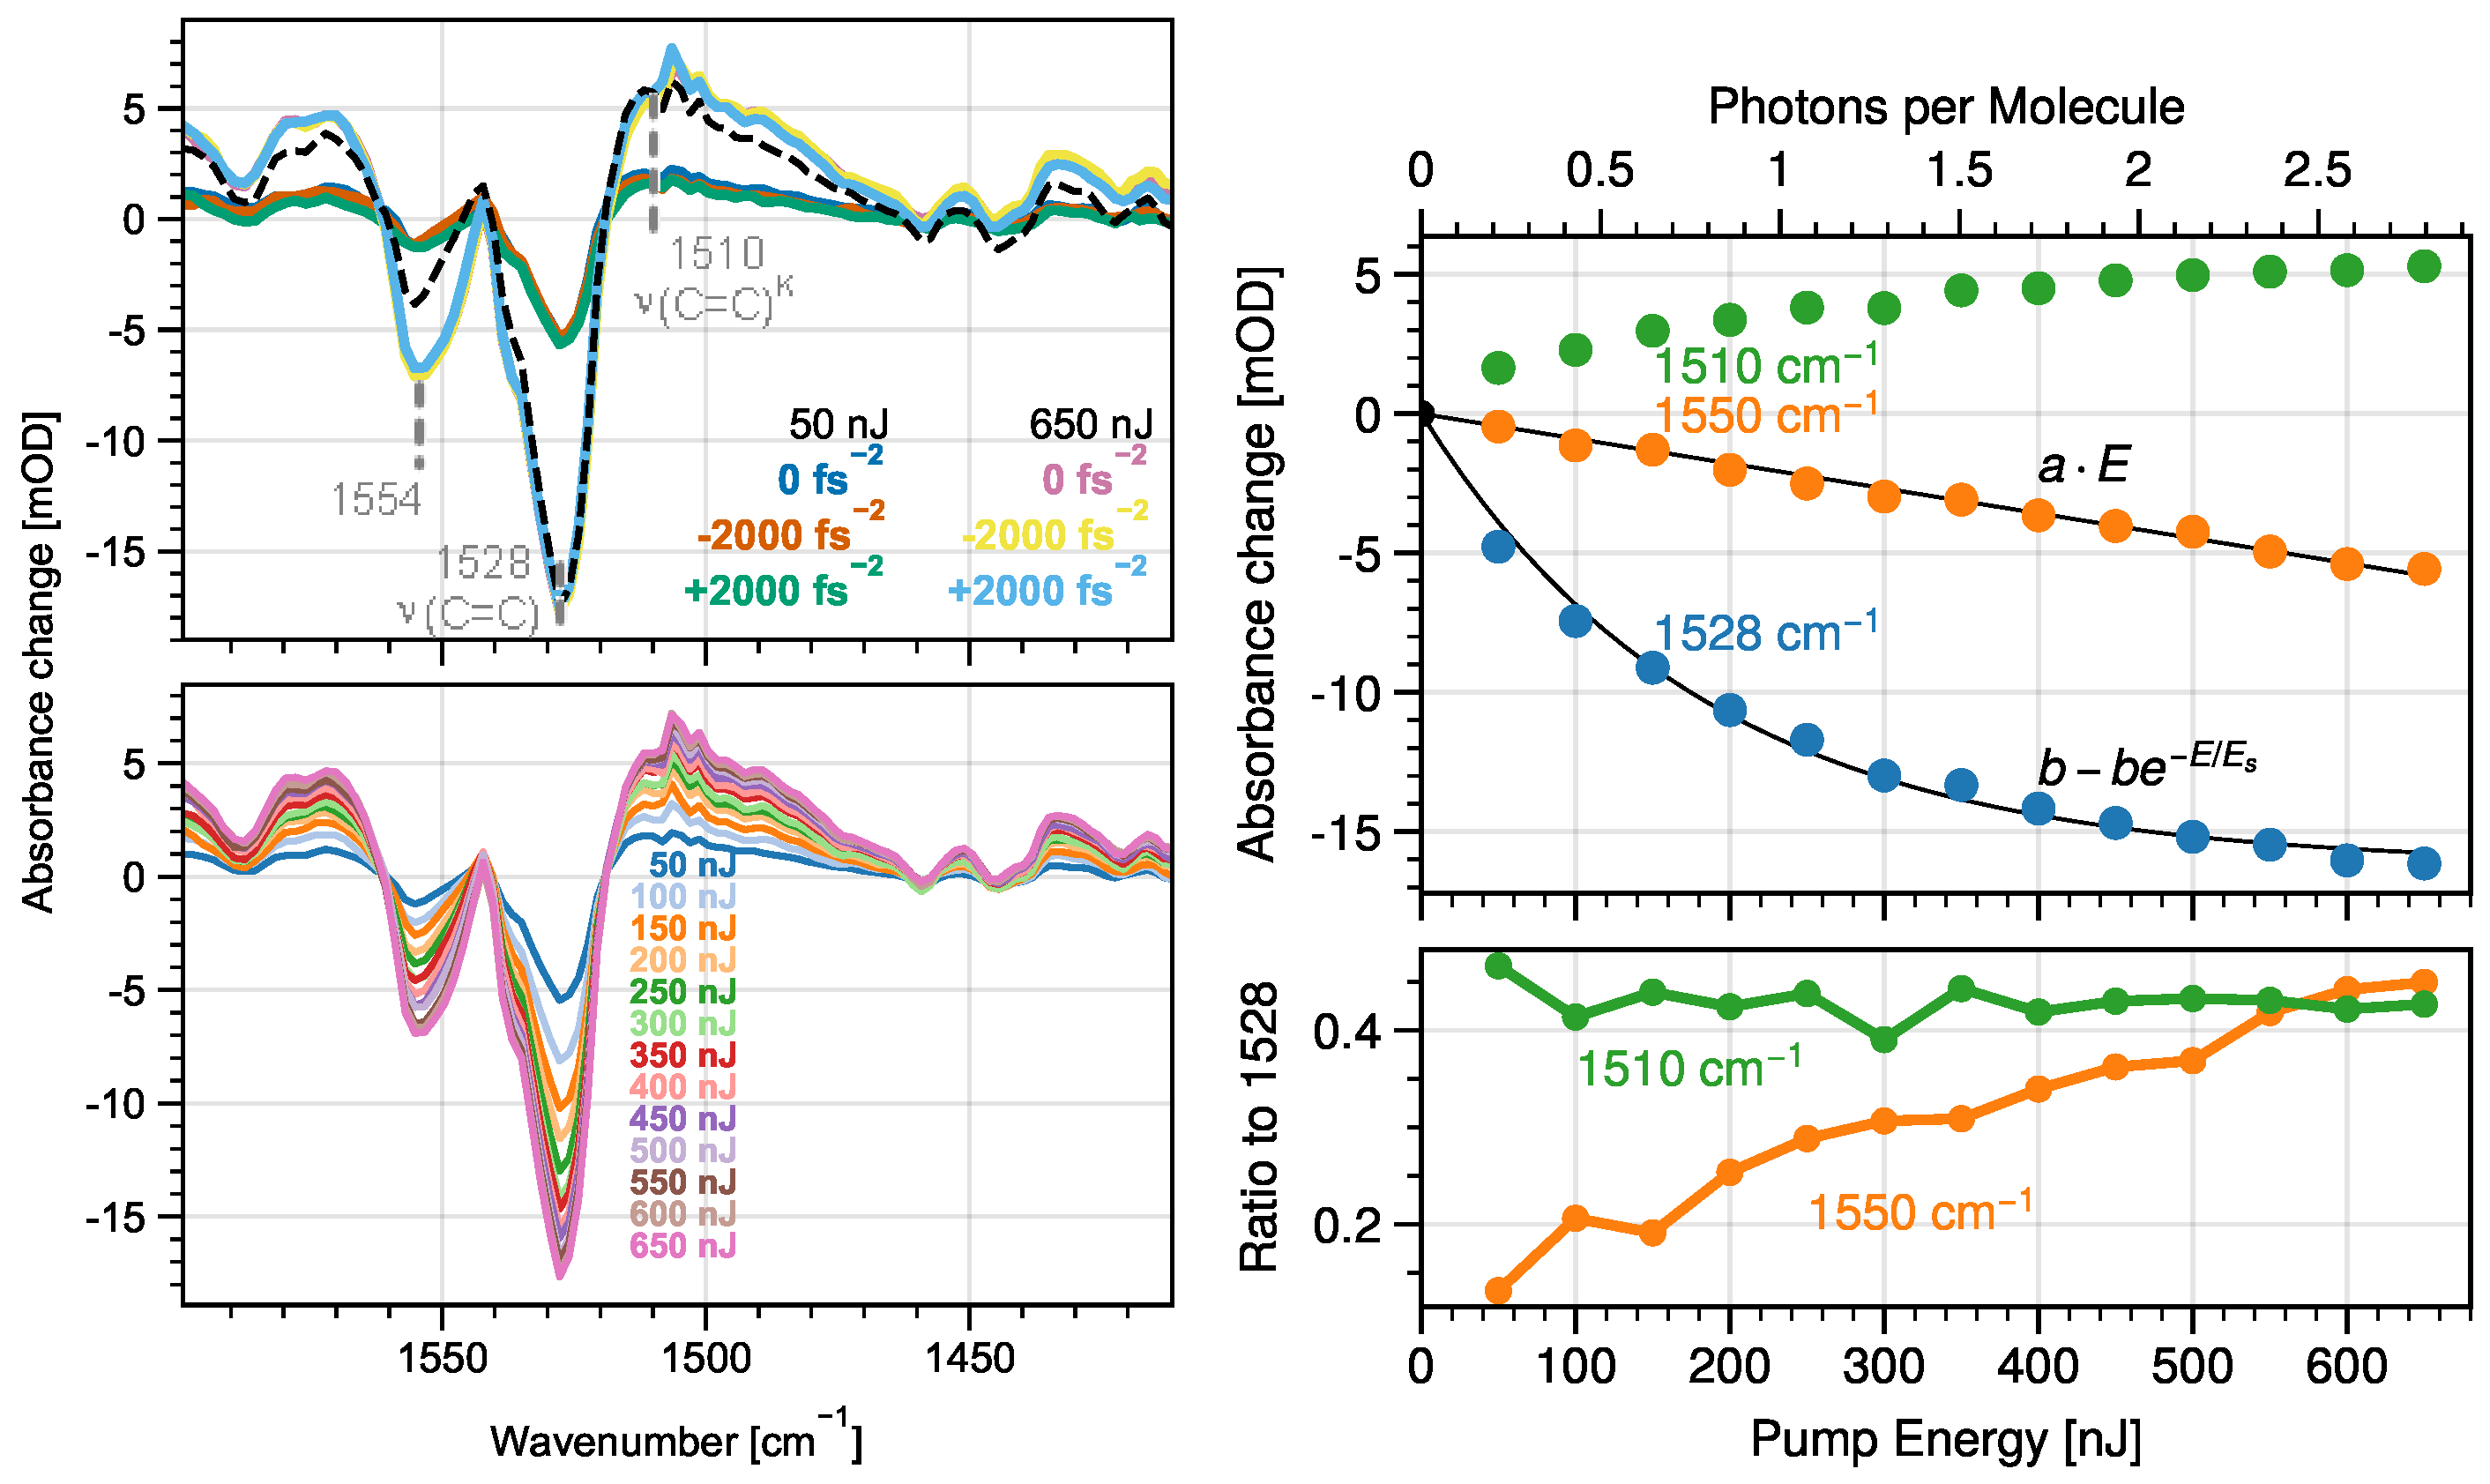
Comparing the signal strengths of the bands at 1555 and 1528 at 50 nJ and 650 nJ excitation energy shows a significantly different behavior. The signal increase in the 1528 band is only about while the increase in the 1555 band is about 6-fold, unmistakably proving the different behavior as a function of excitation energy. However, to get a better comparison, Figure 3 shows the summation of all time-delays for all six measurements presented in Figure 2. While the resulting sum-spectra are not helpful in analyzing the photo-reaction—their relative signal amplitudes depend on the choice of the summed time-delays—they are quite useful for quantifying the influence of excitation conditions. Two major observations are made:
Figure 3.
(Top left) Sum over all time-delays larger than 0 for the six measurements shown in Figure 2. The sum-spectra form two groups, one for each energy. Within each group, the sum-spectra of the three different phase settings are nearly identical. The dashed black line is the scaled average of the 50 -lines. Clearly identifiable absorption peaks of the ν stretching vibrations of the retinal at 1510 and 1528 are due to absorption in the K intermediate state and in its electronic ground state, respectively. Assignment of the vibration at 1554 is under discussion. (Bottom left) Sum over all time-delays averaged over all three dispersion settings for all measured energies. (Top right) Power dependency of selected spectral positions in the sum-spectra. Positive signals at 1510 (green dots), negative signals at 1528 (blue dots) and at 1550 (orange dots). The black dot indicates the 0 signal. As shown by the black lines, the power dependence can be modelled well by an exponential function for the signal at 1528 with saturation energy ES and by a linear function for the signal at 1550 . (Bottom right) Ratio of the 1510 and 1550 signals to the 1528 signals (green and orange dots, respectively); deviations at low energy reflect lower signal to noise ratio.
(a) Since the lines for the different phase settings are almost identical, the pump-pulse duration and chirp (within the checked limits) do not influence the reaction for both the minimal and maximal excitation power. Within the one-photon limit, the lack of influence of the spectral phase was already shown by Libel and Kukura [24]. Our findings are, at first glance, in contrast with Florean et al. [19], who observed a dependence of the product yield on the linear chirp in the multi-photon regime. The difference might be due to the different pump spectra: their excitation pulse was centered at 570 and had a larger spectral width of approximately 30 (FWHM) compared to to the 10 used here.
(b) The ratio of the two negative peaks changes with the excitation energy. To get a better understanding of this energy dependency, we additionally average over all three spectral phase settings. The bottom panel shows these averaged sum-spectra for all measured energies. The main observation is the occurrence of isosbestic points, indicating that two different reactions might be sufficient to describe the reaction within the given energy limits.
The energy-dependent behavior of the main features is further analyzed in Figure 3, where the signal of three features in the sum-spectra is plotted against the pump-energy. Normalized spectra are shown in the Supplementary Materials (Figure S2). The behavior of the C=C-stretching bands is clearly non-linear. This is in line with recent studies by Robben and Cheatum [25], which predict a saturation behavior for pump-probe signals as excitation energy increases.
Surprisingly, the behavior of the 1550 signal seems to be linear, which will be discussed later. All lines are required to reach 0 mOD for 0 . Linear extrapolation of the two lowest energies indicates that at least the second lowest energy of 100 is already in a non-linear regime, in line with prior fs Vis-pump Vis-probe studies [12,19] stating similar focii conditions, which report 30–50 as an upper limit of the linear regime.
The relative dependency of the features is visualized in the bottom of the figure. The ratio between the positive and negative ν(C=C)-bands is nearly constant at the shown positions. In contrast, the relative strength of the 1550 band goes up with energy. We and others previously assigned the behavior at high energies to resonant two-photon absorption [12,18,19]. Furthermore, this band does not appear (or is much weaker) in earlier studies [1,13,26] using lower energies.
However, the power-dependency observed here cast doubts about the previous assignment: the population of the sequentially two-photon excited-state has to be a function of single-photon excited population and is expected to rise non-linearly with increasing photons in the linear single-photon excitation regime. While the signal at 1531 is clearly leveling off at higher energies, the 1550 -signal is independently increasing in a linear fashion. Additional simulations have to be performed to check whether this linear increase is compatible with resonant two-photon excitation at nearly saturated single-photon excitation conditions.
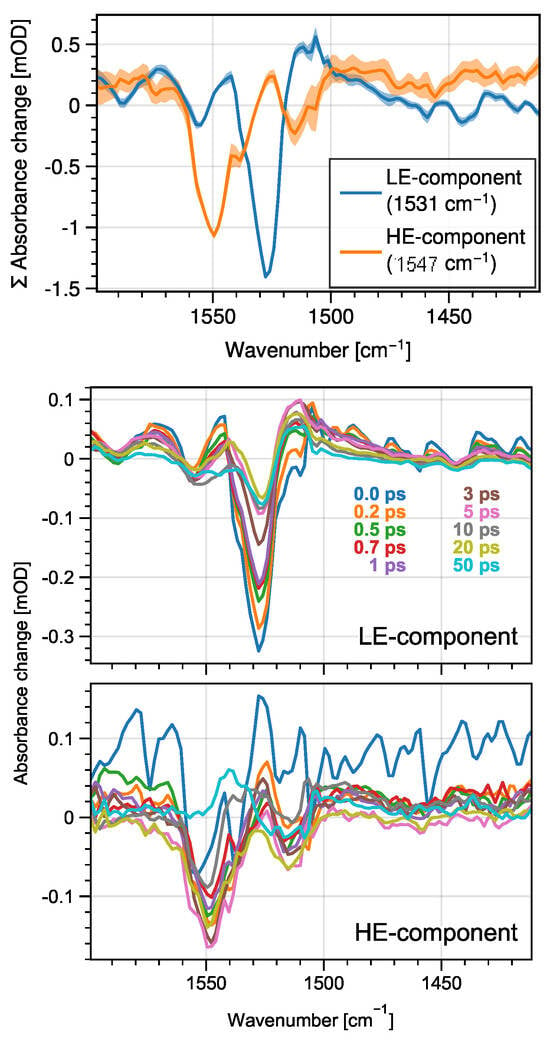
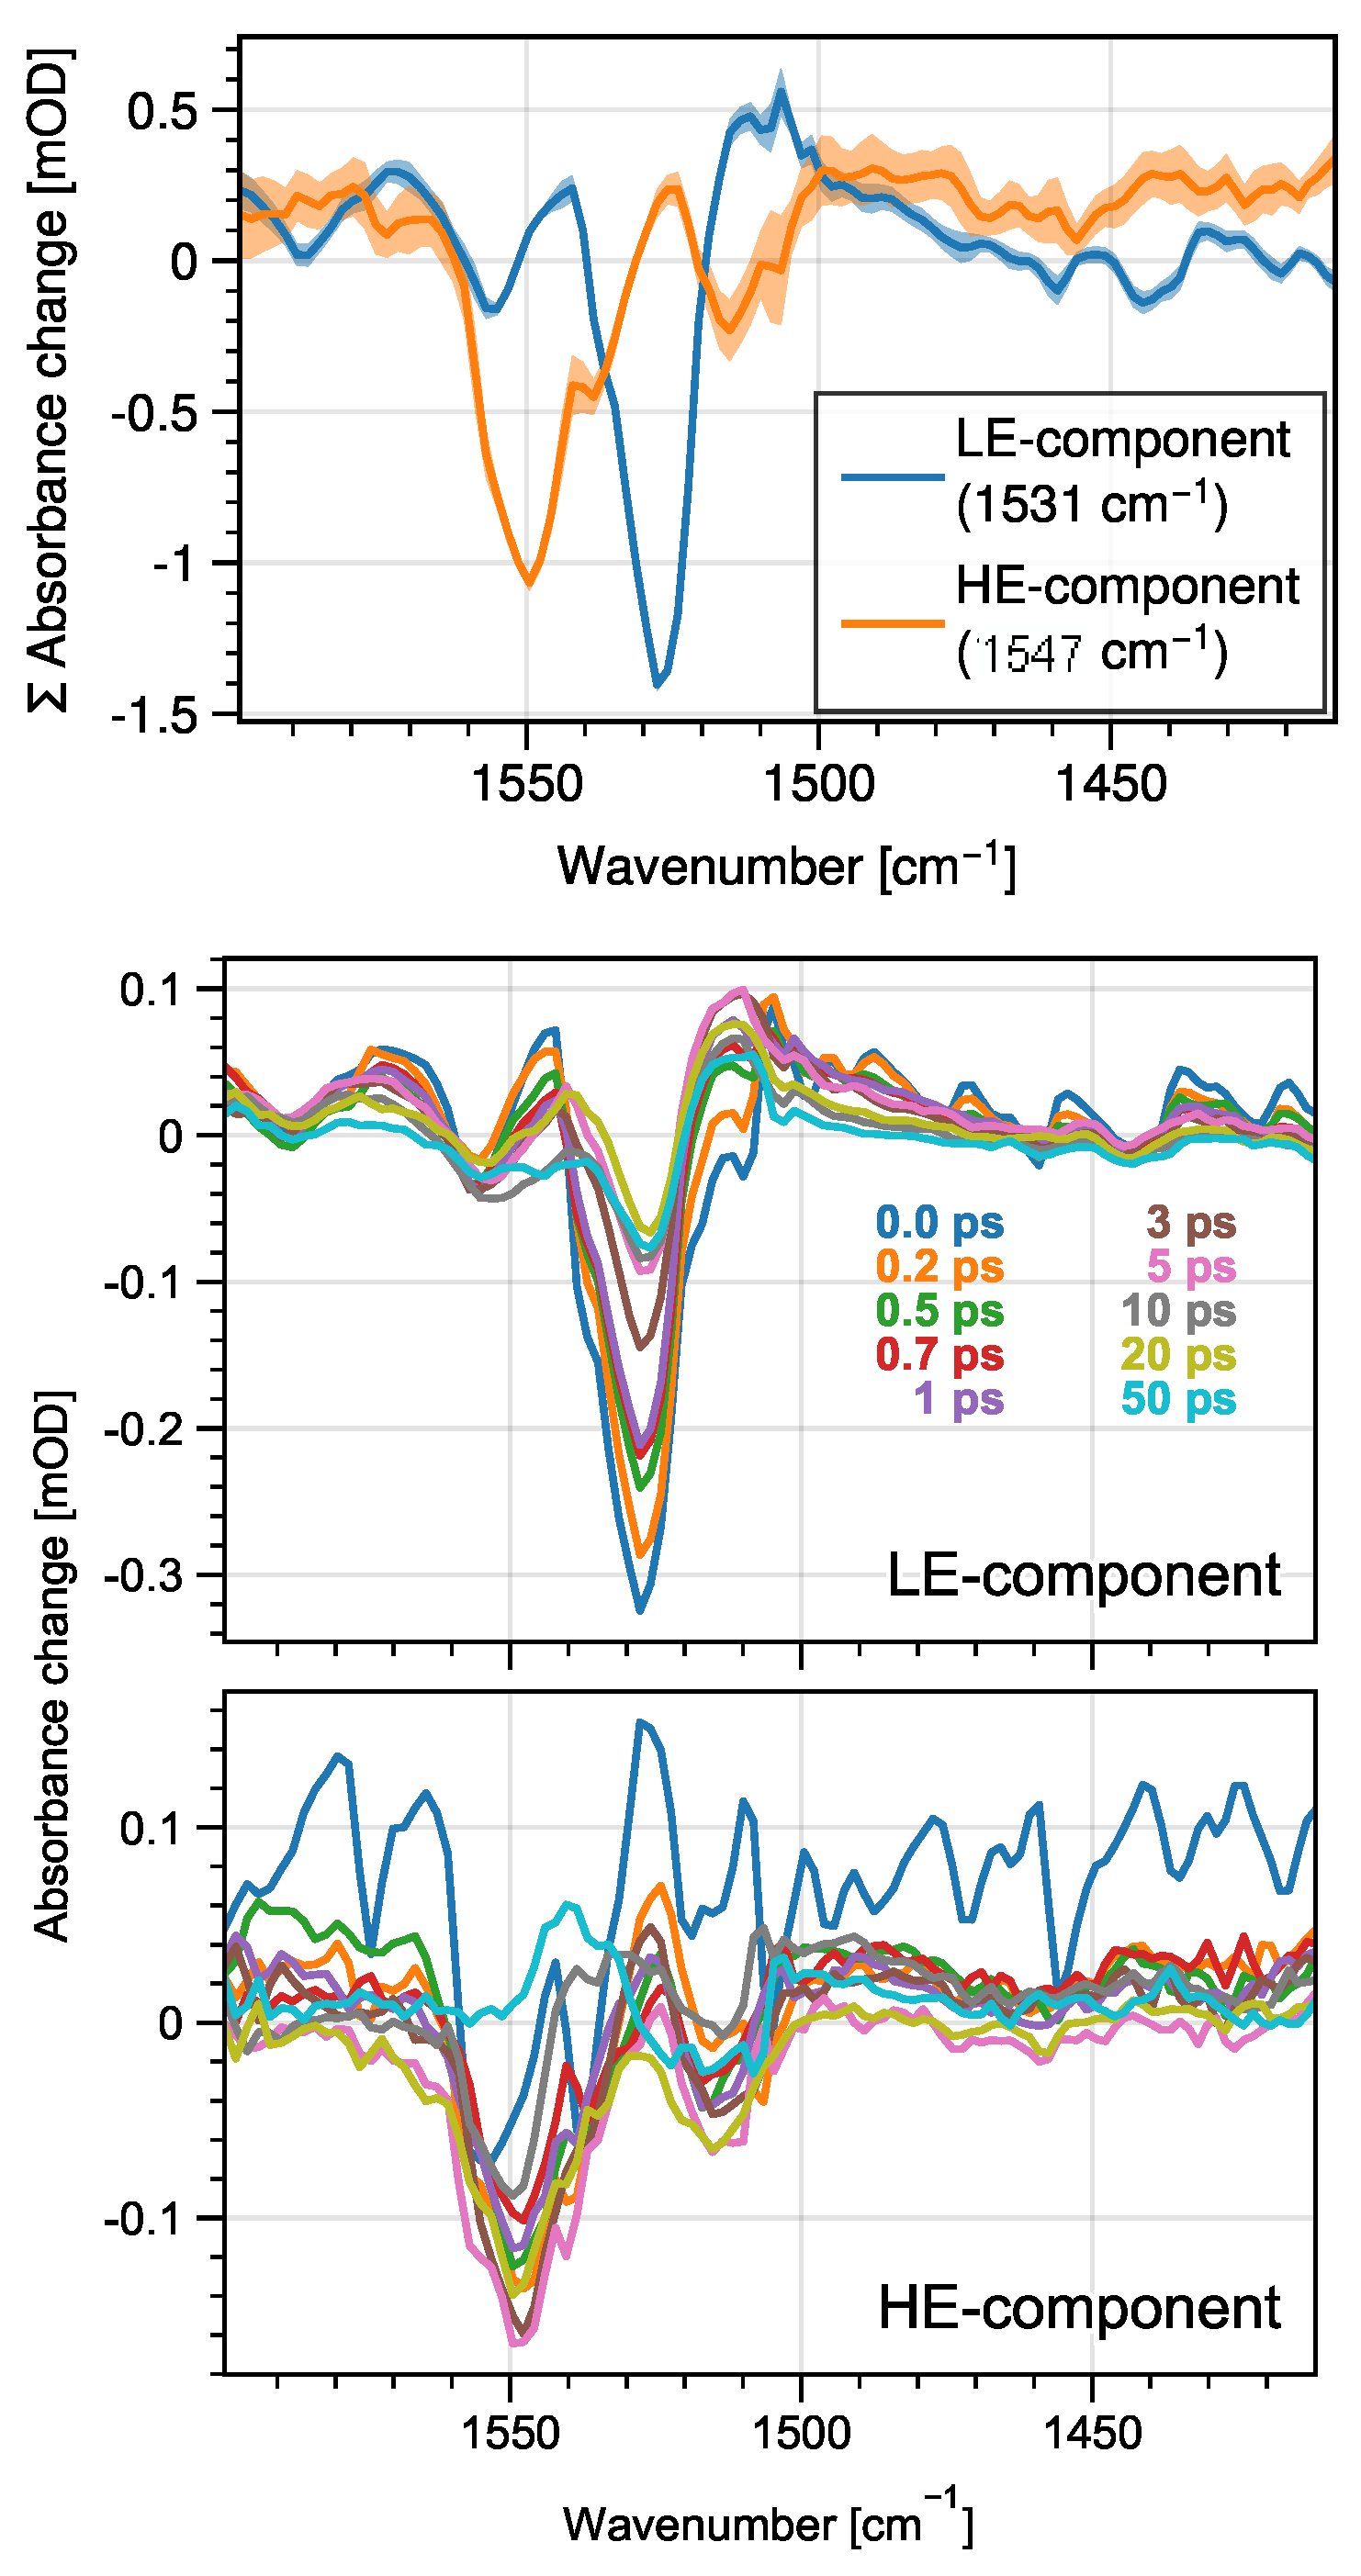
To further check if these two power-dependencies are enough to model all the observed data, we use them as basis-vectors for a linear regression of all the sum-spectra presented in Figure 3. The resulting fit is quite good with a , only 11% worse than a two-component decomposition by singular value decomposition, which gives the best rank-2 approximation. We get an slightly better approximation, within 7% of the SVD, when using the transients at 1547 cm−1 and 1531 as basis-vectors instead. The resulting associated sum-spectra are shown in Figure 4. For simplicity, we call the 1531 -component low energy (LE) and the 1547 -component high energy (HE). The decomposition reveals contributions at 1518 of the HE-component and contributions at 1558 of the LE-component. The HE-component is dominated by three bleaching bands at 1550 cm−1, 1539 cm−1 and 1518 cm−1, all overlaid by a positive continuum band. In contrast, the LE-component consists of multiple positive–negative peak pairs, consistent with previous studies [26]. The bleaching signal at 1528 is assigned to the ethylenic C=C stretching vibration of the retinal in its electronic ground state, while the positive band around 1510 is assigned to the ethylenic C=C stretching vibration of the retinal in the J and K intermediate. The positive band at 1570 is assigned to a chromophore vibration in the S1 state, while the negative bands around 1550 are suggested to be non-chromophore bands.
Figure 4.
(Top) Linear decomposition of the sum-spectra using the signals at 1531 cm−1 and 1547 as a basis. Colored regions mark the -region resulting from the linear regression. (Middle,Bottom) Power-dependent linear decomposition of the full dataset using the power-dependence of the sum-spectra as the basis. The lines show the time-resolved difference spectra associated with the low-energy regime (top) and high-energy regime (bottom).
However, after verification of basis-vectors with the sum-spectra, we can apply the same vectors for each time-delay and therefore reconstruct the two power-depended time-resolved difference spectra. The result is shown in Figure 4. The transient spectra of LE-component are very comparable to earlier studies [1,13] in this spectral region, confirming the validity of our decomposition approach. Therefore the assignment follows the previous work as described above.
The HE-spectra are, not surprisingly, much noisier. Again, the HE-spectrum is dominated by the negative feature at 1550 , accompanied by an positive–negative feature at 1522 (+) and 1513 (−). The band origins are not completely clear. However, we can assume that at least one of the bands is the ethylenic stretch of the retinal. The frequency of this vibration is known [27,28] to be anti-correlated with the wavelength of the absorption maximum. By applying this relationship, a C=C stretching frequency of 1550 would indicate an absorption maximum around and a frequency of 1513 at . While neither of the wavelengths are directly covered by our pump-spectra, the excitation of a retinal with νmax via a vibronic progression band is possible. This assignment is supported by our “After” visible absorption spectra in Figure 1c, which have a visible shoulder around 620 , and by the increasing change in transient spectra over time (see Figure S3). Two-photon excitation of the state (HsBR) was reported to absorb at , matching our estimated absorption maximum of a C=C stretching frequency at 1550 [29]. Thus, the negative signal at 1550 could reflect the bleaching signal of the C=C stretching vibration upon excitation to the state.
Hence, we tentatively assign the peak at 1513 in the HE regime to the ethylene stretching vibration of the retinal and the peak at 1550 to either the ethylene stretching upon two-photon excitation or to a protein vibration. Similarly, Gross et. al [13] showed that, under LE-conditions, peaks above the ethylenic stretch must be protein contributions. According to Imhof et al. [23,30], the shoulder at 620 in the visible spectrum belongs to a product state in which the carboxylates of the counter-ion, D81 and E212, are partially decarboxylated by a two-photon-induced process. Following this argumentation, the origin of 1550 -band may be the anti-symmetric stretching vibration of the remaining COO−-group, which is likely strongly coupled to the retinal via the positive Schiffs base. Another possibility is an assignment of the 1550 bleaching band to Tryptophan ring-mode [31,32], since the two tryptophans near the retinal are strongly coupled to the retinal chromophore in the excited state [8].
However, in both cases it is rather surprising that the intensity of the C=C mode is weaker than the protein mode. Hence, further studies are required to fully elucidate the assignment of a protein vibration or to support the assignment of an ethylenic stretching vibration upon two-photon excitation.
4. Conclusions
The current necessity of high excitation energies in TR-SFX experiments to achieve well resolvable structural changes in proteins requires a careful examination of the behavior of the associated photo-reactions under these conditions. Here, we applied fs Vis-pump IR-probe spectroscopy to HsBR using a AOPDF and careful characterization of the focii, allowing us to study the ultrafast reaction under different chirp and energy settings of the excitation pulse. Within the tested parameter limits, the chirp—and therefore the pulse length—has negligible influence on the reaction. Thus, the fluence alone is an incomplete description for the excitation conditions. Instead, the pulse energy and duration and the protein concentration should be given separately. Since neither the sign of the chirp nor the pulse length has an influence, contributions of non-resonant multi-photon effects to the recorded spectra must be negligible.
Furthermore, the data confirms that the earlier ultrafast TR-SFX studies of HsBR were clearly in the non-linear regime. Our results suggest that TR-SFX studies should be performed with lower excitation power or include a power titration to ensure measurements in or close to the linear regime. In our experiments the non-linear regime is mostly characterized by saturation of the retinal ν(C=C)-bands with increasing energy. As previously reported, an additional band at 1550 gains relative strength at higher energies that we assign to a high-energy (HE) component. Surprisingly, the HE component signal increases linearly with excitation energy, indicating that this signal is not caused by non-resonant two-photon excitation. It remains open whether it could be caused by resonant two-photon excitation. Therefore, we tentatively assign the additional signal either to a resonant two-photon excitation to the state or to a single-photon transition with absorption centered at 625 nm, with a lower absorption at the excitation wavelength of 548 nm. The latter assignment explains the wavelength dependence observed in earlier studies [12]. The exact nature of this signal at 1550 remains to be explored in further studies, but we tentatively assign it to photo-damaged [23,30] HsBR upon resonant two-photon excitation. Our experimental conditions reuse HsBR sample after excitation, while in XFEL-experiments a sample volume is measured only once. Thus, a one-to-one comparison is not given. Therefore, further experiments have to be performed to determine possible reaction pathways under high-energy excitation conditions identical to XFEL-experiments.
In general, photo-induced processes in biological systems that regulate biological functions occur almost exclusively under single-photon excitation conditions. It is therefore appropriate to study these processes exclusively under single-photon excitation conditions. Multi-photon processes lead to additional signals and relaxation pathways that complicate the understanding of the original reaction cascade. Therefore, comparability with the natural process should be ensured in all experiments on biological systems.
Supplementary Materials
The following supporting information can be downloaded at https://www.mdpi.com/article/10.3390/photochem6020023/s1. Figure S1: Relationship between the different beam-diameter definitions for a simulated gaussisan beam with . Top: The blue line shows the power density along the x-axis. The green line displays the normalized integrated power along the x-axis simulating the knifes-edge method. The 10% and 90% points are marked. Bottom: Colormap of the focus profile with contours at and of the maximum value. The beam-waist w is equal to . Figure S2: Transient spectra and normalized transient spectra: Left: Transient spectra at different delay times were plotted upon different excitation energies (color coded). Here, it is clearly visible that with inceasing energy vibrational signals increase. Right: Same spectra normalized to the negative peak at 1528 cm−1. Figure S3: Evolution of transient spectra: For each measurement we performed 12 scans and averaged them. Left: Here, we compare the first six scans (blue lines) with the following six scans (orange lines) and plotted the averages for given delay times. It is clearly visible that during the measurement the transient spectra changes, supporting the accumulation of a new state that contributes to the transient data. Right: Same spectra normalized around 1528 cm−1. From these transient spectra one can conclude that a significant contribution from the acculumated new state is responsible for the different pump energy dependence around 1550 cm−1.
Author Contributions
G.W. and T.S. performed the measurements on HsBR. T.S. analyzed the data, was responsible for methodology, software, data validation, and wrote the manuscript. R.S. provided the HsBR samples. K.H. supervised the project, and contributed to data interpretation and writing the manuscript. All authors have read and agreed to the published version of the manuscript.
Funding
The work was funded by the Free University Berlin, department of physics.
Institutional Review Board Statement
Not applicable.
Informed Consent Statement
Not applicable.
Data Availability Statement
The raw data supporting the conclusions of this article will be made available by the authors on request.
Acknowledgments
The authors thanks Yang Yang for their support with the sample preparation and beam alignment and Kirsten Hoffmann for their technical assistance.
Conflicts of Interest
The authors declare no conflicts of interest.
References
- Herbst, J.; Heyne, K.; Diller, R. Femtosecond Infrared Spectroscopy of Bacteriorodopsin Chromophore Isomerization. Science 2002, 297, 822–825. [Google Scholar] [CrossRef] [Scilit] [PubMed]
- Lorenz-Fonfria, V.A. Infrared Difference Spectroscopy of Proteins: From Bands to Bonds. Chem. Rev. 2020, 120, 3466–3576. [Google Scholar] [CrossRef] [Scilit]
- Lanyi, J.K.; Schobert, B. Crystallographic Structure of the Retinal and the Protein after Deprotonation of the Schiff Base: The Switch in the Bacteriorhodopsin Photocycle. J. Mol. Biol. 2002, 321, 727–737. [Google Scholar] [CrossRef] [Scilit]
- Burankova, T.; Hauß, T.; Ollivier, J.; Lechner, R.E.; Dencher, N.A.; Pieper, J. Functionally relevant protein dynamics monitored by time-resolved quasielastic neutron scattering. Biophys. J. 2026, 125, 2405–2415. [Google Scholar] [CrossRef] [Scilit]
- Smith, S.O.; Braiman, M.S.; Myers, A.B.; Pardoen, J.A.; Courtin, J.M.L.; Winkel, C.; Lugtenburg, J.; Mathies, R.A. Vibrational analysis of the all-trans-retinal chromophore in light-adapted bacteriorhodopsin. J. Am. Chem. Soc. 1987, 109, 3108–3125. [Google Scholar] [CrossRef] [Scilit]
- Mathies, R.A.; Brito Cruz, C.H.; Pollard, W.T.; Shank, C.V. Direct Observation of the Femtosecond Excited-State cis-trans Isomerization in Bacteriorhodopsin. Science 1998, 240, 777–779. [Google Scholar] [CrossRef] [Scilit] [PubMed]
- McCamant, D.W.; Kukura, P.; Mathies, R.A. Femtosecond Stimulated Raman Study of Excited-State Evolution in Bacteriorhodopsin. J. Phys. Chem. B 2005, 109, 10449–10457. [Google Scholar] [CrossRef] [Scilit]
- Schenkl, S.; Mourik, F.V.; Zwan, G.; Haacke, S.; Chergui, M. Probing the Ultrafast Charge Translocation of Photoexcited Retinal in Bacteriorhodopsin. Science 2005, 309, 917–920. [Google Scholar] [CrossRef] [Scilit]
- Kobayashi, T.; Yabushita, A. Dynamics of vibrational and electronic coherences in the electronic excited state studied in a negative-time range. Chem. Phys. Lett. 2009, 482, 143–147. [Google Scholar] [CrossRef] [Scilit]
- Wand, A.; Friedman, N.; Sheves, M.; Ruhman, S. Ultrafast Photochemistry of Light-Adapted and Dark-Adapted Bacteriorhodopsin: Effects of the Initial Retinal Configuration. J. Phys. Chem. B 2012, 116, 10444–10452. [Google Scholar] [CrossRef] [Scilit]
- Wand, A.; Gdor, I.; Zhu, J.; Sheves, M.; Ruhman, S. Shedding New Light on Retinal Protein Photochemistry. Annu. Rev. Phys. Chem. 2013, 64, 437–458. [Google Scholar] [CrossRef] [Scilit] [PubMed]
- Kraack, J.; Buckup, T.; Motzkus, M. Resonant Two-Photon Excitation Pathways During Retinal-Isomerization in Bacteriorhodopsin. EPJ Web Conf. 2013, 41, 07019. [Google Scholar] [CrossRef] [Scilit]
- Gross, R.; Wolf, M.M.N.; Schumann, C.; Friedman, N.; Sheves, M.; Li, L.; Engelhard, M.; Trentmann, O.; Neuhaus, H.E.; Diller, R. Primary Photoinduced Protein Response in Bacteriorhodopsin and Sensory Rhodopsin II. J. Am. Chem. Soc. 2009, 131, 14868–14878. [Google Scholar] [CrossRef] [Scilit] [PubMed]
- Bühl, E.; Eberhardt, P.; Bamann, C.; Bamberg, E.; Braun, M.; Wachtveitl, J. Ultrafast Protein Response in Channelrhodopsin-2 Studied by Time-Resolved Infrared Spectroscopy. J. Phys. Chem. Lett. 2018, 9, 7180–7184. [Google Scholar] [CrossRef] [Scilit]
- Stensitzki, T.; Adam, S.; Schlesinger, R.; Schapiro, I.; Heyne, K. Ultrafast Backbone Protonation in Channelrhodopsin-1 Captured by Polarization Resolved Fs Vis-pump—IR-Probe Spectroscopy and Computational Methods. Molecules 2020, 25, 848. [Google Scholar] [CrossRef] [Scilit] [PubMed]
- Orville, A.M. Recent results in time resolved serial femtosecond crystallography at XFELs. Curr. Opin. Struct. Biol. 2020, 65, 193–208. [Google Scholar] [CrossRef] [Scilit]
- Nogly, P.; Weinert, T.; James, D.; Carbajo, S.; Ozerov, D.; Furrer, A.; Gashi, D.; Borin, V.; Skopintsev, P.; Jaeger, K.; et al. Retinal isomerization in bacteriorhodopsin captured by a femtosecond x-ray laser. Science 2018, 361, eaat0094. [Google Scholar] [CrossRef] [Scilit]
- Kovacs, G.N.; Colletier, J.P.; Grünbein, M.L.; Yang, Y.; Stensitzki, T.; Batyuk, A.; Carbajo, S.; Doak, R.B.; Ehrenberg, D.; Foucar, L.; et al. Three-dimensional view of ultrafast dynamics in photoexcited bacteriorhodopsin. Nat. Commun. 2019, 10, 3177. [Google Scholar] [CrossRef] [Scilit]
- Florean, A.C.; Cardoza, D.; White, J.L.; Lanyi, J.K.; Sension, R.J.; Bucksbaum, P.H. Control of retinal isomerization in bacteriorhodopsin in the high-intensity regime. Proc. Natl. Acad. Sci. USA 2009, 106, 10896–10900. [Google Scholar] [CrossRef] [Scilit]
- Mizuno, M.; Shibata, M.; Yamada, J.; Kandori, H.; Mizutani, Y. Picosecond Time-Resolved Ultraviolet Resonance Raman Spectroscopy of Bacteriorhodopsin: Primary Protein Response to the Photoisomerization of Retinal. J. Phys. Chem. B 2009, 113, 12121–12128. [Google Scholar] [CrossRef] [Scilit]
- Kraack, J.P.; Buckup, T.; Motzkus, M. Evidence for the Two-State-Two-Mode model in retinal protonated Schiff-bases from pump degenerate four-wave-mixing experiments. Phys. Chem. Chem. Phys. 2012, 14, 13979. [Google Scholar] [CrossRef] [Scilit]
- Stensitzki, T.; Yang, Y.; Kozich, V.; Ahmed, A.A.; Kössl, F.; Kühn, O.; Heyne, K. Acceleration of a ground-state reaction by selective femtosecond-infrared-laser-pulse excitation. Nat. Chem. 2018, 10, 126–131. [Google Scholar] [CrossRef] [Scilit]
- Imhof, M.; Rhinow, D.; Hampp, N. Two-photon polarization data storage in bacteriorhodopsin films and its potential use in security applications. Appl. Phys. Lett. 2014, 104, 081921. [Google Scholar] [CrossRef] [Scilit]
- Liebel, M.; Kukura, P. Lack of evidence for phase-only control of retinal photoisomerization in the strict one-photon limit. Nat. Chem. 2017, 9, 45–49. [Google Scholar] [CrossRef] [Scilit]
- Robben, K.C.; Cheatum, C.M. Increasing Pump–Probe Signal toward Asymptotic Limits. J. Phys. Chem. B 2023, 127, 4694–4707. [Google Scholar] [CrossRef] [Scilit]
- Gross, R.; Schumann, C.; Wolf, M.M.N.; Herbst, J.; Diller, R.; Friedman, N.; Sheves, M. Ultrafast Protein Conformational Alterations in Bacteriorhodopsin and Its Locked Analogue BR5.12. J. Phys. Chem. B 2009, 113, 7851–7860. [Google Scholar] [CrossRef] [Scilit] [PubMed]
- Ogren, J.I.; Yi, A.; Mamaev, S.; Li, H.; Lugtenburg, J.; DeGrip, W.J.; Spudich, J.L.; Rothschild, K.J. Comparison of the Structural Changes Occurring during the Primary Phototransition of Two Different Channelrhodopsins from Chlamydomonas Algae. Biochemistry 2015, 54, 377–388. [Google Scholar] [CrossRef] [Scilit]
- Mei, G.; Mamaeva, N.; Ganapathy, S.; Wang, P.; DeGrip, W.J.; Rothschild, K.J. Raman spectroscopy of a near infrared absorbing proteorhodopsin: Similarities to the bacteriorhodopsin O photointermediate. PLoS ONE 2018, 13, e0209506. [Google Scholar] [CrossRef] [Scilit]
- Birge, R.R.; Zhang, C.-F. Two-photon double resonance spectroscopy of bacteriorhodopsin. Assignment of the electronic and dipolar properties of the low-lying -like and -like π π∗ states. J. Chem. Phys. 1990, 92, 7178–7195. [Google Scholar] [CrossRef] [Scilit]
- Rhinow, D.; Imhof, M.; Chizhik, I.; Baumann, R.-P.; Hampp, N. Structural Changes in Bacteriorhodopsin Caused by Two-Photon-Induced Photobleaching. J. Phys. Chem. B 2012, 116, 7455–7462. [Google Scholar] [CrossRef] [Scilit]
- Barth, A. Infrared spectroscopy of proteins. Biochim. Biophys. Acta (BBA) -Bioenerg. 2007, 1767, 1073–1101. [Google Scholar] [CrossRef] [Scilit]
- Wolpert, M.; Hellwig, P. Infrared spectra and molar absorption coefficients of the 20 alpha amino acids in aqueous solutions in the spectral range from 1800 to 500 cm−1. Spectrochim. Acta Part A Mol. Biomol. Spectrosc. 2006, 64, 987–1001. [Google Scholar] [CrossRef] [Scilit]
Disclaimer/Publisher’s Note: The statements, opinions and data contained in all publications are solely those of the individual author(s) and contributor(s) and not of MDPI and/or the editor(s). MDPI and/or the editor(s) disclaim responsibility for any injury to people or property resulting from any ideas, methods, instructions or products referred to in the content. |
© 2026 by the authors. Licensee MDPI, Basel, Switzerland. This article is an open access article distributed under the terms and conditions of the Creative Commons Attribution (CC BY) license.