


Abstract
Urban areas worldwide face significant pressure from population growth and urban expansion, resulting in habitat loss. Urban planners need to develop a comprehensive strategy for protecting, restoring and enhancing natural heritage (such as natural features and assets), at the municipal and regional levels. Here, we propose an approach to design a Natural Heritage System (NHS) that interconnects natural features and areas. This resulting NHS aims to guide and prioritize the protection, restoration, and enhancement of ecological areas and their functions. The NHS integrates terrestrial and aquatic ecosystem functions for conservation planning. We leverage the Marxan optimization tool to identify target areas using 36 ecological features. We compare three spatial scenarios: regional-scale, watershed-scale, and a hybrid approach. We found that the hybrid scenario proved to be the most effective, covering 52% of the jurisdiction. Then, we classified the target areas into three tiers of the NHS: (1) existing natural cover (23.4%), (2) potential natural cover (12.3%), and (3) contributing areas (16.3%). Contributing areas represent additional parts of the NHS within developed or partly developed landscapes to support overall NHS health and ecological function. These tiers allow for tailored management actions: protection of existing natural cover and restoration of potential natural cover. Altogether, the areas identified for the NHS by Marxan provide a strong, science-based framework to address urbanization impacts and support long-term implementation of biodiversity and urban sustainability solutions. It also provides enhancement opportunities through green infrastructure in contributing areas using nature-based solutions aiming to conserve biodiversity in urban areas.
1. Introduction
There is an urgent need to protect, restore, and expand natural cover in urban areas as land use changes continue to undermine biodiversity and ecosystem function [1,2,3]. Increasing population density is one potential solution to abating land use change and urban sprawl [4,5]. However, while the spatial impact or footprint is reduced, increasing density brings increasing intensity of potential stressors for ecosystems [6]. Solutions must then balance between development needs (e.g., increased housing demand) and their potential impacts on natural systems, which underscores the challenge of creating a sustainable urbanization process.
In urban areas, conversion refers to replacing natural cover with developed land for urban expansion [7]. Densification refers to increasing building intensity within existing land uses [8]. When these changes and/or densification occur in urban environments, consequent impacts follow. These impacts result in altered abiotic factors (e.g., nutrient runoff or pollution [9], increases in the urban heat island effect [10]). Biotic changes include the loss of habitat quantity and quality, and fragmentation that restricts species movement [11]. Sustainable urbanization remains a challenge, as both conversion and densification have detrimental effects on the natural environment. However, there may be urbanization methods that lessen the impact and promote natural processes, such as the movement of wildlife. Here, a Natural Heritage System (NHS) can be a key strategy that can address this challenge. Indeed, an NHS can help identify areas for protection and restoration, to conserve biodiversity and promote ecological functions. From a planning perspective, an NHS can identify areas for three key actions. These actions include protection based on existing natural cover, restoration opportunities in potential natural cover, and enhancement opportunities in urban land uses.
Urban green spaces are a crucial aspect of urban sustainability, as they are essential for mitigating the ecological impacts of widespread impervious surfaces and urban land uses. Developed parts of cities are primarily composed of impervious land cover. A continuous network of vital green infrastructure, including parks, street trees, and naturalized ponds, is maintained even within heavily urbanized areas. This green infrastructure serves a vital ecological function by counteracting the effects of land conversion. Specifically, green infrastructure absorbs rainwater, reducing surface runoff and preventing flooding [12], as well as providing support to urban biodiversity [13]. These spaces also filter pollutants [14], improve air quality [15], and contribute to the mitigation of the urban heat island effect [16,17]. In doing so, they provide a direct counterbalance to the negative impacts of dense development and extensively built surfaces.
Natural cover mapping is essential for understanding ecological impacts in the urban environment. Mapping includes key landscape features such as wetlands, riparian areas, and forests [18,19]. Here, the landscape could be defined by the various interacting ecosystems and human-modified land uses [20]. This spatial perspective is essential to assess the effects of habitat loss and fragmentation. Habitat loss is characterized by a reduction in the overall area of specific natural habitat types [21]. Habitat fragmentation refers to when habitat is divided into smaller and isolated fragments surrounded by a human-transformed land cover [22]. Ecological function based on functional connectivity is therefore a key consideration for land use change due to habitat loss and fragmentation. The amount and configuration of habitat can have detrimental impacts on the movement and subsequent population dynamics of a species [23,24]. Maintaining functional connectivity in terms of the amount and configuration of habitat for species within the urban landscape increases the amount of habitat available for species [25]. It is a challenge to consider long-range species movement and their important corridors in order to carry out conservation practices across the urban landscape. Incorporating functional connectivity into the approach would ensure proactive conservation to maintain ecological corridor planning that anticipates urban development and proposes mitigation [26]. Hence, characterizing connectivity and the value of habitat patches within the landscape is crucial for informing strategic plans for Natural Heritage Systems.
Conventional efforts in this space have often been guided by policy-based frameworks, such as Provincial Policy Statements and municipal Official Plans that are used in Ontario, Canada. These plans are crucial for establishing regulatory boundaries and guiding land use, but they can result in a disconnect between policy and ecology. An NHS policy in Ontario outlines the protection and enhancement of biodiversity and ecological functions [27,28]. These policies may inform land use planning and natural areas management as defined in Ontario’s Provincial Policy Statement [27,28]. For instance, a policy-based NHS may be a collection of legally protected areas, but it may not be an ecologically functional network. There can be a spatial mismatch between areas designated by policy and those with high ecological function, such as critical corridors for species movement or groundwater recharge areas. A system designed with only policy-based frameworks may fail to create the interconnected, resilient network necessary for long-term ecological health. This failure underscores the need for a new planning framework that is scientifically derived, data-driven, as well as designed to optimize ecological function, and not only policy. This scientifically derived framework is essential to align with ambitious global targets. Initiatives such as Nature Needs Half advocate for protecting at least 50% of the planet in the face of biodiversity and habitat loss [29].
The GTA is an ideal location due to the urban pressures the region is facing as well as the provincial policies in place [30]. By 2046, the Greater Toronto Area (GTA), comprising multiple municipalities, is expected to increase its population from 7.4 million in 2024 to 10.5 million (a 41% increase [31]). Balancing urban growth and economic development with environmental protection is necessary. Given the region’s population projections and planned development, sustainable development using a science-based, solutions-oriented approach can help to mitigate risks and protect natural features.
The study aims to develop a scientifical methodology to develop an actionable NHS that can maintain natural areas and biodiversity in urbanized areas. To optimize which areas should be prioritized for the target NHS, we use the Marxan algorithm and compare three scenarios (regional scale, watershed scale, and hybrid scale). Then, we classify the areas using a three-tier approach as either existing natural cover (protect), potential natural cover (restore), and contributing areas (enhance). This process will help maintain natural areas and their spatial configuration, which are essential for providing important ecosystem services that support human well-being and biodiversity in urban environments.
2. Methods
2.1. Study Area
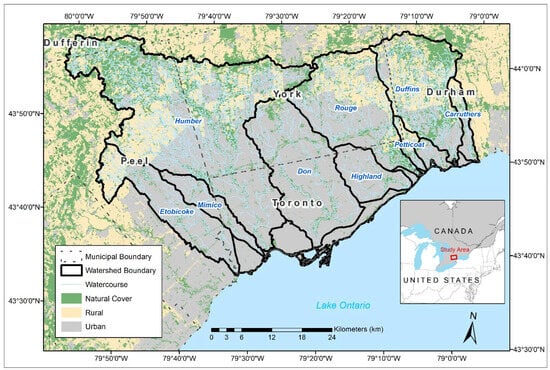
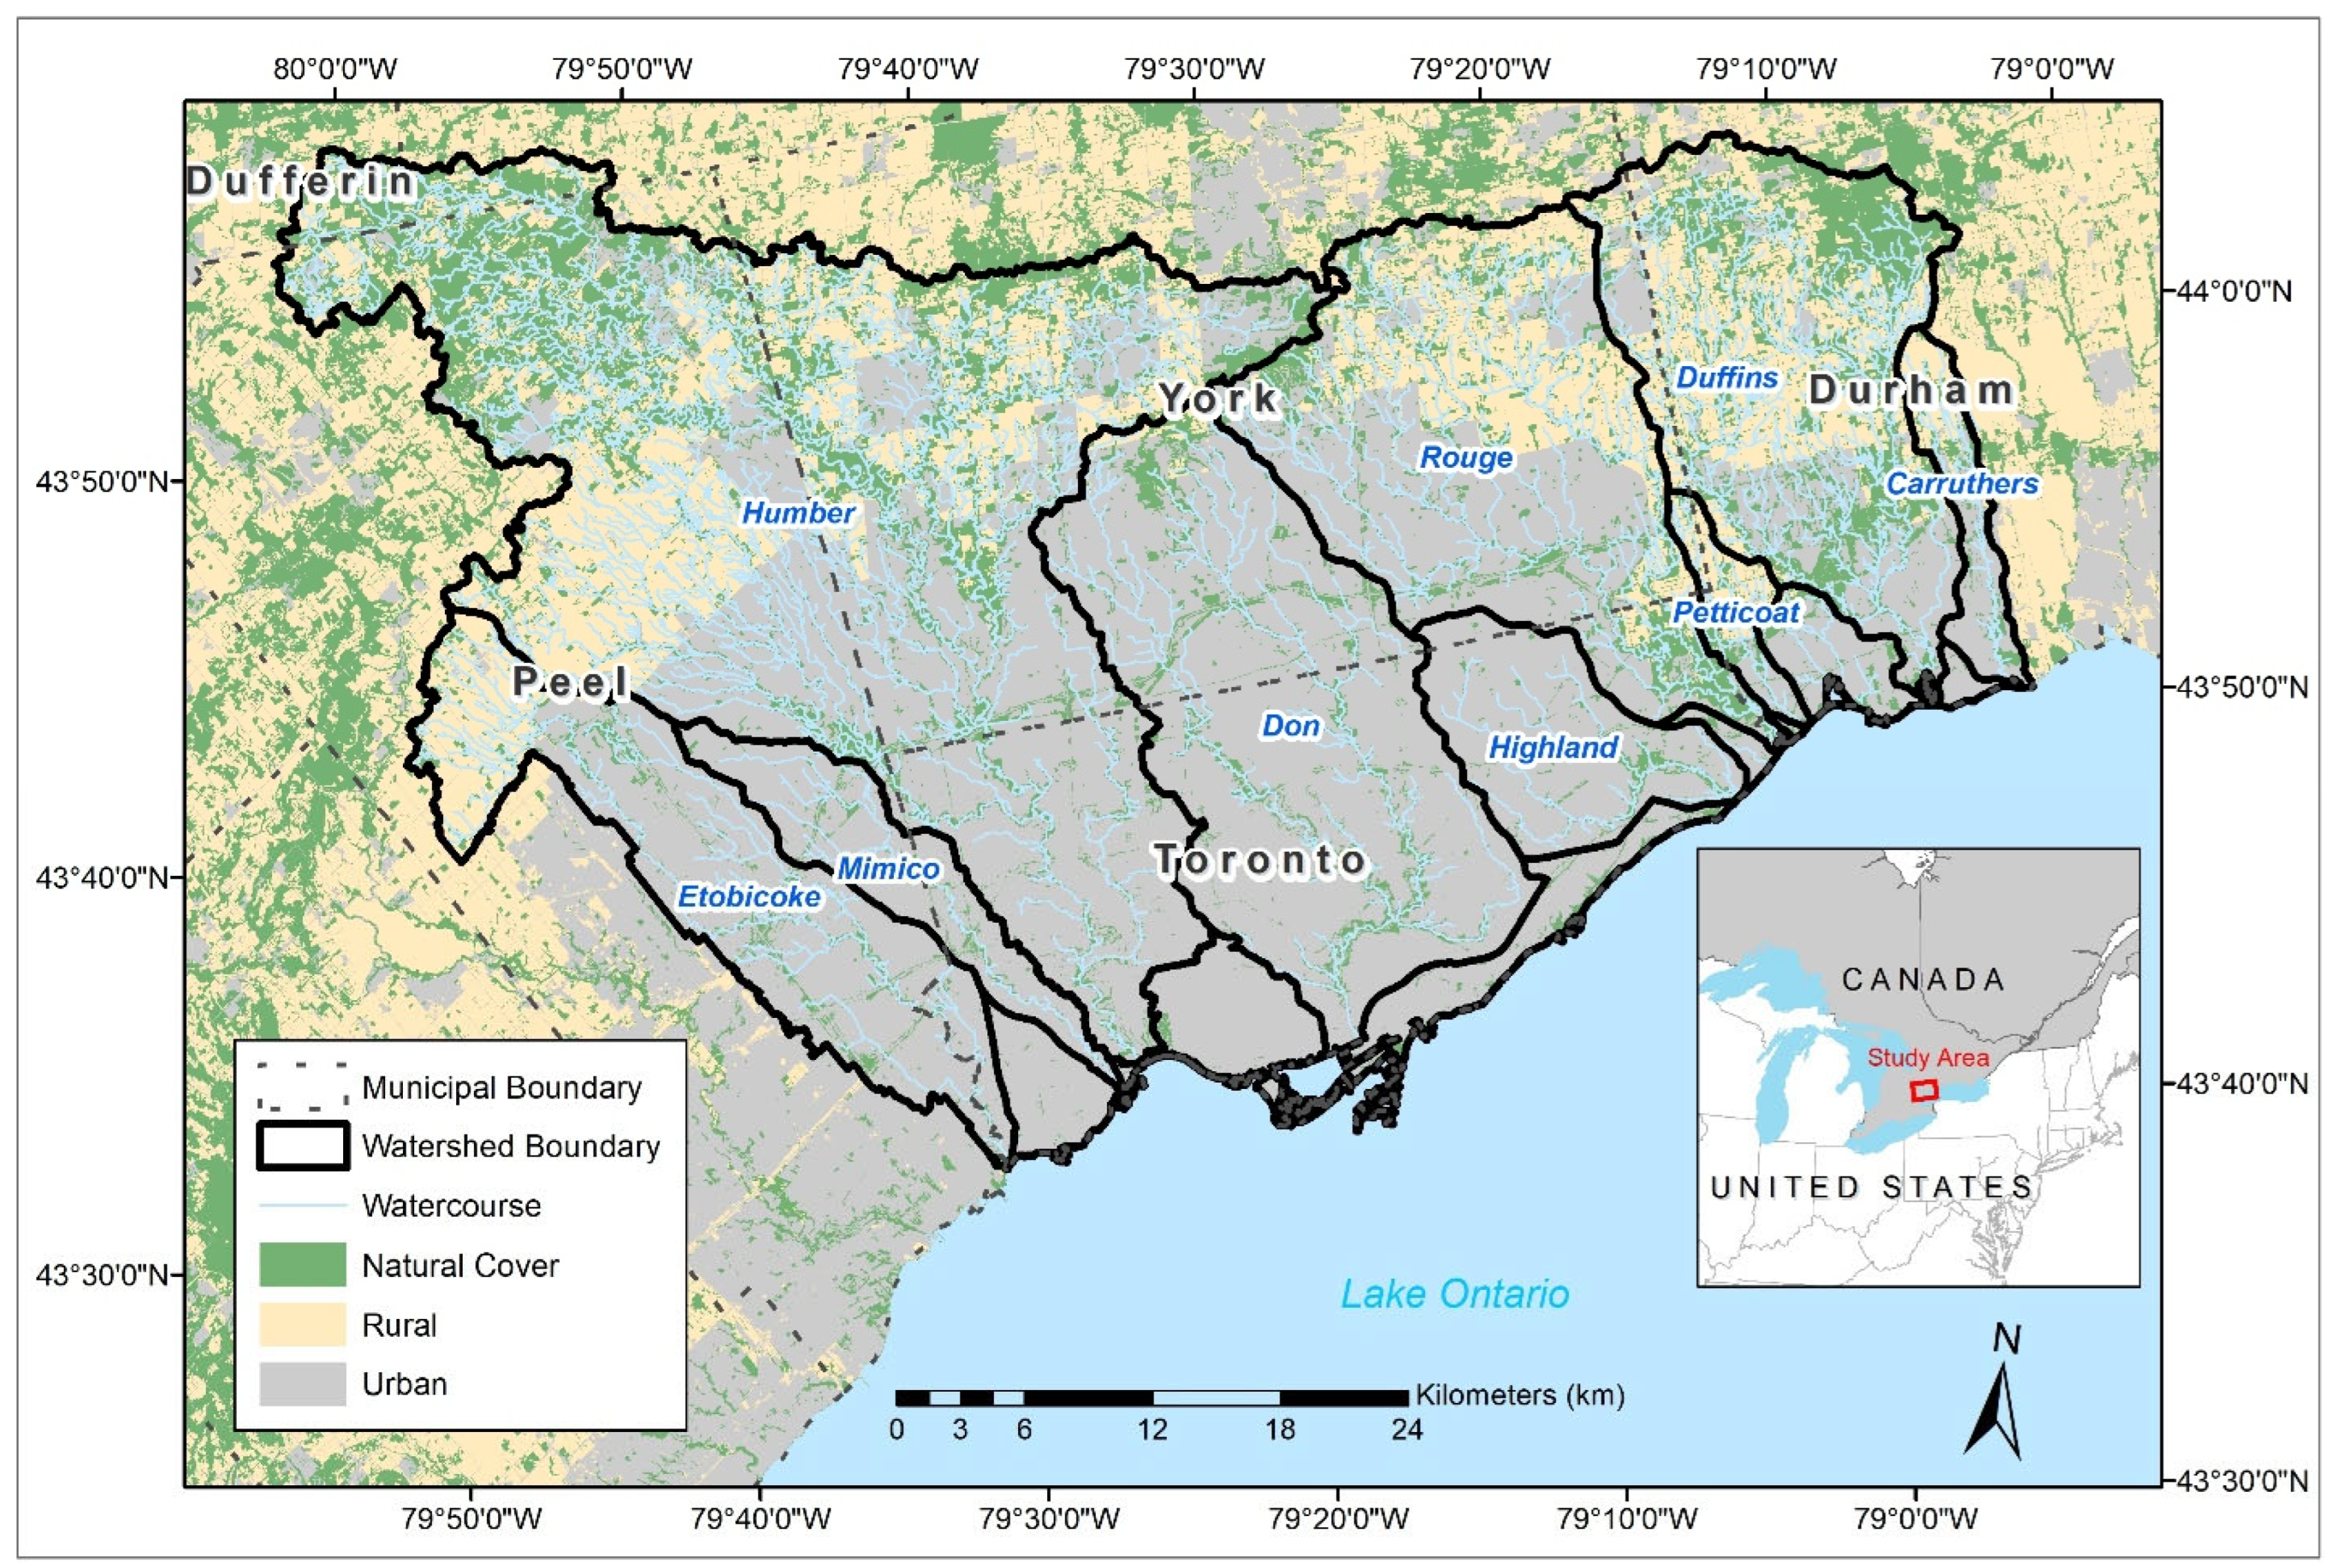
The study area comprises nine watersheds and the remaining area of the waterfront under Toronto and Region Conservation Authority’s (TRCA) jurisdiction in the Toronto region (ON, Canada). These watersheds include Etobicoke Creek, Mimico Creek, Humber River, Don River, Highland Creek, Rouge River, Petticoat Creek, Duffins Creek, and Carruthers Creek (Figure 1). These watersheds overlap most of the Greater Toronto Area, including the municipalities of the City of Toronto, the Durham Region, the Peel Region, the York Region, the Township of Adjala-Tosorontio and Mono. The total study area consists of developed/urban and agricultural lands, as well as remnant natural cover (e.g., forest, meadows, wetlands) that cover 2487 km2 (248,689 hectares). Etobicoke Creek, Mimico Creek, Don River, and Highland Creek watersheds along with the waterfront are primarily urban (Table S1). In contrast, the remaining watersheds are less than 50% urban, but notably Humber River and Duffins Creek watersheds have the highest amount of natural cover (Table S1). A network of natural areas and living green infrastructure are found throughout highly urbanized zones. Impervious land cover constitutes the primary surface in the developed parts of the study area, including roads, as well as residential and industrial land uses. In contrast, specific areas contain more abundant green infrastructure such as older and established neighborhoods with high urban forest canopy. A defining feature of the GTA is its extensive ravine system, which serves as the backbone of the green space network. Predominantly composed of forests, the ravines act as vital wildlife corridors, supporting the majority of the region’s wildlife [26]. In addition, a significant portion also supports plant species, including many sensitive and at-risk species [32]. The region is defined by distinct policy boundaries, including the Greenbelt. The Greenbelt is a protected area of green space, farmland, and forests mainly located in the north. The Whitebelt, which is a transitional area between the Greenbelt and urban zones, is subject to development pressure [33]. Based on these characteristics of the region, the study area was divided into a total of 249,850 planning units for the reserve selection process.
Figure 1.
Study area with the nine watersheds and land use within Toronto and Region Conservation Authority’s (TRCA) jurisdiction. The remaining area of the jurisdiction is the waterfront.
2.2. Selection of Natural Areas
The reserve selection process to determine the target Natural Heritage System was based on ecological and natural heritage features. This process aligns with the Natural Heritage Reference Manual [34] using the software Marxan version 2.01 [35]. The Marxan optimization tool systematically designs reserve (hereafter natural areas) systems through spatial analysis [35]. It achieves targeted conservation goals, such as ecological representation, using combinations of planning units (e.g., one-hectare hexagons) and a set of predefined criteria. The jurisdiction was divided into 1 ha hexagonal planning units in Marxan, resulting in a total of 249,850 planning units.
Data compilation for Marxan input was conducted using ArcGIS version 10.7.1 [36]. Individual targets were then set for each criterion. Marxan identifies combinations of planning units that meet these targets while minimizing overall cost. Locked-in criteria are first included in the selection process and then the optimization accounts for the remaining criteria in the solution. A Boundary Length Modifier (BLM) setting of 2 was used to control the spatial compactness of solutions. To promote a cohesive system that facilitates connectivity, this BLM value reduced the isolated planning units in the optimal solution. For each Marxan run, the number of repetitions was set to 100. The final Marxan output identifies the specific planning units selected as the optimized conservation solution.
2.3. Criteria for the Selection of Natural Areas
In total, 36 criteria were used in the Marxan analysis (Table 1). Criteria for the reserve selection process were based on Ontario’s Provincial Policy Statement (2020) [37]. NHS is defined by natural heritage features that are needed to support biodiversity, natural functions and terrestrial and aquatic ecosystems. The Natural Heritage Reference Manual [34] and Provincial Policy Statement [37] defined natural heritage features including wetlands, wildlife habitat, woodlands, and valleylands. These features hold environmental and social values as remnants of the region’s original natural landscapes. These eight criteria defined the locked-in criteria, where the value was assigned such that significant natural features are automatically included in the final scenario solution (Table 1).
Table 1.
The 36 criteria used in the Marxan analysis for selecting the Natural Heritage System (NHS). Numbers in parentheses indicate the total count of criteria included within each specific category or type.
The remaining planning units used 27 ecological function-based criteria, in addition to the municipal Natural Heritage Systems (Table 1). Ecological criteria were based on terrestrial and aquatic ecosystem features that would indicate planning units that were valuable to conservation efforts. Terrestrial features were based on habitat suitability, connectivity, biodiversity, and natural cover (Table 1). Aquatic ecological criteria focused on habitat suitability, Ecologically Significant Groundwater Recharge Areas (ESGRAs), and percentage of riparian natural cover and forest cover at the 125-hectare reach contributing area (RCA) level (Table 1). Municipal Natural Heritage Systems were included as a criterion, as they may add development protection. Consequently, these municipal natural heritage planning units are not guaranteed to be protected nor locked in for Marxan analysis.
2.4. Data Analysis
For the 249,850 one-hectare hexagonal planning units, we used spatial data of the 36 criteria (Table 1) to summarize each planning unit for the Marxan analysis. The criteria were grouped by aquatic and terrestrial features with equal weight selected between the categories (Table 1). If criteria were continuous values, they were standardized to a value between 0 and 100 (Table S3). If criteria were based on presence/absence values, they were given a value of 0 for absence and 100 for presence. Since locked-in values are included by default, these criteria are given a value of 100 when present.
2.5. Scenario Assessment
The spatial extent determines the priorities that are selected from the Marxan analyses and three scenarios were assessed to account for the systems approach at three scales: (1) regional, (2) watershed, and (3) regional–watershed hybrid. The regional-scale scenario represents the extent of TRCA’s jurisdiction and would result in regional priorities from the Marxan solution. The watershed-scale scenario represents watershed priorities for each watershed and mosaiced together. The regional–watershed hybrid scenario consists of the regional and watershed-scale scenarios to represent the overall priorities at both the regional and watershed scales. A sensitivity analysis selecting three percentages of natural areas (here 30, 40, and 50%) was performed for the regional and watershed scales. Therefore, the hybrid scenario would cover the importance of natural heritage features in both urban and natural areas of the jurisdiction. To create the target system from the hybrid scenario, it would encompass the overall footprint of the regional and watershed-scale scenarios after determining the ideal target percentages, which were 40–50% of the landscape selected in the Marxan solutions to align with initiatives such as Nature Needs Half [29]. This resulted in one hybrid scenario that assessed a combination of 40% regional and 40% watershed, and a second hybrid scenario of 50% regional and 40% watershed.
2.6. Tiered-Target System Classification
From the optimal scenario chosen and its final Marxan solution, the solution footprint was separated into a three-tier system of the NHS with management actions of protect, restore, and enhance. Rather than dividing the management actions as protect or not protect, we designated actionable strategies that could vary according to the different types of land cover within the NHS as well as revisiting the aquatic or terrestrial criteria driving the selection of planning units, therefore providing a flexible approach to conservation to the complex environment of the region ranging from natural, rural, and urban land cover.
The three tiers of the NHS are classified by existing natural cover (protect), potential natural cover (restore), and contributing areas (enhance). This classification was directly tied to the type of built/unbuilt land uses (Table S4), and the ecological function criteria used in the analysis from the footprint of the optimal scenario. In the first tier, existing natural cover represents the natural cover identified in TRCA’s 2017 natural cover layer of the Marxan solution designated for protection. These are the core areas of the NHS that currently exist with natural cover, encompassing prioritized natural spaces, and are designated for protection. In the second tier, potential natural cover represents areas within the planning units identified by the Marxan solution that are crucial for achieving ecological function through restoration. These are areas that require restoration and are identified based on their potential to enhance terrestrial ecological features, such as habitat suitability and connectivity within agricultural fields or open spaces in urban areas. Lastly, the third tier represents the remaining areas within the Marxan solution from the analysis designated for enhancement. These areas are selected based on their influence on aquatic ecological features, particularly the reach contributing areas (RCAs) for streams and wetlands. These areas could apply green infrastructure and low-impact development that would improve ecological function within the urban landscape.
3. Results
3.1. Scenario Assessment
A sensitivity analysis of three NHS targets (30%, 40%, and 50%) was performed for the regional and watershed-scale scenarios to evaluate their effectiveness. Each subsequent scenario added more area to the footprint of the previous solution as the target increased. At the 30% target, the regional solution could select only 26% of the jurisdiction-scale, while the watershed-scale solution selected was 28% (Table 2). At the 40% target, the regional solution accounted for 35% of the jurisdiction, and the watershed-scale solution accounted for 37% (Table 2). At the 50% target, these numbers increased to 45% and 47%, respectively (Table 2).
Table 2.
Summary of the percentage of the jurisdiction selected under each scenario at varying targets.
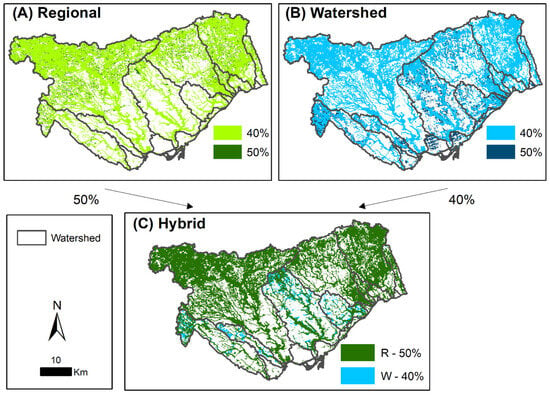
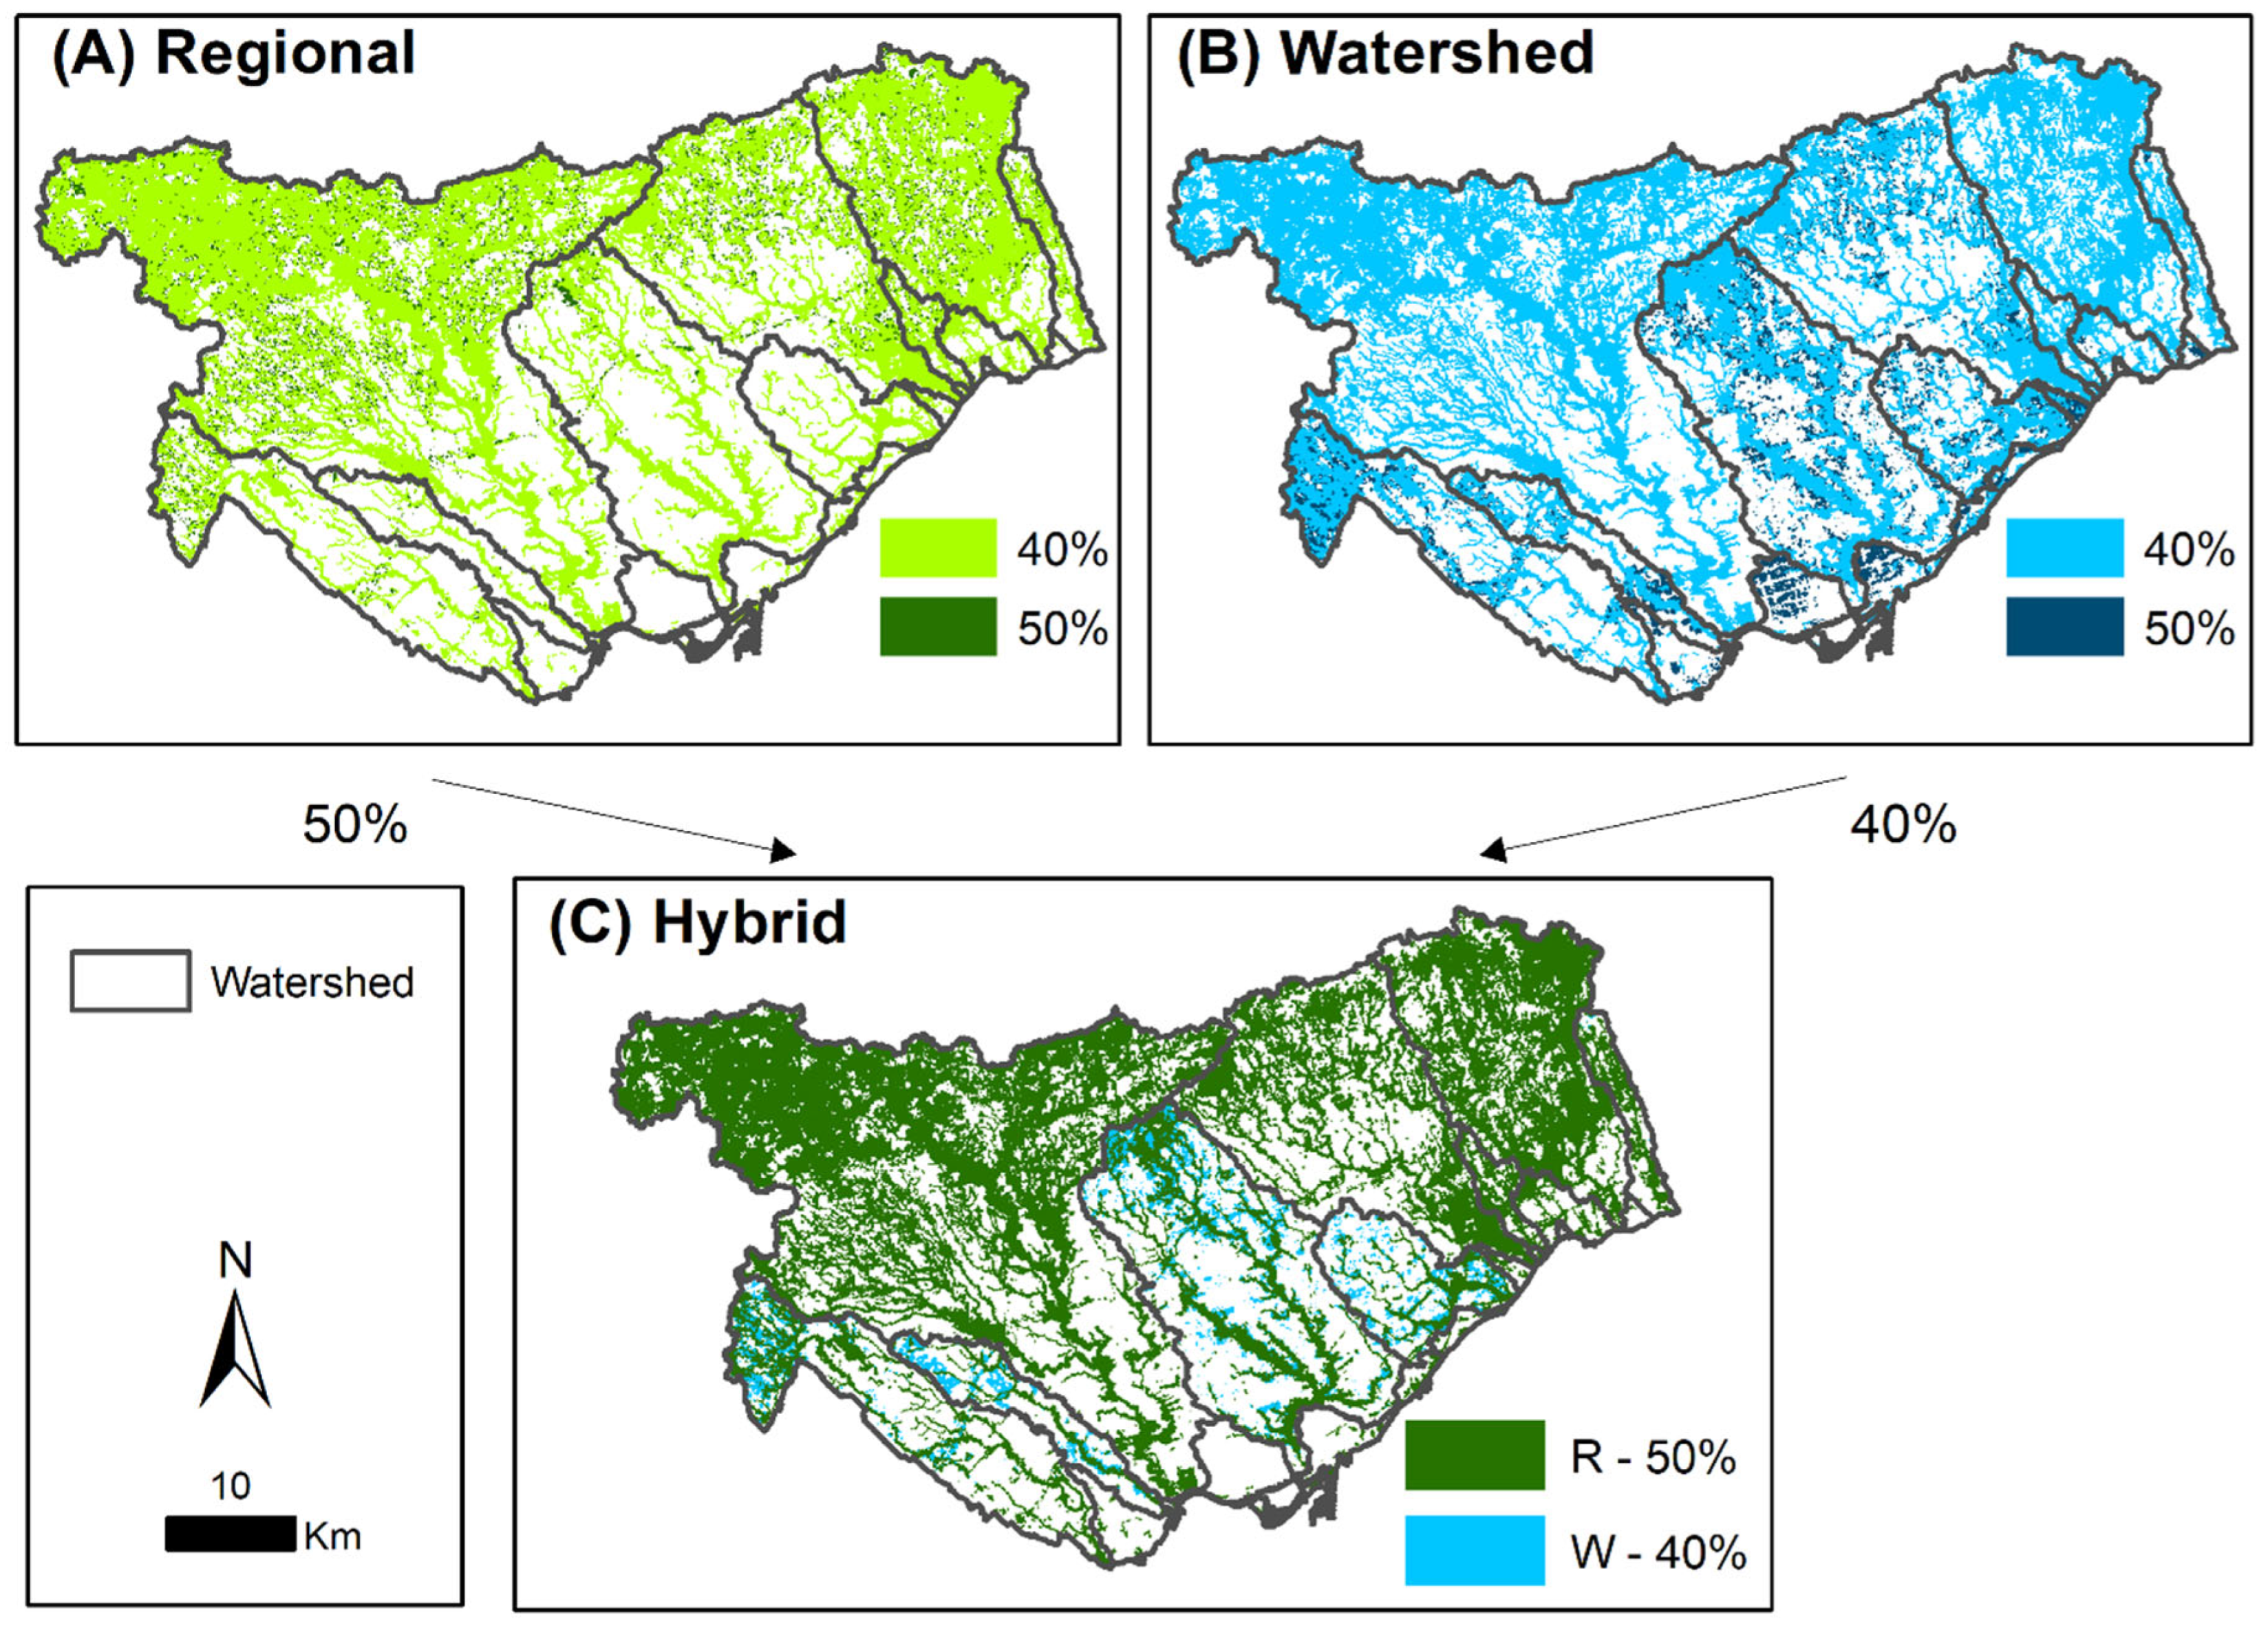
The spatial differences between the regional and watershed-scale solutions were markedly different, and these patterns influenced the hybrid model (Figure 2). The regional scenario focused on maximizing conservation targets across the entire TRCA jurisdiction. This scenario led to a solution that concentrated on the most intact, high-quality natural areas, primarily in the less developed northwest (Humber) and northeast (Duffins) parts of the region (Figure 2A). This regional concentration ensures the protection of these areas with the highest ecological function in the region.
Figure 2.
Comparison of Marxan solutions for (A) regional scale, (B) watershed scale, and (C) the regional–watershed hybrid approach. In panel (C), ‘R’ represents the regional level and ‘W’ represents the watershed level.
In contrast, the watershed-scale scenario was designed to prioritize conservation within each of the nine individual watersheds. This approach resulted in a more distributed solution. Conservation efforts were optimized to address the specific needs of urban watersheds such as Etobicoke Creek, Mimico Creek, Don River, and Highland Creek (Figure 2B). Natural cover is sparse and especially as the target increases from 40% to 50%. At the watershed scale, these scenarios ensure that the conservation efforts are maintained and prioritized within these highly fragmented urban watersheds.
The hybrid scenario was a combination of both the regional- and watershed-level approaches. This approach was designed to resolve the inherent trade-off between protecting large, pristine areas and enhancing fragmented urban ones. There were more additions at the watershed level in urban watersheds (Figure 2C). This combination outperformed either scenario individually by selecting 48% of the jurisdiction at a combined target (regional and watershed) at 40% (Table 2). By increasing the regional target to 50% while maintaining the watershed target at 40%, the hybrid scenario achieved a total coverage of 52% of the jurisdiction (Table 2). The hybrid scenario achieved a balance between regional ecological function and urban watershed priorities.
A breakdown of the hybrid scenarios to indicate their overlap between the regional and watershed levels further elucidated the influence of these models. For the 48% total coverage, the regional level comprised 40% and the watershed level comprised 40%, while at the hybrid level, 44% of the area was shared between the regional and watershed solutions, with 0% uniqueness at the regional scale and 4% uniqueness at the watershed scale (Table 2). To further break down the unique locations of the watershed level, these were in the urban watersheds of the Etobicoke Creek, Mimico Creek, Don River, and Highland Creek (Table S2). Similarly, of the 52% total coverage from the regional level (50%) and watershed level (40%), the hybrid level comprised 45% shared area, with 4% uniqueness at the regional level, and 3% uniqueness at the watershed level (Table 2). To further break down the unique locations at the regional and watershed level, these were concentrated in the Humber River, Rouge River, and Duffins Creek watersheds with the most natural areas for the regional level, and for the watershed level, there was uniqueness in the urban watersheds of Etobicoke Creek, Mimico Creek, Don River, and Highland Creek (Figure 2, Table S2). The unique 4% selected by the regional scenario focuses on expanding large core habitats, whereas the 3% selected by the watershed scenario supports additional urban habitats.
3.2. Tiered-Target System Classification
The optimal Marxan solution (hybrid scenario of regional—50% and watershed—40%) was classified into a three-tiered system to provide a practical framework for management. The tiered management approach provides a clear framework that translates the optimization results into differentiated management actions.
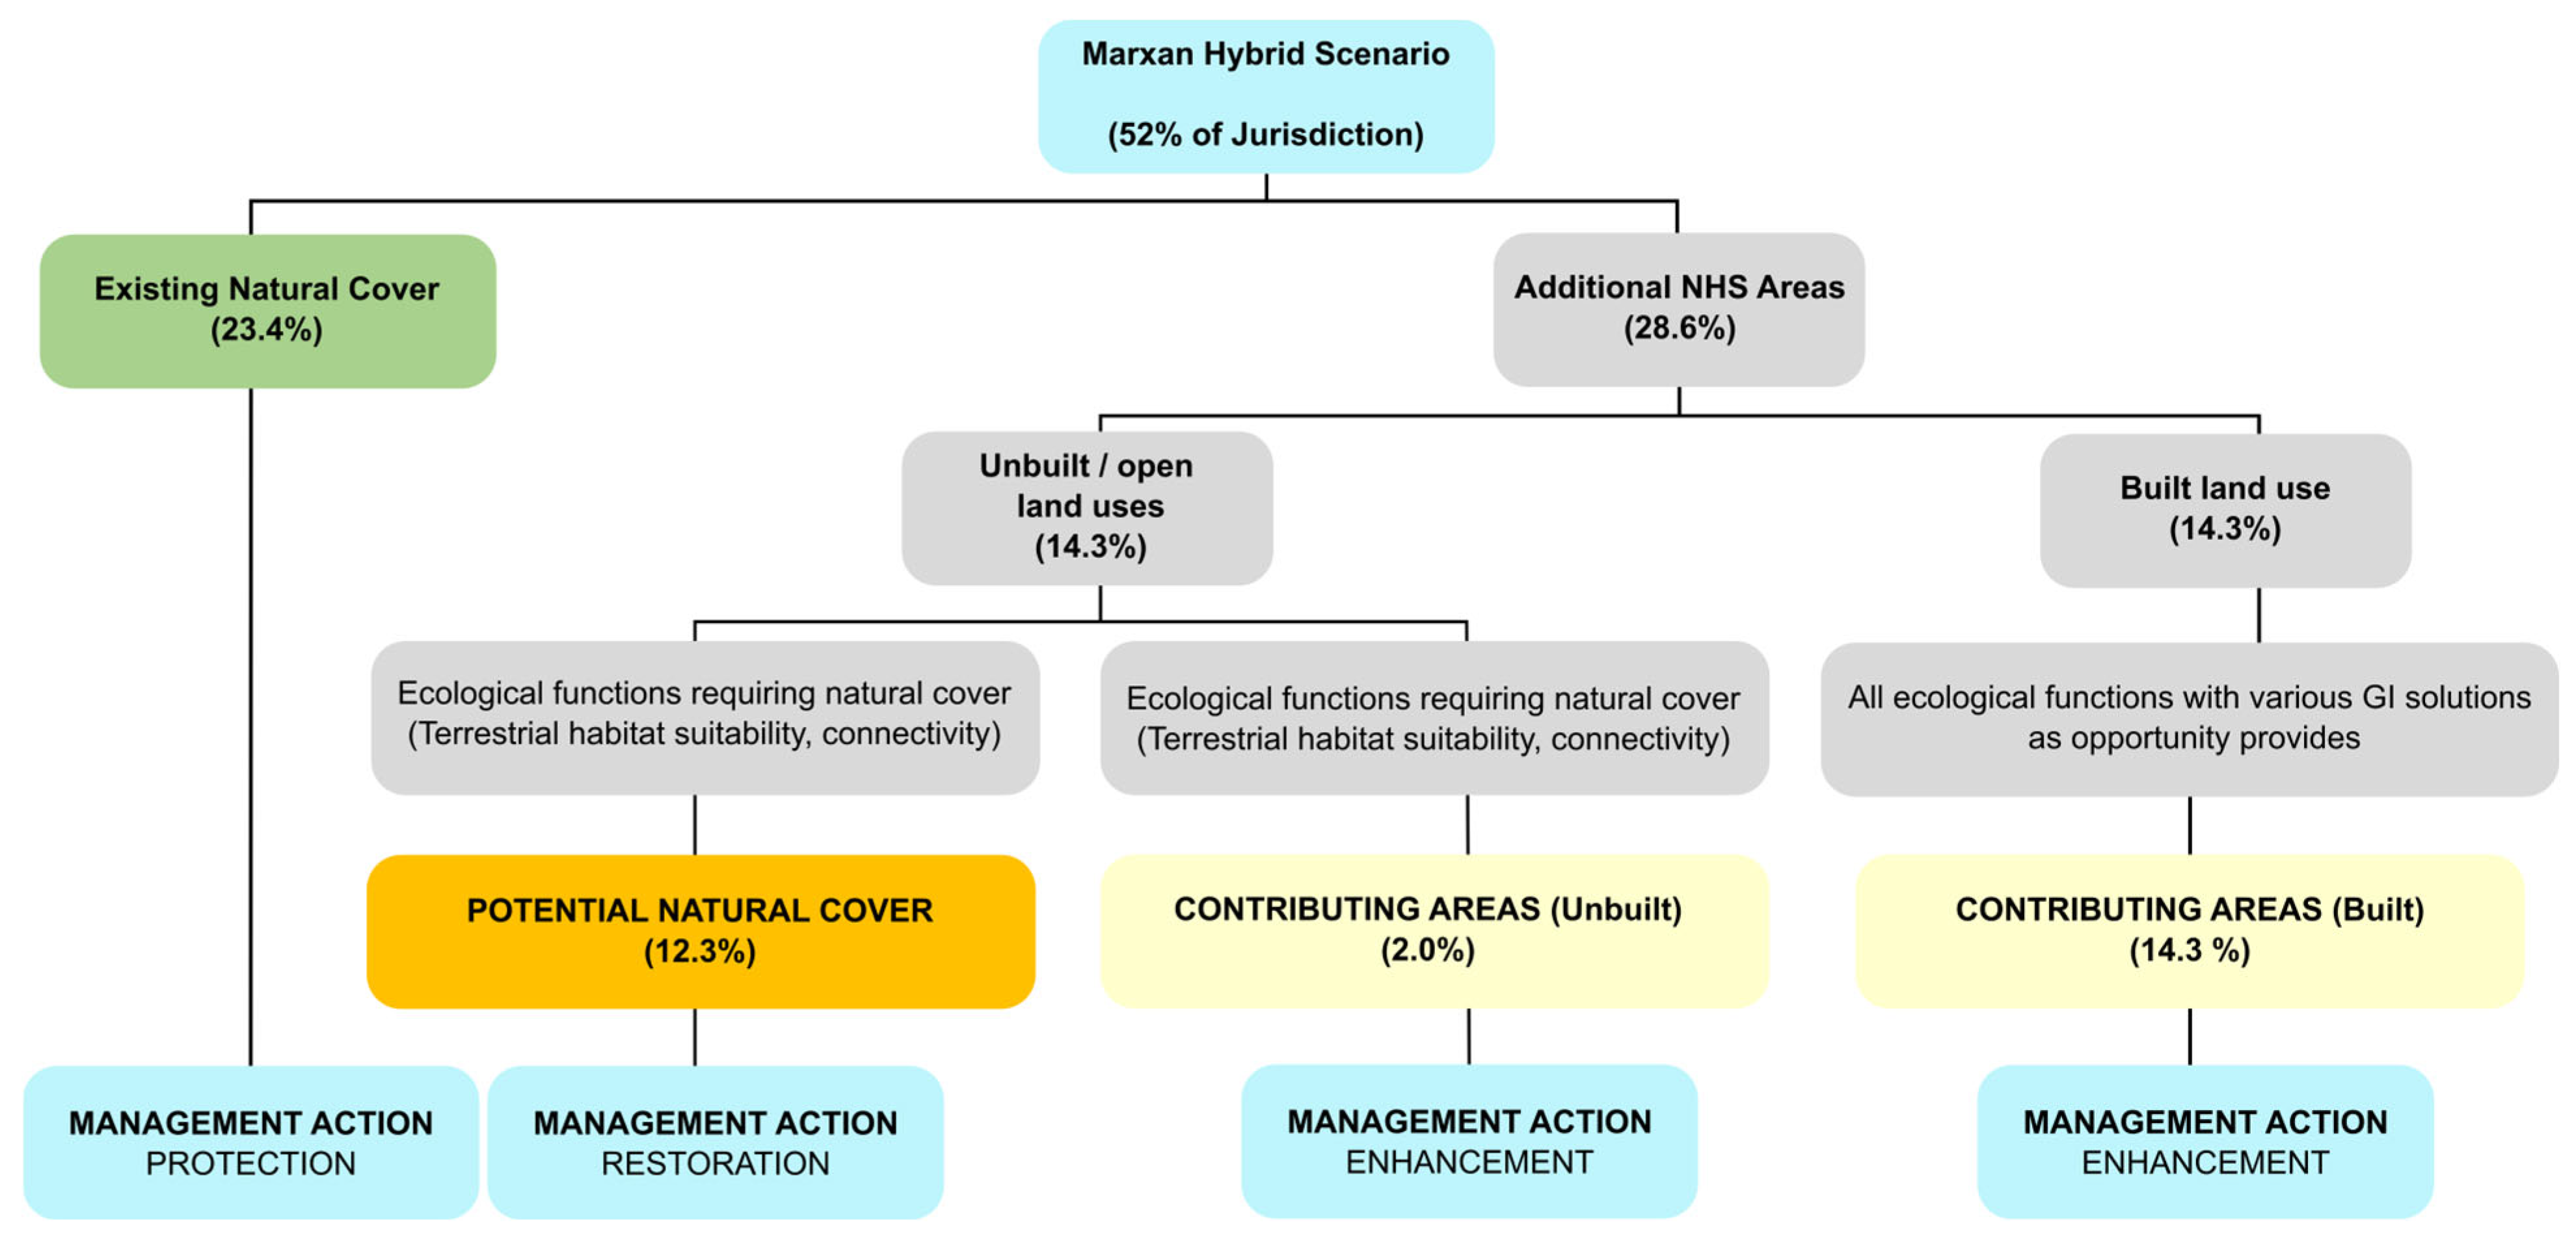
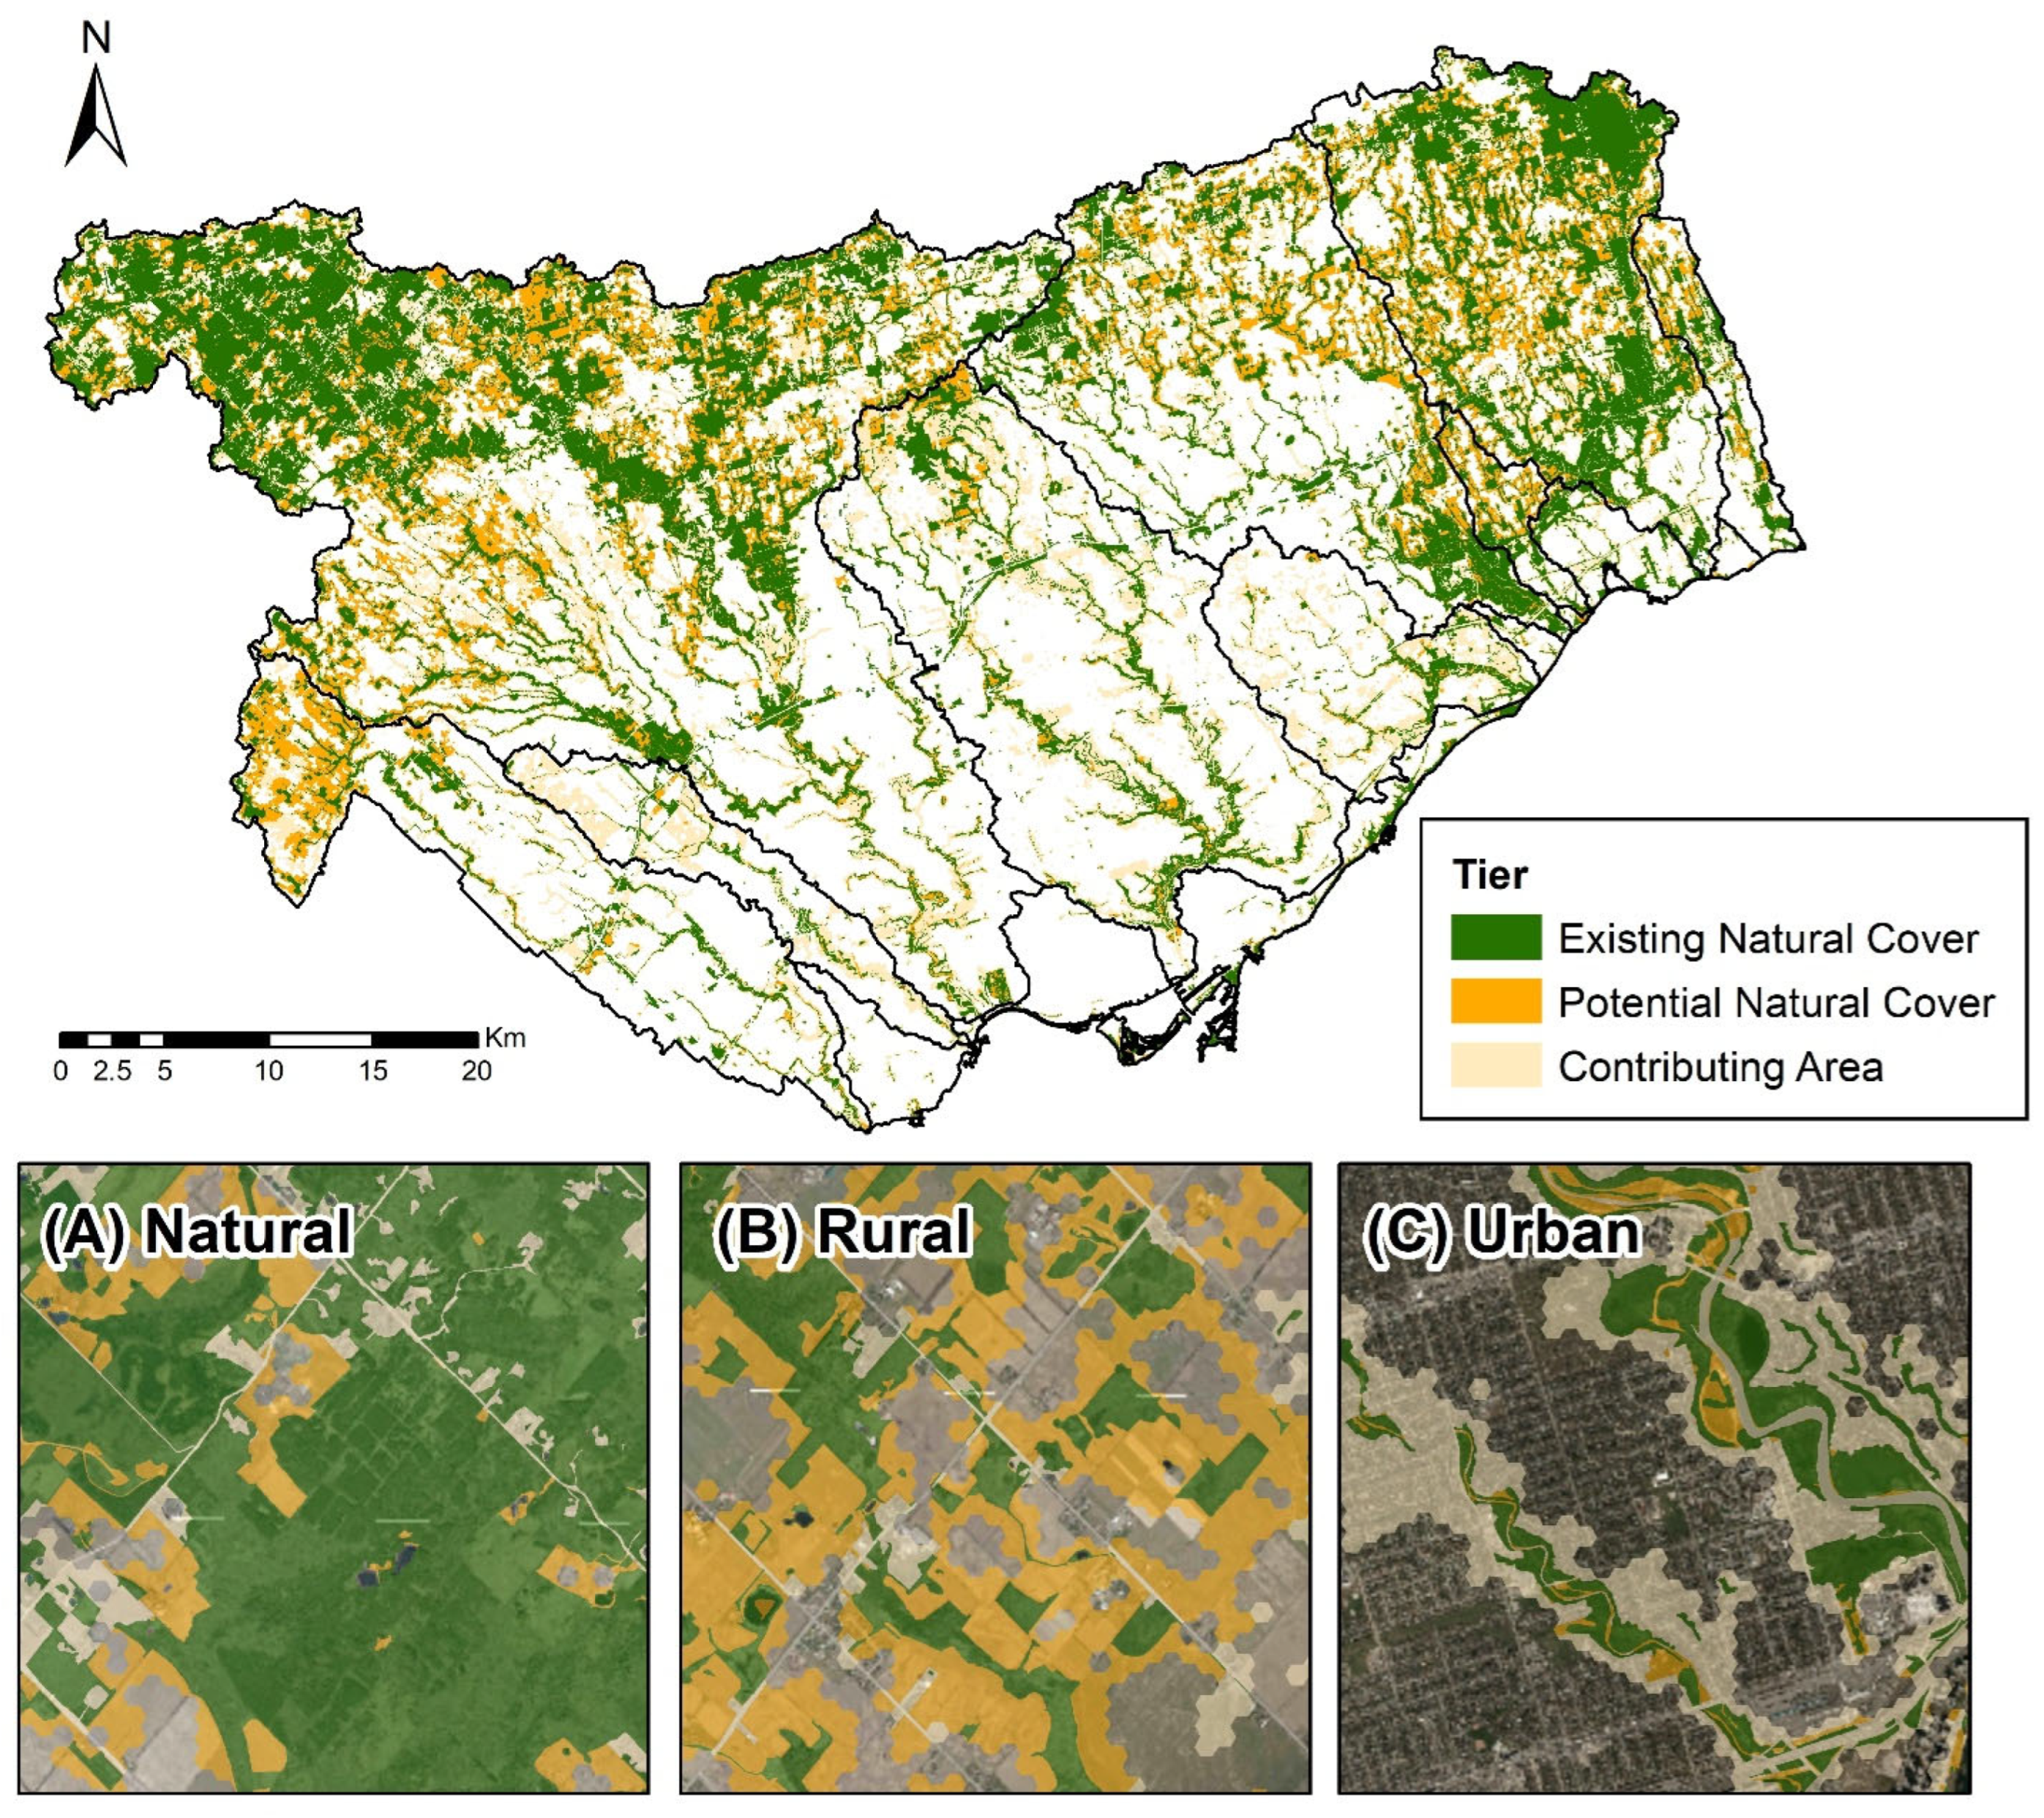
The first tier, existing natural cover, comprised solutions that are within the 2017 TRCA natural cover layer, comprising 23.4% of the jurisdiction (Figure 3). This 23.4% forms the backbone of the NHS, comprising the region’s most ecologically functioning core areas (Figure 4). These were the core areas of the NHS, encompassing natural cover and designated for protection.
Figure 3.
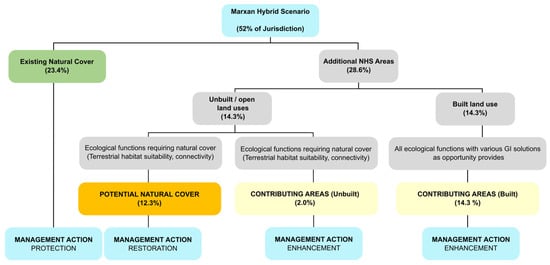
Tiered classification of the target Natural Heritage System (NHS) into the existing natural cover, potential cover, and contributing areas.
Figure 4.
Target Natural Heritage System (NHS) with the existing natural cover, potential natural cover, and contributing areas. Panels are examples of the target NHS in (A) natural, (B) rural, and (C) urban areas overlaid on orthophoto imagery [49].
The second tier, potential natural cover, consisted of planning units identified by the Marxan solution that are ideal for achieving ecological functionality and encompasses 12.3% of the jurisdiction (Figure 3). These are areas that require restoration on unbuilt/open space land uses and are identified based on their potential to enhance terrestrial ecological features, such as habitat suitability and connectivity. These areas were also determined by land use types that may suggest conventional restoration opportunities, such as agriculture or recreational/open spaces. The 12.3% potential natural cover is located on unbuilt/open space land uses, which simplifies restoration feasibility while in close proximity or adjacent to existing natural cover.
Finally, the third tier, contributing areas, represented the remaining solutions from the analysis and comprised 16.3% of the jurisdiction (Figure 3). These areas were selected based on their influence on aquatic ecological features, particularly the reach contributing areas (RCAs) for streams and wetlands. These areas are designated for enhancement through green infrastructure and other interventions that improve ecological function within the broader urban matrix. The 16.3% contributing areas are crucial for identifying the remaining areas of the limited urban landscape to help mitigate urban impacts.
4. Discussion
The effectiveness of the systematic, data-driven approach is a key result of this approach. The Marxan optimization tool integrates multiple criteria to evaluate all planning unit combinations strategically. This process allowed for a greater and more strategic area to be included in the NHS than would have been possible with a rule-based approach. This methodology provides several benefits for addressing complex urban conservation challenges. Unlike ad hoc or qualitative methods, a systematic approach makes the costs and benefits of different conservation scenarios clear, leading to more informed and robust decision-making [28,50]. Also, by including a science-based framework, it provides a transparent, repeatable, and defensible foundation for making decisions [51]. This repeatable methodology can provide a framework for other rapidly urbanizing regions globally.
This NHS approach represents a novel and fundamental shift in conservation strategy, moving beyond the goal of protecting ecological remnants to actively re-integrating ecological function into the human-dominated landscape. This strategy acknowledges that conserving the few remaining high-quality natural spaces is insufficient for long-term resilience, particularly with the combined effects of climate change and urbanization. The inclusion of the contributing areas tier is a direct response to this limitation. It recognizes that built-up areas, through strategic implementation like green infrastructure and low-impact development, can maintain important functions. These functions include stormwater management [52], urban heat island mitigation [16,17], and water quality improvement [53]. This demonstrates an understanding that a successful urban Natural Heritage System should be a hybrid of natural features and nature-based solutions.
While the NHS provides a robust framework, the research also highlighted several limitations and challenges. For instance, achieving high representation targets remains difficult in highly urbanized areas, such as the waterfront, where natural cover is sparse and locked-in criteria are limited. The analysis also noted diminishing returns for exceedingly high conservation targets, indicating that there is an optimal balance to be found between the proportion of representation and the resulting coverage of the jurisdiction. This is particularly evident in highly urbanized areas where sparse natural cover and a lack of additional criteria act as a practical limit on the total area that can be selected for the NHS. Another key limitation is that policy-based decisions, such as those that guide a municipal NHS, may not always optimally maintain ecological function, especially when a spatial mismatch exists between policy-driven areas and those with high ecological function [54]. This underscores the need to continually align policy frameworks with science-based ecological priorities.
This framework provides a strong foundation for future research and implementation. Using the target NHS, there is the potential for integrating Nature-based Climate Solutions (NbCS) within the tiered system, leveraging the identified tiers for biodiversity and climate resilience [53]. The NHS can also serve as a tool for watershed-based management, translating the tiered framework into actionable plans for restoration, enhancement, and the implementation of low-impact development within each watershed’s unique land use context [55]. These future directions highlight the potential of this research to inform not only conservation but also broader urban sustainability and climate adaptation strategies.
Overall, this research demonstrates that using a systematic, science-based approach with an optimization tool is beneficial. Marxan allows for a greater area to be included in the NHS than would be possible with simpler, more conventional planning methods. This robust framework is crucial for addressing the complexities of urban conservation. The analysis found that the hybrid scenario, which combines priorities from both the regional and watershed levels, is the most effective approach for urbanizing regions. It strategically balances the protection of large, high-quality natural areas with the needs of fragmented urban watersheds. This ensures that conservation efforts are comprehensive and not disproportionately concentrated in one type of landscape. The classification of the final solution into three tiers of existing natural cover, potential natural cover, and contributing areas is a practical and actionable output of the research. This tiered approach provides clear, differentiated management actions, moving beyond an explicit “protect or not protect” approach to guide protection, restoration, and enhancement strategies. The target NHS footprint identified by Marxan serves as a decision-support tool that integrates both terrestrial and aquatic ecosystem functions. By including criteria for connectivity and incorporating the reach contributing area scale, the system is designed to support long-term biodiversity resilience, provide vital ecosystem services, and contribute to overall urban sustainability.
Supplementary Materials
The following supporting information can be downloaded at https://www.mdpi.com/article/10.3390/conservation6010021/s1, Table S1. Summary of land use area (hectare) and percentages in each watershed and the waterfront of Toronto and Region Conservation Authority’s (TRCA) jurisdiction. Table S2. Summary of the two hybrid scenarios, detailing the percentage of TRCA’s jurisdiction selected and its breakdown into unique and overlapping areas of the regional and watershed-level solutions. Table S3. Natural Heritage System values of criteria for input into Marxan. Table S4. Land use designated as built and unbuilt for the tiered classification of the target Natural Heritage System (NHS) using TRCA’s land use (2017) [56].
Author Contributions
A.T.M.C. compiled data, completed analysis, and tested the models. N.S. conceptualized the study approach, outlined, and supervised the findings of this work. J.L.W.R. and M.-J.F. outlined and supervised the findings of this work. All authors contributed to the final manuscript. All authors have read and agreed to the published version of the manuscript.
Funding
A.T.M.C. was provided funding through Mitacs (IT11565) and TRCA. M.-J.F. acknowledges the funding from an NSERC Discovery Grant and of the Canada Research Chair in Spatial Ecology.
Data Availability Statement
The data presented in this study are available on request from the corresponding author. Additionally, all data layers can be requested from Toronto and Region Conservation Authority through a data sharing agreement. Final layers are available on https://trca-camaps.opendata.arcgis.com (accessed on 29 September 2025).
Acknowledgments
We would like to thank Toronto and Region Conservation Authority (TRCA) for providing data for this analysis and the Regions of Peel, York, and the City of Toronto for supporting ongoing TRCA data collection efforts. This study would not have been possible without their effort and dedication.
Conflicts of Interest
The authors declare no conflicts of interest.
References
- McKinney, M.L. Urbanization, Biodiversity, and Conservation. Bioscience 2002, 52, 883–890. [Google Scholar] [CrossRef] [Scilit]
- Setälä, H.; Bardgett, R.D.; Birkhofer, K.; Brady, M.; Byrne, L.; de Ruiter, P.C.; de Vries, F.T.; Gardi, C.; Hedlund, K.; Hemerik, L.; et al. Urban and Agricultural Soils: Conflicts and Trade-Offs in the Optimization of Ecosystem Services. Urban Ecosyst. 2014, 17, 239–253. [Google Scholar] [CrossRef] [Scilit]
- Pickard, B.R.; Van Berkel, D.; Petrasova, A.; Meentemeyer, R.K. Forecasts of Urbanization Scenarios Reveal Trade-Offs between Landscape Change and Ecosystem Services. Landsc. Ecol. 2017, 32, 617–634. [Google Scholar] [CrossRef] [Scilit]
- Tole, L. Changes in the Built vs. Non-Built Environment in a Rapidly Urbanizing Region: A Case Study of the Greater Toronto Area. Comput. Environ. Urban Syst. 2008, 32, 355–364. [Google Scholar] [CrossRef] [Scilit]
- Lister, N.M.; Brocki, M.; Ament, R. Integrated Adaptive Design for Wildlife Movement under Climate Change. Front. Ecol. Environ. 2015, 13, 493–502. [Google Scholar] [CrossRef] [Scilit]
- McDonald, R.I.; Marcotullio, P.J.; Güneralp, B. Urbanization and Global Trends in Biodiversity and Ecosystem Services. In Urbanization, Biodiversity and Ecosystem Services: Challenges and Opportunities: A Global Assessment; Elmqvist, T., Fragkias, M., Goodness, J., Güneralp, B., Marcotullio, P.J., McDonald, R.I., Parnell, S., Schewenius, M., Sendstad, M., Seto, K.C., et al., Eds.; Springer: Dordrecht, The Netherlands, 2013; pp. 31–52. ISBN 978-94-007-7088-1. [Google Scholar]
- van Vliet, J. Direct and Indirect Loss of Natural Area from Urban Expansion. Nat. Sustain. 2019, 2, 755–763. [Google Scholar] [CrossRef] [Scilit]
- Haaland, C.; van den Bosch, C.K. Challenges and Strategies for Urban Green-Space Planning in Cities Undergoing Densification: A Review. Urban For. Urban Green. 2015, 14, 760–771. [Google Scholar] [CrossRef] [Scilit]
- Kaye, J.P.; Groffman, P.M.; Grimm, N.B.; Baker, L.A.; Pouyat, R.V. A Distinct Urban Biogeochemistry? Trends Ecol. Evol. 2006, 21, 192–199. [Google Scholar] [CrossRef] [Scilit]
- Bechtel, B.; Schmidt, K.J. Floristic Mapping Data as a Proxy for the Mean Urban Heat Island. Clim. Res. 2011, 49, 45–58. [Google Scholar] [CrossRef] [Scilit]
- Aurambout, J.P.; Endress, A.G.; Deal, B.M. A Spatial Model to Estimate Habitat Fragmentation and Its Consequences on Long-Term Persistence of Animal Populations. Environ. Monit. Assess. 2005, 109, 199–225. [Google Scholar] [CrossRef] [Scilit] [PubMed]
- Webber, J.L.; Fletcher, T.D.; Cunningham, L.; Fu, G.; Butler, D.; Burns, M.J. Is Green Infrastructure a Viable Strategy for Managing Urban Surface Water Flooding? Urban Water J. 2020, 17, 598–608. [Google Scholar] [CrossRef] [Scilit]
- Filazzola, A.; Shrestha, N.; MacIvor, J.S. The Contribution of Constructed Green Infrastructure to Urban Biodiversity: A Synthesis and Meta-Analysis. J. Appl. Ecol. 2019, 56, 2131–2143. [Google Scholar] [CrossRef] [Scilit]
- Sharma, R.; Malaviya, P. Management of Stormwater Pollution Using Green Infrastructure: The Role of Rain Gardens. WIREs Water 2021, 8, e1507. [Google Scholar] [CrossRef] [Scilit]
- Tomson, M.; Kumar, P.; Barwise, Y.; Perez, P.; Forehead, H.; French, K.; Morawska, L.; Watts, J.F. Green Infrastructure for Air Quality Improvement in Street Canyons. Environ. Int. 2021, 146, 106288. [Google Scholar] [CrossRef] [Scilit] [PubMed]
- Marando, F.; Heris, M.P.; Zulian, G.; Udías, A.; Mentaschi, L.; Chrysoulakis, N.; Parastatidis, D.; Maes, J. Urban Heat Island Mitigation by Green Infrastructure in European Functional Urban Areas. Sustain. Cities Soc. 2022, 77, 103564. [Google Scholar] [CrossRef] [Scilit]
- Balany, F.; Ng, A.W.M.; Muttil, N.; Muthukumaran, S.; Wong, M.S. Green Infrastructure as an Urban Heat Island Mitigation Strategy—A Review. Water 2020, 12, 3577. [Google Scholar] [CrossRef] [Scilit]
- Wang, Y.; Moskovits, D.K. Tracking Fragmentation of Natural Communities and Changes in Land Cover: Applications of Landsat Data for Conservation in an Urban Landscape (Chicago Wilderness). Conserv. Biol. 2001, 15, 835–843. [Google Scholar] [CrossRef] [Scilit]
- Hooftman, D.A.P.; Bullock, J.M. Mapping to Inform Conservation: A Case Study of Changes in Semi-Natural Habitats and Their Connectivity over 70years. Biol. Conserv. 2012, 145, 30–38. [Google Scholar] [CrossRef] [Scilit]
- Fischer, J.; Lindenmayer, D.B. Landscape Modification and Habitat Fragmentation: A Synthesis. Glob. Ecol. Biogeogr. 2007, 16, 265–280. [Google Scholar] [CrossRef] [Scilit]
- Liu, Z.; He, C.; Wu, J. The Relationship between Habitat Loss and Fragmentation during Urbanization: An Empirical Evaluation from 16 World Cities. PLoS ONE 2016, 11, e0154613. [Google Scholar] [CrossRef] [Scilit]
- Haddad, N.M.; Brudvig, L.A.; Clobert, J.; Davies, K.F.; Gonzalez, A.; Holt, R.D.; Lovejoy, T.E.; Sexton, J.O.; Austin, M.P.; Collins, C.D.; et al. Habitat Fragmentation and Its Lasting Impact on Earth’s Ecosystems. Sci. Adv. 2025, 1, e1500052. [Google Scholar] [CrossRef] [Scilit] [PubMed]
- Gilliam, J.F.; Fraser, D.F. Movement in Corridors: Enhancement by Predation Threat, Disturbance, and Habitat Structure. Ecology 2001, 82, 258–273. [Google Scholar] [CrossRef]
- Whytock, R.C.; Fuentes-Montemayor, E.; Watts, K.; Macgregor, N.A.; Williams, L.; Park, K.J. Context-Dependent Colonization of Terrestrial Habitat “islands” by a Long-Distance Migrant Bird. Proc. R. Soc. B Biol. Sci. 2018, 285, 20181490. [Google Scholar] [CrossRef] [Scilit]
- Bierwagen, B. Connectivity in Urbanizing Landscapes: The Importance of Habitat Configuration, Urban Area Size, and Dispersal. Urban Ecosyst. 2007, 10, 29–42. [Google Scholar] [CrossRef] [Scilit]
- Gelmi-Candusso, T.A.; Chin, A.T.M.; Ruppert, J.L.W.; Fortin, M.J. Urban Planning for Wildlife Connectivity: A Multispecies Assessment of Urban Sprawl and SLOSS Renaturalization Strategies. J. Appl. Ecol. 2025, 62, 1007–1023. [Google Scholar] [CrossRef] [Scilit]
- Ontario Ministry of Municipal Affairs and Housing (OMMAH). Provincial Policy Statement, 2020; Ontario Ministry of Municipal Affairs and Housing: Toronto, ON, Canada, 2020. [Google Scholar]
- Puric-Mladenovic, D.; Strobl, S. Designing Natural Heritage Systems in Southern Ontario Using a Systematic Conservation Planning Approach. For. Chron. 2012, 88, 667–796. [Google Scholar] [CrossRef] [Scilit]
- Crist, E.; Kopnina, H.; Cafaro, P.; Gray, J.; Ripple, W.J.; Safina, C.; Davis, J.; DellaSala, D.A.; Noss, R.F.; Washington, H.; et al. Protecting Half the Planet and Transforming Human Systems Are Complementary Goals. Front. Conserv. Sci. 2021, 2, 761292. [Google Scholar] [CrossRef] [Scilit]
- Furberg, D.; Ban, Y. Satellite Monitoring of Urban Sprawl and Assessment of Its Potential Environmental Impact in the Greater Toronto Area Between 1985 and 2005. Environ. Manag. 2012, 50, 1068–1088. [Google Scholar] [CrossRef] [Scilit]
- Ontario Ministry of Finance. Ontario’s Long-Term Report on the Economy 2024–46; King’s Printer for Ontario: Toronto, ON, Canada, 2024. [Google Scholar]
- Ramsay-Brown, J. Toronto’s Ravines and Urban Forests: Their Natural Heritage and Local History; James Lorimer & Company: Toronto, ON, Canada, 2020. [Google Scholar]
- Macdonald, S.; Monstadt, J.; Friendly, A. Towards Smart Regional Growth: Institutional Complexities and the Regional Governance of Southern Ontario’s Greenbelt. Territ. Politic Gov. 2023, 11, 1727–1747. [Google Scholar] [CrossRef] [Scilit]
- Ontario Ministry of Natural Resources. Natural Heritage Reference Manual for Natural Heritage Policies of the Provincial Policy Statement, 2005, 2nd ed.; Ontario Ministry of Natural Resources: Toronto, ON, Canada, 2010; ISBN 9781443517904. [Google Scholar]
- Ball, I.R.; Possingham, H.P.; Watts, M. Spatial Conservation Prioritisation: Quantitative Methods and Computational Tools. In Marxan and Relatives: Software for Spatial Conservation Prioritisation; Moilanen, A., Wilson, K.A., Possingham, H.P., Eds.; Oxford University Press: Oxford, UK, 2009; pp. 185–195. [Google Scholar]
- ArcGIS, version 10.7.1; Esri Inc.: Redlands, CA, USA, 2015.
- Ontario Ministry of Municipal Affairs and Housing. Government of Ontario Provincial Policy Statement, 2020; Under the Planning Act; Queen’s Printer for Ontario: Toronto, ON, Canada, 2020; pp. 1–56. [Google Scholar]
- Toronto and Region Conservation Authority (TRCA) TRCA Water Resource System. Available online: https://trca-camaps.opendata.arcgis.com/maps/9fda1cd9733f410297fb5fcde88b9e9d/about (accessed on 29 September 2025).
- Ruppert, J. TRCA Water Resource System: A Summary Report; Toronto and Region Conservation Authority: Vaughan, ON, Canada, 2022. [Google Scholar]
- Toronto and Region Conservation Authority (TRCA). TRCA Landuse Natural Cover (2017); Toronto and Region Conservation Authority (TRCA): Concord, ON, Canada, 2017. [Google Scholar]
- Toronto and Region Conservation Authority (TRCA) TRCA Regulation Mapping. Available online: https://experience.arcgis.com/experience/a783d0f006ea482787b7aceeee649f0a (accessed on 29 September 2025).
- City of Toronto Environmentally Significant Areas. Available online: https://www.toronto.ca/explore-enjoy/parks-gardens-beaches/ravines-natural-parklands/environmentally-significant-areas-2/ (accessed on 6 July 2020).
- Government of Ontario. Biodiversity: It’s in Our Nature; Government of Ontario: Toronto, ON, Canada, 2012; ISBN 9781443597623. [Google Scholar]
- Archibald, K.M.; Buler, J.J.; Smolinsky, J.A.; Smith, R.J. Migrating Birds Reorient toward Land at Dawn over the Great Lakes, USA. Auk 2017, 134, 193–201. [Google Scholar] [CrossRef] [Scilit]
- Toronto and Region Conservation Authority (TRCA) Toronto and Region Conservation Authority Conservation Lands. Available online: https://trca.ca/about/conservation-authorities-act-strategies/#land-inventory (accessed on 29 September 2025).
- Ontario Ministry of Natural Resources Areas of Natural and Scientific Interest (ANSI). Available online: https://geohub.lio.gov.on.ca/datasets/areas-of-natural-and-scientific-interest-ansi/about (accessed on 29 September 2025).
- Chin, A.T.M.; Ruppert, J.L.W.; Shrestha, N.; Fortin, M.-J. Urban Avian Conservation Planning Using Species Functional Traits and Habitat Suitability Mapping. Land 2022, 11, 1831. [Google Scholar] [CrossRef] [Scilit]
- Shrestha, N.; Chin, A. TRCA Updated Target Natural Heritage System: A Summary Report; Toronto and Region Conservation Authority: Vaughan, ON, Canada, 2022. [Google Scholar]
- Toronto and Region Conservation Authority (TRCA). TRCA Orthophoto Imagery (2022); Toronto and Region Conservation Authority (TRCA): Vaughan, ON, Canada, 2022. [Google Scholar]
- Sarkar, S.; Pressey, R.L.; Faith, D.P.; Margules, C.R.; Fuller, T.; Stoms, D.M.; Moffett, A.; Wilson, K.A.; Williams, K.J.; Williams, P.H.; et al. Biodiversity Conservation Planning Tools: Present Status and Challenges for the Future. Annu. Rev. Environ. Resour. 2006, 31, 123–159. [Google Scholar] [CrossRef] [Scilit]
- Giakoumi, S.; Richardson, A.J.; Doxa, A.; Moro, S.; Andrello, M.; Hanson, J.O.; Hermoso, V.; Mazor, T.; McGowan, J.; Kujala, H.; et al. Advances in Systematic Conservation Planning to Meet Global Biodiversity Goals. Trends Ecol. Evol. 2025, 40, 395–410. [Google Scholar] [CrossRef] [Scilit]
- Golden, H.E.; Hoghooghi, N. Green Infrastructure and Its Catchment-Scale Effects: An Emerging Science. Wiley Interdiscip. Rev. Water 2018, 5, 1254. [Google Scholar] [CrossRef] [Scilit]
- Wang, D.; Xu, P.Y.; An, B.W.; Guo, Q.P. Urban Green Infrastructure: Bridging Biodiversity Conservation and Sustainable Urban Development through Adaptive Management Approach. Front. Ecol. Evol. 2024, 12, 1440477. [Google Scholar] [CrossRef] [Scilit]
- Winkler, K.J.; Dade, M.C.; Rieb, J.T. Mismatches in the Ecosystem Services Literature-a Review of Spatial, Temporal, and Functional-Conceptual Mismatches. Curr. Landsc. Ecol. Rep. 2021, 6, 23–34. [Google Scholar] [CrossRef] [Scilit]
- Jones, A.L.; Gordon, S.I. From Plan to Practice: Implementing Watershed-based Strategies into Local, State, and Federal Policy. Environ. Toxicol. Chem. 2000, 19, 1136–1142. [Google Scholar] [CrossRef]
- Toronto and Region Conservation Authority (TRCA). TRCA Land Use (2017); Toronto and Region Conservation Authority (TRCA): Vaughan, ON, Canada, 2017. [Google Scholar]

Disclaimer/Publisher’s Note: The statements, opinions and data contained in all publications are solely those of the individual author(s) and contributor(s) and not of MDPI and/or the editor(s). MDPI and/or the editor(s) disclaim responsibility for any injury to people or property resulting from any ideas, methods, instructions or products referred to in the content. |
© 2026 by the authors. Licensee MDPI, Basel, Switzerland. This article is an open access article distributed under the terms and conditions of the Creative Commons Attribution (CC BY) license.