


Abstract
Among global biodiversity hotspots, the Mediterranean Basin is expected to become the one containing the largest extent of urban land, leaving natural forest fragments embedded within urban areas. Consequently, urban forests represent key reservoirs of biodiversity in rapidly urbanizing regions. However, how tree species adjust to the fragmentation and altered conditions of these forests remains poorly understood. We evaluated the seasonal variation in leaf functional traits of Quercus frainetto in an urban and a natural forest stand belonging to the same phytosociological association, Roso arvensis-Quercetum cerridis, in the municipality of Campobasso (Italy), and compared these patterns with those of the co-dominant Q. cerris sampled in the same stands and campaigns. Specific leaf area (SLA), leaf dry matter content (LDMC), leaf thickness, chlorophyll, flavonols and anthocyanins were measured in June, July and September 2023 and analysed using linear mixed-effects models, together with satellite-derived environmental variables. Q. frainetto showed a seasonal shift toward a more conservative leaf economy, with declining SLA and increasing LDMC and flavonols. In the urban forest, Q. cerris combined relatively high SLA with consistently higher LDMC and higher flavonol content than Q. frainetto in July and September, whereas in the natural forest these differences were restricted to single sampling dates. Overall, in the stands studied, the urban functional profile of Q. cerris was more consistent with tolerance to warmer and seasonally drier conditions than that of Q. frainetto, a pattern that requires validation across multiple sites and years.
1. Introduction
The 22 countries bordering the Mediterranean Sea host about 512 million people [1], and the region is characterized by an exceptionally high density of historical, ancient, and modern settlements. By 2030, the Mediterranean Basin is projected to become the only biodiversity hotspot containing more than 100,000 km2 of urban land [2], while the forests of Mediterranean countries currently cover about 88 million hectares [3]. Among the different types of forests, oak forests represent the most prevalent natural forest vegetation type, especially in the Mediterranean regions of south-eastern Europe [4], often occurring as fragmented remnants of forests embedded within urban and peri-urban landscapes.
Urban oak forests constitute key reservoirs of biodiversity within rapidly urbanizing regions. Located within or adjacent to cities, these ecosystems deliver essential ecosystem services; however, their ecological integrity is increasingly threatened by land-use change, habitat fragmentation, climate change, and anthropogenic disturbance [5]. Accordingly, understanding how urban oak forest ecosystems function has become a strategic priority for biodiversity conservation and their long-term sustainability [6,7,8].
In Italy, within the framework of the EU’s NextGenerationEU and the National Recovery and Resilience Plan (NRRP), a dedicated program was launched under Mission 2 (Green Revolution and Ecological Transition) for “Protection and Enhancement of Urban and Peri-Urban Green Areas”. As part of this project, a list of native woody species suitable for urban afforestation and reforestation was developed to enhance urban resilience [9,10]. Among the listed deciduous tree taxa, the oak species Quercus frainetto Ten. and Quercus cerris L. are designated as priority species, characterizing a zonal thermophilous deciduous oak forest type throughout the central and southern Apennines [11,12,13,14,15]. These species frequently co-dominate forest stands distributed between 150 and 800 m a.s.l. under a bioclimate characterized by mean annual precipitation of 600–900 mm and mean annual temperatures of 10–13 °C [11]. The soils are generally Eutric or Dystric Cambisols, with a pH of 5.5–7.0, retaining sufficient moisture throughout the growing season [16,17]. Namely, Quercus frainetto Ten. (subgenus Quercus section Quercus), also known as the Hungarian oak, is an autochthonous deciduous species native to central and southeast Europe [18]. It primarily grows in plains and foothill slopes and has a high demand for soil water and a comparatively low tolerance to drought and high temperatures [4,18,19,20,21,22]. Quercus cerris L. (subgenus Cerris section Cerris), commonly known as Turkey oak, is a deciduous species native to southern Europe and Asia Minor [18]. It is widely distributed throughout the Italian and Balkan peninsulas and is tolerant of poor, clayey soils, drought, and air pollution [19,20,21,22,23,24,25]. Owing to its adaptability, this species is well suited to urban environments, including parks, gardens, avenues, and other public green spaces [9,26].
Despite extensive research on these two species in natural ecosystems [25,27,28,29,30,31], their ecological responses to urban environments at both the European and Italian scales remain poorly investigated. In urban settings, long-term tree survival and performance depend on physiological tolerance and phenotypic plasticity in key functional traits. Understanding these traits is therefore essential for predicting the persistence of urban forests under increasingly severe future climatic conditions [32,33,34]. Consequently, co-dominant oak species with contrasting autecological requirements may therefore differ in how they respond to the same urban environmental conditions.
Quaranta et al. [26] showed that oak responses to natural and urban environments can be assessed using functional traits. Specific Leaf Area (SLA), Leaf Dry Matter Content (LDMC), and leaf pigment composition (chlorophyll, anthocyanins, and flavonols) were identified as informative traits reflecting species responses to urban and natural environmental conditions in a Mediterranean forest ecosystem. Such information is increasingly recognized as essential for guiding the selection of tree species for urban afforestation and reforestation programs [35,36,37].
The two forest stands compared in this study both belong to the association Roso arvensis-Quercetum cerridis Ubaldi 2003 and derive from the progressive fragmentation of a single pre-existing woodland [26]. Their understory species pools indicate comparable light, soil reaction and nitrogen requirements, with only the urban forest expressing slightly warmer and drier conditions. This shared vegetation type and historical origin provide a comparatively controlled ecological context in which to examine stand-related differences in leaf functional traits, while reducing potential confounding associated with differences in forest history and community composition.
Building on these findings, the present study investigated the seasonal variation in leaf functional traits of Quercus frainetto, a species not yet characterized through trait-based approaches in urban environments and compares it with Quercus cerris across urban and natural forest stands.
Accordingly, the objectives of this study were to:
- (a)
- characterize the seasonal variation in Q. frainetto leaf functional traits in response to urban and natural forest environments;
- (b)
- compare the functional responses of Q. frainetto and Q. cerris across the same environmental contexts and sampling periods;
- (c)
- assess whether the seasonal functional patterns identified for Q. frainetto and Q. cerris reflect species-specific patterns or vary according to the environmental context.
Given their contrasting autecological requirements [4,18,19,20,21,22], we expected the two species to differ in how their traits respond to urban conditions, with Q. cerris adjusting structural and biochemical traits in a coordinated way and Q. frainetto showing trait-specific responses. We also expected biochemical traits to discriminate between stands more markedly than structural ones.
This work forms part of a broader interdisciplinary research program conducted over the past decade by the Plant Taxonomy Laboratory of the University of Molise, aimed at elucidating the ecological, morphological, and molecular characteristics of Quercus species across Europe [38,39,40,41,42,43,44,45,46,47,48]. In addition, it contributes to a multidisciplinary investigation carried out in the same urban and natural forest stands of Campobasso municipality, in which complementary ecosystem components, including soil properties, root functional traits, and rhizosphere microbial communities, have been examined by other research groups. Together, these studies provide an integrated above- and below-ground perspective on oak responses to urbanization [49,50,51,52].
The results are expected to highlight the relevance of the selected functional traits and support their use as a practical and robust tool for evaluating the health status of oak trees across different environmental conditions, contributing to more accurate monitoring and management strategies for forest ecosystems.
2. Results
Descriptive statistics (mean ± standard deviation) for all leaf functional traits, grouped by species, stand, and sampling month, are reported in Supplementary Table S1.
2.1. Leaf Functional Traits of Quercus frainetto: Relationships with Climatic Variables and Seasonal Variation Between Stands
2.1.1. Pearson’s Correlations
Figure 1 shows the Pearson’s correlation matrix for the complete Quercus frainetto dataset. Environmental variables were strongly intercorrelated. Land surface temperature (LST) was almost perfectly negatively correlated with soil moisture (SMOI; r = −0.96), whereas precipitation (PPT) was strongly positively correlated with both actual evapotranspiration (ACTEVP; r = 0.94) and SMOI (r = 0.93).
Figure 1.
Pearson’s correlation matrix plots for the Quercus frainetto dataset, based on samples of Urban (UF) and Natural (NF) forest stands. Correlation coefficients range from −1 (red) to +1 (blue). The shape, width, and colour gradient of the ellipses represent the strength and direction of the correlation, with narrower and more elongated ellipses indicating stronger correlations. Grey boxes highlight statistically significant correlations (p < 0.05). Correlations were calculated among six leaf functional traits: SLA (Specific Leaf Area), LDMC (Leaf Dry Matter Content), LTH (leaf thickness), CHL (chlorophyll content), FLV (flavonol content), and ANTH (anthocyanin content); one canopy structural variable: LAI (Leaf Area Index); four climatic variables: LST (Land Surface Temperature), SMOI (Soil Moisture), PPT (Precipitation), and ACTEVP (Actual Evapotranspiration).
Among the leaf functional traits, Specific Leaf Area (SLA) exhibited the strongest correlations, being negatively associated with flavonol content (FLV; r = −0.77) and leaf thickness (LTH; r = −0.54). Leaf Dry Matter Content (LDMC) was moderately negatively correlated with Leaf Area Index (LAI; r = −0.58). Anthocyanin content (ANTH) was moderately positively correlated with SMOI (r = 0.43) and negatively correlated with LST (r = −0.37), whereas chlorophyll content (CHL) showed only weak correlations with the environmental variables.
Separate analyses of the natural forest (NF) and urban forest (UF) stands revealed similar overall correlation patterns, although the strength of several trait–environment relationships differed between stands (Figures S1 and S2). In both NF and UF, environmental variables remained highly intercorrelated, with strong negative correlations between LST and SMOI and strong positive correlations among PPT, ACTEVP, and SMOI. In the NF stand, SLA was strongly negatively correlated with FLV (r = −0.83) and LTH (r = −0.76), and moderately negatively correlated with LDMC (r = −0.43). Anthocyanin content was positively correlated with SMOI (r = 0.55) and negatively correlated with LST (r = −0.55), whereas CHL showed negligible correlations with the environmental variables (|r| ≤ 0.10). In the UF stand, trait–environment relationships were generally stronger. SLA was negatively correlated with FLV (r = −0.64), LDMC (r = −0.49), and LST (r = −0.55), while showing positive correlations with SMOI (r = 0.56) and PPT (r = 0.55). Anthocyanin content exhibited weaker but consistent positive correlations with SMOI, PPT, and ACTEVP (r ≈ 0.25) and a negative correlation with LST (r = −0.25).
Overall, the Pearson correlation analysis identified SLA and anthocyanin content as the traits most consistently associated with the environmental gradient, whereas chlorophyll content showed limited associations.
2.1.2. Principal Component Analysis
The principal component analysis (PCA) revealed clear seasonal and forest stand-related patterns in the functional traits and environmental variables of Quercus frainetto (Figure 2). The first two principal components explained 63.44% of the total variance, with PC1 accounting for 44.82% and PC2 for 18.62%.
Figure 2.
Principal component analysis (PCA) of urban and natural Quercus frainetto forests. The axes represent the first and second components, and the variance values are shown in brackets. The crosses represent Urban forest leaves and the dots represent Natural forest leaves; the ellipses indicate the dispersion of the group. The arrows on the biplot represent the direction and strength of the variables SLA (Specific Leaf Area), LDMC (Leaf Dry Matter Content), LTH (leaf thickness), CHL (chlorophyll content), FLV (flavonol content), and ANTH (anthocyanin content), LAI (Leaf Area Index), LST (Land Surface Temperature), SMOI (Soil Moisture), PPT (Precipitation), and ACTEVP (Actual Evapotranspiration) over three months of sampling (June = green, July = red, September = blue).
PC1 primarily separated the September samples from those collected in June and July, whereas PC2 distinguished June from July. Urban forest (UF) and natural forest (NF) samples formed distinct groups across all sampling periods, with NF samples generally occupying higher scores along the main ordination axes. The separation between the two forest stands was evident throughout the sampling period and was most pronounced in July, particularly along PC2.
The orientation of the variable vectors highlighted clear seasonal differences in trait–environment relationships. Specific Leaf Area (SLA), Leaf Area Index (LAI), and anthocyanin content (ANTH) were mainly associated with the June samples, whereas precipitation (PPT), actual evapotranspiration (ACTEVP), and soil moisture (SMOI) were more closely associated with the July samples. In contrast, Leaf Dry Matter Content (LDMC), leaf thickness (LTH), flavonol content (FLV), and chlorophyll content (CHL) were associated with the September samples. Overall, the PCA revealed a progressive seasonal shift in leaf functional traits, together with a consistent separation between urban and natural forest stands.
2.1.3. Linear Mixed-Effects Models
We used linear mixed-effects models (LMM) to evaluate the intraspecific variation in the six leaf functional traits of Q. frainetto between the urban (UF) and natural (NF) stands across the three sampling months. The results are summarized in Figure 3, where significant differences among month × stand combinations are indicated by Šidák-adjusted grouping letters.
Figure 3.
Boxplots of the six leaf functional traits of Quercus frainetto in the Urban (UF, red) and Natural (NF, green) stands across the three sampling months: (a) SLA, specific leaf area; (b) LDMC, leaf dry matter content; (c) CHL, chlorophyll content; (d) LTH, leaf thickness; (e) FLV, flavonol content; (f) ANTH, anthocyanin content. Letters indicate Šidák-adjusted groups across the month × stand combinations, derived from linear mixed-effects models with tree identity as a random effect; groups sharing a letter do not differ significantly (p > 0.05).
Specific Leaf Area (SLA; Figure 3a) declined progressively from June to September in both forest stands. No significant differences were detected between UF and NF in June or September, whereas SLA was significantly higher in UF than in NF in July. Leaf Dry Matter Content (LDMC; Figure 3b) exhibited the opposite seasonal pattern, increasing steadily throughout the growing season. Stand differences were detected only in June, when LDMC was significantly lower in UF than in NF. Chlorophyll content (CHL; Figure 3c) varied only slightly during the sampling period, and no significant differences were observed between the two stands in any sampling month. Leaf thickness (LTH; Figure 3d) showed the greatest temporal and spatial variability. Leaves were significantly thicker in UF than in NF in June, whereas the opposite pattern was observed in July. No significant differences between stands were detected in September. Flavonol content (FLV; Figure 3e) increased progressively from June to September in both stands, with a more pronounced increase in NF. Although no stand differences were detected in June, FLV was significantly higher in NF than in UF in both July and September. Anthocyanin content (ANTH; Figure 3f) followed the opposite seasonal trend, with the highest values recorded in June and a progressive decline towards September. ANTH was significantly higher in NF than in UF in June, whereas no significant differences between stands were detected in July or September. Overall, month significantly affected SLA, LDMC, FLV, and ANTH (p < 0.001), whereas the Month × Stand interaction was significant for SLA, LTH, FLV, and ANTH (Table S2).
2.2. Leaf Functional Traits Variations Between Quercus frainetto and Quercus cerris
We assessed interspecific variations in leaf traits using linear mixed-effects models (LMM) with estimated marginal means (EMMs) combining the Quercus frainetto dataset generated in the present study with the previously published Quercus cerris dataset [26]. Seasonal trends and pairwise comparisons between the two species within each forest stand are shown in Figure 4.
Figure 4.
Seasonal variations in leaf functional traits: (a) SLA (Specific Leaf Area), (b) LDMC (Leaf Dry Matter Content), (c) CHL (chlorophyll content), (d) LTH (leaf thickness), (e) FLV (flavonol content) and (f) ANTH (anthocyanin content), in Quercus cerris (brown) and Quercus frainetto (yellow) across Urban (UF) and Natural (NF) forests. Boxplots represent raw data distribution; colored lines with error bars indicate estimated marginal means (EMMs ± 95% CI) from linear mixed-effects models. Pairwise differences between species (Q. cerris vs. Q. frainetto) within each stand and sampling period (p < 0.05: *, p < 0.01: **, p < 0.001: ***, ns = not significant) are reported above the boxplots.
Overall, SLA decreased seasonally at both forest stands (Figure 4a). In UF, Q. frainetto had significantly lower SLA than Q. cerris in June (**) and July (*) and remained lower, though without significance in September (ns). In NF, no differences were observed in June (ns), but Q. frainetto showed a stronger decline, resulting in lower values in July (***). LDMC increased seasonally at both stands (Figure 4b). In UF, it increased from June to September, with lower values for Q. frainetto, showing a significant difference with Q. cerris in June (**) which became more evident in July and September (***). In NF, LDMC remained stable in June and July with no interspecific differences (ns), while in September both species increased, with Q. frainetto showing lower values than Q. cerris (*). CHL peaked in July and then decreased in September, except for Q. cerris in NF, which continued to increase (Figure 4c). In UF, no interspecific differences were observed until September (*), when both species declined, but Q. frainetto maintained higher values. In NF, Q. frainetto followed the same seasonal trend as UF, while Q. cerris increased steadily but remained lower than Q. frainetto throughout the three months (**,***,*). LTH showed stand-specific patterns (Figure 4d). In UF, no differences were observed in June and July (ns), while differences were evident in September, when LTH increased in Q. frainetto and decreased in Q. cerris (***). In NF, Q. frainetto had lower LTH in June than Q. cerris (*), but this pattern reversed in July and September, with significant differences maintained (*). FLV increased at both stands (Figure 4e). In UF, the species showed no differences in June (ns), but Q. frainetto showed a lower increase than Q. cerris in July (**) and September (*). As for the NF, Q. frainetto showed significantly lower values in flavonol content compared to Q. cerris in June (***), while in the following two months this difference was not significant (ns). ANTH declined across the season at both stands, more sharply in NF (Figure 4f). In UF, no differences were evident in June (ns); in July, Q. frainetto remained stable while Q. cerris declined (**); in September, the values converged again (ns). In NF, both species decreased, with higher values for Q. frainetto than Q. cerris, although the difference was not statistically significant in any month (ns).
The RDPI heatmap (UF vs. NF; Figure 5) revealed clear trait-specific differences in the magnitude of stand-related phenotypic differentiation in both species.
Figure 5.
Heatmap of the whole-season Relative Distance Plasticity Index (RDPI) values for six leaf traits (SLA—Specific Leaf Area, LDMC—Leaf Dry Matter Content, LTH—leaf thickness, CHL—chlorophyll content, FLV—flavonol content, and ANTH—anthocyanin content), in Quercus cerris and Quercus frainetto. Values within cells represent RDPI between Urban (UF) and Natural (NF) forest stands. The color scale, ranging from ≤0% (white) to 45% (red), indicates the percentage by which RDPI exceeds the random expectation (the median RDPI of all 3432 random reallocations of trees between stands). Asterisks indicate statistical significance (one-sided exact permutation test; Benjamini–Hochberg adjustment across the six traits within each species): * p < 0.05, ** p < 0.01 (monthly values and complete statistics in Table S6).
In both oaks, the highest RDPI values were observed for anthocyanin and flavonol content, with greater values in Q. frainetto (ANTH = 0.107; FLV = 0.089) than in Q. cerris (ANTH = 0.071; FLV = 0.063). However, only flavonol content exceeded the random expectation in both species (Q. frainetto p = 0.007; Q. cerris p = 0.030), whereas anthocyanin RDPI did not differ from it. Conversely, Q. cerris exhibited higher RDPI values for SLA (0.044 vs. 0.032) and chlorophyll content (0.031 vs. 0.020), whereas LDMC showed greater differentiation in Q. frainetto (0.027 vs. 0.016); among these, the random expectation was exceeded by chlorophyll content in Q. cerris (p = 0.007) and by SLA and LDMC in Q. frainetto (p = 0.017 and p = 0.022, respectively). No interspecific difference in whole-season RDPI was statistically supported for any trait (Table S7). Leaf thickness showed nearly identical RDPI values in the two species (0.034 in Q. frainetto and 0.033 in Q. cerris), neither exceeding the random expectation. Overall, neither species exhibited uniformly greater RDPI across traits, indicating that the magnitude of phenotypic differentiation between the urban and natural forest stands was strongly trait-dependent and differed in its distribution between the two species.
3. Discussion
Our study aimed to evaluate how the leaf functional traits selected for Quercus frainetto vary between urban and natural forest stands within a Mediterranean municipality and across the growing season in response to different environmental conditions.
As reported in Quaranta et al. [26], the Urban forest and Natural forest stands differ in the physiognomy of the surrounding landscape. The Urban forest stand lies within a matrix of sealed surfaces and built infrastructure, which raises air and surface temperatures through the urban heat island effect, while the continuous forest surrounding the Natural forest stand buffers microclimatic conditions and sustains higher soil moisture [53,54]. The Ecological Indicator Values for Europe derived from the community vegetation [26] are consistent with this pattern: light, soil reaction and nitrogen requirements are comparable between stands, whereas the temperature and moisture indicators separate them, with the Urban forest stand expressing slightly warmer and drier conditions. In contrast, the soil pH reported by Gillini et al. [49] was higher in the Urban than in the Natural forest stand (8.07 vs. 6.18; Table 1). This value lies outside the range typical of the Cambisols on which these oak forests develop (5.5–7.0 [16,17]) and is consistent with the higher pH reported for urban and peri-urban soils of Campobasso compared with non-urban ones [49], possibly reflecting the effect of urbanization. However, soil measurements describe conditions at the time of sampling, whereas the occurrence of species reflects conditions over longer periods: the comparable soil reaction values indicate that the plant communities of the two stands share similar requirements despite the difference in measured pH.
Table 1.
Description of Natural forest (NF) and Urban forest (UF) characteristics.
In this context, Q. frainetto showed a largely seasonal pattern in both stands consistent with the Leaf Economics Spectrum [55,56], although the magnitude and timing of the trait responses differed between the two populations.
In June, leaf dry matter content was already higher in the natural than in the urban forest stand at comparable specific leaf area, suggesting a more advanced stage of leaf development, whereas tissue accumulation between June and July was greater in the urban stand (Figure 3). The seasonal decline in specific leaf area and increase in leaf dry matter content indicate greater investment in leaf structural robustness and resource conservation [55,56], while the increase in flavonol content suggests enhanced photoprotection [57,58] as environmental conditions become warmer and drier. Together, these responses suggest that the selected traits captured seasonal acclimation in the studied Mediterranean oak stands.
The correlation matrix of Q. frainetto suggested leaf traits vary with the climatic variables: leaf dry matter content increases as soil moisture, precipitation and actual evapotranspiration decline (Figure 1) and Specific Leaf Area declines as Land Surface Temperature increases. These relationships describe the environmental context in which leaf maturation occurs, where climatic variables are themselves strongly intercorrelated and vary jointly over the course of the season. Chlorophyll behaved differently from the other pigments. It showed no relationship with the climatic variables and correlated mainly with the structural traits (Figure 1), remaining comparatively stable across the three sampling periods. This suggested that chlorophyll content was constrained by leaf anatomy and nitrogen allocation within the lamina rather than by short-term climatic variation [59], and that it operates within a narrow physiological range in which the pigment must be maintained for photosynthesis to proceed.
The seasonal functional patterns identified for Q. frainetto take on further ecological significance when considered in relation to Q. cerris, the co-dominant species, providing a basis for assessing whether these responses reflect species-specific patterns or vary according to the environmental context.
In the urban forest stand, the two species diverged primarily in traits related to leaf construction and its biochemical protection, with Q. cerris showing higher specific leaf area early in the season, consistently higher leaf dry matter content and higher flavonol content from July onwards (Figure 4). This combination points to a functionally mixed strategy in Q. cerris, consistent with the coexistence of resource-acquisitive potential [55,56,60] and enhanced structural and photoprotective investment under urban conditions [57,58]. Higher Leaf Dry Matter Content is generally associated with greater investment in persistent leaf tissues and a more conservative resource-use strategy [60], potentially allowing Q. cerris to maintain structural robustness without the marked reduction in Specific Leaf Area observed in Q. frainetto.
In the natural forest stand, by contrast, interspecific differences in these traits emerged only at specific sampling dates (Figure 4). The contrasting patterns observed between stands therefore indicate that interspecific differentiation in these structural and biochemical traits was more persistent across the growing season in the urban stand.
This pattern was not shared uniformly across traits, with chlorophyll showing the clearest contrasting response. In the natural stand, Q. frainetto consistently exhibited higher chlorophyll content than Q. cerris throughout the growing season, whereas interspecific differences were largely absent in the urban stand, emerging only in September. Leaf thickness showed a different temporal pattern: in the natural stand, the two species differed throughout the growing season, although the direction of the difference reversed after June, whereas in the urban stand a significant interspecific divergence emerged only in September. However, because leaf thickness may partly covary with overall leaf morphology [61], and the two species differ markedly in leaf size, the ecological significance of this interspecific pattern should be interpreted cautiously. Taken together, these trait-specific contrasts are consistent with evidence that interspecific functional differentiation among co-occurring species can vary across environmental contexts [62].
The interspecific contrast is therefore not simply a matter of magnitude, but also of functional composition, with different trait dimensions distinguishing the two species in the urban and natural stands. Accordingly, the urban stand was characterized by more persistent interspecific differences in traits related to leaf construction and biochemical protection, whereas chlorophyll content and leaf thickness represented the more consistently differentiated traits in the natural stand.
The Relative Distance Plasticity Index analysis [63] provided a complementary perspective on these interspecific patterns by quantifying the magnitude of stand-related phenotypic differentiation relative to the random expectation. This differentiation was strongly trait-specific rather than uniformly greater in either species. In both oaks, the highest Relative Distance Plasticity Index values occurred for anthocyanin and flavonol content, but only flavonol content exceeded the random expectation, representing the only stand-related response shared by the two species. Conversely, chlorophyll content was differentiated only in Q. cerris, whereas Specific Leaf Area and Leaf Dry Matter Content were differentiated in Q. frainetto, and leaf thickness was nearly equivalent between species. These patterns indicate that the interspecific contrast lies not in a generally greater responsiveness of one species, but in the functional dimensions through which their responses to the two forest contexts are expressed. These functional patterns alone do not provide complete evidence to infer greater suitability of Q. cerris for urban environments, which would require complementary assessments of growth, survival, and whole-plant performance; nevertheless, they are compatible with the greater tolerance of this species to high temperatures and seasonal water limitation reported in the literature [24,25].
Previous studies have reported a comparatively high sensitivity of Q. frainetto to severe summer drought, particularly with respect to leaf water status and hydraulic functioning [22,64]. As a ring-porous oak, the species relies on the formation of new earlywood vessels each spring, which may increase vulnerability to early-season drought events affecting hydraulic conductivity [64]. Although Q. frainetto and Q. cerris commonly coexist across sub-Mediterranean forests, their contrasting physiological sensitivities provide a plausible framework for interpreting the more persistent interspecific differentiation in structural and biochemical traits observed in the urban stand, where the environmental data indicated comparatively warmer and seasonally drier conditions.
However, because hydraulic traits were not directly assessed in this study, the proposed link between species-specific hydraulic sensitivity and the observed functional patterns should be regarded as a plausible mechanistic interpretation rather than as a process demonstrated by the present data.
Overall, the interspecific comparison suggests that Q. cerris expresses a functional profile more consistent with tolerance to urban environmental conditions than Q. frainetto, combining relatively high leaf area per unit biomass with greater dry-matter investment [55,56,60] and enhanced flavonol accumulation [57,58]. This combination may allow the species to maintain resource-acquisitive potential while simultaneously reinforcing structural and photoprotective functions.
This study benefits from a matched-site design in which the urban and natural stands originated from the same woodland, thereby reducing potential confounding associated with differences in forest history and broad site context. Nevertheless, only one urban and one natural forest stand were investigated during a single growing season, so stand identity and environmental context, including differences in soil pH and stand structure, cannot be fully disentangled and the generality of the observed patterns remains limited. Additional studies across multiple urban–natural stand pairs, growing seasons and including performance measures such as growth, water status, damage and survival are needed to determine whether similar functional responses occur across Mediterranean environments and translate into differences in species performance.
In the context of rapid urban expansion, trees are increasingly recognized as critical components of urban infrastructure [33,65,66]. Native species are often regarded as valuable elements of urban green infrastructure and a better understanding of their functional responses can help clarify their suitability for different urban contexts. More broadly, the use of native tree species consistent with the potential natural vegetation (PNV) is widely advocated in urban reforestation and afforestation initiatives [67,68,69,70].
4. Materials and Methods
4.1. Study Area and Stand Characteristics
The study area is located within the Mediterranean biogeographic region [71], in the municipality of Campobasso (Molise Region, southern Italy; Figure 6).
Figure 6.
Geographic framework of the study area. The location in the Italian peninsula and the boundaries of the municipality of Campobasso (Molise Region, southern Italy) are shown in the left part of the panel. The detailed pictures of the Natural forest (NF) and Urban forest (UF) stands are shown in the right part of the panel.
The urban (UF) and the natural (NF) forest stands were selected within the National Biodiversity Future Center (NBFC) research framework as representative of contrasting levels of urbanization along a gradient of fragmentation and green cover [36,72,73]. The urban forest (UF), located about 4 km east of the natural forest (NF), was originally contiguous with it and has gradually become isolated due to agricultural expansion and urban development; despite this, the two forest stands share comparable characteristics in terms of forest composition, slope and altitude.
The macro-bioclimate of the study area can be defined as temperate oceanic/sub-Mediterranean, characterized by a mean annual temperature of 13.3 °C, coldest-month averages between −1 °C and 4 °C, two months exceeding 20 °C, and a mean annual precipitation of 806 mm [71,74,75]. The dominant lithologies include sandstones and conglomerates [76] with slopes around 10° for both the stands (Table 1).
Land use is characterized by the presence of a relatively compact urban core, which is incorporated into a larger agricultural matrix moving toward the periphery. The surrounding landscape is dominated by cultivated land interspersed with large areas of forest cover [77]. Moreover, the Natural forest is designated as a Special Area of Conservation (SAC) IT7222295, “Monte Vairano,” under the Habitats Directive (92/43/EEC) [78].
4.2. Sampling Protocol
Before the leaf measurements, both stands were characterized through phytosociological relevés [79], to describe the composition of the two oak communities and to obtain independent information on their site conditions. Species and syntaxa nomenclature followed Bartolucci et al. [80] and Biondi et al. [81], respectively. Ecological Indicator Values for Europe (EIVE 1.0) [82] were applied to the relevé matrix to calculate the cover-weighted mean response of each community to light, temperature, soil moisture, soil reaction and nitrogen, using the cover-abundance percentage values of the Braun-Blanquet scale [83]. The relevés and the resulting indicator values were reported in [26] and summarized in Table S3. Both stands were assigned to the association Roso arvensis-Quercetum cerridis Ubaldi 2003 [31] (alliance Crataego laevigatae-Quercion cerridis Arrigoni 1997; order Fagetalia sylvaticae Pawłowski in Pawłowski, Sokołowski et Wallish 1928; class Carpino-Fagetea Jakucs ex Passarge 1968).
After the characterization, in each forest a one-hectare circular stand was established, maintaining a 25 m buffer from the edge. Fourteen trees per stand (seven Quercus cerris and seven Quercus frainetto individuals) were randomly selected from the upper canopy layer (approximately 20 m height), with a minimum distance of 20 m between individuals and marked for seasonal resampling. From each tree, ten fully expanded leaves were collected from different crown exposures. Sampled twigs were stored in humidified airtight bags and processed immediately. We conducted the in-field sampling simultaneously for both species in 2023, on the same days and under the same weather conditions, during three campaigns corresponding to early summer (June), peak summer (July), and early autumn (September). The sampling followed the standardized protocol described by Quaranta et al. [26], where the Q. cerris dataset was published as a single-species assessment; while Q. frainetto dataset and the interspecific comparison are presented here. Nine leaf functional traits were measured to characterize key aspects of leaf structure, resource allocation, and biochemical composition (Table 2).
Table 2.
List of measured variables: stand structure, in-field and laboratory leaf functional traits. A description and the unit of measurement are provided for each trait.
Leaf area index (LAI) was measured using an AccuPAR LP-80 ceptometer (METER Group, Munich, Germany). LAI represents the total one-sided leaf area per unit ground surface area and provides an estimate of canopy leaf layering [84]. Fresh weight (FW) was measured immediately after sampling using a portable balance (Kern 300 EMS, KERN & SOHN GmbH, Balingen, Germany; precision ± 0.001 g) to ensure fully hydrated leaf tissue [85,86]. Chlorophyll (CHL), anthocyanin (ANTH), and flavonol (FLV) contents were measured non-destructively using a Multi-Pigment Meter MPM-100 (ADC BioScientific Ltd., Hoddesdon, UK) [87,88,89]. Measurements were taken at three standardized positions per leaf (base, centre, and apex), always on the same half leaf surface, and averaged to obtain a representative lamina value. CHL is widely related to photosynthetic capacity and leaf nitrogen status, whereas ANTH and FLV are associated with stress responses, with ANTH related to low temperature and senescence; and FLV indicates exposure to high radiation and/or nutrient limitation [57,59,90,91,92,93,94,95,96,97,98,99]. Leaf thickness (LTH) was measured on fresh leaves using a Neoteck portable digital thickness gauge (Neoteck Technology Ltd., Hong Kong, China) [100]. Measurements were taken at three standardized positions per leaf (base, centre, and apex), always on the same half leaf surface, and averaged to obtain a representative lamina value. Leaf thickness reflects structural investment and water storage capacity [101,102,103]. Leaf area (LA) was calculated by scanning fresh leaves with an Epson GT15000 scanner (Epson Europe Electronics GmbH, Munich, Germany). Leaf area was quantified from scanned images using ImageJ software (version 2.1.0/1.53c) [104]. Dry weight (DW) was determined after oven-drying leaves at 70 °C to constant mass [86,105]. Specific leaf area (SLA) was calculated as the ratio of leaf area to dry mass and is widely interpreted as an indicator of light capture efficiency per unit of biomass, reflecting differences in resource-use strategies [55,85,105,106,107,108,109,110,111,112,113,114]. Leaf dry matter content (LDMC) was calculated as the ratio of dry weight to fresh weight and provides an indicator of leaf tissue density and water content [55,60,61,105,107,108,110]. All traits were measured following standardized plant functional trait protocols [85,86,105,115].
Environmental variables, including land surface temperature (LST), precipitation (PPT), soil moisture (SMOI), and actual evapotranspiration (ACTEVP), were obtained from the Climate Engine platform (https://app.climateengine.org/climateEngine; accessed on 1 August 2025). Spatial resolution, sensor specifications and mean values for these datasets are detailed in Quaranta et al. [26] and reported in Supplementary File (Tables S4 and S5). For each stand, mean values were computed over the two-month period preceding each sampling campaign: April–May for the June sampling, May–June for the July sampling, and July–August for the September sampling. This integration window was chosen because leaf functional traits, particularly structural traits such as SLA and LDMC, reflect cumulative responses to environmental conditions rather than instantaneous measurements, and a two-month integration period is consistent with the timescale over which leaf differentiation and acclimation occur in deciduous oaks under Mediterranean climate conditions.
4.3. Statistical Analysis
We conducted all the statistical analyses on a dataset formed from the in-field and laboratory measurements for Quercus cerris [26] and Quercus frainetto. A Pearson’s correlation coefficient (r) was calculated on the Q. frainetto dataset to evaluate linear relationships among functional traits and climatic variables, using PAST software (version 4.17) [116]. Correlation analysis was conducted on the complete dataset, including 11 variables across the two forest stands (NF and UF) and the three sampling periods, and was subsequently repeated separately for each stand (Figures S1 and S2). Correlation strength was interpreted according to the following thresholds: |r| < 0.1, no correlation; 0.1 ≤ |r| < 0.3, low correlation; 0.3 ≤ |r| < 0.5, moderate correlation; 0.5 ≤ |r| < 0.7, high correlation; and |r| ≥ 0.7, very high correlation [117].
To investigate multivariate patterns of trait variation in Q. frainetto, a principal component analysis (PCA) was performed using PAST 4.17; the analysis was based on the correlation matrix to standardize variables measured in different units.
The intraspecific variation in Q. frainetto across the six leaf traits (SLA, LDMC, LTH, CHL, FLV, and ANTH) between the Urban (UF) and Natural (NF) stands and across the sampled months was first examined through a two-way ANOVA followed by Tukey’s HSD test (stats [118]; rstatix). Considering that the ten sampled leaves represent repeated measurements within the same tree and are therefore not independent, the ‘stand × month’ comparisons were analysed using linear mixed-effects models (LMM; lme4 [119], lmerTest [120]) (Figure S3). In these models, the individual tree was treated as the experimental unit, with tree identity included as a random intercept, while stand, month, and their interaction were fitted as fixed effects. Pairwise comparisons among stand × month combinations were obtained from the estimated marginal means and summarized as compact letter displays, with p-values adjusted for multiple comparisons using the Šidák method (emmeans [121]). Model assumptions were assessed by visual inspection of residual and random-effect quantile–quantile plots, which showed no severe departures from normality (Figure S4).
Interspecific differences in leaf traits were tested in R (version 4.5.1; R Core Team) using linear mixed-effects models (LMM) fitted with species, month, and habitat (and their interactions) as fixed effects, and tree identity included as a random intercept to account for repeated measurements (lme4 [119]; lmerTest [120]). Model-based estimated marginal means (EMMs) and 95% confidence intervals were computed and Q. cerris versus Q. frainetto pairwise contrasts were performed within each month × habitat combination (emmeans [121]). Data handling and visualization were carried out with the tidyverse [122] and ggplot2 [123] packages.
Stand-related phenotypic differentiation between UF and NF was quantified using the Relative Distance Plasticity Index (RDPI) [63]. Trait values were first averaged within each individual across the three sampling months and, separately, within each sampling month. For each species and trait, RDPI was then calculated as the mean relative distance across all pairwise comparisons between individuals from the UF and NF stands:
Confidence intervals (95%) for RDPI and for the interspecific difference in RDPI (Q. frainetto–Q. cerris) were obtained from 2000 bootstrap resamples of trees within stands (percentile method), and interspecific differences were considered supported when the interval excluded zero. The significance of stand-related differentiation was assessed with a one-sided exact permutation test based on all 3432 allocations of the 14 trees of each species to the two stands, with p-values adjusted within species using the Benjamini–Hochberg procedure, separately for whole-season and monthly values. Stand-related differentiation was expressed as the percentage by which the observed RDPI exceeded the random expectation, defined as the median RDPI across allocations.
5. Conclusions
This study showed that the seasonal functional response of Quercus frainetto is expressed through coordinated changes in structural and biochemical leaf traits, with declining SLA and increasing LDMC and flavonol content, indicating a progressive shift towards a more conservative leaf economy over the growing season. The comparison with the co-dominant Quercus cerris revealed that the two species differ not simply in the magnitude of their responses, but also in the functional dimensions through which these responses are expressed. RDPI further confirmed this trait-specific pattern: flavonol content was the only trait differentiated between stands in both species, whereas chlorophyll content was differentiated only in Q. cerris, and Specific Leaf Area and Leaf Dry Matter Content only in Q. frainetto. Despite the differentiation of structural traits in Q. frainetto, the functional profile expressed by Q. cerris under urban conditions, combining relatively high leaf area per unit biomass with greater dry-matter investment and flavonol accumulation, was more consistent with tolerance to the warmer and seasonally drier conditions characterizing the urban stand. Overall, these findings suggest that integrating structural and biochemical leaf traits provides an informative assessment of species-specific responses to urbanization. Within this framework, Q. cerris emerges as a promising candidate for urban green spaces in the Mediterranean area, although its suitability needs to be validated across multiple sites and growing seasons and with performance measures such as growth and survival.
Supplementary Materials
The following supporting information can be downloaded at: https://www.mdpi.com/article/10.3390/stresses6040089/s1, Table S1: Mean values (±standard deviation) of the leaf functional traits of Quercus cerris and Quercus frainetto in the natural (NF) and urban (UF) forest stands across the three sampling months; Table S2: Fixed-effect results of the linear mixed-effects models fitted to the six leaf functional traits of Quercus frainetto (trait ~ Stand × Month + (1|Tree)). NumDF and DenDF are the numerator and denominator degrees of freedom (Satterthwaite approximation); Table S3: Phytosociological relevés of the sampling stands. EIVE 1.0 indicator values for niche position of L (light), T (temperature), M (moisture), R (reaction), and N (nitrogen availability) from Dengler et al. [82] for the 64 taxa. Adapted from Quaranta et al. [26]; Table S4: Source and characteristics of the satellite-derived environmental variables used to characterize the study stands. Adapted from Quaranta et al. [26]; Table S5: Climatic data (soil moisture, land surface temperature, precipitation, and actual evapotranspiration) for the natural (NF) and urban (UF) forest stands across the considered periods. A-M: April–May 2023; J-J: June–July 2023; J-A: July–August 2023. Adapted from Quaranta et al. [26]; Table S6: Relative Distance Plasticity Index (RDPI) between Urban (UF) and Natural (NF) forest stands for six leaf traits of Quercus cerris and Quercus frainetto, by sampling month and over the whole season, calculated on tree means (n = 7 trees per stand). 95% CI: bootstrap percentile confidence interval (2000 resamples of trees within stands). Within-stand RDPI: mean relative distance among trees of the same stand. Random expectation: median RDPI across all 3432 allocations of the 14 trees between stands, with 5th–95th percentiles in brackets. Excess: percentage by which RDPI exceeds the random expectation. p: one-sided exact permutation test; p adj: Benjamini–Hochberg adjustment within species, separately for monthly (18 tests) and whole-season; Table S7: Interspecific difference in the Relative Distance Plasticity Index (RDPI; Q. frainetto − Q. cerris) for six leaf traits, by sampling month and over the whole season. Figure S1: Pearson’s correlation matrix of the Quercus frainetto dataset for the Urban forest (UF) stand; Figure S2: Pearson’s correlation matrix of the Quercus frainetto dataset for the Natural forest (NF) stand; Figure S3: Within-species comparison of leaf functional traits of Quercus frainetto between the urban (UF) and natural (NF) forest stands within each sampling month, estimated through linear mixed-effects models (LMM) with tree identity as a random effect; Figure S4: Model diagnostic plots used to assess normality and homoscedasticity of the linear mixed-effects models for each leaf functional trait.
Author Contributions
Conceptualization, P.F. and L.Q.; methodology, P.D.M., P.F. and L.Q.; software, L.Q., and P.D.M.; validation, L.Q., P.D.M., T.H., and P.F.; formal analysis, L.Q., P.D.M., T.H. and P.F.; investigation, L.Q., P.F. and F.C.; resources, P.F. and L.Q.; data curation, L.Q. and P.D.M.; writing—original draft preparation, L.Q. and P.F.; writing—review and editing, L.Q., P.D.M., P.F., T.H. and F.C.; supervision, P.F.; funding acquisition, P.F. and P.D.M. All authors have read and agreed to the published version of the manuscript.
Funding
This study was partially supported by: (a) MUR PRIN 2022, project code: 2022B3HA72 (PI. R. Di Pietro, UO P. Fortini) CUP B53D23011890006. (b) the National Recovery and Resilience Plan (NRRP), Mission 4 Component 2: Investment 1.4, Call for tender No. 3138 of 16 December 2021, rectified by Decree n.3175 of 18 December 2021 of the Italian Ministry of University and Research; Award Number: project code CN_00000033, Concession Decree No. 1034 of 17 June 2022 adopted by the Italian Ministry of University and Research, Project funded by the European Union “NextGenerationEU NBFC”; R. Di Pietro: CUP B83C22002950007; P. Fortini and P. Di Marzio CUP H73C22000300001; project title “National Biodiversity Future Center”.
Institutional Review Board Statement
Not applicable.
Informed Consent Statement
Not applicable.
Data Availability Statement
Data are contained within the article and Supplementary Materials. Further inquiries can be directed to the corresponding authors.
Acknowledgments
We sincerely thank Immacolata Doganieri and Sandra Ciccone for their support with the administration of the funding and procurement management.
Conflicts of Interest
The authors declare no conflicts of interest.
References
- UNEP/MAP; Plan Bleu. State of the Environment and Development in the Mediterranean; UNEP/MAP and Plan Bleu: Nairobi, Kenya, 2020; Available online: https://www.unep.org/unepmap/resources/2020-edition-state-environment-and-development-mediterranean-soed (accessed on 20 October 2026).
- Güneralp, B.; McDonald, R.I.; Fragkias, M.; Goodness, J.; Marcotullio, P.J.; Seto, K.C. Urbanization Forecasts, Effects on Land Use, Biodiversity, and Ecosystem Services. In Urbanization, Biodiversity and Ecosystem Services: Challenges and Opportunities: A Global Assessment; Elmqvist, T., Fragkias, M., Goodness, J., Güneralp, B., Marcotullio, P.J., McDonald, R.I., Parnell, S., Schewenius, M., Sendstad, M., Seto, K.C., et al., Eds.; Springer: Dordrecht, The Netherlands, 2013; pp. 437–452. [Google Scholar] [CrossRef] [Scilit]
- FAO; Plan Bleu. State of Mediterranean Forests 2018; Food and Agriculture Organization of the United Nations: Rome, Italy; Plan Bleu: Marseille, France, 2018. [Google Scholar]
- Mauri, A.; Enescu, C.; Durrant, T.; de Rigo, D.; Caudullo, G. Quercus frainetto in Europe: Distribution, Habitat, Usage and Threats. In European Atlas of Forest Tree Species; Publications Office of the European Union: Luxembourg, 2016; p. e01de78+. [Google Scholar]
- van Vliet, J. Direct and Indirect Loss of Natural Area from Urban Expansion. Nat. Sustain. 2019, 2, 755–763. [Google Scholar] [CrossRef] [Scilit]
- Livesley, S.J.; Escobedo, F.J.; Morgenroth, J. The Biodiversity of Urban and Peri-Urban Forests and the Diverse Ecosystem Services They Provide as Socio-Ecological Systems. Forests 2016, 7, 291. [Google Scholar] [CrossRef] [Scilit]
- Endreny, T.A. Strategically Growing the Urban Forest Will Improve Our World. Nat. Commun. 2018, 9, 1160. [Google Scholar] [CrossRef] [Scilit] [PubMed]
- O’Brien, L.E.; Urbanek, R.E.; Gregory, J.D. Ecological Functions and Human Benefits of Urban Forests. Urban For. Urban Green. 2022, 75, 127707. [Google Scholar] [CrossRef] [Scilit]
- Frigerio, J.; Capotorti, G.; Del Vico, E.; Ouled Larbi, M.; Grassi, F.; Blasi, C.; Labra, M.; Guidi Nissim, W. Tree Tracking: Species Selection and Traceability for Sustainable and Biodiversity-Friendly Urban Reforestation. Plant Biosyst.-Int. J. Deal. Asp. Plant Biol. 2023, 157, 920–934. [Google Scholar] [CrossRef] [Scilit]
- Blasi, C.; Capotorti, G.; Del Vico, E.; Bonacquisti, S.; Zavattero, L. Native Flora and Potential Natural Vegetation References for Effective Forest Restoration in Italian Urban Systems. Plants 2025, 14, 2396. [Google Scholar] [CrossRef] [Scilit] [PubMed]
- Horvat, I.; Glavač, V.; Ellenberg, H. Vegetation Südosteuropas; Gustav Fischer Verlag: Stuttgart, Germany, 1974. [Google Scholar]
- Mucina, L.; Bültmann, H.; Dierßen, K.; Theurillat, J.-P.; Raus, T.; Čarni, A.; Šumberová, K.; Willner, W.; Dengler, J.; García, R.G.; et al. Vegetation of Europe: Hierarchical Floristic Classification System of Vascular Plant, Bryophyte, Lichen, and Algal Communities. Appl. Veg. Sci. 2016, 19, 3–264. [Google Scholar] [CrossRef] [Scilit]
- Pignatti, S.; Guarino, R.; La Rosa, M. Flora d’italia, 2nd ed.; Edagricole: Bologna, Italy, 2017; Volume 1–4. [Google Scholar]
- Pignatti, S. Flora d’Italia; Edagricole: Bologna, Italy, 1982. [Google Scholar]
- Abbate, G.; Blasi, C.; Paura, B.; Scoppola, A.; Spada, F. Phytoclimatic Characterization of Quercus frainetto Ten. Stands in Peninsular Italy. Vegetatio 1990, 90, 35–45. [Google Scholar] [CrossRef] [Scilit]
- Rivas-Martínez, S.; Penas, A.; Díaz, T.E. Bioclimatic and Biogeographic Maps of Europe; University of León: León, Spain, 2004. [Google Scholar]
- Bohn, U.; Gollub, G.; Hettwer, C. Map of the Natural Vegetation of Europe; Federal Agency for Nature Conservation: Bonn, Germany, 2003.
- Plants of the World Online | Kew Science. Available online: https://powo.science.kew.org/ (accessed on 7 April 2026).
- Iliev, I.; Dakov, A. Country Report: Bulgaria. In IPGRI Mediterranean Oaks Network: Report of the 2nd Meeting, Gozo, Malta; Bozzano, M., Turok, J., Eds.; International Plant Genetic Resources Institute: Rome, Italy, 2003; pp. 28–31. [Google Scholar]
- Koynarliyska, S. Seasonal Changes of Antioxidative Enzymes in Leaves of Quercus cerris L. and Quercus frainetto Ten. forests. Silva Balc. 2008, 9, 67–76. [Google Scholar]
- Wolkerstorfer, S.V.; Wonisch, A.; Stankova, T.; Tsvetkova, N.; Tausz, M. Seasonal Variations of Gas Exchange, Photosynthetic Pigments, and Antioxidants in Turkey Oak (Quercus cerris L.) and Hungarian Oak (Quercus frainetto Ten.) of Different Age. Trees 2011, 25, 1043–1052. [Google Scholar] [CrossRef] [Scilit]
- Koynarliyska, S.; Tzvetkova, N. Investigations on the Water Regime of Turkey Oak (Quercus cerris L.) and Hungarian Oak (Quercus frainetto Ten.). In Proceedings of the First National Conference on Ecology: Biodiversity, Ecosystems, Global Changes, Sofia, Bulgaria, 4–5 November 2004; pp. 155–159. [Google Scholar]
- Koynarliyska, S. Seasonal Changes in Proline Accumulation at 15-, 35- and 140-Year Old Trees from Turkey Oak (Q. cerris L.) and Hungarian Oak (Q. frainetto Ten). For. Sci. 2007, 44, 55–66. [Google Scholar]
- De Rigo, D.; Enescu, C.M.; Houston Durrant, T.; Caudullo, G. Quercus cerris in Europe: Distribution, Habitat, Usage and Threats. In European Atlas of Forest Tree Species; San-Miguel-Ayanz, J., de Rigo, D., Caudullo, G., Houston Durrant, T., Mauri, A., Eds.; Publications Office of the European Union: Luxembourg, 2016; pp. 148–149. [Google Scholar]
- Najib, R.; Houri, T.; Khairallah, Y.; Khalil, M. Quercus cerris L.: An Overview. For. Stud. 2021, 74, 1–9. [Google Scholar] [CrossRef] [Scilit]
- Quaranta, L.; Di Marzio, P.; Fortini, P. Quercus cerris Leaf Functional Traits to Assess Urban Forest Health Status for Expeditious Analysis in a Mediterranean European Context. Plants 2025, 14, 285. [Google Scholar] [CrossRef] [Scilit] [PubMed]
- Quaranta, L.; Di Marzio, P.; Di Pietro, R.; Ferretti, F.; Di Salvatore, U.; Fortini, P. Analysis of the Functional Traits of Quercus cerris L. Seedlings in the Molise Region (Southern Italy). Plant Sociol. 2022, 59, 11–24. [Google Scholar] [CrossRef] [Scilit] [PubMed]
- Blasi, C.; Stanisci, A.; Filesi, L.; Milanese, A.; Perinelli, E.; Riggio, L. Syndinamics of Lowland Quercus frainetto & Quercus cerris Forests in Lazio (Central Italy). Fitosociologia 2002, 39, 23–43. [Google Scholar]
- Di Pietro, R.; Tondi, G. A New Mesophilous Turkey-Oak Woodland Association from Laga Mts. (Central Italy). Hacquetia 2005, 4, 5–25. [Google Scholar]
- Apostol, E.N.; Stuparu, E.; Scarlatescu, V.; Budeanu, M. Testing Hungarian Oak (Quercus frainetto Ten.) Provenances in Romania. iForest-Biogeosci. For. 2020, 13, 9. [Google Scholar] [CrossRef] [Scilit]
- Terzi, M.; Ciaschetti, G.; Fortini, P.; Rosati, L.; Viciani, D.; Di Pietro, R. A Revised Phytosociological Nomenclature for the Italian “Quercus cerris” Woods. Mediterr. Bot. 2020, 41, 101–120. Available online: https://revistas.ucm.es/index.php/MBOT/article/view/65052 (accessed on 26 October 2026).
- Esperon-Rodriguez, M.; Tjoelker, M.G.; Lenoir, J.; Baumgartner, J.B.; Beaumont, L.J.; Nipperess, D.A.; Power, S.A.; Richard, B.; Rymer, P.D.; Gallagher, R.V. Climate Change Increases Global Risk to Urban Forests. Nat. Clim. Change 2022, 12, 950–955. [Google Scholar] [CrossRef] [Scilit]
- Bratu, I.; Dinca, L.; Constandache, C.; Murariu, G. Resilience and Decline: The Impact of Climatic Variability on Temperate Oak Forests. Climate 2025, 13, 119. [Google Scholar] [CrossRef] [Scilit]
- Esperon-Rodriguez, M.; Arndt, S.; Asibey, M.O.; Augustinus, B.A.; Bach, A.; Ballinas, M.; Barradas, V.L.; Barton, D.N.; Bauhus, J.; Beaumont, L.; et al. Urban Forests as Essential Infrastructure for Climate Resilience and Biodiversity: A Call to Policymakers. Plants People Planet 2026, 8, 14–19. [Google Scholar] [CrossRef] [Scilit]
- Tamene, G.; Sjöman, H.; Ode Sang, Å.; Yeshitla, K.; Belay, B.; Tesfaye, E.; Levinsson, A. A Functional Trait-Based Assessment of Urban Street Tree Selection for Ethiopia. Front. Sustain. Cities 2024, 6, 1451930. [Google Scholar] [CrossRef] [Scilit]
- Sjöman, H.; Busse Nielsen, A. Selecting Trees for Urban Paved Sites in Scandinavia—A Review of Information on Stress Tolerance and Its Relation to the Requirements of Tree Planners. Urban For. Urban Green. 2010, 9, 281–293. [Google Scholar] [CrossRef] [Scilit]
- Esperon-Rodriguez, M.; Rymer, P.D.; Power, S.A.; Challis, A.; Marchin, R.M.; Tjoelker, M.G. Functional Adaptations and Trait Plasticity of Urban Trees along a Climatic Gradient. Urban For. Urban Green. 2020, 54, 126771. [Google Scholar] [CrossRef] [Scilit]
- Esperon-Rodriguez, M.; Ordoñez, C.; van Doorn, N.S.; Hirons, A.; Messier, C. Using Climate Analogues and Vulnerability Metrics to Inform Urban Tree Species Selection in a Changing Climate: The Case for Canadian Cities. Landsc. Urban Plan. 2022, 228, 104578. [Google Scholar] [CrossRef] [Scilit]
- Fortini, P.; Antonecchia, G.; Di Marzio, P.; Maiuro, L.; Viscosi, V. Role of Micromorphological Leaf Traits and Molecular Data in Taxonomy of Three Sympatric White Oak Species and Their Hybrids (Quercus L.). Plant Biosyst.-Int. J. Deal. Asp. Plant Biol. 2015, 149, 546–558. [Google Scholar] [CrossRef] [Scilit]
- Fortini, P.; Di Marzio, P.; Di Pietro, R. Differentiation and Hybridization of Quercus frainetto, Q. petraea, and Q. pubescens (Fagaceae): Insights from Macro-Morphological Leaf Traits and Molecular Data. Plant Syst. Evol. 2015, 301, 375–385. [Google Scholar] [CrossRef] [Scilit]
- Di Pietro, R.; Di Marzio, P.; Medagli, P.; Misano, G.; Silletti, G.N.; Wagensommer, R.P.; Fortini, P. Evidence from Multivariate Morphometric Study of the Quercus pubescens Complex in Southeast Italy. Bot. Serbica 2016, 40, 83–100. [Google Scholar]
- Conte, A.L.; Di Pietro, R.; Iamonico, D.; Di Marzio, P.; Cillis, G.; Lucia, D.; Fortini, P. Oak Decline in the Mediterranean Basin: A Study Case from the Southern Apennines (Italy). Plant Sociol. 2019, 56, 69–80. [Google Scholar] [CrossRef] [Scilit] [PubMed]
- Conte, A.L.; Di Pietro, R.; Di Marzio, P.; Strumia, S.; Cillis, G.; Capuano, A.; Fortini, P. Oak Decline in Southern Italy: Environmental and Climate Parameters for Modelling Purposes. Veg. Ecol. Divers. 2025, 62, e160170. [Google Scholar] [CrossRef] [Scilit]
- Di Pietro, R.; Conte, A.L.; Di Marzio, P.; Gianguzzi, L.; Spampinato, G.; Caldarella, O.; Fortini, P. A Multivariate Morphometric Analysis of Diagnostic Traits in Southern Italy and Sicily Pubescent Oaks. Folia Geobot. 2020, 55, 163–183. [Google Scholar] [CrossRef] [Scilit]
- Di Pietro, R.; Di Marzio, P.; Antonecchia, G.; Conte, A.L.; Fortini, P. Preliminary Characterization of the Quercus pubescens Complex in Southern Italy Using Molecular Markers. Acta Bot. Croat. 2020, 79, 15–25. [Google Scholar] [CrossRef] [Scilit]
- Di Pietro, R.; Conte, A.L.; Di Marzio, P.; Fortini, P.; Farris, E.; Gianguzzi, L.; Müller, M.; Rosati, L.; Spampinato, G.; Gailing, O. Does the Genetic Diversity among Pubescent White Oaks in Southern Italy, Sicily and Sardinia Islands Support the Current Taxonomic Classification? Eur. J. For. Res. 2021, 140, 355–371. [Google Scholar] [CrossRef] [Scilit]
- Di Pietro, R.; Quaranta, L.; Mattioni, C.; Simeone, M.C.; Di Marzio, P.; Proietti, E.; Fortini, P. Chloroplast Haplotype Diversity in the White Oak Populations of the Italian Peninsula, Sicily, and Sardinia. Forests 2024, 15, 864. [Google Scholar] [CrossRef] [Scilit]
- Fortini, P.; Proietti, E.; Stojnic, S.; Di Marzio, P.; Aravanopoulos, F.A.; Benavides, R.; Loy, A.; Di Pietro, R. First Results of a Geometric Morphometric Analysis of the Leaf Size and Shape Variation in Quercus petraea Across a Wide European Area. Forests 2025, 16, 70. [Google Scholar] [CrossRef] [Scilit]
- Gillini, A.; Bilyera, N.; Sferra, G.; Bucci, A.; Monaco, P.; Loginova, I.; Dippold, M.A.; Naclerio, G.; Scippa, G.S.; Trupiano, D. Insights into Plant-Microbe Interactions in Urban Rhizosphere: Feedback from Quercus Cerris L. Root Morphology, Soil Zymography, and Microbial Community Composition in Rhizobox System. J. Plant Interact. 2025, 20, 2554974. [Google Scholar] [CrossRef] [Scilit]
- Sferra, G.; Montagnoli, A.; Bucci, A.; Monaco, P.; Agosto, G.; Trupiano, D.; Naclerio, G.; Chiatante, D.; Scippa, G.S. An Integrated Perspective on the Interactions between Quercus Cerris Fine Roots and Microbial Community in Top- and Sub-Layers of Urban Rhizosphere. Plant Biosyst.-Int. J. Deal. Asp. Plant Biol. 2025, 159, 1630–1648. [Google Scholar] [CrossRef] [Scilit]
- Gillini, A.; Monaco, P.; Sferra, G.; Bucci, A.; Scippa, G.S.; Naclerio, G.; Trupiano, D. Short-Term Effects of Biochar Amendment on Root–Microbe Interactions in Natural and Peri-Urban Soils. Sci. Rep. 2026, 16, 16769. [Google Scholar] [CrossRef] [Scilit] [PubMed]
- Fantozzi, D.; Sferra, G.; Trupiano, D.; Scippa, G.S. Design and Application of Species-Specific Primers to Quercus Cerris Roots’ Identification in Urban Forests. Sci. Rep. 2025, 15, 32298. [Google Scholar] [CrossRef] [Scilit] [PubMed]
- Arnfield, A.J. Two Decades of Urban Climate Research: A Review of Turbulence, Exchanges of Energy and Water, and the Urban Heat Island. Int. J. Climatol. 2003, 23, 1–26. [Google Scholar] [CrossRef] [Scilit]
- Oke, T.R. The Energetic Basis of the Urban Heat Island. Q. J. R. Meteorol. Soc. 1982, 108, 1–24. [Google Scholar] [CrossRef] [Scilit]
- Wright, I.J.; Reich, P.B.; Westoby, M.; Ackerly, D.D.; Baruch, Z.; Bongers, F.; Cavender-Bares, J.; Chapin, T.; Cornelissen, J.H.C.; Diemer, M.; et al. The Worldwide Leaf Economics Spectrum. Nature 2004, 428, 821–827. [Google Scholar] [CrossRef] [Scilit] [PubMed]
- Reich, P.B. The World-Wide ‘Fast–Slow’ Plant Economics Spectrum: A Traits Manifesto. J. Ecol. 2014, 102, 275–301. [Google Scholar] [CrossRef] [Scilit]
- Laoué, J.; Fernandez, C.; Ormeño, E. Plant Flavonoids in Mediterranean Species: A Focus on Flavonols as Protective Metabolites under Climate Stress. Plants 2022, 11, 172. [Google Scholar] [CrossRef] [Scilit] [PubMed]
- Agati, G.; Brunetti, C.; Di Ferdinando, M.; Ferrini, F.; Pollastri, S.; Tattini, M. Functional Roles of Flavonoids in Photoprotection: New Evidence, Lessons from the Past. Plant Physiol. Biochem. 2013, 72, 35–45. [Google Scholar] [CrossRef] [Scilit] [PubMed]
- Li, Y.; He, N.; Hou, J.; Xu, L.; Liu, C.; Zhang, J.; Wang, Q.; Zhang, X.; Wu, X. Factors Influencing Leaf Chlorophyll Content in Natural Forests at the Biome Scale. Front. Ecol. Evol. 2018, 6, 64. [Google Scholar] [CrossRef] [Scilit]
- Wilson, P.J.; Thompson, K.; Hodgson, J.G. Specific Leaf Area and Leaf Dry Matter Content as Alternative Predictors of Plant Strategies. New Phytol. 1999, 143, 155–162. [Google Scholar] [CrossRef] [Scilit]
- Vile, D.; Garnier, É.; Shipley, B.; Laurent, G.; Navas, M.-L.; Roumet, C.; Lavorel, S.; Díaz, S.; Hodgson, J.G.; Lloret, F.; et al. Specific Leaf Area and Dry Matter Content Estimate Thickness in Laminar Leaves. Ann. Bot. 2005, 96, 1129–1136. [Google Scholar] [CrossRef] [Scilit] [PubMed]
- Aronson, M.F.J.; Nilon, C.H.; Lepczyk, C.A.; Parker, T.S.; Warren, P.S.; Cilliers, S.S.; Goddard, M.A.; Hahs, A.K.; Herzog, C.; Katti, M.; et al. Hierarchical Filters Determine Community Assembly of Urban Species Pools. Ecology 2016, 97, 2952–2963. [Google Scholar] [CrossRef] [Scilit] [PubMed]
- Valladares, F.; Sanchez-Gomez, D.; Zavala, M.A. Quantitative Estimation of Phenotypic Plasticity: Bridging the Gap between the Evolutionary Concept and Its Ecological Applications. J. Ecol. 2006, 94, 1103–1116. [Google Scholar] [CrossRef] [Scilit]
- Gentilesca, T.; Camarero, J.J.; Colangelo, M.; Nolè, A.; Ripullone, F. Drought-Induced Oak Decline in the Western Mediterranean Region: An Overview on Current Evidences, Mechanisms and Management Options to Improve Forest Resilience. iForest-Biogeosci. For. 2017, 10, 796. [Google Scholar] [CrossRef] [Scilit]
- Kisvarga, S.; Horotán, K.; Wani, M.A.; Orlóci, L. Plant Responses to Global Climate Change and Urbanization: Implications for Sustainable Urban Landscapes. Horticulturae 2023, 9, 1051. [Google Scholar] [CrossRef] [Scilit]
- Komarolya, D.V.; Maleknia, R. Identifying Indicators of Sustainable Management of Urban Forests: A Qualitative Approach. Trees For. People 2025, 22, 101084. [Google Scholar] [CrossRef] [Scilit]
- Jambhekar, R.; Satish, R.; Sharma, S.; Bakhale, G.; Ranganathan, P.; Naidu, D.G.T.; Deshpande, K.; Krishnaswamy, J. Nature-Based Solutions and Urban Biodiversity Conservation in the Global South. Ecol. Indic. 2026, 183, 114627. [Google Scholar] [CrossRef] [Scilit]
- Kodym, A.; Lapin, K.; Sanyal, D. Ecological Connectivity in Urban and Semi-Urban Forests. In Ecological Connectivity of Forest Ecosystems; Lapin, K., Oettel, J., Braun, M., Konrad, H., Eds.; Springer Nature: Cham, Switzerland, 2025; pp. 365–381. [Google Scholar]
- Levavasseur, G.; Vrac, M.; Roche, D.M.; Paillard, D. Statistical Modelling of a New Global Potential Vegetation Distribution. Environ. Res. Lett. 2012, 7, 044019. [Google Scholar] [CrossRef] [Scilit]
- Bourdouxhe, A.; Wibail, L.; Claessens, H.; Dufrêne, M. Modeling Potential Natural Vegetation: A New Light on an Old Concept to Guide Nature Conservation in Fragmented and Degraded Landscapes. Ecol. Model. 2023, 481, 110382. [Google Scholar] [CrossRef] [Scilit]
- Rivas-Martínez, S.; Sáenz, S.; Penas, A. Worldwide Bioclimatic Classification System. Glob. Geobot. 2011, 1, 1–634. [Google Scholar] [CrossRef]
- Varricchione, M.; Laura Carranza, M.; D’Angeli, C.; Carla de Francesco, M.; Innangi, M.; Santoianni, L.A.; Stanisci, A. Exploring the Distribution Pattern of Native and Alien Forests and Their Woody Species Diversity in a Small Mediterranean City. Plant Biosyst.-Int. J. Deal. Asp. Plant Biol. 2024, 158, 1335–1346. [Google Scholar] [CrossRef] [Scilit]
- Dondina, O.; Tirozzi, P.; Viviano, A.; Mori, E.; Orioli, V.; Tommasi, N.; Tanzi, A.; Bazzoli, L.; Caprio, E.; Patetta, C.; et al. Spatial and Habitat Determinants of Small-Mammal Biodiversity in Urban Green Areas: Lessons for Nature-Based Solutions. Urban For. Urban Green. 2025, 104, 128641. [Google Scholar] [CrossRef] [Scilit]
- European Environment Agency (EU body or agency). Europe’s Environment 2025: Knowledge for Resilience, Prosperity and Sustainability; Publications Office of the European Union: Luxembourg, 2025. [Google Scholar]
- Blasi, C.; Capotorti, G.; Copiz, R.; Guida, D.; Mollo, B.; Smiraglia, D.; Zavattero, L. Classification and Mapping of the Ecoregions of Italy. Plant Biosyst. 2014, 148, 1255–1345. [Google Scholar] [CrossRef] [Scilit]
- Servizio Geologico d’Italia. Carta Geologica d’Italia Alla Scala 1:50.000, F. 405 Campobasso; ISPRA-Servizio Geologico d’Italia: Roma, Italia, 2014. Available online: https://www.openaccessrepository.it/records/211670 (accessed on 26 October 2026).
- Carta della Natura del Comune di Campobasso. Available online: https://www.isprambiente.gov.it/it/servizi/sistema-carta-della-natura/cartografia/carta-della-natura-a-scala-locale/carta-della-natura-del-comune-di-campobasso (accessed on 2 April 2026).
- Council of the European Communities. Council Directive 92/43/EEC of 21 May 1992 on the Conservation of Natural Habitats and of Wild Fauna and Flora; Official Journal of the European Communities: Luxembourg, 1992; Volume L 206, pp. 7–50. [Google Scholar]
- Braun-Blanquet, J. Pflanzensoziologie: Grundzüge der Vegetationskunde, 3rd ed.; neubearb. und wesentlich verm. Aufl.; Springer: New York, NY, USA, 1964. [Google Scholar]
- Bartolucci, F.; Peruzzi, L.; Galasso, G.; Albano, A.; Alessandrini, A.; Ardenghi, N.M.G.; Astuti, G.; Bacchetta, G.; Ballelli, S.; Banfi, E.; et al. An Updated Checklist of the Vascular Flora Native to Italy. Plant Biosyst. 2018, 152, 179–303. [Google Scholar] [CrossRef] [Scilit]
- Biondi, E.; Blasi, C.; Allegrezza, M.; Anzellotti, I.; Azzella, M.M.; Carli, E.; Casavecchia, S.; Copiz, R.; Del Vico, E.; Facioni, L.; et al. Plant Communities of Italy: The Vegetation Prodrome. Plant Biosyst. 2014, 148, 728–814. [Google Scholar] [CrossRef] [Scilit]
- Dengler, J.; Jansen, F.; Chusova, O.; Hüllbusch, E.; Nobis, M.P.; Van Meerbeek, K.; Axmanová, I.; Bruun, H.H.; Chytrý, M.; Guarino, R.; et al. Ecological Indicator Values for Europe (EIVE) 1.0. Veg. Classif. Surv. 2023, 4, 7–29. [Google Scholar] [CrossRef] [Scilit]
- Canullo, R.; Allegrini, M.C.; Campetella, G. Reference Field Manual for Vegetation Surveys on the CONECOFOR LII Network, Italy (National Programme of Forest Ecosystems Control—UNECE, ICP Forests). Braun Blanquetia 2012, 48, 5–65. [Google Scholar]
- Bréda, N.J.J. Ground-based Measurements of Leaf Area Index: A Review of Methods, Instruments and Current Controversies. J. Exp. Bot. 2003, 54, 2403–2417. [Google Scholar] [CrossRef] [Scilit] [PubMed]
- Vendramini, F.; Díaz, S.; Gurvich, D.E.; Wilson, P.J.; Thompson, K.; Hodgson, J.G. Leaf Traits as Indicators of Resource-Use Strategy in Floras with Succulent Species. New Phytol. 2002, 154, 147–157. [Google Scholar] [CrossRef] [Scilit]
- Pérez-Harguindeguy, N.; Díaz, S.; Garnier, E.; Lavorel, S.; Poorter, H.; Jaureguiberry, P.; Bret-Harte, M.S.; Cornwell, W.K.; Craine, J.M.; Gurvich, D.E.; et al. New Handbook for Standardised Measurement of Plant Functional Traits Worldwide. Aust. J. Bot. 2013, 61, 167–234, Correction in Aust. J. Bot. 2016, 64, 715–716. https://doi.org/10.1071/bt12225_co. [Google Scholar] [CrossRef] [Scilit]
- Ali, A.; Santoro, P.; Mori, J.; Ferrante, A.; Cocetta, G. Intermittent UV-B Irradiation Optimizes Secondary Metabolite Production and Growth in Red Rubin Basil. Theor. Exp. Plant Physiol. 2025, 37, 23. [Google Scholar] [CrossRef] [Scilit]
- Rakhmetov, D.; Bondarchuk, O.; Rakhmetova, S.; Blume, Y.; Blume, R.; Kutsokon, N.; Rashydov, N. Physiological State of Brassica carinata Plants Depending on the Genotype Characteristics and Phase of Plant Development in the Conditions of Kyiv; CEP USM: Chișinău, Moldova, 2024. [Google Scholar]
- Ali, A.; Santoro, P.; Mori, J.; Ferrante, A.; Cocetta, G. Effect of UV-B Elicitation on Spearmint’s (Mentha spicata L.) Morpho-Physiological Traits and Secondary Metabolites Production. Plant Growth Regul. 2024, 104, 63–76. [Google Scholar] [CrossRef] [Scilit]
- Gratani, L.; Pesoli, P.; Crescente, M.F. Relationship between Photosynthetic Activity and Chlorophyll Content in an Isolated Quercus ilex L. Tree during the Year. Photosynthetica 1998, 35, 445–451. [Google Scholar] [CrossRef] [Scilit]
- Buttery, B.R.; Buzzell, R.I. The Relationship between Chlorophyll Content and Rate of Photosynthesis in Soybeans. Can. J. Plant Sci. 1977, 57, 1–5. [Google Scholar] [CrossRef] [Scilit]
- Gitelson, A.A.; Gritz, Y.; Merzlyak, M.N. Relationships between Leaf Chlorophyll Content and Spectral Reflectance and Algorithms for Non-Destructive Chlorophyll Assessment in Higher Plant Leaves. J. Plant Physiol. 2003, 160, 271–282. [Google Scholar] [CrossRef] [Scilit] [PubMed]
- Chalker-Scott, L. Environmental Significance of Anthocyanins in Plant Stress Responses. Photochem. Photobiol. 1999, 70, 1–9. [Google Scholar] [CrossRef]
- Gould, K.S. Nature’s Swiss Army Knife: The Diverse Protective Roles of Anthocyanins in Leaves. J. Biomed. Biotechnol. 2004, 2004, 314–320. [Google Scholar] [CrossRef] [Scilit] [PubMed]
- Landi, M.; Tattini, M.; Gould, K.S. Multiple Functional Roles of Anthocyanins in Plant-Environment Interactions. Environ. Exp. Bot. 2015, 119, 4–17. [Google Scholar] [CrossRef] [Scilit]
- Bouderias, S.; Teszlák, P.; Jakab, G.; Kőrösi, L. Age- and Season-Dependent Pattern of Flavonol Glycosides in Cabernet Sauvignon Grapevine Leaves. Sci. Rep. 2020, 10, 14241. [Google Scholar] [CrossRef] [Scilit] [PubMed]
- Daryanavard, H.; Postiglione, A.E.; Mühlemann, J.K.; Muday, G.K. Flavonols Modulate Plant Development, Signaling, and Stress Responses. Curr. Opin. Plant Biol. 2023, 72, 102350. [Google Scholar] [CrossRef] [Scilit] [PubMed]
- Gautam, H.; Sharma, A.; Trivedi, P.K. The Role of Flavonols in Insect Resistance and Stress Response. Curr. Opin. Plant Biol. 2023, 73, 102353. [Google Scholar] [CrossRef] [Scilit] [PubMed]
- Mattila, H.; Valev, D.; Havurinne, V.; Khorobrykh, S.; Virtanen, O.; Antinluoma, M.; Mishra, K.B.; Tyystjärvi, E. Degradation of Chlorophyll and Synthesis of Flavonols during Autumn Senescence—The Story Told by Individual Leaves. AoB Plants 2018, 10, ply028. [Google Scholar] [CrossRef] [Scilit] [PubMed]
- Caprari, C.; Bucci, A.; Ciotola, A.C.; Del Grosso, C.; Dell’Edera, I.; Di Bartolomeo, S.; Di Pilla, D.; Divino, F.; Fortini, P.; Monaco, P.; et al. Microbial Biocontrol Agents and Natural Products Act as Salt Stress Mitigators in Lactuca sativa L. Plants 2024, 13, 2505. [Google Scholar] [CrossRef] [Scilit] [PubMed]
- Marenco, R.A.; Antezana-Vera, S.A.; Nascimento, H.C.S. Relationship between Specific Leaf Area, Leaf Thickness, Leaf Water Content and SPAD-502 Readings in Six Amazonian Tree Species. Photosynthetica 2009, 47, 184–190. [Google Scholar] [CrossRef] [Scilit]
- McBurney, T. The Relationship Between Leaf Thickness and Plant Water Potential. J. Exp. Bot. 1992, 43, 327–335. [Google Scholar] [CrossRef] [Scilit]
- Afzal, A.; Duiker, S.W.; Watson, J.E. Leaf Thickness to Predict Plant Water Status. Biosyst. Eng. 2017, 156, 148–156. [Google Scholar] [CrossRef] [Scilit]
- Schneider, C.A.; Rasband, W.S.; Eliceiri, K.W. NIH Image to ImageJ: 25 Years of Image Analysis. Nat. Methods 2012, 9, 671–675. [Google Scholar] [CrossRef] [Scilit] [PubMed]
- Garnier, E.; Shipley, B.; Roumet, C.; Laurent, G. A Standardized Protocol for the Determination of Specific Leaf Area and Leaf Dry Matter Content. Funct. Ecol. 2001, 15, 688–695. [Google Scholar] [CrossRef] [Scilit]
- Cornelissen, J.H.C.; Cerabolini, B.; Castro-Díez, P.; Villar-Salvador, P.; Montserrat-Martí, G.; Puyravaud, J.P.; Maestro, M.; Werger, M.J.A.; Aerts, R. Functional Traits of Woody Plants: Correspondence of Species Rankings between Field Adults and Laboratory-Grown Seedlings? J. Veg. Sci. 2003, 14, 311–322. [Google Scholar] [CrossRef]
- Castro-Díez, P.; Puyravaud, J.P.; Cornelissen, J.H.C. Leaf Structure and Anatomy as Related to Leaf Mass per Area Variation in Seedlings of a Wide Range of Woody Plant Species and Types. Oecologia 2000, 124, 476–486. [Google Scholar] [CrossRef] [Scilit] [PubMed]
- Karavin, N. Effects of Leaf and Plant Age on Specific Leaf Area in Deciduous Tree Species Quercus cerris L. Var. cerris. Bangladesh J. Bot. 2013, 42, 301–306. [Google Scholar] [CrossRef] [Scilit]
- Karavin, N.; Kilinc, M. Variation in SLA and LMA of Deciduous Quercus cerris Var. cerris and Evergreeen Phillyrea latifolia According to Directional, Seasonal and Climatical Parameters. Ekoloji 2011, 20, 21–29. [Google Scholar] [CrossRef] [Scilit]
- Garnier, E.; Laurent, G. Leaf Anatomy, Specific Mass and Water Content in Congeneric Annual and Perennial Grass Species. New Phytol. 1994, 128, 725–736. [Google Scholar] [CrossRef] [Scilit]
- Gratani, L.; Foti, I. Estimating Forest Structure and Shade Tolerance of the Species in a Mixed Deciduous Broad-Leaved Forest in Abruzzo, Italy. Ann. Bot. Fenn. 1998, 35, 75–83. [Google Scholar]
- Valladares, F.; Martinez-Ferri, E.; Balaguer, L.; Pérez-Corona, M.E.; Manrique, E. Low Leaf-Level Response to Light and Nutrients in Mediterranean Evergreen Oaks: A Conservative Resource-Use Strategy? New Phytol. 2000, 148, 79–91. [Google Scholar] [CrossRef] [Scilit] [PubMed]
- Ordoñez, J.C.; Van Bodegom, P.M.; Witte, J.-P.M.; Wright, I.J.; Reich, P.B.; Aerts, R. A Global Study of Relationships between Leaf Traits, Climate and Soil Measures of Nutrient Fertility. Glob. Ecol. Biogeogr. 2009, 18, 137–149. [Google Scholar] [CrossRef] [Scilit]
- Dijkstra, P.; Lambers, H. Analysis of Specific Leaf Area and Photosynthesis of Two Inbred Lines of Plantago major Differing in Relative Growth Rate. New Phytol. 1989, 113, 283–290. [Google Scholar] [CrossRef] [Scilit] [PubMed]
- Gottardini, E.; Cristofolini, F.; Cristofori, A.; Pollastrini, M.; Ferretti, M. Misura Della Fluorescenza Della Clorofilla a, Contenuto Di Clorofilla e Tratti Fogliari: Campionamento, Raccolta e Misurazioni. Guida per Studi in Campo; Documento del Progetto LIFE FutureForCoppiceS, Azione B.2 . 2016. Available online: https://openpub.fmach.it/bitstream/10449/38027/1/B2_Manuale_F4C_FINAL_06022017.pdf (accessed on 26 October 2026).
- Hammer, O.; Harper, D.; Ryan, P. PAST: Paleontological Statistics Software Package for Education and Data Analysis. Palaeontol. Electron. 2001, 4, 9. [Google Scholar]
- Kuckartz, U.; Rädiker, S.; Ebert, T.; Schehl, J. Statistik: Eine Verständliche Einführung; Springer VS: Wiesbaden, Germany, 2013. [Google Scholar]
- Chambers, J.M.; Freeny, A.E.; Heiberger, R.M. Analysis of Variance; Designed Experiments. In Statistical Models in S; Routledge: London, UK, 1992. [Google Scholar]
- Bates, D.; Mächler, M.; Bolker, B.; Walker, S. Fitting Linear Mixed-Effects Models Using Lme4. J. Stat. Softw. 2015, 67, 1–48. [Google Scholar]
- Kuznetsova, A.; Brockhoff, P.B.; Christensen, R.H. lmerTest Package: Tests in Linear Mixed Effects Models. J. Stat. Softw. 2017, 82, 1–26. [Google Scholar] [CrossRef] [Scilit]
- Lenth, R. Emmeans: Estimated Marginal Means, aka Least-Squares Means, R Package Version 1.11.2-8. 2025. Available online: https://doi.org/10.32614/CRAN.package.emmeans (accessed on 26 October 2026). [CrossRef] [Scilit]
- Wickham, H.; Averick, M.; Bryan, J.; Chang, W.; McGowan, L.D.; François, R.; Grolemund, G.; Hayes, A.; Henry, L.; Hester, J.; et al. Welcome to the Tidyverse. J. Open Source Softw. 2019, 4, 1686. [Google Scholar] [CrossRef] [Scilit]
- Wickham, H. Ggplot2. Wiley Interdiscip. Rev. Comput. Stat. 2011, 3, 180–185. [Google Scholar] [CrossRef] [Scilit]
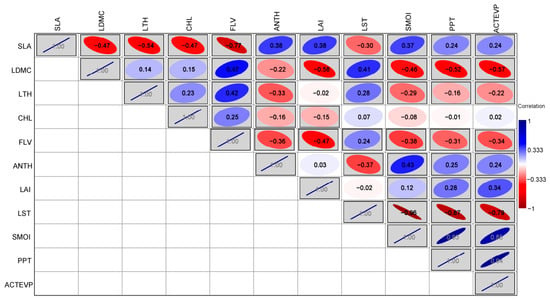
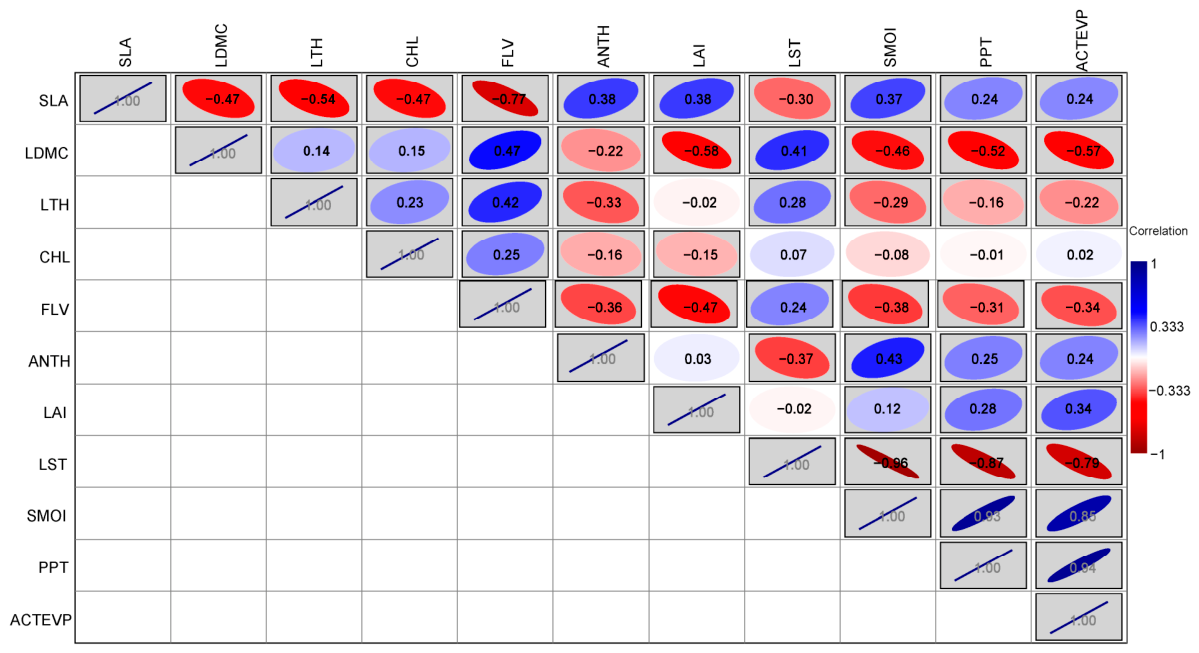
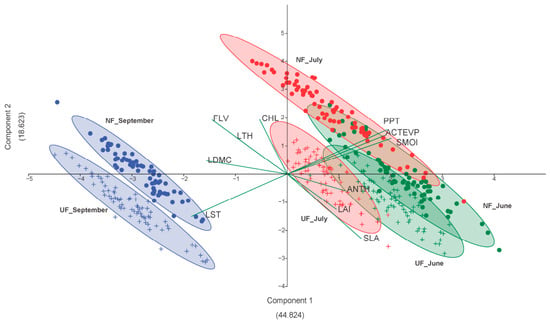
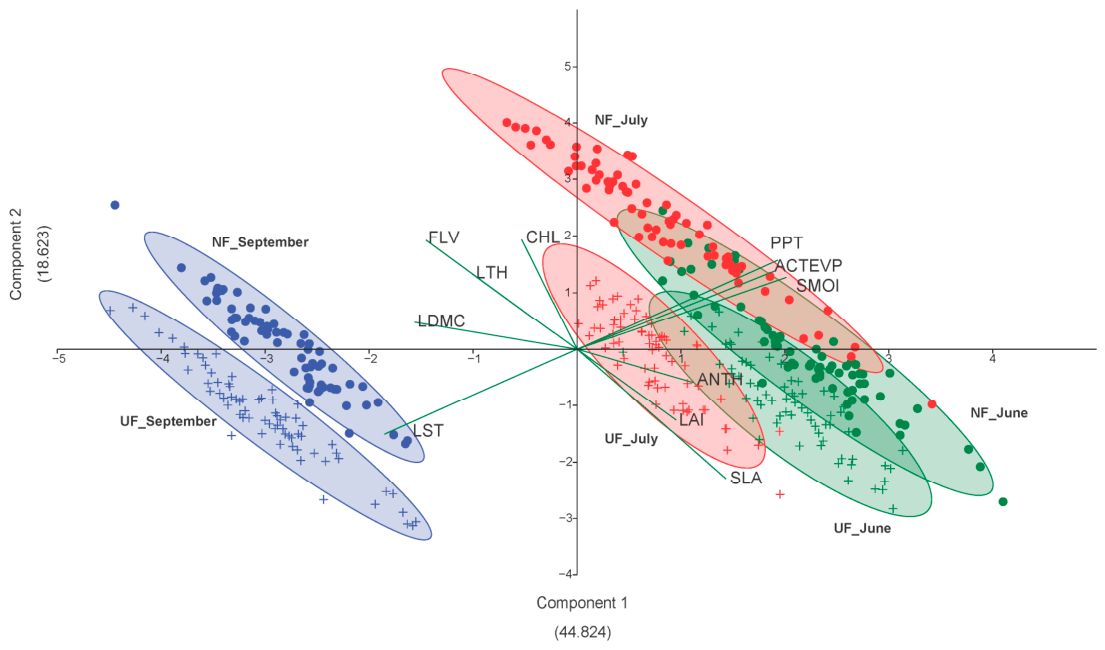
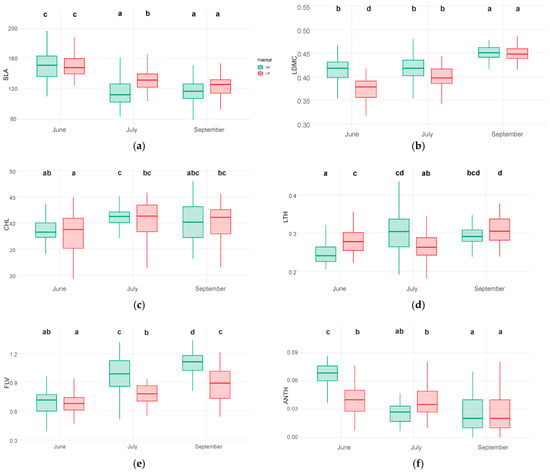
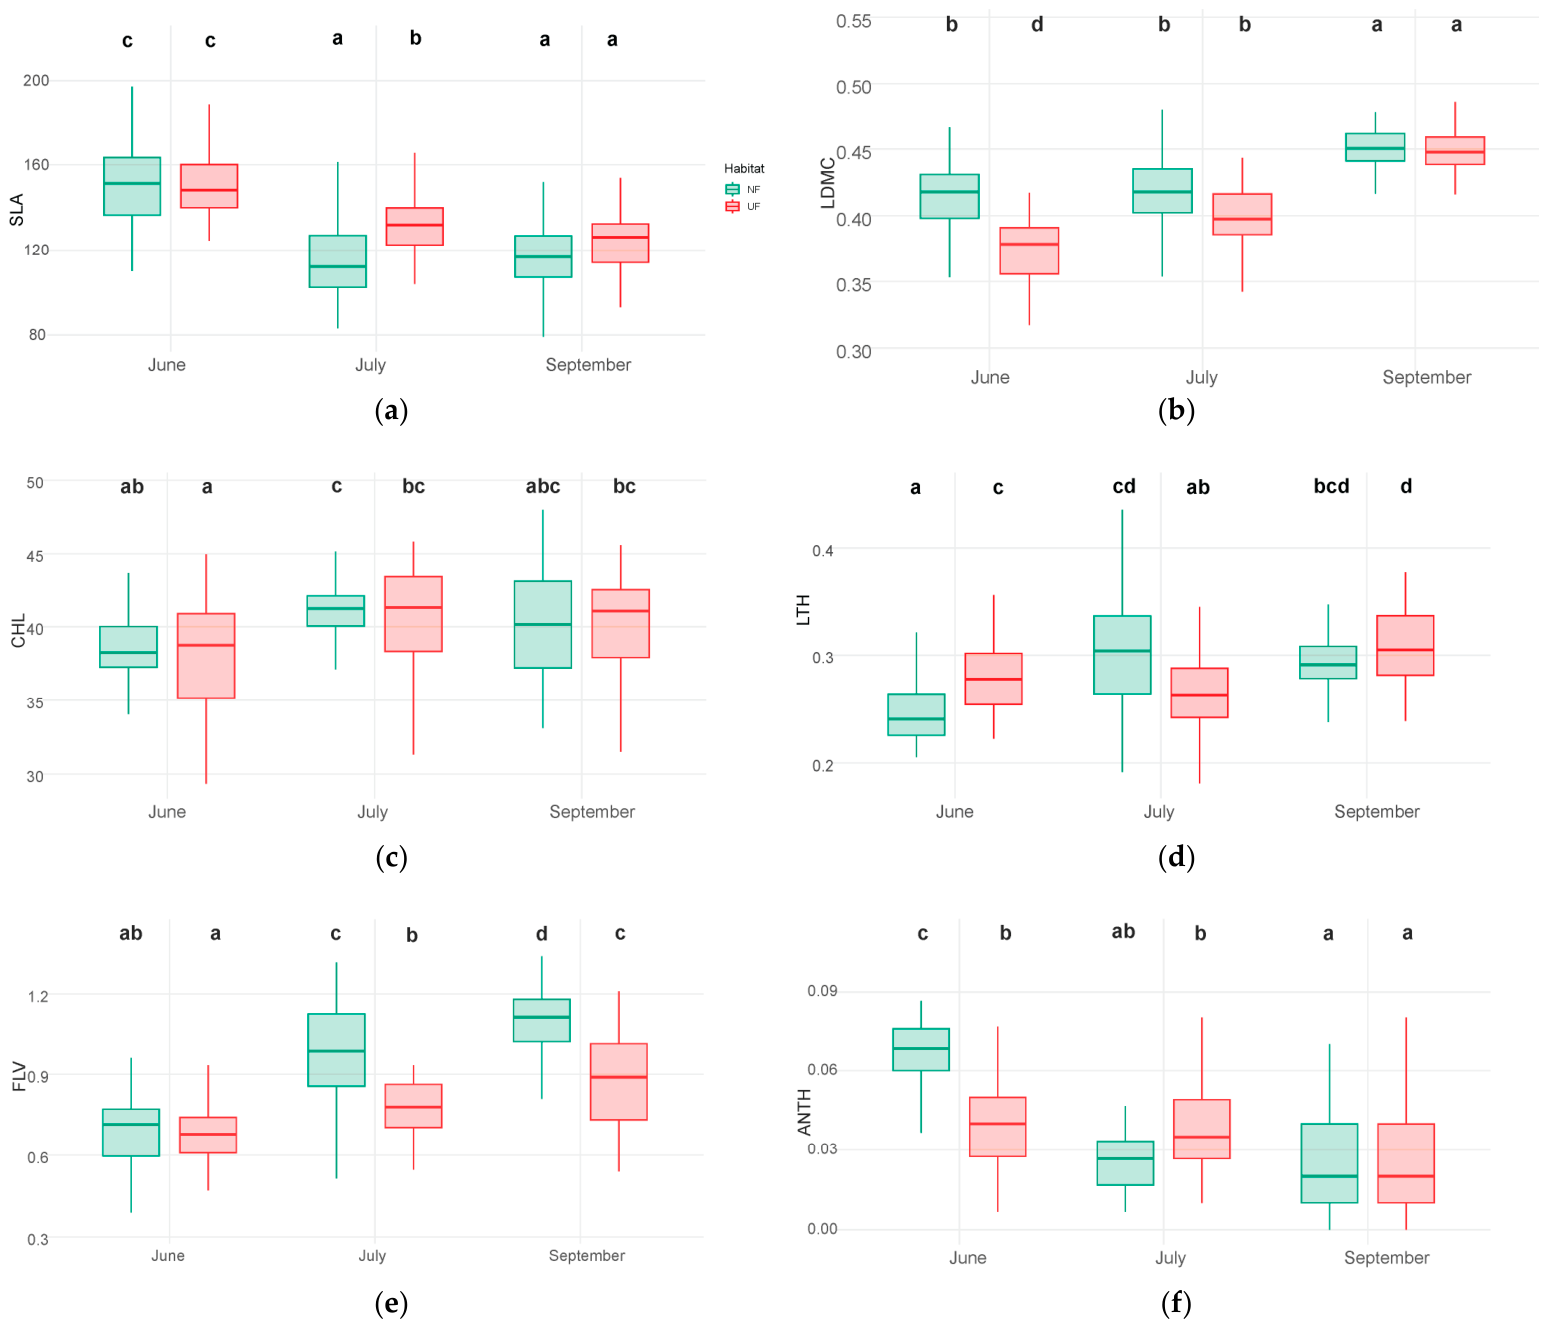
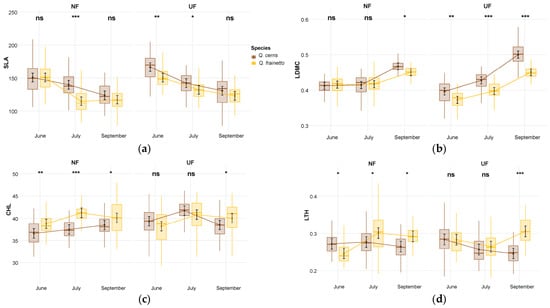
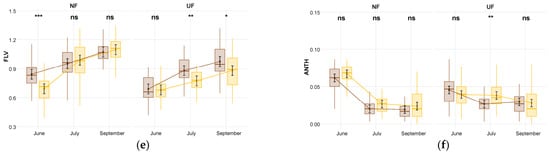
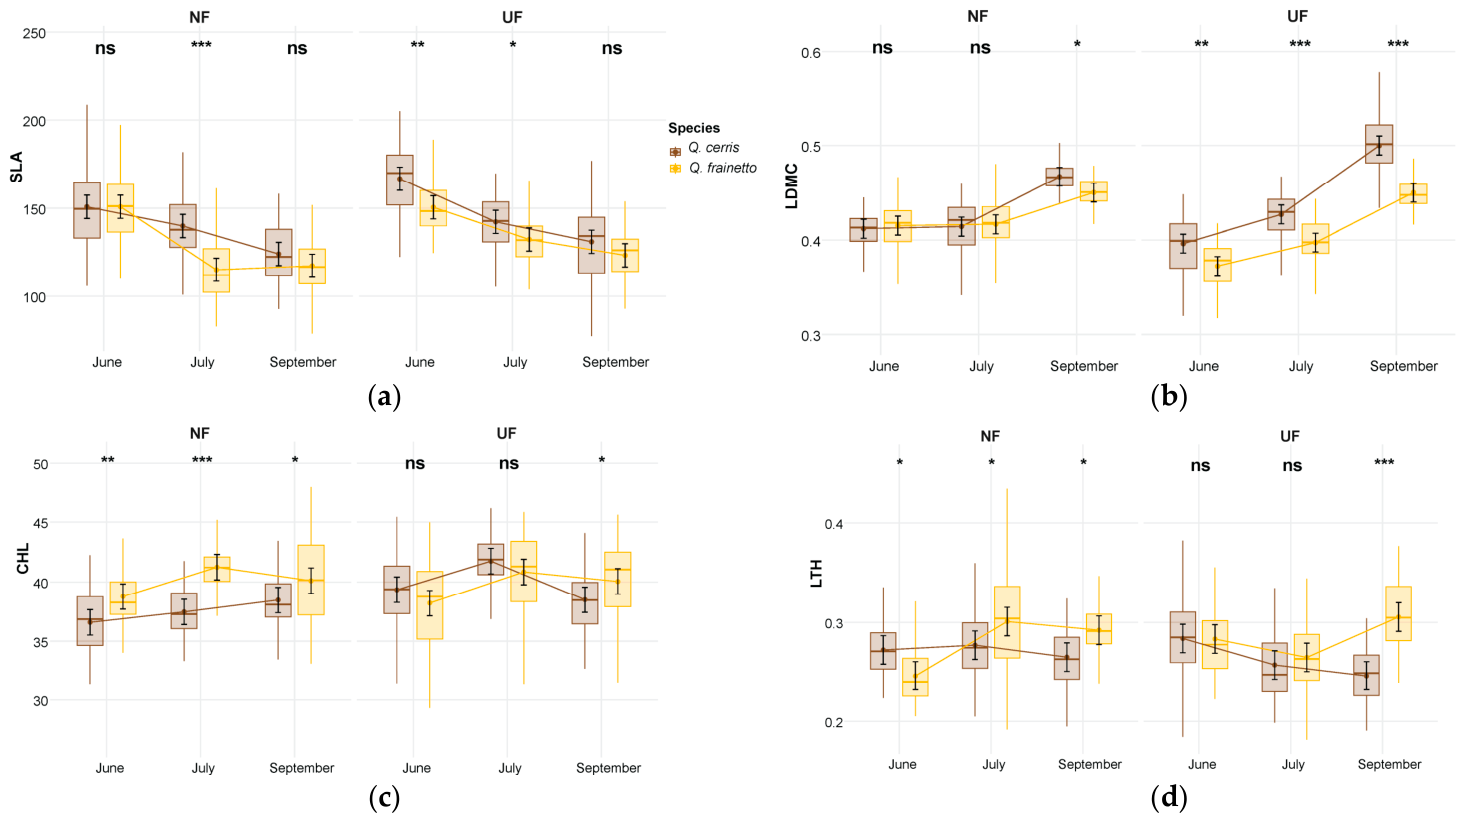
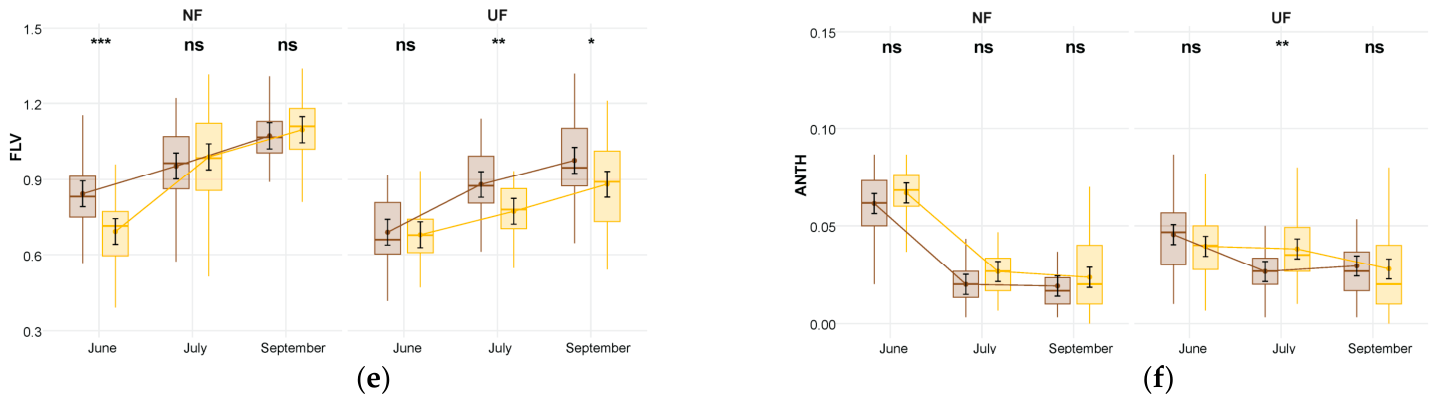
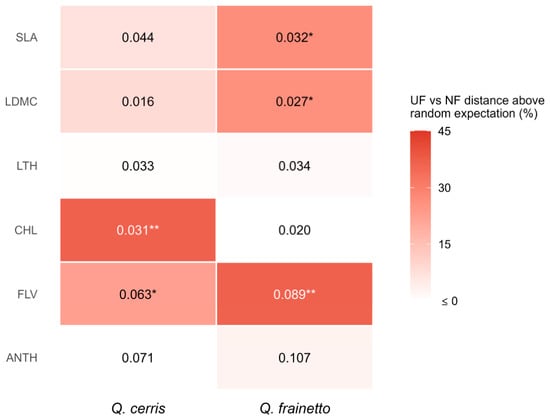
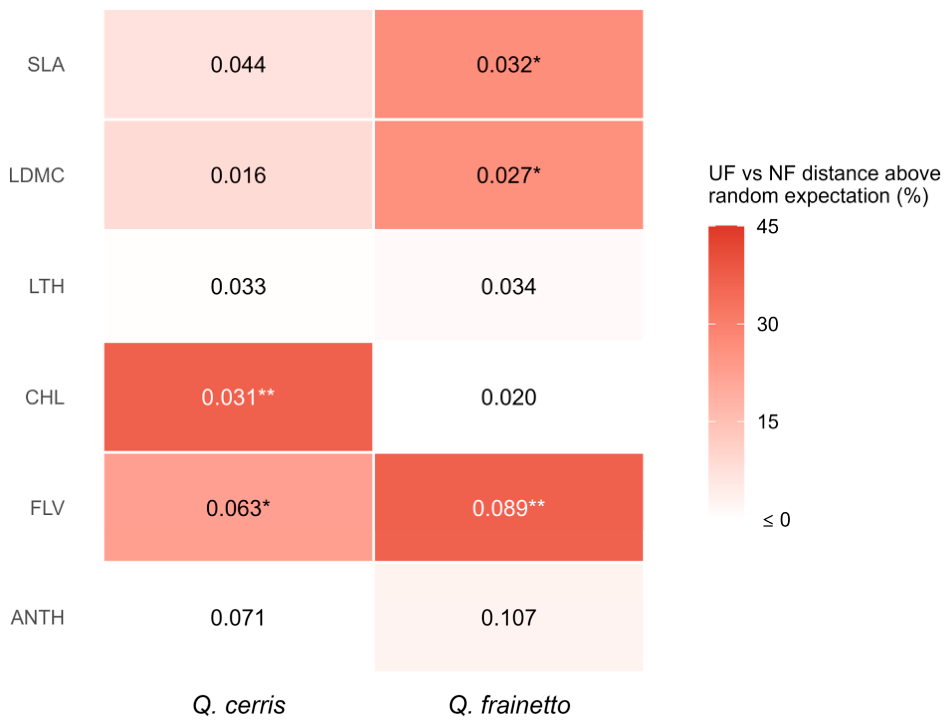
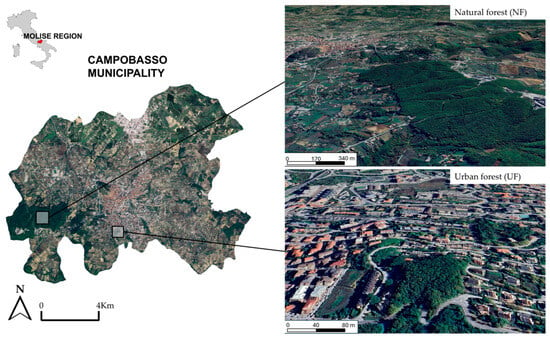
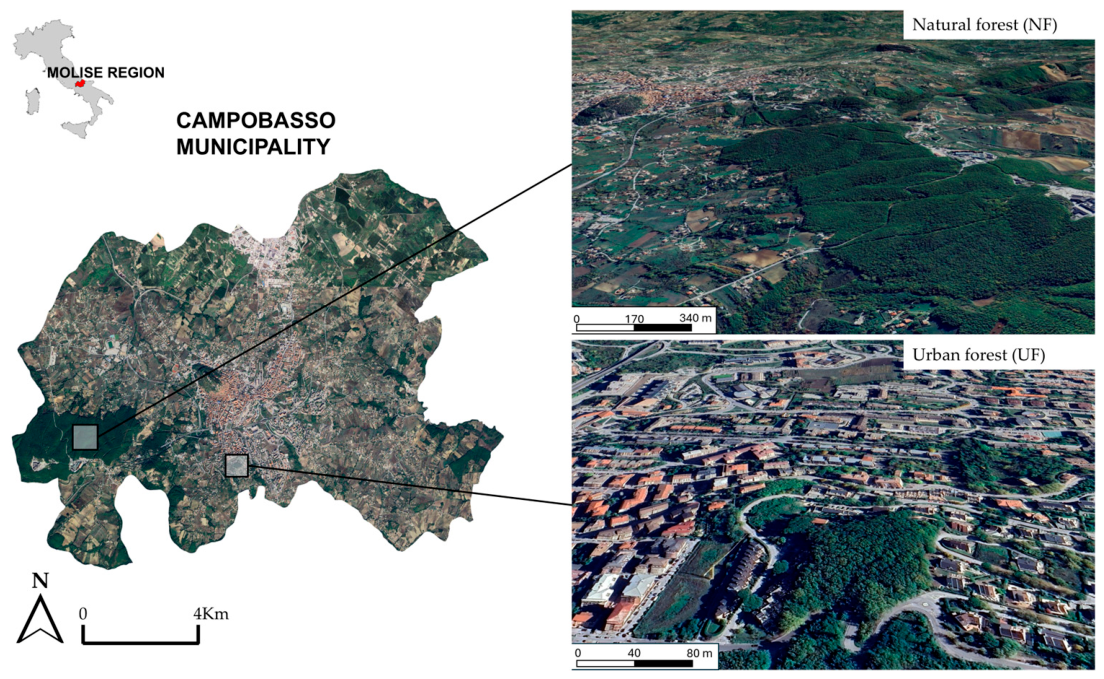

Disclaimer/Publisher’s Note: The statements, opinions and data contained in all publications are solely those of the individual author(s) and contributor(s) and not of MDPI and/or the editor(s). MDPI and/or the editor(s) disclaim responsibility for any injury to people or property resulting from any ideas, methods, instructions or products referred to in the content. |
© 2026 by the authors. Licensee MDPI, Basel, Switzerland. This article is an open access article distributed under the terms and conditions of the Creative Commons Attribution (CC BY) license.