


Abstract
Progressive slope failures in open pit mining are characterized by accelerating deformations that can be monitored and potentially forecast. While current monitoring practice emphasizes velocity-based parameters and the inverse velocity method for failure prediction, the role of acceleration in understanding failure mechanisms and improving early warning systems remains underexplored. This paper presents a conceptual and analytical framework for characterizing acceleration in progressive slope failures. We introduce the concept of slope damage as a cumulative measure of positive accelerations over time, and demonstrate its utility in identifying the Onset of Acceleration (OOA), defined as the critical transition from regressive to progressive failure. We further examine the geotechnical conditions necessary for the inverse velocity method to be valid, proposing that a fully or nearly fully mobilized failure surface is required for sustained acceleration. The conceptual link among rock bridge degradation, fracture network connectivity, and the OOA framework is explored using the Network Connectivity Index (NCI), which is presented as a hypothesis for future numerical investigation and systematic empirical testing. This work contributes to the fundamental understanding of progressive failure mechanisms and provides practical guidance for acceleration-based slope monitoring.
1. Introduction
Open pit slope failures represent one of the most significant geotechnical hazards in mining operations worldwide. The consequences of unexpected slope failures range from operational disruptions and economic losses to potential threats to personnel safety and environmental impacts. While advancements in monitoring technologies have substantially improved our ability to detect and track slope movements, uncertainty remains regarding the real-time identification of progressive failure states and the systematic implementation of alarm frameworks.
This paper builds upon the frameworks and case studies presented by a significant number of geotechnical practitioners. For instance, ref. [1] discussed several notable publications towards an empirical approach of failure forecasting methods. These are summarized in Table 1 below. While Table 1 is certainly not exhaustive, it illustrates both the topic’s significance and the enduring appeal of the premise that all slope failures can be successfully predicted from monitoring data alone. This premise, however appealing, should not be mistaken for an established fact; failure forecasting remains an interpretive discipline rather than an exact science, particularly in the context of brittle failure mechanisms where phenomenological observations are inherently difficult to generalize.
Table 1.
Chronological overview of notable contributions to progressive failure monitoring and forecasting. The table is not intended as a comparative evaluation of methods.
Current state-of-practice in slope monitoring emphasizes deformation and velocity measurements, with the inverse velocity method [7] serving as the primary tool for predicting the time of failure. Despite the physical reality of acceleration in all slope failures, comparatively little attention has been paid to the systematic assessment of acceleration characteristics from either a monitoring or a design perspective. From a monitoring standpoint, acceleration is typically assessed indirectly by visualizing increasing velocity trends on time-series plots. This indirect approach may limit our ability to identify critical transitions between regressive and progressive failure states in real time.
The concept of the Onset of Acceleration (OOA), defined as the transition from regressive to progressive failure [15], represents a critical juncture in the evolution of slope failure. Accurate identification of this point is straightforward in back-analysis but challenging in real-time monitoring due to multiple confounding factors, including system accuracy, episodic accelerations, atmospheric effects, and varying failure mechanisms. Understanding the geotechnical conditions associated with OOA has important implications for both monitoring system design and failure forecasting methodology.
This paper investigates the acceleration characteristics of progressive slope failures by analyzing a comprehensive database of historical slope monitoring records compiled by [19]; readers are referred to that work, which is publicly available as a dissertation, for full details on the database composition, case study selection criteria, and individual monitoring records. Building on this foundation, the present paper develops a conceptual and analytical framework for acceleration-based slope monitoring, with the following specific objectives:
- Characterisation of acceleration patterns and their diagnostic relationship to progressive and regressive failure states;
- Development of the slope damage concept as a cumulative measure of progressive failure, and demonstration of its utility in identifying the OOA point;
- Investigation of the geotechnical conditions necessary for the validity of the inverse velocity method;
- Exploration of the conceptual link between rock bridge degradation, fracture network connectivity, and the OOA framework;
- Discussion of implications for slope monitoring frameworks and Trigger Action Response Plans (TARPs).
2. Conceptual Framework
This section develops the conceptual foundation for the acceleration-based monitoring framework proposed in this paper. The physical basis for acceleration as a diagnostic parameter is established, the slope damage concept is introduced as a cumulative metric for tracking failure progression, and the geotechnical conditions necessary for sustained acceleration are examined. The section concludes with a refined operational definition of the OOA point, illustrated by a representative case study.
2.1. Acceleration in Progressive Failures
Acceleration is a physically necessary precondition for all slope failures. By definition, it represents the rate of change of velocity (the second derivative of displacement with respect to time) and, in the context of slope instability, reflects the evolving mechanical state of the failing rock mass. The fundamental distinction between regressive and progressive failure can be characterized through acceleration trends (Figure 1): regressive deformations are associated with episodic accelerations that return to near-zero values following discrete triggering events (e.g., blasting, excavation, rainfall), whereas progressive failures exhibit sustained positive accelerations that increase consistently toward collapse. This distinction forms the basis for defining the OOA point.
Figure 1.
Generic regressive and progressive trends for slope monitoring data.
Figure 2 illustrates characteristic deformation, velocity, and acceleration curves for progressive slope failures. Unlike deformation curves, which show continuously increasing displacement, or velocity curves, which capture increasing rates, acceleration curves isolate periods of active slope damage by filtering out constant-velocity trends and highlighting intervals of changing mechanical behaviour. The OOA point represents the critical transition from regressive to progressive failure. While previous authors [15,20] characterized this transition based on displacement-time behaviour, the present work proposes a refined definition based on sustained acceleration.
Figure 2.
(a) Illustration of characteristic deformation curves (modified from [11]); (b) illustration of characteristic acceleration and damage curves. The time scale between pre-failure and failure conditions is intentionally schematic and site-dependent. Based on the authors’ experience with open pit slope monitoring, pre-failure stages may develop over periods ranging from weeks to years, the terminal accelerating phase may span hours to days, and brittle failures in particular may transition to collapse within minutes to hours.
Although acceleration is simply a higher-order derivative of displacement, its diagnostic value lies precisely in its ability to remove either flat (non-deforming) or constant-velocity trends, yielding either episodic or progressive signatures. The question then naturally arises: why is acceleration not routinely assessed in slope monitoring practice or incorporated into design frameworks? The answer likely lies in the practical difficulty of reliably computing and interpreting acceleration, particularly in real time. It is the authors’ view that limitations in certain monitoring software present meaningful obstacles to the adequate assessment of acceleration trends.
From a monitoring standpoint, it is proposed that acceleration should not be assessed incrementally. Real-time identification of the OOA point is inherently challenging: episodic accelerations may precede the true OOA, and slopes may temporarily accelerate before regressing. Environmental factors, including diurnal temperature variations, atmospheric pressure changes, and precipitation events, can induce short-term accelerations that do not reflect progressive failure.
Distinguishing between episodic and sustained progressive acceleration, therefore, requires careful integration of monitoring data trends, failure mechanisms, and broader geotechnical context. Instead, acceleration should be evaluated as the slope of velocity over a sufficiently long time window to attenuate diurnal and atmospheric effects (Figure 3). The OOA point is reached when accelerations remain persistently above zero for a sustained period, signalling the transition from episodic, event-driven deformation to continuous progressive failure. What constitutes a “sustained” or “sufficiently long” period must be determined within the holistic slope monitoring and design framework applicable to the site in question.
Figure 3.
Schematic deformation, velocity and acceleration curves following discrete triggering events (e.g., blasting, rainfall). The curves are conceptual and are not drawn from a specific case study; assigning numerical critical values to the axes would imply a generalisability that does not exist and could be misleading.
2.2. Slope Damage Concept
We introduce the concept of slope damage as a cumulative measure of progressive failure development. Slope damage is calculated as the accumulated positive accelerations over time:
Slope Damage = ∑(at) for at > 0
This formulation captures the intuitive notion that slope damage accumulates during periods of acceleration, whereas periods of zero or negative acceleration (deceleration/regression) do not contribute to progressive failure. In our current approach, acceleration is calculated as a linear regression through velocity data recorded over various time periods (see [19] for details). The slope damage approach provides a clear visual representation of when and how rapidly damage accumulates in the slope mass. Conceptually, slope damage calculations are expected to provide clearer identification of OOA boundaries than velocity-based metrics alone, a proposition supported by the representative monitoring records discussed in Section 2.4. The slope damage approach appears to facilitate early identification of signs of adverse conditions in monitoring data, serving as a precursor to slope failure. This enhanced clarity stems from filtering out negative accelerations, acknowledging that episodic decelerations and recovery periods do not contribute to the cumulative damage metric. Slope damage as defined in Equation (1) should not be interpreted as a standalone failure criterion with a universal threshold value; rather, it is a diagnostic indicator designed to identify the OOA point and to complement velocity-based monitoring. The absence of a universal threshold reflects the parameter’s site-specific nature, analogous to the lack of a universal inverse-velocity threshold in TARPs frameworks (see Section 3.3).
Figure 4 illustrates slope damage accumulation for a typical failure record (undisclosed mine location, see [19] for details). In Figure 4c, the three curves represent different calculation periods for acceleration (labelled 1, 2, and 3, corresponding to 24, 100, and 200 points, respectively), demonstrating that the slope-damage concept (Figure 4d) is robust across various data-processing approaches. The number of data points selected within the acceleration period slightly delays and reduces the overall amplitude of the record. Note how slope damage remains relatively flat during regressive periods and increases systematically during the seven days preceding failure.
Figure 4.
Example of slope damage accumulation process for an undisclosed mine location. (a) Displacement data; (b) velocity data; (c) acceleration data using different calculation periods calculated only from Regression Velocity 2; (d) calculated slope damage for the three acceleration periods, which is used to establish the date for OOA; and (e) inverse velocity data for the same case study (calculation time periods 1 and 2). The assumed OOA and the actual failure date are reported in all charts. The OOA point is determined following the criteria described in Section 2.1.
For failure forecasting purposes, raw incremental acceleration trends alone do not appear to offer advantages over the inverse velocity method, given their episodic nature during the regressive phase. It is the cumulative integration of positive accelerations, the slope damage concept, that provides diagnostic value, specifically in identifying the OOA point and distinguishing progressive from regressive failure states. Acceleration in its raw incremental form is susceptible to episodic noise. The proposed slope damage concept filters this noise by accumulating only positive accelerations, thereby isolating the progressive component of slope behaviour that is diagnostically relevant to failure forecasting. Figure 4e shows the corresponding inverse-velocity record for the same case study. The pattern shown is common among slope failure records: episodic accelerations of increasing amplitude occur in the lead-up to failure, and a reasonable linear trend can be fitted to the inverse velocity record over the full monitoring period. This raises an important observation: the inverse velocity method could, in principle, be applied throughout this record, not only after the identified OOA point. Nevertheless, the change in the character of the monitoring data at the OOA point suggests that conditions within the slope changed meaningfully around November 21st, even if the precise boundary between regressive and progressive behaviour remains difficult to assign objectively in Figure 4e. Indeed, prior to the OOA point, inverse velocity trends were characterized by episodic breaks rather than a sustained linear progression. Figure 4d appears to better illustrate the OOA point within the slope damage framework. Combining this methodology as part of a TARP framework, in which failure forecasting methods utilizing the inverse velocity method in Figure 4e illustrate the overall utility and contextualization of the method.
2.3. Geotechnical Basis for Sustained Acceleration
Under the assumption that the inverse velocity method applies throughout the period of a progressive failure, a natural corollary question arises: Is it reasonable to assume the method also applies during regressive slope deformations? Slope monitoring records that did not progress to ultimate failure are therefore as instructive as those that did, providing essential context for establishing TARP threshold values and for bounding the distinction between progressive and regressive behaviour. In this regard, Beingessner [19] compiled a database of slope monitoring records in which no failure occurred, yet TARP velocity thresholds were nonetheless triggered. Examined from an acceleration monitoring perspective, however, those records show little deviation from zero, with only minor excursions during discrete episodic events. Crucially, accelerations did not remain persistently elevated above zero as regressive deformations consistently produced a return toward baseline, consistent with the dampening characteristic of non-progressive behaviour.
It is therefore inappropriate to assign an OOA point to a non-accelerating slope, or to invoke inverse velocity analysis in the absence of progressive failure conditions. While this may appear self-evident, it raises a more consequential question: Is velocity-based monitoring, using predefined threshold velocities, even appropriate for slopes that are not trending toward failure? Geotechnical practitioners reasonably need to know whether a slope is displacing faster than acceptable limits, regardless of failure trajectory; surficial ravelling, for instance, may be accompanied by elevated velocities that warrant attention even in the absence of deep-seated progressive failure. Nevertheless, the distinction between hazard-relevant velocity exceedance and failure-indicative progressive acceleration should be made explicit within slope monitoring and design frameworks to avoid misapplication of methods developed specifically for progressive failure conditions.
This distinction naturally leads to a more fundamental question: what geotechnical conditions must exist for acceleration to persist, rather than episodically return to zero? We propose that sustained acceleration requires a fully or nearly fully mobilized failure surface. Prior to complete mobilization, episodic accelerations occur as local areas of the potential failure surface yield, with subsequent load redistribution to adjacent regions that retain sufficient strength to maintain stability (a behaviour characteristic of regressive deformation). Once the failure surface is sufficiently developed, the system loses its capacity to redistribute loads to areas retaining peak strength, and sustained acceleration ensues. Our conclusion aligns with the results presented by [21], which characterized failure of jointed rock slopes as a function of rock bridge failure, leading to the development of a fully continuous failure surface. However, constant velocity does not preclude the accumulation of progressive damage across all failure modes. In creep-dominated or ductile failure mechanisms, rock bridge rupture and intact rock damage may continue to accumulate during periods of apparent kinematic stability. The slope damage metric, as proposed, is specifically calibrated to acceleration-driven brittle failure mechanisms, and its applicability to creep-dominated slopes should be interpreted with caution.
2.4. Definition of the Onset of Acceleration Point
Figure 5 below illustrates a slope monitoring record over a reasonably long period (160 days), spanning both regressive and progressive trends. The slope can be thought of as subject to brittle accelerations (typically following an event such as mining or blasting), followed by plastic strain, and shearing occurring through the rock mass along a basal shear plane. The slope was previously understood to be affected by toppling mechanisms until sufficient damage had occurred along the basal plane, causing the failure mechanism to change in the weeks leading up to failure. Slope deformations could be characterized as regressive up to the day of failure, as illustrated in the deformation plot. However, it is reasonably clear from the acceleration plots that a notable change in trend occurred sometime in mid-July, during which accelerations (along with velocities) increased and remained above zero for substantial periods. This trend has a ‘regressive’ shape (as defined earlier in Figure 2) on a smaller scale, but accelerates overall in context. This is difficult to interpret within the definitions provided in Figure 2, as it could be argued to be either accelerating or regressive. This ambiguity reflects a genuine limitation of the binary regressive/progressive classification. Real slope behaviour may occupy an intermediate state that does not map cleanly onto either category, and the OOA framework, as currently proposed, is most robust for slopes that exhibit a clear transition between the two.
Figure 5.
Example of slope damage accumulation process at an undisclosed mine location in Canada. (a) Displacement data; (b) velocity data; (c) acceleration data using different calculation periods; (d) calculated slope damage for three acceleration periods; and (e) inverse velocity data for the same case study (calculation time periods 1 and 2). The OOA point is determined following the criteria described in Section 2.1.
It should also be noted that the 10 m of cumulative displacement recorded over the monitoring period does not reflect continuous brittle fracture throughout; rather, it reflects the coexistence of episodic brittle shear events, triggered by discrete activities such as blasting or excavation, and intervening periods of near-constant velocity consistent with block sliding along previously sheared surfaces at residual strength. The slope damage metric accumulates only during the episodic acceleration events and remains flat during intervening periods, which is precisely what makes it diagnostically useful in settings where large background displacements might otherwise obscure the transition to progressive failure. The corresponding slope-damage record and inverse-velocity plot are presented in Figure 5d and Figure 5e, respectively.
The inverse velocity record for this case shows an earlier trend toward failure, mirroring the spikes in displacement and velocity attributed to triggering events rather than to the initiation of actual failure. This is, in itself, a significant observation, as it suggests that inverse velocity alone would not have provided reliable failure forecasting for this slope (albeit earlier alarms may retain a degree of conservatism). What the record does reveal, however, is a discernible step change around mid-July, coinciding with a shift in relative acceleration and a corresponding inflexion in the slope damage curve. The convergence of these three signals at the same point in time strengthens the case for using acceleration and slope damage as complementary indicators, particularly when inverse velocity trends are ambiguous or non-linear.
3. A New Framework to Monitor Slope Failure
This study develops a conceptual and analytical framework for characterizing acceleration in progressive slope failures. The methodology proceeds in two steps:
- The OOA point is defined through a systematic examination of acceleration and slope-damage trends in representative monitoring records included in [19].
- A calculation framework is proposed to reliably derive acceleration from displacement time-series data.
The approach emphasizes the distinction between episodic and sustained acceleration as the basis for differentiating regressive from progressive failure states, and establishes the conditions under which inverse velocity analysis is appropriately applied.
3.1. Proposed Acceleration Calculation Framework
The goal of an acceleration calculation framework is to produce mostly null (or zero) values unless an actual event (e.g., slope movement triggered by mining, blasting, or damage) occurs. Unfortunately, the periods used to calculate the slope of velocities can vary widely, depending on system and atmospheric parameters, and as such, specifying specific periods as part of this framework is considered premature. It is suggested that the period spans at least one full day and likely less than one full month (30 days). Geotechnical practitioners familiar with site data and systems are encouraged to assess this based on their experience. While 30 days may seem like a long period, its main effect is to dampen the amplitude of acceleration, not necessarily to miss short-term movements. Note that acceleration should be calculated by fitting points using calculated velocity values, themselves obtained via regression, or by another method that determines reliable and consistent velocity values. This may represent a substantial degree of smoothing, and the risk of over-dampening genuine acceleration signals must be acknowledged. In the examples shown in Figure 6 and Figure 7, the 7-day and 30-day periods denote the duration of the rolling regression window applied to the velocity record. At each time step, the regression is recalculated over the preceding 7 or 30 days of velocity data, and the resulting slope is recorded as the acceleration at that time. Slope damage is then accumulated as the sum of positive acceleration values over the monitoring period, as defined in Equation (1). Shorter regression windows are more responsive to short-term velocity changes but produce noisier acceleration records with higher-amplitude excursions; longer windows attenuate this noise but dampen the amplitude of genuine acceleration signals and may delay OOA identification. The appropriate window length is therefore site- and system-dependent, and should be calibrated against stable reference areas to identify the shortest period that produces near-zero acceleration in the absence of genuine slope movement.
Figure 6.
Example of acceleration during the regressive (stable) phase. (a) Displacement data; (b) 7-day and 30-day acceleration data for Prism 2214; and (c) calculated slope damage for Prism 2214 between 2024 and 2025. Data from [19].
Figure 7.
Example of acceleration during progressive (unstable) phase. (a) Displacement data; (b) 7-day and 30-day acceleration data for Prism 2214; and (c) calculated slope damage for Prism 2214 between 2022 and 2024. Data from [19].
The period should, however, be long enough to bridge over at least two atmospheric events. It is the author’s experience that atmospheric, or system-based deformations, resulting in apparent deformation spikes, can sometimes offset. This may not, however, be true in the case of cumulated spikes. Regardless, the previously stated goal of this smoothing or dampening process remains the same. In general, this should be assessed on a stable (i.e., non-deforming) area, or, if no stable areas are available, on a constantly deforming area. The resulting acceleration should simply be zero, or very close to zero. This will also ensure that the resulting slope damage is zero, unless a change (i.e., not related to data quality) is recorded. Interestingly, following an event such as blasting, the resulting slope damage parameter appears to be a relatively good indicator of the damage induced by the blast (or any other event type).
Different window lengths may shift the inferred OOA date, and this sensitivity should be understood as an inherent characteristic of the method rather than a deficiency. Shorter windows are more responsive to genuine acceleration signals but are correspondingly more sensitive to episodic noise from atmospheric and system-based effects. Longer windows dampen this noise but risk attenuating genuine acceleration signals, potentially delaying OOA identification. The choice of window length should therefore be guided by the monitoring system’s temporal resolution and the site’s atmospheric noise characteristics, assessed against a stable reference area as described above. A universal objective criterion for window selection cannot be responsibly proposed without a systematic sensitivity analysis across a broader dataset; this is identified as a direction for future work. This is further illustrated in Figure 6 and Figure 7 below, which show two comparative plots taken from the same prism set.
In Figure 6 (timeframe 2024–2025), the data indicate a period of relative stability despite high deformation. To determine an appropriate period for assessing acceleration, various intervals can be evaluated, as illustrated, with the stated goal of identifying acceleration near zero. An acceleration period of more than 7 days but less than 30 days would be appropriate for identifying a slight acceleration trend in spring of 2025 related, for this specific case, to freshet conditions [19]. During this period, approximately 10 m of displacement occurred over one year. Total slope damage accumulation over approximately one year, using acceleration compounded over a 30-day period, is approximately 450 mm/day2.
The application of the acceleration framework to an accelerating slope is shown in Figure 7 (timeframe: 2022–2024). Clearly, despite acceleration periods ranging from 1 week to 30 days, acceleration is easier to decipher in the 30-day window. Slope damage is clearly accumulating during both acceleration windows. Total slope damage accumulation, over approximately one year, using acceleration compounded over a 30-day period, is approximately 1000 mm/day2. Note that this specific monitoring prism was adjacent to a slope which failed on 24 August 2023.
New methods, such as Precision Atmospherics [22] or modifications to the Circular Algorithm, are proposed to provide more reliable and consistent data and are very worthwhile endeavours. However, because these are relatively new technologies subject to intellectual property constraints, the specific smoothing algorithms employed by radar providers to reduce data spikes are not disclosed. The degree and nature of pre-processing applied to the resulting plots are therefore unknown, and introducing unquantifiable uncertainties of this kind means that such plots cannot be reliably used to determine acceleration or OOA. This is a practical limitation based on the authors’ direct experience and personal communications with radar providers. Additional efforts will be required to successfully implement acceleration methods either within software providers or by geotechnical practitioners.
3.2. Slope Monitoring Frameworks
Comprehensive treatments of slope monitoring frameworks are available in the literature and are not reproduced here in full; the reader is referred in particular to the Large Open Pit (LOP) project guidelines [23,24] and to recent parametric reviews of alarm frameworks and trigger levels [18,25]. Monitoring equipment and software providers also publish reference documentation and training materials that detail implementation. The present section provides only the overview necessary to contextualize the roles of acceleration and OOA, and the conditions for the applicability of inverse velocity, within a TARP framework, and to clarify how parameters such as velocity and acceleration are derived from raw monitoring data across different system types.
Typical alarm frameworks are structured as layered or stackable trigger levels within TARPs, as illustrated in Figure 8. The primary parameters, including deformation, velocity, velocity ratio, and inverse velocity, are typically derived from Line-of-Sight (LOS) displacement measurements via successive calculations. Velocity ratio, it should be noted, is functionally related to acceleration, though it is not equivalent to the acceleration metric proposed in this paper. Coherence, used principally in radar-based systems, describes the correlation between successive scans and is particularly useful for detecting rockfall precursors or defining failure boundaries. Tracking refers to the maximum recordable displacement between successive scans and serves as a data quality indicator. Each of these metrics has demonstrated value in slope failure monitoring across a wide range of operational settings [18]. The proposed framework is most straightforwardly applied when a single dominant failure mechanism is active. In practice, coincident or sequential failure surfaces, for example, a shallow failure surface preceding a deeper-seated mechanism, represent a complexity that requires careful interpretation of acceleration and slope damage trends across multiple monitoring points. This is identified as an area deserving further attention in future work.
Figure 8.
Alignment of stackable alarms with TARP levels (Modified after [26]).
3.3. Proposed Acceleration TARP Framework
The acceleration trends derived from the calculation framework described in Section 3.1 represent meaningful deviations from baseline behaviour when they differ from zero. It should be emphasized, however, that acceleration monitoring is not proposed as a replacement for existing monitoring parameters. Deformation and velocity data retain considerable diagnostic value and remain essential components of a comprehensive slope monitoring framework.
Non-zero acceleration deviations are particularly useful as a screening tool, as they represent departures from slopes that exhibit stable behaviour (e.g., constant or regressive deformation). In practice, baseline conditions frequently include instrument cycling, atmospheric effects, and other sources of noise that velocity-based triggers may be disproportionately sensitive to. Sustained positive acceleration, that is, acceleration remaining above zero over a sufficient time window, may indicate the approach to a critical failure state, particularly when accompanied by concurrent increases in deformation and velocity. Under these conditions, the OOA point can be identified, and the inverse velocity method should be applied to estimate potential failure times, as established in the literature [3,7,14].
A potential acceleration trend function leading to failure is discussed in Beingessner [19]. This function is analogous in form to those proposed for deformation and velocity, but is applied to the acceleration signal. Combined use of acceleration and velocity has also been proposed by [27], who demonstrated that plotting the relative magnitude of velocity and acceleration against a trend line can discriminate between stable and non-stable slope states; the approach, illustrated in Figure 9, was reviewed across nine monitoring records at an open pit mine in Norway. Nevertheless, among mining operators and consultants, the inverse velocity method remains the most practical approach for estimating failure time, given its simplicity and established track record.
Figure 9.
Acceleration and Velocity in Monitoring Brittle Failures (modified from [27]).
The TARP framework proposed here and summarised in Table 2 offers a potential middle path: reducing nuisance alarms during regressive conditions while preserving sensitivity to the onset of progressive failure. Acceleration primarily serves to identify the OOA point and to determine when the Fukuzono method [7] is appropriately applied. Episodic acceleration is interpreted as indicative of an incomplete failure surface, whereas sustained positive acceleration suggests that the failure surface is fully, or nearly fully, developed. Supplementary alarm criteria, including coherence, amplitude, and tracking alarms [28], may be applied following OOA identification through acceleration filtering. A known limitation of velocity-based alarms is their susceptibility to atmospheric artifacts, which can generate false positives and contribute to alarm fatigue. Uncritical acceptance of velocity threshold exceedances without assessing contextual trends is therefore problematic. While some practitioners have argued against blanket alarm systems for this reason, a monitoring program that relies solely on periodic trend review introduces its own risks, including susceptibility to heuristic bias and delayed response.
Table 2.
Acceleration TARP Framework.
Slope damage is not proposed as a standalone failure criterion with a universal threshold value. Its role is diagnostic; it serves as a screening indicator for the OOA transition, complementing rather than replacing velocity-based monitoring parameters. The absence of a universal threshold reflects the parameter’s inherently site-specific nature, consistent with the lack of universal inverse-velocity thresholds in established TARPs frameworks. Indeed, proposing a universal threshold for any slope monitoring parameter would be contrary to sound professional practice in rock engineering; site-specific calibration against local geological conditions, failure mechanisms, and monitoring system characteristics is not merely preferred but required. Slope damage should therefore be interpreted within the broader geotechnical context of the site, alongside deformation trends, velocity records, and assessments of failure mechanisms.
4. Brittle Failure and Rock Bridges
When considering brittle failure processes, the reliability of monitoring-driven TARPs depends not only on the adopted calculation frameworks but also on the underlying geotechnical conditions that govern failure development. Two factors are particularly relevant: the nature of brittle failure processes, which determines whether progressive acceleration, as required by the Fukuzono method [7], will occur; and the role of rock bridges, which governs the transition from episodic to sustained acceleration. This section examines both and develops the conceptual link between rock bridge degradation, fracture network connectivity, and the OOA point.
4.1. Applicability of the Inverse Velocity Method
As previously discussed, the inverse velocity method was developed under controlled laboratory conditions using a model consisting of a sloped concrete base with loose frictional sand, in which failure was induced by wetting. The resulting monitoring data exhibited progressive acceleration, and by inverting the velocity plot, a linear trend was identified, whose intercept with the time axis provided an estimate of the failure time; this linearity was also noted by [3] during the terminal phase preceding catastrophic failure.
This experimental configuration implicitly assumed the existence of a continuous, fully mobilised failure surface from the outset, the sand-concrete interface providing a pre-existing basal sliding surface with no intact-rock bridges or progressive damage mechanisms. The conditions under which the method was derived are therefore entirely consistent with the paper’s proposition that sustained acceleration, and by extension the valid application of the inverse velocity method, requires a fully or nearly fully mobilised failure surface. This is further discussed in Section 4.3.
The applicability of this method to field conditions has been questioned, particularly given the fundamental differences in stress–strain behaviour between granular soils and rock, and the specific concern that a soil-derived empirical method may not translate reliably to brittle rock failure. Empirical evidence suggests, however, that the method has broad applicability and has performed well across a wide range of failure types, from early documented cases [4,29] to more recent investigations [27] and those documented in Beingessner [19]. The method appears most applicable to failures exhibiting progressive acceleration toward catastrophic collapse. It is less reliably applied in the following circumstances:
- Brittle failures, such as rockfalls or liquefaction events;
- Slopes with strongly contrasting material stiffness or shear strength along the failure surface, where load redistribution is highly localized;
- Sudden, catastrophic events, such as those triggered by extreme seismic loading.
For brittle failures such as rockfalls or liquefaction events, the failure occurs too rapidly for progressive acceleration to develop over a monitoring-relevant timescale. For slopes with strongly contrasting material stiffness or shear strength along the failure surface, load redistribution is highly localised rather than progressive, meaning that acceleration does not develop uniformly across the failure surface, and the sustained linear inverse velocity trend required by the Fukuzono method does not emerge. For sudden catastrophic events triggered by extreme seismic loading, the external forcing overwhelms any progressive internal damage mechanism, and the failure is driven by the loading event rather than by the gradual mobilisation of the failure surface that the inverse velocity method presupposes. In all three cases, the common thread is the absence of the progressive, sustained acceleration that is the fundamental precondition for the method’s applicability, as discussed in Section 2.3.
The theoretical basis for the method’s applicability to brittle rock failure has been explored by several authors. Voight [29] invoked subcritical crack growth and progressive stress transfer to adjacent rock as mechanisms for accelerating deformation, a concept further elaborated in the context of creeping landslides by [30]. Reches and Lockner [31] proposed that at a critical crack density, adjacent microcracks interact and propagate unstably into intact rock, generating a shear surface that advances progressively through undeformed material. Helmstetter et al. [32] applied a slider-block model to the La Clapière and Vajont landslides to explore how velocity- and state-dependent friction laws might govern basal sliding. More broadly, material damage laws [33,34] have been applied across a wide range of materials and loading conditions, including strain- and seismic energy-based formulations, providing a theoretical basis for the proposition that materials under load, including rock, may exhibit accelerating deformation preceding catastrophic failure.
Some ambiguity in this discussion stems from the inconsistent use of the term “brittle failure,” which is applied both to sudden, low-ductility fracture following elastic deformation and, separately, to liquefaction, phenomena that are mechanistically distinct. For the purposes of this paper, brittle failure refers to a rapid loss of strength with limited plastic deformation prior to the peak stress, resulting in a comparatively abrupt change in acceleration as observed in monitoring data. This is distinguished from ductile or creep-dominated failure, in which strength loss is gradual and acceleration trends are correspondingly more progressive.
In practice, different portions of a failure surface may simultaneously undergo plastic shear, approach peak strength, or fail through intact rock along microdefects, consistent with the progressive failure framework described by Voight [29]. The precise mechanism operating along any given failure surface is inherently uncertain. What does appear empirically robust is that ground movements follow Newton’s second law: acceleration occurs when a net destabilizing force is applied. This is proposed to hold for both episodic acceleration and for progressive failure following the OOA point, under which conditions the inverse velocity method is considered applicable.
Several case studies presented in Beingessner [19] indicate that brittle failures can be successfully monitored using the inverse velocity method. Some records exhibit steep inverse velocity trends, providing limited warning time; others indicate warning periods of less than one day. However, the same author notes that this specific case is characterized by identifiable precursor signals, including a change in relative acceleration and incremental deformation recorded at the toe of the failure rather than at the crest, consistent with a basal rather than a toppling mechanism. The observation that steeper, smoother inverse-velocity trends are associated with more brittle failure behaviour is consistent with the broader pattern observed across many case studies [19].
It is the authors’ view that brittle failures can, in general, be effectively monitored, particularly with modern high-frequency ground-based monitoring systems and knowledgeable geotechnical practitioners. However, an appropriate TARP configuration within a robust governance framework is essential. High-frequency acquisition systems (e.g., two-minute scan intervals) are more susceptible to calculation artifacts than lower-frequency systems, while low-frequency systems (e.g., weekly satellite acquisitions) may fail to capture rapidly evolving events entirely. Acceleration monitoring and slope damage calculations may provide early deviation signals within a Plan-Do-Check-Act (PDCA) framework, offering a basis for tiered alarm response.
Regarding whether the inverse velocity method applies to brittle failure, a binary answer is neither appropriate nor accurate. The method is demonstrably effective in certain brittle-failure settings and requires caution in others. The governing principle remains: for an object to change position, energy must be expended. Large-scale brittle failures in rock should not be treated as inherently sudden or unforeseeable events; rather, they warrant systematic engineering assessment, recognizing that slope movements, however rapid, are physical processes governed by Newton’s second law and, as such, are, in principle, detectable through diligent monitoring.
4.2. Brittle Failure Processes and Slope Damage
Following the conceptual framework introduced in Section 2.2, slope damage can be understood as the cumulative number of acceleration events the slope has undergone. This differs from a strain-based method [20] in that linear velocity strain is not accumulated, and there is no divisor such as slope height. Both methods are thought to be at least partially difficult to implement and track, especially when using non-continuous methods such as ground-based radars, which require frequent re-creation of monitoring records.
The value of the strain-based method is that it is rooted in strain principles, which apply in stress–strain curves and associated laboratory testing of rock samples. A difficulty with the method is that it is somewhat arbitrary to assign a slope height at which the percentage of strain is determined. For the case studies presented in this paper, a direct quantitative comparison between slope damage and strain-based OOA approaches was not considered meaningful, given differences in slope geometry and monitoring configuration between the cases and those for which the strain-based method was originally developed. We acknowledge this as a limitation, and a systematic comparison between the two approaches across a consistent dataset with known slope geometry is identified as a priority for future work. It should be noted, however, that the strain-based method’s dependence on an arbitrarily assigned slope height, which this paper identifies as a fundamental difficulty, means that agreement between the two methods would not necessarily constitute evidence of validity for either.
In complete monitoring records and stable slope heights, such as those presented for a wedge failure at Greenhills [35], strain-based methods appear to show reasonable correlations with OOA at around 2% strain. Some slopes at Gibraltar mine, however, reached a value of 25% prior to failing [20]. Comparatively, slope damage (as currently proposed) is subject to an artificial dampening of acceleration from the outset, which may yield different values depending on the extent of the relative reduction in acceleration amplitude.
Some failures appear to withstand significantly more deformation than others. For large deep-seated rockslides in particular, failure of intact rock parts along the three-dimensional failure surface may occur during periods of overall deceleration, driven by localised stress concentrations that arise during an interlocking stage. Under such conditions, the slope damage metric, as currently formulated, may underestimate cumulative damage because it does not accumulate during deceleration phases. This represents a recognised limitation of the framework, whose applicability is strongest for brittle, acceleration-driven failure mechanisms. For example, the in situ rock in the 2019 Jordan Slide [36] degraded into a soil-like mass, resulting in a 330 kt circular failure. In others, structural geology can result in significant strain with no failure [19]. Recent advancements in geophysical monitoring may offer insights into relative stiffness, resonant frequency, and the monitoring of brittle failure processes at depth, as illustrated by the La Praz landslide [37] and landslides in the Austrian Alps [30].
If stress transfer is a key parameter governing the potential for brittle failure in rock slopes, the conceptual validity of limit equilibrium models under such conditions warrants scrutiny, particularly given their inability to account for the progressive, stress-path-dependent nature of rock bridge failure. The direct quantification of rock bridge contribution within limit equilibrium models presents a fundamental challenge. The existence and definition of rock bridges depend on the specific rock engineering problem and failure mechanism under consideration. Current industry practice commonly relies on Jennings’ rock bridge percentage method [38]; however, Elmo [39] has demonstrated that this approach can lead to non-conservative assumptions when a rock bridge percentage greater than 10% is assumed in the analysis. This limitation is compounded by a more fundamental problem: direct measurement of rock bridge percentage in the field is not possible, rendering the input parameter itself an unverifiable assumption rather than a measurable quantity. This is further discussed in Section 4.3.
The inverse velocity method in rock slopes can be influenced by factors such as triggers, for example, a reduction in shear strength related to groundwater, damage, or shearing; loading factors such as cyclic loading (seismic, groundwater or other) or placement of material; or removal of passive resistance during mining activities. Indeed, several case studies refer to the removal of a “key-block” [20]. These key blocks provide the last vestiges of strength, holding material in place. In general, they represent regions where potential brittle failure would concentrate and can occur from relatively low amounts of (additional) strain, either along existing fractures or through intact rock. In the case of failure through intact rock, tensile strength and crack development theory [40] may apply more than is currently understood or analyzed, particularly in toppling slopes. In the context of subcritical crack growth and creep velocity [30], the applied stress along a shear plane may increase exponentially within an intact key block. It is proposed that an increase in acceleration amplitude may provide an early indication of this slope condition. Indeed, ref. [19] reported several examples of acceleration curves that resemble seismic (earthquake) plots.
Updates to Griffith’s crack theory, which assessed the direction and associated movements of a fracture, have been further examined by investigating force chains in brittle fracture [41]. As part of this, a conceptual framework was developed to show where loads might develop during a slope failure, as inferred from slope stability radar data [41].
These are all important factors to consider in the case of the inverse velocity method as it relates to failure forecasting, and require detailed assessments of geotechnical models. For example, structural geology may greatly influence the development of a slope failure and cause it to coalesce in a very different manner [42]. Groundwater, in both pressure and hydromechanical senses, may influence the development and propagation of shear planes [12].
Slope Damage: An Acceleration Framework and Slope Modelling Perspective
Slope damage, from an acceleration-framework and slope-modelling perspective, is most likely to occur during modelling time steps in which the model is changed. In most models, this would occur during excavation steps (akin to removing a block), thereby altering the slope’s stress regime. Other event types could include changes in boundary conditions, changes in pore pressure, or seismically induced events. When considering models capable of simulating time-dependent damage, it would be possible to establish acceleration variations within the model. These accelerations may be episodic and related to an event, followed by a regression to a null (zero) value. In order for this to occur, the stress must have exceeded the strength of the material (ignoring, for the purposes of this discussion, linear elastic response to unloading). In numerical models, these “damage” events typically manifest as yielded elements.
Episodic acceleration that does not progress to failure is, within the context of this paper, classified as accumulating slope damage. Accelerations that progress to failure would be indicated in numerical modelling either by catastrophic failure or by models “failing to resolve” due to deformation amounts exceeding the software’s capacity. This would particularly be the case in “small strain” type models. Slope damage is recorded as progressing to failure through continual acceleration until the model capacity is reached.
Differing modelling types have varying capabilities in this regard [43]. For instance, when assessing the San Leo landslide (Italy), the authors [43] used two different modelling approaches: a Finite-Discrete Element (FDEM) analysis and a lattice-spring model, both of which allow representation of brittle failure, explicit in the former and implicit in the latter. Havaej et al. [21] tested several modelling approaches, including continuum-based frictional plasticity theory, discontinuum-based DEM modelling with Voronoi tessellation, and FDEM modelling with explicit fracture capability. Damage intensity versus simulation time was illustrated graphically on a per-section basis and described a slope-damage approach to failure development.
4.3. OOA Hypothesis and Rock Bridge Strength Degradation
Figure 10 below illustrates a hypothetical slope in which rock bridge failure (i.e., brittle failure) may occur, along with potential slope monitoring indicators of inverse velocity and acceleration trends, as well as when the OOA and inverse-velocity methods are thought to apply. In our conceptual model, three periods (A, C and E) represent acceleration events. These events could be considered triggered by activities such as mining or blasting. The first two events represent temporary acceleration above zero, during which brittle fracture and shear sliding mechanisms, namely rock bridge failure and displacement across existing joint surfaces, mobilize certain portions of the slope. Small strains result in initial brittle shear along joints, leaving residual shear strength characteristics on portions of the overall slip surface that are not yet fully developed. Other portions of the slip surface, or the intact rock mass, which have not been sheared in a brittle manner, then have comparatively higher stress or driving load (from gravity).
Figure 10.
Panels (i–vi) illustrate successive stages of failure evolution from fully regressive to progressive behaviour. Shear failure (green), previously yielded zones at plastic/residual strength (pink), tensile failure (purple), and shearing through rock bridges (red) are shown along the developing failure surface. An enlarged version of the conceptual diagram is provided at the bottom of the figure for reference. Inset monitoring plots in each panel show the conceptual evolution of deformation, inverse velocity, and acceleration trends for each stage.
Continual deformation (sometimes referred to as secondary creep) then occurs until point E, or OOA. At the OOA point, acceleration remains above zero for prolonged periods, and a full, or quite close to full, slip surface exists along the length of the slope. Additionally, as a result of continued deformation and increased load on the comparatively small remaining portions of the slip surface that have yet to be fully mobilized or sheared at peak strength, failure along rock bridges may occur [39,44]. Rock bridge failure may have occurred earlier (as illustrated during period C); however, at the OOA point, it is hypothesized that a comparatively greater failure occurs in the remaining intact portions of the rock bridge due to the increased load. Conceptually, with ongoing deformation (strain) and shear, an increasing number of portions of the overall failure surface are thought to be at residual strength. Prior to OOA (Point E), inverse velocity does not show a consistent linear trend to failure, and acceleration decreases back to zero. At stage E, the OOA point is reached: a fully or nearly fully developed failure surface exists, acceleration remains persistently above zero, and inverse velocity follows a sustained linear trend toward failure. Stage F represents the progressive failure phase, during which the inverse velocity method is applicable, and acceleration continues to increase toward collapse. This conceptual interpretation matches failure records listed in [19].
In the context of the inverse velocity method, inverse velocity, acceleration and slope damage may provide clues describing the potential state of rock bridge failure within a slope. As different portions of slopes may deform in different amounts and have different strength characteristics, some portions of slopes may be stable, while others may be comparatively unstable. It stands to reason, then, that wide-area monitoring methods provide significant value. Methods such as SSAFE [41] have investigated the assignment of relative stability weightings across a slope.
Up to this point, the discussion has implicitly assumed that rock bridges can be defined and identified prior to failure. Figure 10 reflects this assumption by adopting an implicit definition of rock bridges as the geometric distances between non-persistent fractures. However, Elmo [39] identifies two fundamental restrictions on our knowledge of rock bridges that challenge this assumption:
- A rock bridge’s existence is known only the moment it fails. It can neither be observed nor measured before failure.
- Because of this conditional existence, the contribution of rock bridges to rock mass strength can only be described as a potential, not a quantity or a percentage.
The concept of rock bridge potential refers to the capacity of a rock mass to resist failure, governed by a combination of intact rock strength, loading conditions, fracture network connectivity, and block interlocking [39].
During progressive failure (as illustrated in the example in Figure 10), the rock bridge potential is dissipated through kinematically controlled mechanisms, elastic deformation, and plastic yielding, resulting in fracturing of the intact rock and block sliding or rotation.
To characterise the degree of connectivity and interlocking within a rock mass, refs. [39,45] developed the Network Connectivity Index (NCI), a connectivity-based characterisation tool that integrates fracture size (fracture intensity), fracture intersections, and fracture density per unit area or volume. The NCI quantifies the degree of fracture network connectivity along a potential failure surface and, by extension, the residual contribution of intact rock bridges to rock mass strength.
Building on this, Elmo [39] proposed that numerical simulations of fracturing processes can be used to define a rock bridge potential, expressed as the ratio of the induced fracturing NCIrb to the combined total of natural NCI and induced-fracturing NCIrb at failure (Figure 11a,b). Indeed, Figure 11b illustrates how two rock masses with approximately equivalent NCI values yield markedly different NCIrb values, demonstrating that their failure mechanisms are fundamentally distinct. For rock mass A1, failure is governed largely by stress-driven fracturing, with structurally controlled mechanisms becoming more prominent only after a failure surface has been established. Rock mass A2, by contrast, already presents a near-continuous fracture along the shearing path, resulting in minimal stress-driven failure; the overall mechanism in this case is structurally controlled from the outset.
Figure 11.
Rock bridge potential and NCI-based characterization of failure mechanisms. (a) NCI–NCIrb space illustrating the relationship between natural fracture network connectivity and stress-driven induced fracturing, with failure mechanism domains defined as a function of the rock bridge potential; (b) direct shear box simulation results for Models A1 and A2, showing two rock masses with similar natural NCI but markedly different NCIrb thresholds at failure (modified from [39]; (c) Conceptual relationship between rock bridge potential and episodic acceleration events leading to the OOA point; and (d) comparison of rock bridge potential and acceleration curves for two rock masses with contrasting natural fracture network connectivity (high connectivity in green; low connectivity in blue), illustrating that the OOA threshold is reached at different levels of induced fracturing depending on initial NCI.
As a rock slope fails by brittle fracture, NCIrb increases progressively toward a critical threshold, reflecting the transition from a poorly connected fracture network with significant intact rock bridge strength to a fully connected network governed solely by residual strength (Figure 11c). Applying this reasoning to the context of acceleration monitoring, we therefore hypothesize that the OOA point corresponds to reaching this critical NCIrb, at which point the remaining rock bridge strength is insufficient to arrest progressive acceleration, and sustained failure becomes inevitable. It follows that the threshold at which inverse velocity becomes applicable, marking the onset of structurally controlled failure mechanisms, is itself a function of the initial natural NCI (Figure 11d). Rock masses with higher natural connectivity will reach this threshold with comparatively less induced fracturing and are therefore more susceptible to a rapid transition from regressive to progressive failure.
The authors acknowledge, however, that NCIrb remains a numerical threshold. Direct measurement of this critical value is not merely challenging but impossible in principle. Consistent with the paper’s broader position, a rock bridge cannot be observed or measured before failure. NCIrb can therefore only be described as a potential, derived from DFN and geomechanical models that are themselves subject to well-documented limitations in calibration and validation. This is not a limitation unique to the NCIrb approach; it applies equally to other widely accepted rock engineering frameworks that have never been validated against direct measurement at the rock mass scale [38]. The hypothesis is nevertheless falsifiable in principle, and establishing empirical bounds on NCIrb through back-analysis of monitored failures and systematic numerical investigation across diverse rock mass configurations represents a meaningful direction for future work.
5. Discussion and Conclusions
The central argument of this paper is that acceleration, when calculated over an appropriate time window, provides diagnostic information that velocity and displacement monitoring alone cannot reliably provide, specifically, the capacity to distinguish episodic, event-driven deformation from sustained, progressive failure in near real time. The three components of the proposed framework are conceptually unified by this argument. Slope damage, as the cumulative integral of positive accelerations, translates the instantaneous acceleration signal into a progressive record of failure development, providing a clearer visual basis for identifying the OOA point than velocity trends alone. The OOA point, in turn, defines the condition under which the inverse velocity method is appropriately applied; namely, a fully or nearly fully mobilised failure surface along which load redistribution to intact material is no longer possible. The NCI hypothesis connects this mechanical condition to a measurable structural parameter, proposing that the OOA point corresponds to the critical fracture-network connectivity threshold beyond which rock-bridge strength can no longer arrest acceleration. Together, these three elements constitute a framework that advances from signal processing through failure mechanics to structural geology, providing a more physically grounded basis for progressive failure monitoring than currently exists in practice.
The proposed framework is complementary to, rather than a replacement for, existing monitoring practice. The inverse velocity method remains the most practical tool for failure time estimation, as established by decades of empirical application [7,14], and the present work does not challenge its utility within its domain of applicability. Strain-based OOA approaches [46] offer a physically grounded alternative metric for OOA identification, and the slope-damage concept shares a similar motivation as both seek to capture progressive failure development over time. The key distinction is that slope damage is acceleration-derived rather than displacement-derived, which makes it less sensitive to absolute deformation magnitudes and more sensitive to changes in the rate of deformation. This may be advantageous in settings where large background displacements obscure velocity trends, or where failure occurs at relatively low total displacement. Velocity-based TARP thresholds retain their value as hazard management tools, particularly for non-progressive conditions such as surficial ravelling; the present framework does not argue against their use, but proposes that acceleration filtering provides a basis for contextualizing velocity exceedances and reducing alarm fatigue in regressive conditions.
The question of whether the inverse velocity method applies to brittle failure deserves a direct response. The evidence presented in this paper, together with the broader literature, supports the following position: the method is applicable to brittle failures provided that progressive acceleration precedes collapse. That is, provided the failure is not truly instantaneous but involves a period of accelerating deformation, however brief, that is detectable by the monitoring system. The critical practical constraint is therefore not the failure mechanism per se, but the ratio between the duration of the accelerating phase and the monitoring system’s temporal resolution. High-frequency ground-based systems can capture brittle failure precursors that lower-frequency systems would miss entirely. The framework proposed here, in which acceleration is calculated over windows ranging from 1 day to 1 month, is calibrated to detect progressive failure over days to weeks and is less suited to failures that accelerate over hours. For such cases, shorter calculation windows and higher-frequency acquisition are necessary, and the TARP framework should be configured accordingly.
Several limitations of the present work should be acknowledged. First, the acceleration calculation is sensitive to the choice of time window, and no objective criterion currently exists for selecting an appropriate window length for a given site and monitoring system. The guidance offered in Section 3.1, spanning at least one day and no more than one month, with the specific period calibrated against stable reference areas, is necessarily qualitative. Establishing more robust, site-adaptive criteria for window selection represents an important area for further development. Second, the NCIrb threshold is currently a conceptual construct. While the hypothesis is falsifiable in principle, it has not yet been tested against empirical data, and the critical connectivity value at which OOA occurs is unknown. Third, the framework has been illustrated through representative monitoring records rather than validated against a systematic dataset. The conceptual claims are supported by the case study evidence presented, but their generalisability across failure mechanisms, rock mass types, and monitoring system configurations has not been formally established.
Geomechanical field observations, including evidence of crack growth, increasing joint aperture, newly formed fractures, and differential movements, provide essential contextual information that complements monitoring data and strengthens the interpretive basis for OOA identification. The integration of such observations into the proposed framework represents a meaningful avenue for further development. While the framework was developed in the context of open pit mining, the underlying physical principles are not inherently restricted to engineered slopes, and application to natural slopes represents a further direction for future work, subject to the additional complexities of natural slope geometry, geological variability, and monitoring access constraints.
These limitations define a clear agenda for future work. The most immediate priority is empirical validation of the acceleration-OOA framework against a larger and more systematically characterised dataset of slope monitoring records, spanning both failure and non-failure cases. This work is directly enabled by the database compiled in [19] and is planned as a follow-on study. Establishing empirical bounds on NCIrb through back-analysis of monitored failures, using DFN and geomechanical models calibrated to documented cases, would provide the first quantitative test of the NCI hypothesis and could ultimately support its integration into design practice. Integration of the acceleration calculation and slope damage framework into slope monitoring software platforms is a practical priority, given that current software limitations are among the principal obstacles to routine acceleration assessment identified in this paper.
Finally, numerical modelling, using hybrid finite-discrete element approaches capable of representing progressive brittle fracture, provides a controlled environment for testing the relationship among rock bridge degradation, fracture network connectivity, and the onset of sustained acceleration. Taken together, these directions position the present conceptual framework as a foundation for a more physically grounded and operationally practical approach to monitoring progressive slope failure.
Author Contributions
Conceptualization, T.B. and D.E.; methodology, T.B.; formal analysis, T.B.; investigation, T.B.; resources, T.B. and D.E.; data curation, T.B.; writing—original draft preparation, T.B. and D.E.; writing—review and editing, T.B. and D.E.; visualization, T.B. and D.E.; supervision, D.E. All authors have read and agreed to the published version of the manuscript.
Funding
This research received no external funding.
Data Availability Statement
This paper used a comprehensive database of historical slope monitoring records compiled by [19]; readers are referred to that work, which is publicly available as a dissertation, for full details on the database composition, case study selection criteria, and individual monitoring records.
Conflicts of Interest
The author Thomas Beingessner was employed by the Teck Highland Valley Copper Partnership company. All authors declare that the research was conducted in the absence of any commercial or financial relationships that could be construed as a potential conflict of interest.
Abbreviations
The following abbreviations are used in this manuscript:
| OOA | Onset Of Acceleration |
| TARP | Trigger Action Response Plan |
| LOS | Line-of-Sight |
| PDCA | Plan-Do-Check-Act |
| NCI | Network Connectivity Index |
References
- Federico, A.; Popescu, M.; Elia, G.; Fidelibus, C.; Interno, G.; Murianni, A. Prediction of time to slope failure: A general framework. Environ. Earth Sci. 2012, 66, 245–256. [Google Scholar]
- Terzaghi, K.; Peck, R. Soil Mechanics in Engineering Practice; John Wiley: Hoboken, NJ, USA, 1948. [Google Scholar]
- Saito, M. Forecasting the time of occurrence of a slope failure. In Proceedings of the 6th International Conference on Soil Mechanics and Foundation Engineering; ISSMGE: London, UK, 1965; Volume 2, pp. 537–540. [Google Scholar]
- Kennedy, B.; Niermeyer, K. Slope monitoring systems used in the prediction of a major slope failure at the Chuquicamata Mine. In Proceedings of the Symposium on Planning Open Pit Mines; South African Institute: Johannesburg, South Africa, 1971; pp. 215–225. [Google Scholar]
- Hoek, E.; Bray, J. Rock Slope Engineering: Revised Second Edition; Institution of Mining & Metallurgy: London, UK, 1977. [Google Scholar]
- Varnes, D. Slope movement types and processes. Landslides, analysis and control. In Special Report; Transportation Research Board: Washington, DC, USA, 1978; pp. 11–33. [Google Scholar]
- Fukuzono, T. A new method for predicting the failure time of a slope. In Proceedings of the 4th International Conference and Field Workshop on Landslides; The Japan Landslide Society: Tokyo, Japan, 1985. [Google Scholar]
- Desai, C.; Samtani, N.; Vulliet, L. Constitutive modeling and analysis of creeping slopes. J. Geotech. Eng. 1995, 121, 43–56. [Google Scholar] [CrossRef] [Scilit]
- Picarelli, L.; Urciuoli, G.; Russo, C. Mechanics of slope deformation and failure in stiff clays and clay shales as a consequence of pore pressure fluctuation. In Proceedings of 8th International Symposium on Landslides; Thomas Telford Ltd.: London, UK, 2000; p. 34. [Google Scholar]
- Mercer, K. Investigation into the Time Dependent Deformation Behaviour and Failure Mechanisms of Unsupported Rock Slopes Based on the Interpretation of Observed Deformation Behaviour. Doctoral Dissertation, University of the Witwatersrand, Johannesburg, South Africa, 2006. [Google Scholar]
- Sullivan, T. Hydromechanical coupling and pit slope movements. In Slope Stability 2007: Proceedings of the 2007 International Symposium on Slope Stability in Open Pit Mining and Civil Engineering; Australian Centre for Geomechanics: Perth, Australia, 2007. [Google Scholar]
- Kilburn, C.; Petley, D. Forecasting giant catastrophic slope collapse: Lessons from Vajont northern Italy. Geomorphology 2003, 54, 21–32. [Google Scholar] [CrossRef] [Scilit]
- Crosta, G.; Agliardi, F. Failure forecast for large rock slides by surface displacement measurements. Can. Geotech. J. 2003, 40, 176–191. [Google Scholar] [CrossRef] [Scilit]
- Rose, N.; Hungr, O. Forecasting potential rock slope failure in open pit mines using the inverse-velocity method. Int. J. Rock Mech. Min. Sci. Géoméch. Abstr. 2007, 44, 308–320. [Google Scholar] [CrossRef] [Scilit]
- Dick, G. Development of an Early Warning Time-of-Failure Analysis Methodology for Open Pit Mine Slopes Utilizing the Spatial Distribution of Ground-Based Radar Monitoring Data. Bachelor’s Thesis, University of British Columbia, Vancouver, BC, Canada, 2013. [Google Scholar]
- Farina, P.; Taurino, V.; Ciampalini, A.; Colombo, D. Spatially distributed and multi-temporal inverse velocity analysis: Toward a proactive slope monitoring approach. In Proceedings of the Slope Stability 2022 Symposium, Tucson, AZ, USA, 17–21 October 2022. [Google Scholar]
- Eberhardt, E.; Preisig, G.; Gischig, V. Progressive failure in deep-seated rockslides due to seasonal fluctuations in pore pressures and rock mass fatigue. In Landslides and Engineered Slopes. Experience, Theory and Practice; CRC Press: London, UK, 2016; pp. 121–136. [Google Scholar] [CrossRef] [Scilit]
- Torres, A.; Cabrejo, A.; Musa, R.; Ega, I.; Sanang, M.; Dwitya, R.; Saunders, P. A study on 3000+ slope failures in open pit mines detected with interferometric radars. In Proceedings of the Slope Stability 2024 Symposium, Belo-Horizonte, Brazil, 14–19 April 2024. [Google Scholar]
- Beingessner, T.J. Slope Damage and Accelerations of Slope Failures; MASc UBC Theses and Dissertations; University of British Columbia: Vancouver, BC, Canada, 2026. [Google Scholar] [CrossRef]
- Dick, G.; Nunoo, S.; Smith, S.; Newcomen, W.; Kinakin, D.; Stilwell, I.; Danielson, J. Monitoring and managing large deformation pit slope instabilities at a British Columbia copper mine. In Slope Stability 2020: Proceedings of the 2020 International Symposium on Slope Stability in Open Pit Mining and Civil Engineering; Australian Centre for Geomechanics: Perth, Australia, 2020; pp. 439–452. [Google Scholar]
- Havaej, M.; Stead, D.; Eberhardt, E.; Fisher, B. Characterization of bi-planar and ploughing failure mechanisms in footwall slopes using numerical modelling. Eng. Geol. 2014, 178, 109–120. [Google Scholar] [CrossRef] [Scilit]
- Cabrejo-Lievano, A.; Musa, R.; Ega-Putra, I.; Saunders, P.; Torres, A.; Leonnardo, P. A study on 2000+ slope failures in open pit mines detected with interferometric radars. In Proceedings of the Slope Stability 2022 Symposium, Tucson, AZ, USA, 17–21 October 2022. [Google Scholar]
- Sharon, R.; Eberhardt, E. Guidelines for Slope Performance Monitoring. Large Open Pit Project, 1st ed.; CRC Press: London, UK, 2020. [Google Scholar]
- Sharon, R. Slope performance monitoring: System design implementation and quality assurance. In Slope Stability 2020: Proceedings of the 2020 International Symposium on Slope Stability in Open Pit Mining and Civil Engineering; Australian Centre for Geomechanics: Perth, Australia, 2020. [Google Scholar]
- Harries, N.; Rowley, K.; Prinsloo, N.; Mossop, D.; Tharandt, S. Mine based development of a pit evacuation alarm. In Proceedings of Surface Mining 2008; Southern African Institute of Mining and Metallurgy: Johannesburg, South Africa, 2008; pp. 283–290. [Google Scholar]
- Saunders, P.; Nicoll, S.; Christensen, C. Slope stability radar alarm threshold validation at Telfer gold mine. In PSSIM 2016: Proceedings of the First Asia Pacific Slope Stability in Mining Conference; Australian Centre for Geomechanics: Perth, Australia, 2016; pp. 367–378. [Google Scholar] [CrossRef] [Scilit]
- Carla, T.; Farina, P.; Intrieri, E.; Botsialas, K.; Casagli, N. On the monitoring and early warning of brittle slope failures in hard rock masses: Examples from an open pit mine. Eng. Geol. 2017, 228, 71–81. [Google Scholar] [CrossRef] [Scilit]
- Cabrejo, A.; Harries, N. ACARP Report C17023; Groundprobe: Brisbane, Australia, 2013. [Google Scholar]
- Voight, B. A method for prediction of volcanic eruptions. Nature 1988, 332, 125–130. [Google Scholar] [CrossRef] [Scilit]
- Brückl, E.; Parotidis, M. Prediction of slope instabilities due to deep-seated gravitational creep. Nat. Hazards Earth Syst. Sci. 2005, 5, 155–172. [Google Scholar] [CrossRef] [Scilit]
- Reches, Z.; Lockner, D.A. Nucleation and growth of faults in brittle rocks. J. Geophys. Res. 1994, 99, 18159–18173. [Google Scholar] [CrossRef] [Scilit]
- Helmstetter, A.; Sornette, D.; Grasso, J.-R.; Andersen, J.V.; Gluzman, S.; Pisarenko, V. Slider block friction model for landslides: Application to Vaiont and La Clapière landslides. J. Geophys. Res. 2004, 109, B02409. [Google Scholar] [CrossRef] [Scilit]
- Rabotnov, Y. Creep Problems in Structural Members; North-Holland Series in Applied Mathematics and Mechanics; North Holland Publishing Company: Amsterdam, The Netherlands, 1969; Volume 7, p. 803. [Google Scholar]
- Gluzman, S.; Sornette, D. Self-consistent theory of rupture by progressive diffuse damage. Phys. Rev. E 2001, 63, 066129. [Google Scholar] [CrossRef] [Scilit]
- Lecomte, B.; Werner, S.; Bidwell, A. Case study: Risk management for a pit slope instability through failure above a primary haul route. In Proceedings of the Slope Stability 2024 Symposium, Belo-Horizonte, Brazil, 14–19 April 2024. [Google Scholar]
- Bakken, K.M.; Chapin, G.K.; Abrahams, M.G. Trigger action response plan development and optimisation at the Bingham Canyon Mine. In Slope Stability 2020: Proceedings of the 2020 International Symposium on Slope Stability in Open Pit Mining and Civil Engineering; Dight, P.M., Ed.; Australian Centre for Geomechanics: Perth, Australia, 2020; pp. 177–190. [Google Scholar] [CrossRef] [Scilit]
- Bottelin, P.; Baillet, L. Original insights into rock slope damage processes until collapse from passive seismic monitoring. Geophys. Res. Lett. 2024, 51, e2024GL109139. [Google Scholar] [CrossRef] [Scilit]
- Jennings, J.E. A mathematical theory for the calculation of the stability of slopes in open cast mines. In Planning Open Pit Mines, Proceedings, Johannesburg; Van Rensburg, P.W.J., Ed.; A.A. Balkema: Cape Town, South Africa, 1970; pp. 87–102. [Google Scholar]
- Elmo, D. The Bologna interpretation of rock bridges. Geosciences 2023, 13, 33. [Google Scholar] [CrossRef] [Scilit]
- Griffiths, A. The Phenomena of Rupture and Flow in Solids; Royal Aircraft Establishment: Hampshire, UK, 1921; pp. 163–198. [Google Scholar]
- Tordesillas, A.; Kahagalage, S.; Campbell, L.; Bellett, P.; Batterham, R. Introducing a data-driven framework for spatiotemporal slope stability analytics for failure estimation. In SSIM 2021: Second International Slope Stability in Mining; Australian Centre for Geomechanics: Perth, Australia, 2021; pp. 235–246. [Google Scholar]
- Casagrande, D.; Klawitter, M.; Koek, M. Monitoring and risk-control of large-scale toppling failures—A case study from Ok Tedi. In ISRM EUROCK; IOP Conference Series: Earth and Environmental Science; IOP Publishing Ltd.: Bristol, UK, 2021; Volume 833. [Google Scholar]
- Donati, D.; Stead, D.; Elmo, D.; Karimi Sharif, L.; Gao, F.; Borgattie, L.; Spreafico, M. Experience gained in modelling brittle fracture in rock. In Proceedings of the 52nd US Rock Mechanics/Geomechanics Symposium, Seattle, WA, USA, 17–20 June 2018. [Google Scholar]
- Ming, Y. Numerical Modelling of Brittle Fracture and Step-Path Failure: From Laboratory to Rock Slope Scale. Doctoral Dissertation, Simon Fraser University, Burnaby, BC, Canada, 2008. [Google Scholar]
- Elmo, D.; Yang, B.; Stead, D.; Rogers, S. A new discrete fracture network approach to rock mass classification. In Proceedings of the 16th International Conference on Computer Methods and Advances in Geomechanics, Turin, Italy, 30 August–2 September 2022. [Google Scholar] [CrossRef] [Scilit]
- Newcomen, W.; Dick, G. An update to the strain-based approach to pit wall failure prediction and a justification for slope monitoring. J. S. Afr. Inst. Min. Met. 2016, 116, 379–385. [Google Scholar]
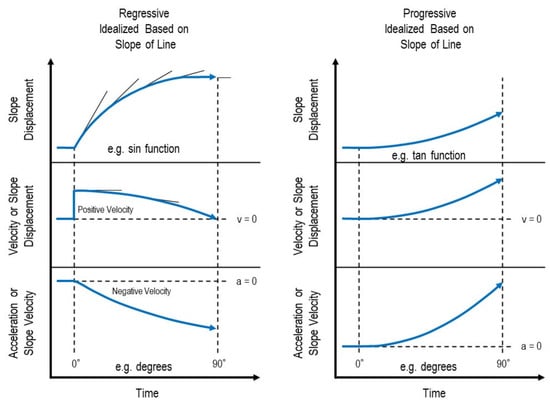
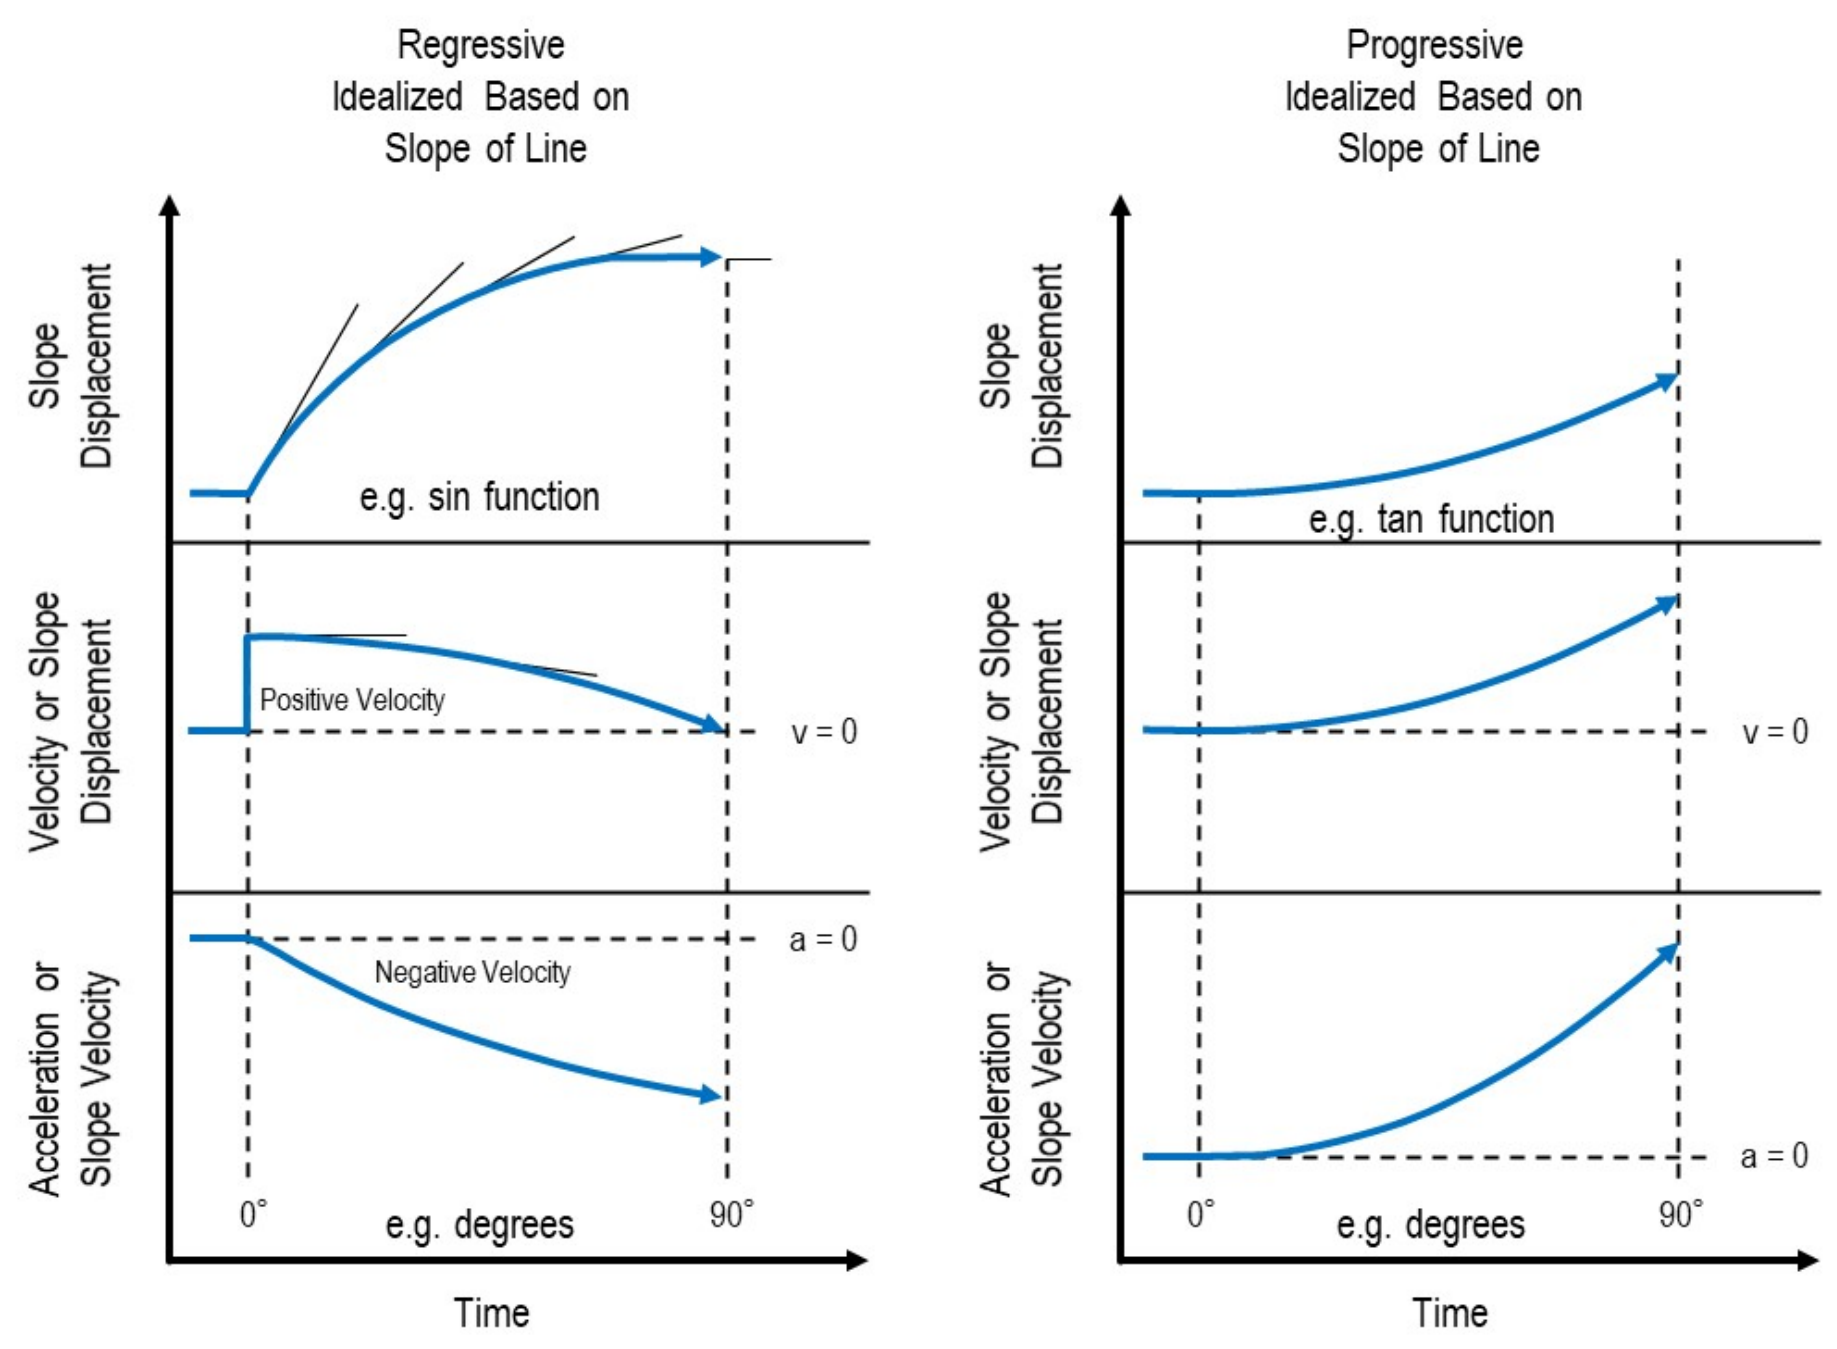
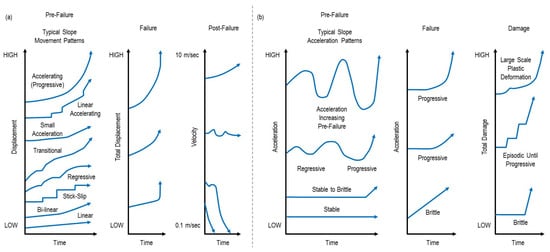
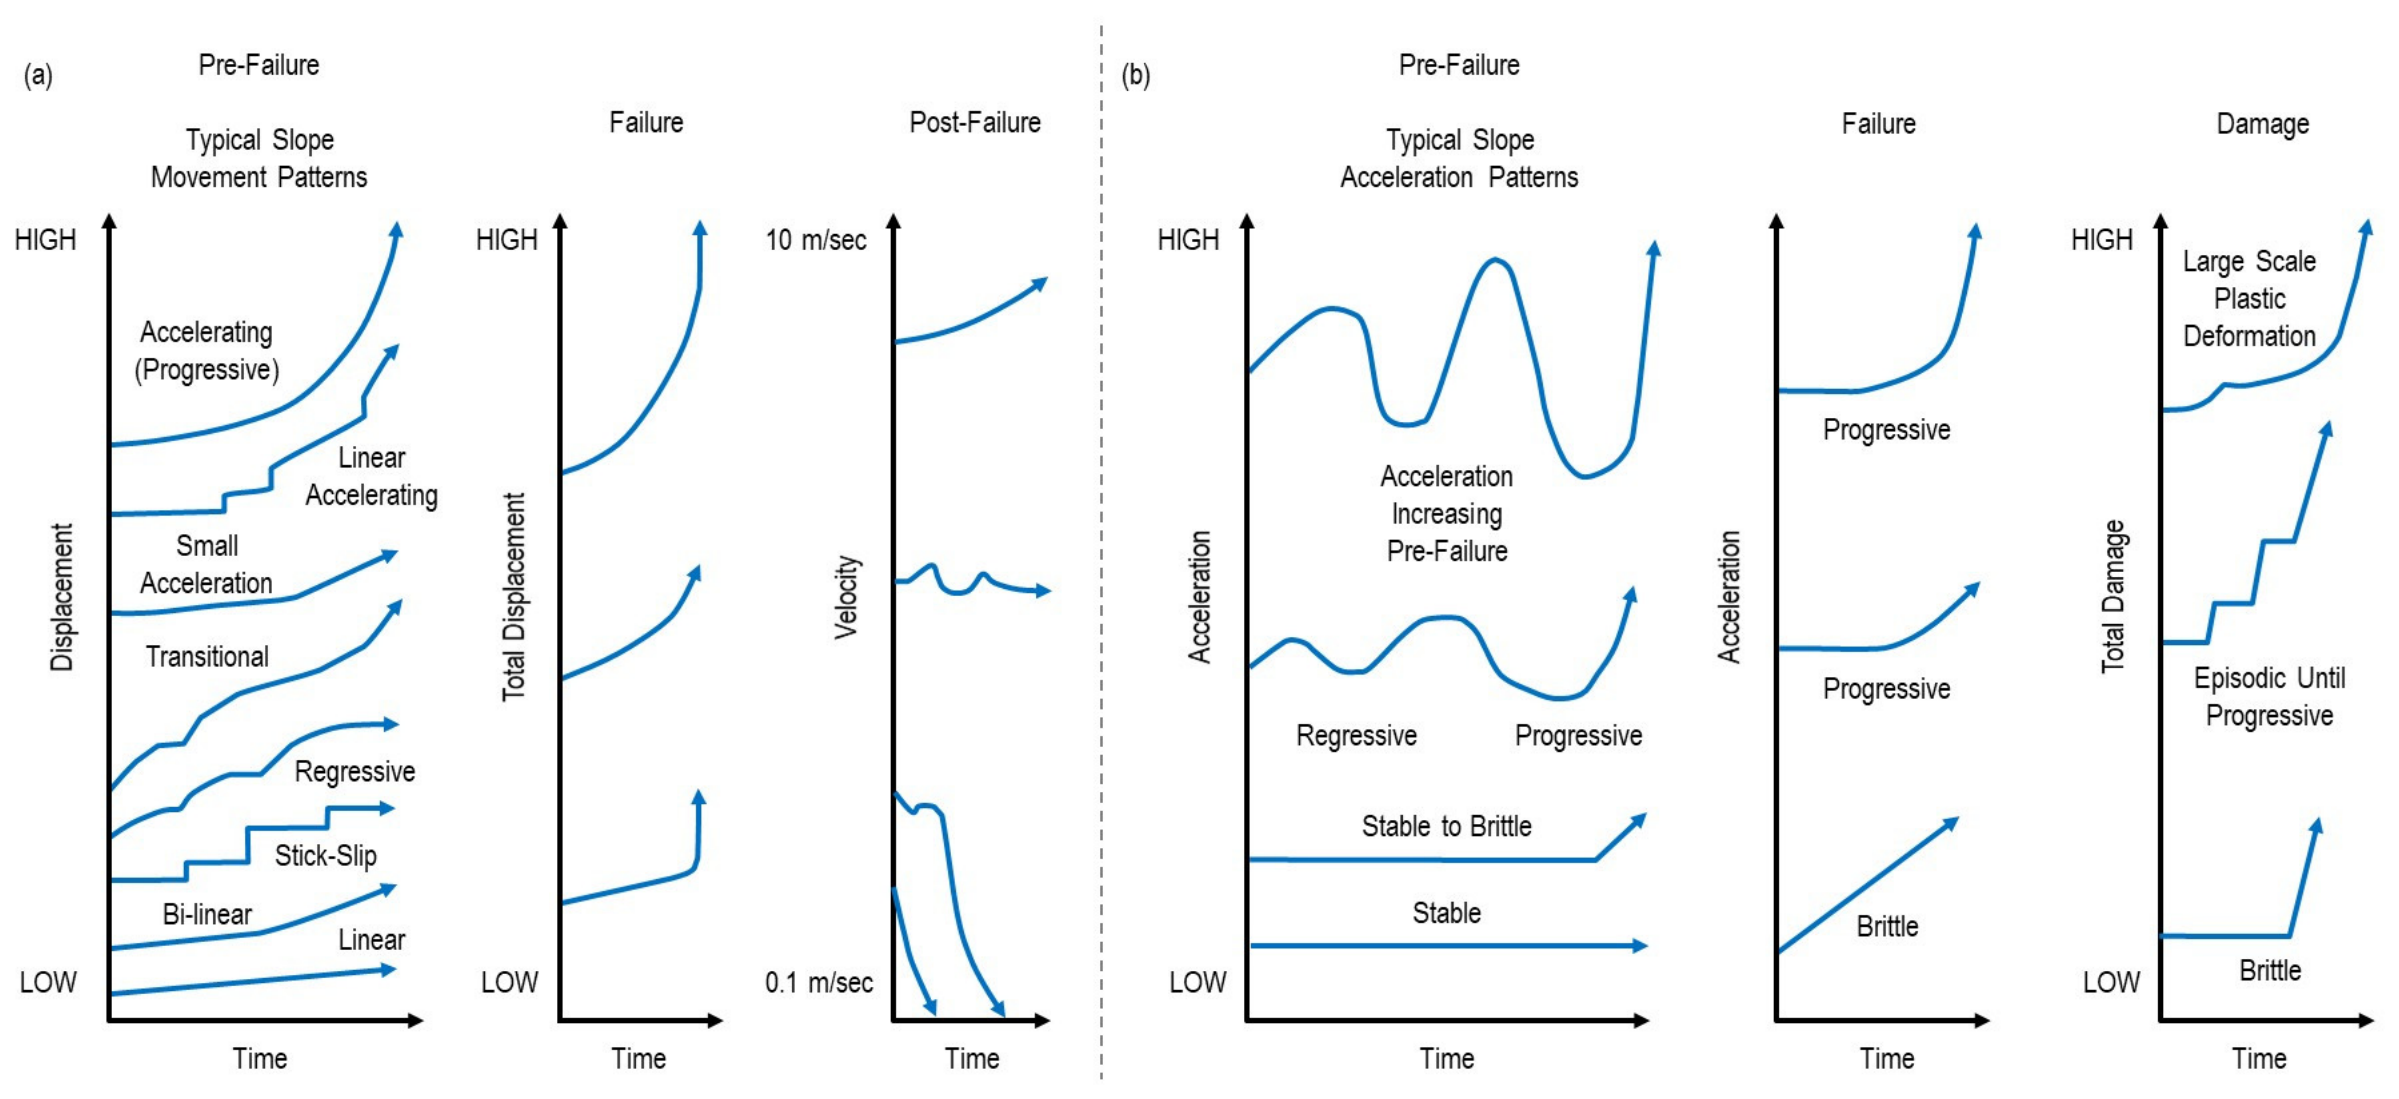
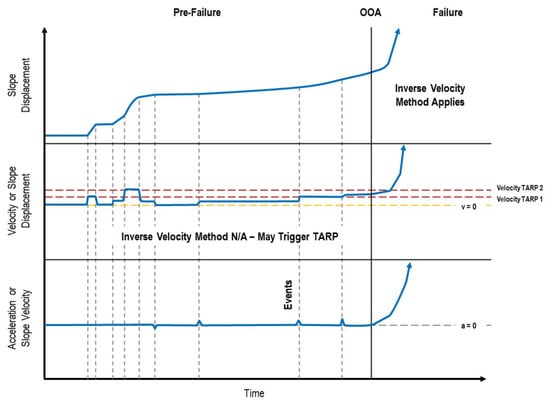
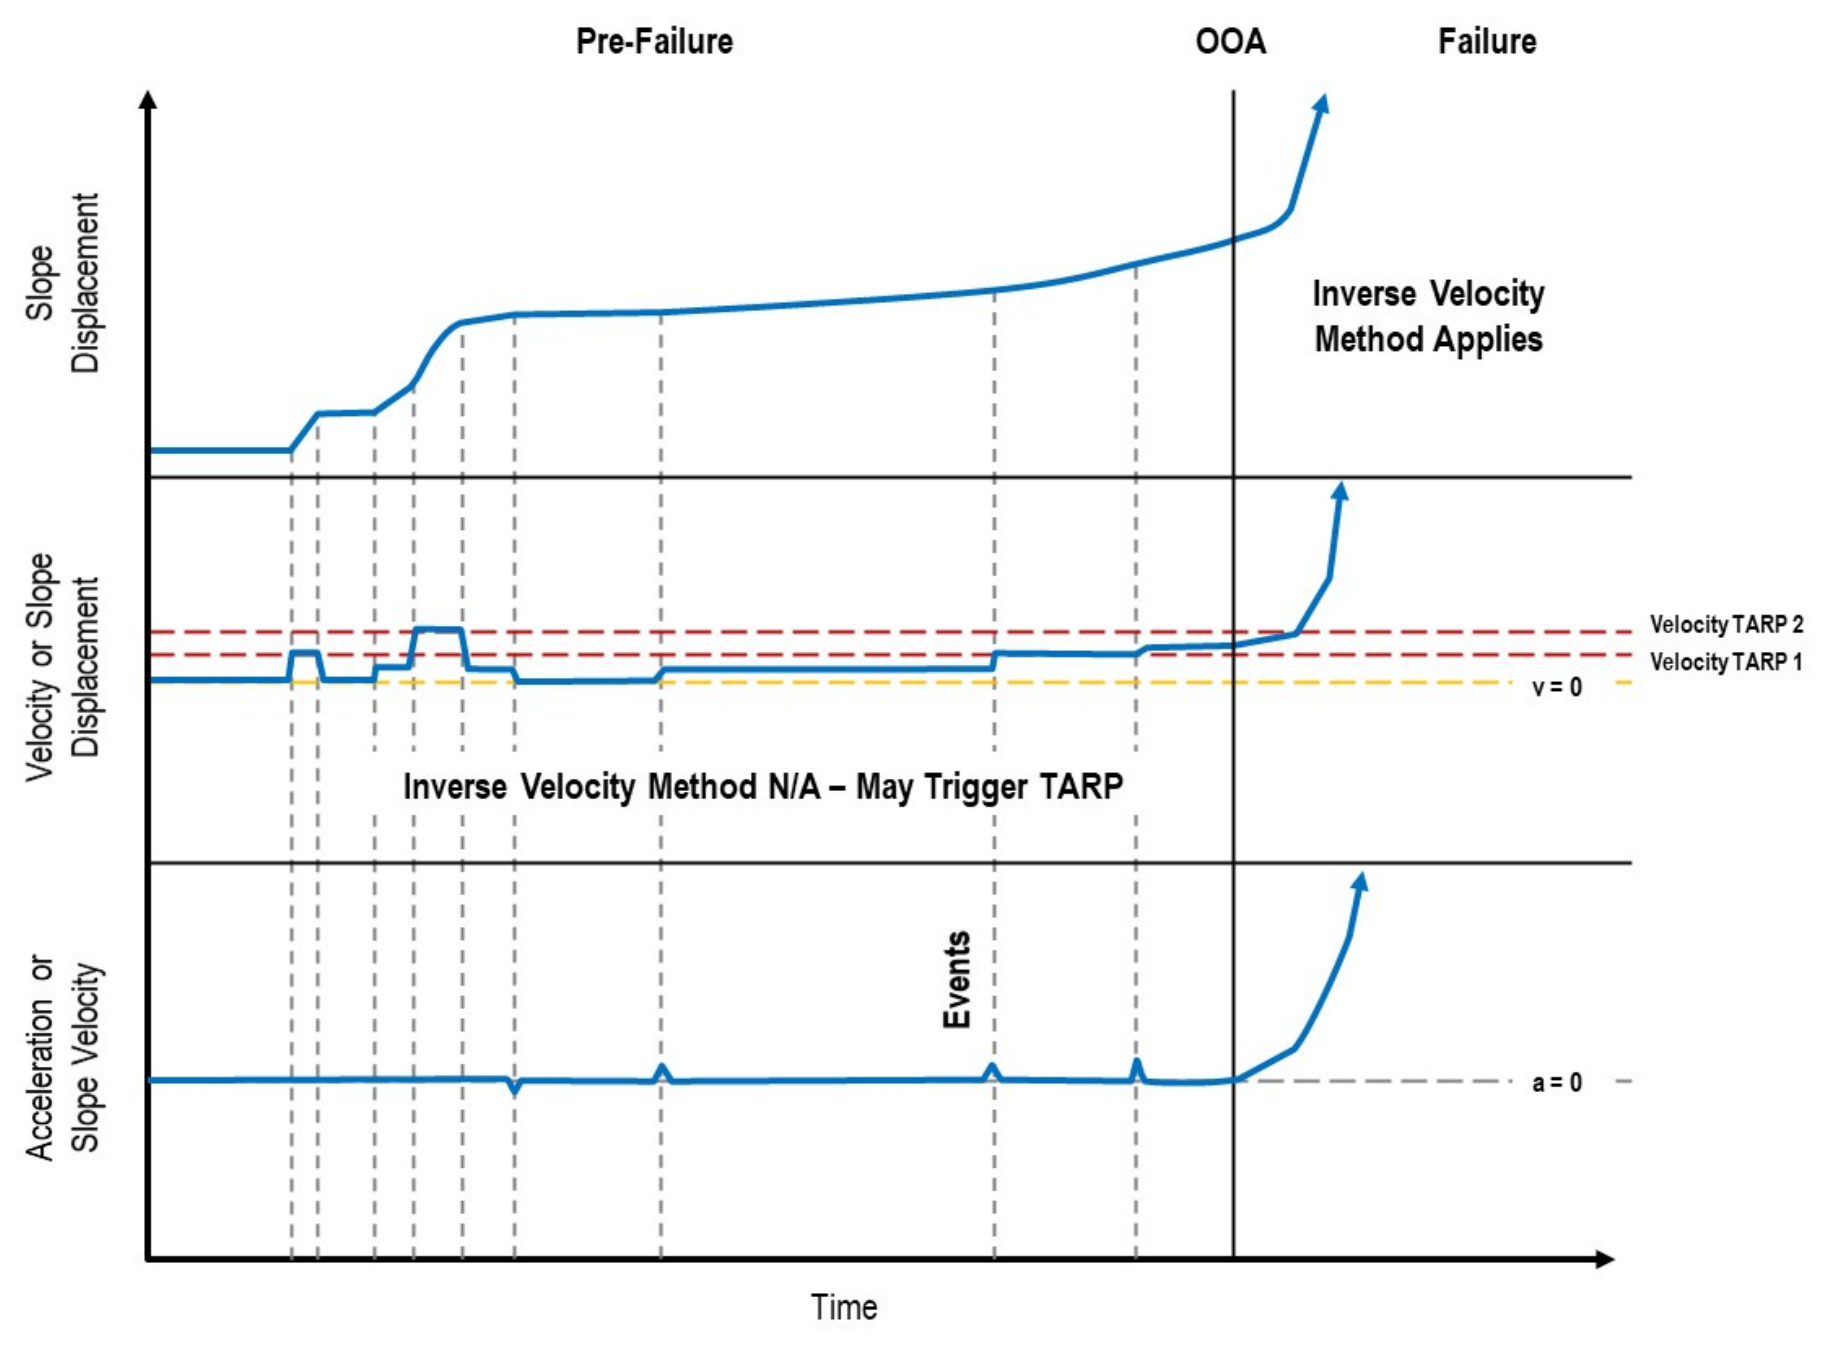
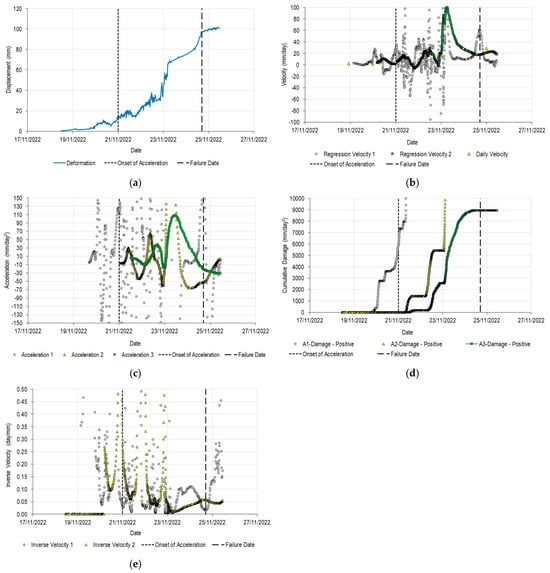
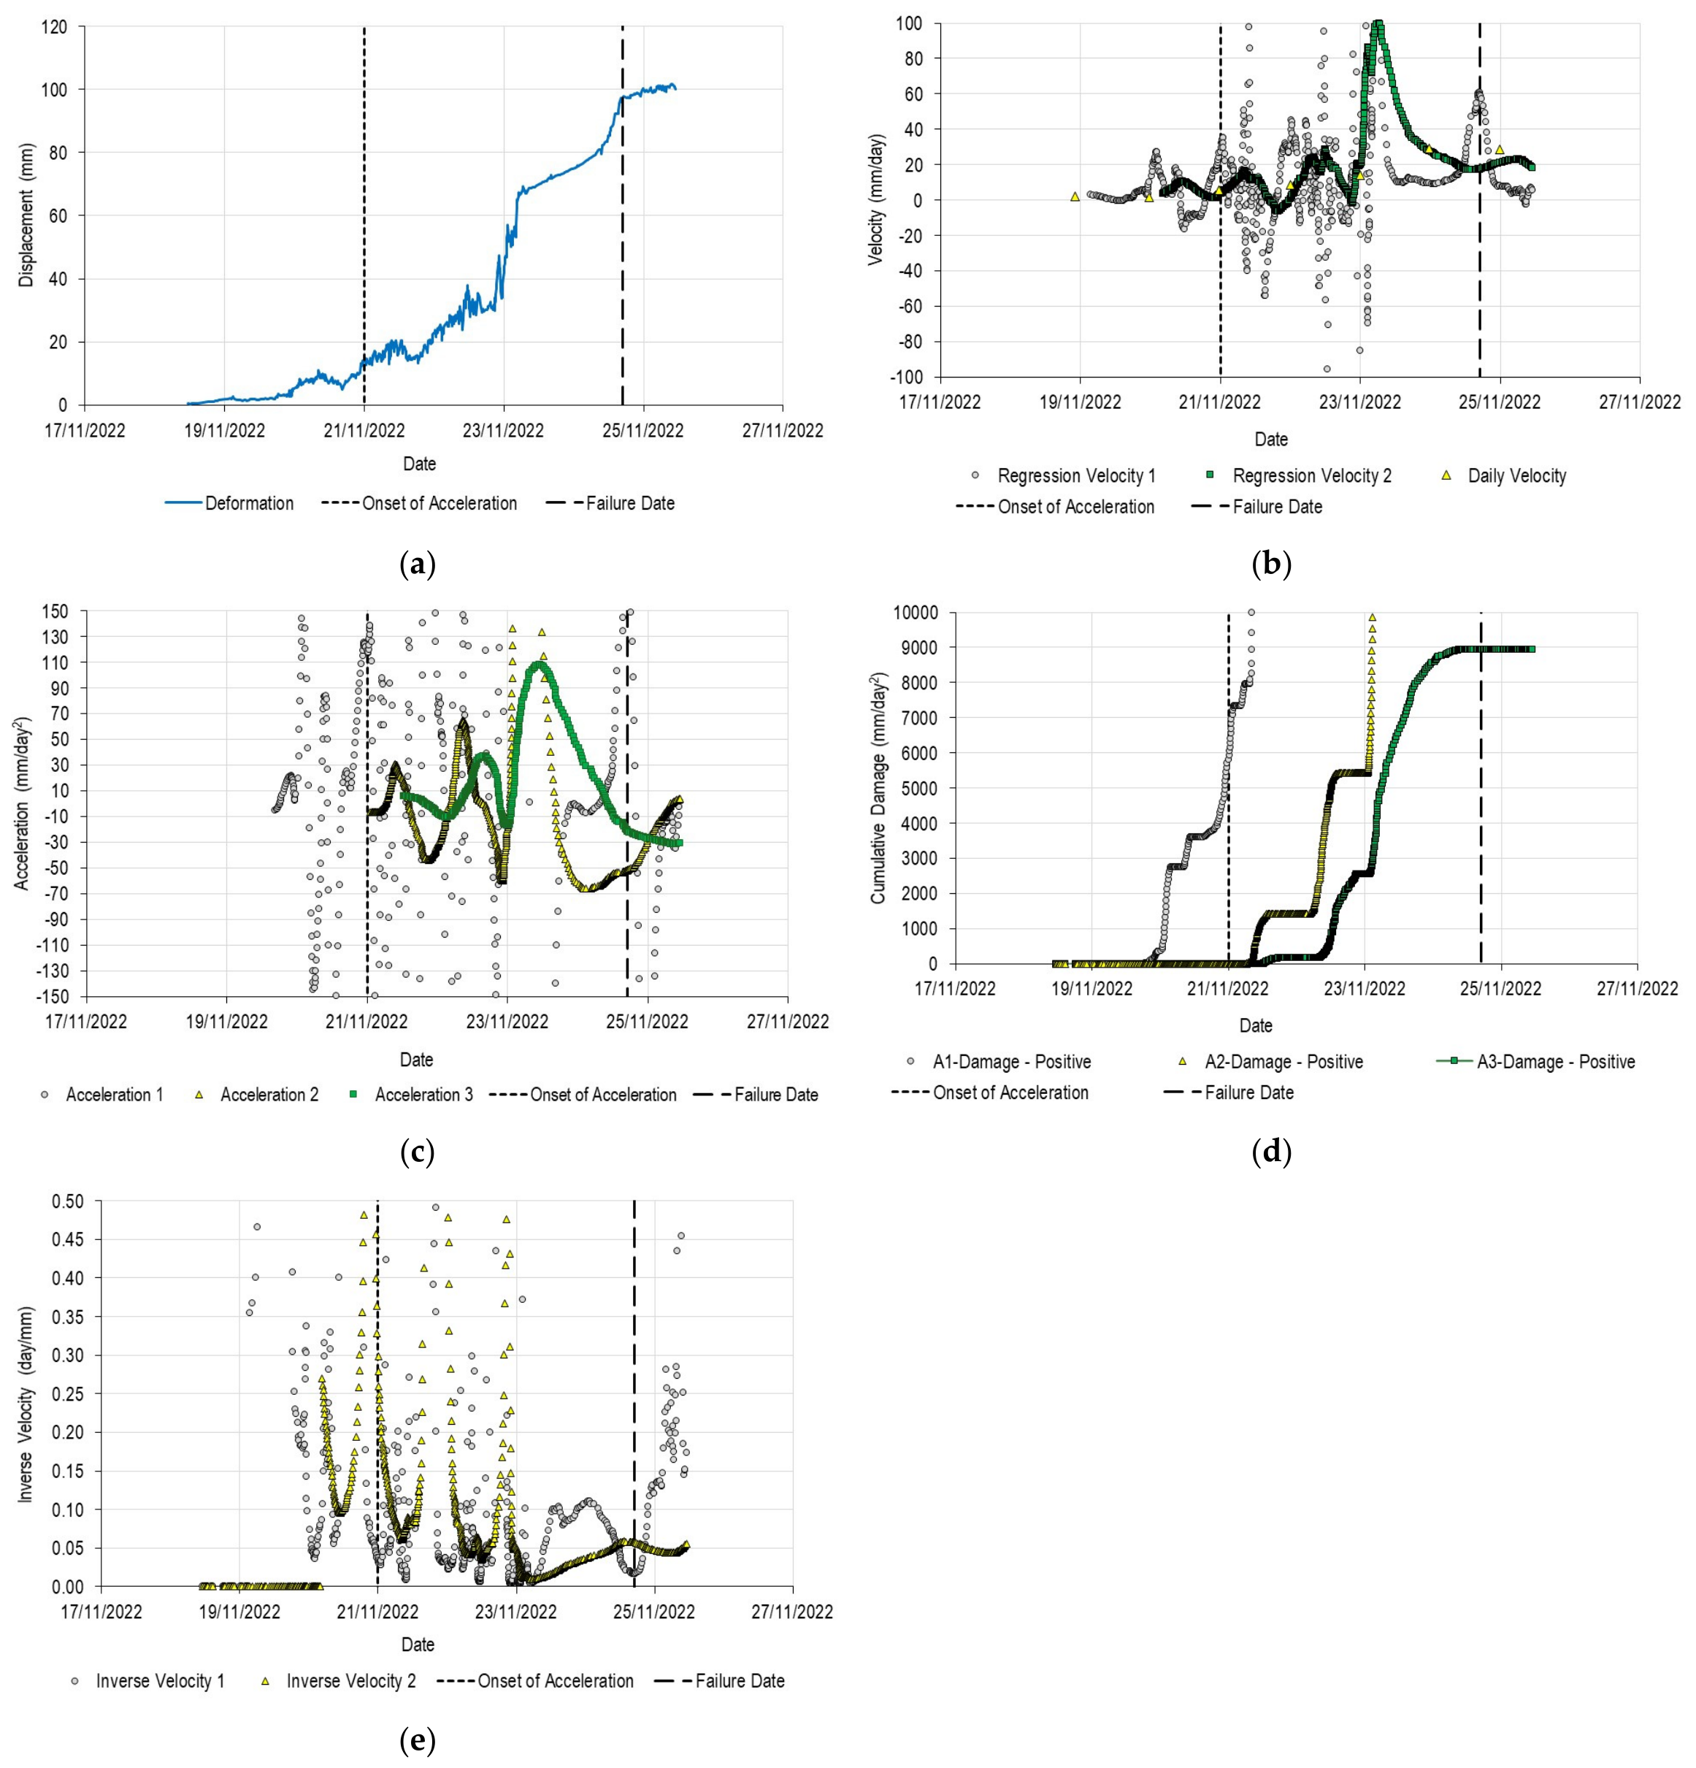
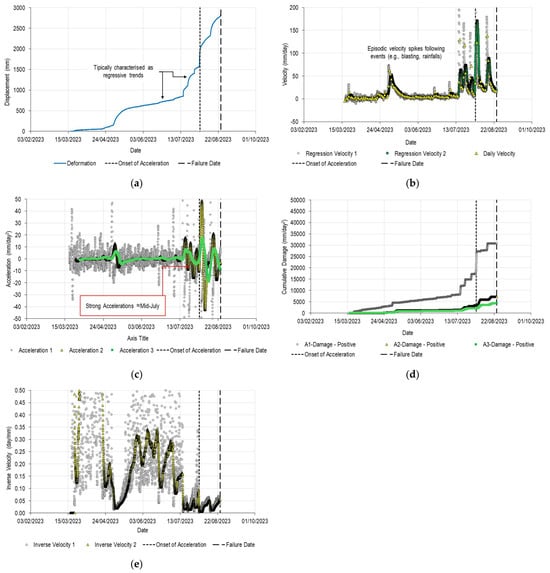
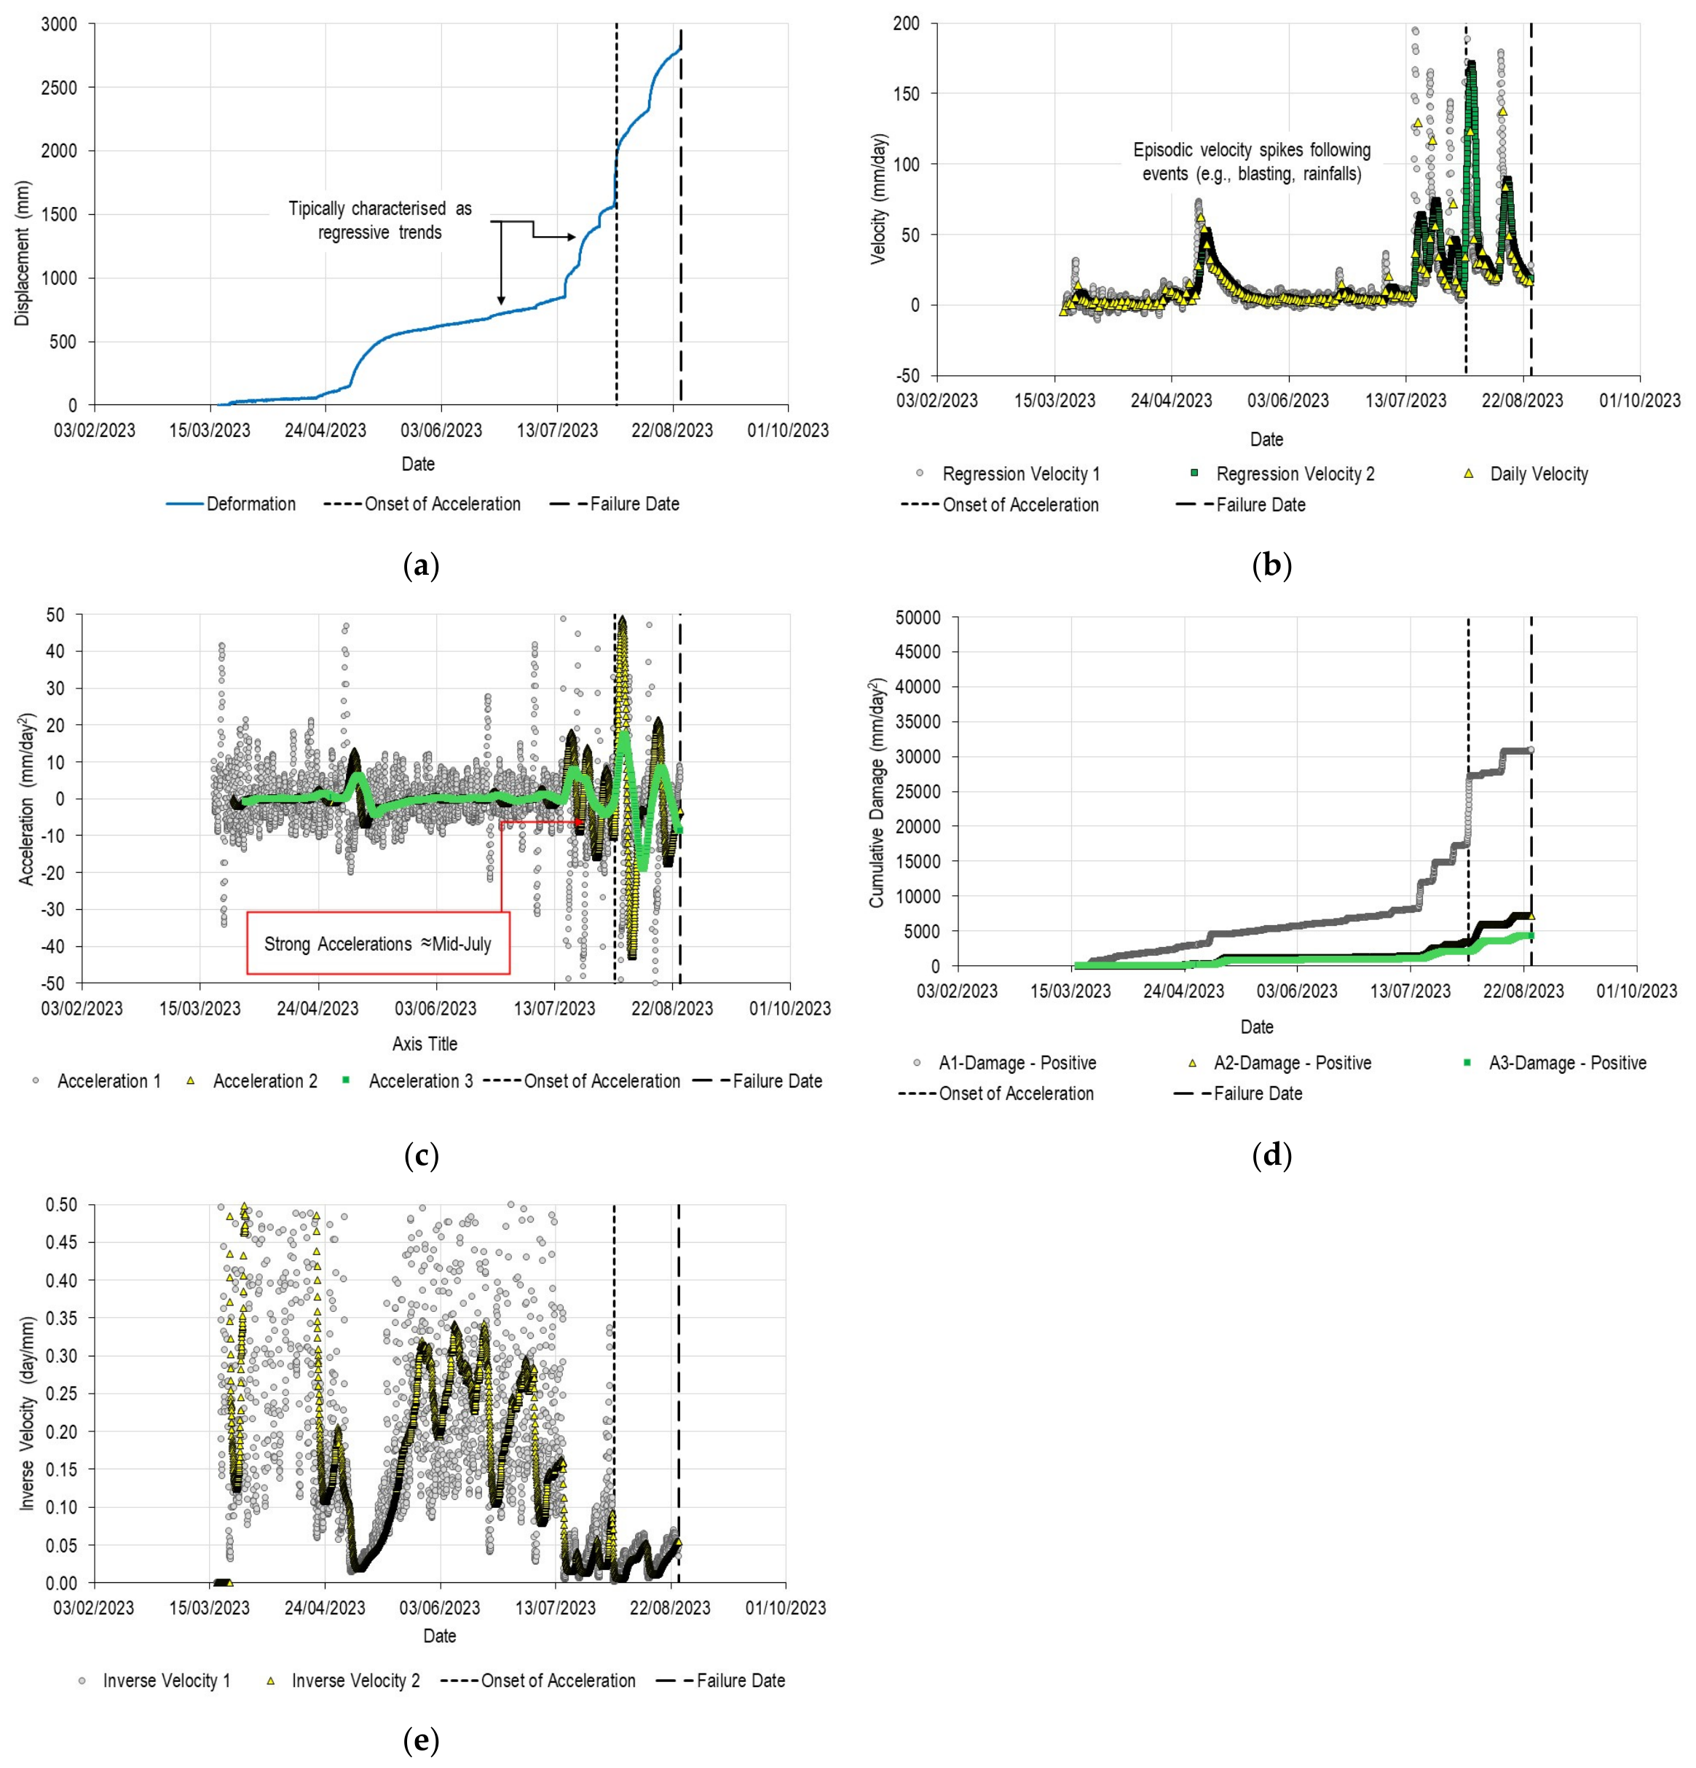
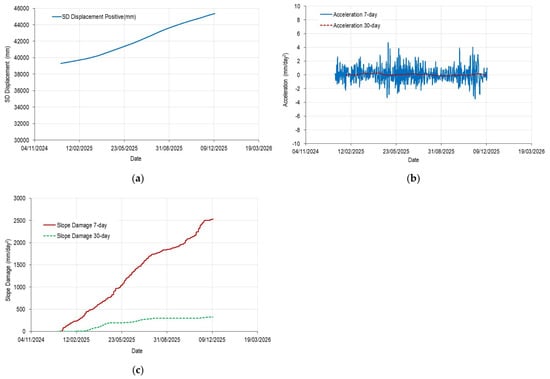
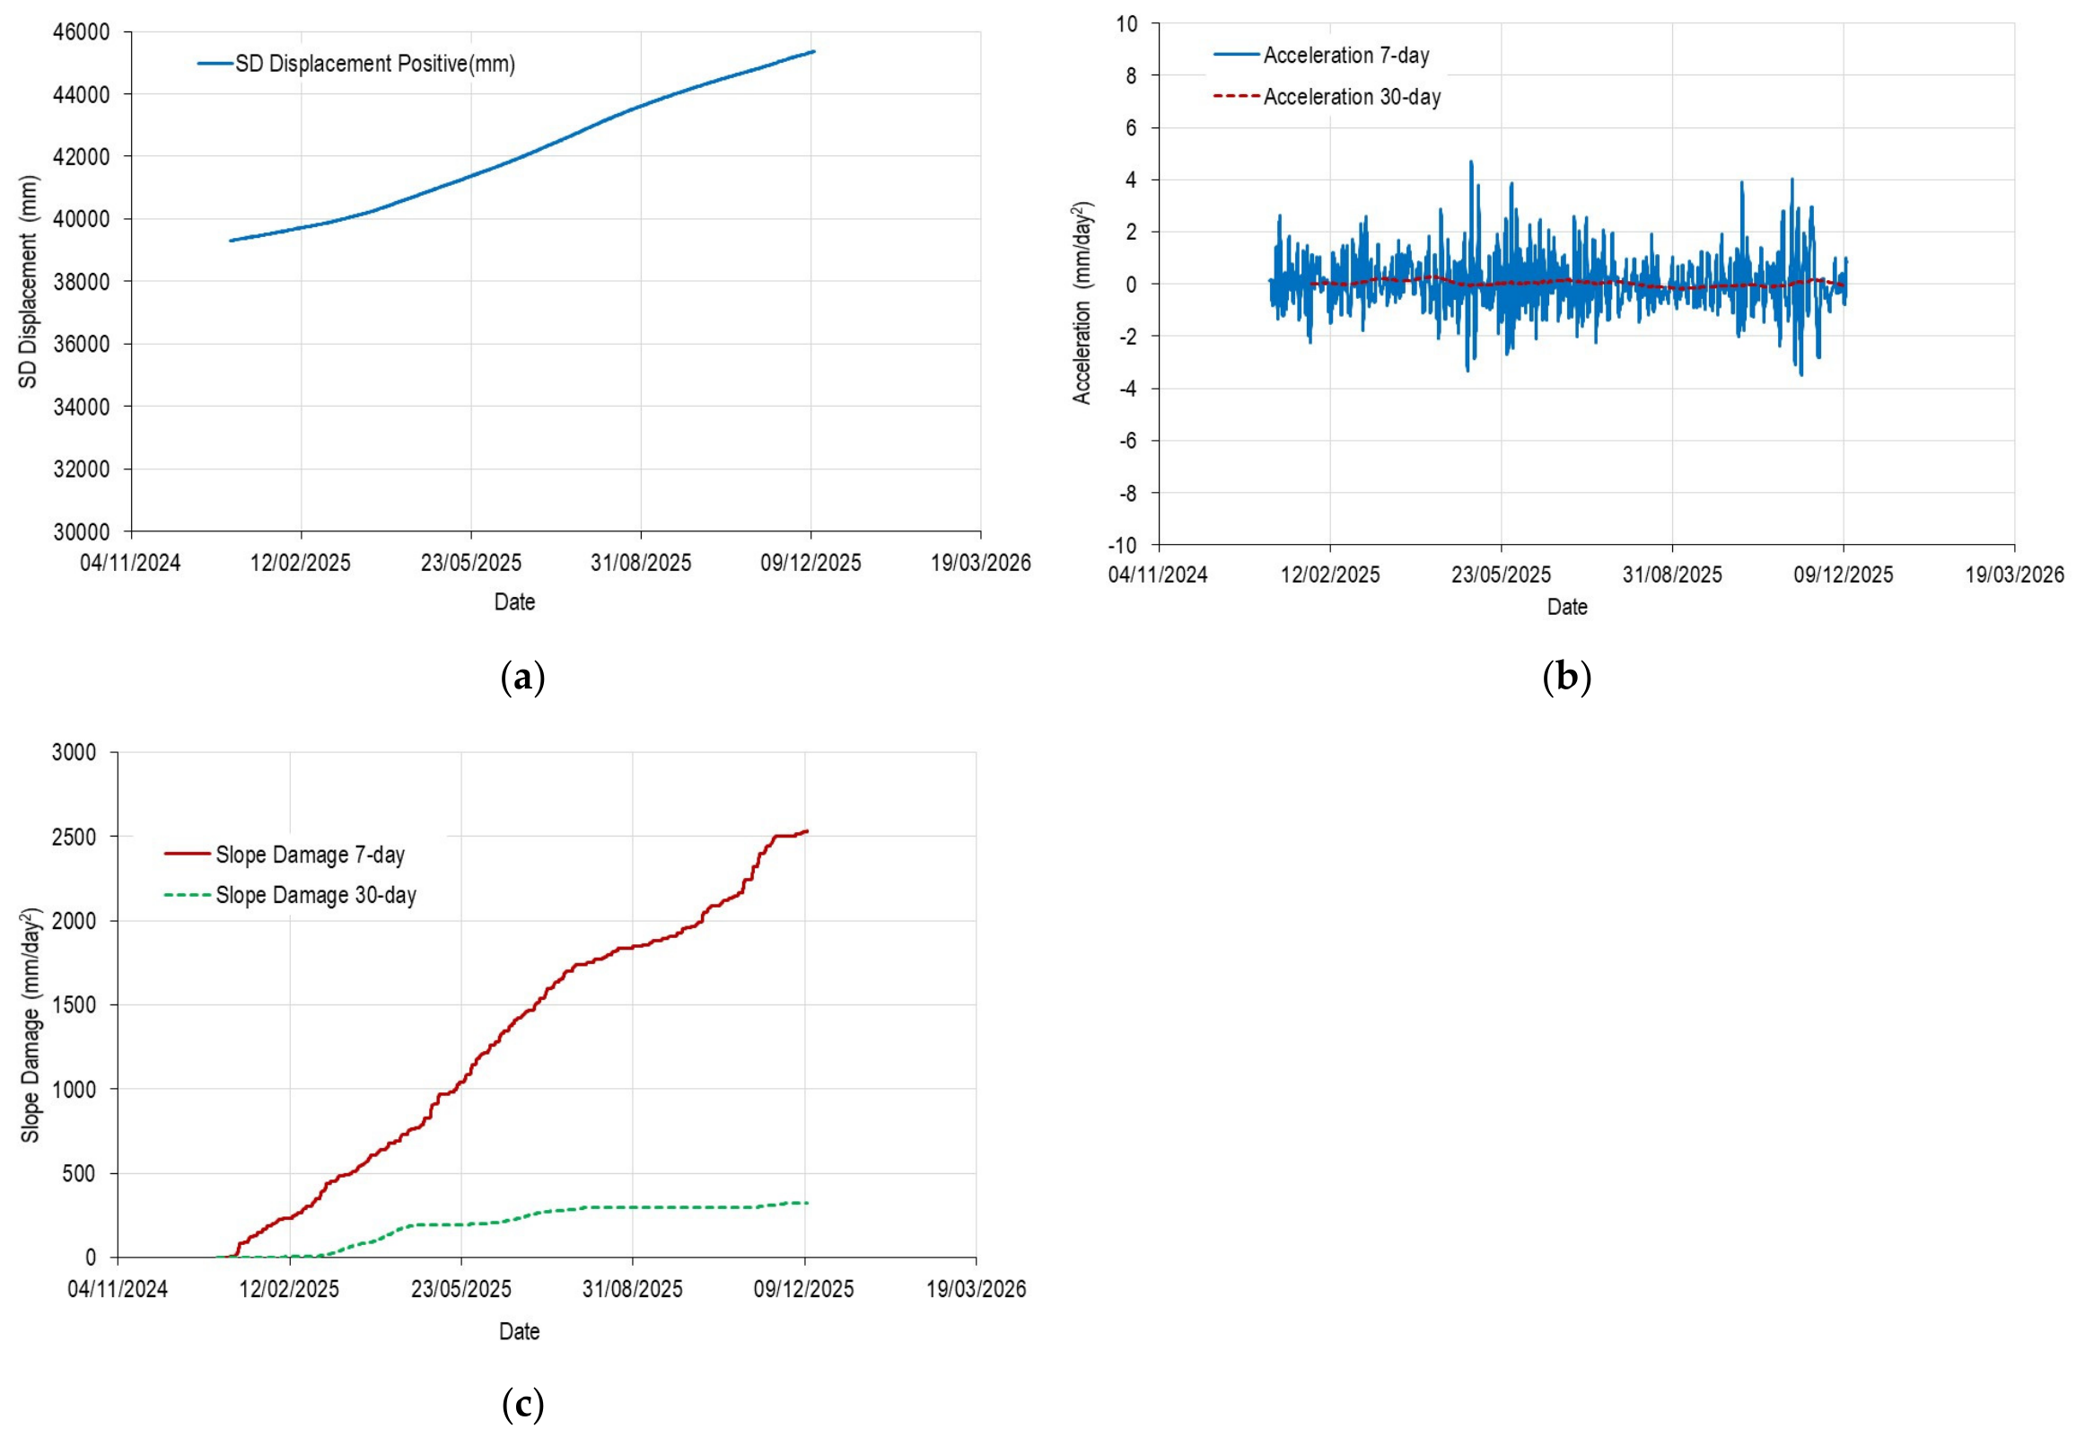
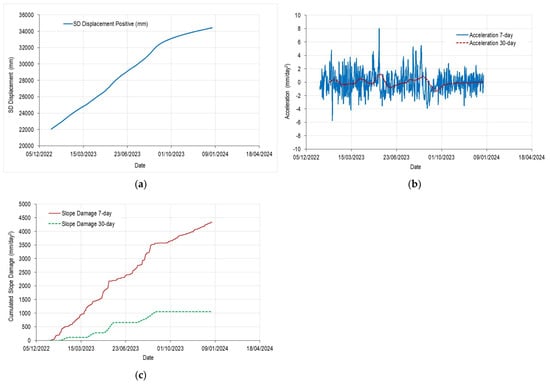
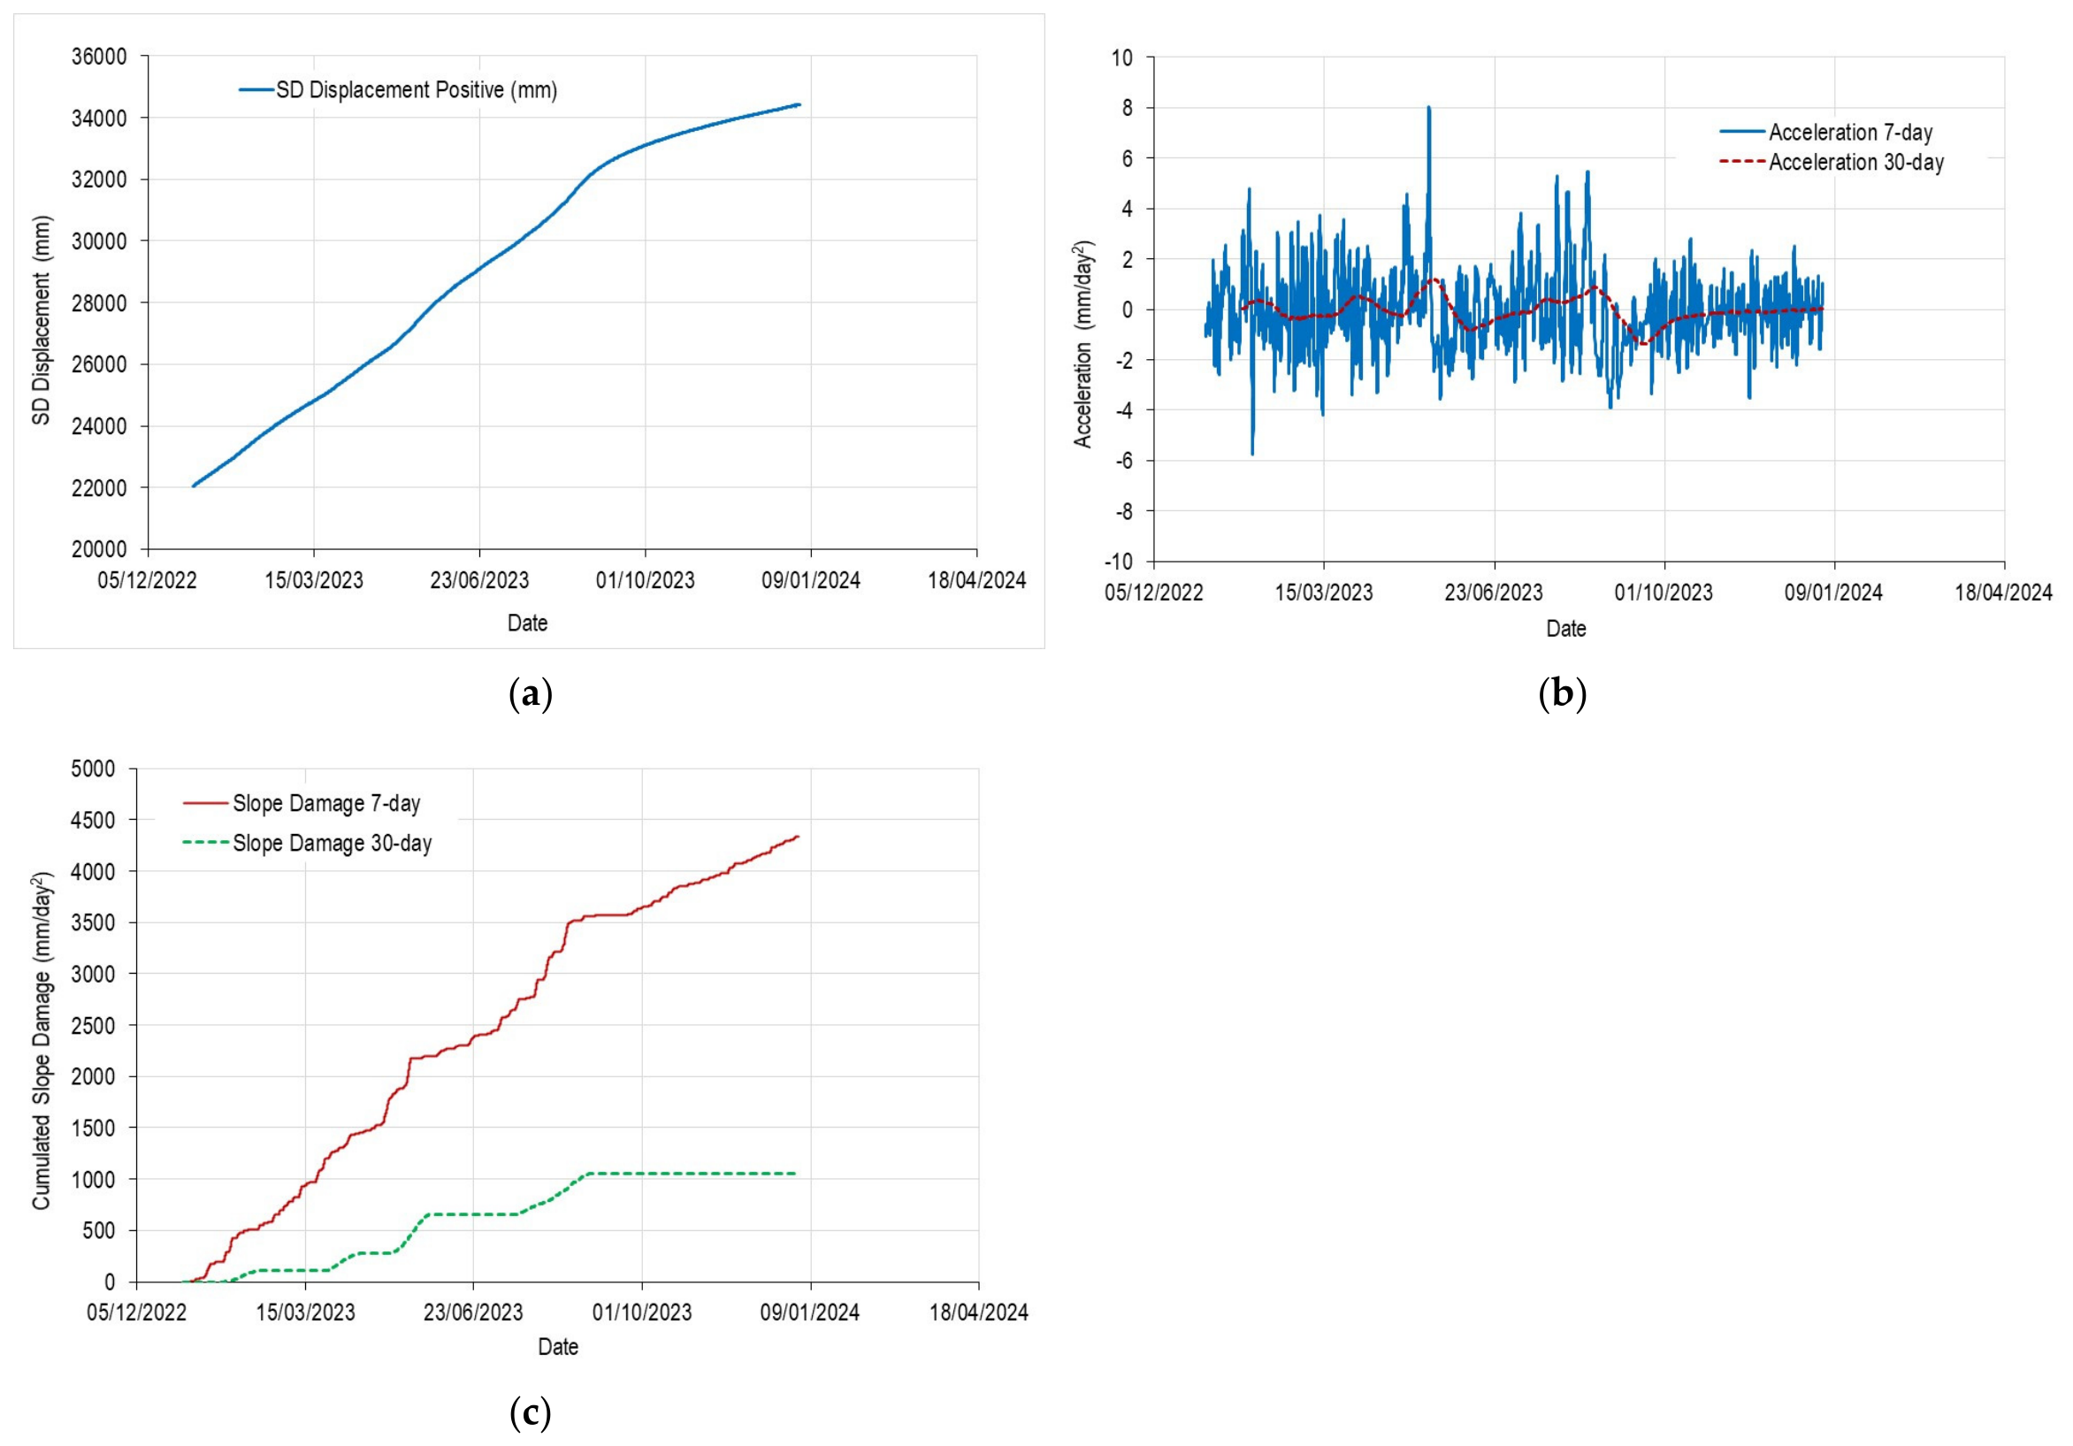
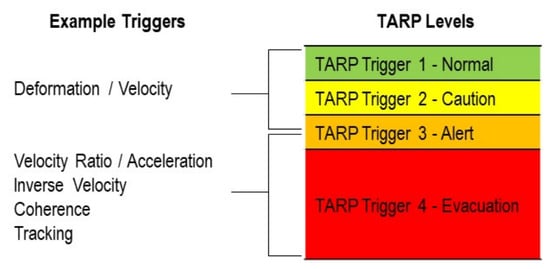
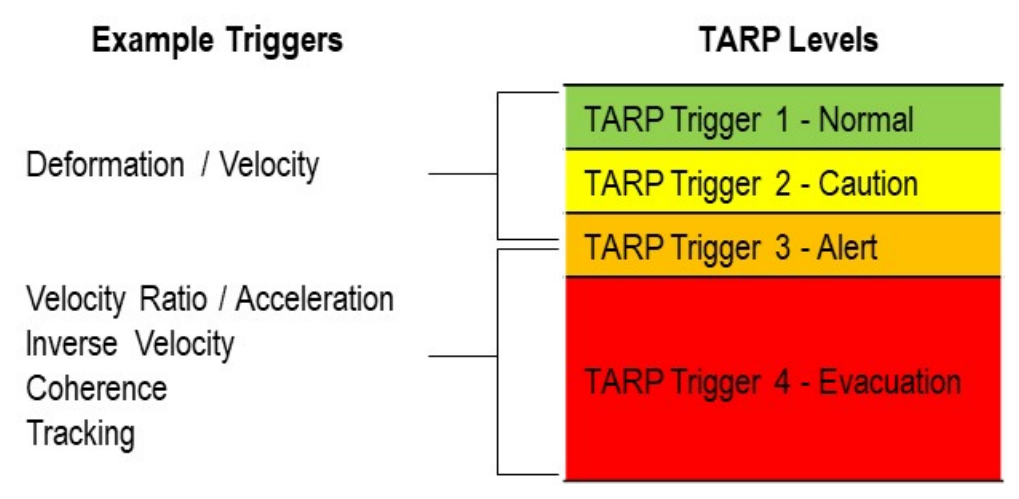
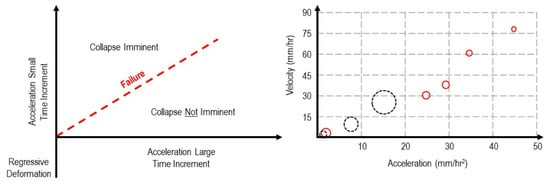
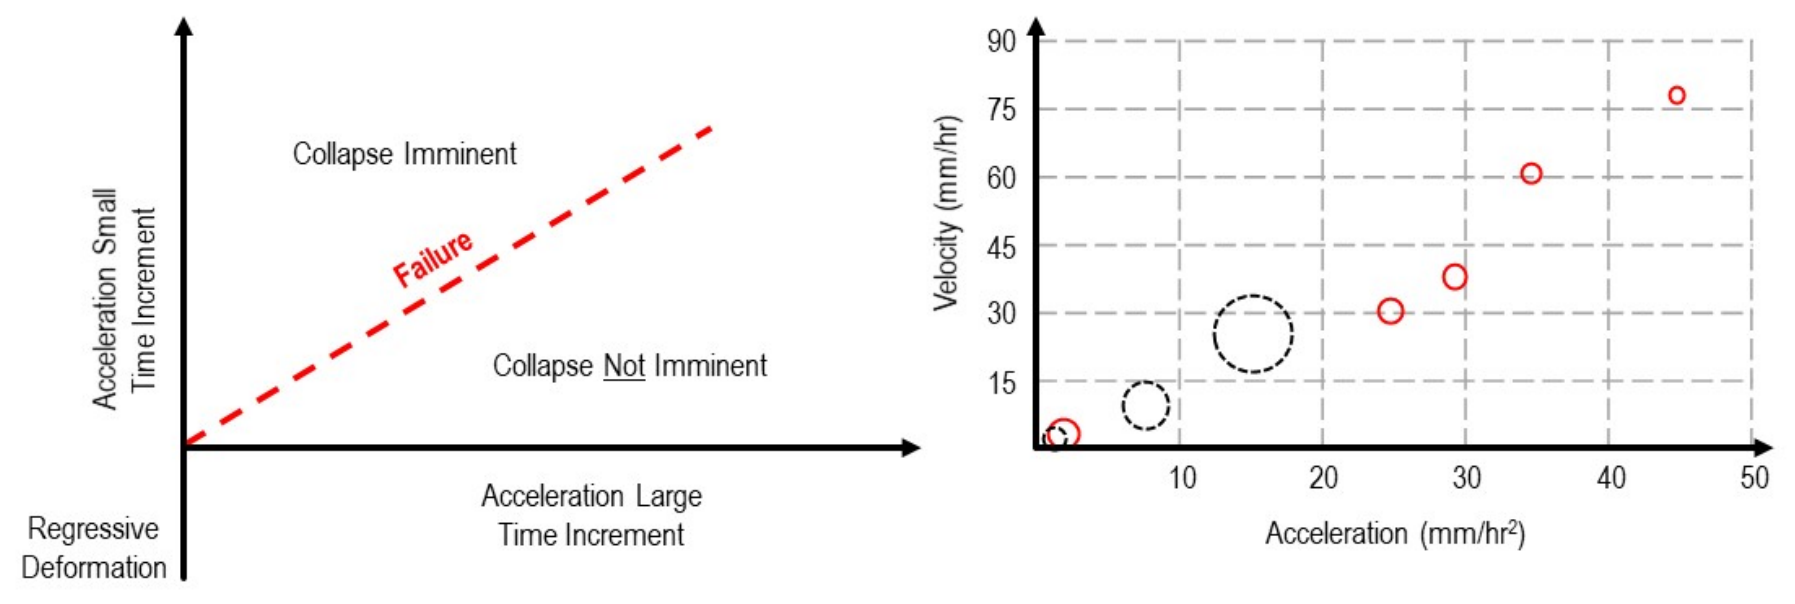
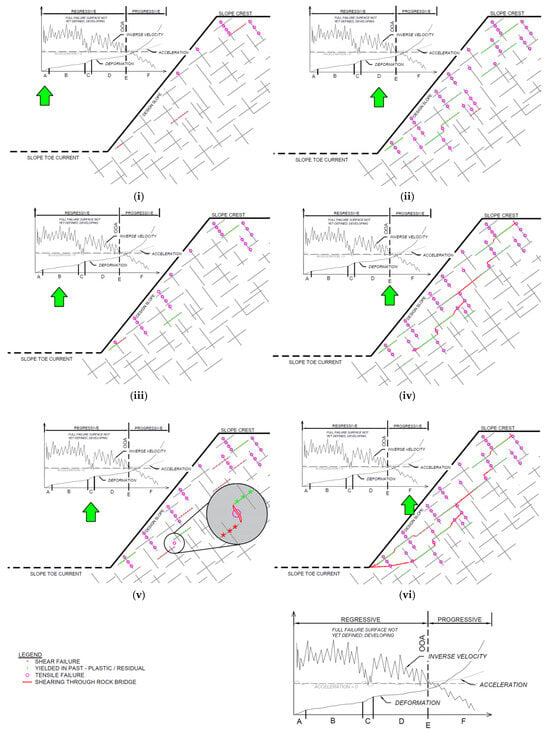
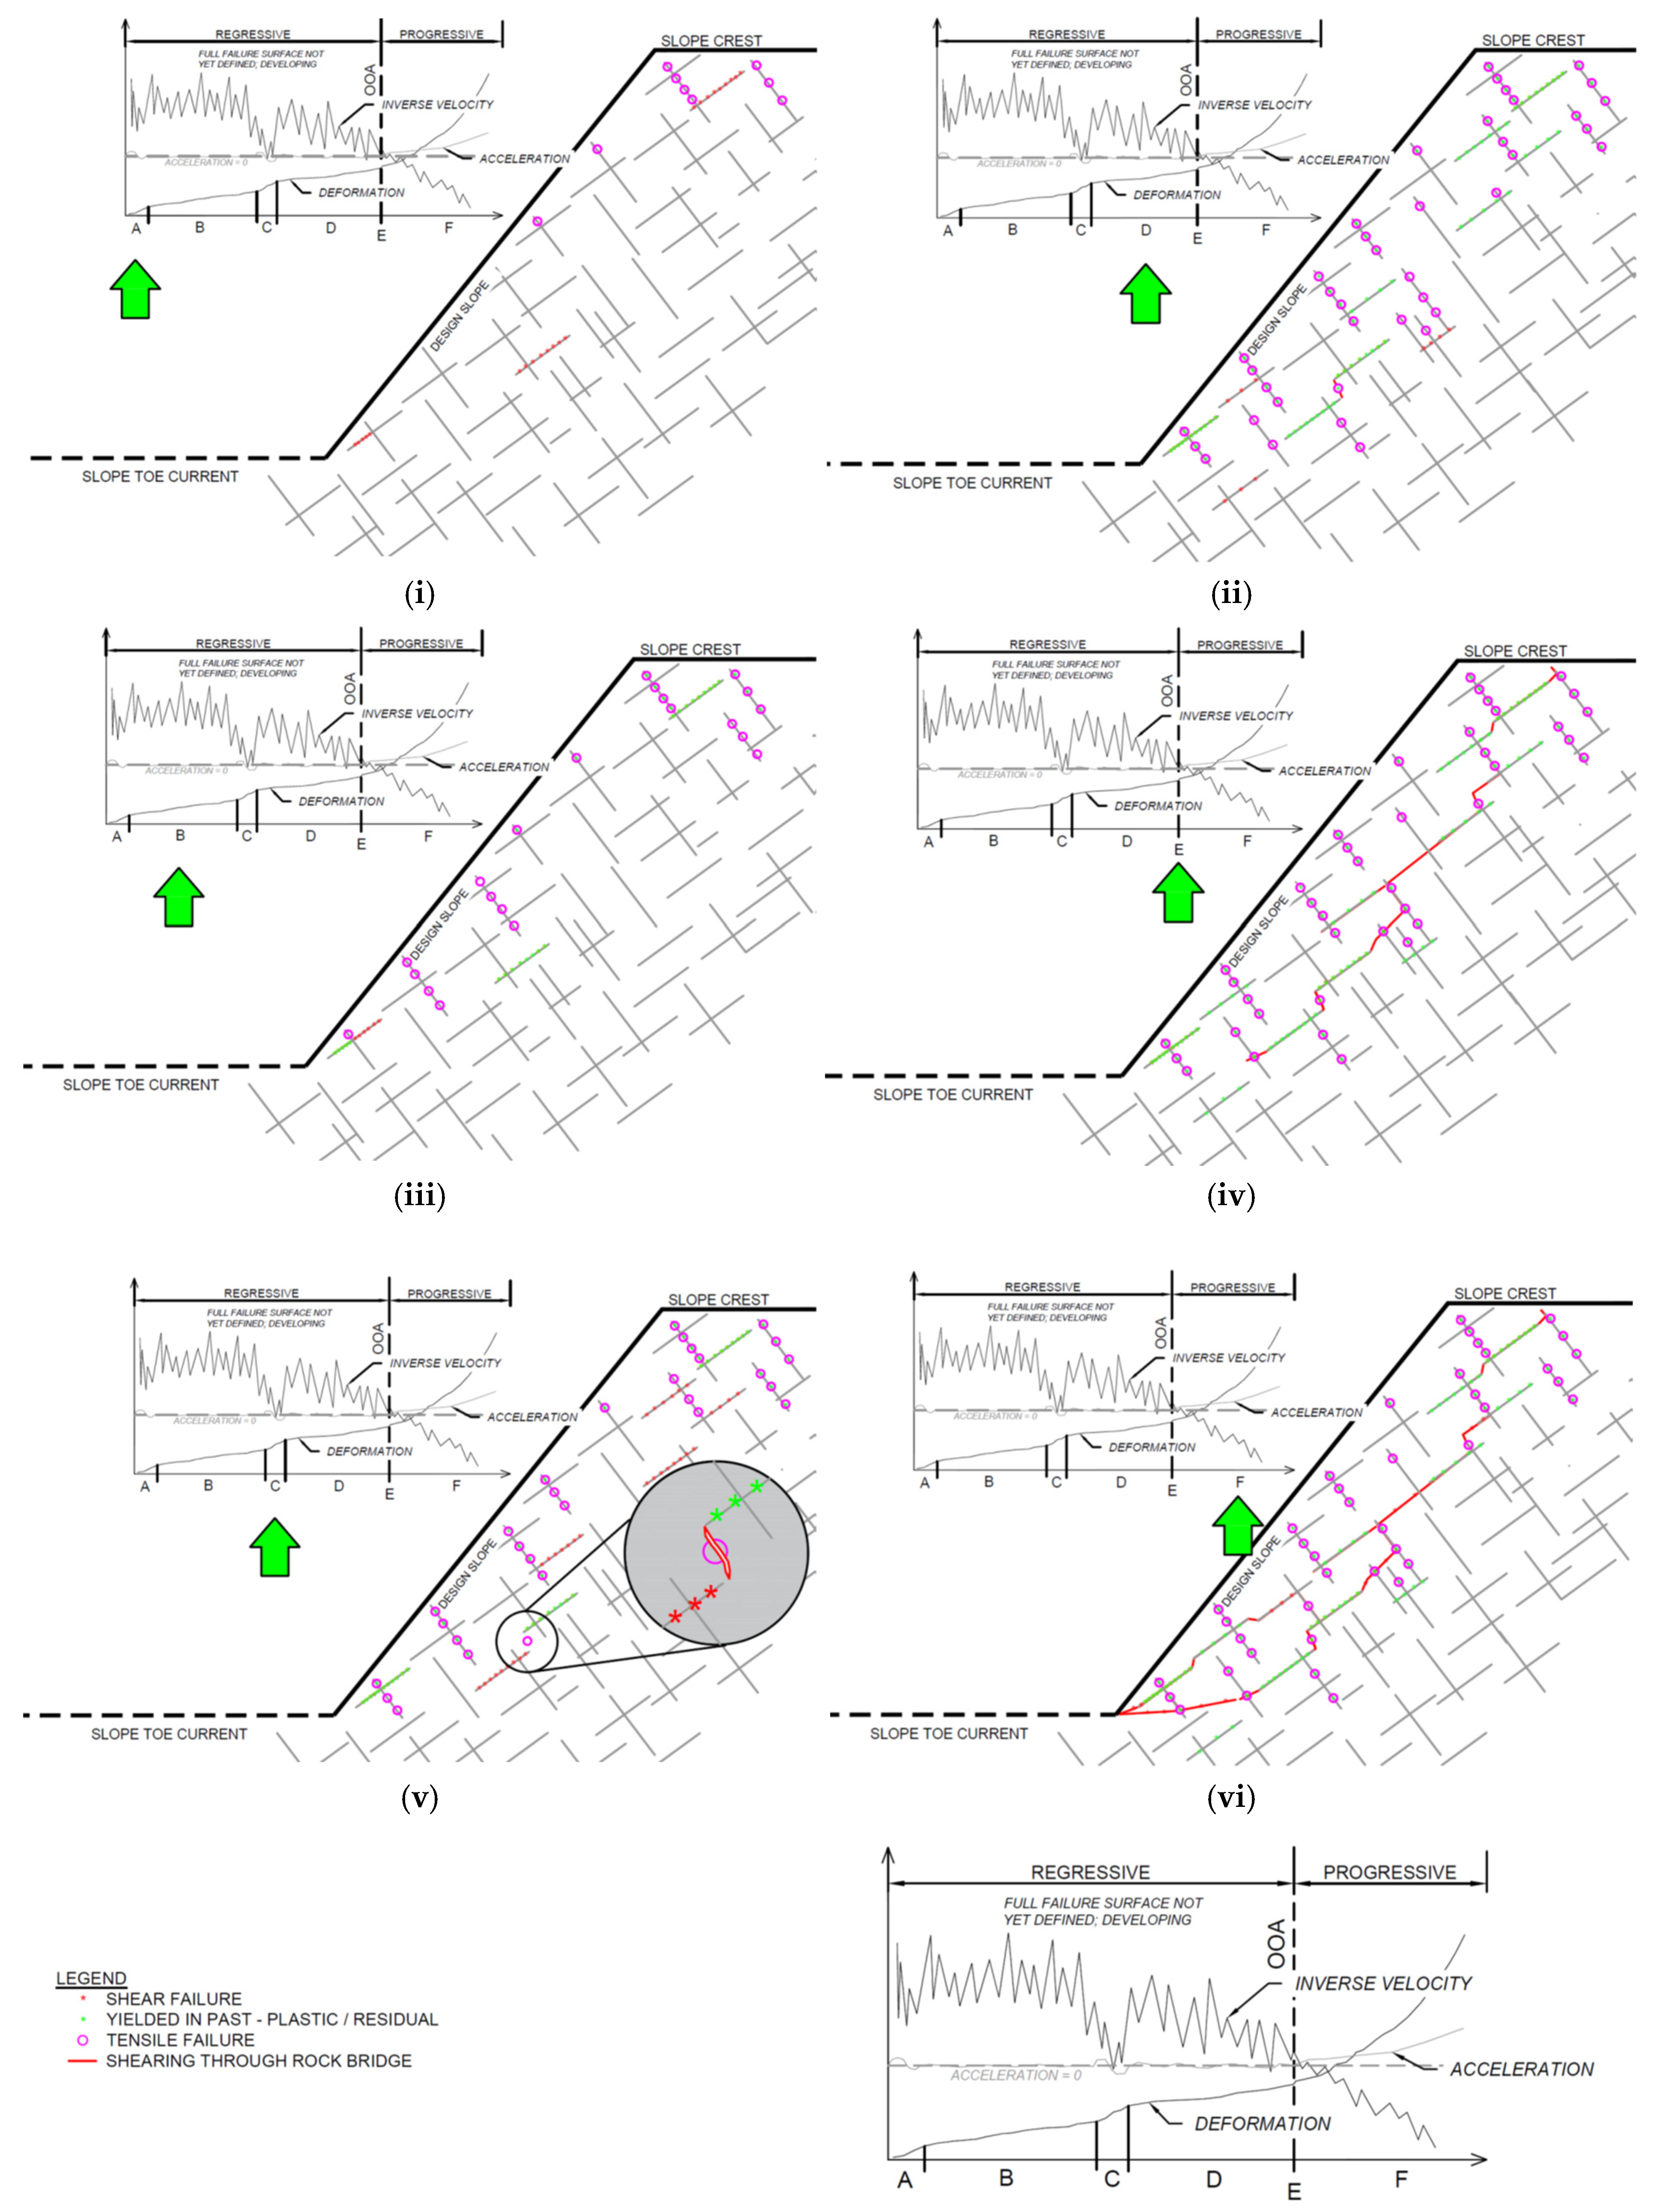
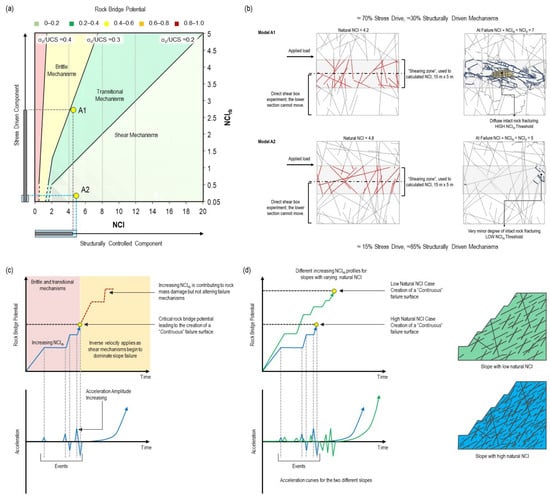
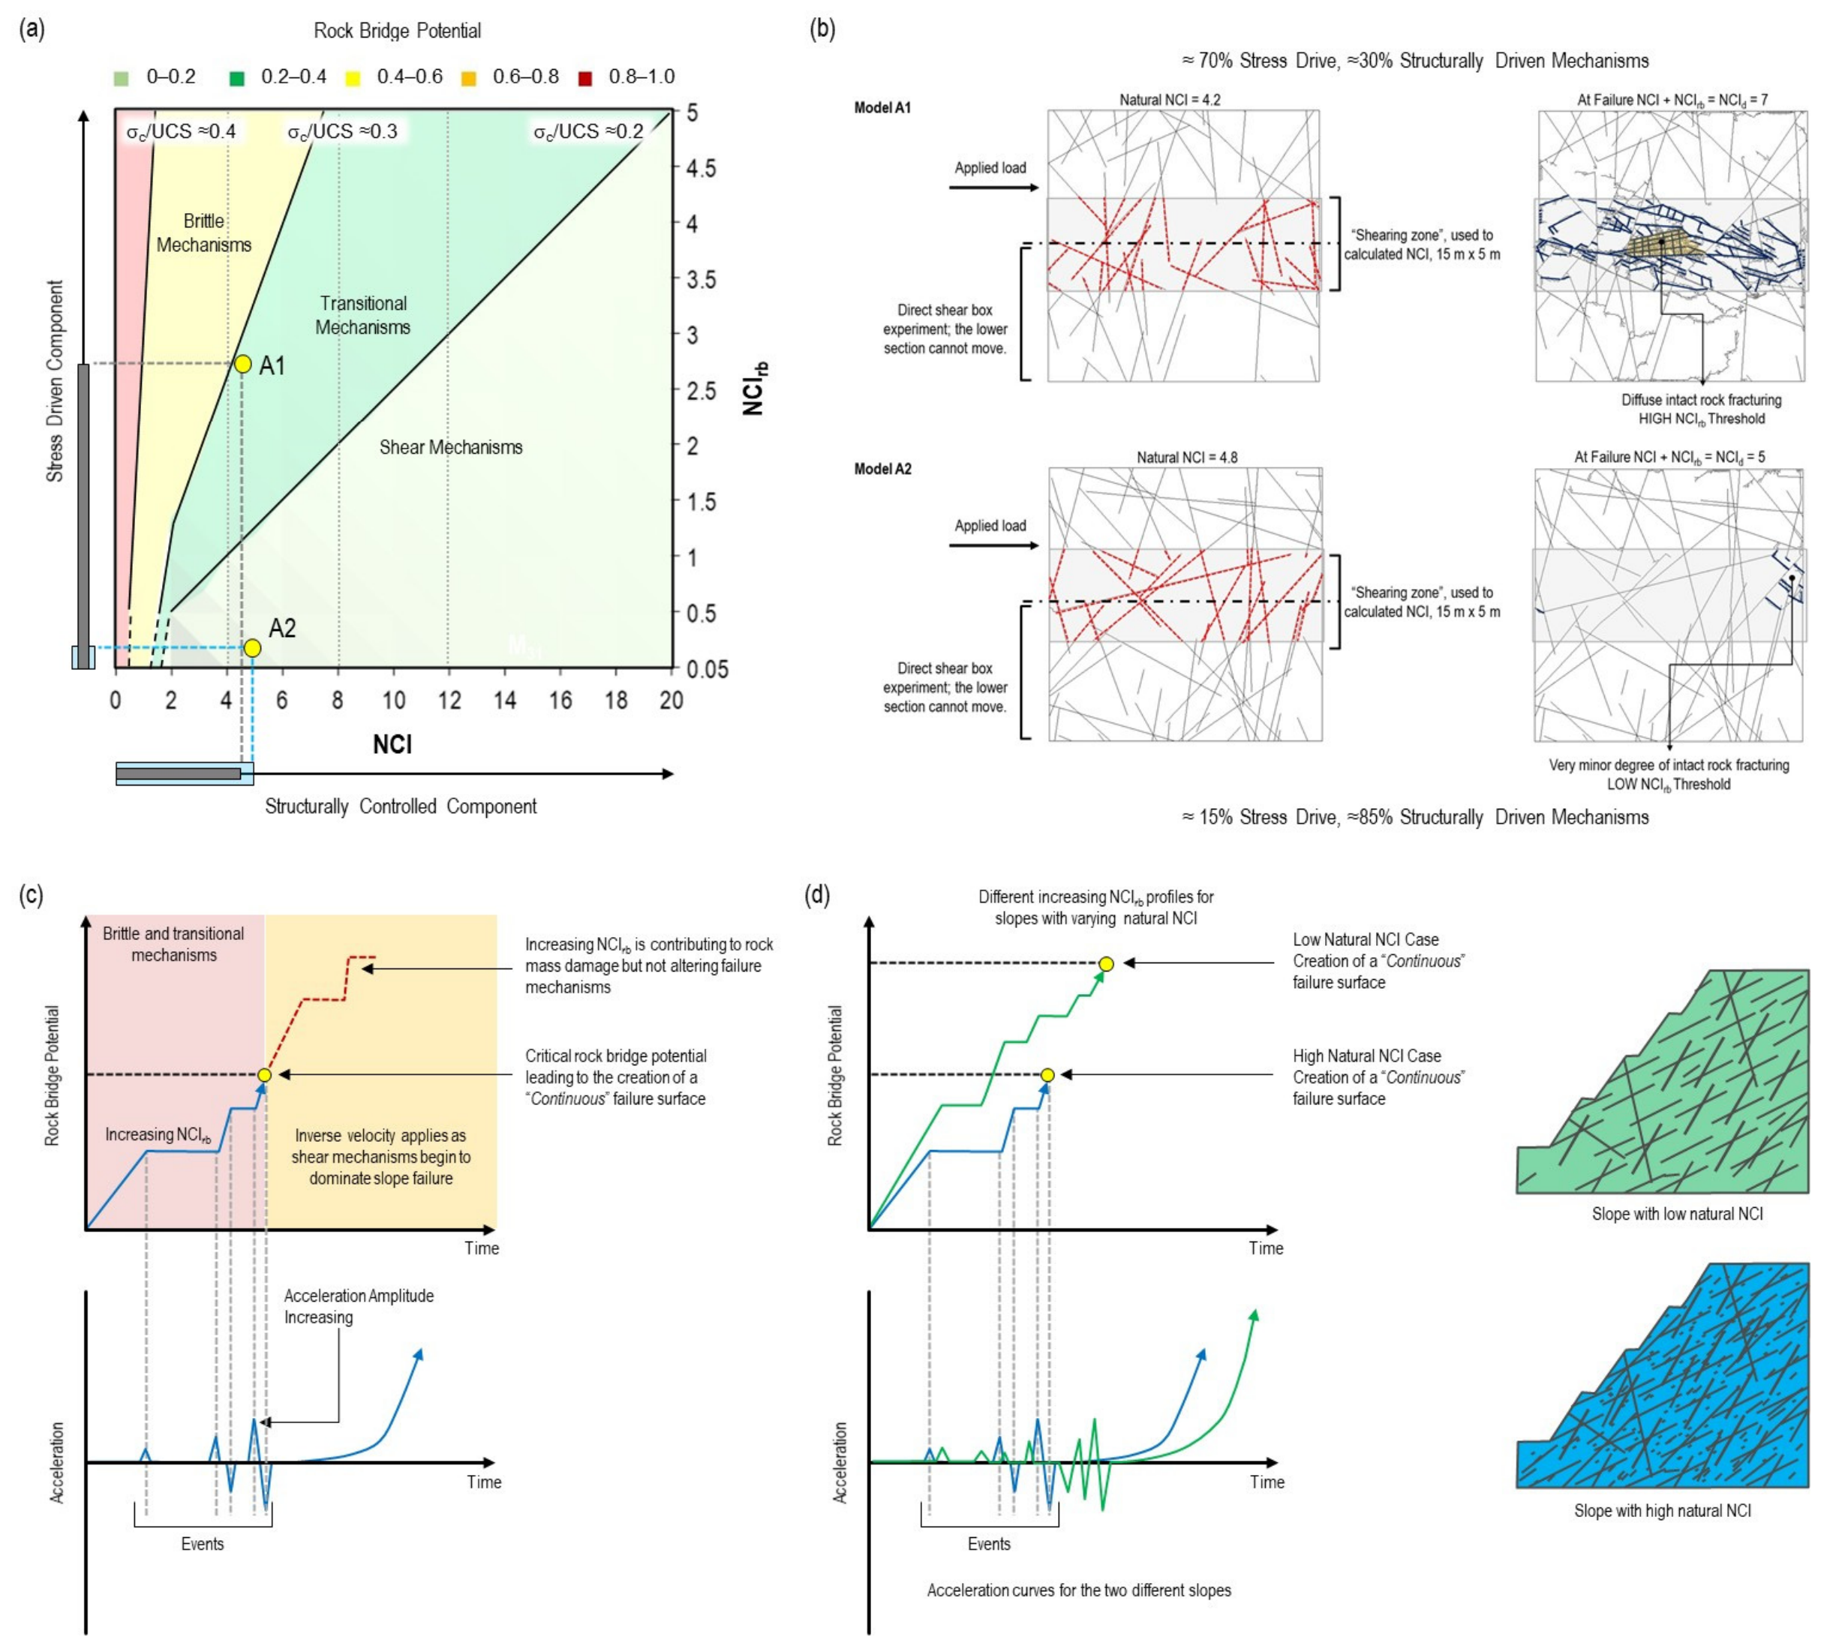

Disclaimer/Publisher’s Note: The statements, opinions and data contained in all publications are solely those of the individual author(s) and contributor(s) and not of MDPI and/or the editor(s). MDPI and/or the editor(s) disclaim responsibility for any injury to people or property resulting from any ideas, methods, instructions or products referred to in the content. |
© 2026 by the authors. Licensee MDPI, Basel, Switzerland. This article is an open access article distributed under the terms and conditions of the Creative Commons Attribution (CC BY) license.