


Abstract
Soil–Structure Interaction (SSI) is known to influence the seismic response of structures; however, its implications for the classification of dual wall–frame systems within the framework of Eurocode 8 remain insufficiently understood. This study investigates how SSI affects not only the global response but also the code-based classification of a reinforced concrete dual wall–frame system. A 9-storey prototype building is analyzed using fixed-base and flexible-base models, considering linear-elastic, nonlinear static (pushover), and nonlinear dynamic (time-history) analyses. As expected, the results show that SSI induces a significant redistribution of seismic forces, reducing the contribution of shear walls and increasing the role of frames. As a consequence, the system classification shifts from wall-equivalent dual to frame-equivalent dual, or even toward frame-dominated behavior under Eurocode 8. A comparison with ASCE/SEI 7-16 reveals that such classification changes are less pronounced due to broader system definition limits. The findings highlight that SSI influences not only structural demand but also key design parameters, including behavior factors and force distribution assumptions. This underscores the need for consistent consideration of SSI effects in both analysis and system classification within seismic design codes.
1. Introduction
Conventional seismic design procedures typically assume that buildings are fixed at their base, disregarding the interaction between soil and structure. In reality, the dynamic response of a building is strongly influenced by the flexibility and deformability of its foundation and soil, a phenomenon widely known as Soil–Structure Interaction (SSI). Depending on soil conditions, SSI can be either beneficial—by reducing base shear—or detrimental—by amplifying displacements and redistributing internal forces.
The response of structures during historical earthquakes, such as Mexico City, 1985 [1], Kobe, 1995 [2], Adana-Ceyhan, Turkey, 1998 [3], Christchurch, New Zealand, 2011 [4], and more recently Türkiye, 2023 [5,6,7] has repeatedly demonstrated that ignoring SSI can lead to severe or unexpected structural damage.
Over the past decades, extensive research has been devoted to SSI effects on moment-resisting frames and shear-wall structures. Key outcomes include the recognition of period elongation, reduction of base shear, and increased rocking effects. More recently, attention has turned toward mixed systems, such as dual wall–frame structures, which combine the stiffness of shear walls with the ductility of frames. These systems are widely adopted in practice, particularly for medium- to high-rise reinforced concrete buildings. However, their response under SSI is complex: the relative stiffness of frames, walls, and soil can significantly alter force distribution [8,9], deformation patterns [10,11,12], and ultimately the classification of the lateral force-resisting system [13]. Taking into account the large differences in the behavior between these two systems and the fact that the volume of research for dual-wall frame structures is much less than for moment-resisting frame structures [14], it is quite clear that there are still a lot of uncertainties about the behavior of wall-frame structures with the inclusion of SSI effects.
This issue is of particular importance in the context of seismic design codes. Eurocode 8 defines structural systems—and their associated behavior factors—based on the distribution of base shear between walls and frames. Since SSI directly modifies this distribution, it may lead to a different system classification than assumed at the design stage. In contrast, the American standard ASCE/SEI 7-16 [15] provides explicit procedures for incorporating SSI and applies a broader definition of dual systems.
Technical reports such as Applied Technology Council [16] and FEMA 356 [17], although not specifically focused on soil-structure interaction, provide useful insights into the consequences of neglecting the foundation and soil effects. Most recent documents, the National Institute of Standards and Technology—NIST [18] (NIST 2012) and A Practical Guide to Soil-Structure Interaction—FEMA P-2091 [19] are dedicated to soil-structure interaction and introduce step-by-step procedures for accounting for these effects, supported by examples on real buildings.
This study examines the influence of Soil–Structure Interaction (SSI) on the seismic response of a reinforced concrete dual wall–frame system designed according to Eurocode 8 and compares the resulting system classification with the provisions of ASCE/SEI 7-16. A 9-storey prototype building is analyzed under fixed-base and flexible-base conditions using elastic, nonlinear static, and nonlinear dynamic procedures.
Rather than introducing a new SSI mechanism, the study focuses on the interpretation of well-established SSI effects—such as force redistribution between walls and frames and changes in global demand—within the framework of Eurocode 8 (EN 1998-1) [20] system classification criteria. In particular, it investigates how SSI-induced variations in wall and frame participation ratios interact with the discrete classification thresholds defined in EN 1998-1 and how this influences the resulting design parameters, including the behavior factor and lateral force distribution. The results highlight that the main implication of SSI in this context is not a fundamental change in structural behavior but the sensitivity of code-based system classification to continuous changes in structural response.
2. Code Approaches to SSI and Definitions of Dual Systems
2.1. Code Approaches to SSI
The consideration of Soil–Structure Interaction (SSI) in structural design depends strongly on the procedures and guidelines provided within building codes. In ASCE/SEI 7-16, a detailed framework is given for SSI. Starting with a simplified expression for estimating the reduction in base shear due to SSI, the standard further provides comprehensive formulas and parameters that allow designers to incorporate SSI explicitly in their calculations. This enables engineers who choose to include SSI to follow a codified procedure throughout the design process.
By contrast, the first generation of Eurocode 8 acknowledged the importance of SSI but limited its treatment to general qualitative guidance. While it recognized that SSI may lengthen natural periods, reduce seismic forces, and change structural behavior, no prescriptive methods or detailed procedures were included. Designers who intended to consider SSI under this framework therefore needed to rely on complementary research results or national provisions to adapt their design in line with Eurocode’s general requirements.
The second generation of Eurocode 8 is currently under preparation and not yet officially adopted. While drafts suggest a more explicit recognition of SSI effects, the framework remains in progress, and therefore its treatment is not analyzed in this study.
This evolution of Eurocode 8—from general recognition in the first generation to a still-developing second generation—illustrates the gradual codification of SSI but also highlights that, in practice, detailed implementation continues to rely largely on the designer’s expertise and interpretation.
2.2. Definitions of Dual Systems
The classification of structural lateral load-resisting systems can be made based on the base shear distribution or by inspection of the building geometry and of its configuration. Generally, if the system consists only of frames, it is simply classified as a frame system. Similarly, if the system consists purely of walls, it is classified as a wall system. However, when the building consists of both walls and frames, its classification is determined based on the stiffnesses of the walls and of the frames as compared to the overall stiffness of the building. Alternatively, if the stiffnesses are difficult to estimate, the system classification can be determined after the elastic analysis has been carried out, i.e., the base shear forces on walls and frames are expressed as a fraction of the overall base shear. For this study, this approach has been used.
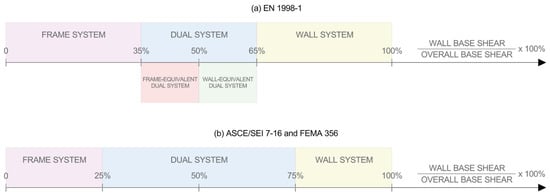
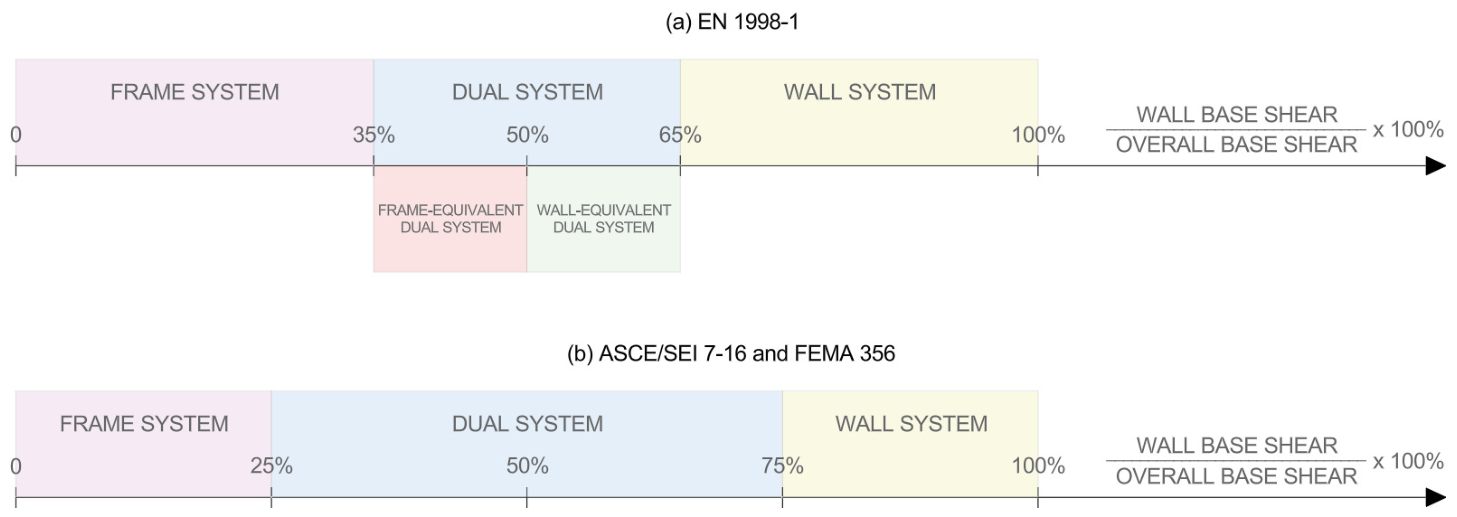
To explain the classification of the structural systems according to EN 1998-1, ASCE/SEI 7-16 and FEMA 356, a schematic representation of the base shear distribution is given in Figure 1, where the horizontal axis represents the percentage of the wall base shear to the overall base shear. The classification according to FEMA 356 is almost identical to the one of ASCE/SEI 7-16. Because of this, in the following text, only the differences between EN 1998-1 and ASCE/SEI 7-16 will be discussed.
Figure 1.
Structural system classification according to EN 1998-1, ASCE/SEI 7-16, and FEMA 356.
In ASCE/SEI 7-16, the system consisting of walls and frames is classified as dual if the contribution of walls or frames as a separate system is larger than 25% [15]. In other words, the system is classified as dual if the frames contribute at least 25% in resisting the base shear. In this context, the connection between beams and columns should be moment-resistant. If the frame system is not moment-resistant, any contribution of the frame system in resisting base shear is neglected, and consequently, the system shall not be classified as dual. It is worth mentioning that the limit of 25% is based on judgment.
In EN 1998-1 [20], the classification of the dual systems differs. First, for the system to be classified as dual, the minimum threshold of the contribution of the separate systems is 35%, and second, dual systems are further divided into wall-equivalent dual systems and frame-equivalent dual systems. If the frame contributes 50–65% to the overall base shear, the system is classified as a frame-equivalent dual system, and if this percentage belongs to the wall, the system is classified as a wall-equivalent dual system. Although not explicitly stated in the code, these numerical boundaries also mark a distinction between simple frames and moment-resisting frames. Specifically, for wall-equivalent dual systems, no capacity design checks are required, meaning that the resistances of the columns at a joint may be equal to or even lower than those of the beams framing into the same joint. This reflects the assumption that the wall governs the seismic response by providing the majority of the lateral strength, stiffness, and energy dissipation capacity, while the frame plays a secondary role. Consequently, the strong-column–weak-beam hierarchy is not enforced within the frame. In contrast, for frame or frame-equivalent dual systems, capacity design requirements stipulate that the resistance of the columns must exceed that of the beams at the joint. Regarding SSI incorporation in dual systems, the system classification not only affects the behavior factor but also determines whether capacity design rules are applied to the frame elements. In cases where the system response lies close to the classification boundary, the distinction between wall-equivalent and frame-equivalent dual systems, and more importantly, the application (or not) of the capacity design philosophy, becomes dependent on the interpretation of modeling assumptions and the relative contribution of the frame to the global lateral resistance.
Each of these codes recommends the reduction of reinforced concrete (RC) member stiffness to account for crack openings during the nonlinear response. Stiffness reduction factors are assigned to each member type, and they vary among the codes. None of the codes explicitly state whether to consider the effects of SSI when the classification of the system and assignment of reduction factors is to be determined.
3. Case Study
For this study on the role of SSI in the seismic behavior of dual wall-frame structural systems, a hypothetical building structure was considered. First, the elastic analysis was carried out, and the reinforcement content was determined as required following the European Standards. Then, having the adopted geometry and the provided reinforcement contents, the seismic evaluation of the building was done. The analyses were carried out for both the fixed-base case and the flexible-base case. In total, there are three models for each considered building as follows:
- B1_FIXED is the model designed and evaluated as being fixed at its base. The results obtained from this model will serve as a reference for comparing the following SSI results.
- B1_FLEXIBLE-1 is the model designed as being fixed at its base but evaluated as being flexibly supported.
- B1_FLEXIBLE-2 is the model designed and evaluated as being flexibly supported at its base.
Note that the B1_FIXED model does not consider any kind of Soil-Structure Interaction. Instead, the results obtained for this model will serve as a reference for comparing the SSI results.
3.1. Building Description
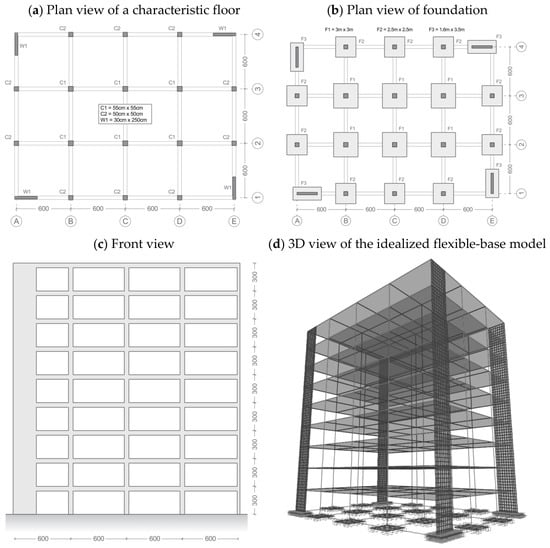
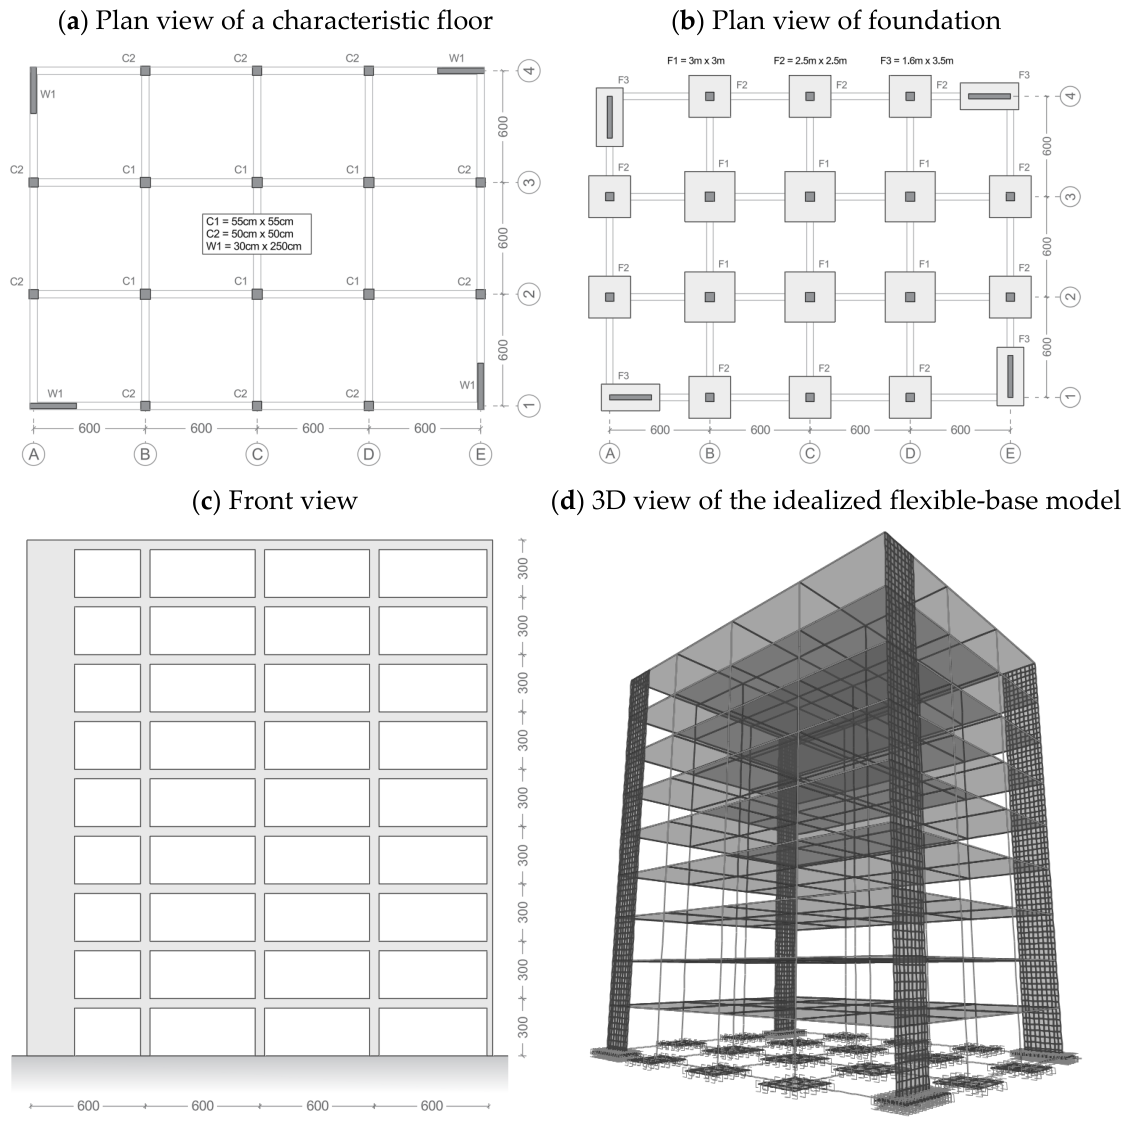
Figure 2 shows the plan and front view of the structure together with the plan view of its foundations and its idealized flexible-base model. The height of each story is , which gives an overall building height of . As seen from the figure, the building has a rectangular and regular form in its plan. The regularity is maintained to isolate any other effect and to focus solely on the SSI effects. The beams have cross-section dimensions of , while the slabs have a thickness of . The foundation system consists of spread footings interconnected with foundation grade beams. The depth of the footings are . The material grades for concrete and reinforcing steel are C25/30 and B500C, respectively. The geometry of the building was limited by the minimal required stiffness (so as to keep the interstory drifts within the limits of EN 1998-1).
Figure 2.
Geometric properties of the hypothetical building. (a) Plan view of a characteristic floor with column and wall size details; (b) Plan view of foundation system; (c) Front profile view; (d) 3D view of the idealized flexible-base model.
3.2. Soil Modelling
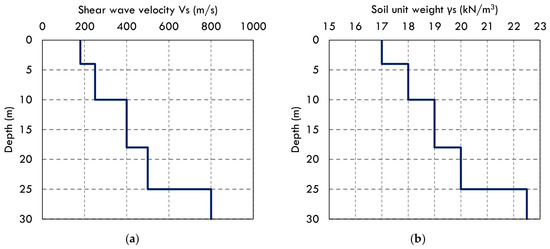
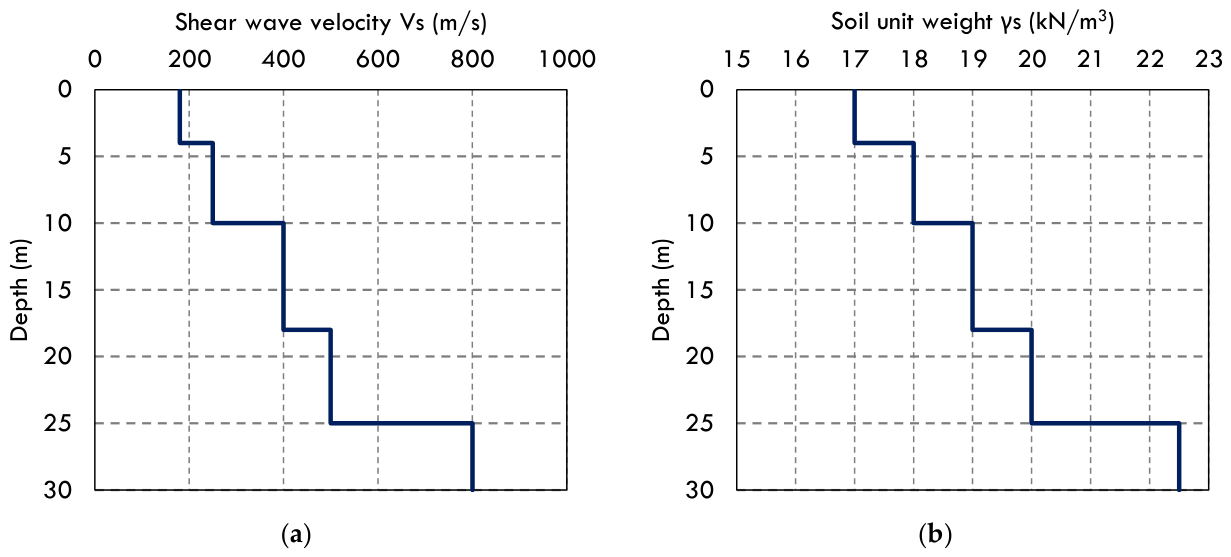
The parameters describing the soil environment were taken from [21] based on the results from an instrumented existing building in the city of Ohrid, North Macedonia. The site is classified as soil category C, as the average time-history spectrum aligns with the Eurocode 8 category C elastic spectrum. To match the shear wave velocity of this soil category, the upper layers of the site were slightly improved in this study. The profiles of shear wave velocity and of soil unit weight for the considered soil environment are shown in Figure 3.
Figure 3.
The profile of shear wave velocity (a) and the profile of soil unit weight (b).
The depth considered for the average effective profile velocity was based on the size of the spread footings, and a velocity equal to 180 m/s was determined for all considered footing dimensions. Poisson’s ratio of was used for the upper layers.
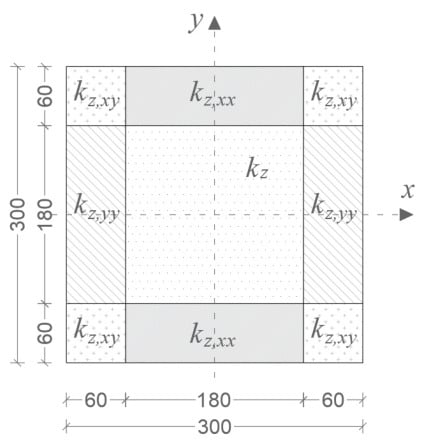
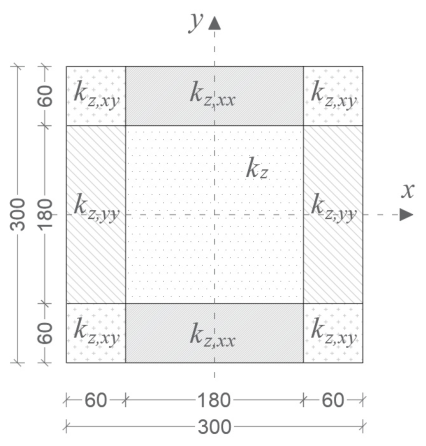
For SSI modeling, the substructure approach was used, meaning that the soil media was modeled using uniaxial springs and dashpots when considering inertial interaction. The spring and dashpot coefficients have been calculated using the equations derived by Pais and Kausel (1998) [22]. To account for foundation flexibility, the Beam on Nonlinear Winkler Foundation (BNWF) modelling was used, where the uniaxial springs were distributed over the footing footprints. The coefficients of vertical springs and dashpots within the end zones are modified to reproduce the appropriate rotational stiffness. Table 1 shows the calculated values of springs and dashpots for footing F1, while Figure 4 shows the zones where these values are distributed over the footing.
Table 1.
Values of springs and dashpots for footing F1, accounting for rocking modes of vibration.
Figure 4.
Spring zones in footing F1.
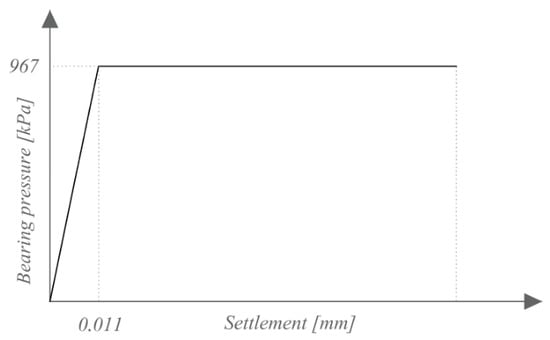
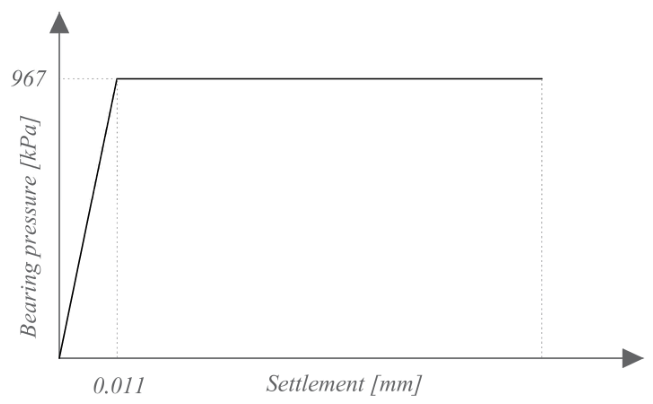
The values of the springs given in Table 1 do not consider any nonlinearity in the springs. In order to account for spring nonlinearity, which may be caused by foundation lifting or loss of bearing capacity of the soil, the constitutive law of Figure 5 was used [23]. In this model, the soil nonlinearity is simplified as a linear-elastic-perfectly-plastic behavior. The yield capacity of the spring is based on the nominal unfactored bearing capacity, and the yielding settlement is calculated as the quotient of bearing capacity and spring stiffness. The soil material and, consequently, the soil-foundation interface cannot accommodate any tensile load. So, tensile resistance of the springs is zero. For elastic analysis, the stiffness of the “rocking” springs of the perimetral foundations was reduced by 50% to account for the uplift [24]. The constitutive law shown in Figure 5 shows the simplified nonlinear behavior of spring of foundation F1.
Figure 5.
The simplified nonlinear behavior of spring.
The effects of kinematic interaction, including base slab averaging and embedment effects, on the foundation input motion were determined to be small for spread footings, and so kinematic interaction effects were not considered further. Although the BNWF model provides an efficient and widely used representation of soil–foundation interaction, it relies on several simplifying assumptions that may influence the predicted foundation response. In particular, the soil is represented by a set of independent springs and dashpots, which neglects soil continuity and the redistribution of stresses within the soil mass. Furthermore, the adopted constitutive law idealizes the soil response as linear elastic–perfectly plastic and does not account for cyclic degradation, stiffness degradation with increasing strain, or multidirectional loading effects.
These simplifications may affect the predicted magnitude of foundation settlements, uplift, and rocking rotations. Consequently, the quantitative values of force redistribution between walls and frames, foundation rotations, and energy dissipation reported in this study should be interpreted within the context of the adopted modelling assumptions. Nevertheless, the BNWF approach is generally considered suitable for capturing the primary mechanisms governing the response of shallow spread foundations, namely foundation compliance, uplift, and nonlinear bearing behavior, which are the key SSI phenomena investigated in this work.
For the considered case study, the use of the BNWF model was deemed appropriate due to the relatively small building footprint, regular structural configuration, shallow spread footings, and the absence of conditions requiring simulation of complex soil phenomena such as wave propagation, significant spatial stress redistribution, pore-pressure generation, or advanced cyclic soil degradation. More rigorous continuum-based SSI approaches could provide a more detailed representation of soil behavior and may lead to different quantitative estimates of rocking response and force redistribution. However, the qualitative trends identified in this study are expected to remain governed by the same fundamental mechanism of increased foundation flexibility and uplift-induced redistribution of forces.
3.3. Design Considerations
The building is designed in accordance with EN 1992-1-1 [25] and EN 1998-1 [20]. In addition to the self-weight, additional dead load with a magnitude of and live load with a magnitude of were assigned to the building models. The building was designed for a peak ground acceleration of . The type 1 design spectrum was used corresponding to a soil category C. The prototype building was designed for medium class of ductility (DCM). To account for crack openings, the moments of inertia of walls, beams, and columns were reduced by 50% as suggested by 4.3.1(7) of EN 1998-1 [20]. For beams and walls, only the larger moments of inertia were reduced, whereas for columns the reduction was done for both axes of their cross sections. The elastic analyses of the building were carried out in Robot Structural Analysis Professional 2024 [26], whereas for nonlinear analysis SAP2000 [27] was used.
The preliminary analysis of the B1_FIXED has shown that, in -direction, of the base shear is resisted by the walls, whilst the other is resisted by the frames. Based on EN 1998-1 classification (Figure 1), this system is categorised as a dual wall-frame system or, more specifically, as a wall-equivalent dual system. As such, its behavior factor for the medium class of ductility (DCM) amounts to . Since the range of dual-system classification spectrum is larger in ASCE/SEI 7-16 than in EN 1998-1, the system is also classified as a dual system in the ASCE/SEI 7-16 code. The structural behavior of the building is very similar in both orthogonal directions, so only the results for -direction will be presented here.
Substituting the fixed supports with soil springs, developed as described previously, the distribution of shear forces changes, and so does the classification of the system. For B1_FLEXIBLE-2 model, of the base shear is resisted by the walls, and the remaining is resisted by the frames. With such a distribution of shear forces, the system is classified as a frame-equivalent dual system with a behavior factor of . Due to the increase in behavior factor, the design base shear is decreased in the flexible-base building. This results in a reduction of reinforcement demand in the walls at the expense of higher demand in the columns of the bottom stories. It is worth mentioning that, although the behavior factors depend on code-based system classification, they are also influenced by several other parameters. The discussion of the behavior factor in this work is limited to its relation to system classification and does not address detailing or energy dissipation mechanisms.
4. Results and Discussion
For the considered RC dual wall-frame building structure, three types of analyses were carried out: linear-elastic analysis, nonlinear static (pushover) analysis, and nonlinear dynamic (time-history) analysis.
4.1. Linear-Elastic Analysis
4.1.1. Modal Analysis
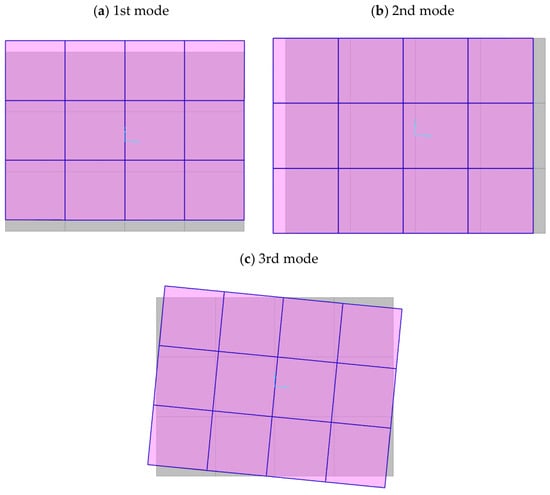
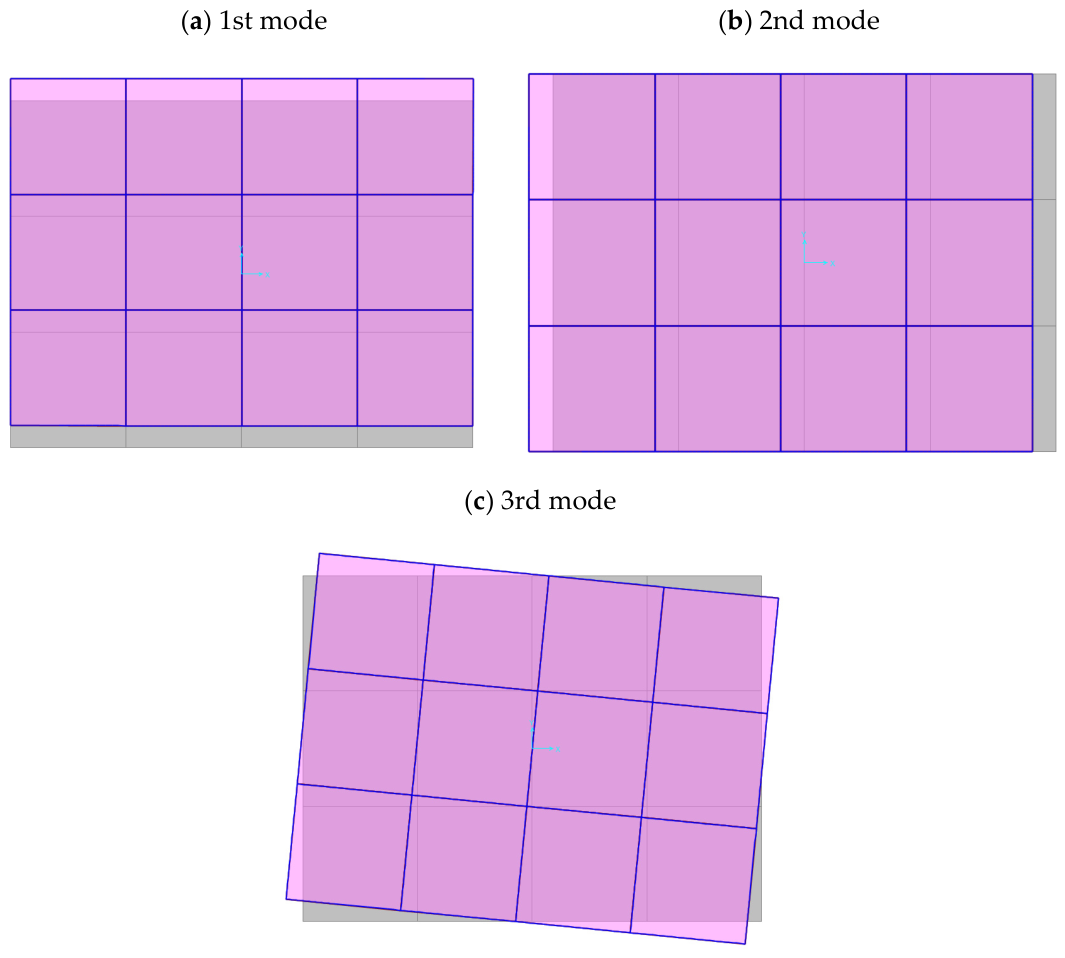
The first three mode shapes of Building 1 are shown in Figure 6, and their corresponding vibration periods are given in Table 2. Because the dynamic characteristics of B1_FLEXIBLE-1 and B1_FLEXIBLE-2 models are totally identical, they are both referred to simply as B1_FLEXIBLE. The first two mode shapes are mainly translational, and the third one is torsional. Also, the transverse () direction of the building is somewhat more flexible than the longitudinal () direction. It is worth noting that the mode shapes given in Figure 6 are representative for both fixed-base and the flexible-base models. Changing the base of the system changes from fixed to flexible, a slight elongation in all vibration periods can be noticed.
Figure 6.
The first three mode shapes of Building 1 (plan view). (a) 1st mode; (b) 2nd mode; (c) 3rd mode.
Table 2.
Vibration periods corresponding to each mode shape of Building 1.
4.1.2. Base Shear and Story Shears
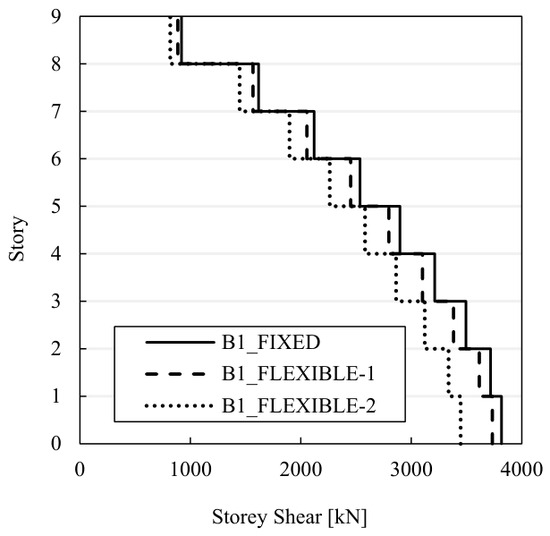
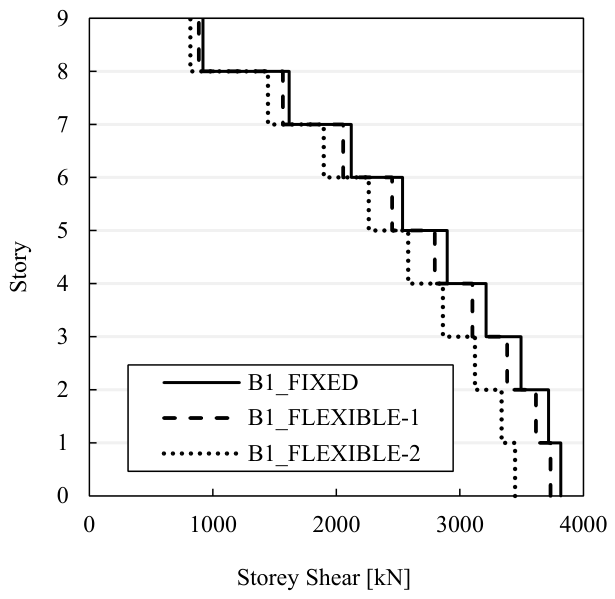
The overall shear forces from elastic analysis distributed throughout the height of all investigated models of Building 1 are shown in Figure 7. A slight reduction of shear forces is noticed between B1_FIXED and B1_FLEXIBLE-1 models. On the other hand, the difference between B1_FLEXIBLE-1 and B1_FLEXIBLE-2 is somewhat larger. Recalling that models B1_FIXED and B1_FLEXIBLE-1 differ only in the way they are supported, it is clear that the difference in story shears is from SSI only. On the other hand, B1_FLEXIBLE-2 has reduced story shears not only because SSI effects are considered, but also because it is classified as a frame-equivalent dual system with a behavior factor of . If the models B1_FLEXIBLE-1 and B1_FLEXIBLE-2 had the same type of structural system, their models would have been identical, and so would have been the story shears. So, the difference between B1_FLEXIBLE-1 and B1_FLEXIBLE-2 models is due to the different way in which system type affects the elastic design forces.
Figure 7.
Shear forces over the height of Building 1 models.
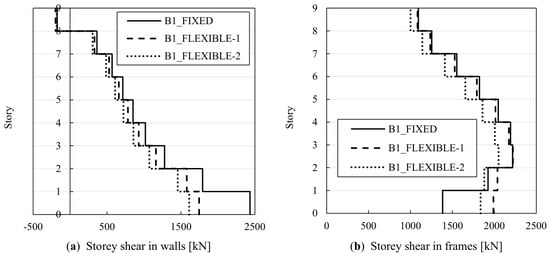
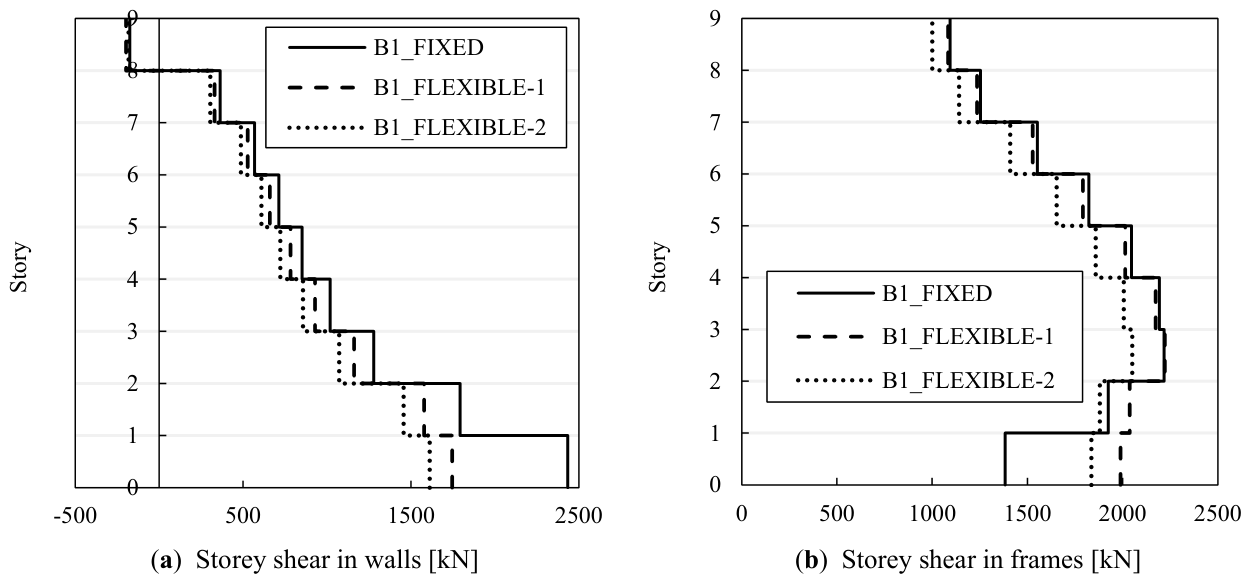
Figure 8 shows the contribution of walls and frames in resisting story shears. A significant reduction of shear forces can be noticed in the walls, as the base of the model changes from fixed to flexible. In contrast, when flexibility of the base is considered, a significant increase in story shears can be noticed in the frames. Since the reduction of overall base shear due to SSI only was minor (Figure 7), the major effect of base shear is in shifting the shear forces from the walls to the frames. Considering the fact that the walls are much stiffer than the columns, the direct effect of SSI (base flexibility) is larger in the walls than in the frames. However, since the base of the wall is softened, its cantilever effect is reduced, and the shear forces in the lower stories are redistributed from the walls to the frames.
Figure 8.
Contribution of walls (a) and frames (b) in resisting shear forces in Building 1 models.
It is worth mentioning that, for buildings having moderate fundamental periods such as the ones analyzed here, the soil-structure interaction is not expected to increase base shear, as it might for very stiff, short period, structures. If the increase of base shear is to the extent shown here, it may not affect the frame capacity due to the following reason: the increased shear forces in the columns of the first story are still smaller than in the columns with the largest shear forces (third story). However, a variation of axial forces and of bending moments may have additional effects on the columns’ resistances. Although the effect of increasing forces is limited to the frames only and, in fact, the overall base shear is reduced, the beneficial effect of SSI may not always be warranted.
Figure 8 shows the effects of system flexibility on story shear, broken down between the walls and the frames. It is clear that the largest effect of redistribution of forces occurs in the first story, and this effect diminishes towards the top of the building. The walls of stories 3 to 9 are equally sensitive to the changes in the building base as they are to changes in the structural system (behavior factor), i.e., the horizontal shift between the solid line and the dashed line is nearly equal to the horizontal shift between the dashed line and the dotted line. On the other hand, in the frames of stories 3 to 9, the effect of base flexibility is negligible compared to the effect of the system type (the solid line almost overlaps the dashed line, whereas the dotted line is almost equally shifted from both).
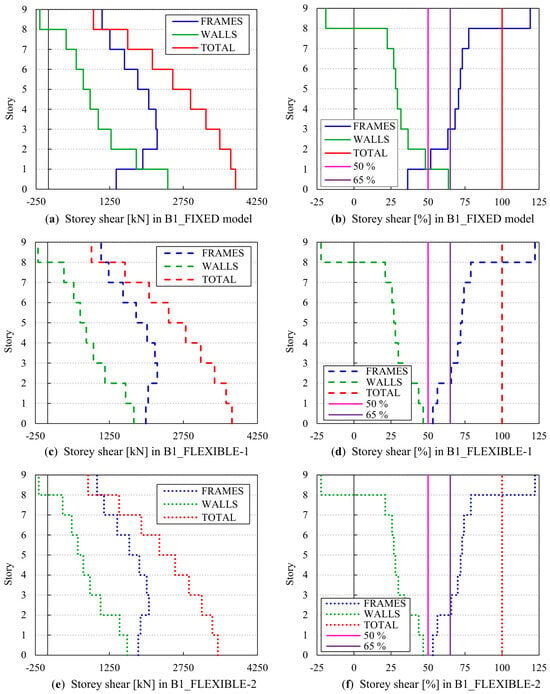
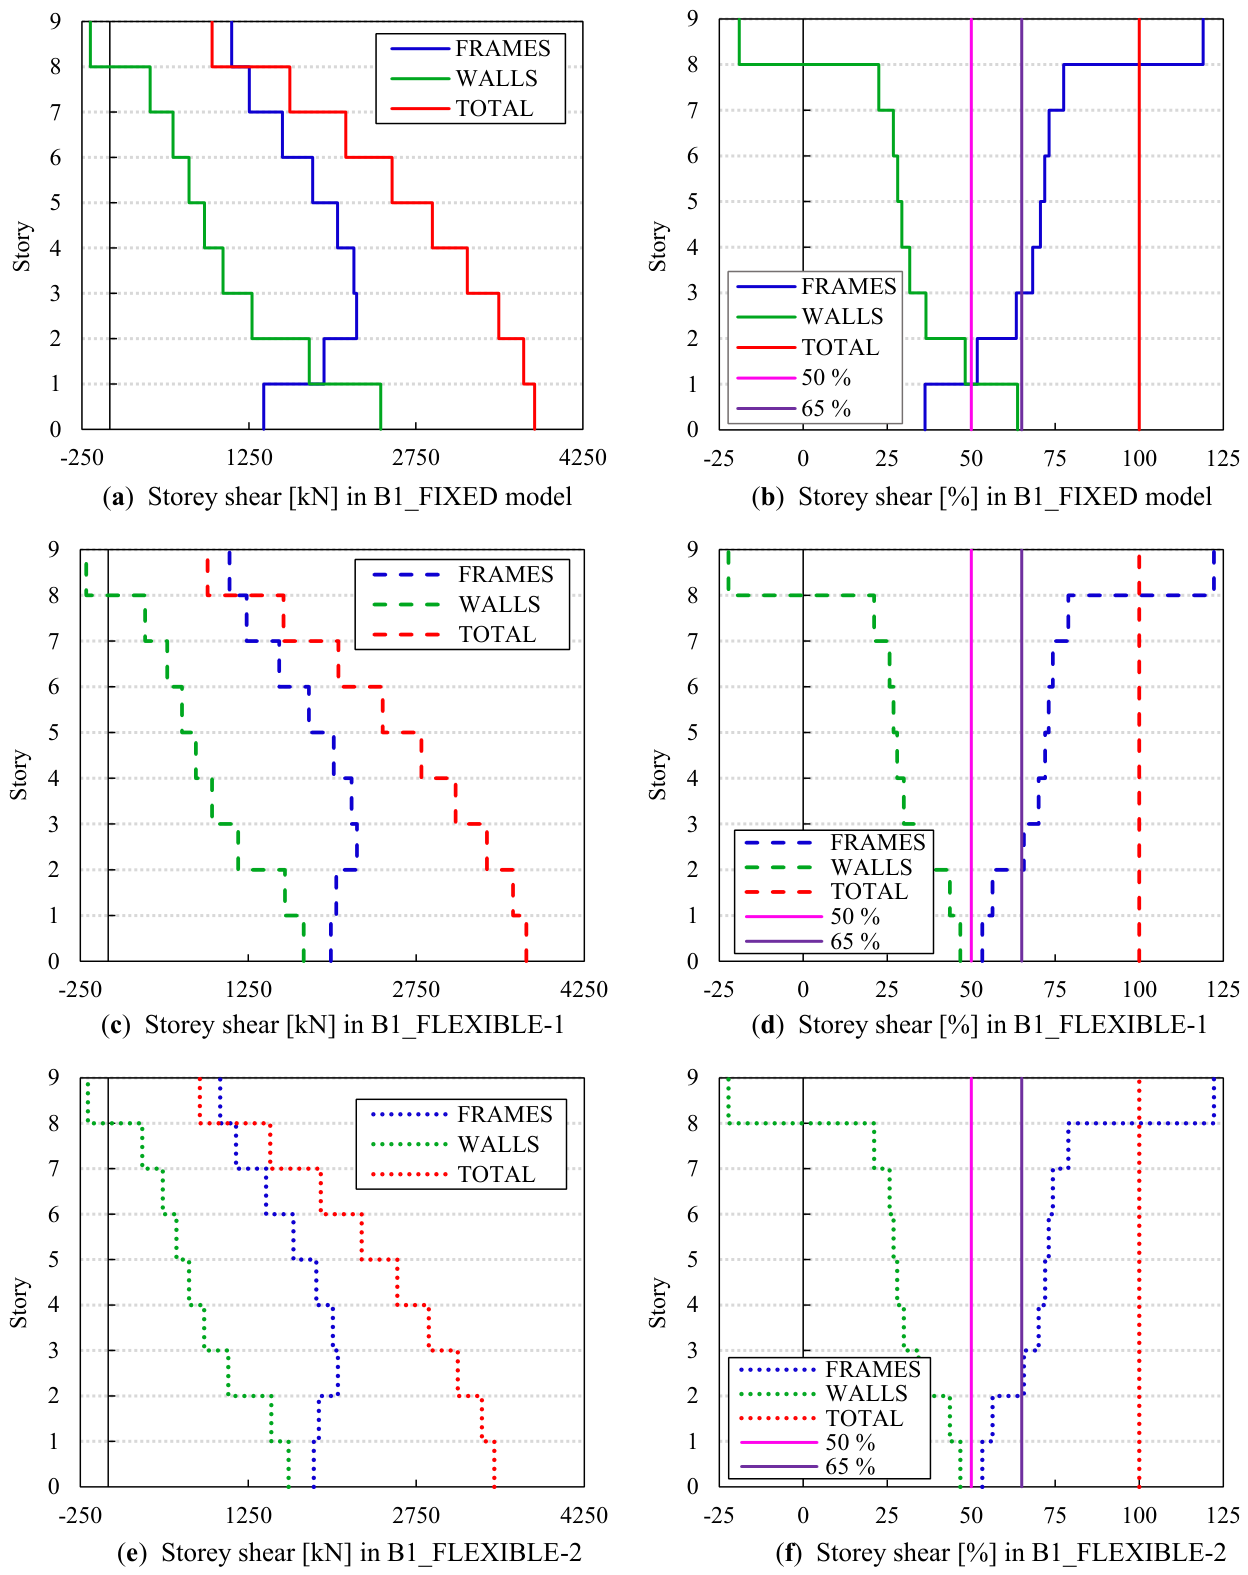
The contributions of walls and frames to the story shears, along with the total story shears, for each separate model of Building 1 are shown in Figure 9. On the left, the graphs are presented in force units, while on the right, they are presented in percentages. The base story shear distribution does not change at all among the flexible models. However, the amplitude slightly changes due to the different behavior factors applied.
Figure 9.
Wall and frame contributions to resisting shear forces on B1_FIXED model (a,b), B1_FLEXIBLE-1 model (c,d), and B1_FLEXIBLE-2 model (e,f).
The two additional vertical lines at 50% and 65% on the right figures represent the thresholds of wall contribution for system classification. For example, the B1_FIXED model falls in a wall-equivalent dual system as its wall contribution to base shear is slightly less than . On the other hand, the flexible-base models fall in the frame or frame-equivalent dual system, as their wall contributions on base shear are less than .
From a mechanical perspective, this redistribution can be attributed to the reduction of rotational restraint at the base of the walls due to soil flexibility. As the foundation becomes more compliant, the cantilever action of the walls is diminished, leading to a decrease in their lateral resistance contribution. Consequently, the frame system—being less sensitive to base rotation—assumes a greater share of the seismic demand.
4.1.3. Displacements and Interstory Drifts
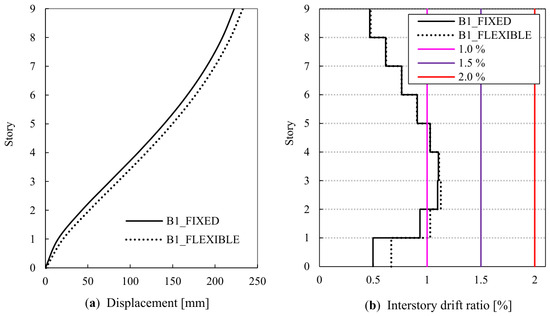
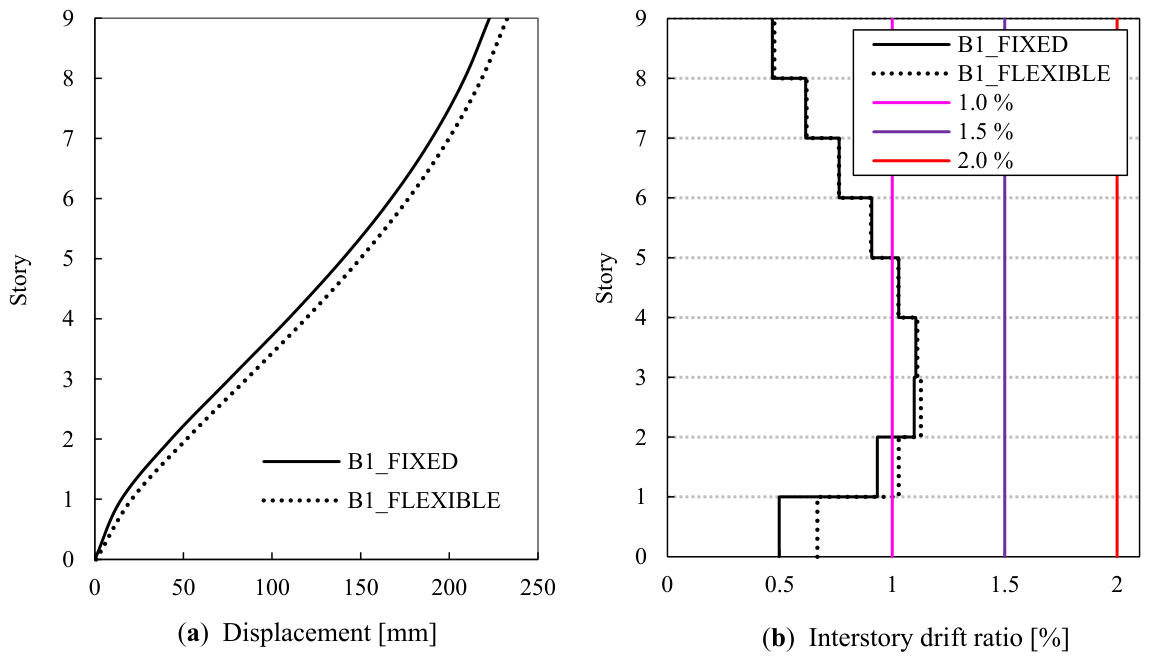
The displacement shapes for the fixed-base and flexible-base models of Building 1 are shown in Figure 10. The elastic displacement shapes of the two flexible-base models are totally identical and thus are represented with a single curve in the figure. By comparing this curve with the one representing the displacement shape of the fixed-base model, a slight increase in the displacement can be noticed in the flexible-base model. The increase appears to be almost uniform over the entire height of the building. However, at the base of the building, a larger difference between the fixed-base model and the flexible-base model can be noticed due to the softening of the cantilever effect in the flexible-base model.
Figure 10.
Displacements (a) and interstory drift ratios (b) for the Building 1 models.
The right-hand side of Figure 10 shows the interstory drift ratios of Building 1 models and compares them with the three levels of the allowable interstory drifts based on the type of the nonstructural infill as well as on their connection to the structure. Except for the bottom two stories, where the interstory drifts of the flexible-base model are significantly larger than those of the fixed-base model, no other obvious difference between the models can be noticed. However, the increase is generally lower than the maximum interstory drift of the fixed-base model. In both models, the limit of 1% is exceeded in some stories, which means that a seismic action having a larger probability of occurrence than the design seismic action will probably damage the infill walls unless they are constructed of ductile materials or they do not engage with the structure.
4.2. Nonlinear Static (Pushover) Analysis
The discussion from the previous section revealed some important considerations regarding the code-based design of the buildings. However, the results from the nonlinear static analysis provide a better insight into the nonlinear step-by-step lateral loading of the building until collapse.
4.2.1. Lateral Displacement
The damage state of a building is usually defined in terms of displacements. In (EN 1998-3 2005), these damage states are known as Limit States (LS). Based on the level of damage, there are three limit states: Near Collapse (NC), Significant Damage (SD) and Damage Limitation (DL). However, these limit states are not defined quantitatively. Based on the descriptions given in EN 1998-3 [28] and FEMA 356 [17], the above-mentioned limit states correspond respectively to the following Structural Performance Levels of FEMA 356: Immediate Occupancy, Life Safety and Collapse Prevention. The interstory drift limits corresponding to these Structural Performance Levels for wall and frame structural systems are given in the following table (Table 3). Since the models analyzed in this study consist of both walls and frames, the interstory drift limit for walls will govern.
Table 3.
The limit states (structural performance levels) and their corresponding interstory drifts.
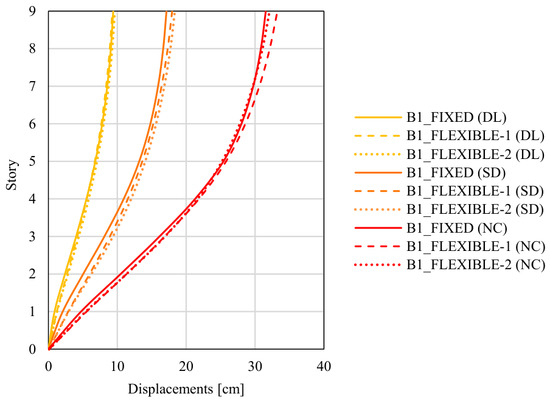
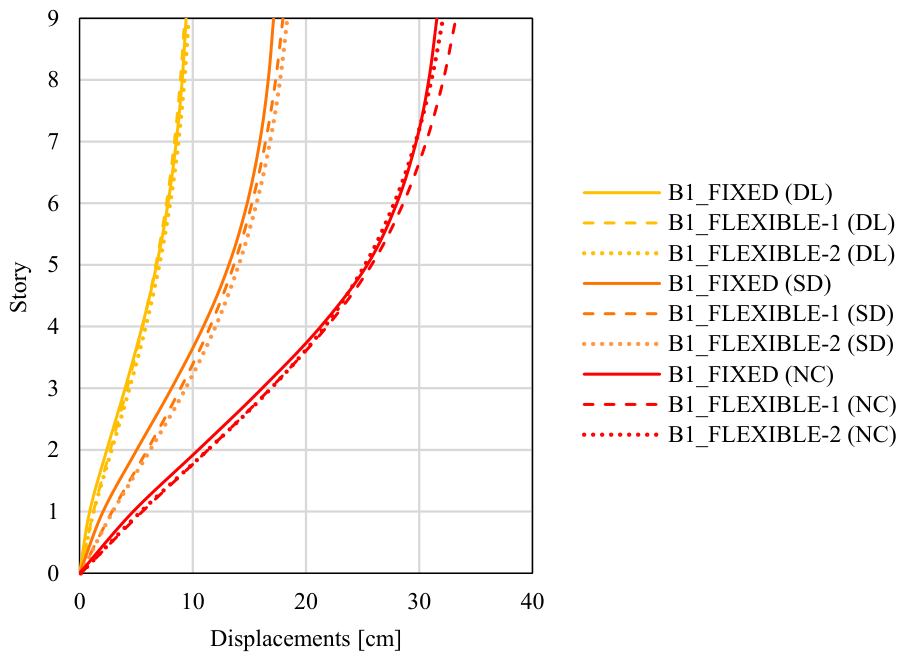
The displaced shapes of Building 1 at the three limit states (determined by the interstory drift limits of the walls) are shown in Figure 11. A slight increase in the overall displacements can be seen in all limit states when SSI is considered. This increase in the displacements is similar for all three limit states.
Figure 11.
Displacement shapes of Building 1 models for the three limit states.
4.2.2. Capacity Curves and Contributions of Walls and Frames in Resisting Base Shear
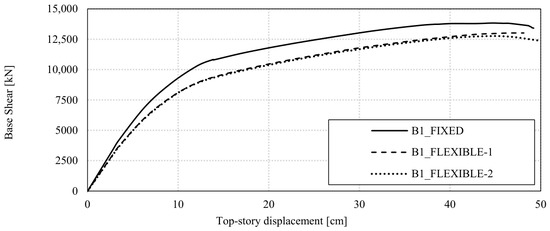
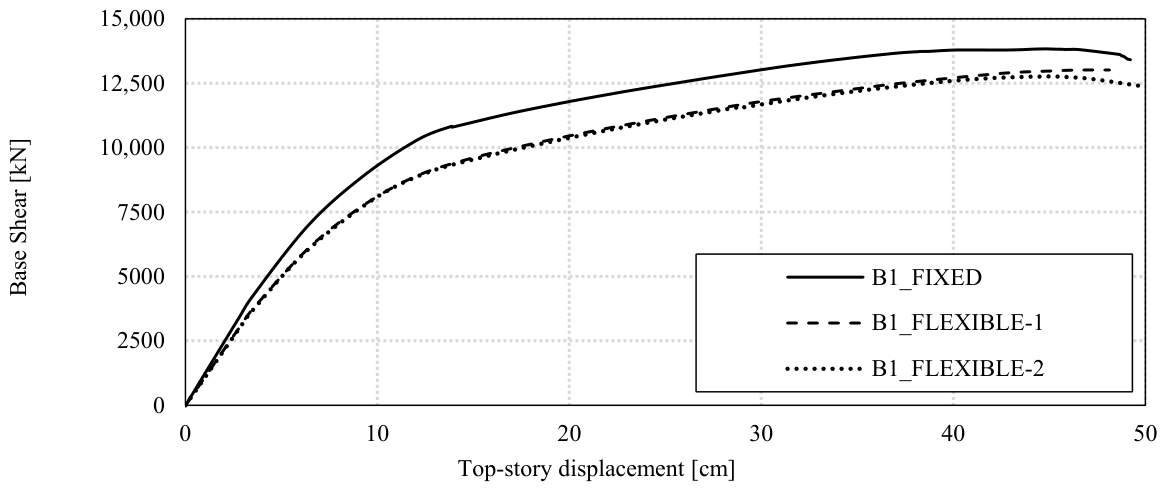
The capacity curves for the Building 1 models are shown in Figure 12. B1_FIXED model exhibits larger strength and stiffness compared to the flexible models. On the other hand, the deformation capacities of all models are very similar. The B1_FLEXIBLE-1 model closely matches the strength and stiffness of the B2_FLEXIBLE-2 model, with the exception at ultimate deformation. This indicates that incorporating SSI during the design phase reduces the strength and stiffness of the building.
Figure 12.
Capacity curves for Building 1 models.
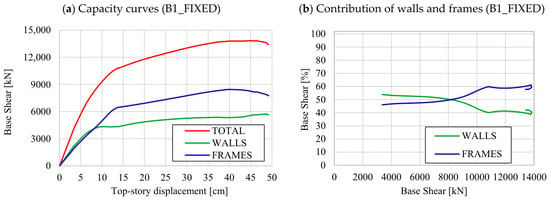
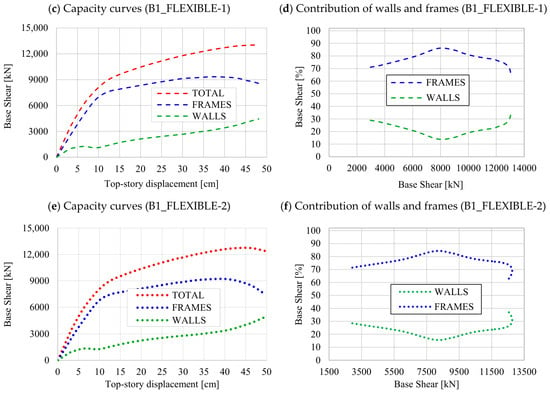
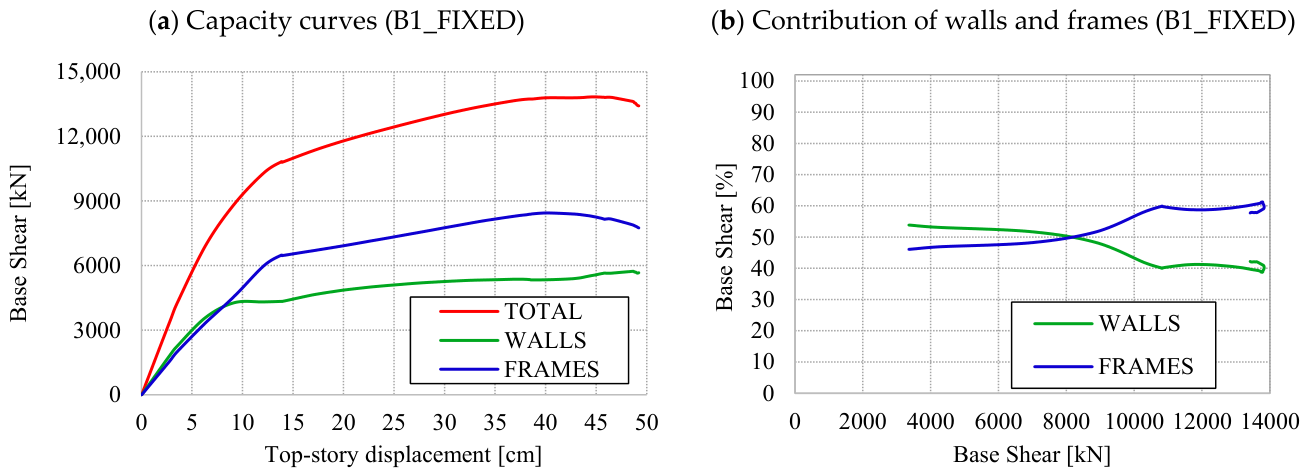
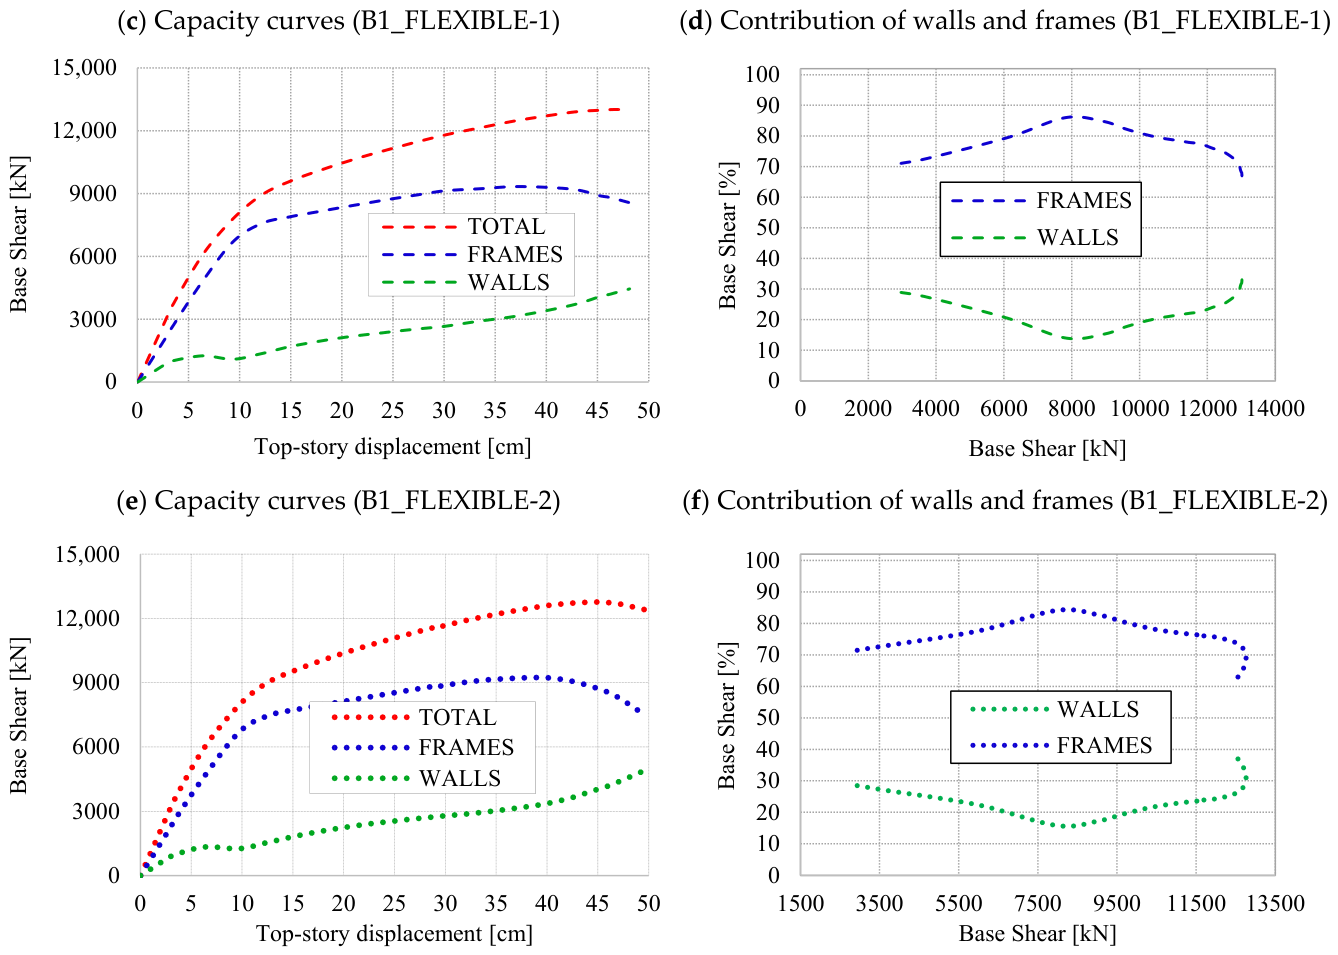
The capacity curves of walls and frames considered separately in resisting lateral loads together with the overall building capacity are given on the left-hand side of Figure 13. Similarly, the right-hand side of Figure 13 shows the variation of the contributions (in percentages) of walls and frames as the base shear increases. A large difference in behavior can be noticed between the fixed-base and flexible-base models. In the fixed-base model, at the onset of load application, the building behaves as a wall-equivalent dual system, with the walls resisting the larger portion of base shear. This continues until the structural yielding of the walls. Past wall yielding, the contribution of the frames continues to increase—shifting the structural system to a frame-equivalent dual system—and continues to increase until yielding of the frames occurs. After this point, up to the ultimate load, the base shear in walls and frames remains nearly constant.
Figure 13.
The contributions of walls and frames in resisting base shear. B1_FIXED (a,b), B1_FLEXIBLE-1 (c,d) and B1_FLEXIBLE-2 (e,f).
On the other hand, in the flexible-base models, most of the lateral force is resisted by the frames, with the walls resisting less than 40% of base shear at their maximum. This means that the flexible-base models behave as frame or frame-equivalent dual systems throughout the entire process of nonlinear loading. Note that the distribution of base shear forces is very similar between the flexible-base models.
Comparing the overall behavior of the fixed-base and flexible-base models, the larger contribution of the walls delays the yielding of the frames in the fixed-base model. On the other hand, in the flexible-base models, the yielding of the frames occurs at smaller drifts, while no obvious yielding is noticed in the walls. Instead, the wall’s foundation undergoes considerable rotation, with noticeable uplift on the tension side. The moment-curvature relationship for a wall and a column will be shown in the subsequent sections to clarify these discussions.
Table 4 shows the average contribution of walls and frames in resisting the base shear, averaged over the nonlinear loading steps. The incorporation of SSI in the model changes the force distribution between the walls and frames, i.e., about 15% of the average total base shear is transferred from the walls to the frames when SSI is considered.
Table 4.
Average contributions of walls and frames in resisting base shear in Building 1 models.
4.2.3. Moment-Curvature Relationships
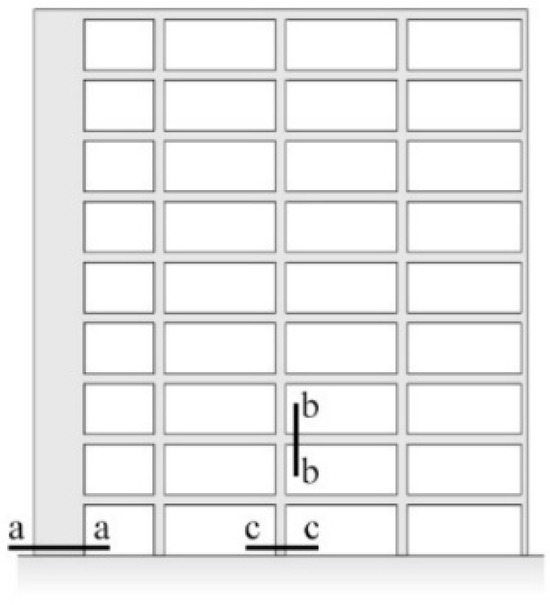
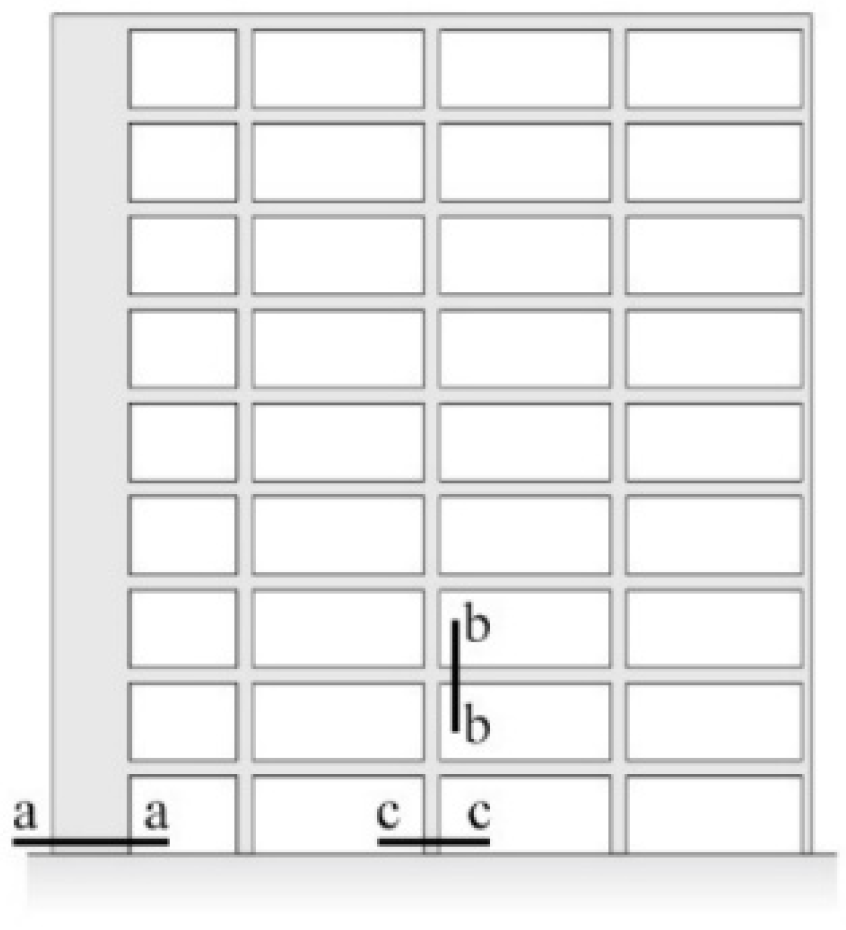
The capacity curves presented in the previous section have shown mostly the global behavior of the considered buildings with a fixed base and a flexible base. To better understand the response of specific structural components within the building models, the moment-curvature relationships will be discussed in this section. Figure 14 shows the chosen locations in Frame 1 of both buildings, for which the moment-curvature relationships are provided.
Figure 14.
The locations in Frame 1 for sections (a-a) wall, (b-b) beam and (c-c) column, for which the moment-curvature relationships are provided.
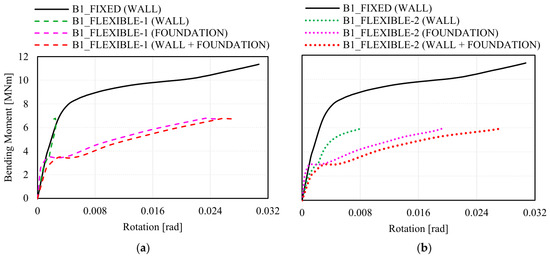
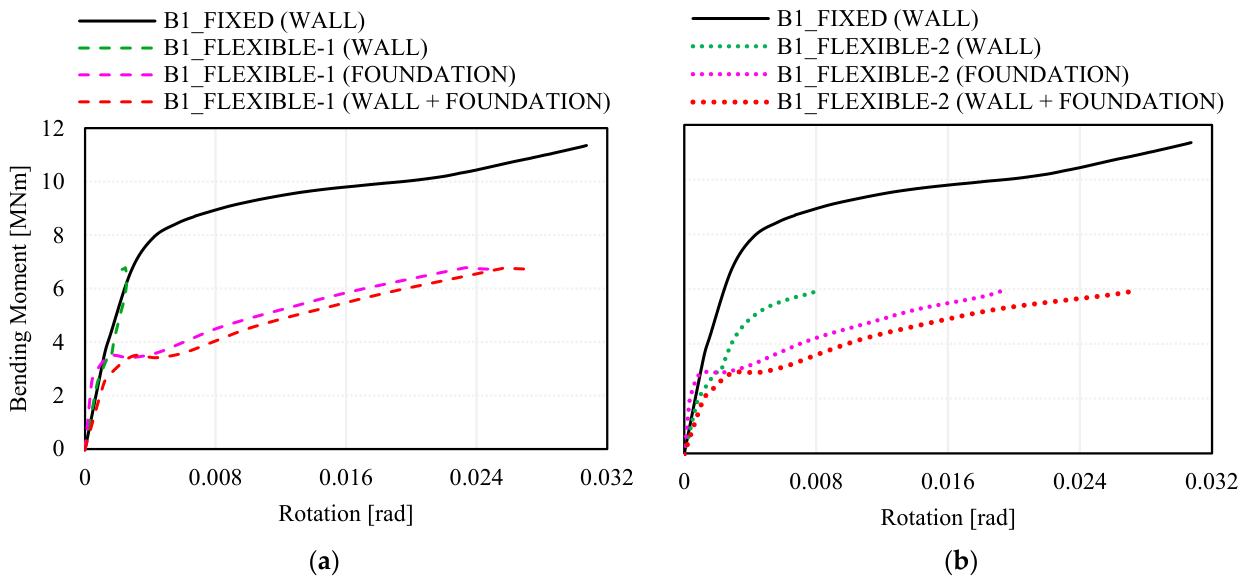
The moment-curvature () relationships for a section (a-a) of a wall of Building 1 models are shown in Figure 15. On the left side of the figure, the () relationship of a wall in the fixed-base model is compared to that of the B1_FLEXIBLE-1 model, whereas on the right side, it is compared to that of the B1_FLEXIBLE-2 model. The wall in the fixed-base model experiences considerable deformation before failure. However, in the B1_FLEXIBLE-1 model, the significant rotation of the foundation under the wall softens its fixed-end boundary condition. As a result, its rigid-body rotation is much higher than its rotation due to bending. This means that the net rotation of the flexible-base wall is significantly smaller than that of the fixed-base wall. In other words, for the same moment, the flexible-base wall experiences larger (rigid body) rotation than the fixed-base wall.
Figure 15.
Moment-Curvature Relationships for a section (a-a) at the base of a wall for Building 1 models: (a) B1_FLEXIBLE-1 vs. B1_FIXED and (b) B1_FLEXIBLE-2 vs. B1_FIXED.
Note that the rigid-body rotation of the flexible-base wall prevents the concentration of forces at its base, thereby delaying its damage. As a result, forces are redistributed to the frames, and the structure reaches its ultimate load before the wall experiences large nonlinear deformations, indicating low utilization of the wall’s strain energy in the B1_FLEXIBLE-1 model.
In Section 3.3, it was shown that changing the support conditions from fixed to flexible significantly reduced the shear forces in the walls. Consequently, the walls in the structure designed with a flexible base (B1_FLEXIBLE-2) require less reinforcement compared to those in the structure designed with a fixed base (B1_FIXED). The reduction in the reinforcement content also lowered the wall capacity. This reduction is reflected in the () relationships shown on the right side of Figure 15. The reduction of the reinforcement content allows the wall to yield and deform nonlinearly even with a flexible base. The nonlinear deformation of the wall slightly reduces the rotation of its foundation. However, comparing the common work of the wall and foundation among the Building 1 models shows that the wall in the B1_FIXED model provides not only greater strength and stiffness but also greater ductility.
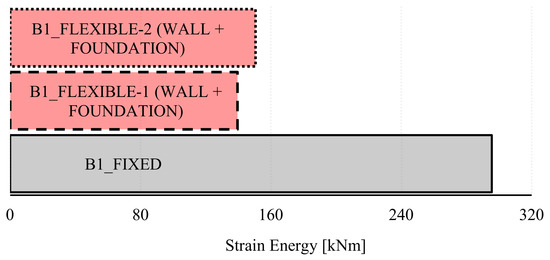
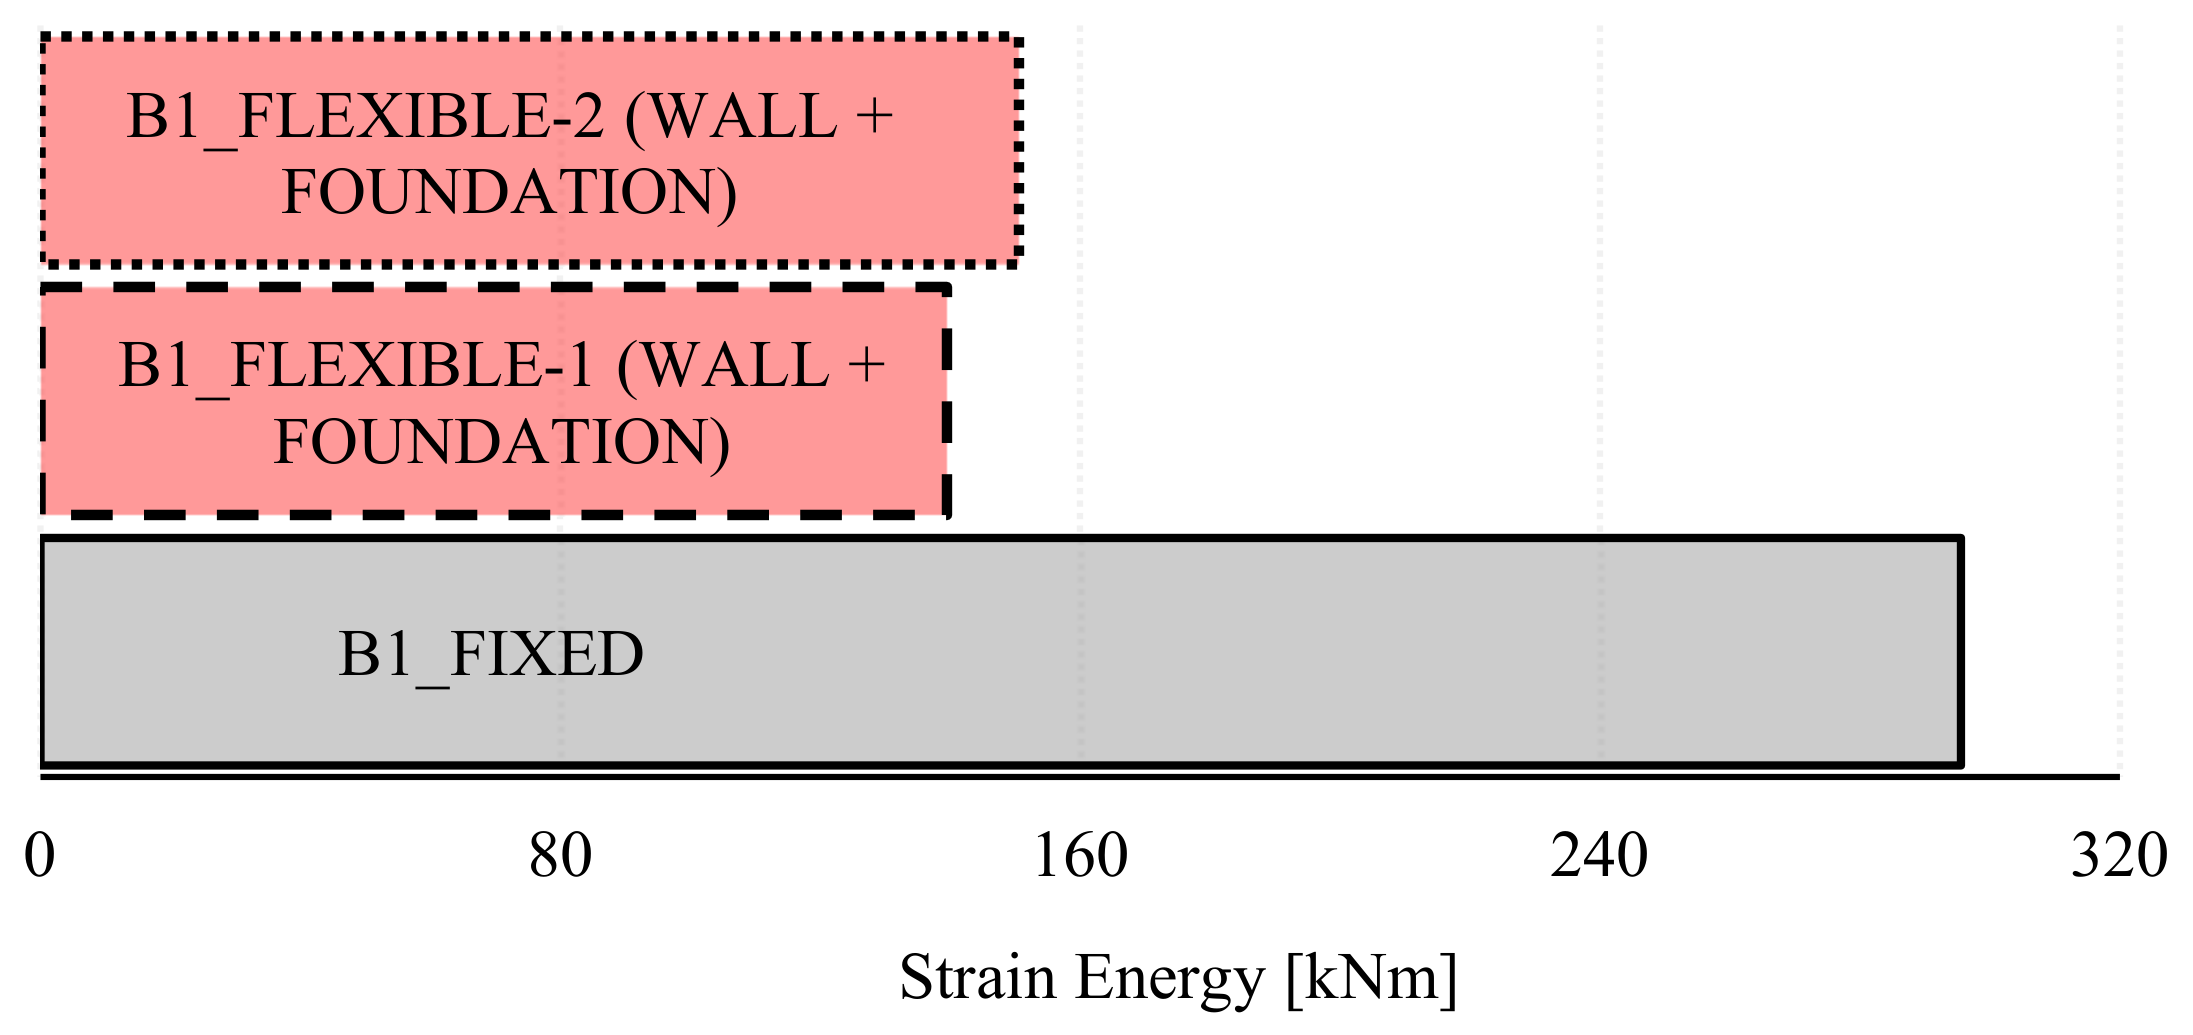
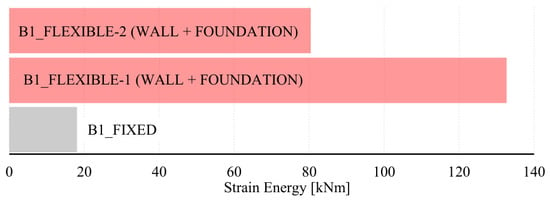
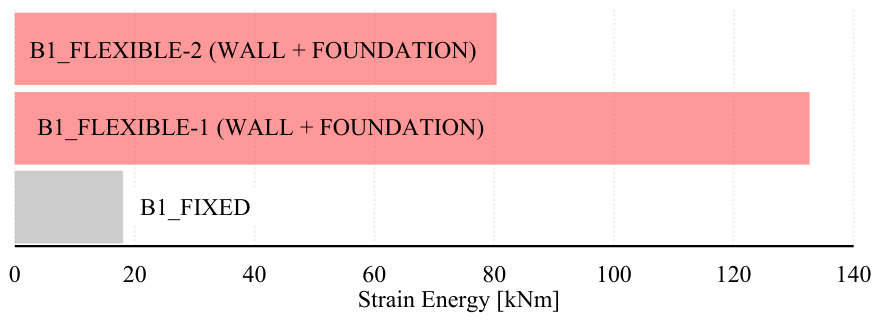
The area under the moment-curvature curve represents the strain energy developed by the corresponding component. From this perspective, the fixed-base wall develops more strain energy than the flexible-base wall, even when the latter is considered together with the foundation. In addition, it is unclear which flexible-base wall develops more strain energy. To compare them, the strain energies developed within each wall and foundation considered together are shown in Figure 16, whereas the strain energies exhibited among the walls and foundations of each model separately are shown in Figure 17. Note that the cumulative strain energies in the walls and foundations of the flexible-base models are similar, whereas the strain energy in the wall of the fixed-base model is significantly higher.
Figure 16.
Cumulative strain energies developed during nonlinear pushover analysis in the walls and foundations of Building 1 models.
Figure 17.
Distribution of strain energy between the wall and the foundation in the B1_FLEXIBLE-1 and B1_FLEXIBLE-2 models.
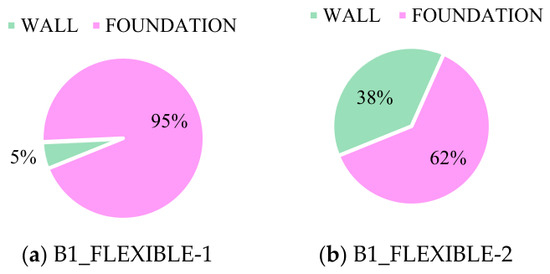
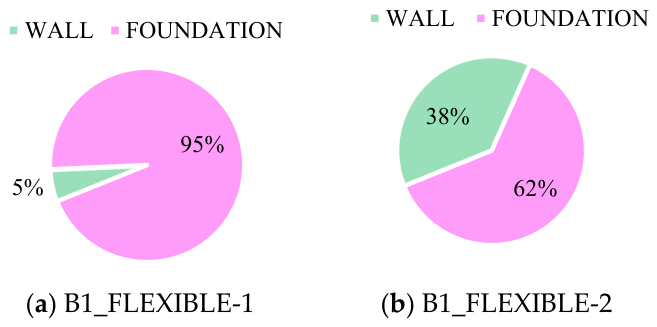
Although similar in magnitude, the cumulative strain energies of the walls and foundations differ significantly in the flexible-base models. Figure 17 illustrates the difference in strain energy distribution between the walls and foundations. Note that in the B1_FLEXIBLE-1 model, 95% of the energy is absorbed by the foundation. On the contrary, in the B1_FLEXIBLE-2 model, the situation is quite different: as the reinforcement content in the wall decreases, its rotation capacity increases, and the strain energy is transferred from the foundation to the wall. In other words, although the reinforcement content in the wall decreases when the building is designed with the flexible-base assumption, the wall’s strain energy increases compared to the flexible-base model that is not designed with the flexible-base assumption. This highlights the beneficial effect of considering the foundation flexibility in both the analysis and design of the dual wall-frame structures.
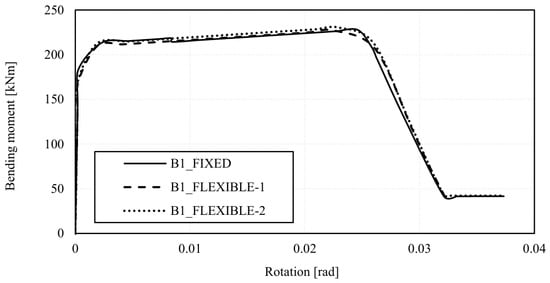
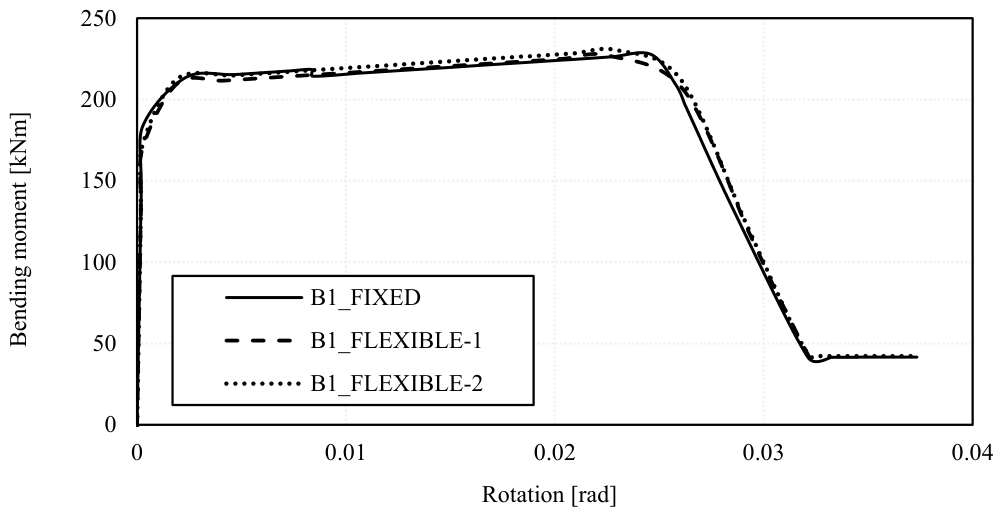
The moment-curvature relationships at a section (b-b) of a beam in the Building 1 models are shown in Figure 18. It can be observed that the curves nearly overlap, indicating that the beam section behaves similarly in each Building 1 model.
Figure 18.
Moment-Curvature Relationships for a section (b-b) at the end of a beam for Building 1 models.
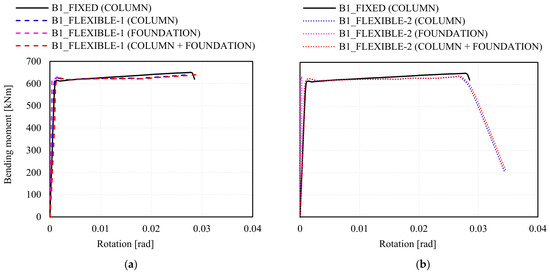
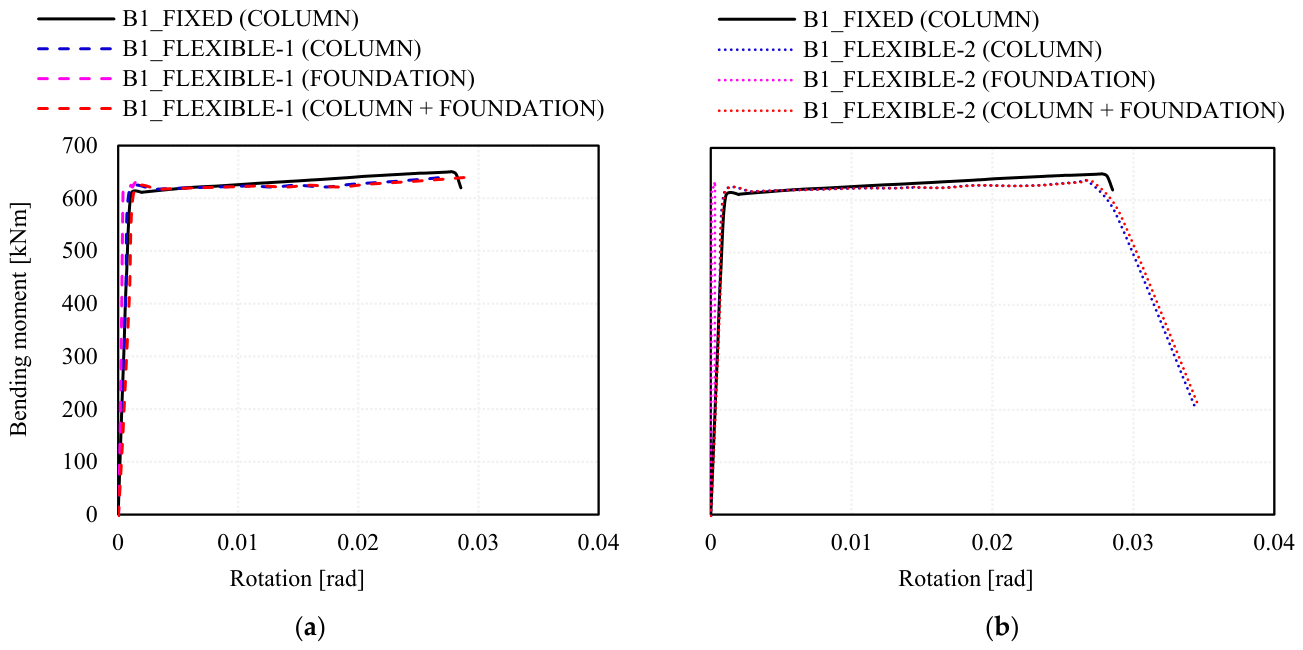
Figure 19 shows the moment-curvature relationships for a section (c-c) at the base of a column in the Building 1 models. Similar strength and stiffness can be observed among the columns in all Building 1 models. However, the base of the column in the B1_FLEXIBLE-2 model shows larger deformability as it reaches its ultimate strength. This increased deformation is accompanied by a strength degradation, meaning that the column section is maximally utilized in the B1_FLEXIBLE-2. Note that in both flexible-base models, the foundation rotation is very small. The foundation rotation is small enough to force the column to undergo its full nonlinear behavior.
Figure 19.
Moment-Curvature Relationships for a section (c-c) at the base of a column for Building 1 models: (a) B1_FLEXIBLE-1 vs. B1_FIXED and (b) B1_FLEXIBLE-2 vs. B1_FIXED.
Generally, for the Building 1 models, soil-structure interaction significantly affects the behavior of the walls in terms of strength, stiffness, and deformation. On the other hand, a negligible difference in strength and stiffness of the beams and columns is observed when SSI is considered. However, the curvature of the column slightly increases when the building is also designed under a flexible-base assumption.
4.2.4. Performance Assessment
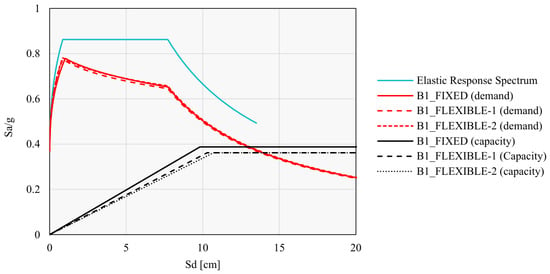
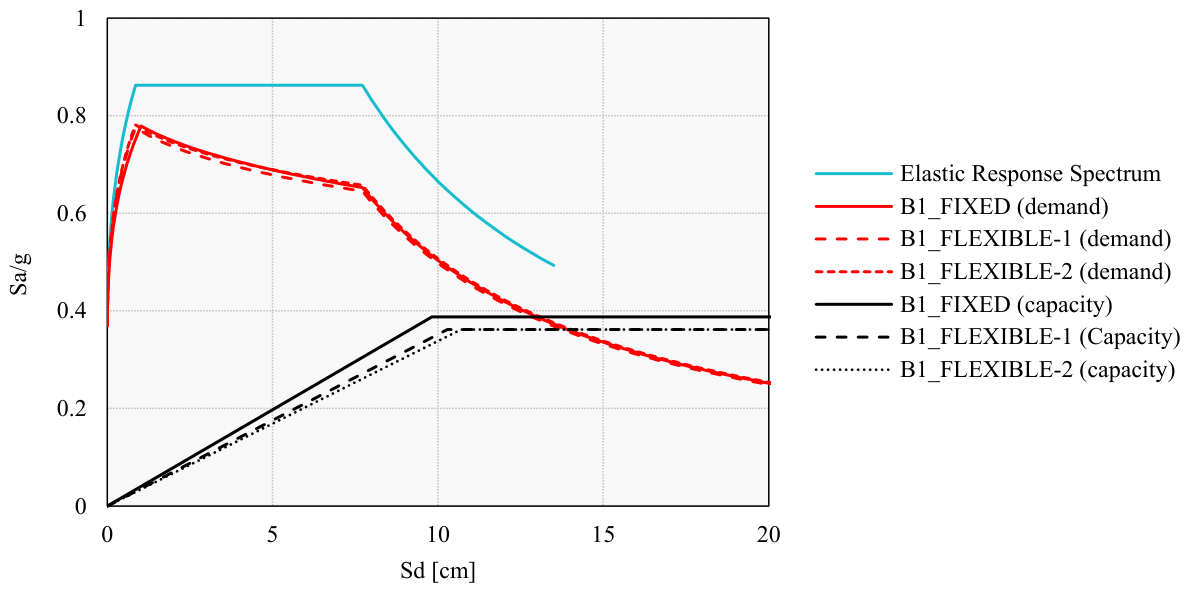
The capacity curves obtained from pushover analysis along with the corresponding response spectra were plotted together into an Acceleration-Displacement Response Spectra (ADRS) format to evaluate the performance of each model. The N2 method proposed by Fajfar and Fischinger (1998) [29] was used for assessing the performance, so the capacity curve is idealized into an elastic-perfectly plastic curve. The performance assessments of the three models of Building 1 are presented in Figure 20. The three models meet the required demands even though they slightly differ in terms of strength and deformation. The fixed-base model exhibits larger strength and stiffness, whereas the flexible-base models exhibit larger deformations. This indicates that even though the distribution of forces and deformations differs to a large extent between the models, they perform similarly.
Figure 20.
Performance assessment of Building 1 models.
4.3. Nonlinear Dynamic (Time-History) Analysis
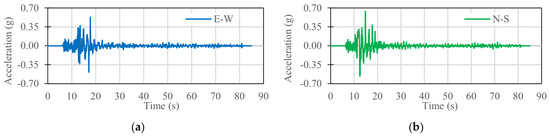
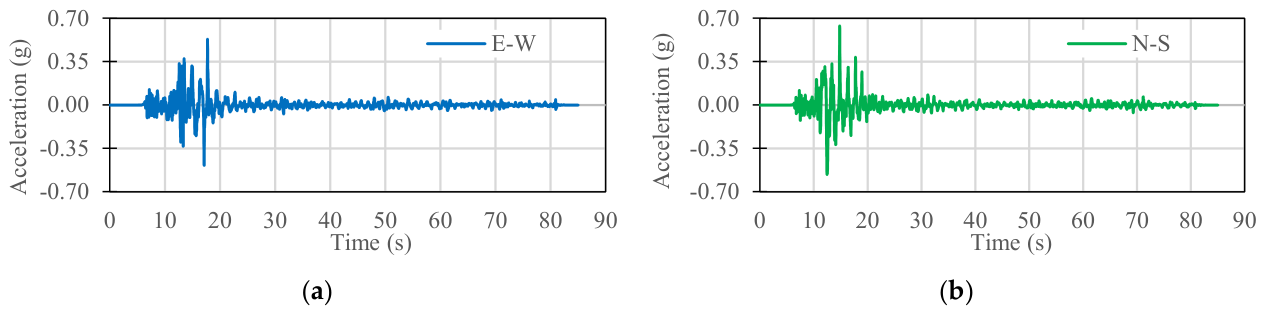
The earthquake record used in this study was selected from the Elbistan Earthquake, which occurred on 6 February 2023, in Kahramanmaraş, Turkey. This event, with a moment magnitude of 7.5, was the second major earthquake to strike the region that day, occurring approximately nine hours after the MW 7.8 initial event (Pazarcik earthquake). Numerous studies have indicated that extensive structural damage—and even building collapse—was caused by this event and linked to soil and foundation issues [7,30,31]. The soil characteristics at the recording station (Goksun Meteorology Directorate, Station 4612) correspond to soil category C, which aligns with the soil type assumed in the elastic design of the building models. It is worth mentioning that any other earthquake recorded on soil type A or B may derive similar results because foundation uplifting constitutes a considerable portion of foundation rotation. Station 4612 recorded the maximal peak ground acceleration for this earthquake [32], making it a significant data point for analysis. The acceleration time histories for the two horizontal components of the Elbistan earthquake are given in Figure 21. The E-W component will be used as input motion in the X-direction, whereas the N-S component will be used as input motion in the Y-direction. In other words, the analyses were carried out for both directions, although the results are shown for the X-direction only. The vertical component will not be considered in this work.
Figure 21.
Acceleration time histories for (a) E-W and (b) N-S components of the Elbistan earthquake (station 4612).
The properties of this recording of the Elbistan earthquake are shown in Table 5. The peak ground accelerations in both directions exceed the one used in the design of building models. Therefore, the earthquake records for both directions were scaled down to a maximum peak ground acceleration of .
Table 5.
Elbistan earthquake properties.
4.3.1. Top-Story Displacement Time Histories
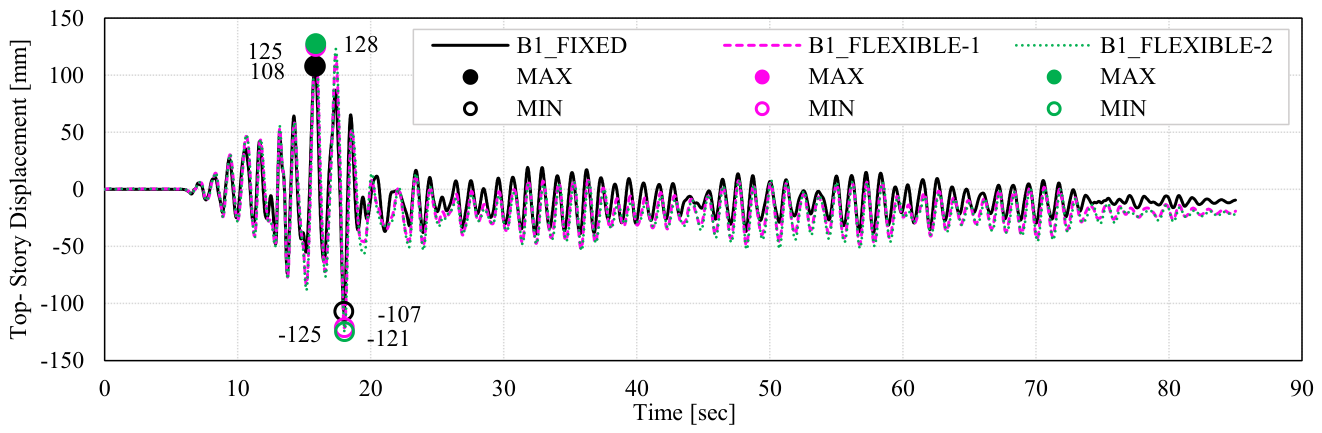
The top-story displacement time histories for Building 1 models are shown in Figure 22. The maximum and minimum values are also shown in the figure. The fixed-base model shows smaller displacement through the entire loading history as compared to the flexible-base counterparts. A permanent offset to the negative side is present for all models after reaching the maximum negative displacement. The shift is somewhat larger for the flexible-base models.
Figure 22.
Top-story displacement time histories for Building 1 models.
4.3.2. Displacement Shapes and Interstory Drifts
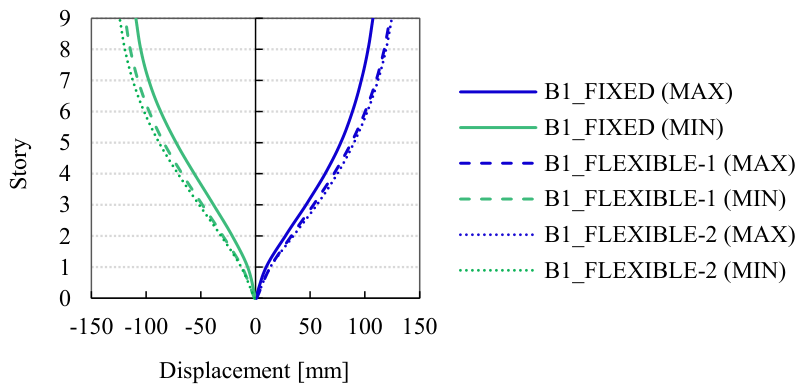
The displacement shapes shown in this section correspond to the extreme values taken from the displacement time-history, as indicated in Figure 22. The displacement shapes of Building 1 models are shown in Figure 23. From these curves, it can be seen that the flexible-base models exhibit larger lateral displacements not only at the top story, but also on the lower stories. No significant difference between the flexible-base models is observed.
Figure 23.
Displacement shapes of Building 1 models.
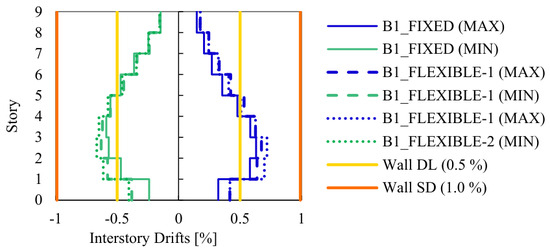
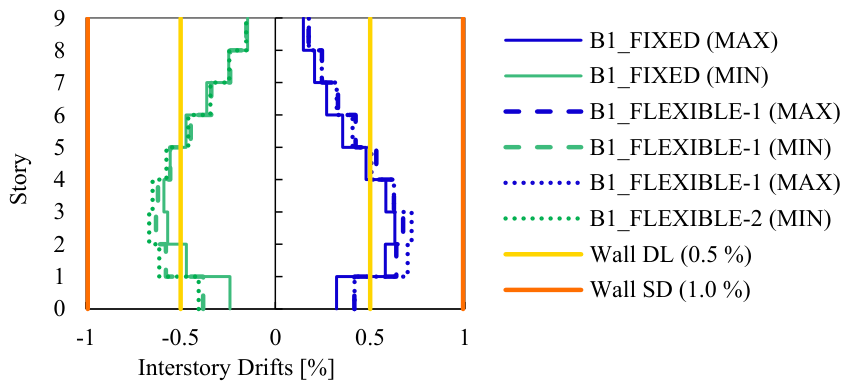
The interstory drift ratios shown in Figure 24 also correspond to the extreme displacement values of Figure 22. The interstory drift ratio thresholds corresponding to different damage states are also shown for comparison. A significant increase in interstory drifts can be observed when the SSI is considered. The increase is more pronounced in the lower stories and in the positive direction. This is normally expected since the maximal absolute values are obtained in the positive direction, and the slope of the displacement shape is flatter in the lower stories.
Figure 24.
Interstory drift ratios for Building 1 models.
The thresholds corresponding to the damage states for the walls are also shown in the figure. The Damage Limit state is exceeded, meaning that the walls have entered the Significant Damage limit state. The flexible-base walls also undergo base rotation, meaning they can both rotate and deform.
Recall from Table 3 that the 1% drift limit for the Significant Damage limit state of the walls corresponds to the Damage Limitation limit state of the frames. So, the frames have not yet reached the Damage Limitation limit state. Also, it is worth noting that the buildings were designed to sustain a maximum interstory drift of approximately 1%, corresponding to an earthquake with a probability of occurrence lower than that of the design-level earthquake.
4.3.3. Base Shear Time Histories
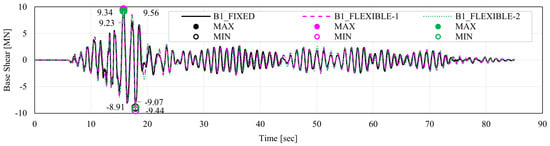
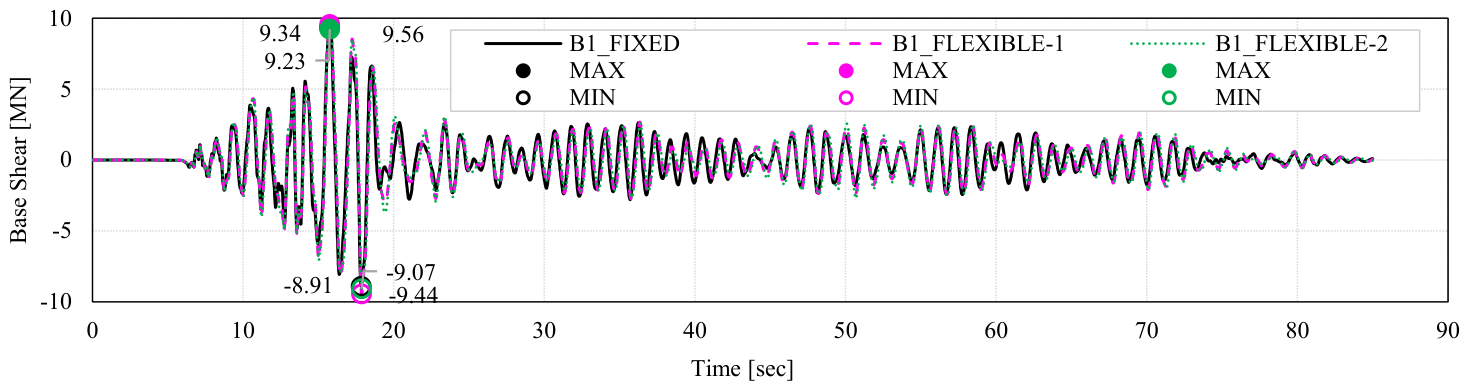
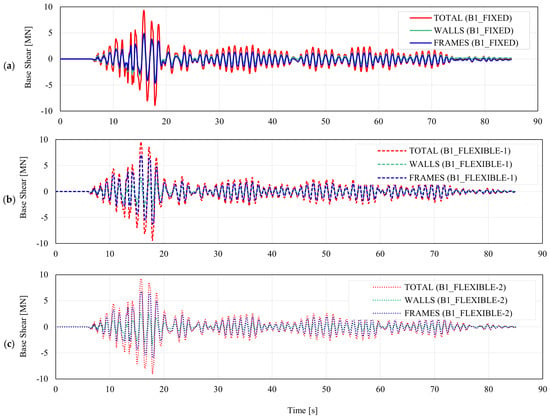
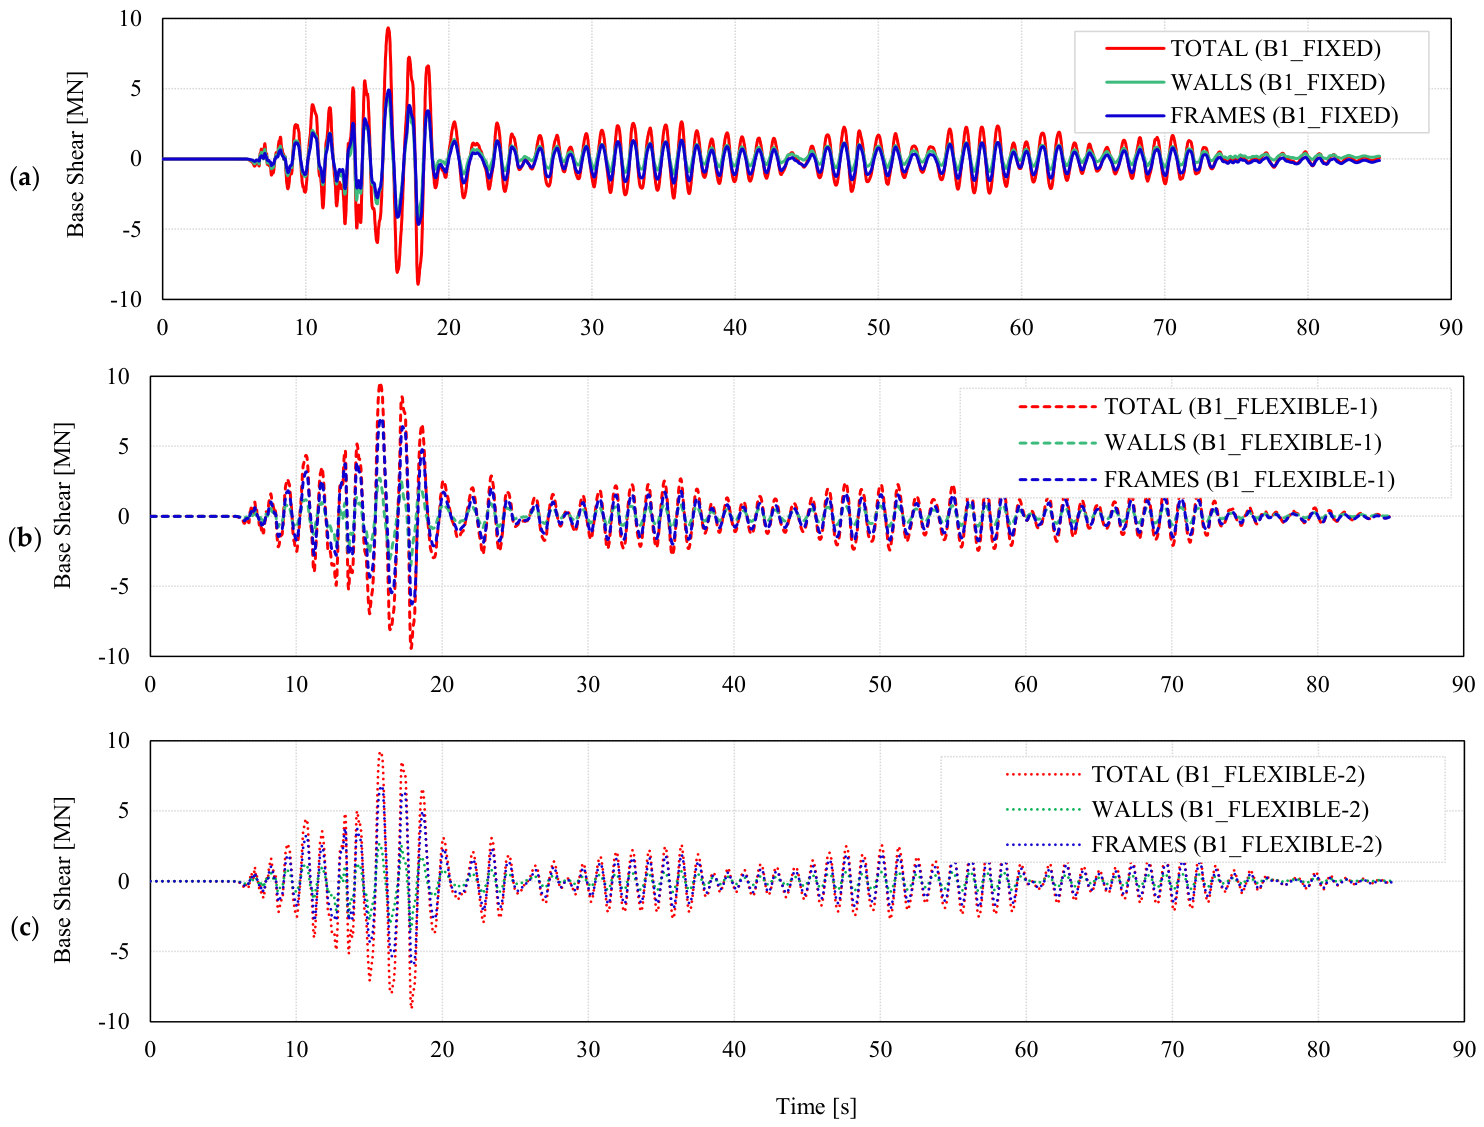
The overall base shear time histories of the considered models are compared in Figure 25, and the contributions of walls and frames within each model are analyzed in Figure 26. Consistent with the two previous analyses, the overall base shear is not significantly affected by SSI. On the other hand, the contributions of walls and frames strongly depend on the base flexibility. In the fixed-base model, the distribution of base shear among the walls and frames is nearly equal. However, when base flexibility is considered in the model, a portion of base shear is transferred from the walls to the frames. As the base shear is an important parameter in seismic design, its dependency on base flexibility indicates not only the importance of SSI in building behavior, but also its consequences in the design approach.
Figure 25.
Base shear time histories of Building 1 models.
Figure 26.
Base shear time histories and their distribution among the walls and frames for B1_FIXED (a), B1_FLEXIBLE-1 (b) and B1_FLEXIBLE-2 (c) models.
Since the loading intensity varies with time, the systems’ contributions are not constant. In order to compare the system contributions quantitatively, the average contributions for each system are calculated and expressed as percentages in Table 6. The dominance of frame systems is obvious when the base flexibility is introduced in the structural model.
Table 6.
Average contribution percentages of walls and frames for Building 1 models.
4.3.4. Rotation Time Histories and Hysteresis Loops of Structural Elements
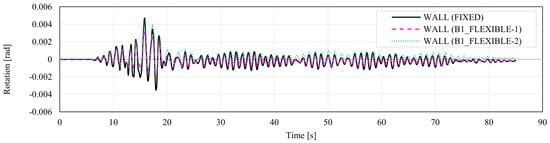
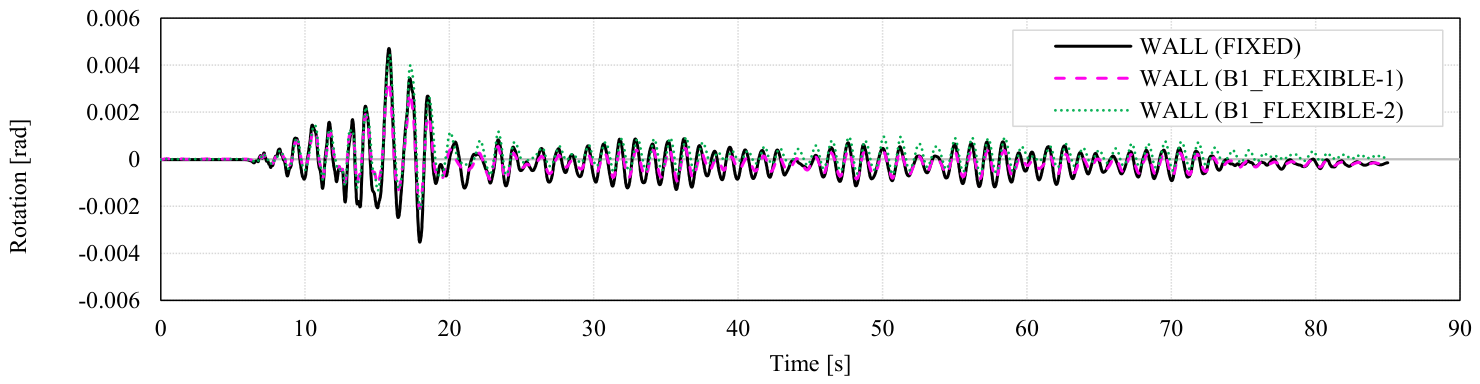
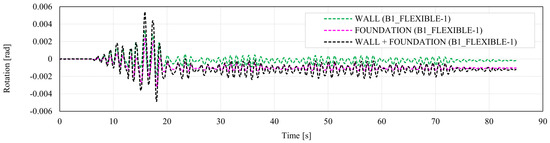
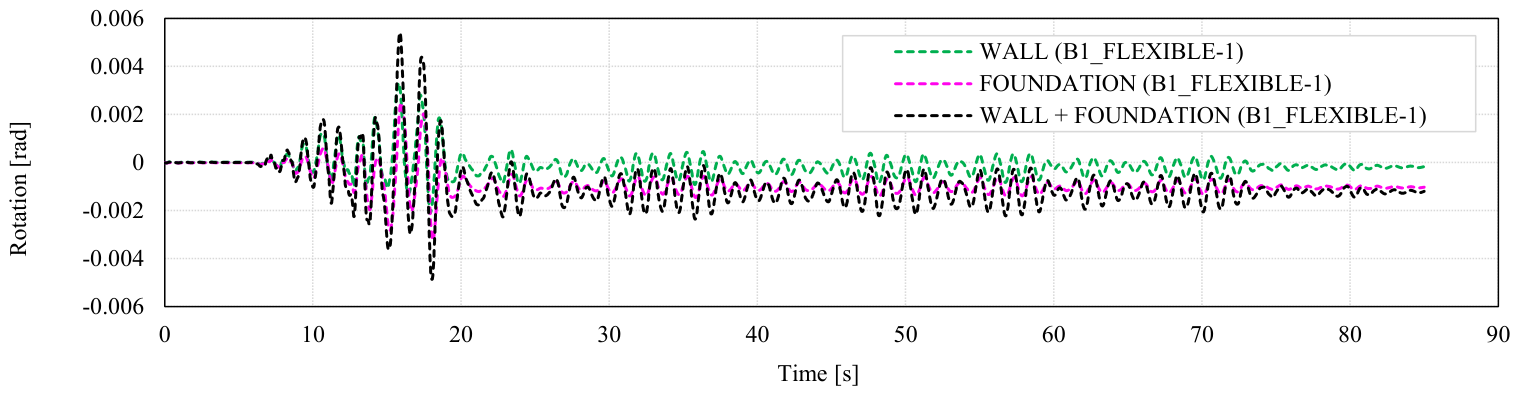
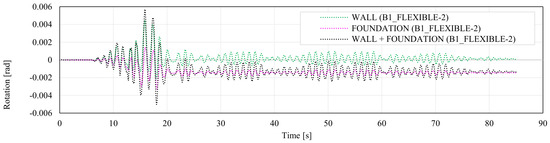
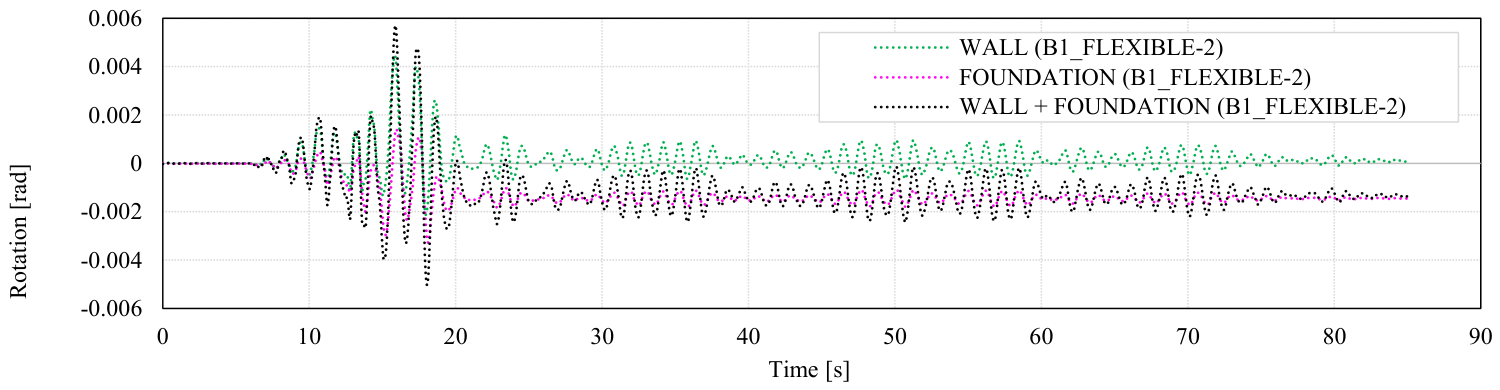
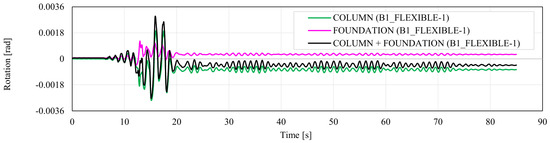
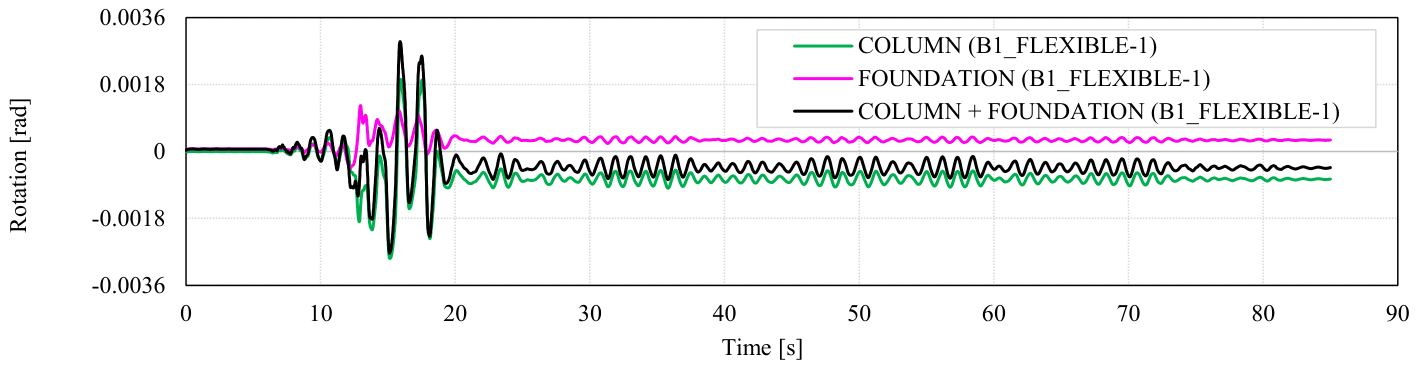
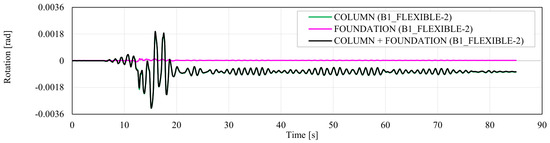
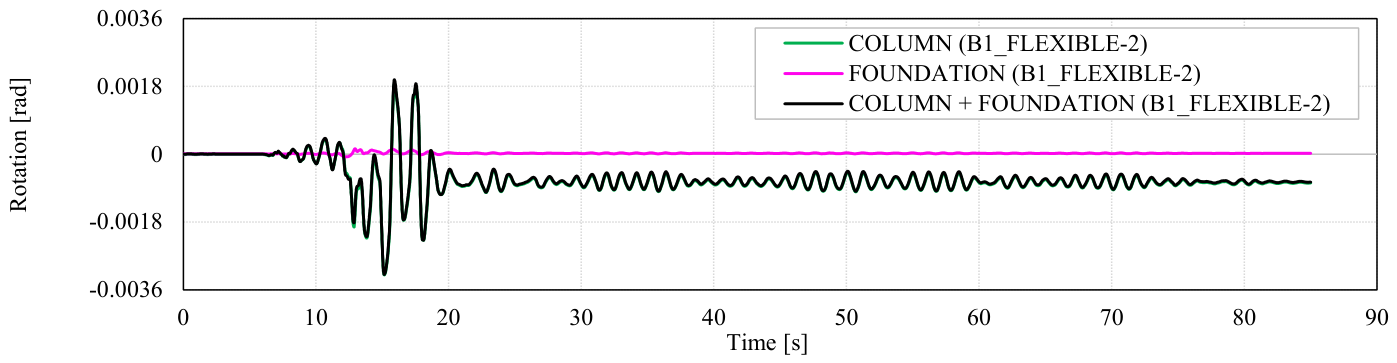
Figure 27 shows the rotation time histories for a section at the wall’s base. Generally, the wall’s behavior in each model is almost identical. However, if the foundation rotations are analyzed in the flexible-base models, a better understanding of the structural response is obtained. Thus, Figure 28 and Figure 29 show the rotation time histories of the walls and of their supporting foundations in the B1_FLEXIBLE-1 and B1_FLEXIBLE-2 models, respectively. The figures indicate that the walls undergo relatively small rotations. However, when the rotation of the foundations is considered, the overall deformation is considerably increased. In fact, a part of this deformation is a wall distortion, and the remaining part is a rigid-body rotation due to the rotation of the foundation. It is also indicated that while the wall vibrates around its initial equilibrium position, the foundation rotates around a new equilibrium position apparently shifted from the initial one.
Figure 27.
Rotation time-histories for a wall section (a-a) in Building 1 models.
Figure 28.
Rotation time-histories for the wall section (a-a) and its foundation in B1_FLEXIBLE-1 model.
Figure 29.
Rotation time-histories for the wall section (a-a) and its foundation in B1_FLEXIBLE-2 model.
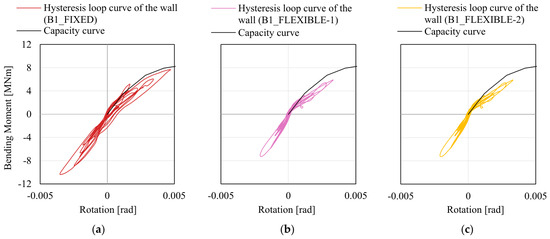
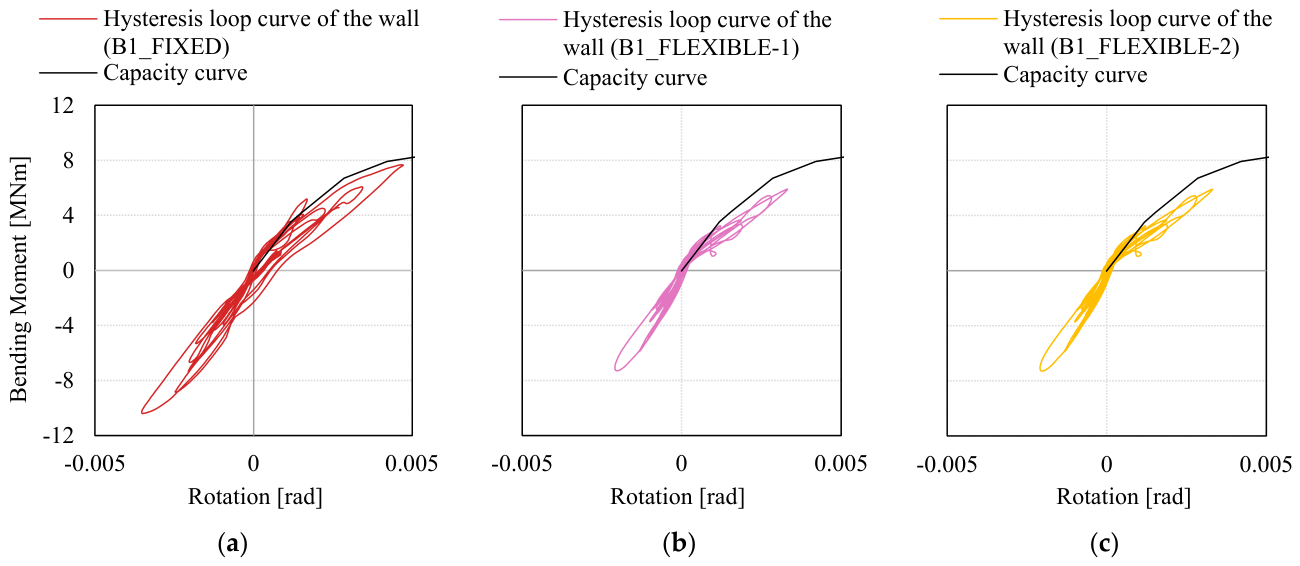
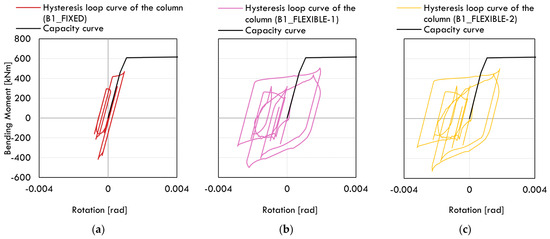
The hysteresis loops together with the capacity curve of the fixed-base wall from Figure 17 are shown in Figure 30. Although the wall in none of the models enters the deep nonlinear stage, the hysteresis loop of the fixed-base wall is both larger and wider, meaning that the fixed-base wall dissipates larger energy. The hysteresis loops of the flexible-base walls have similar shapes.
Figure 30.
Hysteresis loop curves versus capacity curves for section a-a at the wall in Building 1 models: (a) B1_FIXED, (b) B1_FLEXIBLE-1 and (c) B1_FLEXIBLE-2.
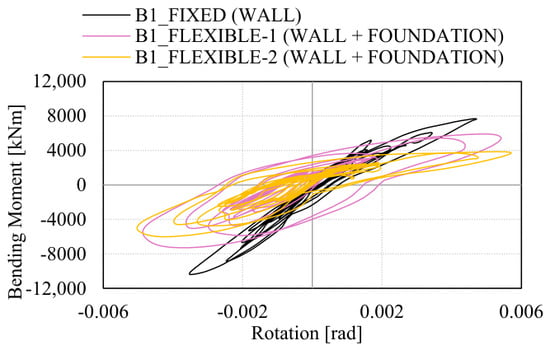
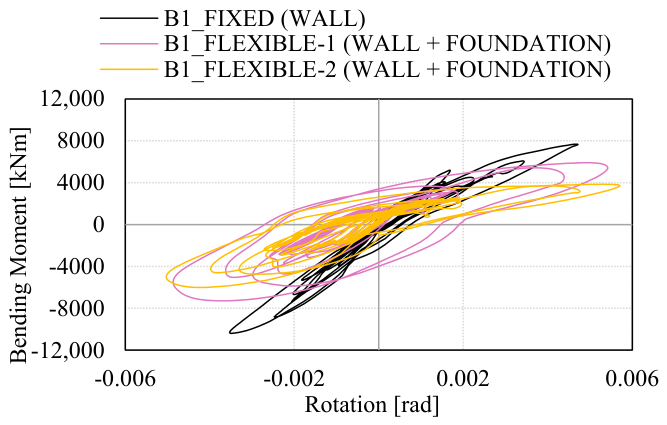
If the foundation rotation is included in analyzing the flexible-base walls, both the shape and size of the hysteresis loops will change. Figure 31 illustrates this change by plotting the three hysteresis loops in the same chart. Although the flexible-base walls alone have shown smaller energy dissipation than their fixed-base counterpart, when the foundation rotation is considered, their hysteresis loops are considerably increased. The quantitative energy dissipations of the walls are shown in Figure 32 as a cumulative strain energy absorbed during the loading history. Note that for the loading intensity considered, the strain energy dissipated by the wall in the B1_FLEXIBLE-1 model is the largest, while the strain energy dissipated by the wall in the B1_FIXED model is the smallest. During the dynamic loading analysis, the imposed loading intensity in the structure is not large enough to force the structure into a deep nonlinearity, as was achieved in the pushover analysis. Because of that, the cumulative strain energy for the fixed base case relative to the flexible base cases is much smaller in Figure 32 compared to those given in Figure 16.
Figure 31.
Hysteresis loop curves for section a-a at the wall in Building 1 models.
Figure 32.
The dissipated energy of the wall (+ foundation) for nonlinear dynamic loading of Building 1 models.
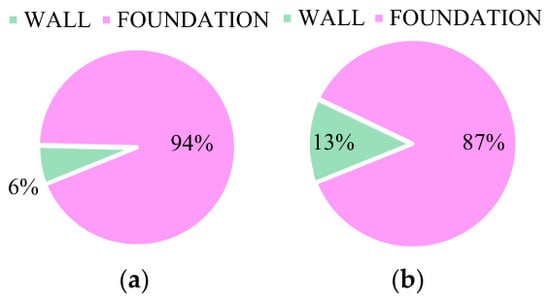
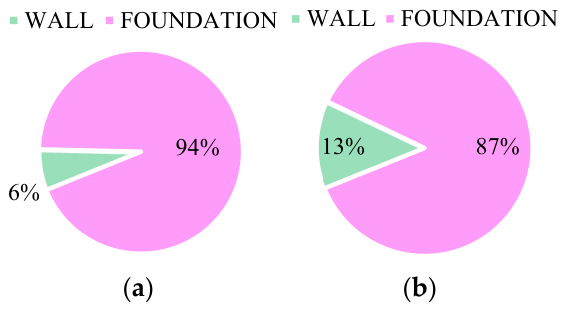
The pie charts of Figure 33 compare the contributions of walls and of their foundation on energy dissipation. Since the B1_FLEXIBLE-2 model is designed with a flexible base, the reinforcement demand of the wall decreases, thus increasing the wall deformability. As a result, the wall in this model dissipates more energy as compared to the one in the B1_FLEXIBLE-1 model.
Figure 33.
Distribution of strain energy between the wall and the foundation in: (a) B1_FLEXIBLE-1 model and (b) B1_FLEXIBLE-2 model.
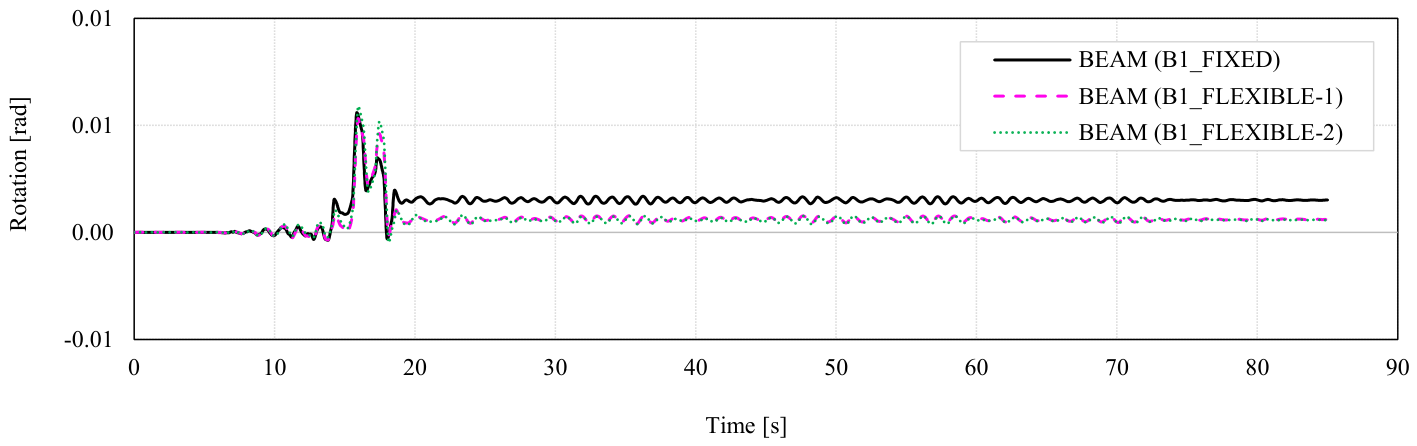
Figure 34 gives the rotation time histories of a beam section. With the exception of a few small differences in rotation time histories, the beam response in all three models is very similar. This means that the beam behavior is not largely affected by the building’s base flexibility.
Figure 34.
Rotation time-histories for a beam section (b-b) in Building 1 models.
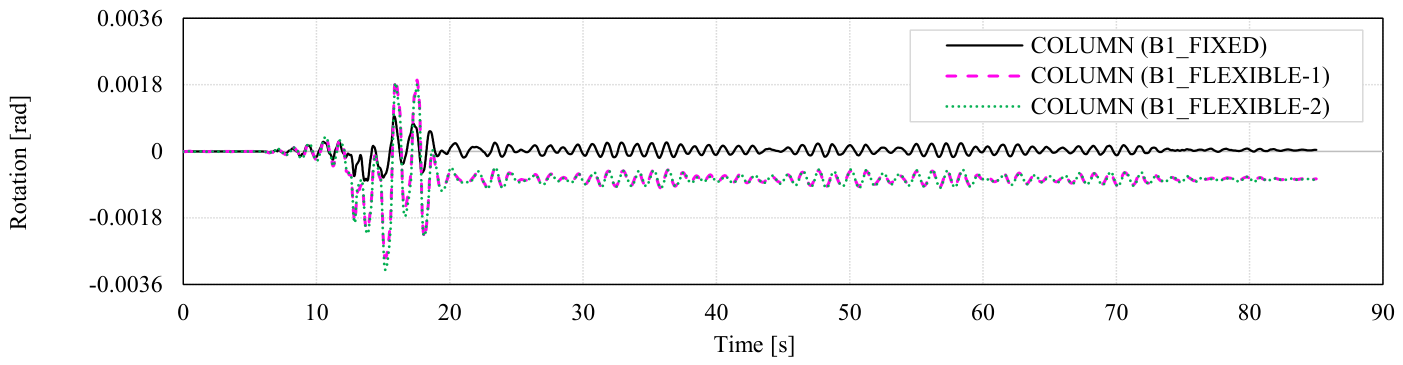
Rotation time histories at the wall’s base for three models of the considered building are shown in Figure 35, where it is indicated that the flexible-base columns undergo much higher rotations compared to the fixed-base counterparts. Figure 36 and Figure 37 show the wall rotation together with the foundation rotation for the flexible-base models of the considered building. As the pushover analysis has indicated, the larger portion of the rotation is concentrated in the column, while the foundation’s rotation is negligible. In addition, in the B1_FLEXIBLE-1 model, the foundation rotation opposes that of the column. This behavior is expected considering the fact that the foundation has a much higher stiffness than the column and that the foundation is connected to foundation beams. Figure 38, one more time, shows that the columns’ rotations are higher in the flexible-base models. In fact, not only the rotations, but also the dissipated energies are higher in the flexible-base models.
Figure 35.
Rotation time-histories for a column section (c-c) in Building 1 models.
Figure 36.
Rotation time-histories for the column section (c-c) and its foundation in B1_FLEXIBLE-1 model.
Figure 37.
Rotation time-histories for the column section (c-c) and its foundation in B1_FLEXIBLE-2 model.
Figure 38.
Hysteresis loop curves versus capacity curves for section c-c at the column in Building 1 models: (a) B1_FIXED, (b) B1_FLEXIBLE-1 and (c) B1_FLEXIBLE-2.
4.4. The Role of SSI in Shifting the Structural System
The observed variation in structural system classification across elastic, pushover, and nonlinear analyses highlights an important aspect of the interpretation of SSI effects within a code-based framework.
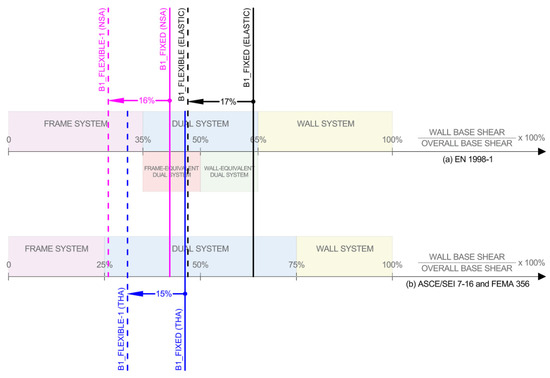
The elastic, pushover, and nonlinear analyses consistently showed a redistribution of base shear from the walls toward the frames as the foundation condition changed from fixed to flexible. Figure 39 summarizes the resulting system classifications and illustrates that this redistribution may shift the structure across the classification thresholds defined by EN 1998-1. It is important to emphasize that this change in classification does not reflect an abrupt modification of the underlying load-resisting mechanism. The structural response evolves continuously as a consequence of foundation flexibility and rocking effects. The apparent “shift” arises because this continuous variation in force distribution is evaluated against discrete classification thresholds defined in EN 1998-1. Accordingly, the principal finding is not a fundamental transformation of the structural system induced by SSI, but rather the sensitivity of Eurocode 8 system classification to SSI-induced changes in wall and frame force contributions.
Figure 39.
The system classification of analyzed models.
This interpretation is further supported by the fact that, according to ASCE/SEI 7-16, all analyzed models remain classified as dual systems regardless of analysis type or base fixity. The narrower classification ranges and additional subdivisions adopted in EN 1998-1 make the classification more sensitive to variations in relative wall and frame contributions. Nevertheless, the consistency of the observed redistribution across all analysis types confirms that the underlying SSI effect is physical, while the classification shift is a consequence of the code-based interpretation of that response.
Finally, it is important to highlight that this work is limited to numerical analysis based on a single case-study RC dual wall-frame building structure. To generalize the findings, a broader range of structural systems should be investigated. Also, nonlinear dynamic analysis in this study was used for comparative purposes. For structural assessment, more earthquake records with different frequency contents should be considered so that record-to-record variability can be properly captured. This would allow a more reliable evaluation of the structural response under diverse seismic characteristics, including variations in duration, spectral shape, pulse effects, and intensity measures. In addition, the numerical results should be validated through experimental testing, such as shake-table tests, centrifuge tests, or monitored responses from real structures. Therefore, the conclusions derived from this study mainly depend on uplift behavior as well as rocking response and rotational flexibility of the foundations.
While the results provide consistent insights across elastic, pushover, and nonlinear dynamic analyses, the findings are not intended to represent all possible structural configurations. Instead, they establish a reference case that highlights the sensitivity of system classification to SSI effects. Future studies may extend this work by considering a broader range of structural typologies, soil conditions, and ground motion records to further generalize the observed trends.
5. Conclusions and Recommendations
This study examined the implications of incorporating Soil–Structure Interaction (SSI) in the seismic analysis and design of a reinforced concrete dual wall–frame building according to Eurocode 8, with additional comparison to ASCE/SEI 7-16. A nine-story prototype structure was analyzed under fixed-base and flexible-base assumptions, using linear-elastic, nonlinear static, and nonlinear dynamic methods. The main conclusions are as follows:
- A significant decrease in strength and stiffness is noticed when the SSI is considered in structural analysis. No significant drop in capacity could be noticed between the building analyzed as flexible at its base and the building both analyzed and designed as flexible at its base.
- As expected, when the base of the dual wall-frame building is changed from fixed to flexible, a portion of base shear is transferred from the walls to the frames. This transition of forces from the walls to the frames may change the system classification from a dual system to a frame system.
- In the considered dual wall–frame system, the introduction of base flexibility resulted in a redistribution of base shear from the walls toward the frames. This redistribution was sufficiently pronounced to influence the force-based classification of the system within the framework of the performed Eurocode 8-based assessment.
- Even though the performance assessment of the building has shown that its global response was not largely affected by the inclusion of Soil-Structure Interaction in structural analysis, the detailed analysis of some of the characteristic locations indicated a considerable discrepancy compared to the fixed-base assumption.
- Incorporation of SSI led to an increase in internal forces in the columns, which exceeded their resistance capacity. Unless columns are designed with considerable overstrength, the interaction of the structure with the underlying soil will likely cause damage to them.
- The inclusion of SSI increased the calculated internal forces in the columns, in some cases approaching or exceeding their design resistance. This indicates that, under the adopted modelling assumptions, column demand is sensitive to soil–structure interaction effects.
- Although the average contributions of walls and frames from nonlinear analyses differ significantly from those obtained from elastic analysis (and, in the case of nonlinear dynamic analysis, also depend on the selected ground motion record), the observed shift under SSI consideration is consistent with the shift indicated by elastic analysis.
- The average contributions of walls and frames obtained from nonlinear analyses differed from those derived from elastic analysis, while in nonlinear dynamic cases they also depended on the selected ground motion record. Nevertheless, the observed trend of force redistribution under SSI remained consistent with that indicated by elastic analysis.
- Normally, the shift of the structural system towards the frame system implies that the structure will be designed with a larger behavior factor. A larger behavior factor suggests that the structure will be subjected to smaller forces, but it should be able to undergo larger deformations—a typical behavior of flexible-base buildings.
- As long as the design rules of Eurocode 8 are followed, the structure will be able to achieve the intended performance, regardless of whether it is designed as fixed-base or flexible-base. This conclusion is related to the buildings for which the consideration of SSI is not mandatory according to Eurocode 8.
- For the studied configuration and within the applicability limits of Eurocode 8, where SSI is not explicitly required, the code-based design approach resulted in satisfactory performance under the considered seismic action, irrespective of whether base flexibility was explicitly included.
- Since the walls have strength and stiffness comparable to their footings and soil beneath them, they undergo large rigid-body rotations and small bending. As such, their damage is delayed or even prevented. Instead, permanent deformations occur in the foundation and the underlying soil, while the foundation beams undergo significant damage.
- In the analyzed configuration, the walls exhibited stiffness and strength comparable to those of the supporting foundation system. This resulted in pronounced rigid-body rotation and limited bending deformation, which reduced damage in the walls, while permanent deformations concentrated in the foundation system and foundation beams.
- The utilization ratio of the walls is higher when Soil-Structure Interaction is accounted for during both the analysis and the design of the building. In other words, the flexible-base wall with less reinforcement content is more likely to yield and, therefore, prevents its rigid-body rotation.
- Since the combined effect of soil, foundation beams, and footing beneath the column produces a strength much higher than that of the column itself, a small-to-negligible (and sometimes opposite) rotation occurs in the footing. As a result, the entire deformation is concentrated in the column base. In addition, the transfer of the forces from the walls to the frames makes the situation worse for the columns. The nonlinear analyses have shown that the flexible-base columns dissipate more energy compared to their fixed-base counterparts. Most of this added energy in the flexible-base columns comes from the redistribution of forces, rather than from any slight increase in the reinforcement content (the minimal reinforcement requirement governed the design of the columns).
- The SSI has a negligible effect on the beams of the dual wall-frame structural system. The three types of analyses have shown almost identical behavior of the beam, regardless of the SSI consideration.
- For the considered earthquake record, almost linear behavior was observed in the walls of all models. As a result, the larger dissipated energy was noticed from the common work of the flexible-base walls and of their footings.
- For the selected ground motion record, wall response remained largely elastic in all models. Consequently, energy dissipation in the flexible-base case was mainly associated with the combined response of the walls and their supporting foundation system rather than inelastic wall behavior.
Because this study was based on a single hypothetical building structure, the above-listed conclusions cannot be directly generalized. Instead, the following topics are recommended for future work:
- When the base of the building with mixed-type system—such as dual wall-frame system—is changed from fixed to flexible, the redistribution of forces occurs. A portion of base shear is transferred to the more flexible system of the mixed-type system. As a result, other mixed-type systems, such as wall systems, coupled-wall systems, braced-frame systems, etc., may also be subject to a redistribution of forces and a change of the structural system.
- Although the results of nonlinear time-history analysis show a good agreement with other types of analysis, they are unique to a specific ground motion record (Elbistan earthquake) and do not represent general time-history response. Including other ground motion records may reveal variability in the results.
- It is recommended that the implementation of the Eurocode 8 provisions for SSI in the analysis and design of building structures with dual wall-frame systems be preceded by a clarification of whether the structural system classification considers the SSI. However, since considering SSI in the analysis tends to shift the system classification towards a frame system, it is advisable, when defining the structural system, to lean toward the more flexible system consisting of the mixed-type system. Evaluating the cracked section for each member type is also important, as the SSI may influence the depth of cracking differently in various systems. These considerations should be addressed before evaluating the appropriate behavior factor. The findings indicate that neglecting SSI may lead not only to inaccurate response estimation but also to an inconsistent classification of structural systems within Eurocode-based design procedures.
Author Contributions
Conceptualization, B.A. and J.B.; Methodology, B.A. and J.B.; Software, B.A.; Validation, B.A., J.B. and L.M.S.; Investigation, J.B. and L.M.S.; Writing—original draft, B.A.; Writing—review & editing, B.A., J.B. and L.M.S.; Supervision, J.B. and L.M.S.; Project administration, J.B. All authors have read and agreed to the published version of the manuscript.
Funding
The authors declare that no funds, grants, or other support were received during the preparation of this manuscript.
Institutional Review Board Statement
Not applicable.
Informed Consent Statement
Not applicable.
Data Availability Statement
The raw data supporting the conclusions of this article will be made available by the authors on request.
Conflicts of Interest
The authors have no relevant financial or non-financial interests to disclose.
References
- Reséndiz, D.; Roesset, J.M. Soil-structure interaction in Mexico City during the 1985 earthquakes. In The Mexico Earthquakes—1985: Factors Involved and Lessons Learned; ASCE: Reston, VA, USA, 1985; pp. 193–203. [Google Scholar]
- Gazetas, G.; Anastasopoulos, I.; Gerolymos, N.; Mylonakis, G.; Syngros, K. The Collapse of the Hanshin Expressway (Fukae) Bridge, Kobe 1995: Soil-Foundation-Structure Interaction, Reconstruction, Seismic Isolation. In Entwicklungen in der Bodenmechanik, Bodendynamik und Geotechnik; Springer: Berlin/Heidelberg, Germany, 2006; pp. 93–120. [Google Scholar] [CrossRef] [Scilit] [PubMed]
- Çelebi, M. Turkish Earthquakes: Two reports. Lessons from the Adana-Ceyhan quake and the Dinar aftershocks. EERI Newsl. 1998, 32, 8. [Google Scholar]
- Goto, H.; Kaneko, Y.; Naguit, M.; Young, J. Records of Extreme Ground Accelerations during the 2011 Christchurch Earthquake Sequence Contaminated by a Nonlinear, Soil–Structure Interaction. Bull. Seismol. Soc. Am. 2021, 111, 704–722. [Google Scholar] [CrossRef] [Scilit]
- Akar, F.; Işık, E.; Büyüksaraç, A.; Arkan, E.; İzol, R. Geotechnical and Structural Damages Caused by the 2023 Kahramanmaraş Earthquakes in Gölbaşı (Adıyaman). Appl. Sci. 2024, 14, 2165. [Google Scholar] [CrossRef] [Scilit]
- Avğın, S.; Köse, M.; Özbek, A. Damage assessment of structural and geotechnical damages in Kahramanmaraş during the February 6, 2023 earthquakes. Eng. Sci. Technol. Int. J. 2024, 57, 101811. [Google Scholar] [CrossRef] [Scilit]
- Binici, B.; Yakut, A.; Kadas, K.; Demirel, O.; Akpinar, U.; Canbolat, A.; Yurtseven, F.; Oztaskin, O.; Aktas, S.; Canbay, E. Performance of RC buildings after Kahramanmaraş earthquakes: Lessons toward performance based design. Earthq. Eng. Eng. Vib. 2023, 22, 883–894. [Google Scholar] [CrossRef] [Scilit]
- Hutchinson, T.C.; Raychowdhury, P.; Chang, B. Nonlinear structure and foundation response during seismic loading: Dual lateral load resisting systems. In Proceedings of the 8th US National Conference on Earthquake Engineering, San Francisco, CA, USA, 18–22 April 2006. [Google Scholar]
- Sandro, C.; Dezi, F.; Leoni, G. Linear soil-structure interaction of coupled wall-frame structures on pile foundations. Soil Dyn. Earthq. Eng. 2011, 9, 1296–1309. [Google Scholar] [CrossRef] [Scilit]
- Marzban, S.; Banazadeh, M.; Azarbakht, A. Seismic performance of reinforced concrete shear wall frames considering soil-foundation-structure interaction. Struct. Des. Tall Spec. Build. 2014, 23, 302–318. [Google Scholar] [CrossRef] [Scilit]
- Carbonari, S.; Dezi, F.; Leoni, G. Nonlinear seismic behaviour of wall-frame dual systems accounting for soil-structure interaction. Earthq. Eng. Struct. Dyn. 2012, 41, 1651–1672. [Google Scholar] [CrossRef] [Scilit]
- Emami, A.; Halabian, A.M. Seismic response assessment of reinforced concrete structures based on displacement, force and energy criteria, considering soil-structure interaction. Aust. J. Struct. Eng. 2020, 21, 64–93. [Google Scholar] [CrossRef] [Scilit]
- Katrangi, M.; Memarpour, M.M.; Yakhchalian, M. Assesment of the Seismic Performance and the Base Shear Contribution Ratios of the RC Wall-frame Dual System Considering Soil-Structure Interaction. J. Earthq. Eng. 2022, 26, 5290–5317. [Google Scholar] [CrossRef] [Scilit]
- Bapir, B.; Abrahamczyk, L.; Wichtmann, T.; Sarmiento, L. Soil-structure interaction: A state-of-the-art review of modelling techniques and studies on seismic response of building structures. Front. Built Environ. 2023, 9, 1120351. [Google Scholar] [CrossRef] [Scilit]
- ASCE/SEI 7-16; Minimum Design Loads and Associated Criteria for Buildings and Other Structures. Structural Engineering Institute of American Society of Civil Engineers: Reston, VA, USA, 2017.
- Applied Technology Council. Seismic Evaluation and Retrofit of Concrete Buildings; Applied Technology Council: Redwood City, CA, USA, 1996. [Google Scholar]
- FEMA 356; Prestandard and Commentary for the Seismic Rehabilitation of Buildings. Federal Emergency Management Agency: Washington, DC, USA, 2000.
- Gcr, N. Soil-Structure Interaction for Building Structures; Gaithersburg: GCR, 12-917-21, Prepared by NEHRP Consultants Joint Venture, A Partnership of the Applied Technology Council and the Consortium of Universities for Research in Earthquake Engineering; National Institute of Standards and Technology: Gaithersburg, MD, USA, 2012.
- FEMA P-2091; A Practical Guide to Soil-Structure Interaction. Applied Technology Council: Redwood, CA, USA, 2020.
- EN 1998-1; Eurocode 8: Design of Structures for Earthquake Resistance—Part 1: General Rules, Seismic Actions and Rules for Buildings. British Standard Institution: London, UK, 2004.
- Bojadjieva, J.; Bogdanovic, A.; Edip, K.; Sheshov, V.; Rakicevic, Z.; Farsangi, E.N.; Ivanovski, D.; Shoklarovski, A.; Gjorgjeska, I.; Kitanovski, T.; et al. Seismic site investigation and structural amplification based on geotechnical and structural health monitoring. In Data-Centric Structural Health Monitoring: Mechanical, Aerospace and Complex Infrastructure Systems; De Gruyter: Berlin, Germany, 2023; pp. 1–27. [Google Scholar]
- Pais, A.; Kausel, E. Approximate formulas for dynamic stiffnesses of rigid foundations. Soil Dyn. Earthq. Eng. 1988, 7, 213–227. [Google Scholar] [CrossRef] [Scilit]
- ASCE/SEI 41-17; Seismic Evaluation and Retrofit of Existing Buildings. American Society of Civil Engineers: Reston, VA, USA, 2017.
- FEMA P-2139-3; Short-Period Building Collapse Performance and Recommendations for Improving Seismic Design, Volume 3—Study of One-to-Four Story Special Reinforced Masonry Shear Wall Buildings. Federal Emergency Management Agency (FEMA): Washington, DC, USA, 2020.
- EN 1992-1-1; Eurocode 2: Design of Concrete Structures—Part 1-1: General Rules and Rules for Buildings. British Standard Institution: London, UK, 2004.
- Autodesk, Inc. Robot Structural Analysis Professional. 2024. Available online: https://www.autodesk.com (accessed on 17 November 2024).
- Computers and Structures, Inc. Computers and Structures; SAP2000 v21; Computers and Structures, Inc.: Berkeley, CA, USA, 2019; Available online: https://www.csiamerica.com (accessed on 1 May 2025).
- EN 1998-3; Design of Structures for Earthquake Resistance—Part 3: Assessment and Retrofitting of Buildings. British Standard Institution: London, UK, 2005.
- Fajfar, P.; Fischinger, M. N2—A method for nonlinear seismic analysis of regular buildings. In Proceedings of the Ninth World Conference on Earthquake Engineering, Kyoto, Japan, 2–9 August 1988; Volume V, pp. V-111–V-116. [Google Scholar]
- Gurbuz, T.; Cengiz, A. Structural damages during the February 06, 2023 Kahramanmaraş Earthquakes in Turkey. Soil Dyn. Earthq. Eng. 2025, 191, 109214. [Google Scholar] [CrossRef] [Scilit]
- Yuzbasi, J. Post-Earthquake Damage assessment: Field observations and recent developments with recommendations from the Kahramanmaraş earthquakes in Türkiye on February 6th, 2023 (Pazarcık M7.8 and Elbistan M7.6). J. Earthq. Eng. 2024, 29, 3367–3392. [Google Scholar] [CrossRef] [Scilit]
- Celik, O.C.; Ulker, M.B.C.; Gocer, C.; Guntepe, S.; Koz, O.; Eyupgiller, M.M.; Aksu, M.; Yaz, A. Multidisciplinary reconnaissance investigation covering structural, geotechnical, and architectural based damage to mid-rise residential buildings following the February 6th, 2023 Kahramanmaraş, Türkiye earthquake doublets (mw 7.8, mw 7.6). Soil Dyn. Earthq. Eng. 2024, 182, 108738. [Google Scholar] [CrossRef] [Scilit]

Disclaimer/Publisher’s Note: The statements, opinions and data contained in all publications are solely those of the individual author(s) and contributor(s) and not of MDPI and/or the editor(s). MDPI and/or the editor(s) disclaim responsibility for any injury to people or property resulting from any ideas, methods, instructions or products referred to in the content. |
© 2026 by the authors. Licensee MDPI, Basel, Switzerland. This article is an open access article distributed under the terms and conditions of the Creative Commons Attribution (CC BY) license.