


Abstract
Rapid landslide susceptibility screening is important for linear engineering projects because long corridors, numerous slope units, limited data, and tight schedules often restrict the use of data-intensive models. This study develops an engineering-oriented reduced-factor screening framework based on the Information Value (IV) model and applies the framework to the Beijing-Zhangjiakou Railway corridor. A conventional 10-factor IV model was first established as the reference model. Reduced-factor models were then screened under the same study area, the same landslide inventory, the same modelling workflow, and the same factor classification scheme. The 10-factor model reached an accuracy of 94.87%. Two reduced five-factor models reached the same accuracy: Slope + Aspect + Elevation + Lithology and Engineering Rock + NDVI, and Slope + Aspect + Elevation + Lithology and Engineering Rock + Distance to Rivers. The comparison shows that the full-factor model can be simplified without loss of validation accuracy when a stable terrain–geological framework is retained and a suitable external factor is added. Because the available inventory contains only 45 landslides and does not distinguish failure mechanisms consistently, the proposed model should be regarded as a preliminary probabilistic screening tool rather than a mechanism-specific prediction model. The proposed framework provides a practical approach for corridor-scale hazard screening under incomplete data conditions.
1. Introduction
Landslides pose a persistent threat to the safety and serviceability of linear engineering projects such as railways and highways, particularly in mountainous and tectonically active regions. Along corridor-type infrastructure, slope failures are usually spatially discontinuous, yet their impacts can propagate rapidly along the alignment, resulting in traffic interruption, structural damage, and increased maintenance costs. For this reason, landslide susceptibility assessment is not only a scientific problem in geomorphology and engineering geology, but also a practical tool for identifying hazardous slope sections and supporting early stage engineering decision-making [1].
Landslide susceptibility mapping has been widely applied in road and railway environments using statistical, heuristic, and machine-learning approaches [1,2,3,4]. In recent years, hybrid machine-learning frameworks [5,6], interpretable neural-network methods [7], and multi-criteria decision-analysis approaches [8] have demonstrated strong predictive capability. However, many of these approaches require relatively large training samples, a wide range of conditioning factors, and parameter tuning that is not always practical for corridor-scale engineering screening. For long linear corridors and newly planned projects, the immediate engineering problem is often not to maximize algorithmic complexity, but to obtain a stable first-round hazard appraisal from incomplete but readily accessible datasets.
Under such conditions, the Information Value (IV) model remains attractive because it is transparent, data-efficient, and easy to implement within GIS-based engineering workflows [3,9,10]. In this study, transparent indicates that the contribution of each factor class can be traced directly through explicit IV values, whereas bivariate indicates that each conditioning factor is evaluated against landslide occurrence separately rather than estimated jointly in a multivariate parameter space. Such characteristics make the method suitable for preliminary probabilistic screening when data are limited and interpretability is required. At the same time, the IV model cannot replace multivariate statistical models or machine-learning models, because the IV framework does not explicitly resolve factor interdependence, multicollinearity, or higher-order interactions. Results from the IV model should therefore be interpreted as relative susceptibility rather than deterministic prediction [10,11,12].
Recent research increasingly highlights that the practical value of susceptibility models lies not only in predictive performance, but also in robustness, transferability, and engineering operability [13,14,15]. In real railway and highway projects, bivariate approaches such as IV or frequency-ratio methods have been successfully used for rapid corridor-scale screening because they provide interpretable class-based results with modest data requirements [1,16]. For example, Zhang et al. applied the IV model to the new Jing-Zhang high-speed railway in China [17]; Singh et al. used the FR method along the Udhampur-Ramban section of NH-44 in India [3]; and Adhikari and Dhakal applied the IV method to cut slopes along the Dumre-Paudhi Bazar road section in western Nepal [2]. Together, these studies show that bivariate methods can provide an operationally practical basis for preliminary hazard appraisal in real linear-infrastructure settings. Nevertheless, the reliability of any such model still depends strongly on inventory quality, sample size, terrain representation, and the appropriateness of the selected factor set [10,11,12,18,19,20]. These issues are especially important here because the available inventory contains only 45 landslides and is not consistently subdivided by failure mechanism.
Against this background, this study develops a reduced-factor landslide susceptibility screening approach based on the IV model and applies it to the Beijing–Zhangjiakou Railway corridor. A conventional 10-factor IV model was first reproduced as the reference model, and reduced-factor models were then screened under the same study area, the same landslide inventory, the same modelling framework, and comparable factor classification conditions. The study specifically aims to: (1) establish and validate the 10-factor reference model; (2) evaluate whether reduced-factor models can achieve comparable validation accuracy; (3) identify the most effective supplementary external factors once a minimum terrain–geological core has been fixed; and (4) clarify the engineering applicability and limitations of reduced-factor IV screening under incomplete data, a small inventory, and a mechanism-undifferentiated landslide dataset.
2. Study Area
2.1. Location, Terrain, and Rainfall
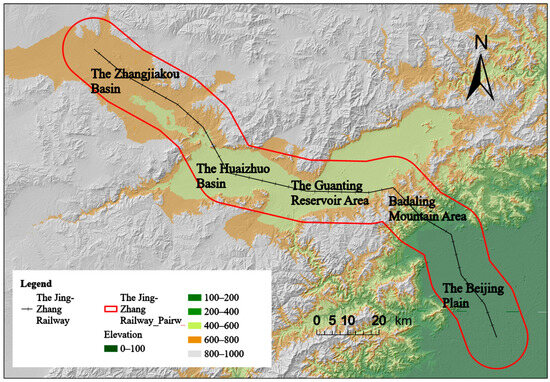
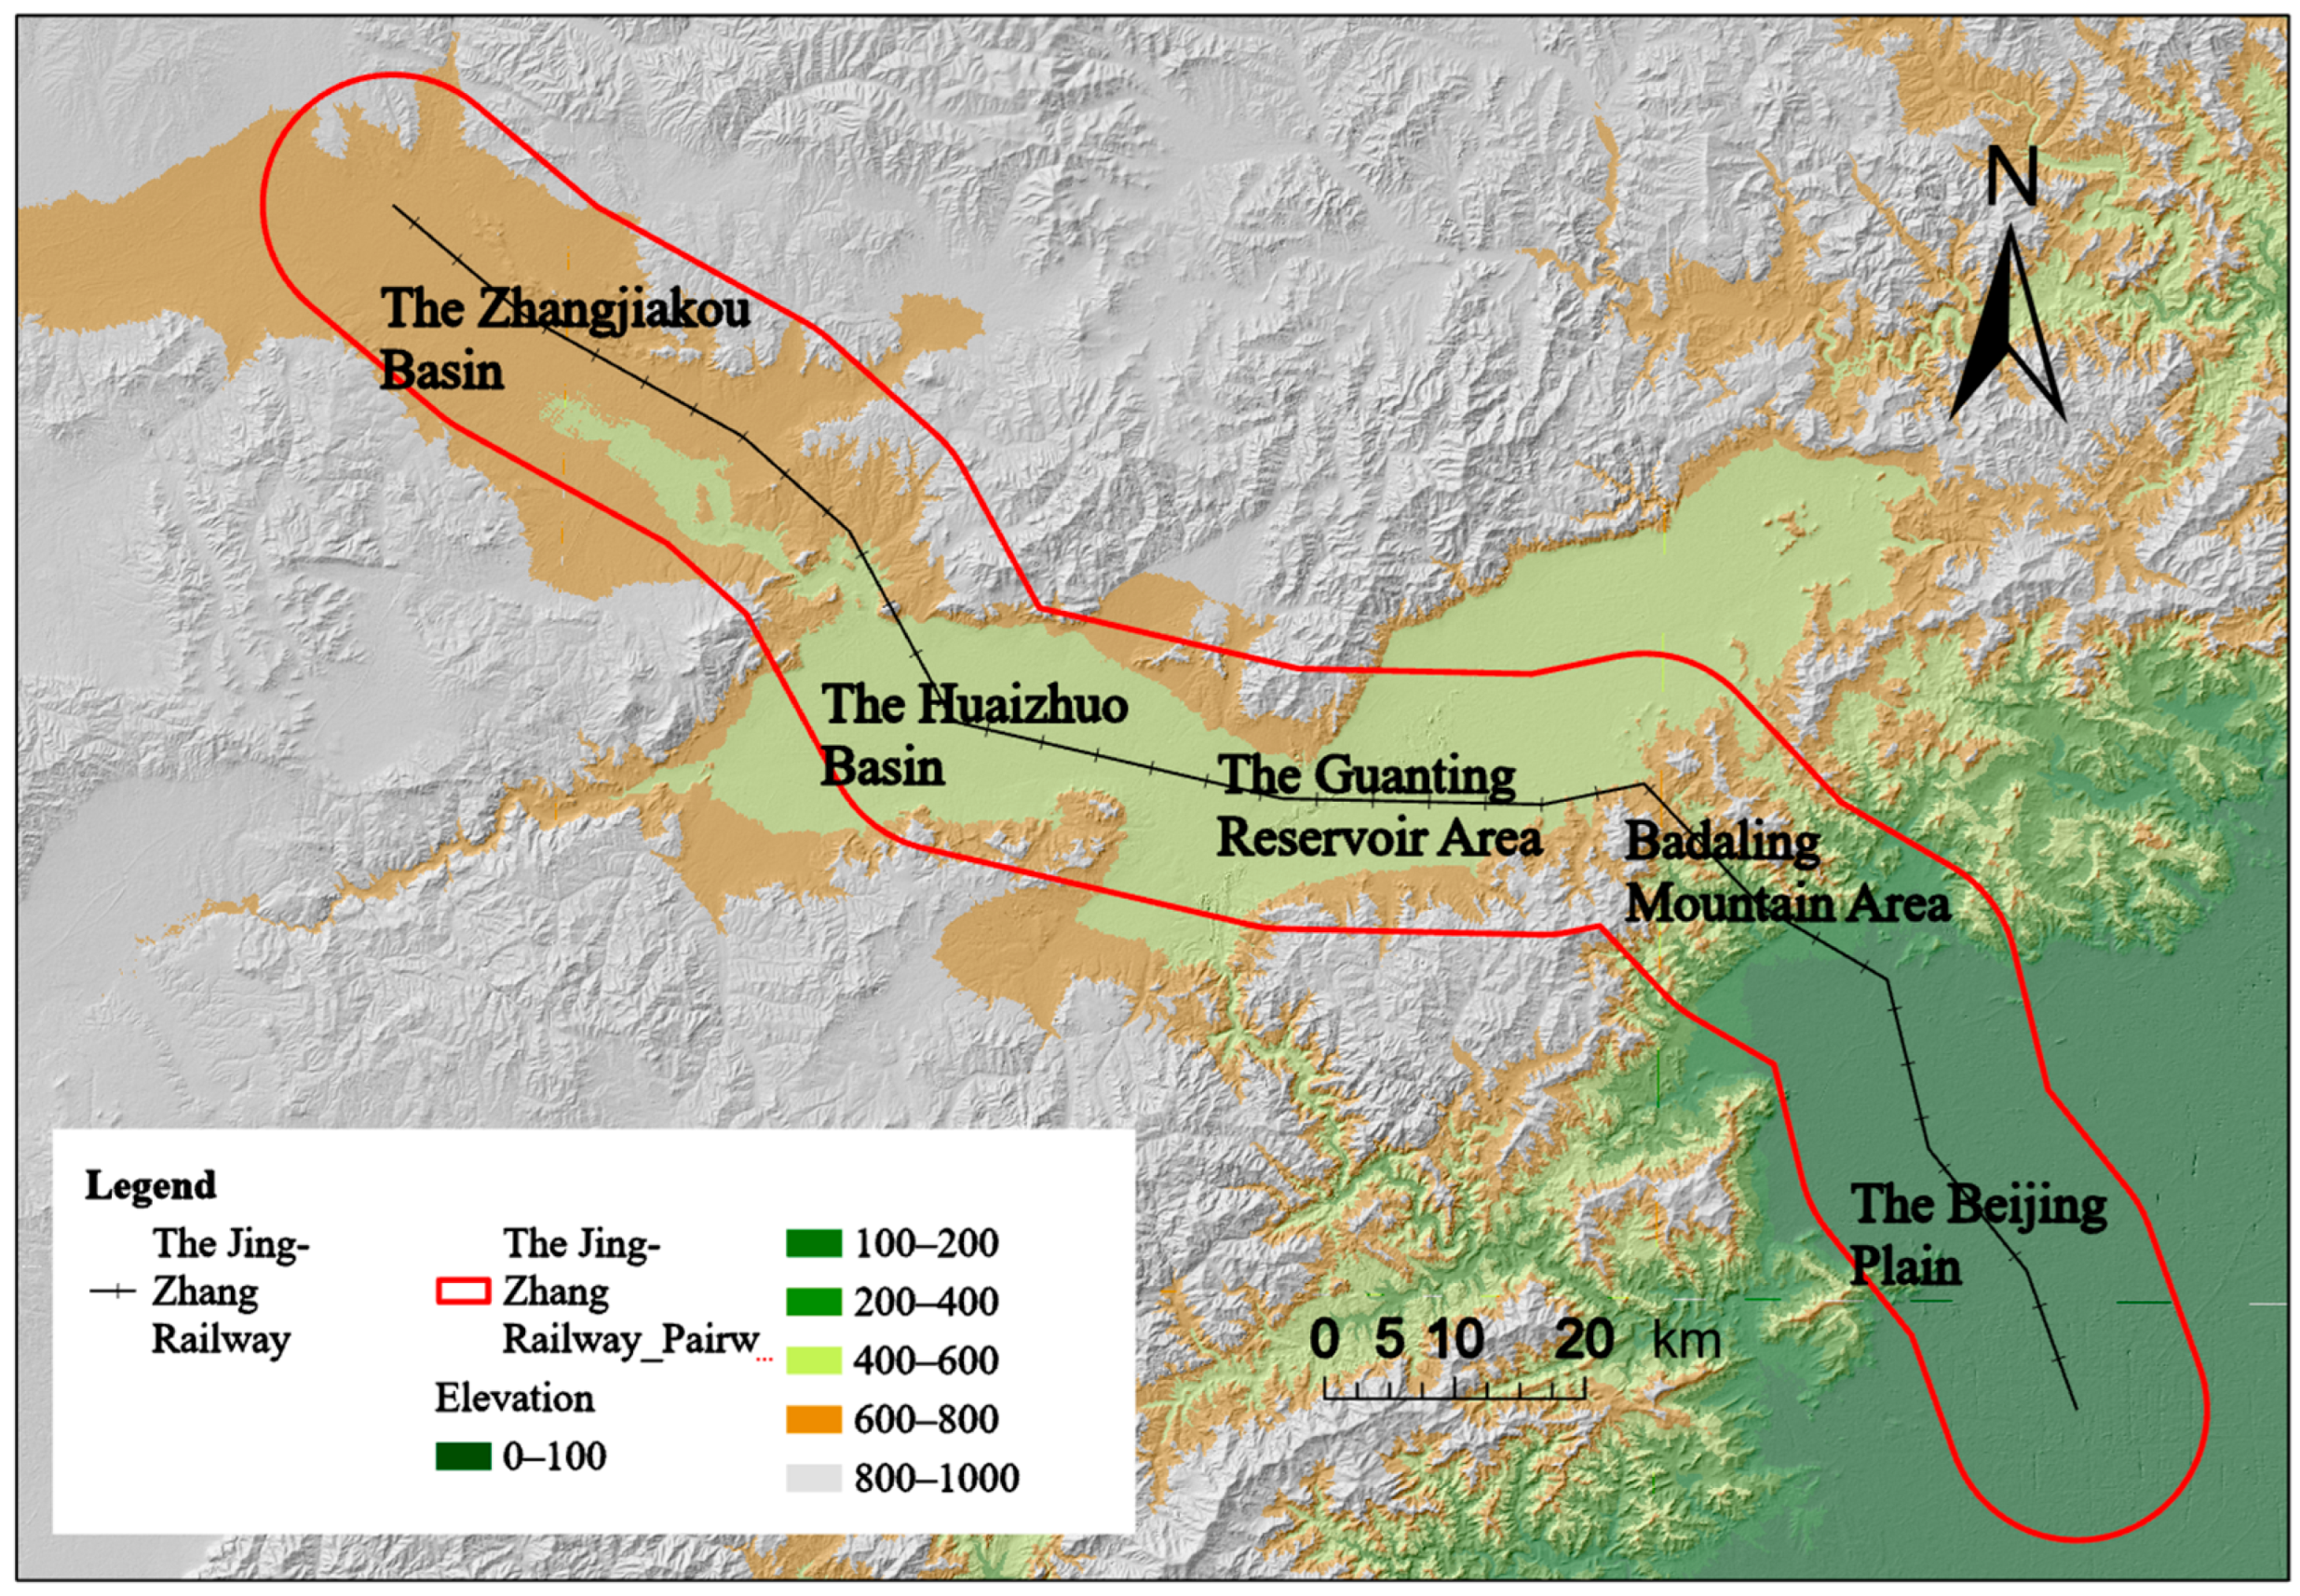
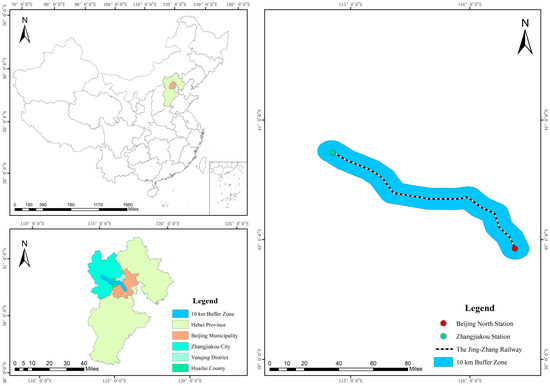
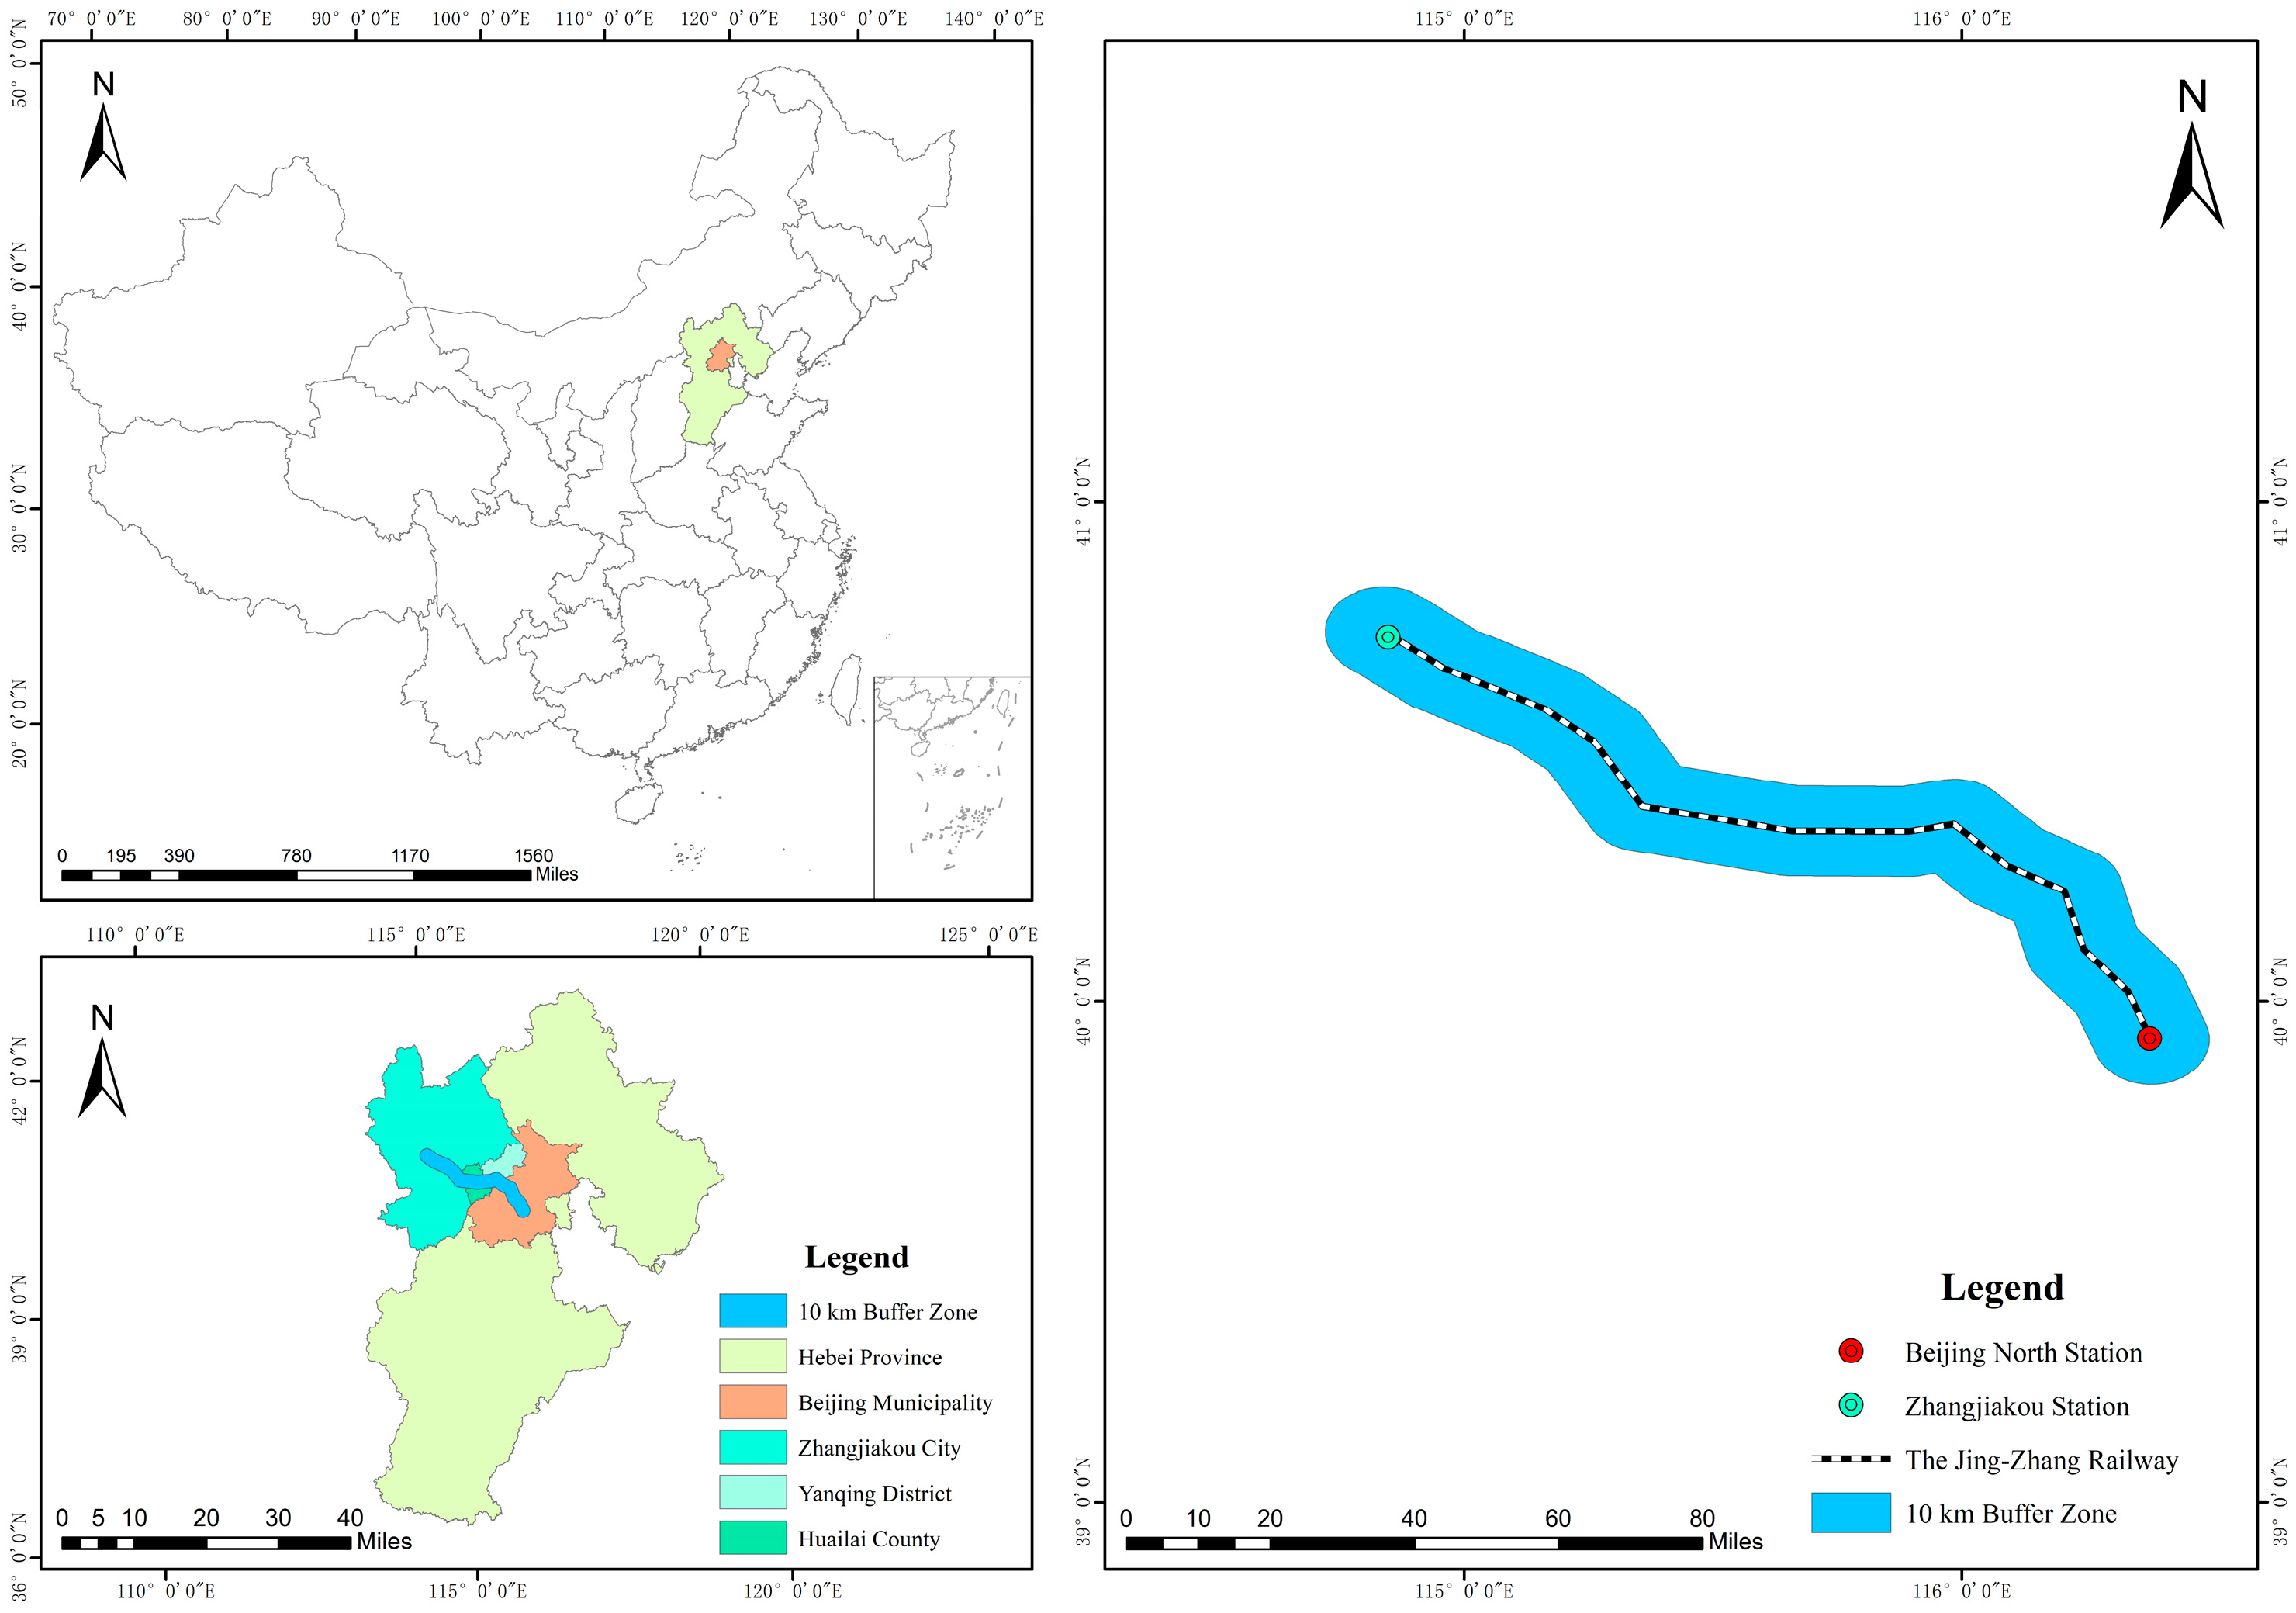
The study area follows the Jing–Zhang Railway in northern China. The railway links Beijing Municipality and Zhangjiakou City, Hebei Province. The total length is about 174 km. The corridor connects key zones of the 2022 Beijing Winter Olympics, including central Beijing, Yanqing District, and Zhangjiakou. The railway crosses a sequence of landform units. The units include the Beijing Plain, the Badaling mountain area, the Guanting Reservoir area, the Huaizhuo Basin, and the Zhangjiakou Basin [10]. The corridor shows strong relief. Basin sections show gentle slopes and low elevation. Mountain sections show steep slopes and dense gullies (as shown in Figure 1). Figure 1 is intended to provide corridor-scale geomorphological context by locating the railway within plains, mountain belts, reservoir-margin terrain, and intermontane basins that together control relief contrast and slope processes along the line.
Figure 1.
Location of the study area, the corridor-scale geomorphological setting, and the major terrain units along the Jing-Zhang Railway.
The corridor has a temperate semi-arid continental monsoon climate. Rainfall shows strong seasonality. Rainfall mainly occurs from July to September. The mean annual precipitation is about 350 to 500 mm. Mean annual precipitation decreases from the Beijing section toward the Zhangjiakou section. Rainfall acts as a main trigger for landslides in the corridor. This role is widely reported in susceptibility studies [17].
2.2. Engineering Geology and Hazard Types
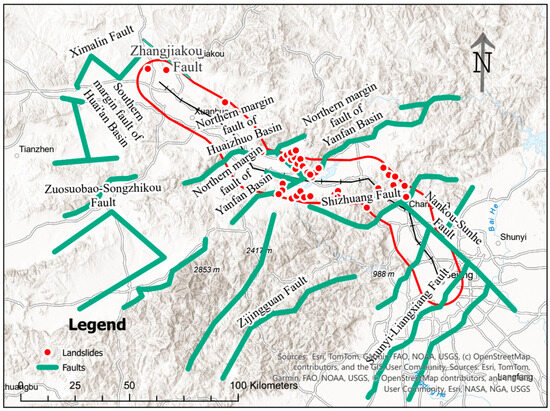
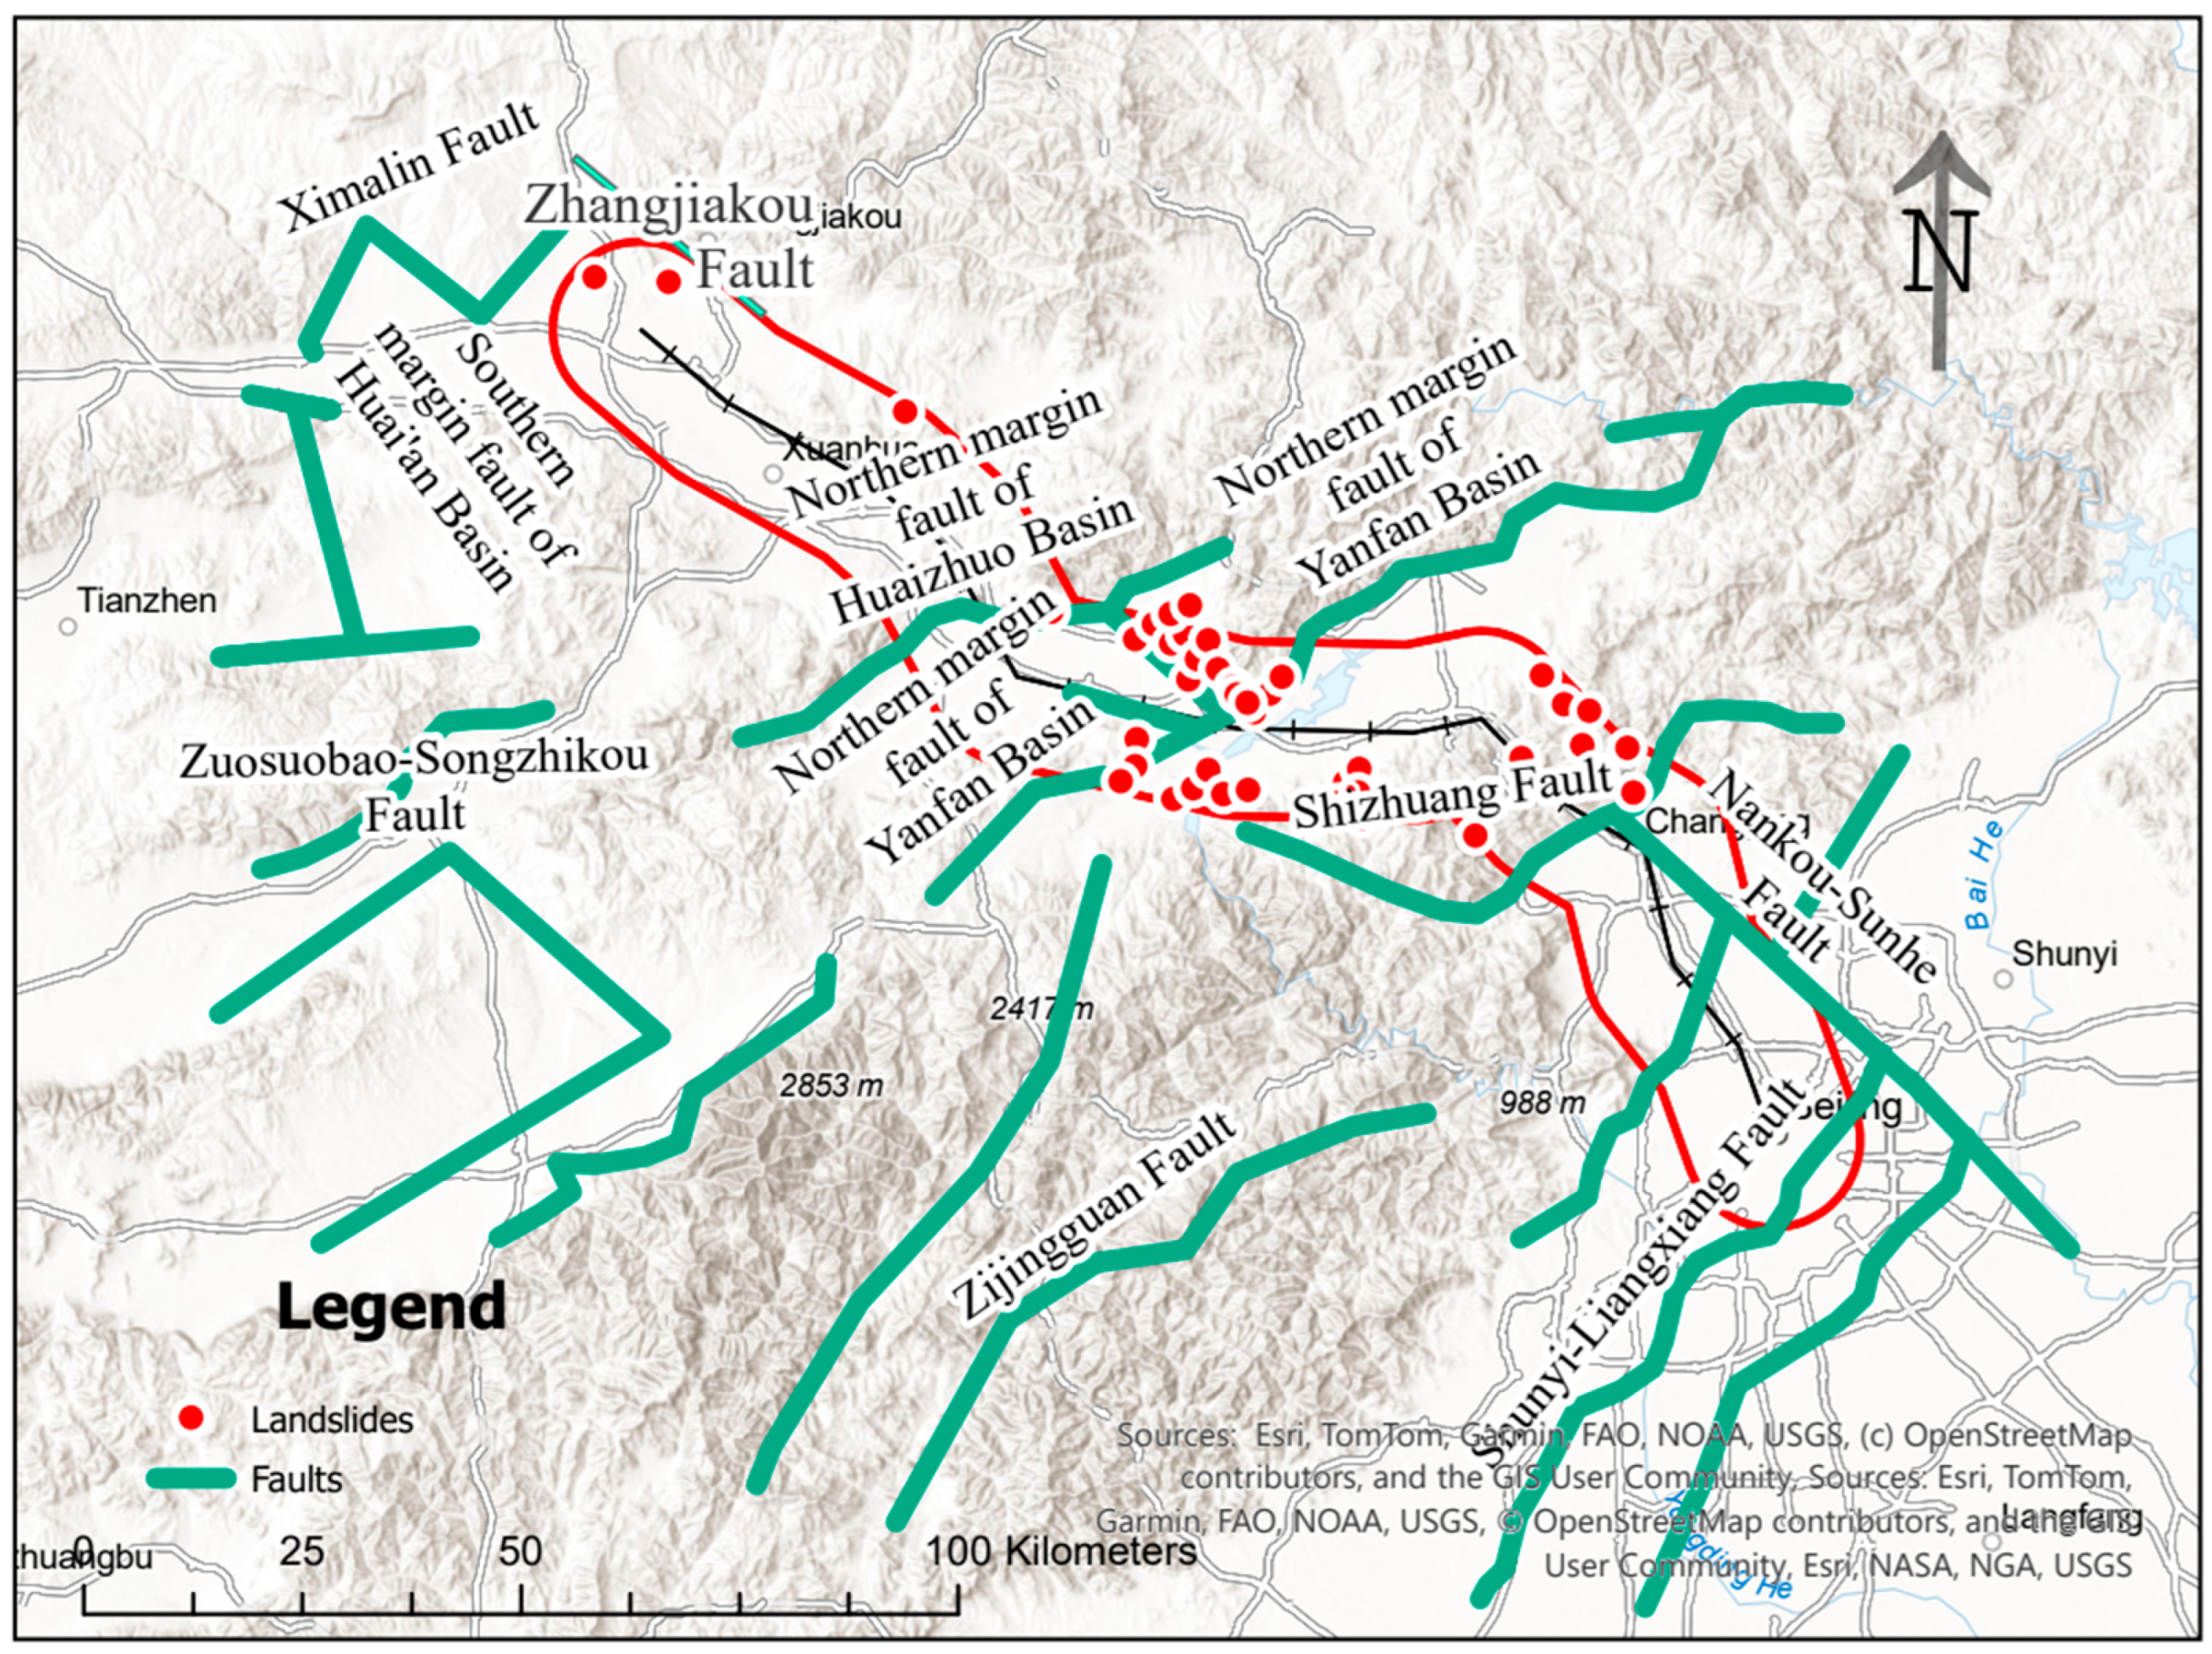
The corridor lies within the Sino-Korean paraplatform. The corridor crosses the North China downfaulted depression, the Yanshan subsidence zone, and the Inner Mongolia axis. Faults are common across the region. Compressional faults dominate, and many faults trend NE or E-W. Four Holocene active faults intersect the railway alignment. The faults include the northern margin fault of the Huaizhuo Basin, the Xinbao’an-Shacheng fault, the northern margin fault of the Yanfan Basin, and the Nankou-Sunhe fault (as shown in Figure 2). The fault network breaks rock masses and weakens slope stability.
Figure 2.
Active faults, Lithology and Engineering Rock, and the landslide inventory in the railway corridor.
Strata and surface materials vary with landform units. Bedrock is common in the Badaling mountains and at basin margins. Quaternary deposits cover basin interiors, including the Beijing section of the North China Plain, the Huaizhuo Basin, the Xuanhua Basin, and the Zhangjiakou Basin. The corridor materials are grouped into four engineering rock groups: (1) loose deposits, (2) soft-hard interbedded clastic rocks and low-grade metamorphic rocks, (3) hard clastic rocks, (4) hard high-grade metamorphic and intrusive rocks. Loose deposits and soft-hard interbedded groups show weak engineering behavior. These groups support many slope problems in the corridor.
Landslides are the main hazard type. Surveys and records report 45 landslides near the railway (as shown in Figure 2). Local collapses and rockfalls occur in steep mountain sections with fractured rock. Many landslides involve loess and loose colluvial or eluvial materials. Many slip surfaces form within loess or at the loess-bedrock contact. Landslides cluster in the Badaling section and in piedmont zones of Huailai County. Landslide occurrence relates to terrain, weak materials, faulting, rainfall infiltration, and construction disturbance. According to the Seismic Ground Motion Parameters Zonation Map of China (GB 18306-2015) [21], the Peak Ground Acceleration (PGA) is about 0.15–0.20 g in the corridor, which can further increase instability under adverse conditions.
2.3. Study Boundary
The study uses the railway main line as the centerline. The study builds a 10 km buffer on both sides of the line in GIS. Administrative boundaries of districts and counties provide additional clipping limits. The final boundary forms a narrow belt along the railway (as shown in Figure 3). The belt covers the direct influence zone of railway construction and operation. The belt also covers mapped landslides and nearby areas with high hazard potential. The boundary avoids an oversized region and improves the efficiency of factor preparation and model runs.
Figure 3.
Delineation of the study boundary using a 10 km buffer and administrative clipping.
3. Data and Factor System
3.1. Landslide and Non-Landslide Samples
Non-landslide samples were generated by random sampling with distance control. The procedure avoided overlap with mapped landslide areas and imposed a minimum distance from each landslide point to reduce spatial dependence. The ratio of non-landslide to landslide samples was set to 2:1. The ratio increases the number of negative samples while maintaining a workable class balance for modelling. The full sample set was then divided into training and validation subsets using a 70%/30% split. The training subset was used to calculate IV statistics, whereas the validation subset was used to test predictive performance. Because the inventory contains only 45 landslides, the present analysis should be regarded as a preliminary corridor-scale screening exercise rather than a fully generalized predictive model. In addition, the available source data do not classify all landslides by failure mechanism in a consistent manner. The model therefore evaluates overall landslide occurrence rather than mechanism-specific susceptibility. The limitation should be considered when judging model reliability and transferability.
3.2. Data Sources and Preprocessing
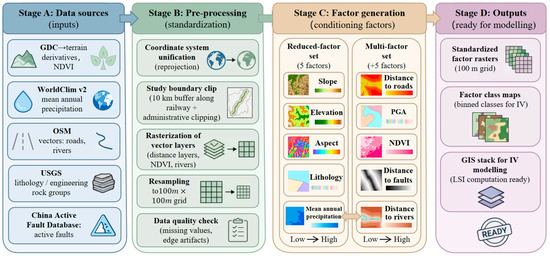
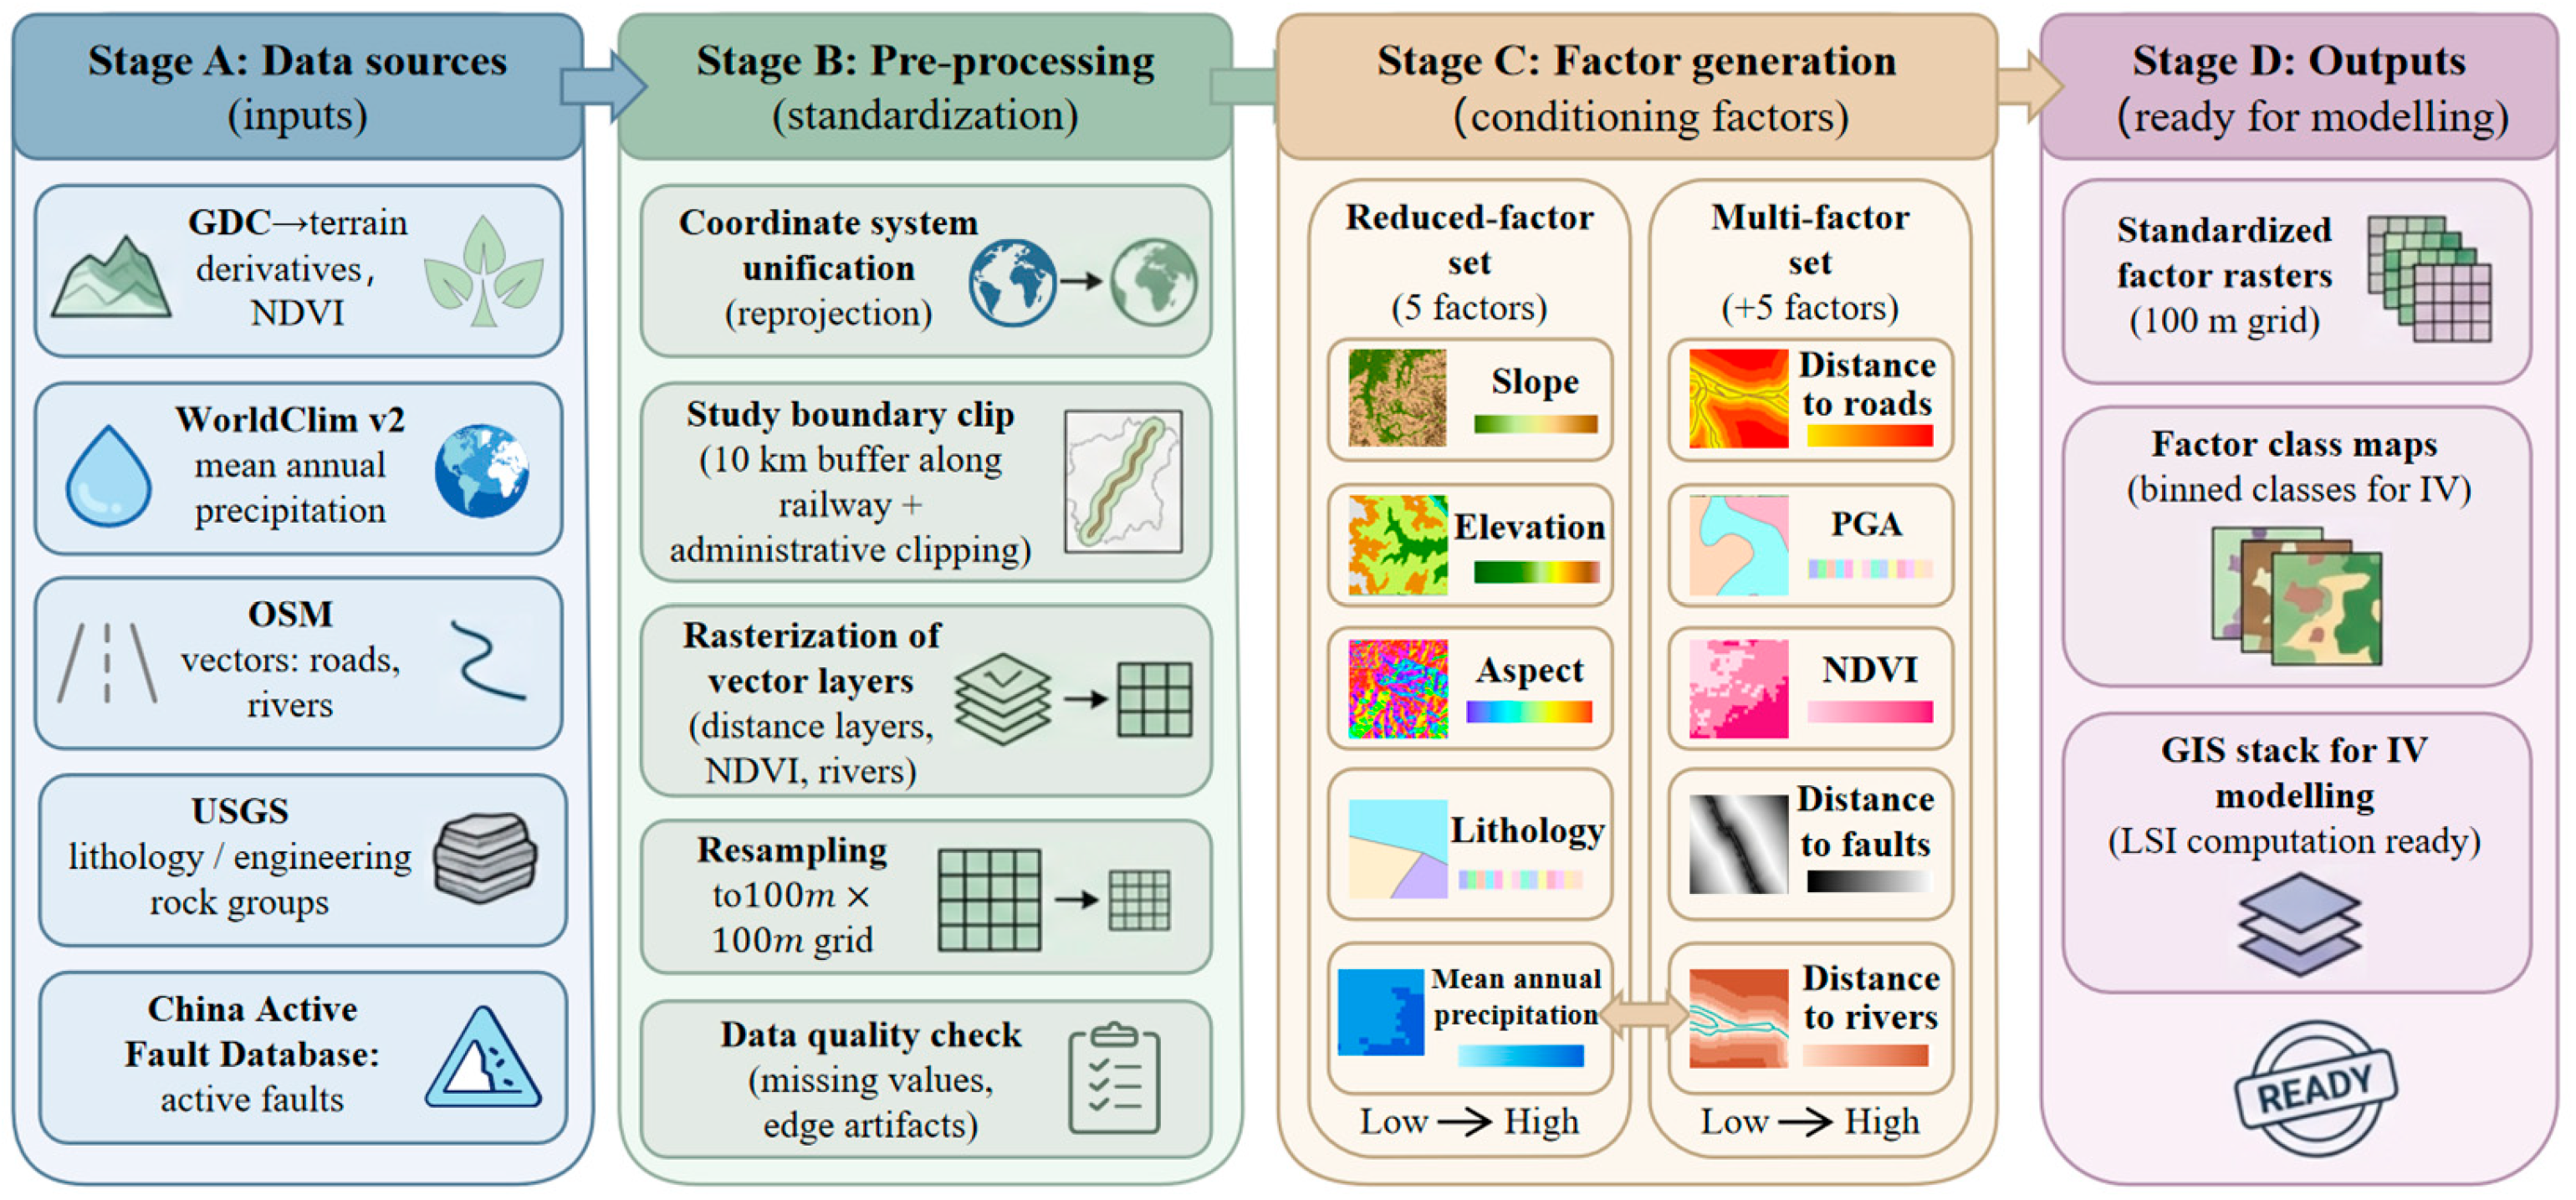
The study compiled geospatial datasets to derive the conditioning factors. A 30 m Geospatial Data Cloud (GDC) dataset was used to generate the Elevation, Slope, Aspect, and NDVI layers. The WorldClim v2 dataset was used for Mean Annual Precipitation. OpenStreetMap (OSM) vector data were used to derive Distance to Roads and Distance to Rivers. Publicly available geological datasets were used to compile Lithology and Engineering Rock, and the China Active Fault Database was used to delineate active faults. These datasets constitute the candidate factor pool. They were used to derive either the full 10-factor reference model or the reduced five-factor models; not every prepared dataset was retained simultaneously in the final reduced model (as shown in Figure 4).
Figure 4.
Workflow for conditioning-factor preparation and data preprocessing.
All datasets were preprocessed under a unified workflow. All layers were projected into a common coordinate system to ensure spatial consistency. Raster datasets were resampled to 30 m grids to match the evaluation unit scale adopted in the Jing-Zhang Railway IV study [17]. All layers were then clipped to the study boundary defined by the 10 km railway buffer. The 30 m DEM was retained because the present work focuses on corridor-scale preliminary screening rather than site-specific slope analysis. The selected resolution also maintains consistency with the published Jing-Zhang Railway study [17] and with other openly available regional datasets used in the present work. At this scale, the DEM represents the broad terrain pattern along the railway corridor. Local micro-topographic features such as short scarps, narrow gullies, and minor slope breaks are inevitably smoothed. The results should therefore be interpreted as corridor-scale screening outputs rather than slope-scale deterministic predictions.
3.3. Fixed Internal Factor Set for Reduced-Factor Screening
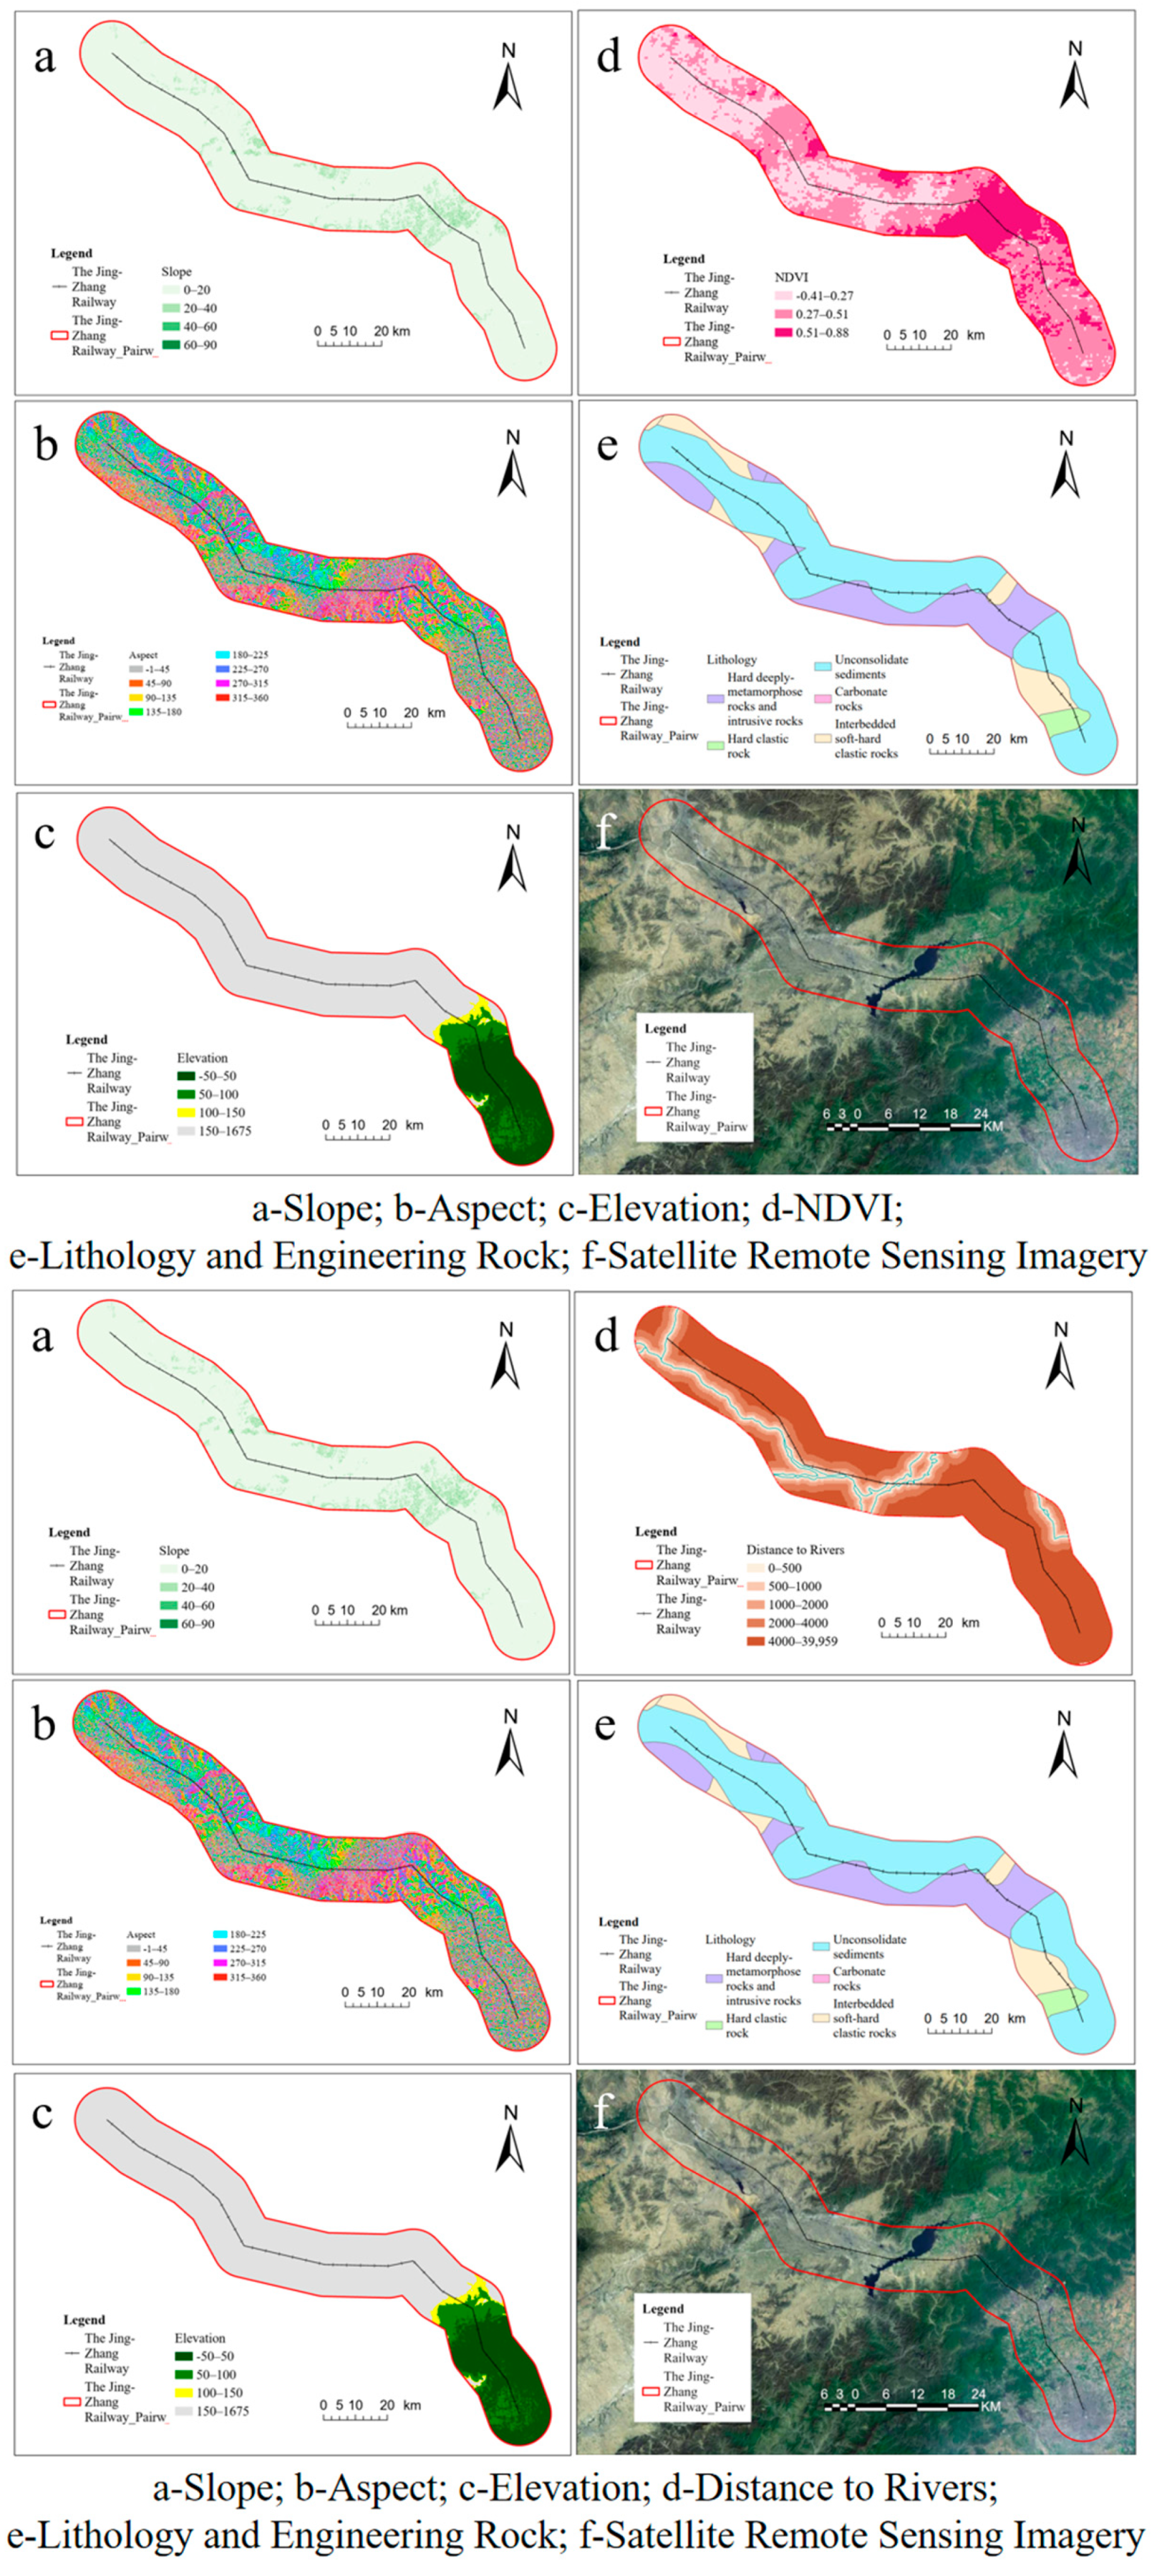
For reduced-factor screening, this study did not define a single preassigned five-factor set. Instead, four internal factors—Slope, Aspect, Elevation, and Lithology and Engineering Rock—were fixed as the core framework, and one external factor was added at a time to form a five-factor model (as shown in Figure 5). This design reflects the engineering objective of the study: to test whether a reduced five-factor model can reproduce the validation performance of the 10-factor reference model while preserving the minimum terrain-geological interpretation required for corridor slopes.
Figure 5.
Core internal conditioning factors fixed in the constrained reduced–factor screening.
Slope, Aspect, and Elevation were fixed because they are the most basic topographic attributes directly derived from the DEM and are widely used in landslide susceptibility studies as fundamental terrain-conditioning factors [22,23,24]. In the present study, they represent slope gradient, slope orientation, and topographic position/elevation, respectively. Lithology and Engineering Rock was also retained in the fixed core because material composition and engineering rock groups fundamentally influence the deformation and failure behaviour of railway slopes by controlling weathering resistance, structural weakness, and shear strength conditions [23,25].
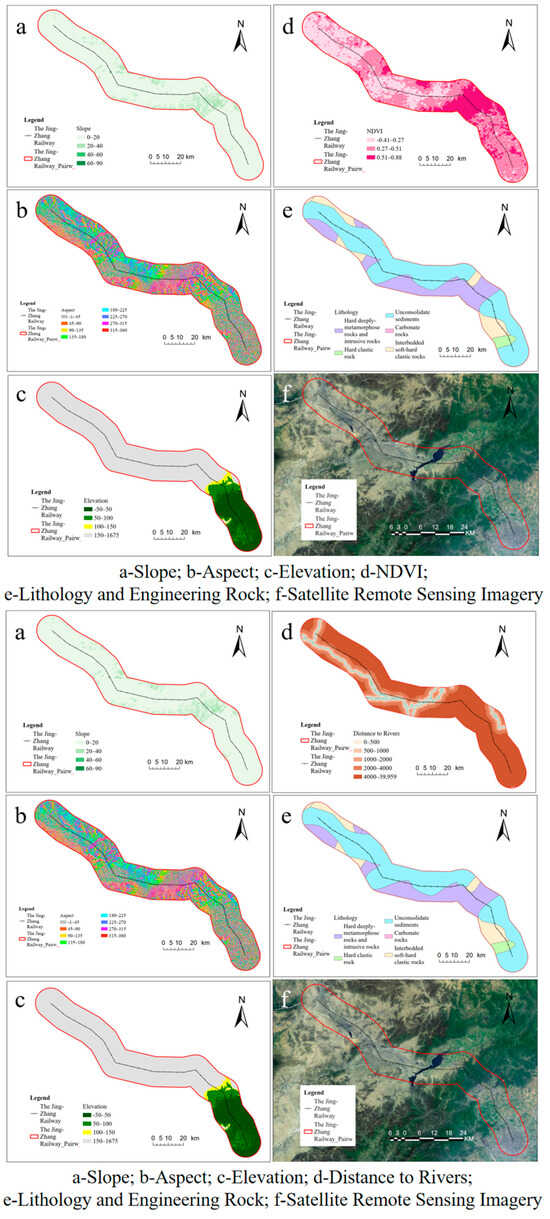
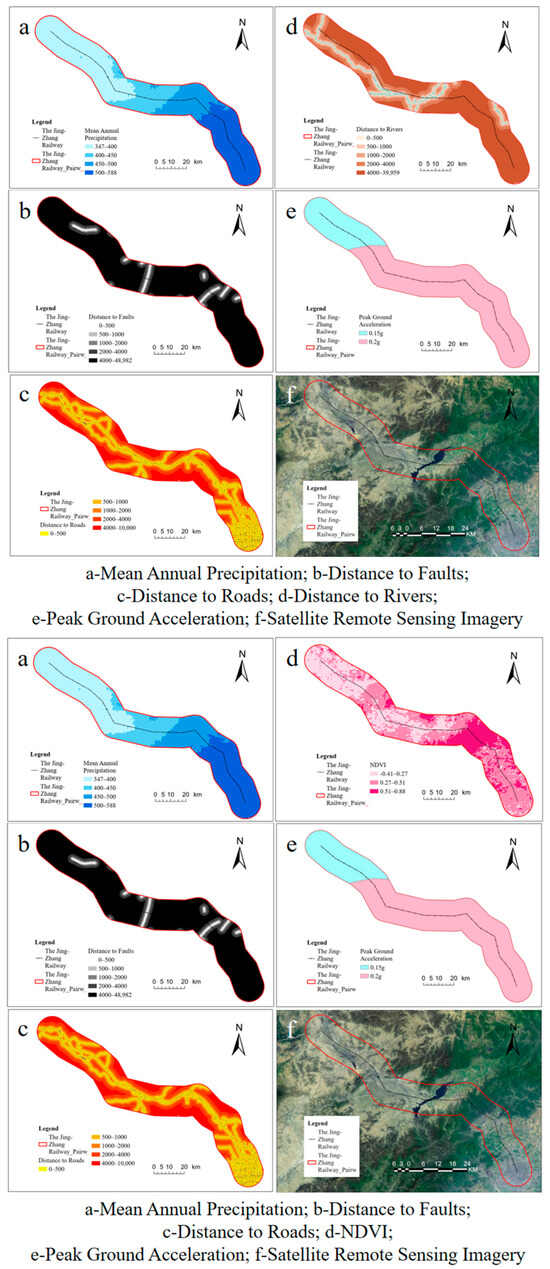
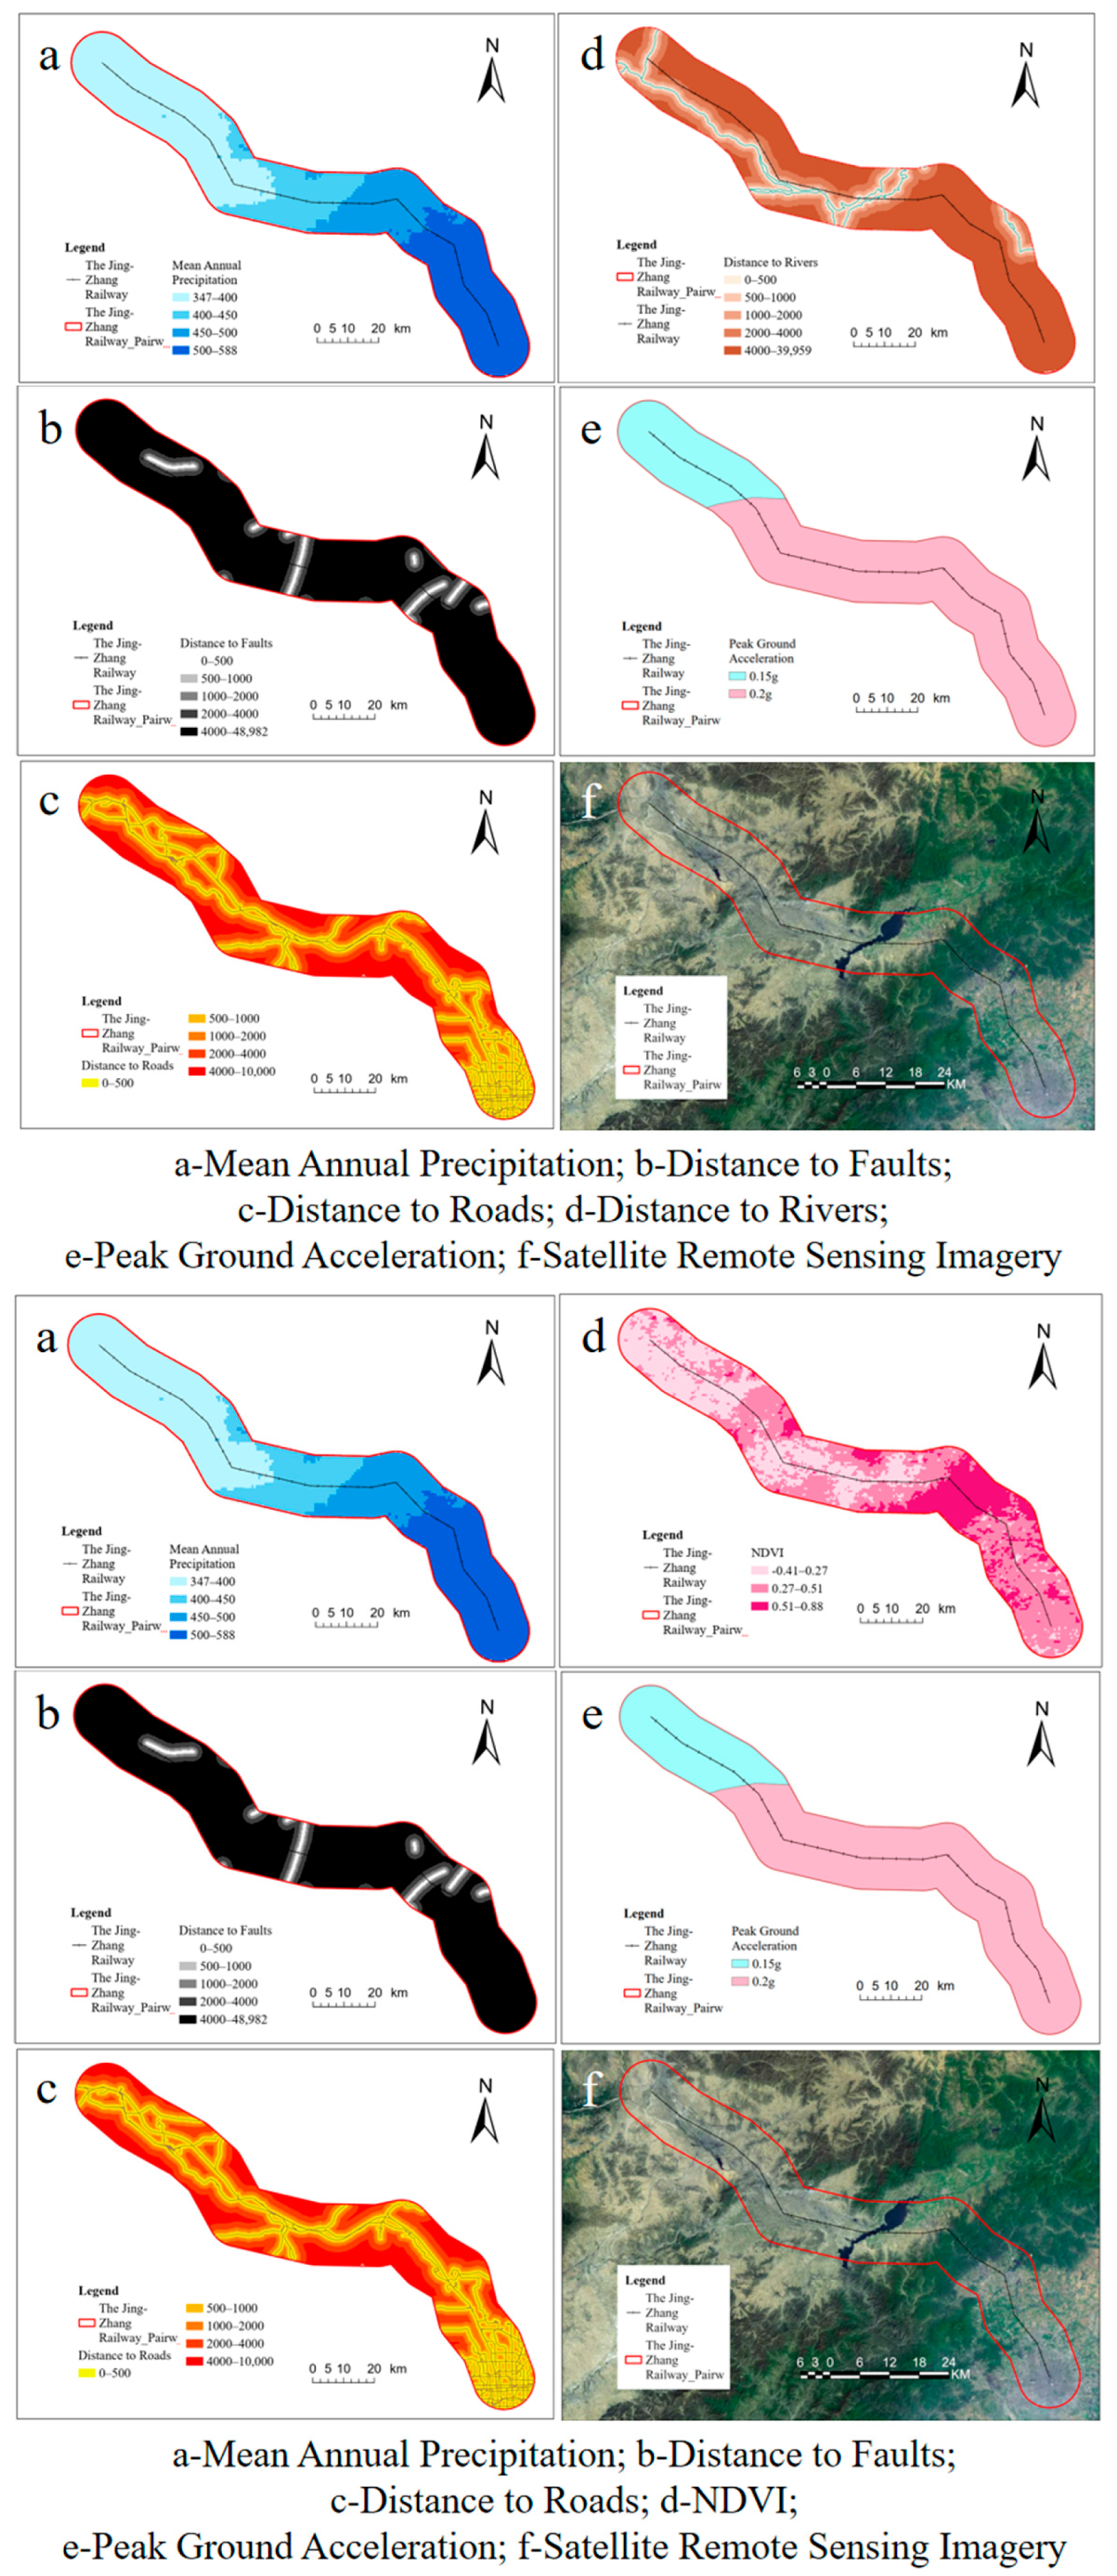
Aspect was retained not because it showed the strongest standalone response in every test, but because it remains a physically meaningful factor in landslide susceptibility assessment. Aspect affects microclimatic conditions such as solar radiation, moisture regime, freeze–thaw exposure, and vegetation differences, which can in turn modify weathering intensity and slope stability [22,24]. By contrast, Distance to Faults, Distance to Rivers, Mean Annual Precipitation, Peak Ground Acceleration, NDVI, and Distance to Roads were treated as candidate external factors because they mainly represent environmental forcing, disturbance, or triggering influences whose incremental contribution is more context-dependent across different corridors (as shown in Figure 6). This separation allowed the study to test the additional explanatory value of these external factors once a defensible terrain-geological core had been fixed.
Figure 6.
Additional conditioning factor maps used in the multi-factor IV model.
3.4. Multi-Factor IV Model Factor Set
The baseline model follows the factor system used for the Jing–Zhang Railway IV assessment [17]. It includes the four fixed internal factors used in the reduced-factor screening—Slope, Aspect, Elevation, and Lithology and Engineering Rock—as well as six candidate external factors: Distance to Roads, Distance to Faults, Distance to Rivers, Mean Annual Precipitation, Peak Ground Acceleration (PGA), and NDVI. These additional layers represent anthropogenic disturbance, structural control, drainage proximity, rainfall conditions, seismic forcing, and vegetation cover. The 10-factor model therefore serves as the benchmark against which the constrained five-factor models are compared under the same IV framework. In other words, all prepared datasets contribute to the candidate factor pool, but only a subset of them is entered into each reduced model. Similar multi-source factor sets are common in corridor-scale susceptibility studies [10].
4. Methodology
4.1. Information Value (IV) Model and Equations
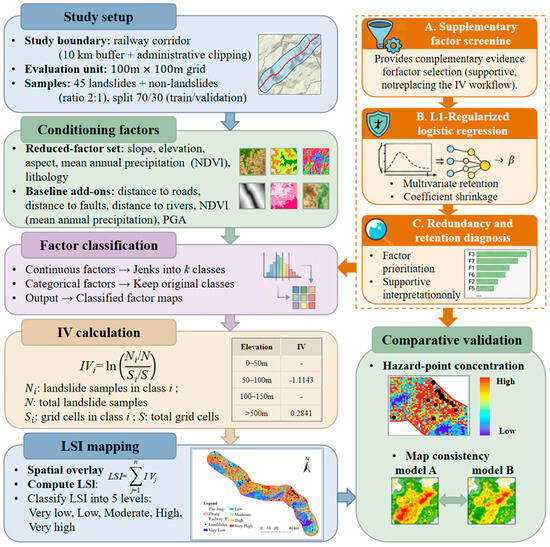
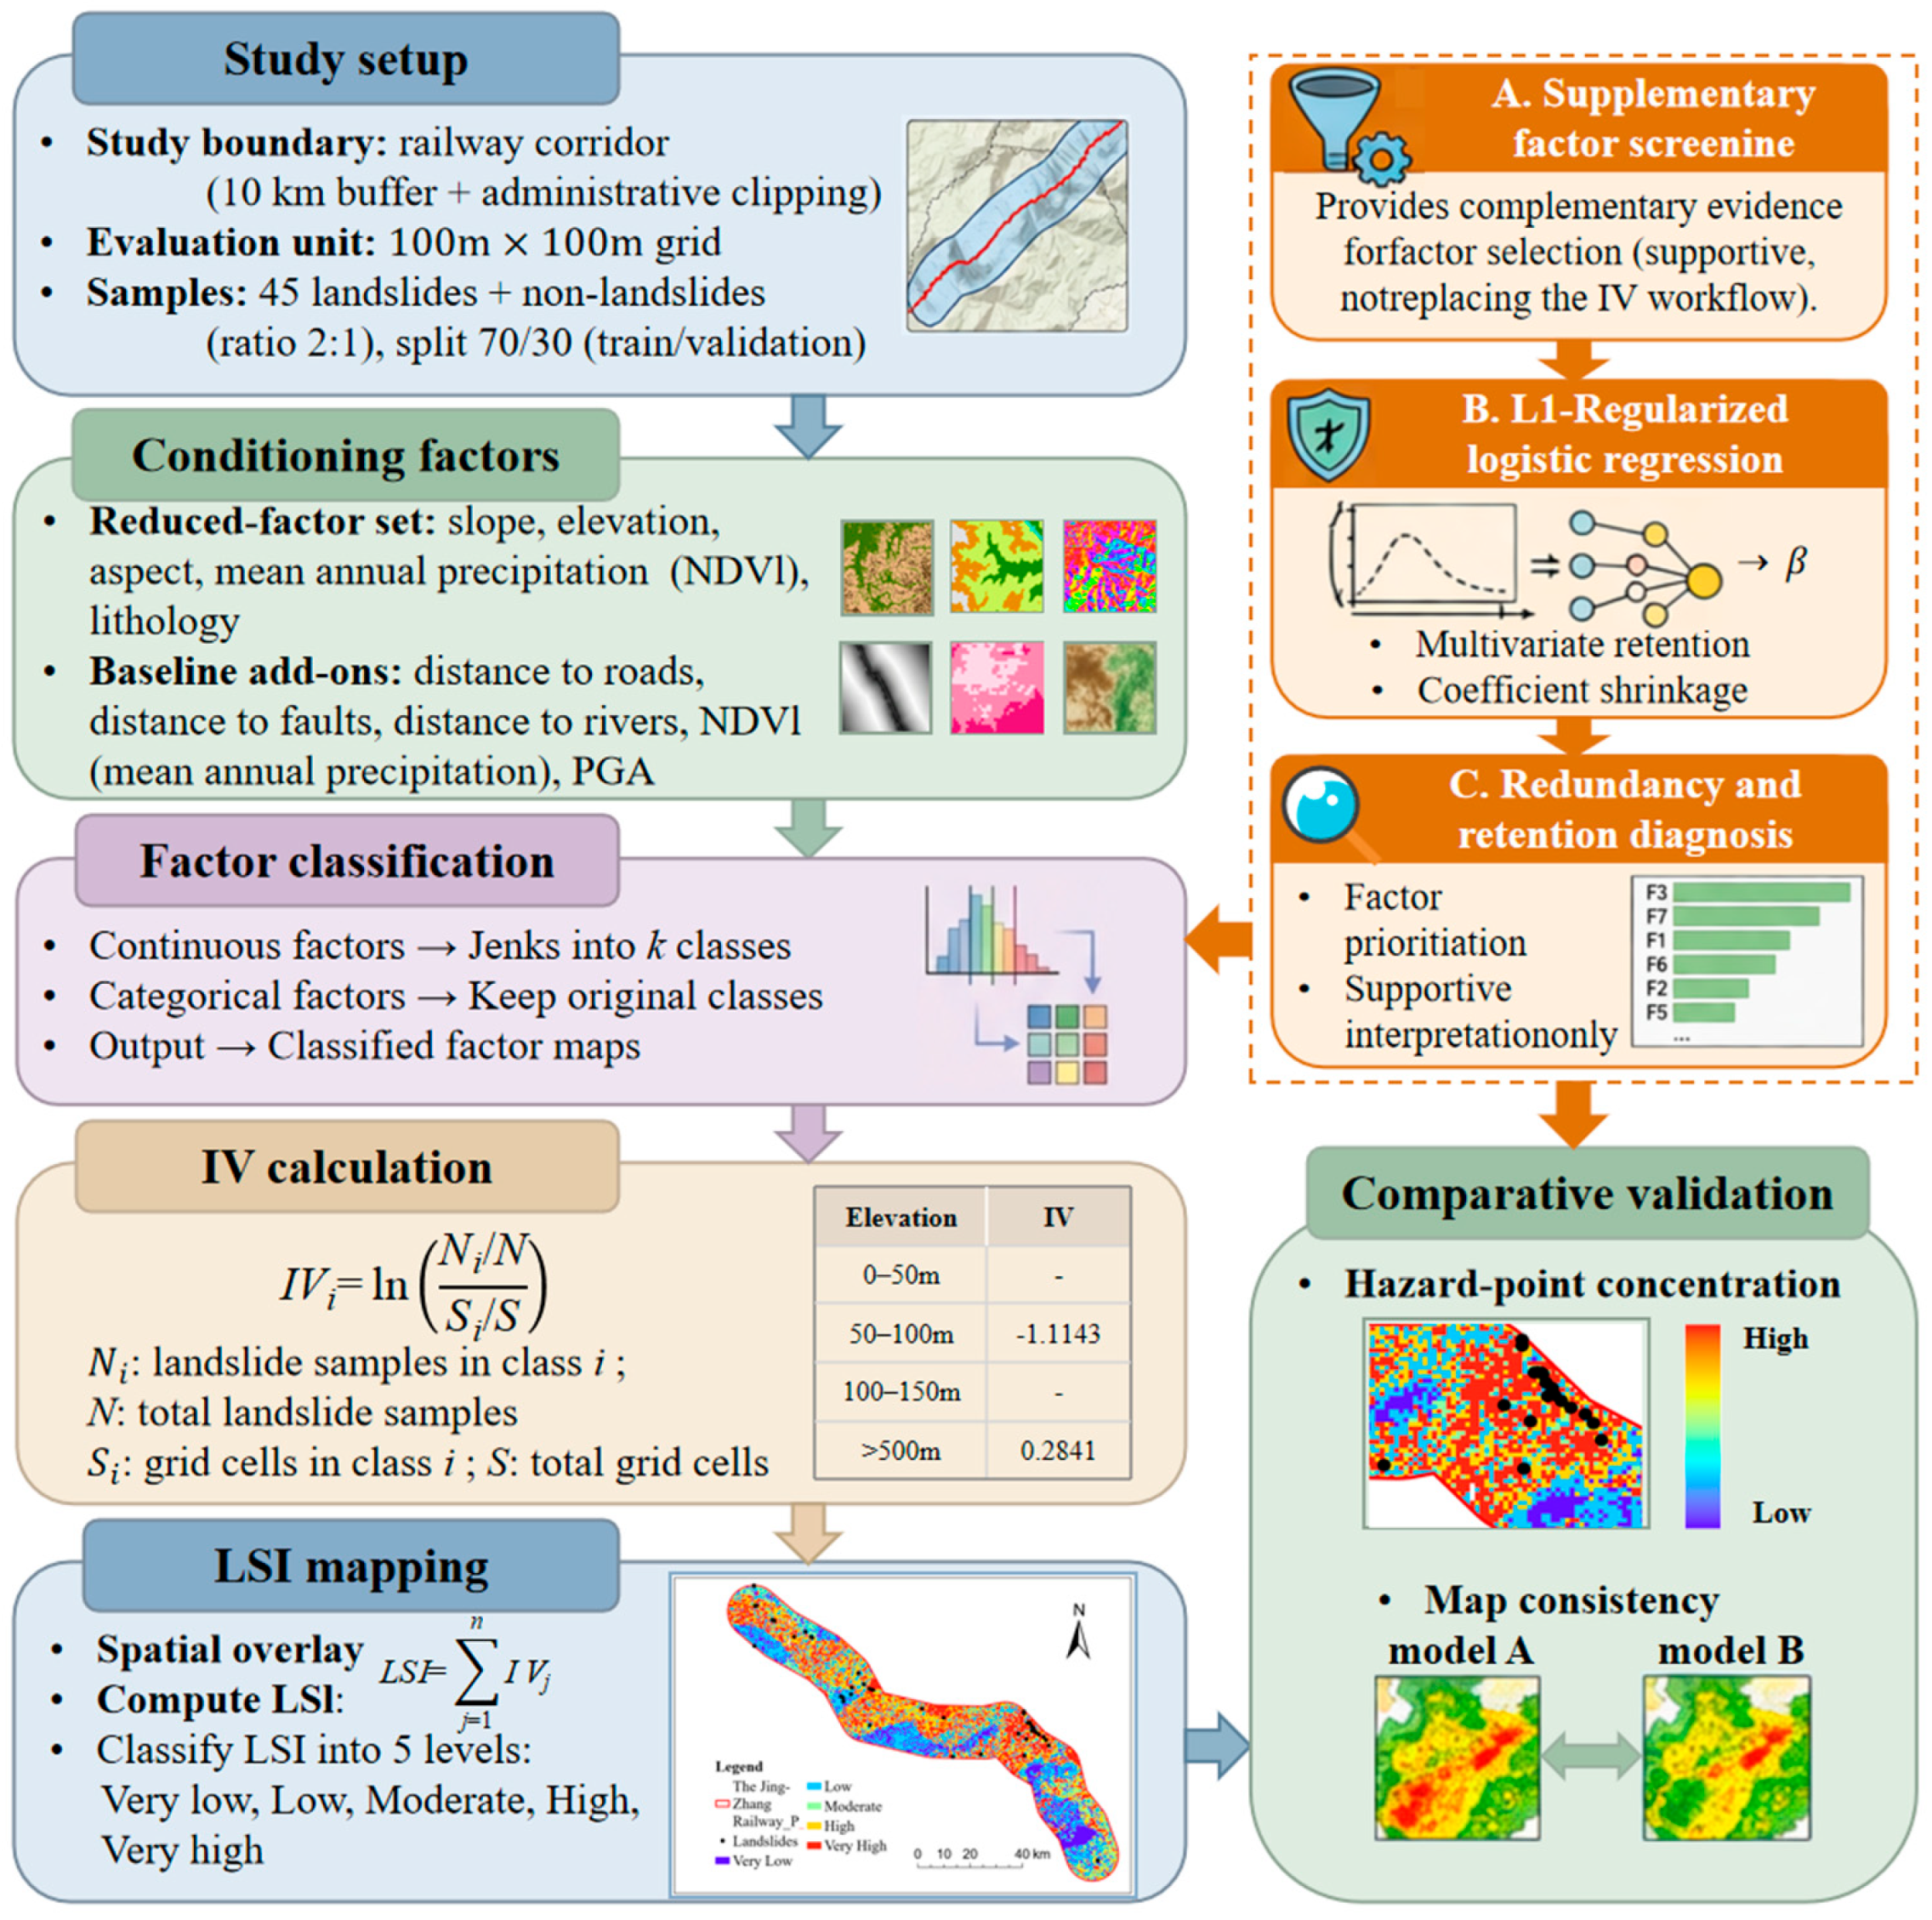
The Information Value (IV) model is a transparent bivariate statistical method that quantifies the contribution of each factor class to landslide occurrence by comparing the landslide density within that class with the background density of the entire study area. The method is widely used in landslide susceptibility mapping because it is easy to implement in GIS and suitable for engineering applications in which model interpretability is important [10,26]. In this study, transparent indicates that every factor class has an explicit and traceable contribution to the final score, whereas bivariate indicates that landslide occurrence is evaluated against each conditioning factor separately rather than estimated jointly in a multivariate parameter space. The method therefore provides probabilistic preliminary estimates of relative susceptibility rather than deterministic predictions of slope failure. IV was selected over more data-intensive machine-learning approaches because the available inventory is limited, the engineering task requires operational simplicity, and class-level interpretability is important for corridor management. However, IV does not explicitly account for covariance, multicollinearity, or higher-order interactions among factors, and these limitations should be considered when interpreting the results, particularly in heterogeneous terrain [10,11,12]. The overall workflow of the IV-based reduced-factor screening and supplementary factor analysis is shown in Figure 7.
Figure 7.
Overall workflow of IV-based reduced-factor screening and supplementary factor analysis.
In Equation (1), denotes the information value of class i; is the number of landslide samples in class i; N is the total number of landslide samples; is the number of grid cells belonging to class i; and S is the total number of grid cells in the study area. A positive information value indicates that the landslide density of that class is higher than the background level, whereas a negative value indicates a lower-than-background landslide density.
After the IV of each factor class was calculated, a Landslide Susceptibility Index (LSI) was assigned to each grid cell by summing the information values of all factor classes represented in that cell, as shown in Equation (2).
In Equation (2), n denotes the number of conditioning factors included in a given model. A higher LSI indicates a stronger association with landslide occurrence and therefore higher susceptibility.
Before IV calculation, all continuous factors were discretized into ordered classes. The continuous variables included slope, elevation, mean annual precipitation, and the distance-based factors. To maintain engineering interpretability while remaining comparable with the published Jing-Zhang Railway assessment [17], class boundaries were defined through a combination of natural breaks and literature-consistent engineering adjustment [27,28,29,30]. The classification strategy supports practical use, although classification sensitivity is unavoidable. A dedicated sensitivity test for DEM resolution or class boundary definition was beyond the scope of the available dataset and modelling framework. The issue is acknowledged later in the limitation analysis because both DEM resolution and discretization may affect model stability and factor-reduction results.
4.2. Model Construction and Comparison Strategy
After factor discretization and IV calculation, an LSI surface was generated for each model by summing the information values of all factor classes represented in each grid cell. A higher LSI indicates a stronger statistical association with landslide occurrence and therefore a higher susceptibility level. The same IV framework was used for both the conventional multi-factor model and the reduced-factor models. Under such a design, differences among models can be interpreted in relation to factor composition rather than methodological inconsistency [31,32,33]. The comparison therefore addresses not only computational simplification but also whether a smaller and more accessible factor set can preserve engineering interpretability under data-scarce conditions.
Model construction was carried out at two levels. First, a 10-factor model was established as the reference model. The factor set includes lithology and engineering rock, distance to faults, distance to rivers, mean annual precipitation, peak ground acceleration, NDVI, slope, aspect, elevation, and distance to roads [34,35,36]. Second, reduced-factor models were constructed to test whether comparable predictive performance could be obtained under restricted data conditions. During the exploratory stage, all possible five-factor combinations were screened. A constrained comparison was then introduced by fixing four internal factors—slope, aspect, elevation, and lithology and engineering rock—and adding one external factor at a time from the remaining six candidates. In this way, the prepared datasets first formed a complete candidate pool and then supported comparison among smaller reduced-factor subsets.
The constrained design was adopted to preserve engineering interpretability. Slope, aspect, and elevation were fixed because the three variables are basic DEM-derived controls that describe slope gradient, slope orientation, and topographic position. Lithology and engineering rock was also fixed because material properties exert first-order control on deformation and failure processes along railway corridors [37].
Aspect was retained in the fixed core not because aspect always showed the strongest standalone response, but because aspect carries clear physical meaning in slope analysis. Aspect influences solar radiation, moisture regime, freeze–thaw activity, and vegetation contrast, all of which may affect weathering and slope instability. In comparison, distance to faults, distance to rivers, mean annual precipitation, peak ground acceleration, NDVI, and distance to roads were treated as candidate external factors because such variables mainly reflect environmental forcing, external disturbance, or triggering conditions. The arrangement makes it possible to identify which external factor provides the most useful additional explanatory power once a stable terrain–geological framework has been established.
4.3. Susceptibility Zoning and Validation Strategy
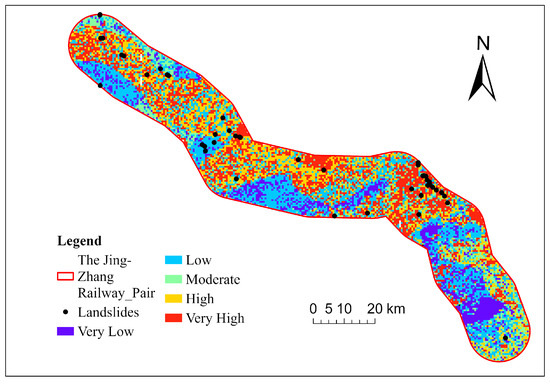
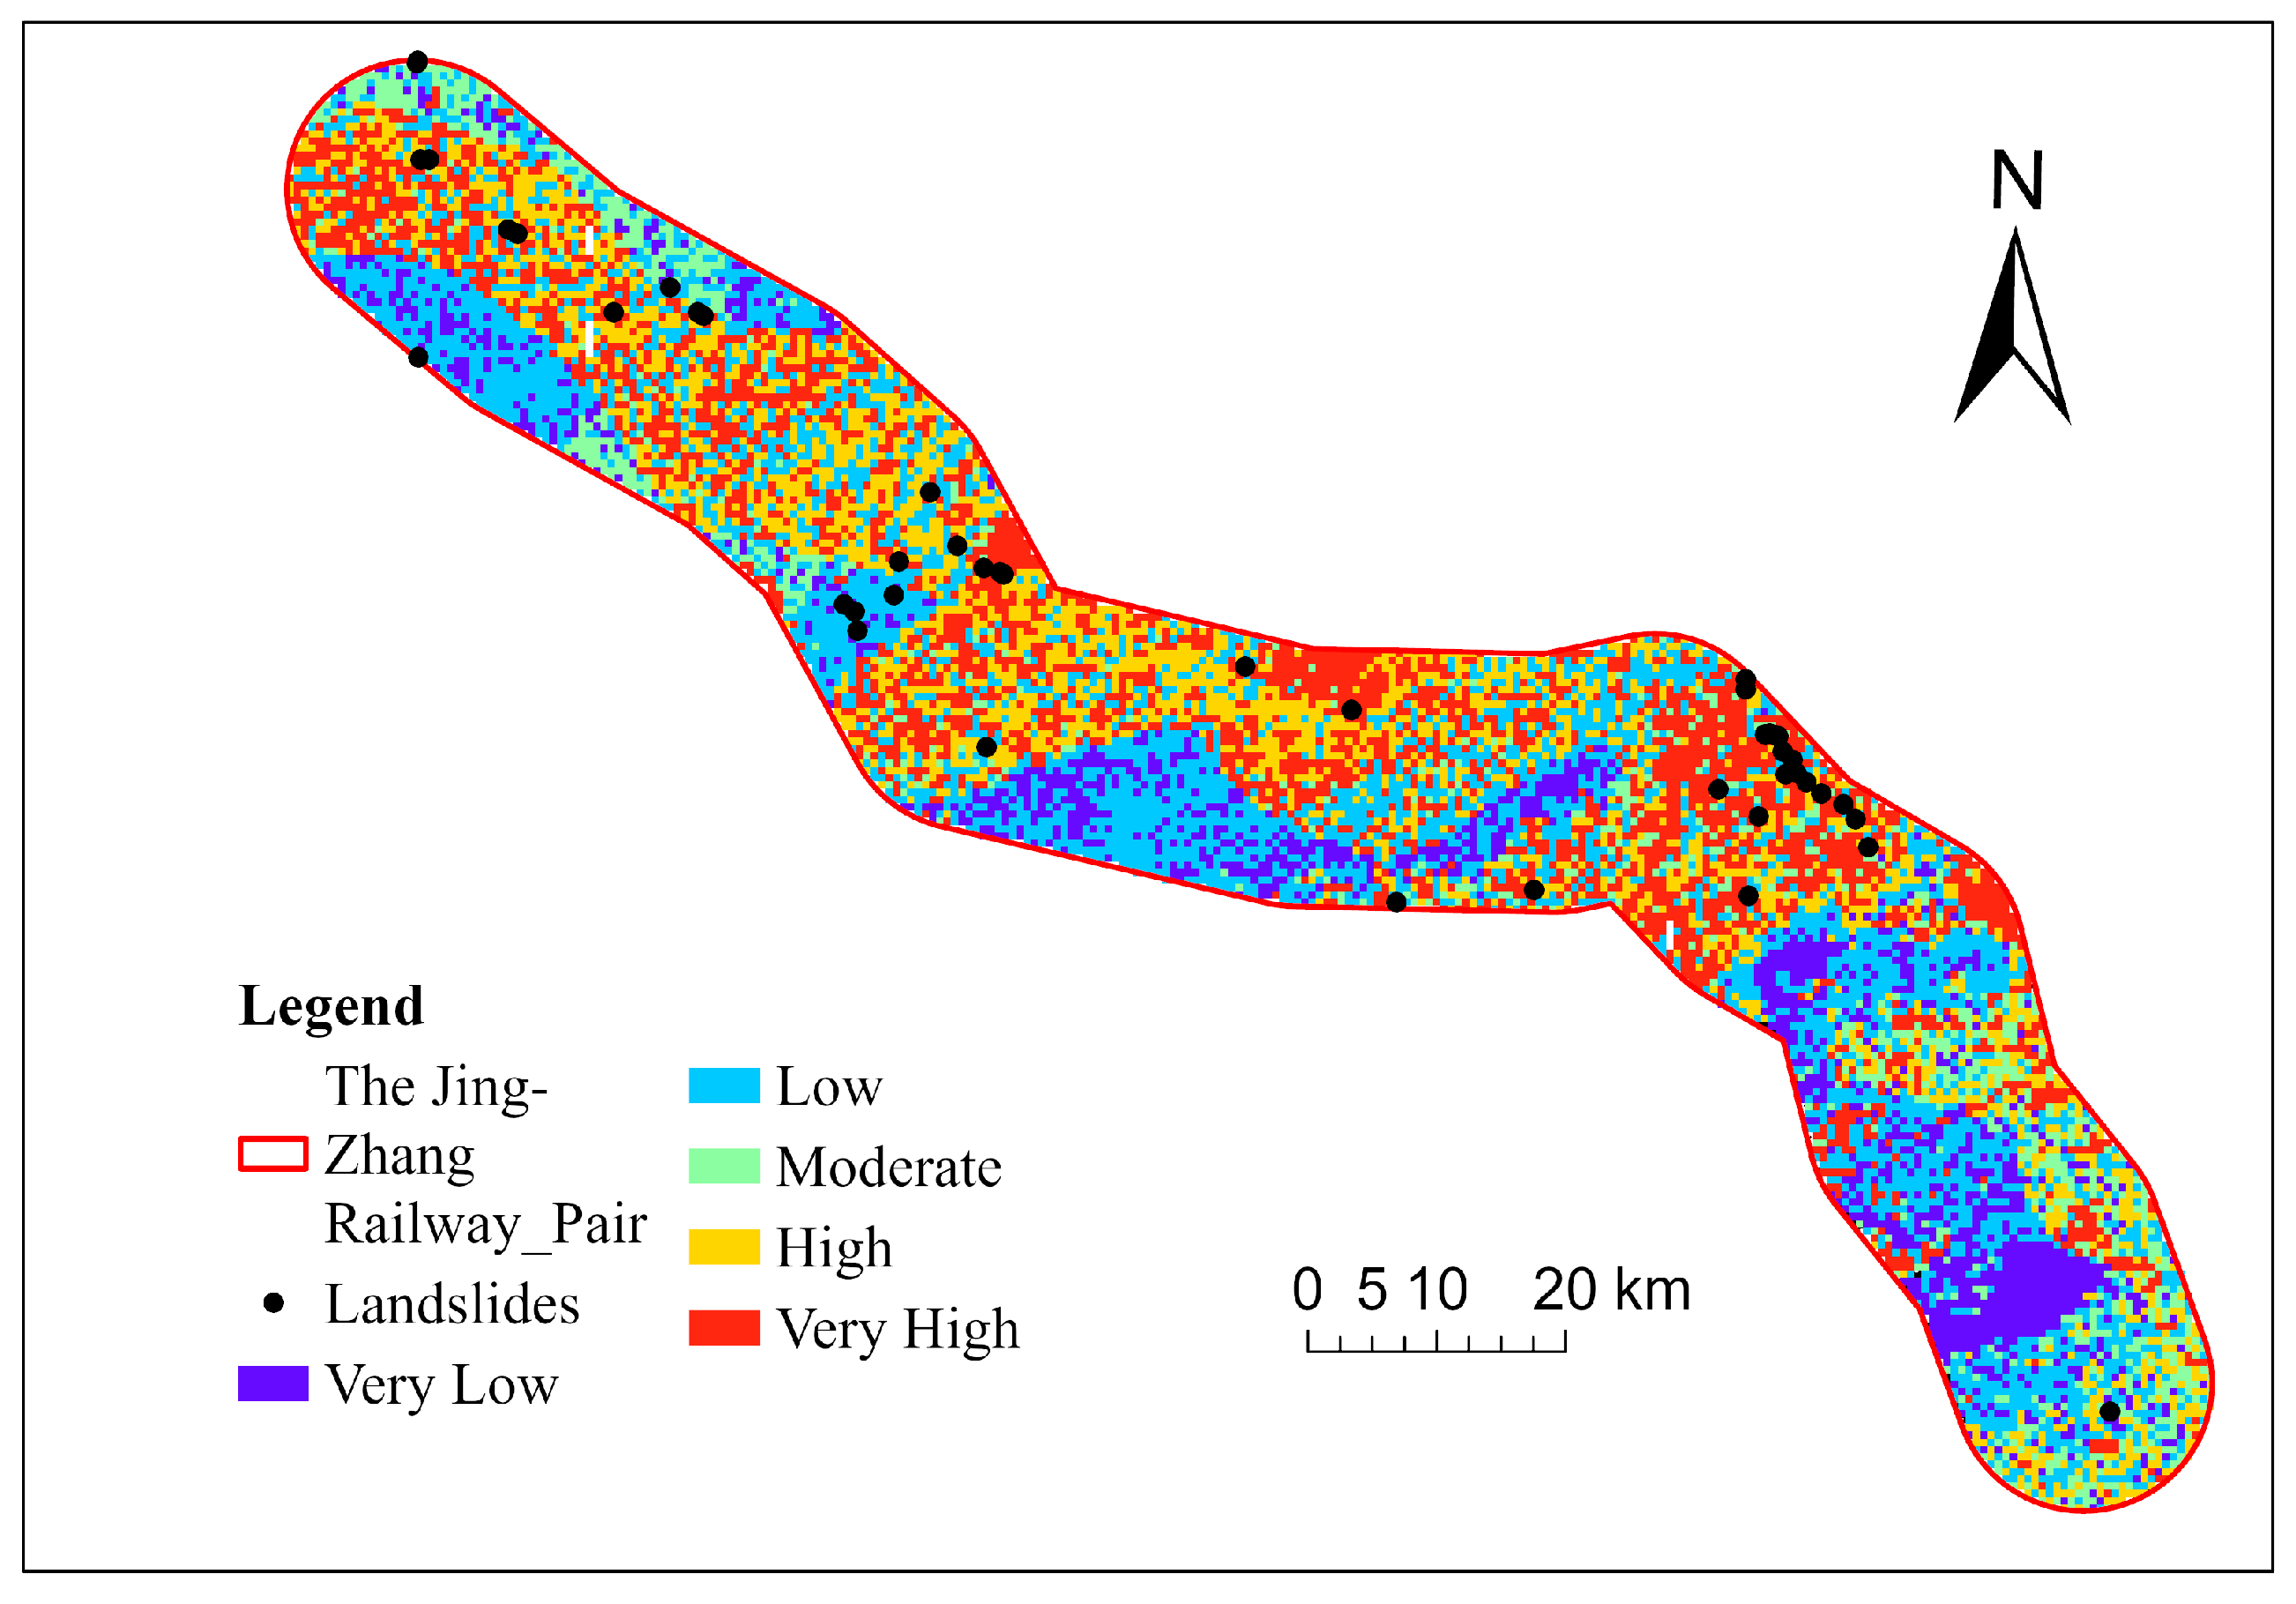
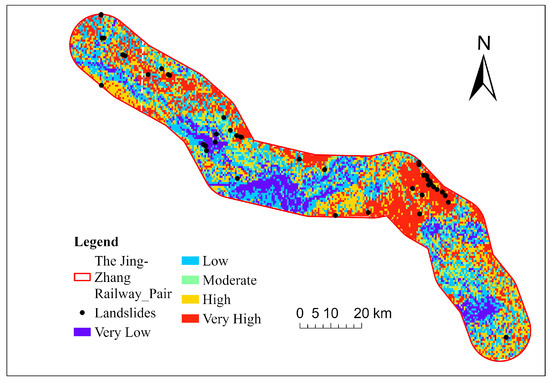
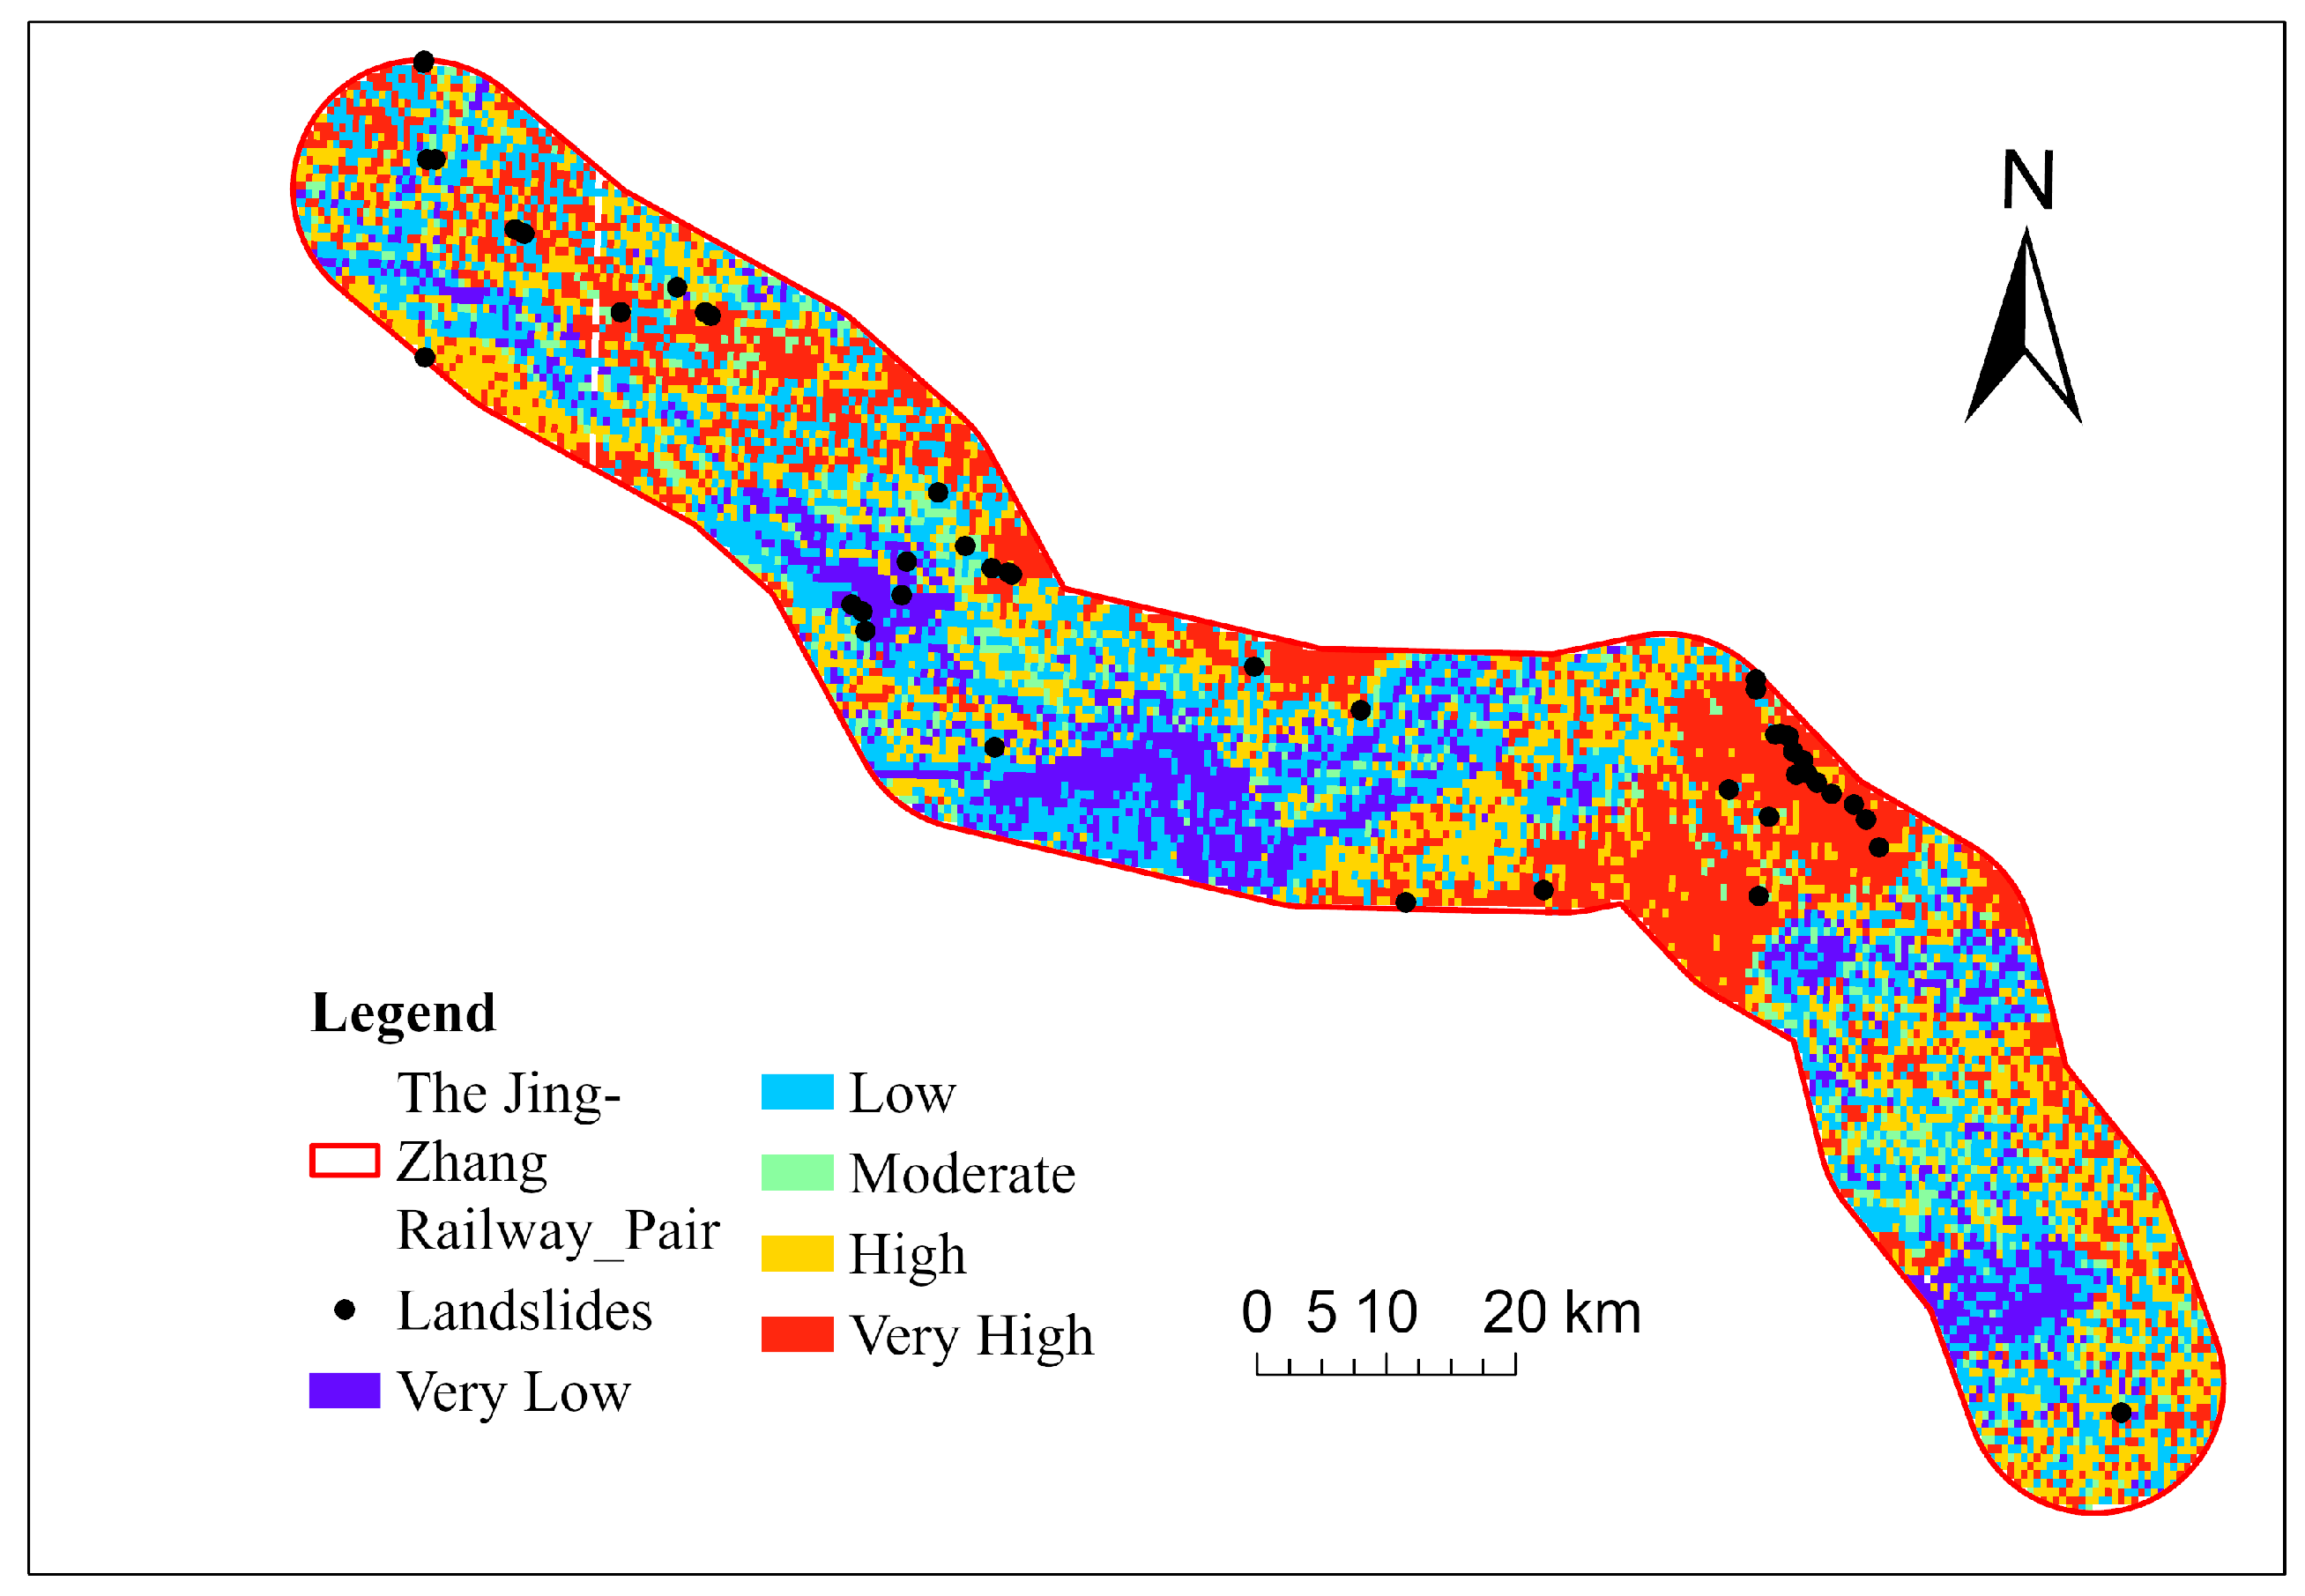
To ensure a fair comparison, all candidate models were developed within the same study area, using the same landslide inventory, the same raster resolution, and the same general IV-based workflow, consistent with standard multi-source remote-sensing data harmonization practices [36,38]. For each model, the continuous LSI surface was further classified into five susceptibility classes—Very Low, Low, Moderate, High, and Very High—using quantile-based zoning (as shown in Figure 8). This strategy maintained comparable class partitions among models and allowed the resulting spatial patterns to be examined under a consistent classification rule. The paired zonation maps in Figure 8 and Figure 9 therefore complement the tabulated results by showing whether the reduced model reproduces the major high-susceptibility belts identified by the 10-factor reference model.
Figure 8.
Landslide susceptibility zonation map produced by the reduced-factor IV model.
Figure 9.
Landslide susceptibility zonation map produced by the multi-factor IV model.
Model performance was evaluated from three complementary perspectives: (1) the areal proportion of each susceptibility class within the modelling domain; (2) the proportion of hazard points falling within each susceptibility class; and (3) the absolute number of hazard points captured by each class. The three indicators describe both the spatial distribution of susceptibility and the degree to which hazard points are concentrated in the more hazardous zones. Such distinction is important because balanced area distribution does not necessarily mean strong hazard-screening ability. Spatial correspondence between the reduced-model map (Figure 8) and the reference-model map (Figure 9) was also examined qualitatively to judge whether the simplified factor set preserved the major corridor-scale susceptibility pattern.
Following the engineering-oriented validation criterion adopted in this study, model accuracy () was defined as the cumulative proportion of hazard points located in the Moderate, High, and Very High susceptibility zones. The calculation can be expressed as Equation (3).
where , , and denote the numbers of validation hazard points falling in the Moderate, High, and Very High susceptibility zones, respectively, and is the total number of validation hazard points. A higher indicates that a larger proportion of hazard points is concentrated in the zones that would normally receive engineering attention first.
The index was adopted because the practical objective of rapid screening is not limited to identifying only the most extreme class. The main objective is to concentrate potentially hazardous slope sections within the Moderate-to-Very-High range so that subsequent engineering attention can focus on the most relevant segments. Reported accuracy values should therefore be interpreted as indicators of screening effectiveness rather than full probabilistic validation of slope-failure processes.
Within this framework, unrestricted and constrained reduced-factor models were compared directly with the 10-factor reference model. The comparison focuses on whether a simplified factor combination can maintain similar hazard-point concentration and overall validation accuracy while reducing data demand. Because the available inventory is small and mechanism-undifferentiated, interpretation of the results relies on numerical performance, geomorphological plausibility, map consistency, and engineering interpretability.
5. Results and Discussion
The study is positioned as an engineering application-oriented investigation of landslide susceptibility assessment for linear engineering slopes along the Beijing-Zhangjiakou Railway corridor. The principal objective is not to introduce a new algorithm, but to determine whether a practically deployable and stable rapid-screening framework can be established under restricted data conditions and tight engineering schedules. Given that the landslide inventory is small and mechanism-undifferentiated, the analysis focuses on preliminary corridor-scale susceptibility rather than mechanism-resolved failure prediction. The distinction is important when interpreting both the strengths and limitations of the reduced-factor IV framework.
To guarantee comparability, all models were developed within the same study area, using the same landslide inventory and the same Information Value (IV) workflow. A conventional 10-factor model was first constructed as the reference model, including Lithology and Engineering Rock, Distance to Faults, Distance to Rivers, Mean Annual Precipitation, Peak Ground Acceleration, NDVI, Slope, Aspect, Elevation, and Distance to Roads. As summarized in Table 1, the most favourable classes in the reference model include 40~60° Slope (IV = 2.7623, Rank 1), 0.51~1.0 NDVI (IV = 0.9466, Rank 2), and 450~500 mm Mean Annual Precipitation (IV = 0.9413, Rank 3). By contrast, several classes such as Hard clastic rock, >60° Slope, and some short-distance fault intervals do not contribute effective positive information under the current dataset. This pattern indicates that landslide occurrence in the study area is jointly controlled by terrain, vegetation condition, and hydro-geomorphic proximity, whereas the explanatory contribution of some conventionally used factors remains limited under the present mapping scale and sample structure. At the same time, because IV is a bivariate model, these rankings should not be interpreted as proof of causal independence among factors.
Table 1.
Information Values (IV) and ranks of the 10-factor reference model.
The validation results of the 10-factor reference model are reported in Table 2. The areal percentages of the five susceptibility classes are close to uniform because the composite susceptibility index was divided by quantiles. However, model performance is reflected not by area balance itself, but by the concentration of hazard points within the more hazardous zones. In the reference model, 0.00% of hazard points fall within the Very Low zone, 5.12% within the Low zone, 15.38% within the Moderate zone, 25.64% within the High zone, and 53.84% within the Very High zone, corresponding to 0, 2, 6, 10, and 21 hazard points, respectively. In spatial terms, Figure 9 shows that the High and Very High susceptibility zones are concentrated mainly in the mountain and piedmont sections of the corridor, whereas basin sections are dominated by lower susceptibility classes. This spatial pattern is geomorphologically plausible and provides the context for judging whether the reduced model preserves the same corridor-scale signal.
Table 2.
Susceptibility zoning statistics and validation results of the 10-factor reference model.
According to this criterion, the 10-factor reference model reaches an accuracy of 94.87%. All listed unrestricted five-factor combinations now report 39 hazard points used. After establishing the reference model, all possible five-factor combinations were first screened as an exploratory comparison to examine the statistical behaviour of reduced models under unrestricted factor selection. The purpose of this step was not to define the final engineering scheme directly, but to identify whether apparently high-performing simplified combinations existed before applying engineering constraints. As shown in Table 3, some unrestricted five-factor combinations achieve 100% under the present validation criterion. However, these results should be interpreted cautiously because the validation sample is small, the reported performance may reflect sample structure, and the selected combinations do not necessarily preserve the terrain-geological interpretability required for a corridor-scale engineering screening framework. Therefore, Table 3 is retained as a statistical exploratory reference rather than as the principal basis for final engineering interpretation.
Table 3.
Ranking of the top 20 unrestricted five-factor combinations.
Because the objective of this study is to develop an engineering-oriented and operationally interpretable screening framework rather than to identify a purely numerical optimum, the exploratory unrestricted ranking was followed by a constrained comparison. In this second stage, four internal terrain-geological factors (Slope, Aspect, Elevation, and Lithology and Engineering Rock) were fixed, and one external factor was introduced at a time. This design makes it possible to evaluate the incremental contribution of each external factor within a stable engineering background framework.
Under this constrained strategy, six reduced five-factor models were tested (Table 4). Among them, two reduced models show the best performance: Model A, consisting of Slope, Aspect, Elevation, Lithology and Engineering Rock, and NDVI; and Model B, consisting of Slope, Aspect, Elevation, Lithology and Engineering Rock, and Distance to Rivers. Both models achieve an accuracy of 94.87%, which is exactly the same as that of the 10-factor reference model. Moreover, the reduced-model susceptibility map (Figure 8) reproduces the main high-susceptibility belts highlighted by the reference model, indicating that the simplified factor set retains the dominant corridor-scale spatial pattern. This result is important because it demonstrates that, for the Beijing-Zhangjiakou Railway corridor, the predictive capability of the full 10-factor model can be retained by using only the four internal factors together with one carefully selected external factor. Accordingly, Table 4 presents the principal engineering comparison used for interpretation and conclusion, whereas Table 3 serves as an exploratory statistical reference.
A closer comparison of the two best reduced models reveals subtle but meaningful differences. In Model A, the numbers of hazard points located in the Moderate, High, and Very High zones are 5, 8, and 24, respectively, indicating that this model tends to concentrate more hazard points into the Very High susceptibility class. In Model B, the corresponding numbers are 6, 10, and 21, which are identical to those of the 10-factor reference model. Therefore, Model A may be regarded as slightly stronger in isolating the most hazardous slope sections, whereas Model B exhibits the highest consistency with the benchmark full-factor model. From an engineering perspective, both behaviours are valuable: the former is advantageous for prioritizing highly critical slope segments, whereas the latter is advantageous for reproducing the performance of the conventional model under reduced data requirements. Nevertheless, both reduced models still inherit the intrinsic limitations of IV: landslides occurring on gentle slopes with locally adverse materials or human disturbance may be underestimated, while steep but naturally stable slopes may be overemphasized because the model evaluates factor classes through relative frequencies rather than explicit mechanical stability analysis.
The remaining four constrained models show lower performance. The model incorporating Peak Ground Acceleration reaches 92.30%, the model incorporating Distance to Roads also reaches 92.30%, the model incorporating Distance to Faults reaches 89.74%, and the model incorporating Mean Annual Precipitation yields 0% under the current constrained comparison. The differences indicate that the incremental explanatory contribution of the candidate external factors is not equivalent once they are combined with the four internal factors. Within the current study area and modelling framework, NDVI and Distance to Rivers provide the most effective improvement, whereas Mean Annual Precipitation does not enhance the hazard-capture ability of the reduced model under the present data structure and factor classification. This does not imply that rainfall is unimportant physically; rather, it suggests that, at the available mapping scale and with the present small inventory, the precipitation layer does not add effective discriminative power beyond the fixed terrain–geological factors.
This result should also be interpreted in relation to the environmental setting of the Beijing-Zhangjiakou Railway corridor. In this corridor, landslide occurrence is associated with strong relief, mountain-front and piedmont terrain, gully development, weak surficial materials, and local runoff concentration. Under such conditions, Distance to Rivers may better capture hydro-geomorphic effects such as channel incision, toe erosion, drainage concentration, and locally increased moisture conditions near valley systems. Similarly, NDVI may partly reflect differences in vegetation cover, surface protection, and slope moisture-related surface conditions. By contrast, although rainfall is a fundamental triggering factor in many landslide settings, the Mean Annual Precipitation layer used here shows limited additional discriminative power at the current regional scale. Therefore, the screening result should be understood as a case-specific statistical outcome that requires interpretation together with local topographic, geological, and hydrological conditions, rather than as a general statement that rainfall is unimportant for landslide occurrence.
From the perspective of engineering practice, this framework is especially suitable for rapid hazard screening. Linear infrastructure projects usually involve long corridors, numerous slope units, and strict time constraints during route planning, design verification, and construction management. Under such conditions, assembling a complete multi-factor dataset may be difficult or time-consuming, whereas a reduced-factor model can be implemented much more rapidly. The present results indicate that a reduced-factor IV model built on four fixed internal factors plus one carefully selected external factor can provide a reliable first-round identification of potentially hazardous sections without a substantial loss of predictive performance. This improves the practicality of landslide susceptibility assessment for early stage route optimization, field reconnaissance planning, monitoring deployment, and the prioritization of stabilization measures. However, because the IV approach is fundamentally a bivariate statistical screening method, the resulting susceptibility map should be used as a first-round prioritization tool and then refined through field investigation, expert judgement, and interpretation of the local geological, geomorphological, and hydrological setting, especially in heterogeneous slopes or sections affected by construction disturbance.
Nevertheless, the conclusions of this study should be interpreted within the geomorphological and environmental context of the Beijing-Zhangjiakou Railway corridor. First, the landslide inventory is small (45 cases) and not classified by failure mechanism, which limits statistical robustness and prevents mechanism-specific assessment. Second, the IV model is bivariate and therefore cannot explicitly resolve covariance, multicollinearity, or higher-order interactions among conditioning factors. For this reason, the factor combinations identified in the present study should be regarded as engineering-oriented screening results rather than uniquely optimal subsets. Future work should further test the robustness of candidate factor combinations by examining factor information content and redundancy, or by introducing multivariate feature-selection methods capable of accounting for inter-factor dependence. Third, the 30 m DEM and regionally harmonized input layers are appropriate for the corridor-scale engineering screening objective of this study, but they may smooth important micro-topographic controls that would be relevant for site-specific slope analysis. A dedicated sensitivity test to DEM spatial resolution was not carried out in the present study because the main objective was to assess the practicality of a reduced-factor IV framework for first-round corridor-scale hazard screening under incomplete data conditions, rather than to optimize terrain representation at individual slope scale. These concerns are consistent with broader discussions of validation, model uncertainty, and landslide-type dependence in susceptibility studies [11,12,18,19,20]. For these reasons, the proposed framework should be interpreted as an engineering application framework for preliminary screening rather than as a universal or deterministic prediction model.
To complement the bivariate IV analysis, mutual information and an L1-regularized multivariate logistic regression were further introduced to evaluate nonlinear relevance, inter-factor redundancy, and joint feature retention (as shown in Table 5). The integrated screening results showed that mean annual precipitation, elevation, NDVI, and lithology were the relatively stable factors, as they were retained by the L1-logistic model and also exhibited above-median MI values in the uploaded summary table. Among them, mean annual precipitation presented the highest MI value, followed by elevation and NDVI, indicating comparatively stronger nonlinear associations with landslide occurrence under the current dataset. Lithology also remained in the retained subset, suggesting that the lithologic setting still provided non-negligible explanatory information after multivariate compression. In contrast, aspect and slope were preserved by the L1 procedure but were not identified as recommended factors in the integrated summary, implying that their marginal contributions became less stable when nonlinear relevance and multivariate selection were considered jointly. Distance to rivers and distance to faults ranked lower in both MI and L1-based importance, whereas human engineering activity showed negligible information gain and was not retained. Nevertheless, the multivariate logistic model yielded only a modest test AUC of 0.5425, and the positive class achieved zero precision, recall, and F1-score with a support of 13 samples. Therefore, these MI/L1-based results are interpreted as supplementary evidence for factor prioritization and redundancy diagnosis, rather than as definitive multivariate confirmation. Human engineering activity was not retained in the final MI–L1 screening results. This was mainly because the classified distance-to-roads factor showed extremely limited variability within the valid joint sample set, resulting in nearly zero entropy and zero mutual information with landslide occurrence. Under such conditions, the factor could not provide effective discriminatory information in the multivariate screening procedure.
Table 5.
Supplementary factor screening based on mutual information and L1-regularized logistic regression.
Overall, the case analysis confirms that, in the study area, a reduced-factor landslide susceptibility model based on the IV method can achieve the same validation accuracy as the conventional 10-factor model when the factor combination is properly selected. In particular, the two reduced models composed of Slope, Aspect, Elevation, Lithology and Engineering Rock, together with either NDVI or Distance to Rivers, perform best among the constrained engineering-oriented schemes. These findings support the practical value of reduced-factor IV screening, but they also indicate that the results must be combined with local geological interpretation, inventory improvement, and subsequent detailed investigation before engineering decisions are finalized.
6. Conclusions, Limitations, and Future Work
The study developed and evaluated an engineering-oriented landslide susceptibility assessment framework for linear engineering slopes along the Beijing-Zhangjiakou Railway corridor. Rather than pursuing methodological novelty, the work focused on a practical question that is highly relevant to real engineering projects: whether a reduced-factor model can provide stable and reliable susceptibility results under conditions of limited data availability and tight project schedules. To address this issue, the Information Value (IV) method was adopted under a unified modelling framework because it offers operational simplicity, explicit class-level interpretability, and suitability for preliminary screening with a small inventory.
The results show that the conventional 10-factor model achieved an accuracy of 94.87%, with hazard points strongly concentrated in the Moderate, High, and Very High susceptibility zones. Under the reduced-factor screening strategy, two five-factor models performed best: Slope + Aspect + Elevation + Lithology and Engineering Rock + NDVI, and Slope + Aspect + Elevation + Lithology and Engineering Rock + Distance to Rivers. Both models reached the same accuracy as the 10-factor reference model and reproduced the main corridor-scale susceptibility pattern. Accordingly, the reduced model should be understood as an efficient preliminary screening tool, not as a deterministic substitute for detailed geotechnical analysis.
These findings suggest that Slope, Aspect, and Elevation, together with Lithology and Engineering Rock, constitute a stable internal conditioning framework for landslide occurrence in the study corridor. In this framework, the DEM-derived terrain attributes describe the basic topographic setting, whereas Lithology and Engineering Rock represents the material background controlling slope deformation and failure. NDVI and Distance to Rivers provide the strongest incremental explanatory contribution beyond this terrain-geological framework in the present case study. However, this result should be interpreted carefully. In other corridors or regions, rainfall may be the dominant controlling or triggering factor for landslide susceptibility. The present result indicates that, under the environmental conditions, mapping scale, and available inventory of the Beijing-Zhangjiakou Railway corridor, vegetation-related surface conditions and hydro-geomorphic proximity offered stronger additional statistical discrimination than the precipitation layer used in this study.
The practical implication of this study is that the proposed framework is well suited to rapid hazard screening in linear infrastructure projects. For railway and similar corridor-type engineering systems, where slope sections are numerous, the investigation corridor is extensive, and time constraints are often severe, the ability to identify potentially hazardous sections quickly is of considerable value. The reduced-factor IV-based framework proposed here can support preliminary route optimization, early stage hazard zoning, field investigation planning, monitoring deployment, and the prioritization of slope stabilization measures. However, because the IV model is an operationally efficient statistical tool for preliminary screening, its outputs should not be interpreted in isolation. More refined prediction and engineering decision-making still require field investigation, expert judgement, and integration of local geological, geomorphological, and hydrological knowledge.
Several limitations should be acknowledged. First, the conclusions are closely linked to the geomorphological and environmental conditions of the Beijing–Zhangjiakou Railway corridor, and the dominant roles of NDVI and Distance to Rivers may not be directly transferable to other engineering corridors with different geological or climatic settings. Second, the present inventory contains only 45 landslides and is not classified by failure mechanism, which reduces statistical robustness and prevents type-specific susceptibility assessment. Third, the IV model is bivariate and therefore cannot explicitly address covariance, multicollinearity, or higher-order interactions among conditioning factors; it may also underestimate some gentle but unstable slopes while overemphasizing some steep but naturally stable slopes. Fourth, the 30 m DEM and other regionally harmonized datasets are appropriate for corridor-scale preliminary screening but may smooth micro-topographic features, and no dedicated spatial-resolution sensitivity test was carried out in the present study.
Future research should therefore proceed along several directions. First, the proposed reduced-factor framework should be validated in other linear engineering environments, such as railway, highway, and pipeline corridors, in order to test its transferability and regional adaptability. Second, future studies should expand the landslide inventory and classify cases by failure mechanism so that mechanism-specific susceptibility patterns can be evaluated. Third, higher-resolution DEMs and sensitivity analyses should be incorporated to examine the effect of spatial resolution and factor discretization on model stability. Fourth, additional validation indicators, including AUC, hit rate, and spatial consistency of susceptibility zoning, should be introduced to provide a more systematic comparison between reduced-factor and conventional multi-factor models. Finally, the reduced-factor IV framework should be compared with multivariate statistical and machine-learning models so that the trade-off between interpretability, data demand, and predictive performance can be assessed more rigorously.
In summary, this study confirms that, for the Beijing-Zhangjiakou Railway corridor, a carefully selected reduced-factor model can achieve the same validation accuracy as a conventional 10-factor model while retaining practical engineering interpretability. The findings highlight the value of factor screening for rapid corridor-scale hazard identification, but they also show that the outputs should be regarded as preliminary probabilistic guidance to be combined with field investigation, expert interpretation, and more detailed follow-up analysis.
Author Contributions
Conceptualization, Z.S. and C.X.; methodology, Z.S., C.H. and H.G.; software, Z.S. and Z.R.; validation, Z.S. and C.H.; formal analysis, Z.S., C.H. and H.G.; investigation, Z.S., C.H., Z.R. and C.X.; resources, C.X.; data curation, Z.S. and C.H.; writing—original draft preparation, Z.S. and C.H.; writing—review and editing, Z.S., C.H., C.X. and H.G.; visualization, Z.S. and Z.R.; supervision, C.X.; project administration, C.X.; funding acquisition, C.X. All authors have read and agreed to the published version of the manuscript.
Funding
This research received no external funding.
Institutional Review Board Statement
Not applicable.
Informed Consent Statement
Not applicable.
Data Availability Statement
The data presented in this study are available on request from the corresponding author due to privacy.
Acknowledgments
The authors would like to express their sincere gratitude to Beijing University of Technology for providing academic support for this research. During the preparation of this manuscript, the authors used ChatGPT 5.4 (OpenAI) to assist in generating a small number of icons used in Figure 4 and Figure 7. The authors have reviewed and edited the output and take full responsibility for the content of this publication.
Conflicts of Interest
The authors declare no conflicts of interest.
Appendix A
Table A1.
IV and rank results for the model Slope + Aspect + Elevation + Lithology and Engineering Rock + NDVI.
Table A2.
IV and rank results for the model Slope + Aspect + Elevation + Lithology and Engineering Rock + Distance to Rivers.
Table A3.
IV and rank results for the model Slope + Aspect + Elevation + Lithology and Engineering Rock + Peak Ground Acceleration.
Table A4.
IV and rank results for the model Slope + Aspect + Elevation + Lithology and Engineering Rock + Distance to Roads.
Table A5.
IV and rank results for the model Slope + Aspect + Elevation + Lithology and Engineering Rock + Distance to Faults.
Table A6.
IV and rank results for the model Slope + Aspect + Elevation + Lithology and Engineering Rock + Mean Annual Precipitation.
References
- Long, S.L.; Wang, C.; Lu, Y.; Bian, Z.Y. GIS-based assessment of geological hazard susceptibility along highways. Xinjiang Nonferrous Met. 2025, 48, 45–47. (In Chinese) [Google Scholar] [CrossRef]
- Adhikari, S.; Dhakal, S. Landslide susceptibility assessment and slope stability analysis of cut slopes along Dumre-Paudhi Bazar road section, western Nepal. Geosyst. Geoenviron. 2026, 5, 100499. [Google Scholar] [CrossRef] [Scilit]
- Singh, Y.; Chib, S.; Hamdani, I.; Parihar, G.S.; Johar, S.; Pandita, S.K. Landslide susceptibility mapping along the Udhampur-Ramban section of National Highway-44, Jammu and Kashmir: A case study based on the frequency ratio method. Results Earth Sci. 2025, 3, 100141. [Google Scholar] [CrossRef] [Scilit]
- Joshi, A.; Kothyari, G.C.; Patidar, A.K.; Gupta, K. Landslide susceptibility assessment using AHP and RF techniques: Special reference to Kumaun lesser Himalaya, Uttarakhand, India. Phys. Chem. Earth 2026, 142, 104191. [Google Scholar] [CrossRef] [Scilit]
- Tumon, M.S.H.; Imran, H.M.; Chow, M.F.; Zahidi, I.; Ahmed, F.; Islam, M.S.; Islam, M.R.; Hafez, M. Integrating a hybrid machine learning model with climate projections for landslide susceptibility assessment. Results Eng. 2025, 28, 108067. [Google Scholar] [CrossRef] [Scilit]
- Zhang, X.; Duan, X.; Khalil, U.; Muhammadi, M.A.; Elmannai, H.; Algarni, A.D.; Kucher, D.E. Multi-sensor deep learning approach for landslide susceptibility mapping under climate and anthropogenic pressures. Phys. Chem. Earth 2026, 143, 104305. [Google Scholar] [CrossRef] [Scilit]
- Ma, S.; Shao, X.; Yuan, R.; Xu, C. Interpretable susceptibility assessment of coseismic landslides using a Superposable Neural Network. J. Rock Mech. Geotech. Eng. 2025, in press. [Google Scholar] [CrossRef] [Scilit]
- Fakana, S.T.; Falta, F.F.; Mano, M.M.; Bojago, E.; Gebremariam, M.S.; Fakana, M.M. Mapping landslide susceptibility in Wolaita Zone, Ethiopia, using geospatial techniques and multi-criteria decision-making analysis. J. Afr. Earth Sci. 2026, 235, 105991. [Google Scholar] [CrossRef] [Scilit]
- Pornbunyanon, T.; Jitpat, P.; Suwanno, P. Rainfall-conditioned landslide susceptibility mapping using an FR-CART hybrid framework in southern Thailand. Prog. Disaster Sci. 2026, 29, 100530. [Google Scholar] [CrossRef] [Scilit]
- Reichenbach, P.; Rossi, M.; Malamud, B.D.; Mihir, M.; Guzzetti, F. A review of statistically-based landslide susceptibility models. Earth-Sci. Rev. 2018, 180, 60–91. [Google Scholar] [CrossRef] [Scilit]
- Beguería, S. Validation and evaluation of predictive models in hazard assessment and risk management. Nat. Hazards 2006, 37, 315–329. [Google Scholar] [CrossRef] [Scilit]
- Brenning, A. Spatial prediction models for landslide hazards: Review, comparison and evaluation. Nat. Hazards Earth Syst. Sci. 2005, 5, 853–862. [Google Scholar] [CrossRef] [Scilit]
- Dwivedi, A.; Hegde, A. Hybrid approach for landslide susceptibility mapping and socio-economic landslide risk assessment in Meghalaya, India. Prog. Eng. Sci. 2026, 3, 100207. [Google Scholar] [CrossRef] [Scilit]
- Pramanik, M.; Hegde, A. Landslide susceptibility assessment of Western Ghats of Karnataka region in India: A case study of Ankola landslide. Geohazard Mech. 2026, 4, 55–66. [Google Scholar] [CrossRef] [Scilit]
- Miah, M.D.; Subaha, S.; Ali, Y. Leveraging remote sensing data with AHP and geospatial analysis for landslide susceptibility hotspot assessment in Bandarban of Bangladesh. Geohazard Mech. 2025, 3, 272–285. [Google Scholar] [CrossRef] [Scilit]
- Zhao, H.; Xu, Q.; Chen, W.; Xu, F.; Peng, D.; Pu, C.; Liu, R.; Shen, Y. Improving rainfall-triggered landslide susceptibility mapping through source-area boundary sampling and multi-dimensional feature analysis. Gondwana Res. 2026, 153, 265–283. [Google Scholar] [CrossRef] [Scilit]
- Zhang, X.Y.; Zhang, C.S.; Meng, H.J.; Wang, P.; Li, H.B. Landslide susceptibility assessment of new Jing-Zhang high-speed railway based on GIS and information value model. J. Geomech. 2018, 24, 96–105. (In Chinese) [Google Scholar] [CrossRef]
- Delchiaro, M.; Rouhi, J.; Valiante, M.; Della Seta, M.; Esposito, C.; Martino, S. Bivariate landslide susceptibility analysis in the Lorestan Arc (Zagros Mountains, Iran). Ital. J. Eng. Geol. Environ. 2021, 1, 53–66. [Google Scholar] [CrossRef]
- Huang, F.; Xiong, H.; Yao, C.; Catani, F.; Zhou, C.; Huang, J. Uncertainties of landslide susceptibility prediction considering different landslide types. J. Rock Mech. Geotech. Eng. 2023, 15, 2954–2972. [Google Scholar] [CrossRef] [Scilit]
- Martinello, C.; Delchiaro, M.; Iacobucci, G.; Cappadonia, C.; Rotigliano, E.; Piacentini, D. Exploring the geomorphological adequacy of the landslide susceptibility maps: A test for different types of landslides in the Bidente river basin (northern Italy). Catena 2024, 238, 107835. [Google Scholar] [CrossRef] [Scilit]
- GB 18306-2015; Seismic Ground Motion Parameters Zonation Map of China. China Standards Press: Beijing, China, 2015.
- Saleem, N.; Huq, M.E.; Twumasi, N.Y.D.; Javed, A.; Sajjad, A. Parameters derived from and/or used with digital elevation models (DEMs) for landslide susceptibility mapping and landslide risk assessment: A review. ISPRS Int. J. Geo-Inf. 2019, 8, 545. [Google Scholar] [CrossRef] [Scilit]
- Chalkias, C.; Ferentinou, M.; Polykretis, C. GIS-supported landslide susceptibility modeling at regional scale: An expert-based fuzzy weighting method. ISPRS Int. J. Geo-Inf. 2014, 3, 523–539. [Google Scholar] [CrossRef] [Scilit]
- Peng, T.; Xu, C.; Ma, S.; Niu, R.; Zhuang, J. Landslide susceptibility modeling using remote sensing data and a coupled information value-machine learning framework. Remote Sens. 2022, 14, 4803. [Google Scholar] [CrossRef] [Scilit]
- Zhang, G.; Liu, Y.; Chen, Z.; Xu, Z.; Yuan, Y.; Wang, S.; Lian, W.; Xu, H.; Ding, Z.; Wang, R. Production and analysis of a landslide susceptibility map based on multiple environmental factors. Remote Sens. 2025, 17, 1615. [Google Scholar] [CrossRef] [Scilit]
- Ratzmann, G.; Gangkofner, U.; Tietjen, B.; Fensholt, R. Dryland vegetation functional response to altered rainfall amounts and variability derived from satellite time series data. Remote Sens. 2016, 8, 1026. [Google Scholar] [CrossRef] [Scilit]
- Singh, L.P.; van Westen, C.J.; Champati Ray, P.K.; Pasquali, P. Accuracy assessment of InSAR derived input maps for landslide susceptibility analysis: A case study from the Swiss Alps. Landslides 2005, 2, 221–228. [Google Scholar] [CrossRef] [Scilit]
- Casagli, N.; Frodella, W.; Morelli, S.; Tofani, V.; Ciampalini, A.; Intrieri, E.; Raspini, F.; Rossi, G.; Tanteri, L.; Lu, P. Spaceborne, UAV and ground-based remote sensing techniques for landslide mapping, monitoring and early warning. Geoenviron. Disasters 2017, 4, 9. [Google Scholar] [CrossRef] [Scilit]
- Wang, S.; Deng, J.; Lu, X.; Song, Z.; Xu, Y. A new GNSS single-epoch ambiguity resolution method based on triple-frequency signals. ISPRS Int. J. Geo-Inf. 2017, 6, 46. [Google Scholar] [CrossRef] [Scilit]
- Antolinos, E.; García-Rial, F.; Hernández, C.; Montesano, D.; Godino-Llorente, J.I.; Grajal, J. Cardiopulmonary activity monitoring using millimeter wave radars. Remote Sens. 2020, 12, 2265. [Google Scholar] [CrossRef] [Scilit]
- Belgiu, M.; Drăguţ, L. Random forest in remote sensing: A review of applications and future directions. ISPRS J. Photogramm. Remote Sens. 2016, 114, 24–31. [Google Scholar] [CrossRef] [Scilit]
- Mountrakis, G.; Im, J.; Ogole, C. Support vector machines in remote sensing: A review. ISPRS J. Photogramm. Remote Sens. 2011, 66, 247–259. [Google Scholar] [CrossRef] [Scilit]
- Li, Z.; Perera, S.; Zhang, Y.; Zhang, G.; Doviak, R. Phased-array radar system simulator (PASIM): Development and simulation result assessment. Remote Sens. 2019, 11, 422. [Google Scholar] [CrossRef] [Scilit]
- Tucker, C.J. Red and photographic infrared linear combinations for monitoring vegetation. Remote Sens. Environ. 1979, 8, 127–150. [Google Scholar] [CrossRef] [Scilit]
- Huete, A.R. A soil-adjusted vegetation index (SAVI). Remote Sens. Environ. 1988, 25, 295–309. [Google Scholar] [CrossRef] [Scilit]
- Friedl, M.A.; McIver, D.K.; Hodges, J.C.F.; Zhang, X.Y.; Muchoney, D.; Strahler, A.H.; Woodcock, C.E.; Gopal, S.; Schneider, A.; Cooper, A.; et al. Global land cover mapping from MODIS: Algorithms and early results. Remote Sens. Environ. 2002, 83, 287–302. [Google Scholar] [CrossRef] [Scilit]
- Gao, B.-C. NDWI-a normalized difference water index for remote sensing of vegetation liquid water from space. Remote Sens. Environ. 1996, 58, 257–266. [Google Scholar] [CrossRef] [Scilit]
- Gao, F.; Masek, J.G.; Schwaller, M.R.; Hall, F.G. On the blending of the Landsat and MODIS surface reflectance: Predicting daily Landsat surface reflectance. IEEE Trans. Geosci. Remote Sens. 2006, 44, 2207–2218. [Google Scholar] [CrossRef] [Scilit]

Disclaimer/Publisher’s Note: The statements, opinions and data contained in all publications are solely those of the individual author(s) and contributor(s) and not of MDPI and/or the editor(s). MDPI and/or the editor(s) disclaim responsibility for any injury to people or property resulting from any ideas, methods, instructions or products referred to in the content. |
© 2026 by the authors. Licensee MDPI, Basel, Switzerland. This article is an open access article distributed under the terms and conditions of the Creative Commons Attribution (CC BY) license.