


Abstract
Reliable field estimation of near-surface soil hydraulic parameters remains challenging, particularly in heterogeneous or stony soil environments. Conventional drip infiltrometers (DI) are widely used, but their field deployment may limit mobility and testing efficiency. This study presents a portable drip infiltrometer (PDI) methodology that enhances field applicability while reducing testing time without compromising parameter robustness. The approach enables estimation of saturated hydraulic conductivity (Ks), effective net capillary drive (G), and sorptivity (S) by integrating image-based analysis of ponded surface areas using the Portable Drip Infiltrometer Software (PDIS v1.5) with linear and non-linear infiltration formulations optimized through evolutionary algorithms. A total of 34 PDI field tests were conducted across two Mexican regions with contrasting climatic and soil conditions. In semi-arid environments, Ks ranged from 1.07 to 12.82 mm h−1 and G from 89.1 to 1999.99 mm, whereas in semi-warm sub-humid settings, Ks ranged from 30.68 to 117.68 mm h−1 and G from 2.65 to 121.64 mm. Results indicate that linear formulations perform adequately under relatively homogeneous conditions, while non-linear PDI formulations become necessary as surface structural complexity increases. The PDI–PDIS framework provides a rapid, repeatable, and physically grounded tool for parameterizing near-surface hydraulic processes in heterogeneous soils.
1. Introduction
Soil hydraulic parameters are fundamental descriptors of soil-water interactions and control key hydrological processes, such as infiltration, redistribution, runoff generation, and erosion [1,2]. Parameters such as saturated hydraulic conductivity (Ks), effective net capillary drive (G), and sorptivity (S) are widely used in agronomy, environmental sciences, and hydrology to support irrigation design, soil conservation planning, and hydrological modeling. Under climate change scenarios, accurate near-surface hydraulic characterization has become increasingly crucial for runoff prediction, flood hazard assessment, and early warning systems associated with extreme precipitation events [3,4]
Despite their relevance, reliable field estimation of soil hydraulic parameters remains challenging, particularly in heterogeneous environments characterized by shallow soils, surface crusts, stoniness, vegetation cover, or pronounced macroporosity. Direct field measurement techniques are often time-consuming and may significantly disturb the soil surface [5,6]. Methods such as lysimeters, rainfall simulators, and ring infiltrometers can alter soil structure, induce compaction or fissuring, and modify surface conditions during installation or operation [7].
These disturbances compromise the representativeness of measurements and limit test repeatability at the same location. Rainfall simulators, for example, may promote surface sealing and erosion due to drop impact energy, while ring infiltrometers can disrupt soil continuity during insertion, especially in fragile or structured soils [8,9,10,11]. Consequently, the measured hydraulic response may deviate from natural infiltration behavior [12,13].
To overcome these limitations, indirect estimation approaches such as pedotransfer functions (PTFs), statistical models, and machine-learning techniques have been widely adopted. These methods allow rapid estimation of hydraulic properties from easily measurable soil attributes and large datasets. However, their reliability depends strongly on the availability of representative calibration data and their applicability at the local scale.
When generalized or regional datasets are used, indirect approaches may yield inconsistent estimates for the same site, particularly in heterogeneous landscapes. Consequently, periodic validation of indirectly estimated hydraulic parameters using field-based measurements has been strongly recommended [14]. Scale effects and soil structural heterogeneity further complicate the transferability of these methods across spatial scales, reinforcing the need for local calibration.
Drip infiltration (DI) methods, derived from point-source infiltration theory and Wooding’s analytical solution, provide a practical compromise between field applicability and physical rigor [5,15,16]. These methods have been successfully applied in irrigation research and in the development of infiltration theory [17,18,19].
However, their practical implementation remains limited in soils with complex surface conditions, such as crusted, cracked, stony, vegetated, or sloping soils [20,21,22,23]. A critical limitation of conventional DI applications is the long time required to reach steady-state conditions and the difficulty of accurately measuring ponded areas under complex field conditions [24]. These constraints often hinder reliable parameter estimation when preferential flow paths or surface heterogeneities interrupt pond development.
To address these limitations, this study proposes a Portable Drip Infiltrometer (PDI) methodology derived from classical drip infiltration theory and Wooding’s solutions [15,24]. The PDI introduces an innovative data measurement and interpretation framework that significantly reduces testing time while preserving the non-invasive nature of drip infiltration experiments.
As in conventional DI approaches, the PDI assumes that water applied at constant discharge rates forms ponded areas on an effectively unbounded shallow soil surface. During the initial stage, the applied discharge exceeds the soil infiltration capacity, allowing the pond to expand. As infiltration increases, discharge and infiltration rates equilibrate, leading to steady-state conditions and stabilization of the ponded area. Under these conditions, hydraulic parameters can be derived from the ponded area (A), its equivalent circular radius (rs) and inverse (1/rs), the applied flow density (q), and the time required to approach steady state for each discharge rate (Figure 1), following the methodology proposed by Borselli et al. [24].
Figure 1.
A steady-state pond was created during an infiltration test with cracks, macropores, gravel content, and ground cover.
Specialized Portable Drip Infiltrometer Software (PDIS v1.5), developed in MATLAB 8.4 (R2014b, MathWorks, Natick, MA, USA), was implemented to quantify ponded areas using color segmentation and active contour techniques, and a dedicated Microsoft Excel template was implemented to optimize parameters and derive soil hydraulic properties. The proposed methodology is grounded in physically based modeling and deterministic optimization for hydraulic parameter estimation, aiming to ensure field applicability and minimize experimental disturbance.
The experimental design represents a monotonic wetting process from relatively dry initial conditions and does not explicitly account for soil water hysteresis or wetting–drying cycles. This simplification is intentional and supports the objective of reducing experimental duration and operational complexity while preserving robust parameter estimation under transient infiltration conditions.
By reducing experimental time while preserving physical consistency, the proposed PDI methodology expands the applicability of drip infiltration techniques to complex soil surfaces where conventional approaches are often impractical. This contribution is particularly relevant for hydrological modeling, erosion assessment, and process-based studies in heterogeneous and structurally complex environments.
The proposed approach integrates image-based quantification of ponded areas, physically based infiltration modeling, and deterministic optimization techniques to estimate saturated hydraulic conductivity (Ks), effective net capillary drive (G), and sorptivity (S), even when steady-state conditions are not fully achieved in the field.
The methodology is explicitly designed for soils with complex surface characteristics, including cracks, macropores, crusted layers, stoniness, vegetation cover, and volcanic substrates—factors known to strongly influence infiltration processes and limit the applicability of conventional field methods [22,23,25,26,27]. By combining portable instrumentation, image-based measurements, and non-linear optimization, the proposed PDI framework provides robust hydraulic parameter estimates suitable for hydrological model parameterization and comparative field studies across contrasting environmental conditions.
The main objectives of this work are to: (i) present the theoretical framework supporting the proposed PDI methodology; (ii) describe its field implementation using portable instrumentation and image-based measurements; (iii) introduce an efficient data-processing workflow for estimating steady-state ponded areas under transient in-filtration conditions; and (iv) demonstrate the applicability of the proposed approach across contrasting soil textures and environmental settings. The theoretical framework is presented in Section 2, followed by the experimental implementation and data-processing workflow in Section 3.
2. Theory
Wooding [15] developed a theoretical framework to describe steady-state flow from a shallow circular pond infiltrating into a semi-infinite porous medium. Under steady-state conditions, the discharge per unit area, q, can be expressed as follows, using the model structure later formalized by Ekhmaj and Abdulaziz [5], as shown in Equation (1).
In this formulation, Q represents the discharge velocity from the source (mm3 h−1), Ks is the saturated hydraulic conductivity (mm h−1), rs is the radius of the saturated area at steady state (mm), and α is a soil-dependent parameter related to capillary absorption and its attenuation within the conductivity matrix (mm−1).
This model structure has been widely adopted in infiltration and irrigation studies due to its physical consistency and practical applicability [17,19,28]. Philip [29] proposed linearizing Wooding’s solution by expressing a linear relationship between the steady-state discharge per unit area (q) and the inverse of the ponded radius (1/rs) in millimeters (mm). This formulation is mathematically equivalent to the diffusion of water in a moving medium and is given by Equation (2).
Following Ekhmaj and Abdulaziz [5], the coefficients of the linear regression are defined as:
where a represents the intercept and b the slope of the linear regression obtained from experimental data pairs of q and 1/rs measured at steady state, under this framework, the saturated hydraulic conductivity is directly obtained as Ks = a, while the parameter α, which quantifies the relative contribution of capillary and gravitational forces, can be estimated using Equation (5) as follows Ekhmaj and Abdulaziz [5]:
The portable drip infiltrometer (PDI) model represents a modification of the original Wooding formulation by incorporating the effective net capillary drive, G [30,31,32], and sorptivity, S [29], and by replacing the parameter α accordingly. This leads to the non-linear expression shown in Equation (6), following the formulation proposed by Borselli et al. [24]:
In this model, Ks denotes the saturated hydraulic conductivity (mm h−1), G the effective net capillary drive (mm), and rs the estimated radius of the ponded area at steady state (mm).
For both PDI formulations—the linear model of Ekhmaj and Abdulaziz [5] and the non-linear model of Borselli et al. [24]. The parameters α and G are related through the equivalence expressed in Equation (7), whose complete derivation is provided in Appendix A:
Using this equivalence, the regression coefficients a and b in Equations (2) and (3) can be transformed as follows:
These expressions can be rearranged to solve explicitly for G, yielding Equation (10), which allows the estimation of the effective net capillary drive from linear regression results obtained from experimental (q, 1/rs) data pairs:
Although Equations (8)–(10) allow Equation (6) to be solved using a linear approach, this study explores a more direct estimation strategy. Specifically, the experimental data are fitted directly to the non-linear formulation of Equation (6), and the resulting fit is subsequently approximated by a linear representation. The non-linear fitting procedure is implemented using evolutionary optimization algorithms available in the Solver tool of Microsoft Office Excel.
A critical aspect of the drip infiltration experiment is that the ponded area increases with time until a steady state is reached. Continuous monitoring of the ponded area is therefore required. To address this, an asymptotic model describing the temporal evolution of the ponded area is introduced in Equation (11):
In this expression, Ac is the observed ponded area (mm2) at time t (h), A is the final asymptotic ponded area at infinite time (mm2), B represents the difference between the initial observed area and the asymptotic value (AO, mm2), and C is a curvature coefficient controlling the rate at which the steady state is approached (usually in the range of [0.01, +ꝏ]).
The use of Equation (11) enables the estimation of steady-state ponded area within a practical testing duration. Under the experimental conditions described in the following section, a duration of approximately 30 min per discharge rate was sufficient to obtain reliable estimates of the asymptotic area and its equivalent circular radius.
The implementation of Equation (11) constitutes one of the most innovative aspects of the proposed PDI procedure, as it allows the steady-state ponding area to be inferred without requiring full stabilization of the infiltration process. This approach is central to the data-processing workflow and motivated the development of the dedicated software PDIS v1.5 described in the subsequent section.
To complete the hydraulic characterization, sorptivity S must also be considered, as it governs water movement during the early stages of infiltration [15,29]. Sorptivity (mm h−1/2) is related to other fundamental soil hydraulic parameters [33] as expressed in Equation (12).
Here, Δθ represents the differential soil moisture content, which is measured using a time-domain reflectometer (TDR) [34,35] and computed as:
where θinitial and θfinal correspond to the volumetric soil moisture content measured before and after the infiltration test, respectively.
Finally, following Smith [31], the effective net capillary drive G and the initial moisture deficit are linked to the suction factor Sf, a key parameter in the Green and Ampt [16] infiltration model, as defined in Equation (14).
The suction factor Sf remains a critical parameter in many hydrological and geotechnical applications [16], including slope stability assessment and landslide susceptibility analysis, as exemplified by recent applications such as Hu et al. [18].
3. Materials and Methods
3.1. Study Sites
The proposed Portable Drip Infiltrometer (PDI) methodology was evaluated at two contrasting study sites in México, selected to represent different climatic, geomorphological, and edaphic conditions (Figure 2).
Figure 2.
Location of the study zones. Two different sites were selected for field experiments. The first site (A) was located in northern México, west of the city of San Luis Potosí, in an arid environment on volcanic soils. The second site (B) was near the Fuego de Colima volcano in western México. This site is located in a temperate climate with persistent volcanic activity.
Site A is located in central–northern México, within the Sierra de San Miguelito, south of the city of San Luis Potosí (22°04′9.78″–22°12′36.84″ N; 100°58′8.31″–101°06′45.61″ W). The region is characterized by a semi-arid temperate climate, with mean annual temperatures ranging from 12 to 18 °C and average annual precipitation of approximately 350 mm, concentrated in short-duration, high-intensity summer rainfall events [36]. The geological substrate consists of an inactive volcanic complex composed of ignimbrites and lava flows of Early to Late Oligocene age, located in the Sierra Madre Occidental [37]. Soils are shallow, poorly developed (Figure 3a), and rich in coarse fragments, classified as Leptosols according to the WRB classification [38], with frequent calcium carbonate accumulations and surface silt crusts that limit vertical percolation and promote runoff generation [39,40] (Figure 3b).
Figure 3.
Representative soil surface conditions at the study areas where PDI experiments were conducted. Site A, Sierra de San Miguelito (San Luis Potosí, S.L.P., México): (a) weakly developed soil surface; (b) dispersed silt crusts observed at the experimental plot (PPR-07/PPR-13). Site B, the Fuego de Colima volcano (La Lumbre ravine): (c) poorly consolidated soils in the surrounding areas (LL-03); (d) vegetation communities recurrently affected by volcanic activity (LL-02).
Site B is located on the southern flank of the Colima volcanic complex in western México (19°30′44.8″ N; 103°37′01.6″ W), within the Trans-Mexican Volcanic Belt. The area exhibits a semi-warm subhumid climate, with mean annual temperatures between 18 and 22 °C and annual precipitation ranging from 1200 to 1500 mm [41,42]. The site lies within the collapse caldera of the Paleofuego volcano and is characterized by intense geomorphological activity driven by recurrent volcanic processes [43,44,45,46]. Soils are weakly developed Regosols formed on unconsolidated volcanic deposits [38] (Figure 3c). Field experiments were conducted along the La Lumbre ravine, a major drainage channel affected by debris flows and pyroclastic deposits [47,48], and by land use dominated by intensive agriculture (coffee, avocado, lime, and blackberry crops), which is recurrently affected by volcanic activity [49] (Figure 3d).
3.2. Field PDI Experiments
3.2.1. Experimental Considerations and Materials
Portable Drip Infiltrometer (PDI) experiments were conducted primarily during the dry season, when near-surface soil moisture was low, to characterize infiltration behavior under initial wetting conditions. Nevertheless, the methodology is applicable across a wide range of antecedent moisture states. Each experiment was assigned a unique identification code to ensure traceability across sites.
In each test, three to five constant water discharge rates were sequentially applied, each maintained for approximately 20–30 min or until the ponded area visually stabilized. Discharge rates were selected within the operational range of the peristaltic pumps, ranging from 1.56 to 12.03 L h−1, obtained by combining individual pump flows. Before field deployment, all pumps and pump combinations were volumetrically calibrated to ensure accurate and stable discharge rates.
The experimental setup included calibrated peristaltic pumps, a time-domain reflectometry (TDR) system for soil moisture measurements, a portable power generator, a GPS receiver, and a digital camera mounted on a tripod for image acquisition (Figure 4). Auxiliary equipment included rulers for spatial calibration, a chronometer for temporal reference, and water containers to maintain a constant hydraulic head. A complete list of materials and detailed experiment coding is provided in Supplementary Material Section S1.
Figure 4.
Materials used for the fieldwork.
3.2.2. Experimental Procedure
The PDI field experiment consists of a sequence of standardized phases designed to ensure repeatability and consistency across sites.
- Experiment site selection and setup. A test location with a smooth and continuous slope was selected and characterized using an inclinometer. Numerical rulers were positioned along the slope to define a reference XY plane for image analysis, and a digital camera mounted on a tripod was aligned parallel to the soil surface (Figure 5a).
- Initial soil moisture measurement. Initial volumetric soil moisture (θinitial) was measured using a TDR [34] device equipped with a 1.5-inch probe. Measurements were taken once stable readings were obtained, allowing characterization of near-surface soil moisture conditions (Figure 5b).
- Image acquisition setup. The camera was synchronized with a mobile application and configured to acquire images of the ponded area at 2-minute intervals throughout the experiment. The ruler and chronometer were included in the field of view to ensure spatial and temporal reference in all images (Figure 5d).
- Application of water discharge rates. The experiment started with a low discharge rate (1.56 L h−1). Subsequent discharge rates were applied sequentially to achieve intermediate (2.71 L h−1), high (7.76 L h−1), and combined (up to 12.03 L h−1) discharge rates. Each discharge rate was applied until the pond visually showed in-camera growth ceased and remained the same size across two or three pictures. Timing and image acquisition were initiated simultaneously with the onset of water release from the nozzle, and transitions between discharge rates were performed immediately after image acquisition to ensure continuous water application.
- Water supply control. A constant discharge was maintained by keeping the supply container at a nearly constant water level throughout the test. All pumps were calibrated before field deployment to ensure stable flow rates.
- Final soil moisture measurement. After completion of the infiltration sequence and once ponded water had thoroughly infiltrated, final volumetric soil moisture (θfinal) was measured using a TDR probe inserted within the infiltrated area, allowing measurements under near-saturated conditions (Figure 5c).
Figure 5.
Experimental fieldwork procedure: (a) Test procedure in field; (b) moisture volumetric content measured with TRD (θinitial) in the selected area under dry conditions; (c) moisture volumetric content measured with TDR (θfinal) under wet conditions (i.e., after the experiment is finished); (d) ponded areas in steady-state with respect to discharge of pump 1 (D1), discharge of pump 2 (D2), discharge of pump 3 (D3), and discharge of pumps 1 + 2 + 3 (D4).
The PDI test can be conducted on surfaces with rough microtopography, surface crusts, stoniness, vegetation cover, or macropores, without causing significant disturbance to the soil surface. This non-invasive character represents a key advantage over conventional infiltration methods, such as ring infiltrometers, which often alter soil structure and preclude repeated measurements at the same location.
3.3. Granulometric Analysis
Soil particle-size distribution was determined using the methodology proposed by Casabella-González [50] Covering the range from −4 to 4 Φ. Gravel (>4 mm), sand (4–0.063 mm), silt (0.063–0.002 mm), and clay (<0.002 mm) fractions were quantified by mechanical sieving using a Ro-Tap system. Fine particle fractions and soil textural class were determined using the Bouyoucos hydrometer method [51] based on sedimentation velocity following Stokes’ law.
3.4. Data Processing
3.4.1. Ponded Area Quantification
Photographs acquired at 2 min intervals during each infiltration test were processed to quantify the temporal evolution of ponded areas. Image analysis was performed using the PDIS module of the software PDI v1.5, which applies color-based segmentation and active contour techniques to distinguish saturated from non-saturated soil surfaces (Figure 6).
Figure 6.
Calculating ponded areas with the software PDIS v1.5: (a) Materials that all pictures must have; (b) mask of the pond used to calculate the ponded area; (c) ponded area obtained from the last picture taken (largest pond); and (d) database of calculated ponded areas for one velocity discharge.
For each experiment, the complete image sequence was imported into the software. A polygon delimiting the maximum ponded extent was manually defined, and the segmentation algorithm was subsequently applied to all images in the sequence. Each pixel was classified as binary (1 = saturated; 0 = dry), enabling automated computation of ponded surface areas. Spatial calibration was performed using reference rulers visible in each image, and temporal consistency was ensured using an in-frame chronometer.
The software PDIS v1.5 is freely available as open-source MATLAB code. A detailed description of the processing workflow is provided in Supplementary Material Section S2. The source code and its manual are available for download from the following open-access webpage: https://www.lorenzo-borselli.eu/pdis-software/index.html (accessed on 9 February 2026)
3.4.2. Linear and Non-Linear Modeling
A linear regression model was first applied to analyze the relationship between infiltration flux density (q) and the inverse of the equivalent ponded radius (1/rs), following the formulation of Philip [29] and Ekhmaj and Abdulaziz [5]. This linear approach provided a first-order estimate of saturated hydraulic conductivity (Ks) and served as a reference framework for subsequent analyses.
In soils where steady-state conditions were difficult to achieve due to surface crusts, cracks, macroporosity, stoniness, or vegetation cover, a non-linear PDI model based on the formulation of Borselli et al. [24] was applied. An asymptotic function describing the temporal evolution of ponded area was fitted to the observed data to estimate the theoretical steady-state ponded area under transient conditions.
To estimate steady-state ponded areas under transient infiltration conditions, an asymptotic function describing the temporal evolution of ponded area was fitted to the observed data. Model parameters were optimized using evolutionary algorithms, minimizing the normalized absolute residual error between observed and modeled ponded areas. The optimization was constrained within physically plausible ranges derived from experimental observations and methodological considerations, as summarized in Table 1.
Table 1.
Parameters and constraints used for asymptotic function optimization of ponded area evolution (Equation (11)). The parameter ranges were defined based on physical considerations, experimental observations of ponded-area development, and methodological constraints to ensure stable, physically meaningful optimization under transient infiltration conditions.
3.4.3. Two-Stage Optimization and Model Evaluation
A two-stage optimization strategy was adopted to ensure robust estimation of soil hydraulic parameters. In the first stage, an asymptotic function was optimized independently for each applied discharge rate to infer steady-state ponded areas from transient observations. In the second stage, global optimization was used to refine saturated hydraulic conductivity (Ks) and effective net capillary drive (G), ensuring internal consistency between the linear and non-linear model formulations. Sorptivity (S) was subsequently computed to complete the hydraulic characterization.
Parameter bounds for the global optimization were defined based on physically plausible ranges reported in the literature for natural soils, ensuring numerical stability and consistency across contrasting surface conditions. The optimization constraints adopted for this stage are summarized in Table 2.
Table 2.
Constraints used for global optimization of saturated hydraulic conductivity (Ks) and effective net capillary drive (G).
Model performance was assessed using goodness-of-fit metrics based on explained variance (R2) and normalized residual errors [54,55]. The coefficient of determination (R2) is reported exclusively for the linear model, as this formulation relies on regression-based assumptions linking the steady-state infiltration flux density (q) to the inverse of the equivalent ponded radius (1/rs).
In contrast, the non-linear PDI formulation is evaluated using optimization-based residual metrics rather than goodness-of-fit statistics; therefore, R2 is not applicable. Inferential statistical tests were not applied, as the study’s objective was deterministic model calibration and physically based estimation of soil hydraulic parameters. The optimized hydraulic parameters obtained using this integrated PDI framework constitute the basis for the analysis presented in the following section.
4. Results
A total of 34 PDI experiments were conducted across the two study sites; however, only four representative tests are presented in detail in the main manuscript. These experiments were deliberately selected to span a clear gradient of soil surface structure and infiltration behavior, from crusted, structurally complex surfaces to coarse-textured, weakly structured deposits. This selection allows a focused comparison of linear and non-linear PDI formulations under contrasting hydraulic regimes, while additional experiments, repetitions, and intermediate cases are provided in Supplementary Materials Sections S5–S7.
The hydraulic parameters derived from the integrated PDI framework are summarized in Table 3, including saturated hydraulic conductivity (Ks), effective net capillary drive (G), and sorptivity (S), together with the main surface characteristics influencing infiltration processes at each test site. A direct comparison between the linear infiltration model and the proposed PDI non-linear approach is presented in Table 4, highlighting differences in parameter estimation across contrasting surface and hydraulic conditions.
Table 3.
Summary of soil characteristics and hydraulic parameters obtained using the integrated PDI framework. The table reports saturated hydraulic conductivity (Ks), effective net capillary drive (G), and sorptivity (S), together with the main soil textural and surface characteristics influencing infiltration processes at each test site. The reported parameters represent effective near-surface hydraulic properties derived from the integrated linear and non-linear PDI analysis.
Table 4.
Comparison of hydraulic parameters obtained using the linear infiltration model and the proposed non-linear PDI approach.
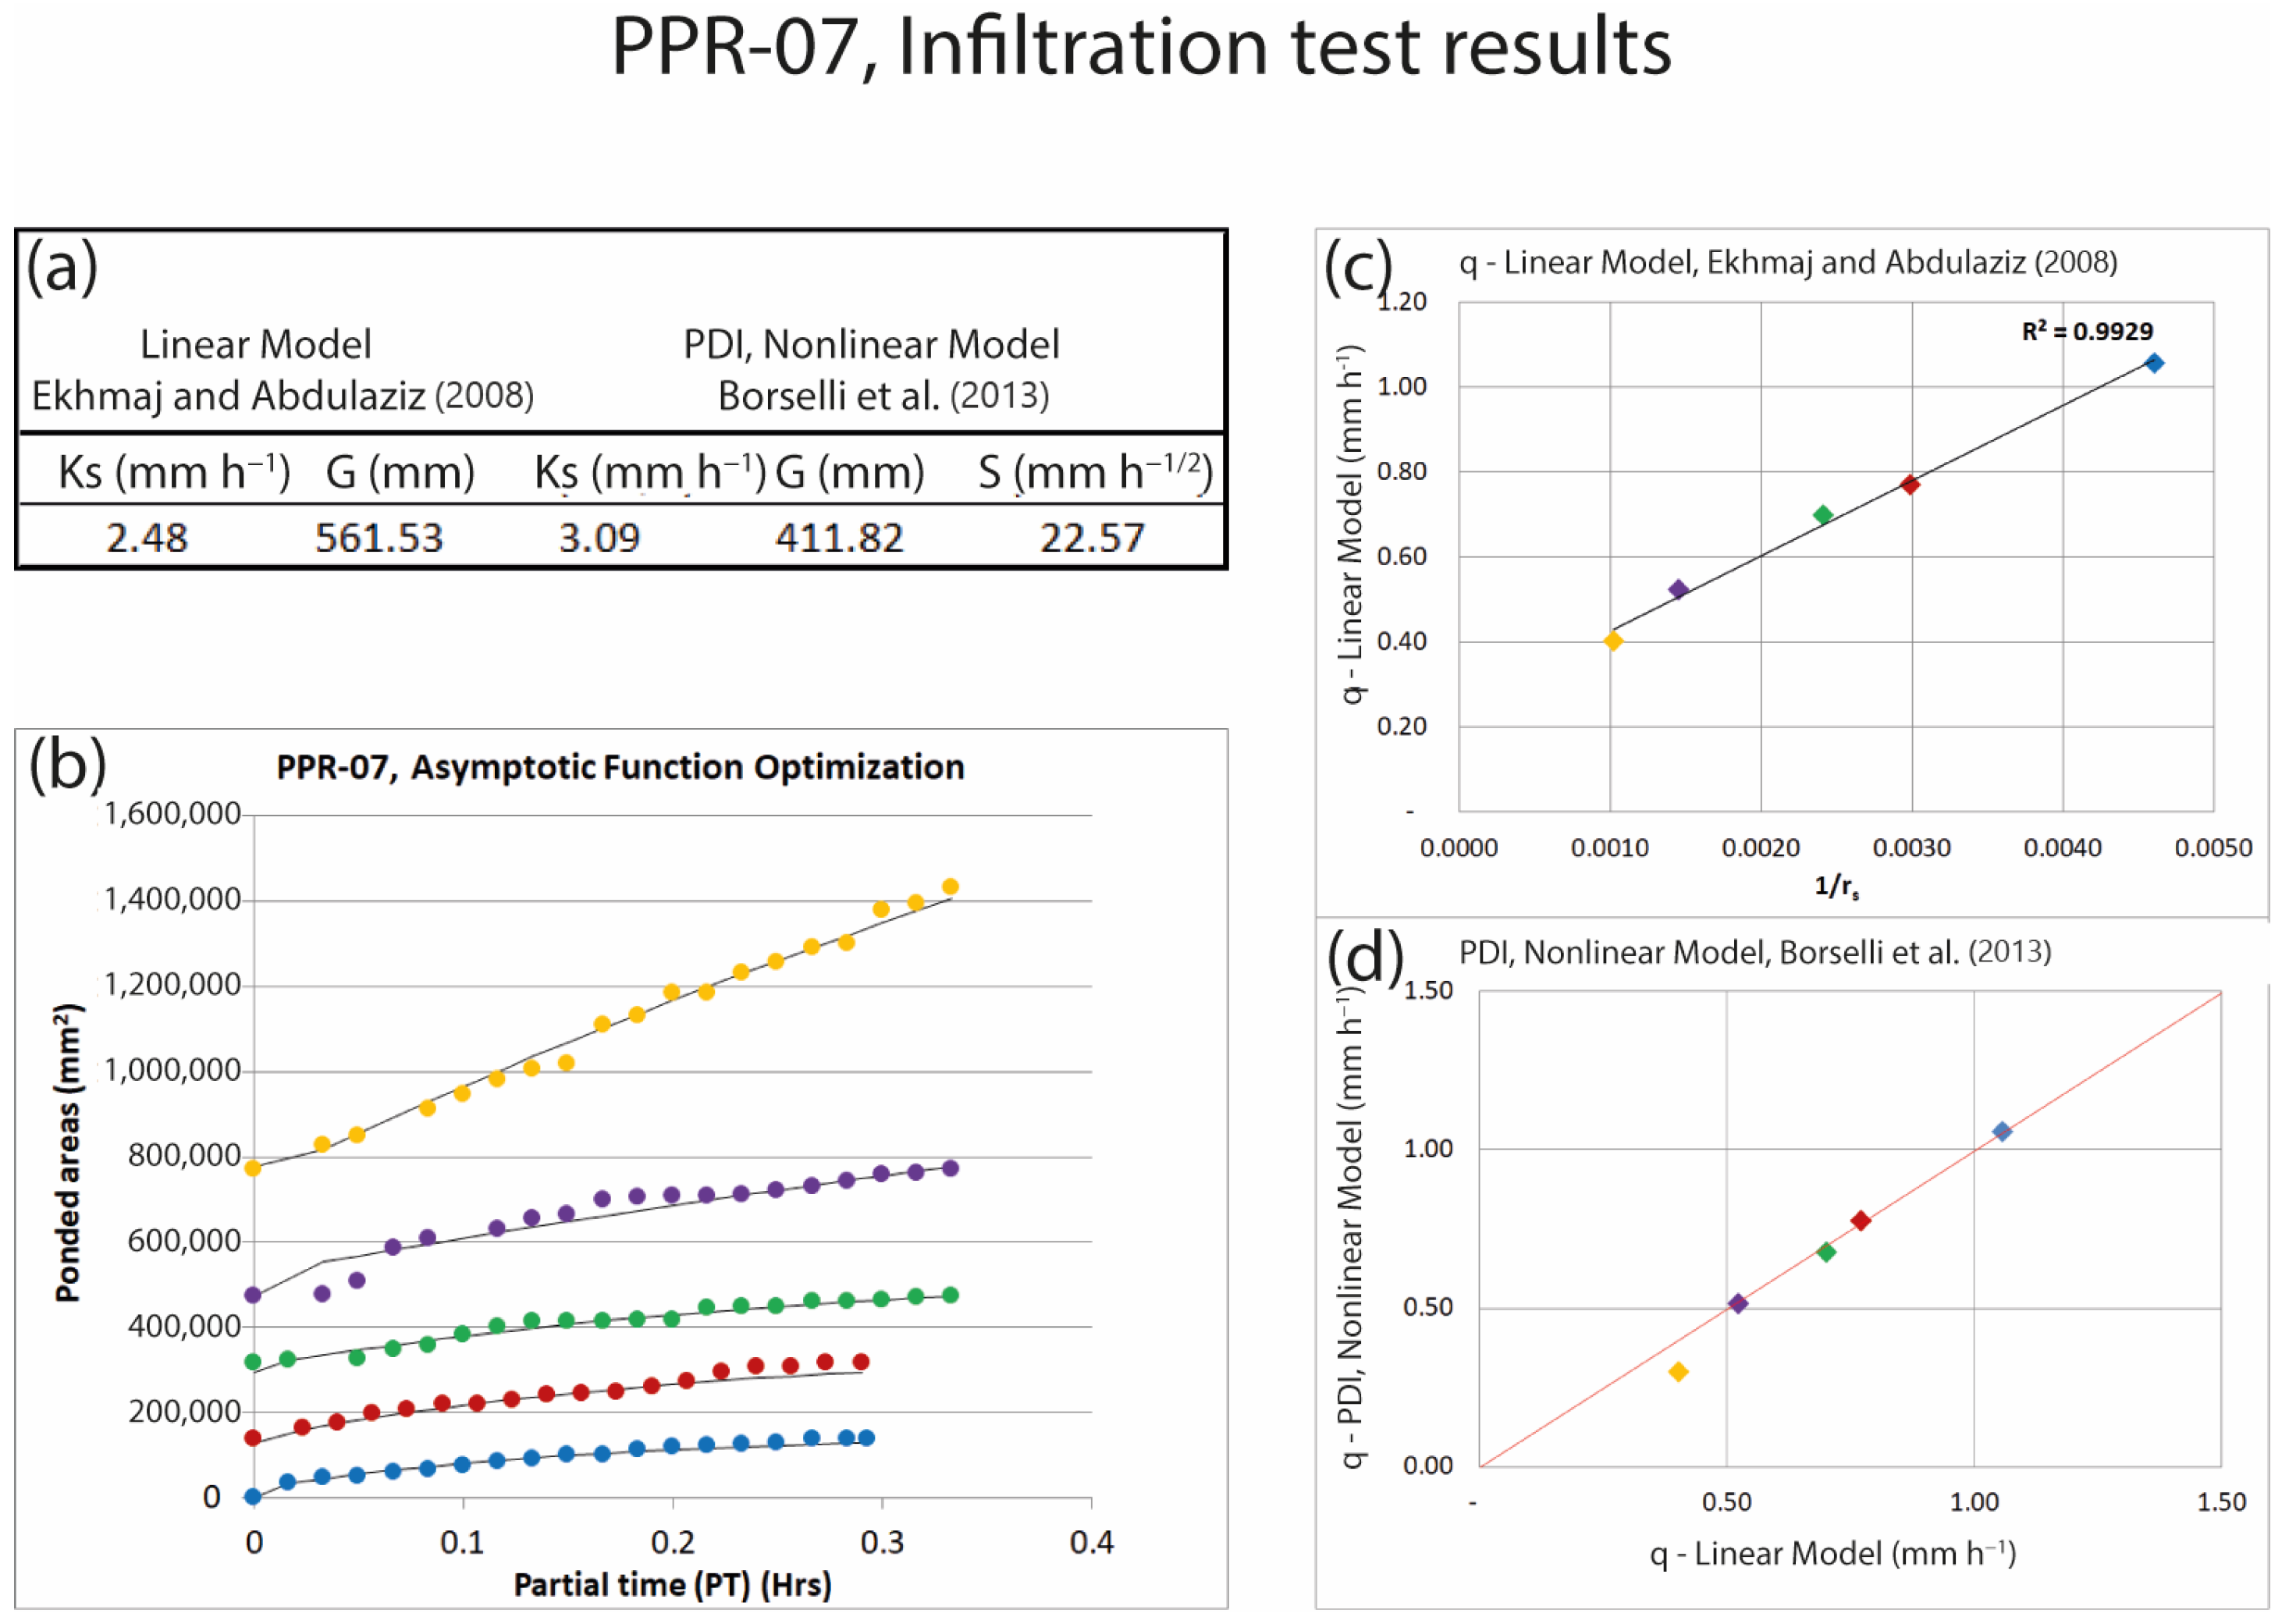
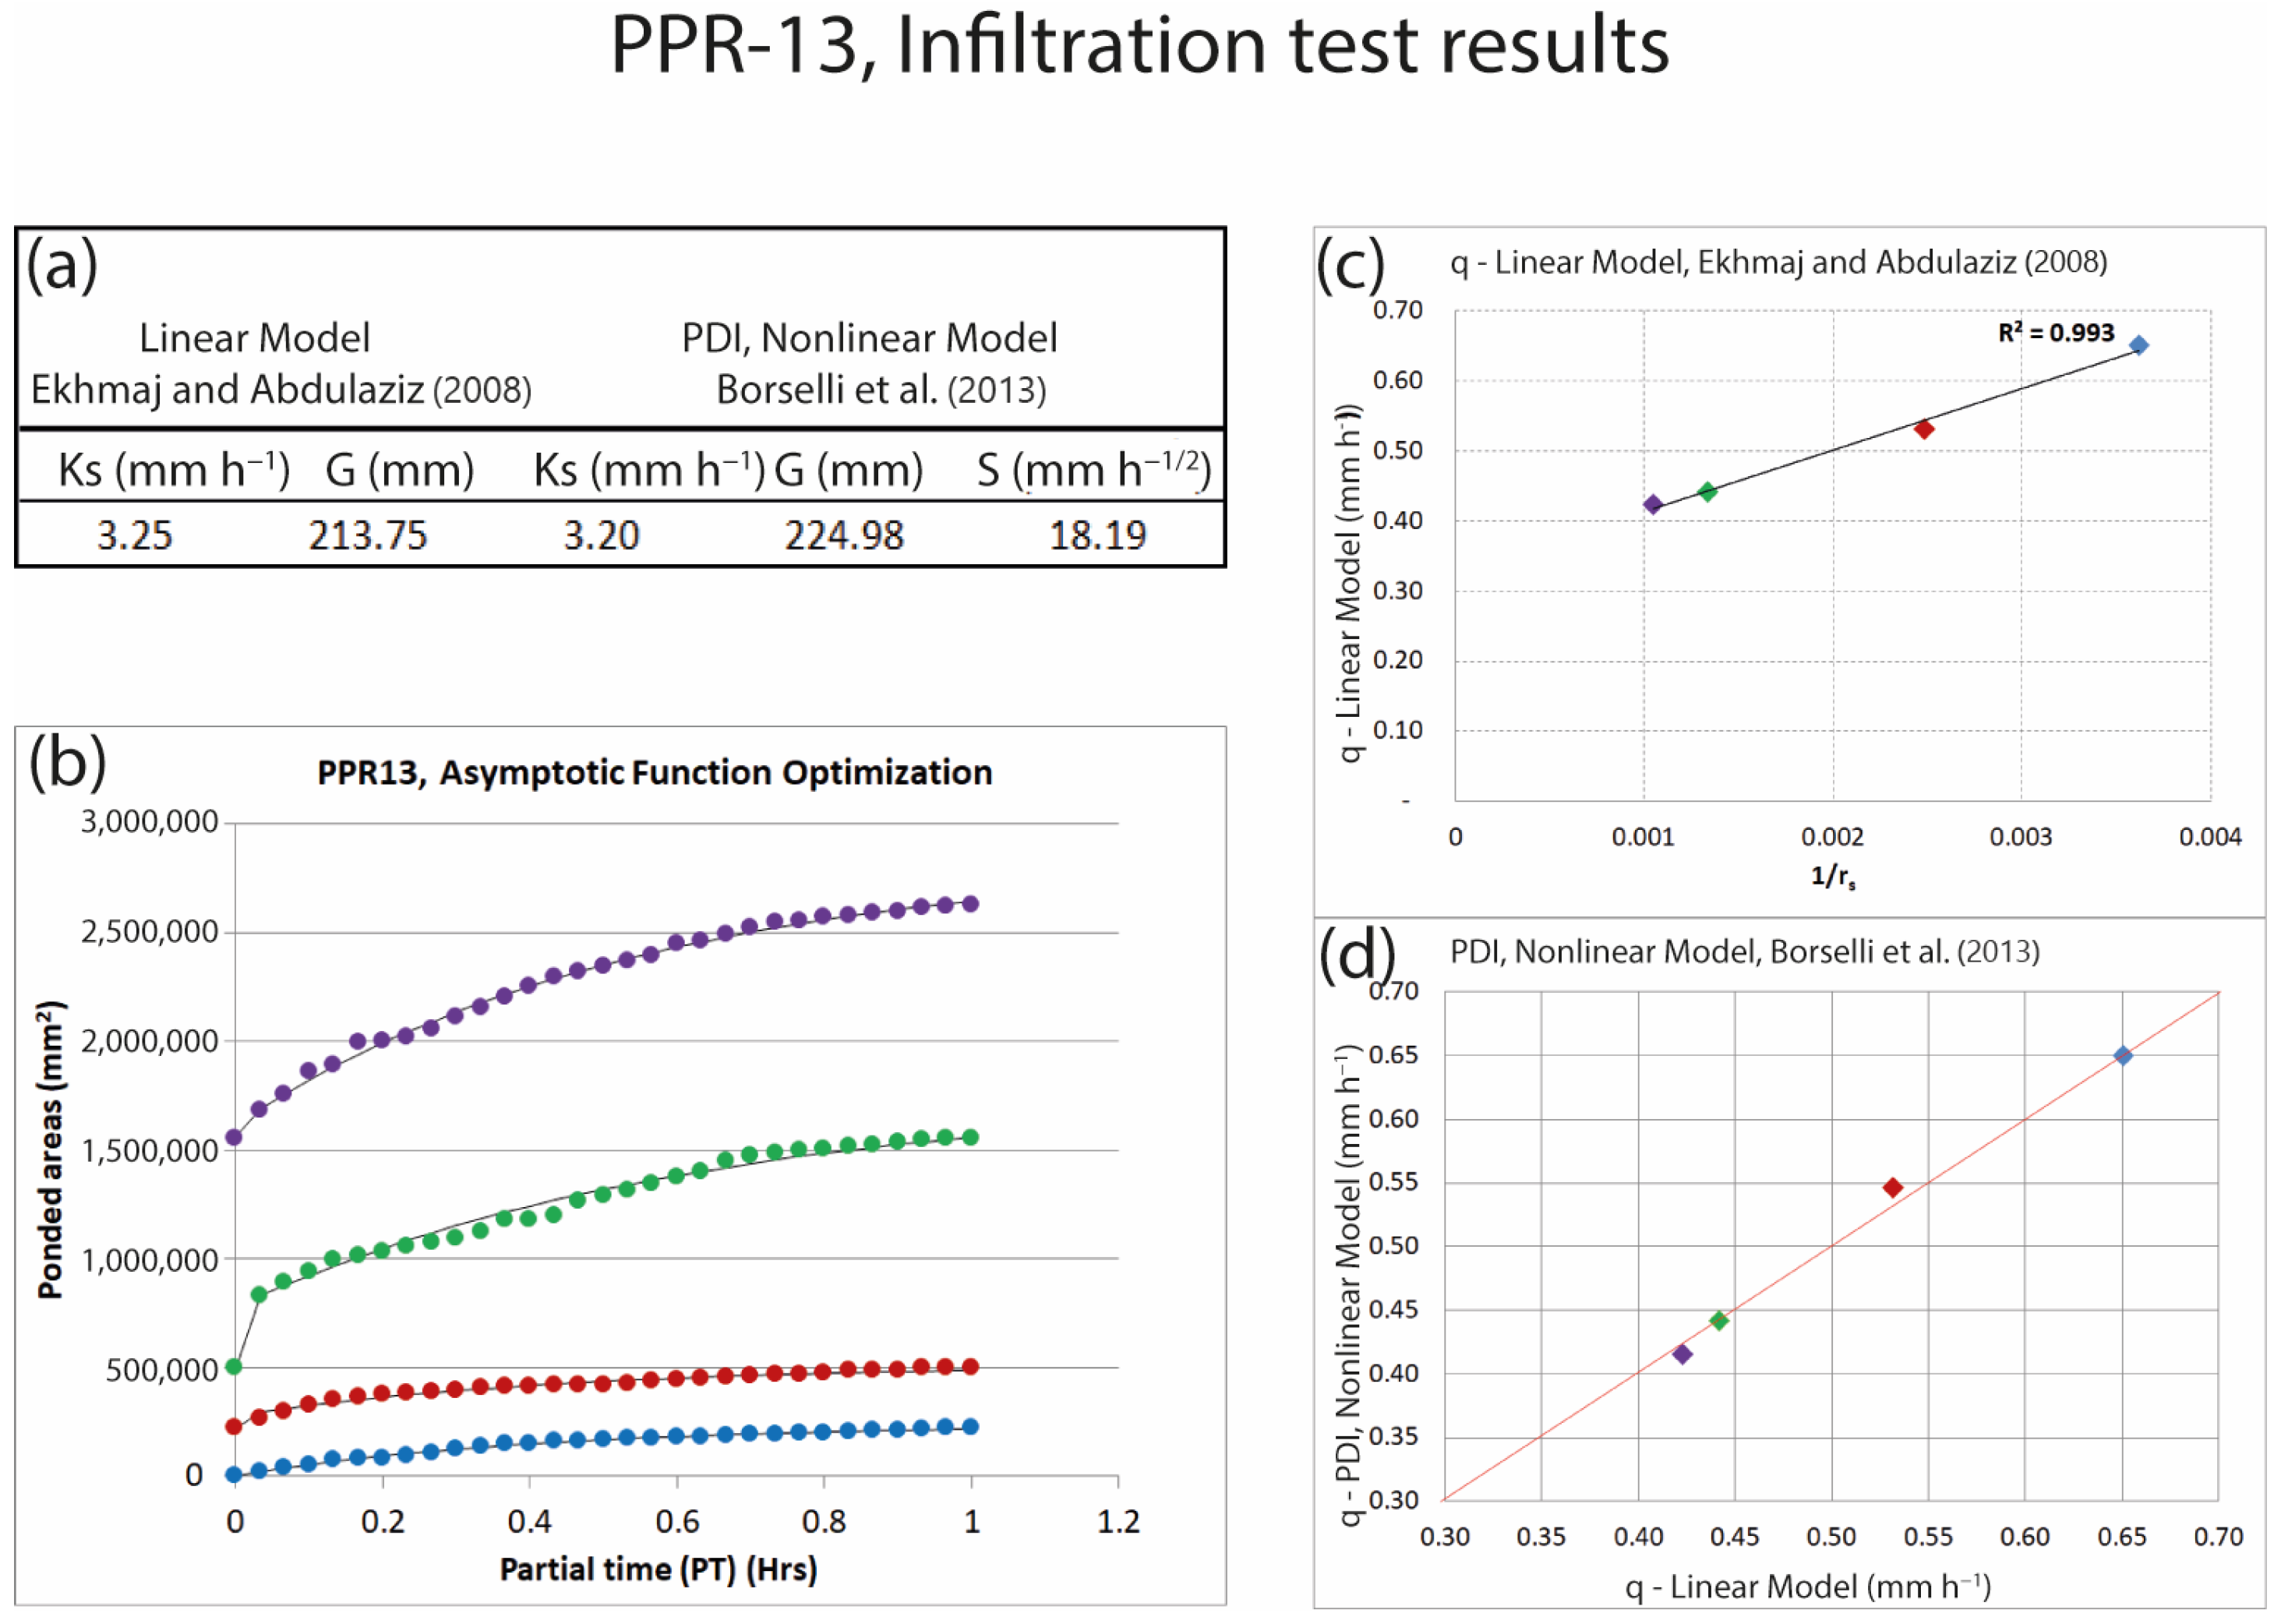
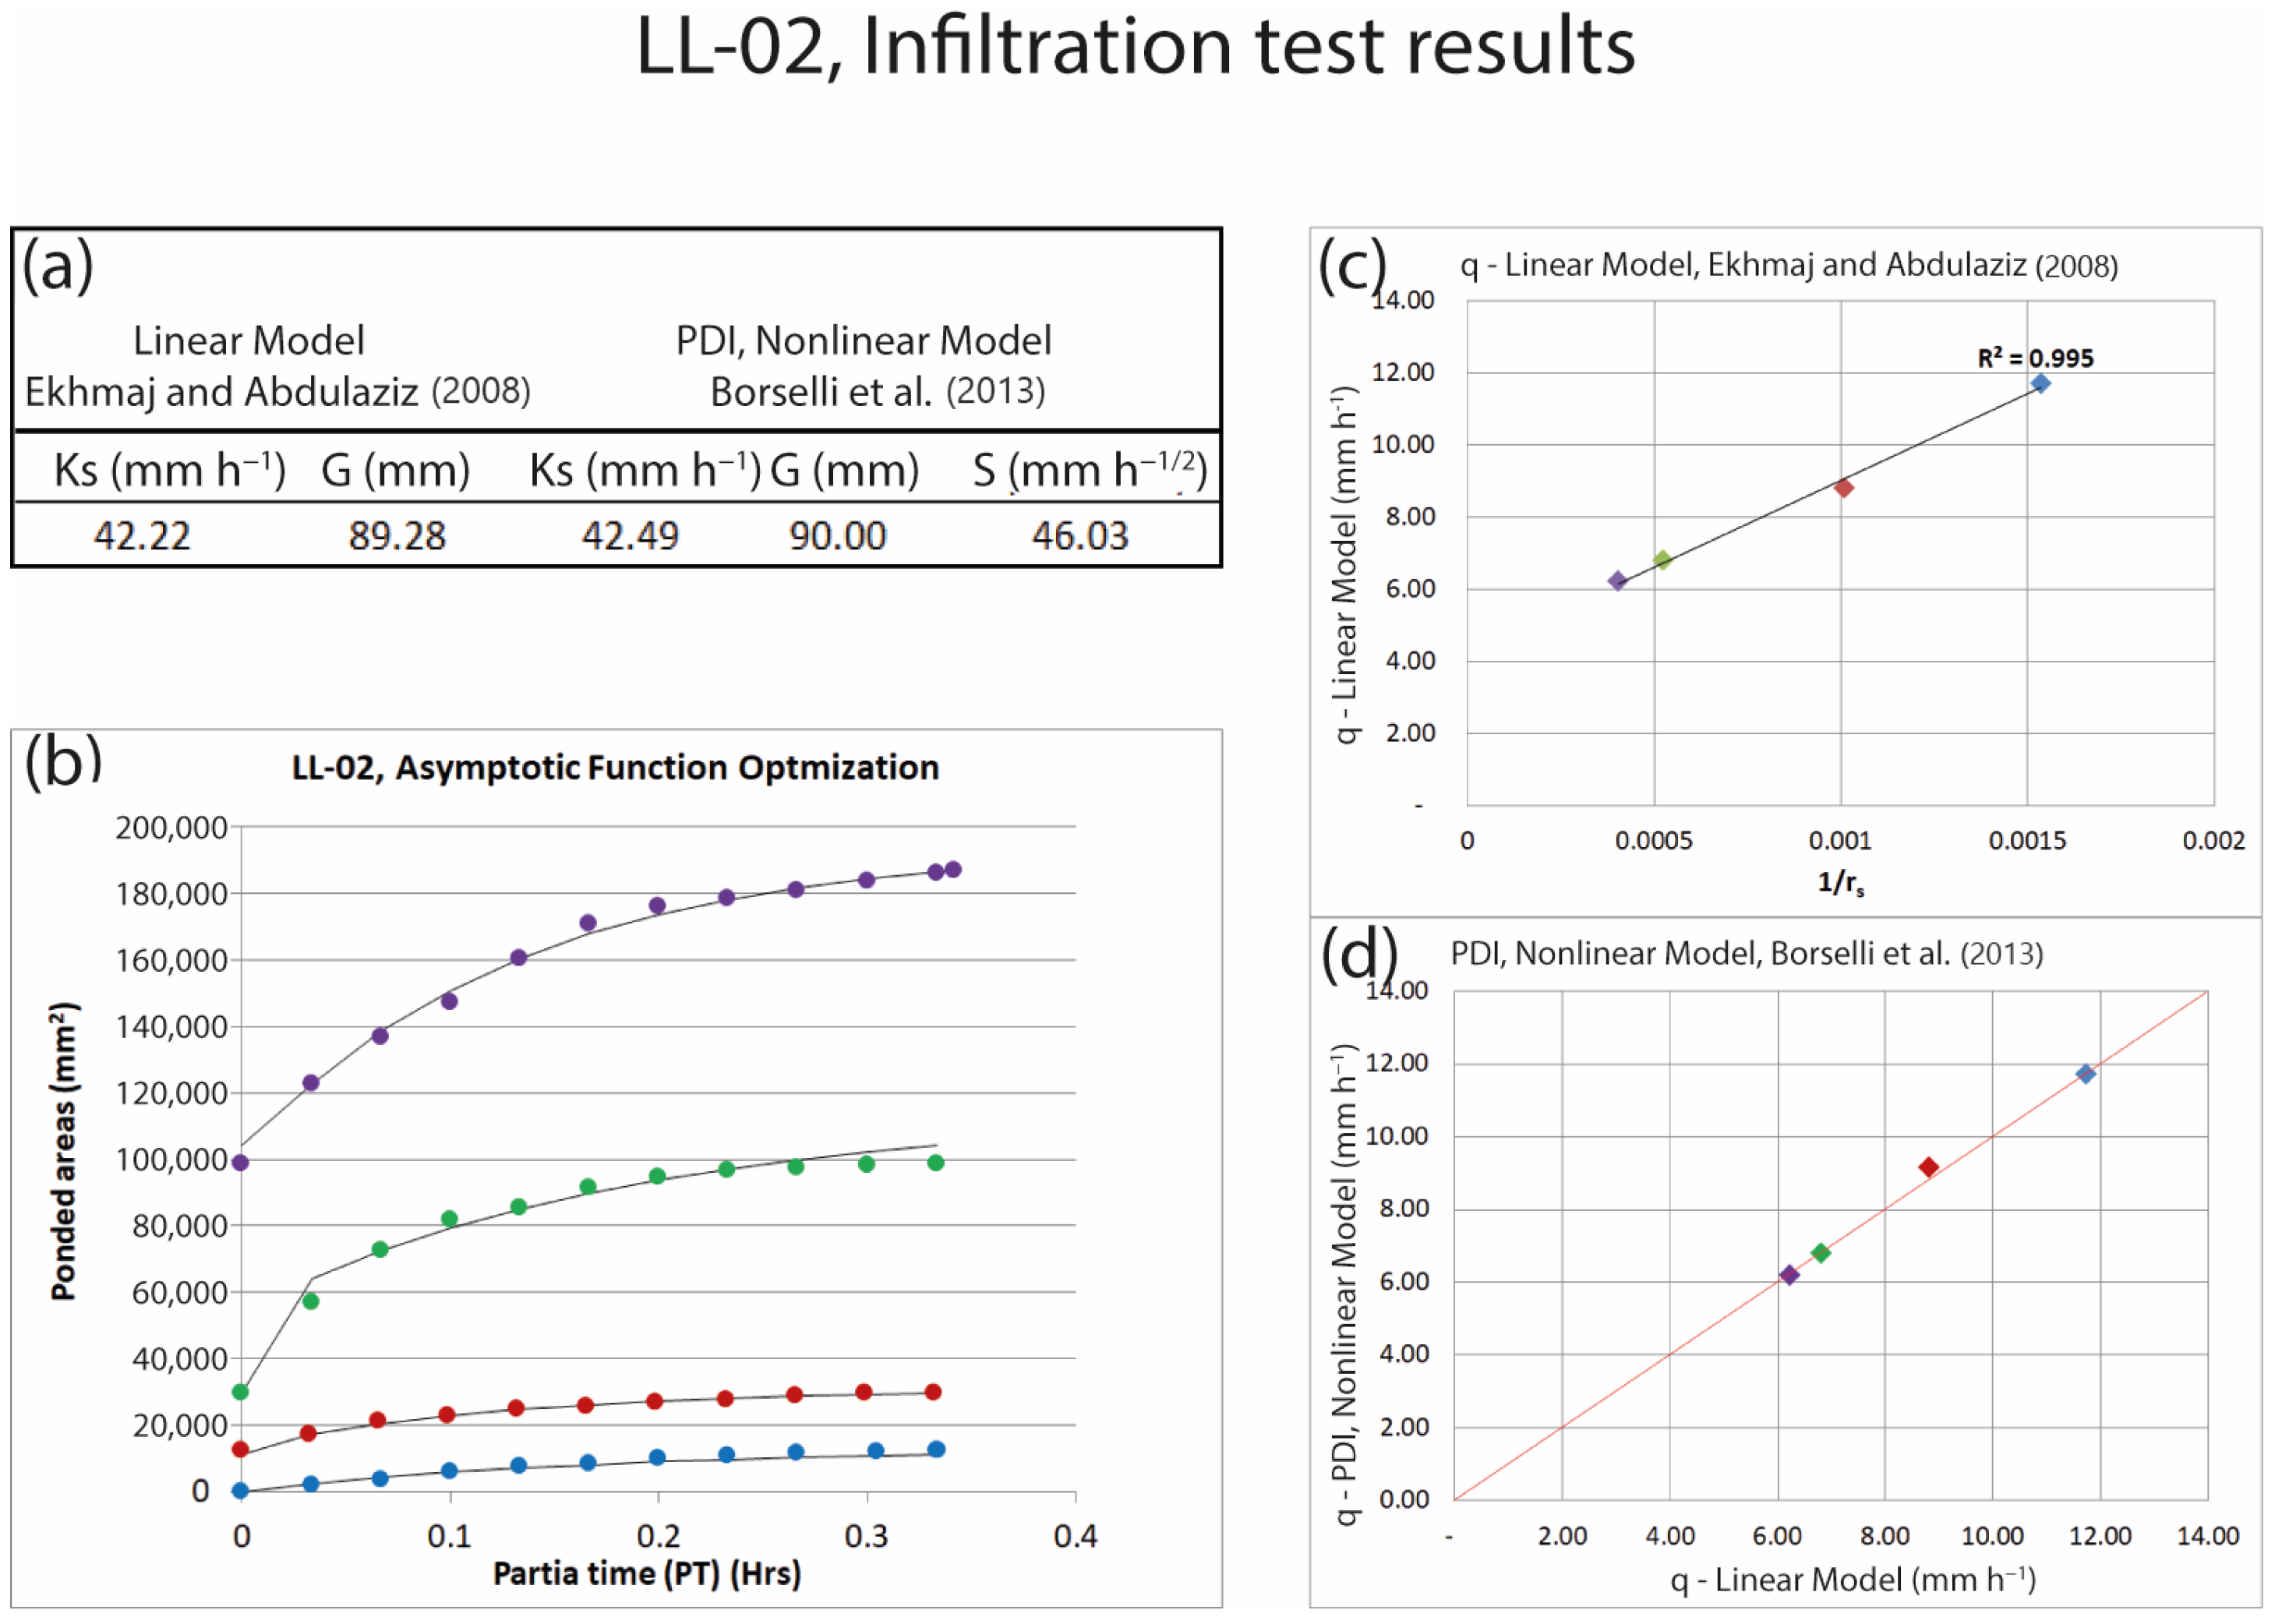
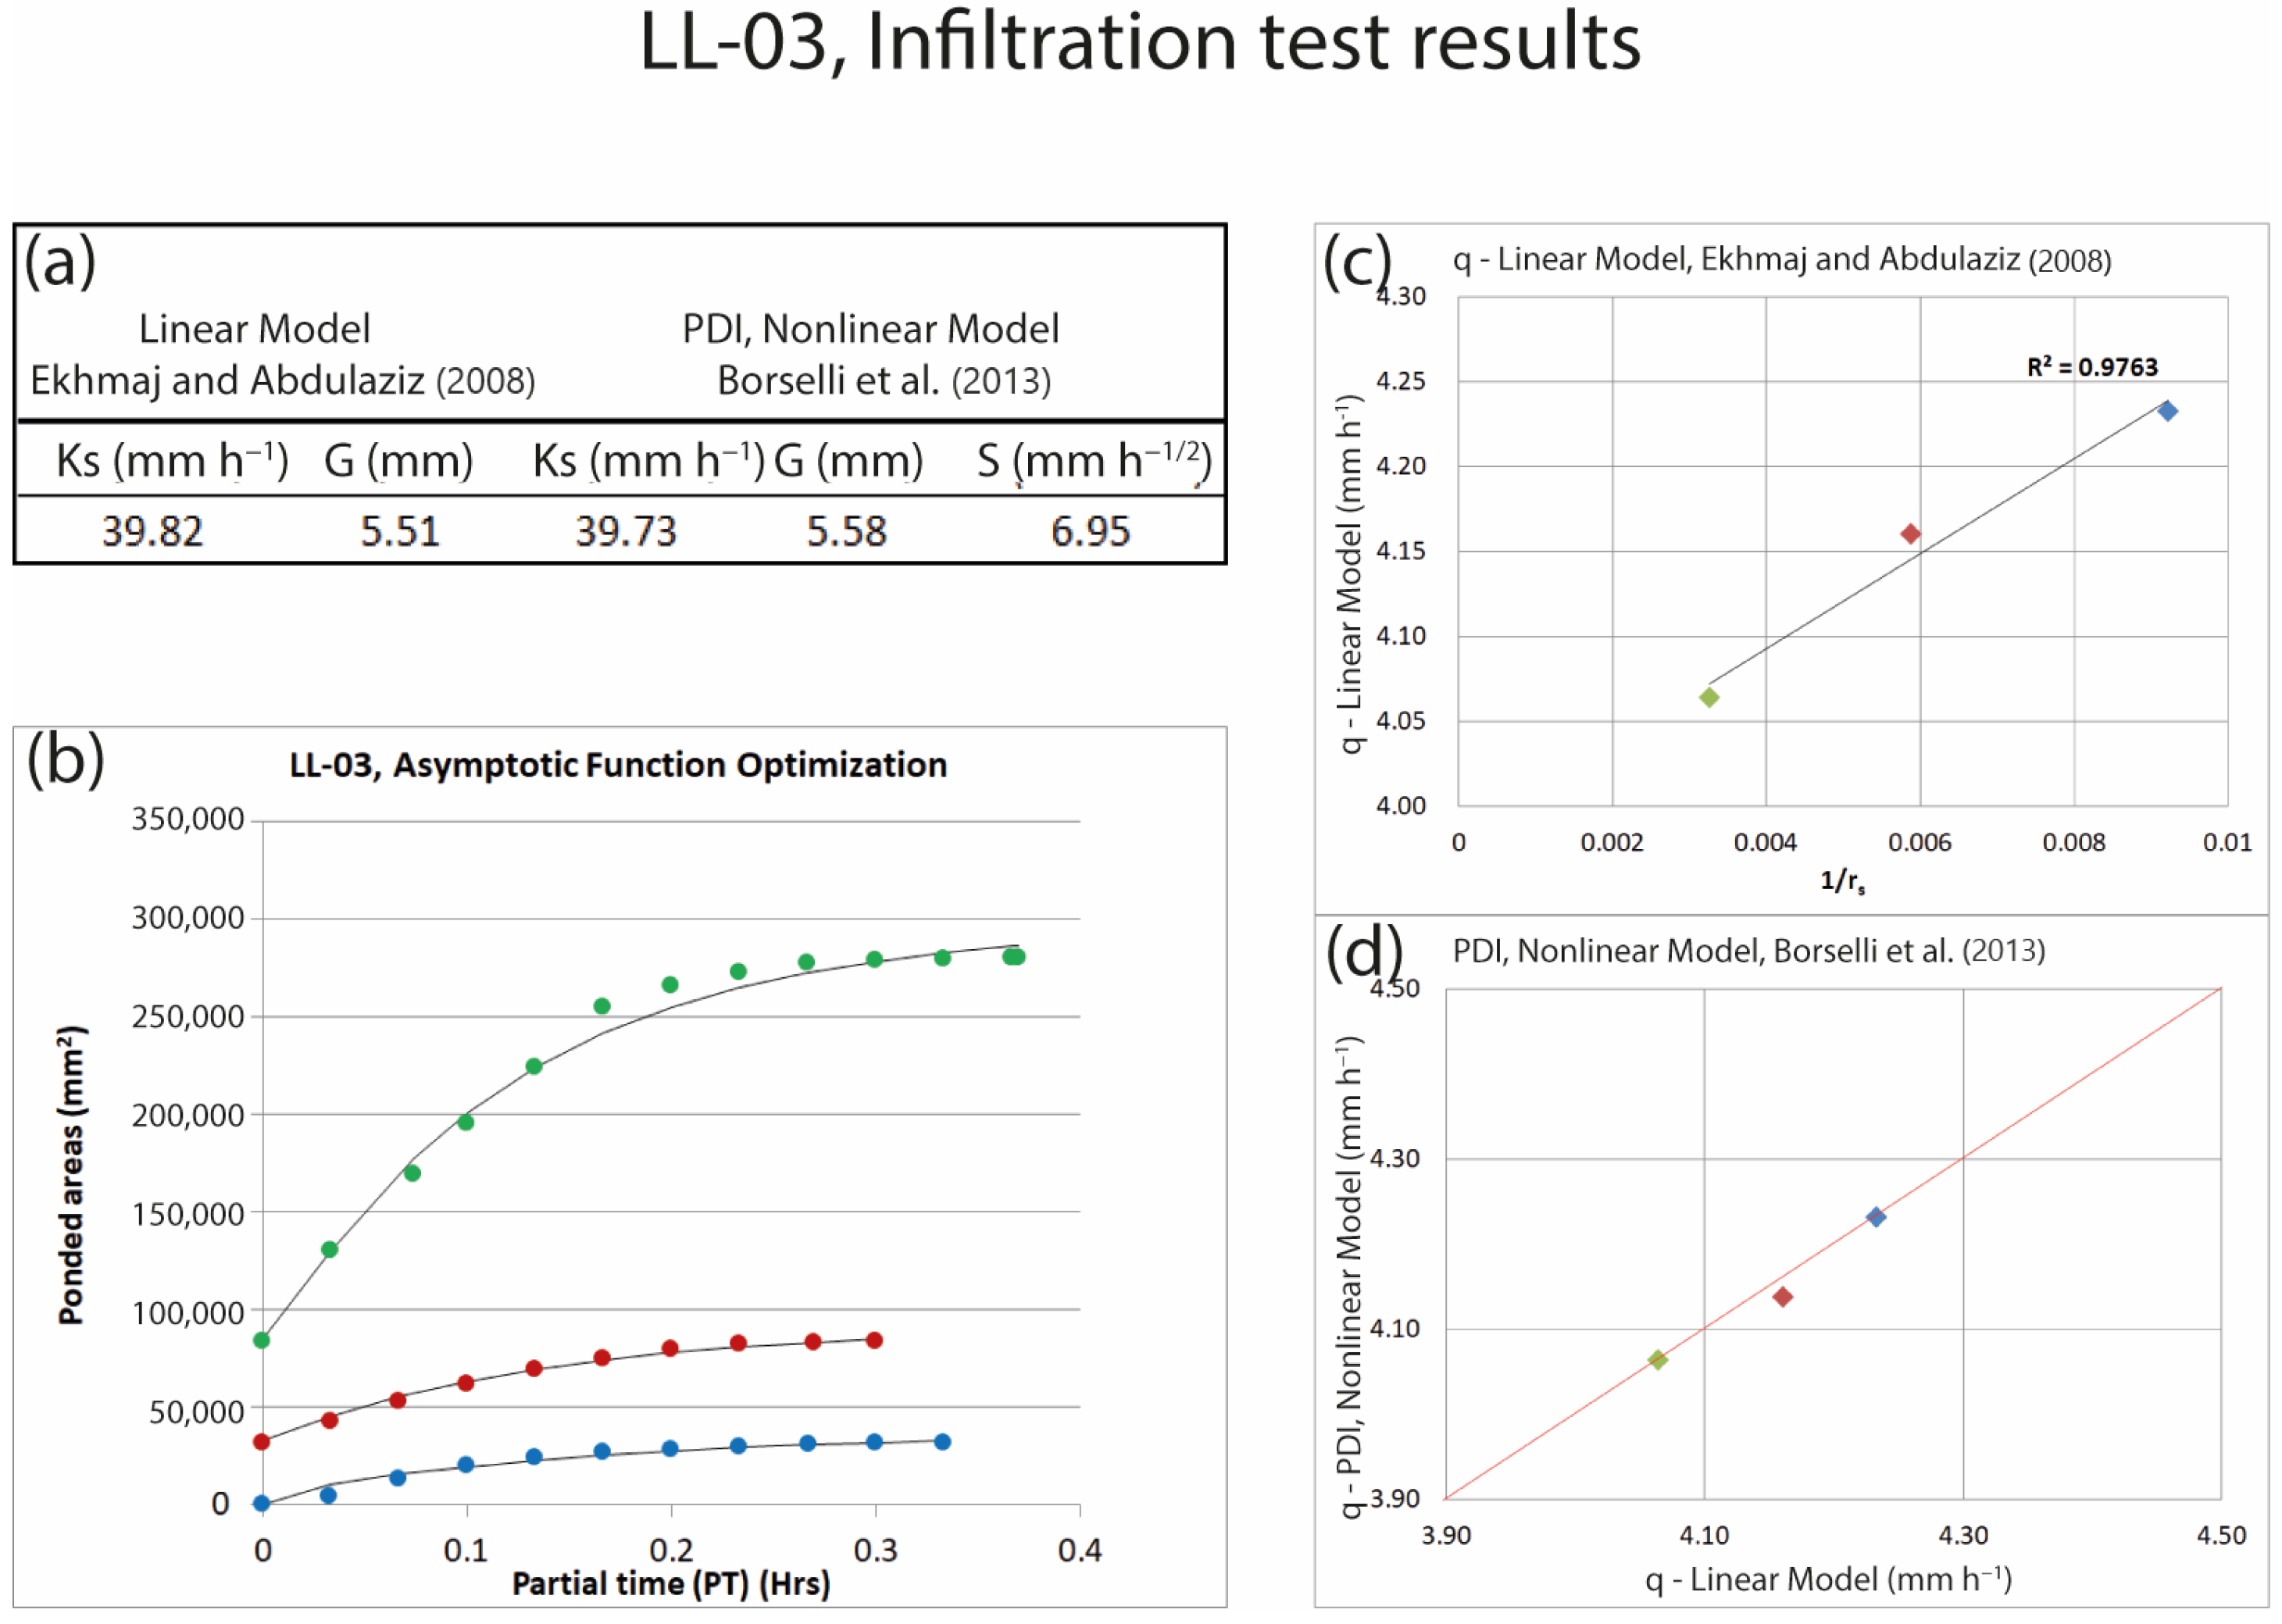
Figure 7, Figure 8, Figure 9 and Figure 10 share a common multi-panel structure designed to illustrate the sequential steps of the PDI analysis applied to the selected experiments. In all cases, panel (a) presents the experimental infiltration database acquired under multiple applied discharge rates. Panel (b) shows the temporal evolution of the ponded area, where colored points represent measured ponded areas (mm2) as a function of elapsed time (2-minute acquisition intervals), and the solid dark line corresponds to the theoretical behavior predicted by the PDI model used to identify steady-state conditions. Panel (c) displays the linear PDI formulation relating steady-state infiltration flux density (q) to the inverse of the equivalent ponded radius (1/rs), where colored points denote q values for each discharge rate and the solid dark line represents the linear trend used to estimate model parameters, with R2 indicating the goodness of fit. Finally, panel (d) compares the linear and non-linear PDI models using identical color-coded q values, including the red optimization line obtained by jointly adjusting q values from both formulations to validate the resulting estimates of Ks and G.
Within this framework, the following subsections describe the results obtained at each site, starting with experiments conducted at Site A (Sierra de San Miguelito) and, subsequently, those performed at Site B, near the Fuego de Colima volcano.
4.1. Experiments in Site A, Sierra de San Miguelito
4.1.1. PPR-07 Experiment
Within the general PDI analytical framework illustrated in Figure 7, Figure 8, Figure 9 and Figure 10, the PPR-07 experiment represents a structurally complex surface condition characterized by strong capillary control and pronounced deviations from ideal steady-state behavior. The test was conducted on transported soil classified as silt loam, characterized by a compacted and hardened silt crust (<1 mm), surface cracking, and macroporosity. As reported in Table 3, the PDI methodology yielded relatively low saturated hydraulic conductivity values (Ks = 3.09 mm h−1) and high effective net capillary drive values (G = 411.82 mm), reflecting the dominant influence of the fine-textured crusted layer on near-surface infiltration processes.
The comparison between modeling approaches (Table 4) reveals a noticeable discrepancy between the linear and non-linear formulations. The linear model underestimated Ks (2.48 mm h−1) and overestimated G (561.53 mm), resulting in differences of +24.6% for Ks and −26.7% for G relative to the PDI non-linear estimates. These differences are consistent with the presence of surface heterogeneities—such as cracks and macropores—that violate the linearity and steady-state assumptions required by the linear model.
This behavior is further illustrated in Figure 7, where the linear model adjustment (Figure 7c) and the comparison with the non-linear PDI formulation (Figure 7d) show that, despite comparable flux density (q) estimates, the inferred hydraulic parameters differ substantially between approaches. This highlights the PDI non-linear methodology’s ability to better capture transient infiltration dynamics under non-steady conditions in structurally complex soils.
Figure 7.
PPR-07 experiment (Site A). Results obtained from the PDI test showing (a) the experimental database [5,24]; (b) the temporal evolution of the ponded area used to estimate steady-state conditions, where colored points represent the ponded area (mm2) recorded on the y-axis versus elapsed time on the x-axis (2-minute acquisition intervals) for the different applied discharge rates, and the solid dark line represents the theoretical behavior predicted by the PDI model; (c) the linear model relating steady-state infiltration flux density (q) to the inverse of the equivalent ponded radius (1/rs), where colored points indicate q values for each discharge rate and the solid dark line represents the linear trend used to estimate model parameters, with R2 quantifying the goodness of fit [5]; and (d) the comparison between the linear and non-linear PDI models using identical color-coded q values, where the red line represents the optimization line obtained by jointly adjusting q values from both models to validate the PDI results [24]. Ks denotes saturated hydraulic conductivity, G the effective net capillary drive, and S the sorptivity.
4.1.2. PPR-13 Experiment
Within the general PDI analytical framework illustrated in Figure 7, Figure 8, Figure 9 and Figure 10, the PPR-13 experiment represents an intermediate surface condition in Site A, characterized by partial surface sealing and localized heterogeneity associated with gravel content and vegetation cover. The test was performed on residual soil classified as sandy loam, with embedded gravel (26.6%) and scattered grass cover (~15%). As summarized in Table 3, the PDI results indicate saturated hydraulic conductivity (Ks = 3.20 mm h−1) and effective net capillary drive (G = 224.98 mm), reflecting a balance between capillary-controlled flow and enhanced infiltration at preferential flow locations.
As shown in Table 4, both the linear and non-linear approaches produced comparable Ks estimates, differing by only −1.2%, while a moderate difference in G values (+3.8%) was observed. This behavior is also illustrated in Figure 8, where the linear model adjustment (Figure 8c) and its comparison with the non-linear PDI formulation (Figure 8d) yield similar estimates of flux density (q).
The close agreement in Ks values suggests that under relatively stable flow conditions and moderate surface heterogeneity, the linear model can adequately approximate infiltration behavior. However, the PDI non-linear approach provides a more robust representation of surface-controlled processes, particularly during the early stages of infiltration, which are influenced by gravel content and vegetation cover.
Figure 8.
PPR-13 experiment (Site A). Results obtained from the PDI test showing (a) the experimental database [5,24]; (b) the temporal evolution of the ponded area used to infer steady-state conditions, where colored points represent the ponded area (mm2) recorded on the y-axis versus elapsed time on the x-axis (2-minute acquisition intervals) for the different applied discharge rates, and the solid dark line represents the theoretical behavior predicted by the PDI model; (c) the linear model relating steady-state infiltration flux density (q) to the inverse of the equivalent ponded radius (1/rs), where colored points indicate q values for each discharge rate and the solid dark line represents the linear trend used to estimate model parameters, with R2 quantifying the goodness of fit [5]; and (d) the comparison between the linear and non-linear PDI models using identical color-coded q values, where the red line represents the optimization line obtained by jointly adjusting q values from both models to validate the PDI results [24]. Ks denotes saturated hydraulic conductivity, G the effective net capillary drive, and S the sorptivity.
4.2. Experiments in Site B, near the Fuego de Colima Volcano
4.2.1. LL-02 Experiment
Applying the same PDI analytical framework illustrated in Figure 7, Figure 8, Figure 9 and Figure 10, the LL-02 experiment represents a coarse-textured, gravity-dominated end-member characterized by limited surface sealing and rapid attainment of near-steady infiltration conditions. The test was conducted on avalanche deposits classified as loamy sand, with high gravel content (~35%) and substantial ground cover (~40%). As summarized in Table 3, the PDI methodology yielded high saturated hydraulic conductivity values (Ks = 42.49 mm h−1) and low effective net capillary drive values (G = 90.00 mm), consistent with the dominance of gravitational forces over capillary control in these materials.
The comparison presented in Table 4 shows excellent agreement between the linear and PDI non-linear approaches, with differences of only +0.6% for Ks and +0.8% for G. This strong agreement is further illustrated in Figure 9, where both the linear model adjustment (Figure 9c) and its comparison with the non-linear PDI formulation (Figure 9d) exhibit nearly identical flux density (q) estimates.
The linear model also yielded a high coefficient of determination (R2 = 0.995), indicating strong linearity under these conditions. These results suggest that when infiltration rapidly approaches near-steady conditions and surface heterogeneity is limited, both modeling approaches yield consistent and reliable estimates of hydraulic parameters.
Figure 9.
LL-02 experiment (Site B). Results obtained from the PDI test showing (a) the experimental database [5,24]; (b) the temporal evolution of the ponded area used to infer steady-state conditions, where colored points represent the ponded area (mm2) recorded on the y-axis versus elapsed time on the x-axis (2-minute acquisition intervals) for each applied discharge rate, and the solid dark line represents the theoretical behavior predicted by the PDI model; (c) the linear model relating steady-state infiltration flux density (q) to the inverse of the equivalent ponded radius (1/rs), where colored points indicate q values for each discharge rate and the solid dark line represents the linear trend used to estimate model parameters, with R2 quantifying the goodness of fit [5]; and (d) the comparison between the linear and non-linear PDI models using identical color-coded q values, where the red line represents the optimization line obtained by jointly adjusting q values from both models to validate the PDI results [24]. Ks denotes saturated hydraulic conductivity, G the effective net capillary drive, and S the sorptivity.
4.2.2. LL-03 Experiment
Under the same PDI analytical framework, the LL-03 experiment represents the most hydraulically homogeneous condition analyzed in this study, characterized by minimal surface impedance and strongly gravity-controlled infiltration. The test was carried out on a recent lahar deposit with no ground vegetation and a high sand content (81%). As reported in Table 3, the PDI results indicate high saturated hydraulic conductivity values (Ks = 39.73 mm h−1) and very low effective net capillary drive values (G = 5.58 mm), reflecting the absence of a sealing surface layer and reduced capillary influence.
As shown in Table 4, the linear and non-linear approaches yielded nearly identical parameter estimates, with differences of −0.2% for Ks and +1.3% for G. This close agreement is also illustrated in Figure 10, where both the linear model adjustment (Figure 10c) and its comparison with the non-linear PDI formulation (Figure 10d) display virtually identical flux density (q) estimates.
The minimal discrepancies between models reflect enhanced linearity and reduced capillary control under these conditions. Compared with Zone A, the absence of a hardened silt crust and vegetation cover leads to more homogeneous infiltration behavior, thereby reducing the sensitivity of hydraulic parameter estimation to model structure.
Figure 10.
LL-03 experiment (Site B). Results obtained from the PDI test showing (a) the experimental database [5,24]; (b) the temporal evolution of the ponded area used to estimate steady-state conditions, where colored points represent the ponded area (mm2) recorded on the y-axis versus elapsed time on the x-axis (2-minute acquisition intervals) for the different applied discharge rates, and the solid dark line represents the theoretical behavior predicted by the PDI model; (c) the linear model relating steady-state infiltration flux density (q) to the inverse of the equivalent ponded radius (1/rs), where colored points indicate q values for each discharge rate and the solid dark line represents the linear trend used to estimate model parameters, with R2 quantifying the goodness of fit [5]; and (d) the comparison between the linear and non-linear PDI models using identical color-coded q values, where the red line represents the optimization line obtained by jointly adjusting q values from both models to validate the PDI results [24]. Ks denotes saturated hydraulic conductivity, G the effective net capillary drive, and S the sorptivity.
4.3. Synthesis of Results
The results summarized in Table 3 and Table 4 and illustrated in Figure 7, Figure 8, Figure 9 and Figure 10 reveal a systematic increase in discrepancies between the linear and non-linear PDI formulations as surface structural complexity increases. Experiments conducted on crusted and structurally heterogeneous soils (PPR-07 and, to a lesser extent, PPR-13) exhibit larger deviations between approaches, primarily associated with differences in the estimation of the effective net capillary drive (G). These deviations reflect violations of the steady-state and linearity assumptions inherent to the linear formulation under conditions influenced by surface sealing, cracks, macropores, gravel content, and vegetation cover.
In contrast, experiments performed on coarse-textured, weakly structured deposits (LL-02 and LL-03) show close agreement between linear and non-linear formulations, indicating that under near-steady, gravity-dominated infiltration regimes, both approaches yield comparable estimates of saturated hydraulic conductivity (Ks) and G. Across the analyzed gradient, Ks remains relatively robust to model formulation, whereas G emerges as the parameter most sensitive to transient ponded-area dynamics and surface-controlled processes.
Overall, these results demonstrate that while the linear formulation performs reliably under relatively homogeneous surface conditions, the non-linear PDI methodology becomes essential when capillary-driven and transient processes dominate infiltration behavior. The main added value of the non-linear PDI approach, therefore, lies in its ability to provide more physically consistent estimates of G, thereby improving the characterization of near-surface hydraulic functioning across contrasting soil surface conditions.
5. Discussion
5.1. Uncertainty, Sensitivity, and Robustness of the PDI Optimization
The results presented in Section 4 demonstrate that discrepancies between the linear and non-linear PDI formulations are strongly controlled by surface structural complexity and are primarily expressed through differences in the estimation of the effective net capillary drive (G). At the same time, saturated hydraulic conductivity (Ks) remains comparatively robust. In this context, the discussion focuses on assessing the uncertainty, sensitivity, and robustness of the proposed PDI optimization framework, with particular emphasis on the assumptions used to identify quasi-steady-state conditions and their implications for parameter estimation under contrasting surface conditions.
In the proposed PDI framework, quasi-steady-state conditions are identified based on the temporal stabilization of the ponded area rather than solely on discharge constancy. In practice, steady conditions are assumed when the relative change in the measured ponded area between successive time intervals remains below a predefined threshold for a sustained period, indicating asymptotic behavior of the infiltration process. This criterion is particularly relevant under complex surface conditions, where discharge may remain constant while the ponded area continues to evolve due to surface-controlled processes.
The estimation of ponded area relies on image-based segmentation implemented in the software PDIS v1.5. Variations in image resolution, lighting conditions, and thresholding parameters introduce uncertainty in the derived ponded area, which may propagate into the estimated hydraulic parameters. Sensitivity analyses indicate that moderate uncertainty in ponded area estimation has a limited effect on saturated hydraulic conductivity (Ks), particularly under gravity-dominated flow conditions. In contrast, the effective net capillary drive (G) shows higher sensitivity to ponded-area uncertainty, especially under crusted, cracked, or highly heterogeneous surface conditions where transient infiltration dynamics dominate.
The bounds and constraints adopted for Ks and G in the evolutionary optimization (Table 2) were selected to ensure physically meaningful solutions while maintaining numerical stability across a wide range of soil surface conditions. Lower and upper bounds were defined based on reported ranges for near-surface soils encompassing coarse-textured deposits, crusted surfaces, and structurally heterogeneous materials. These constraints prevent convergence toward non-physical parameter combinations while remaining sufficiently broad to accommodate the variability observed across the tested sites.
Overall, the combination of image-based ponded-area tracking and bounded evolutionary optimization provides a robust framework for parameter estimation under transient field conditions. While uncertainty in ponded-area estimation cannot be eliminated, the non-linear formulation mitigates its impact by explicitly accounting for time-dependent infiltration behavior, thereby improving the physical consistency of the estimated parameters under complex surface conditions.
5.2. Performance of the PDI Methodology Under Heterogeneous Surface Conditions
Building on the contrasts identified in Section 4.3, this discussion examines the physical mechanisms underlying the observed differences between linear and non-linear PDI formulations. Particular attention is given to the role of surface structure and transient pond development in controlling the validity of steady-state assumptions across contrasting soil conditions. By explicitly incorporating the temporal evolution of ponded areas and adopting a non-linear optimization framework, the PDI approach addresses several conceptual and practical limitations inherent to classical steady-state formulations [5,29].
In relatively homogeneous soils with limited surface impedance, both linear and non-linear formulations yield comparable estimates of saturated hydraulic conductivity (Ks). As surface complexity increases—due to silt crusts, cracks, macropores, gravel cover, vegetation, or slope effects—the divergence between linear and non-linear estimates becomes progressively more pronounced. This behavior aligns with previous studies showing that steady-state assumptions are frequently violated in structured or disturbed soils [56,57,58].
Under such conditions, the PDI framework represents a methodological advance beyond classical drip infiltrometer approaches, as it enables physically consistent estimation of hydraulic parameters under transient infiltration conditions rather than relying on idealized steady-state assumptions. The use of asymptotic fitting to infer steady-state ponded areas from transient observations allows the methodology to remain operational even when full stabilization cannot be achieved within practical fieldwork times, a common limitation of conventional infiltration tests [28,59].
5.3. Role of Soil Texture and Surface Structure on Hydraulic Parameters
Soil texture exerts a first-order control on infiltration processes and hydraulic parameters, as widely documented in soil physics literature [52,60,61]. Coarse-textured soils typically exhibit higher Ks values and reduced capillary influence. In contrast, fine-textured soils are characterized by lower Ks and higher effective net capillary drive (G), reflecting the dominance of capillary forces over gravity.
While the PDI-derived parameters are consistent with these theoretical expectations, the results also highlight the strong modulation imposed by surface structure. Features such as compacted silt crusts, microtopography, aggregate stability, and embedded gravel substantially influence pond expansion and infiltration dynamics under transient conditions. These effects are only partially captured by linear models but are explicitly represented within the PDI framework through the combined use of geometric and hydraulic information (Table 5).
Table 5.
Synthesis of dominant surface conditions and relative performance of linear and non-linear PDI models across representative experiments.
Accordingly, the hydraulic parameters derived from the PDI should be interpreted as effective near-surface properties that integrate surface structure, microtopography, and transient flow conditions, rather than as intrinsic laboratory-scale soil properties.
Overall, the patterns summarized in Table 5 indicate that soil hydraulic parameters derived from the PDI should be interpreted as effective near-surface properties integrating soil texture, surface structure, and transient infiltration dynamics. While coarse-textured soils tend to exhibit higher saturated hydraulic conductivity (Ks) values and reduced capillary control, surface features such as crusts, gravel, vegetation, and microtopography strongly modulate pond development and infiltration behavior. In this context, it is important to note that the effective net capillary drive (G) exhibits a wider range of values than Ks across the tested conditions.
This variability does not indicate experimental inconsistency, but rather reflects the strong sensitivity of capillary-driven infiltration to surface structure, microtopography, and transient pond development under heterogeneous field conditions. These surface controls are only partially captured by linear steady-state models. However, they are explicitly represented within the PDI framework through the combined use of geometric and hydraulic information, reinforcing the need for non-linear formulations capable of capturing transient infiltration dynamics.
5.4. Influence of Slope, Vegetation Cover, Gravel Content, and Macroporosity
Beyond soil texture and surface structure, the patterns summarized in Table 5 highlight the additional influence of topographic and biological factors on near-surface infiltration processes. Slope affects the balance between vertical and lateral flow components and modifies the spatial distribution of ponded water, particularly under conditions of limited infiltration capacity [53,62]. In this study, differences in slope among sites with similar textural characteristics led to distinct hydraulic responses, underscoring the importance of topographic context.
Vegetation cover enhances infiltration by promoting macroporosity, improving aggregate stability, and increasing surface roughness, in agreement with previous field-based studies [57,63]. Gravel content exerts a dual control depending on its spatial arrangement: embedded gravel can locally reduce infiltration by disrupting soil continuity, whereas loose surface fragments may enhance infiltration along particle boundaries [64,65].
Macropores and cracks further complicate infiltration dynamics by providing preferential pathways that temporarily store water and delay uniform pond expansion. These features may lead to apparent steady states that do not correspond to true hydraulic equilibrium, challenging steady-state assumptions [66,67]. It should be emphasized that the PDI methodology does not explicitly aim to resolve preferential flow pathways, but rather to capture their integrated effect on near-surface infiltration dynamics through the temporal evolution of ponded areas. By integrating the complete temporal evolution of ponded areas, the PDI approach mitigates these effects more effectively than instantaneous steady-state methods.
5.5. Methodological Assumptions: Monotonic Wetting and Soil Water Hysteresis
The PDI methodology assumes monotonic wetting from initially dry to moderately dry conditions and does not explicitly account for soil water hysteresis. This behavior arises from differences between wetting and drying paths in the soil water retention relationship and is governed by pore geometry, contact angle variability, and air entrapment [56,68,69].
This assumption is consistent with the experimental design adopted in this study, which involves short-duration imbibition processes without drying phases or flow reversals. As a result, the experimental framework does not traverse the drainage–imbibition loops required to resolve hysteretic behavior or scanning curves [70,71].
Consequently, the hydraulic parameters derived from the PDI—Ks, G, and sorptivity (S)—should be interpreted as effective near-surface properties characterizing short-term infiltration processes. At the spatial and temporal scales considered here, infiltration dynamics are primarily controlled by capillarity, surface pore connectivity, and microtopographic effects, with hysteresis expected to play a secondary role [26,57,58]. Within this experimental design, hysteresis effects are therefore implicitly embedded in the effective hydraulic response observed during transient infiltration, rather than explicitly parameterized, which is consistent with reducing experimental duration while preserving physical interpretability.
5.6. Methodological Limitations, Applicability Domain, and Broader Process-Based Applications
Despite its demonstrated robustness, the PDI methodology has limitations that limit its current applicability. Its physical representation of infiltration processes may become less accurate in soils exhibiting extreme surface heterogeneity, such as the simultaneous presence of compacted crusts, open cracks or macropores, and high gravel content, where highly localized flow pathways may dominate. Additionally, the image-based representation of infiltration assumes a circular equivalent ponded area, a practical simplification of potentially irregular wetted patterns on rough or heterogeneous surfaces.
In addition, the methodology has been primarily validated in soils ranging from sandy loam to silt loam textures; its performance in finer-textured soils with higher clay content—where shrink–swell behavior and stronger hysteretic effects may occur—remains insufficiently explored. These limitations do not compromise the internal consistency of the results but rather delineate the scope within which the PDI should be applied as a rapid, non-invasive field tool.
Within this applicability domain, the PDI-derived parameters provide valuable insight into the functional soil properties controlling near-surface hydrological connectivity. By characterizing effective infiltration capacity, capillary control, and early-time soil–water interactions, the PDI framework enables a process-oriented interpretation of infiltration behavior under contrasting surface conditions. These characteristics support the use of PDI-derived parameters in comparative analyses of runoff generation and erosion-related processes, particularly in heterogeneous and degraded environments [72,73,74,75].
6. Conclusions
Within the applicability domain defined in this study, the Portable Drip Infiltrometer (PDI) methodology constitutes a robust, non-invasive, and field-adapted approach for estimating key near-surface soil hydraulic parameters, including saturated hydraulic conductivity (Ks), effective net capillary drive (G), and derived properties such as sorptivity (S) and suction factor (Sf). By explicitly accounting for the temporal evolution of ponded areas and adopting a non-linear optimization framework, the PDI extends classical drip infiltrometer techniques beyond steady-state assumptions, enabling reliable parameter estimation under transient infiltration conditions.
Field applications across contrasting climatic, geomorphological, and edaphic settings demonstrate how the PDI framework responds to variations in soil surface structure, providing a diagnostic tool to identify when steady-state assumptions are valid and when transient, non-linear formulations are required. While linear steady-state formulations provide acceptable results in relatively homogeneous and coarse-textured soils, their performance deteriorates as surface complexity increases. Under such conditions, the non-linear PDI framework yields more consistent and physically meaningful estimates of Ks and G by integrating geometric and hydraulic information derived from transient pond development.
The methodology assumes monotonic wetting from initially dry or moderately dry conditions and does not explicitly resolve soil water hysteresis. Consequently, the derived hydraulic parameters should be interpreted as effective near-surface properties representative of short-term infiltration processes. Within this experimental context, hysteresis effects are implicitly embedded in the observed hydraulic response rather than explicitly parameterized, which is consistent with minimizing experimental duration and operational complexity.
Despite certain limitations—particularly in soils exhibiting extreme surface heterogeneity or high clay content—the PDI methodology defines a clear applicability domain as a rapid, repeatable, and non-destructive field tool. Its integration with image-based ponded area analysis (PDIS software) and open-access data-processing workflows facilitates its application across a wide range of environments, including stony, volcanic, semi-arid, and vegetated soils where conventional infiltration methods are often impractical.
Overall, the proposed PDI framework establishes a physically grounded link between soil surface conditions and near-surface hydraulic behavior, supporting hydrological modeling, erosion assessment, and ecohydrological connectivity analyses. By explicitly integrating near-surface infiltration dynamics with surface structure and transient flow conditions, the framework offers a robust basis for advancing field-based analyses of runoff generation, soil erosion, and land and water resource management in heterogeneous and degraded environments.
Supplementary Materials
The following supporting information can be downloaded at: https://www.mdpi.com/article/10.3390/geotechnics6010022/s1. The supplementary documentation is organized into seven modules (Sections S1–S7) supporting the field implementation, computational workflow, optimization procedures, and complete dataset of the Portable Drip Infiltrometer (PDI) framework. Section S1 describes field implementation protocols, including materials and equipment (Table S1), test coding, operational considerations, photograph acquisition, and infiltration test execution. Section S2 details the ponded area calculation workflow implemented in PDIS v1.5. Sections S3 and S4 describe the configuration of evolutionary optimization algorithms for asymptotic and global estimation of saturated hydraulic conductivity (Ks) and effective net capillary drive (G), including Tables S2 and S3. Sections S5 and S6 present PDI results for Zone A (Sierra de San Miguelito, San Luis Potosí, México) and Zone B (Colima, México). Section S7 compiles the complete dataset (Table S4) into groups by soil texture class. The Supplementary Materials also include the MATLAB source code (PDIS v1.5), an installation package, an Excel data-processing template, and a user manual. The software is distributed under the GNU General Public License v3.0 (GPL v3.0). All Supplementary Materials are available at: https://www.lorenzo-borselli.eu/pdis-software/index.html (accessed on 9 February 2026).
Author Contributions
Conceptualization, L.B., W.L.P.-C., A.J.O.-R. and D.T.; methodology, W.L.P.-C., L.B. and A.J.O.-R.; software, L.B.; validation, W.L.P.-C. and L.B.; formal analysis, W.L.P.-C., L.B. and A.J.O.-R.; investigation, W.L.P.-C. and A.J.O.-R.; resources, L.B. and D.S.; data curation, W.L.P.-C. and L.B.; writing—original draft preparation, W.L.P.-C., L.B., A.J.O.-R. and D.T.; writing—review and editing, L.B. and A.J.O.-R.; visualization, W.L.P.-C., L.B. and A.J.O.-R.; supervision, L.B. and D.S.; project administration, L.B. and D.S.; funding acquisition, L.B. and D.S. All authors have read and agreed to the published version of the manuscript.
Funding
This research was funded by the Consejo Nacional de Ciencia y Tecnología (CONACYT, México) through the Ciencia Básica Projects Nos. 184060 and 286764. The first author was supported by a CONACYT doctoral fellowship (CVU 427085; fellowship No. 324785; record No. 263327). The corresponding author received a CONACYT postdoctoral fellowship (CVU 288146) under agreement No. I1200/320/2022.
Institutional Review Board Statement
Not applicable.
Informed Consent Statement
Not applicable.
Data Availability Statement
The data presented in this study are available on request from the corresponding author due to privacy concerns.
Acknowledgments
The first author acknowledges the doctoral fellowship granted by the Consejo Nacional de Ciencia y Tecnología (CONACYT, México), fellowship No. 324785, which supported her research stay at the Instituto de Geología, Universidad Autónoma de San Luis Potosí. The corresponding author acknowledges the postdoctoral fellowship granted by CONACYT under agreement No. I1200/320/2022. The authors also thank Alessia Del Piero, Sergio González Bautista, Luis Ángel Rodríguez Sedano, and Daniel Cortés Medellín for their valuable assistance during fieldwork.
Conflicts of Interest
The authors declare no conflicts of interest.
Abbreviations
The following abbreviations are used in this manuscript:
| PDI | Portable drip infiltrometer |
| DI | Drip infiltrometer |
| PTFs | Pedotransfer functions |
| TDR | Time domain reflectometry |
Appendix A
Proof that Equation (6) is the basis of PDI linear and non-linear procedures used for the assessment of K (saturated conductivity) and G (effective net capillary drive). The classical solution of Wooding [15] is a quasi-analytical equation for infiltration from a shallow circular pond, which can be used for a dripper or infiltrometer ring.
Following Revol et al. [28], the asymptotic steady-state flux rate from a shallow circular pond with a radius rs can be approximated as:
where
- q = steady-state flux rate per unit area (mm h−1);
- Ks = saturated conductivity (mm h−1);
- rs = radius of ponded area at steady-state (mm);
- 4ϕs = matrix flux potential at steady-state (mm2 h−1).
The matrix flux potential at steady-state, starting from the initial quasi-dry condition following Revol et al. [28], is equal to:
where
- = matric potential (mm).
Following Revol et al. [76]:
where
- α = constant expressing soil characteristics, related to the absorption properties of the soil and its reduction described in the conductivity matrix (mm−1).
Substituting Equation (A3) into Equation (A1), we obtain the classical flux rate equation for drip infiltration, as Equation (1), from Ekhmaj and Abdulaziz [5]:
The effective net capillary drive G (mm) can be obtained from Smith and Parlange [30], Smith [31], and Assouline [32] as:
Using the following equivalence and Equation (A2), we have:
Consequently, applying Equation (A3), Equation (A6) can be transformed into:
Simplifying Equation (A7), we obtain:
The equivalence relation in Equation (A8) can be substituted into Equation (A4), and we obtain the following expression for the steady-state flux rate per unit area:
This corresponds to Equation (6), namely, the main Equation used in the non-linear PDI procedure.
References
- Sandoval, M.; Castillo, C.; Zagal, E.; Stolpe, N.; Undurraga, P. Parámetros hidráulicos determinados en un Andisol bajo diferentes rotaciones culturales después de diez años. R. C. Suelo Nutr. Veg. 2007, 7, 32–45. [Google Scholar] [CrossRef] [Scilit]
- Landini, A.M.; Martínez, D.; Días, H.; Soza, E.; Agnes, D.; Sainato, C. Modelos de infiltración y funciones de pedotransferencia aplicados a suelos de distinta textura. Cienc. Del Suelo 2007, 25, 123–131. [Google Scholar]
- Silva-Araya, W.; Santiago-Collazo, F.; Gonzalez-Lopez, J.; Maldonado-Maldonado, J. Dynamic modeling of surface runoff and storm surge during hurricane and tropical storm events. Hydrology 2018, 5, 13. [Google Scholar] [CrossRef] [Scilit]
- Lamichhane, N.; Sharma, S. Development of a flood warning system and flood inundation mapping using field survey and LiDAR data for the Grand River near the city of Painesville, Ohio. Hydrology 2017, 4, 24. [Google Scholar] [CrossRef] [Scilit]
- Ekhmaj, A.I.; Abdulaziz, A.M. Trickle irrigation as a simple tool to estimate saturated hydraulic conductivity. In Proceedings of the Twelfth International Water Technology Conference (IWTC12), Alexandria, Egypt, 27–30 March 2008; pp. 1–9. [Google Scholar]
- Muhammed, H.H.; Anlauf, R.; Daum, D. Estimation of hydraulic properties of growing media from numerical inversion of mini disk infiltrometer data. Hydrology 2025, 12, 100. [Google Scholar] [CrossRef] [Scilit]
- Ghosh, B.; Pekkat, S.; Yamsani, S.K. Evaluation of infiltrometers and permeameters for measuring hydraulic conductivity. Adv. Civ. Eng. Mater. 2019, 8, 308–321. [Google Scholar] [CrossRef] [Scilit]
- Panini, T.; Torri, D.; Pellegrini, S.; Pagliai, M.; Salvador Sanchis, M.P. A theoretical approach to soil porosity and sealing development using simulated rainstorms. Catena 1997, 31, 199–218. [Google Scholar] [CrossRef] [Scilit]
- Rousseva, S.; Torri, D.; Pagliai, M. Effect of rain on the macroporosity at the soil surface. Eur. J. Soil Sci. 2002, 53, 83–93. [Google Scholar] [CrossRef] [Scilit]
- Todisco, F.; Vergni, L.; Vinci, A.; Torri, D. Infiltration and bulk density dynamics with simulated rainfall sequences. Catena 2022, 218, 106542. [Google Scholar] [CrossRef] [Scilit]
- Verbist, K.M.J.; Cornelis, W.M.; Torfs, S.; Gabriels, D. Comparing methods to determine hydraulic conductivities on stony soils. Soil Sci. Soc. Am. J. 2013, 77, 25–42. [Google Scholar] [CrossRef] [Scilit]
- Braud, I.; Desprats, J.F.; Ayral, P.A.; Bouvier, C.; Vandervaere, J.P. Mapping topsoil field-saturated hydraulic conductivity from point measurements using different methods. J. Hydrol. Hydromech. 2017, 65, 264–275. [Google Scholar] [CrossRef] [Scilit]
- Morbidelli, R.; Saltalippi, C.; Flammini, A.; Cifrodelli, M.; Picciafuoco, T.; Corradini, C.; Govindaraju, R.S. In situ measurements of soil saturated hydraulic conductivity: Assessment of reliability through rainfall–runoff experiments. Hydrol. Process. 2017, 31, 3084–3094. [Google Scholar] [CrossRef] [Scilit]
- Van der Keur, P.; Iversen, B.V. Uncertainty in soil physical data at river basin scale: A review. Hydrol. Earth Syst. Sci. 2006, 10, 889–902. [Google Scholar] [CrossRef] [Scilit]
- Wooding, R.A. Steady infiltration from a shallow circular pond. Water Resour. Res. 1968, 4, 1259–1273. [Google Scholar] [CrossRef] [Scilit]
- Green, W.H.; Ampt, G.A. Studies on soil physics. J. Agric. Sci. 1911, 4, 1–24. [Google Scholar] [CrossRef] [Scilit]
- Ben-Asher, J.; Volynski, R.; Gulko, N. Spherical interpretation of infiltration from trickle irrigation. Agronomy 2022, 12, 2469. [Google Scholar] [CrossRef] [Scilit]
- Hu, T.; Bai, Z.; Sun, X.; Bai, S.; Wu, F.; Zhang, D. Study on the cumulative effect of drip irrigation on the stability of loess slopes. Geomat. Nat. Hazards Risk 2025, 16, 2434612. [Google Scholar] [CrossRef] [Scilit]
- Ben-Asher, J.; Yano, T.; Shainberg, I. Dripper discharge rates and the hydraulic properties of the soil. Irrig. Drain. Syst. 2003, 17, 325–340. [Google Scholar] [CrossRef] [Scilit]
- Yuliana, Y.; Apriyono, A.; Kamchoom, V.; Boldrin, D.; Cheng, Q.; Tang, C.S. Seasonal dynamics of root growth and desiccation cracks and their effects on soil hydraulic conductivity. Eng. Geol. 2025, 349, 107973. [Google Scholar] [CrossRef] [Scilit]
- Guida, G.; Nicosia, A.; Settanni, L.; Ferro, V. A review on the effects of biological soil crusts on hydrological processes. Earth-Sci. Rev. 2023, 243, 104516. [Google Scholar] [CrossRef] [Scilit]
- Strudley, M.W.; Green, T.R.; Ascough, J.C., II. Tillage effects on soil hydraulic properties in space and time: State of the science. Soil Tillage Res. 2008, 99, 4–48. [Google Scholar] [CrossRef] [Scilit]
- Basset, C.; Abou Najm, M.; Ghezzehei, T.; Hao, X.; Daccache, A. How does soil structure affect water infiltration? A meta-data systematic review. Soil Tillage Res. 2023, 226, 105577. [Google Scholar] [CrossRef] [Scilit]
- Borselli, L.; Puente-Castillo, W.L.; Ortiz-Rodríguez, A.J. Metodología Portable Drip Infiltrometer (PDI) para la medición in situ no destructiva de parámetros hidráulicos del suelo: Conductividad hidráulica saturada (Ks) y empuje capilar neto (G). In Proceedings of the Reunión Anual de la Unión Geofísica Mexicana (UGM), Puerto Vallarta, Mexico, 11–15 November 2013; p. 291. [Google Scholar]
- Brunetti, G.F.A.; De Bartolo, S.; Fallico, C.; Frega, F.; Rivera Velásquez, M.F.; Severino, G. Experimental investigation to characterize simple versus multiscaling analysis of hydraulic conductivity at a mesoscale. Stoch. Environ. Res. Risk Assess. 2022, 36, 1131–1142. [Google Scholar] [CrossRef] [Scilit]
- Cheng, Q.; Tang, C.S.; Xu, D.; Zeng, H.; Shi, B. Water infiltration in a cracked soil considering the effect of drying–wetting cycles. J. Hydrol. 2021, 593, 125640. [Google Scholar] [CrossRef] [Scilit]
- Xu, H.; Zhu, X.; Mi, M. Progress and prospects of research on physical soil crust. Soil Syst. 2025, 9, 23. [Google Scholar] [CrossRef] [Scilit]
- Revol, P.; Clothier, B.E.; Kosuth, P.; Vachaud, G. The free-water pond under a trickle source: A field test of existing theories. Irrig. Sci. 1996, 16, 169–173. [Google Scholar] [CrossRef]
- Philip, J.R. Theory of infiltration. Adv. Hydrosci. 1969, 5, 215–296. [Google Scholar] [CrossRef] [Scilit]
- Smith, R.E.; Parlange, J.Y. A parameter-efficient hydrologic infiltration model. Water Resour. Res. 1978, 14, 533–538. [Google Scholar] [CrossRef] [Scilit]
- Smith, R.E. Analysis of infiltration through a two-layer soil profile. Soil Sci. Soc. Am. J. 1990, 54, 1219–1226. [Google Scholar] [CrossRef] [Scilit]
- Assouline, S. Modeling the relationship between soil bulk density and the hydraulic conductivity function. Vadose Zone J. 2006, 5, 697–705. [Google Scholar] [CrossRef] [Scilit]
- Warrick, A.W.; Broadbridge, P. Sorptivity and macroscopic capillary length relationships. Water Resour. Res. 1992, 28, 427–431. [Google Scholar] [CrossRef] [Scilit]
- Topp, G.C.; Davis, J.L.; Bailey, W.G.; Zebchuk, W.D. The measurement of soil water content using a portable TDR hand probe. Can. J. Soil Sci. 1984, 64, 313–321. [Google Scholar] [CrossRef] [Scilit]
- Al-Jabri, S.A.; Lee, J.; Gaur, A.; Horton, R.; Jaynes, D.B. A dripper–TDR method for in situ determination of hydraulic conductivity and chemical transport properties of surface soils. Adv. Water Resour. 2006, 29, 239–249. [Google Scholar] [CrossRef] [Scilit]
- INEGI. Climas. In Síntesis de Información Geográfica del Estado de San Luis Potosí; Instituto Nacional de Estadística y Geografía: Aguascalientes, Mexico, 2002; p. 5. [Google Scholar]
- Tristán-González, M.; Aguillón-Robles, A.; Barboza-Gudiño, J.R.; Torres-Hernández, J.R.; Bellon, H.; López-Doncel, R.; Rodríguez-Ríos, R.; Labarthe-Hernández, G. Geocronología y distribución espacial del vulcanismo en el Campo Volcánico de San Luis Potosí. Boletín Soc. Geol. Mex. 2009, 61, 287–303. [Google Scholar] [CrossRef] [Scilit]
- IUSS Working Group WRB. Base Referencial Mundial del Recurso Suelo: Sistema Internacional de Clasificación de Suelos para la Nomenclatura de Suelos y la Creación de Leyendas de Mapas de Suelos, 4th ed.; International Union of Soil Sciences (IUSS): Vienna, Austria, 2022. [Google Scholar]
- INEGI. Edafología. Serie II: Continuo Nacional; Instituto Nacional de Estadística y Geografía: Aguascalientes, Mexico, 2007. [Google Scholar]
- INEGI. Suelos. In Síntesis de Información Geográfica del Estado de San Luis Potosí; Instituto Nacional de Estadística y Geografía: Aguascalientes, Mexico, 2002; p. 13. [Google Scholar]
- García, E. Modificaciones al Sistema de Clasificación Climática de Köppen para Adaptarlo a las Condiciones de la República Mexicana, 5th ed.; Universidad Nacional Autónoma de México, Instituto de Geografía: Mexico City, Mexico, 2004; p. 97. [Google Scholar]
- INEGI. Mapa de Climas del Estado de Colima; Instituto Nacional de Estadística y Geografía: Aguascalientes, Mexico, 2011. [Google Scholar]
- Luhr, J.F.; Carmichael, I.S.E. The Colima volcanic complex, México. I. Post-caldera andesites from Volcán de Colima. Contrib. Mineral. Petrol. 1980, 71, 343–372. [Google Scholar] [CrossRef] [Scilit]
- Macías, J.L. Geología e historia eruptiva de algunos de los grandes volcanes activos de México. Boletín Soc. Geol. Mex. 2005, 57, 379–424. [Google Scholar] [CrossRef] [Scilit]
- Robin, C.; Mossand, P.; Camus, G.; Cantagrel, J.M.; Gourgaud, A.; Vincent, P.M. Eruptive history of the Colima volcanic complex (México). J. Volcanol. Geotherm. Res. 1987, 31, 99–113. [Google Scholar] [CrossRef] [Scilit]
- Saucedo-Girón, R.; Macías, J.L.; Gavilanes-Ruíz, J.C.; Arce, J.L.; Komorowski, J.C.; Gardner, J.E.; Valdez-Moreno, G. Eyewitness, stratigraphy, chemistry, and eruptive dynamics of the 1913 Plinian eruption of Volcán de Colima, México. J. Volcanol. Geotherm. Res. 2010, 191, 149–166. [Google Scholar] [CrossRef] [Scilit]
- Rodríguez-Sedano, L.A.; Sarocchi, D.; Caballero, L.; Borselli, L.; Ortiz-Rodríguez, A.J.; Cerca-Ruiz, M.F.; Moreno-Chávez, G.; Franco-Ramos, O. Post-eruptive lahars related to the 1913 eruption in La Lumbre Ravine, Volcán de Colima, México: The influence of ravine morphometry on flow dynamics. J. Volcanol. Geotherm. Res. 2022, 421, 107423. [Google Scholar] [CrossRef] [Scilit]
- Capra, L.; Coviello, V.; Borselli, L.; Márquez-Ramírez, V.-H.; Arámbula-Mendoza, R. Hydrological control of large hurricane-induced lahars: Evidence from rainfall–runoff modeling, seismic and video monitoring. Nat. Hazards Earth Syst. Sci. 2018, 18, 781–794. [Google Scholar] [CrossRef] [Scilit]
- SAGARPA. Producción Agrícola: Cultivos Cíclicos y Perennes 2009. Riego y Temporal. Limón; Secretaría de Agricultura, Ganadería, Desarrollo Rural, Pesca y Alimentación: Mexico City, Mexico, 2009. [Google Scholar]
- Casabella-González, M.J. Estudio de Erosión Hídrica en Varias Localizaciones de la Sierra de San Miguelito, San Luis Potosí, Mexico: Evaluación de la Erodibilidad de los Suelos y Modelado del Proceso. Master’s Thesis, Universidad Autónoma de San Luis Potosí, San Luis Potosí, Mexico, 2015. [Google Scholar]
- Bouyoucos, G.J. Hydrometer method improved for making particle size analyses of soils. Agron. J. 1962, 54, 464–465. [Google Scholar] [CrossRef] [Scilit]
- Rawls, W.J.; Brakensiek, D.L.; Miller, N. Green–Ampt infiltration parameters from soils data. J. Hydraul. Eng. 1983, 109, 62–70. [Google Scholar] [CrossRef] [Scilit]
- Vieux, B.E. Distributed Hydrologic Modeling Using GIS, 2nd ed.; Kluwer Academic Publishers: Dordrecht, The Netherlands, 2004; pp. 105–106. [Google Scholar]
- Chapra, S.C.; Canale, R.P. Numerical Methods for Engineers, 5th ed.; McGraw-Hill: New York, NY, USA, 2007. [Google Scholar]
- Kleinbaum, D.G.; Kupper, L.L.; Nizam, A.; Rosenberg, E.S. Applied Regression Analysis and Other Multivariable Methods, 5th ed.; Cengage Learning: Boston, MA, USA, 2013; p. 1072. [Google Scholar]
- Hillel, D. Environmental Soil Physics; Academic Press: San Diego, CA, USA, 1998. [Google Scholar]
- Nimmo, J.R. Simple predictions of maximum transport rate in unsaturated soil and rock. Water Resour. Res. 2007, 43, W05426. [Google Scholar] [CrossRef] [Scilit]
- Assouline, S. Infiltration into soils: Conceptual approaches and solutions. Water Resour. Res. 2013, 49, 1755–1772. [Google Scholar] [CrossRef] [Scilit]
- Vandervaere, J.-P.; Vauclin, M.; Elrick, D.E. Transient flow from tension infiltrometers. II. Four methods to determine sorptivity and conductivity. Soil Sci. Soc. Am. J. 2000, 64, 1272–1284. [Google Scholar] [CrossRef] [Scilit]
- Rawls, W.J.; Brakensiek, D.L. Estimation of soil water retention and hydraulic properties. In Unsaturated Flow in Hydrologic Modeling; Morel-Seytoux, H.J., Ed.; NATO ASI Series; Springer: Dordrecht, The Netherlands, 1989; Volume 275, pp. 275–300. [Google Scholar]
- Haverkamp, R.; Parlange, J.Y.; Starr, J.L.; Schmitz, G.; Fuentes, C. Infiltration under ponded conditions. Soil Sci. 1990, 149, 292–300. [Google Scholar] [CrossRef] [Scilit]
- Tucker, G.E.; Bras, R.L. Hillslope processes, drainage density, and landscape morphology. Water Resour. Res. 1998, 34, 2751–2764. [Google Scholar] [CrossRef] [Scilit]
- Lavee, H.; Poesen, J.W.A. Overland flow generation and continuity on stone-covered soil surfaces. Hydrol. Process. 1991, 5, 345–360. [Google Scholar] [CrossRef] [Scilit]
- Cerdà, A. Effects of rock fragment cover on soil infiltration, interrill runoff and erosion. Eur. J. Soil Sci. 2001, 51, 59–68. [Google Scholar] [CrossRef] [Scilit]
- Poesen, J.; Lavee, H. Rock fragments in top soils: Significance and processes. Catena 1994, 23, 1–28. [Google Scholar] [CrossRef] [Scilit]
- Beven, K.; Germann, P. Macropores and water flow in soils. Water Resour. Res. 1982, 18, 1311–1325. [Google Scholar] [CrossRef] [Scilit]
- Jarvis, N.J.; Moeys, J.; Hollis, J.M.; Reichenberger, S.; Lindahl, A.M.L.; Dubus, I.G. A conceptual model of soil susceptibility to macropore flow. Vadose Zone J. 2009, 8, 902–910. [Google Scholar] [CrossRef] [Scilit]
- Bear, J. Dynamics of Fluids in Porous Media; Elsevier: New York, NY, USA, 1972. [Google Scholar]
- Kool, J.B.; Parker, J.C. Development and evaluation of closed-form expressions for hysteretic soil hydraulic properties. Water Resour. Res. 1987, 23, 105–114. [Google Scholar] [CrossRef] [Scilit]
- Mualem, Y. A conceptual model of hysteresis. Water Resour. Res. 1974, 10, 514–520. [Google Scholar] [CrossRef] [Scilit]
- Philip, J.R. The theory of infiltration: I. The infiltration equation and its solution. Soil Sci. 1957, 83, 345–358. [Google Scholar] [CrossRef] [Scilit]
- Bracken, L.J.; Croke, J. The concept of hydrological connectivity and its contribution to understanding runoff-dominated geomorphic systems. Hydrol. Process. 2007, 21, 1749–1763. [Google Scholar] [CrossRef] [Scilit]
- Borselli, L.; Cassi, P.; Torri, D. Prolegomena to sediment and flow connectivity in the landscape: A GIS and field numerical assessment. Catena 2008, 75, 268–277. [Google Scholar] [CrossRef] [Scilit]
- Bracken, L.J.; Wainwright, J.; Ali, G.A.; Tetzlaff, D.; Smith, M.W.; Reaney, S.M.; Roy, A.G. Concepts of hydrological connectivity: Research approaches, pathways and future agendas. Earth-Sci. Rev. 2013, 119, 17–34. [Google Scholar] [CrossRef] [Scilit]
- Turnbull, L.; Wainwright, J.; Brazier, R.E. A conceptual framework for understanding semi-arid land degradation: Ecohydrological interactions across multiple space and time scales. Ecohydrology 2008, 1, 23–34. [Google Scholar] [CrossRef] [Scilit]
- Revol, P.; Clothier, B.E.; Vachaud, G.; Thony, J.L. Predicting the field characteristics of drip irrigation. Soil Technol. 1991, 4, 125–134. [Google Scholar] [CrossRef] [Scilit]
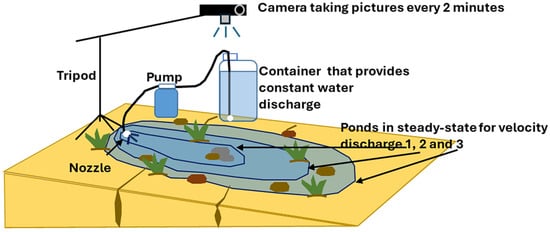
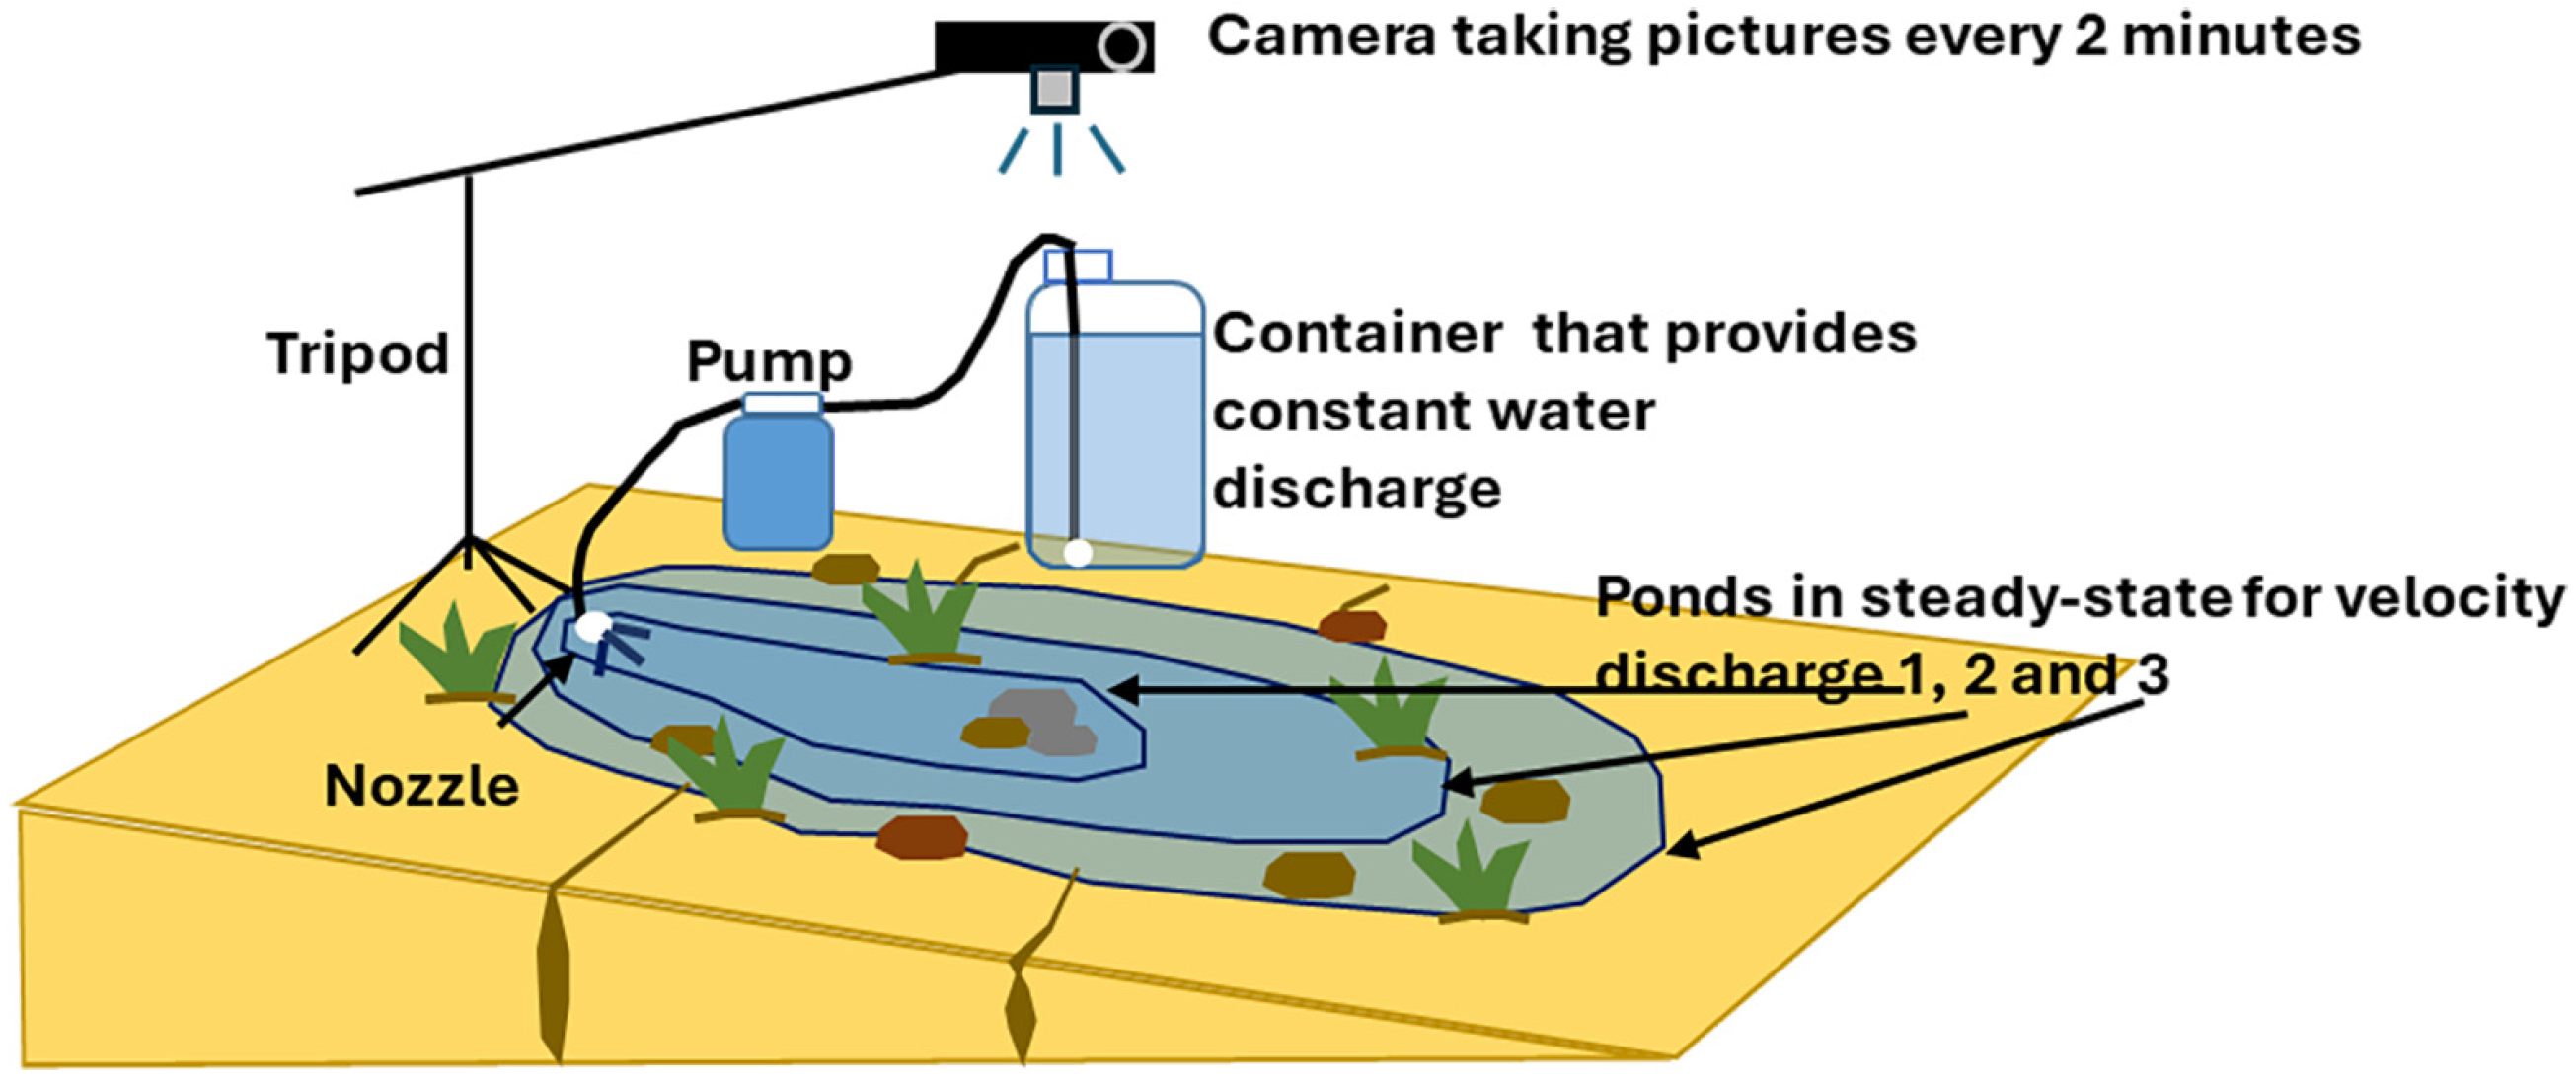
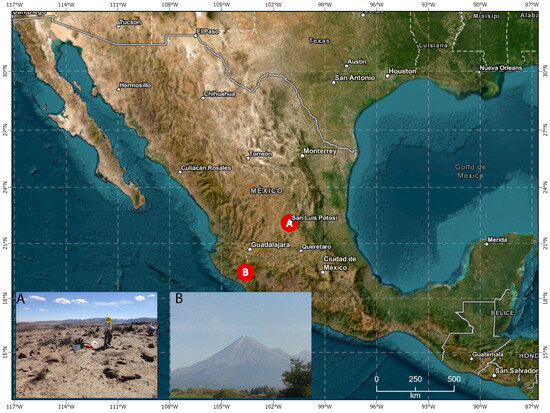
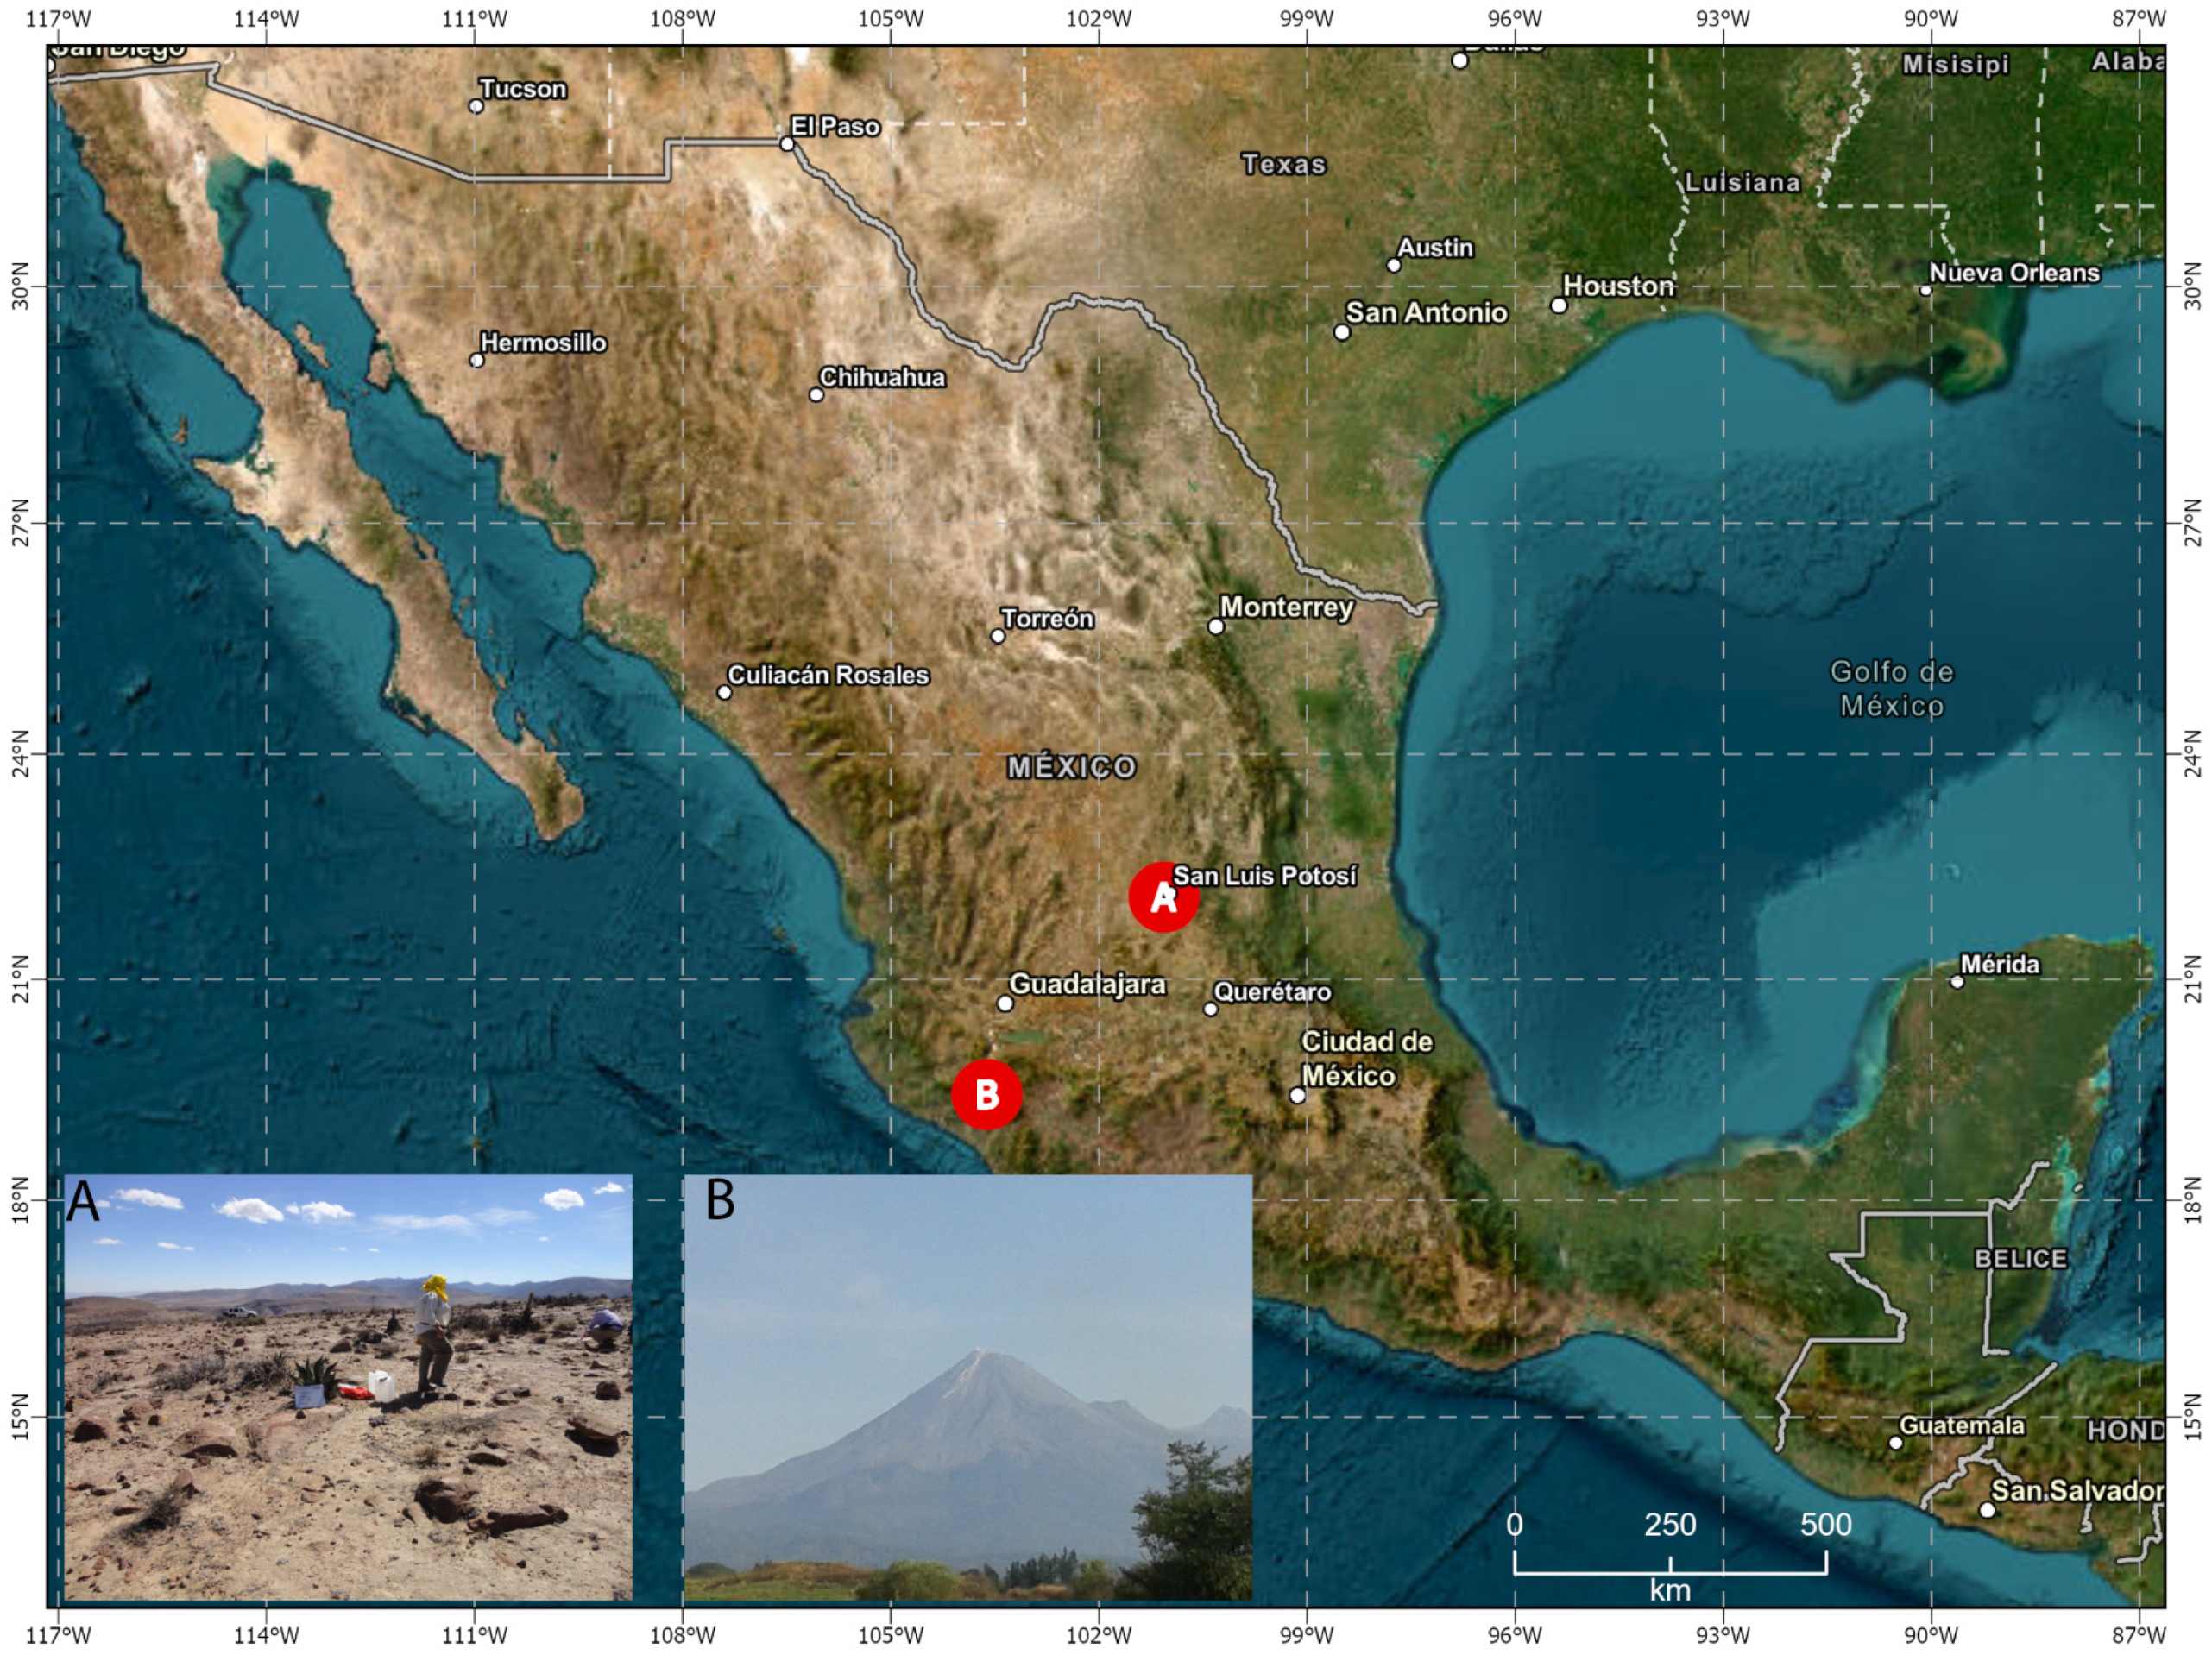
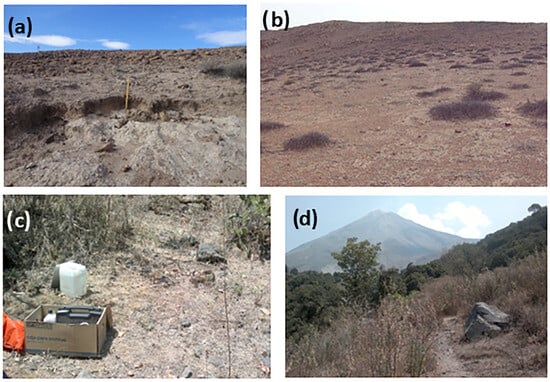
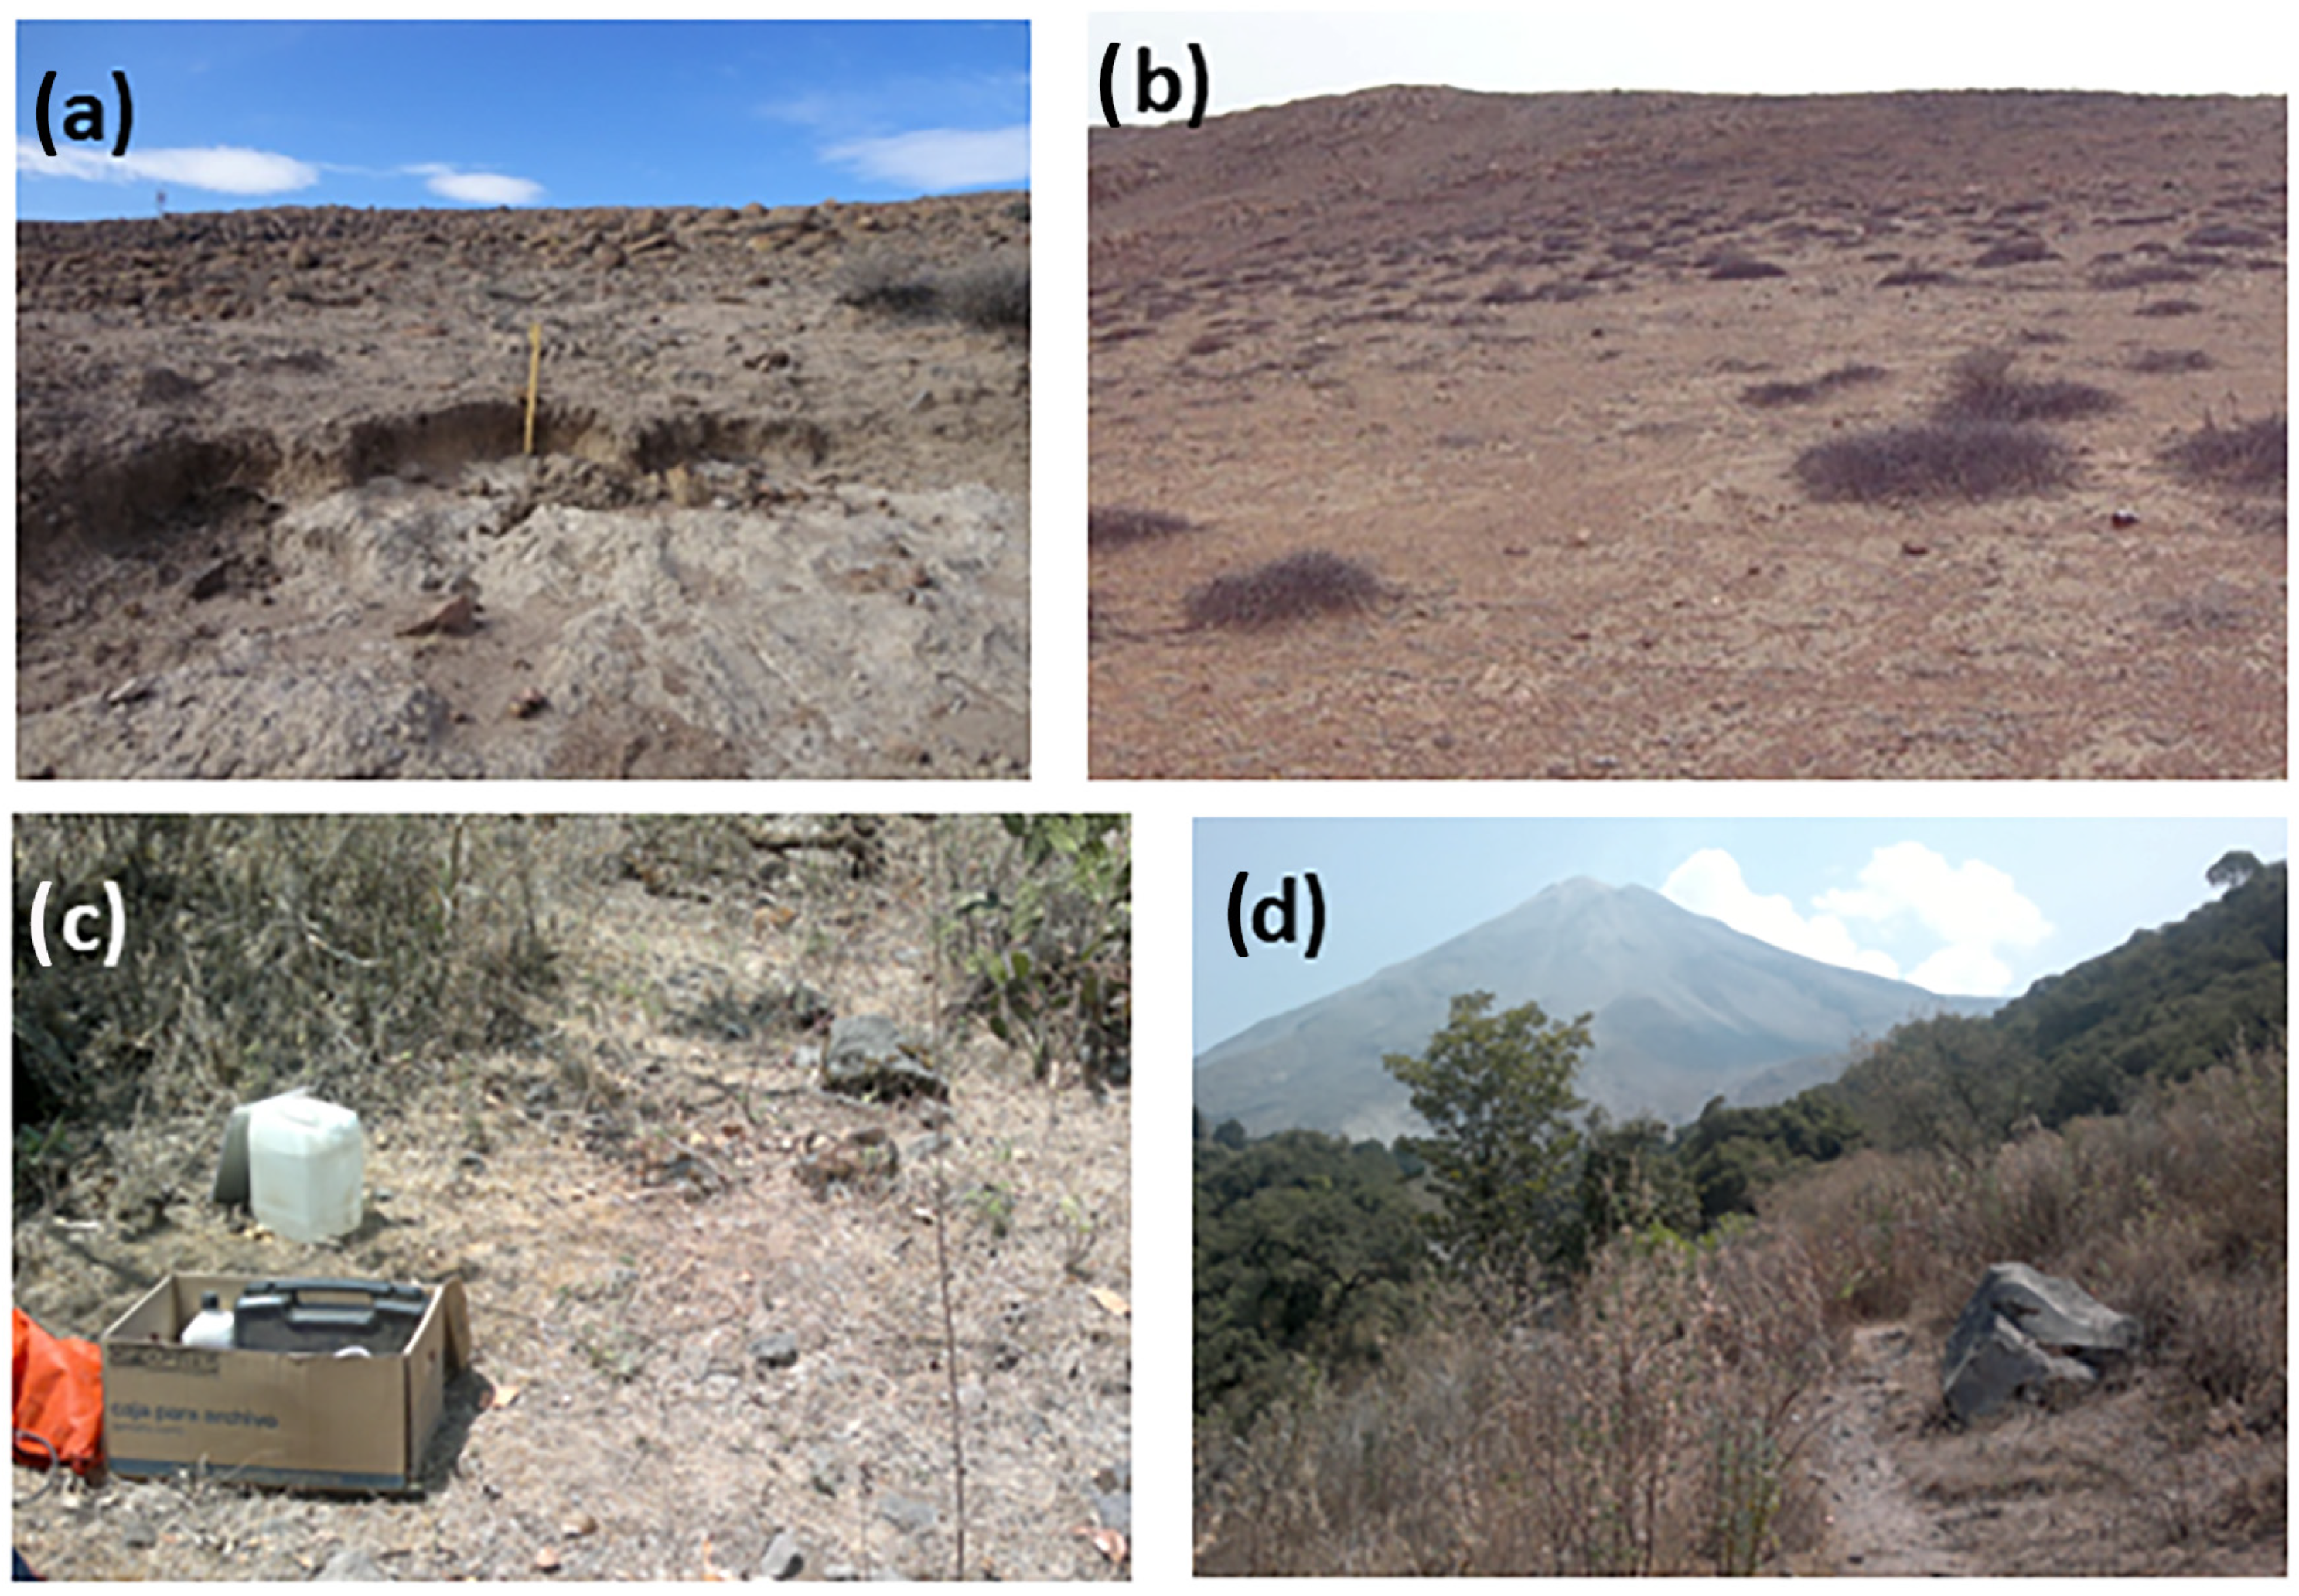
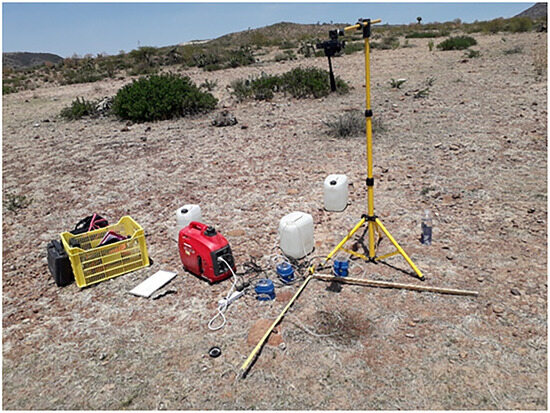
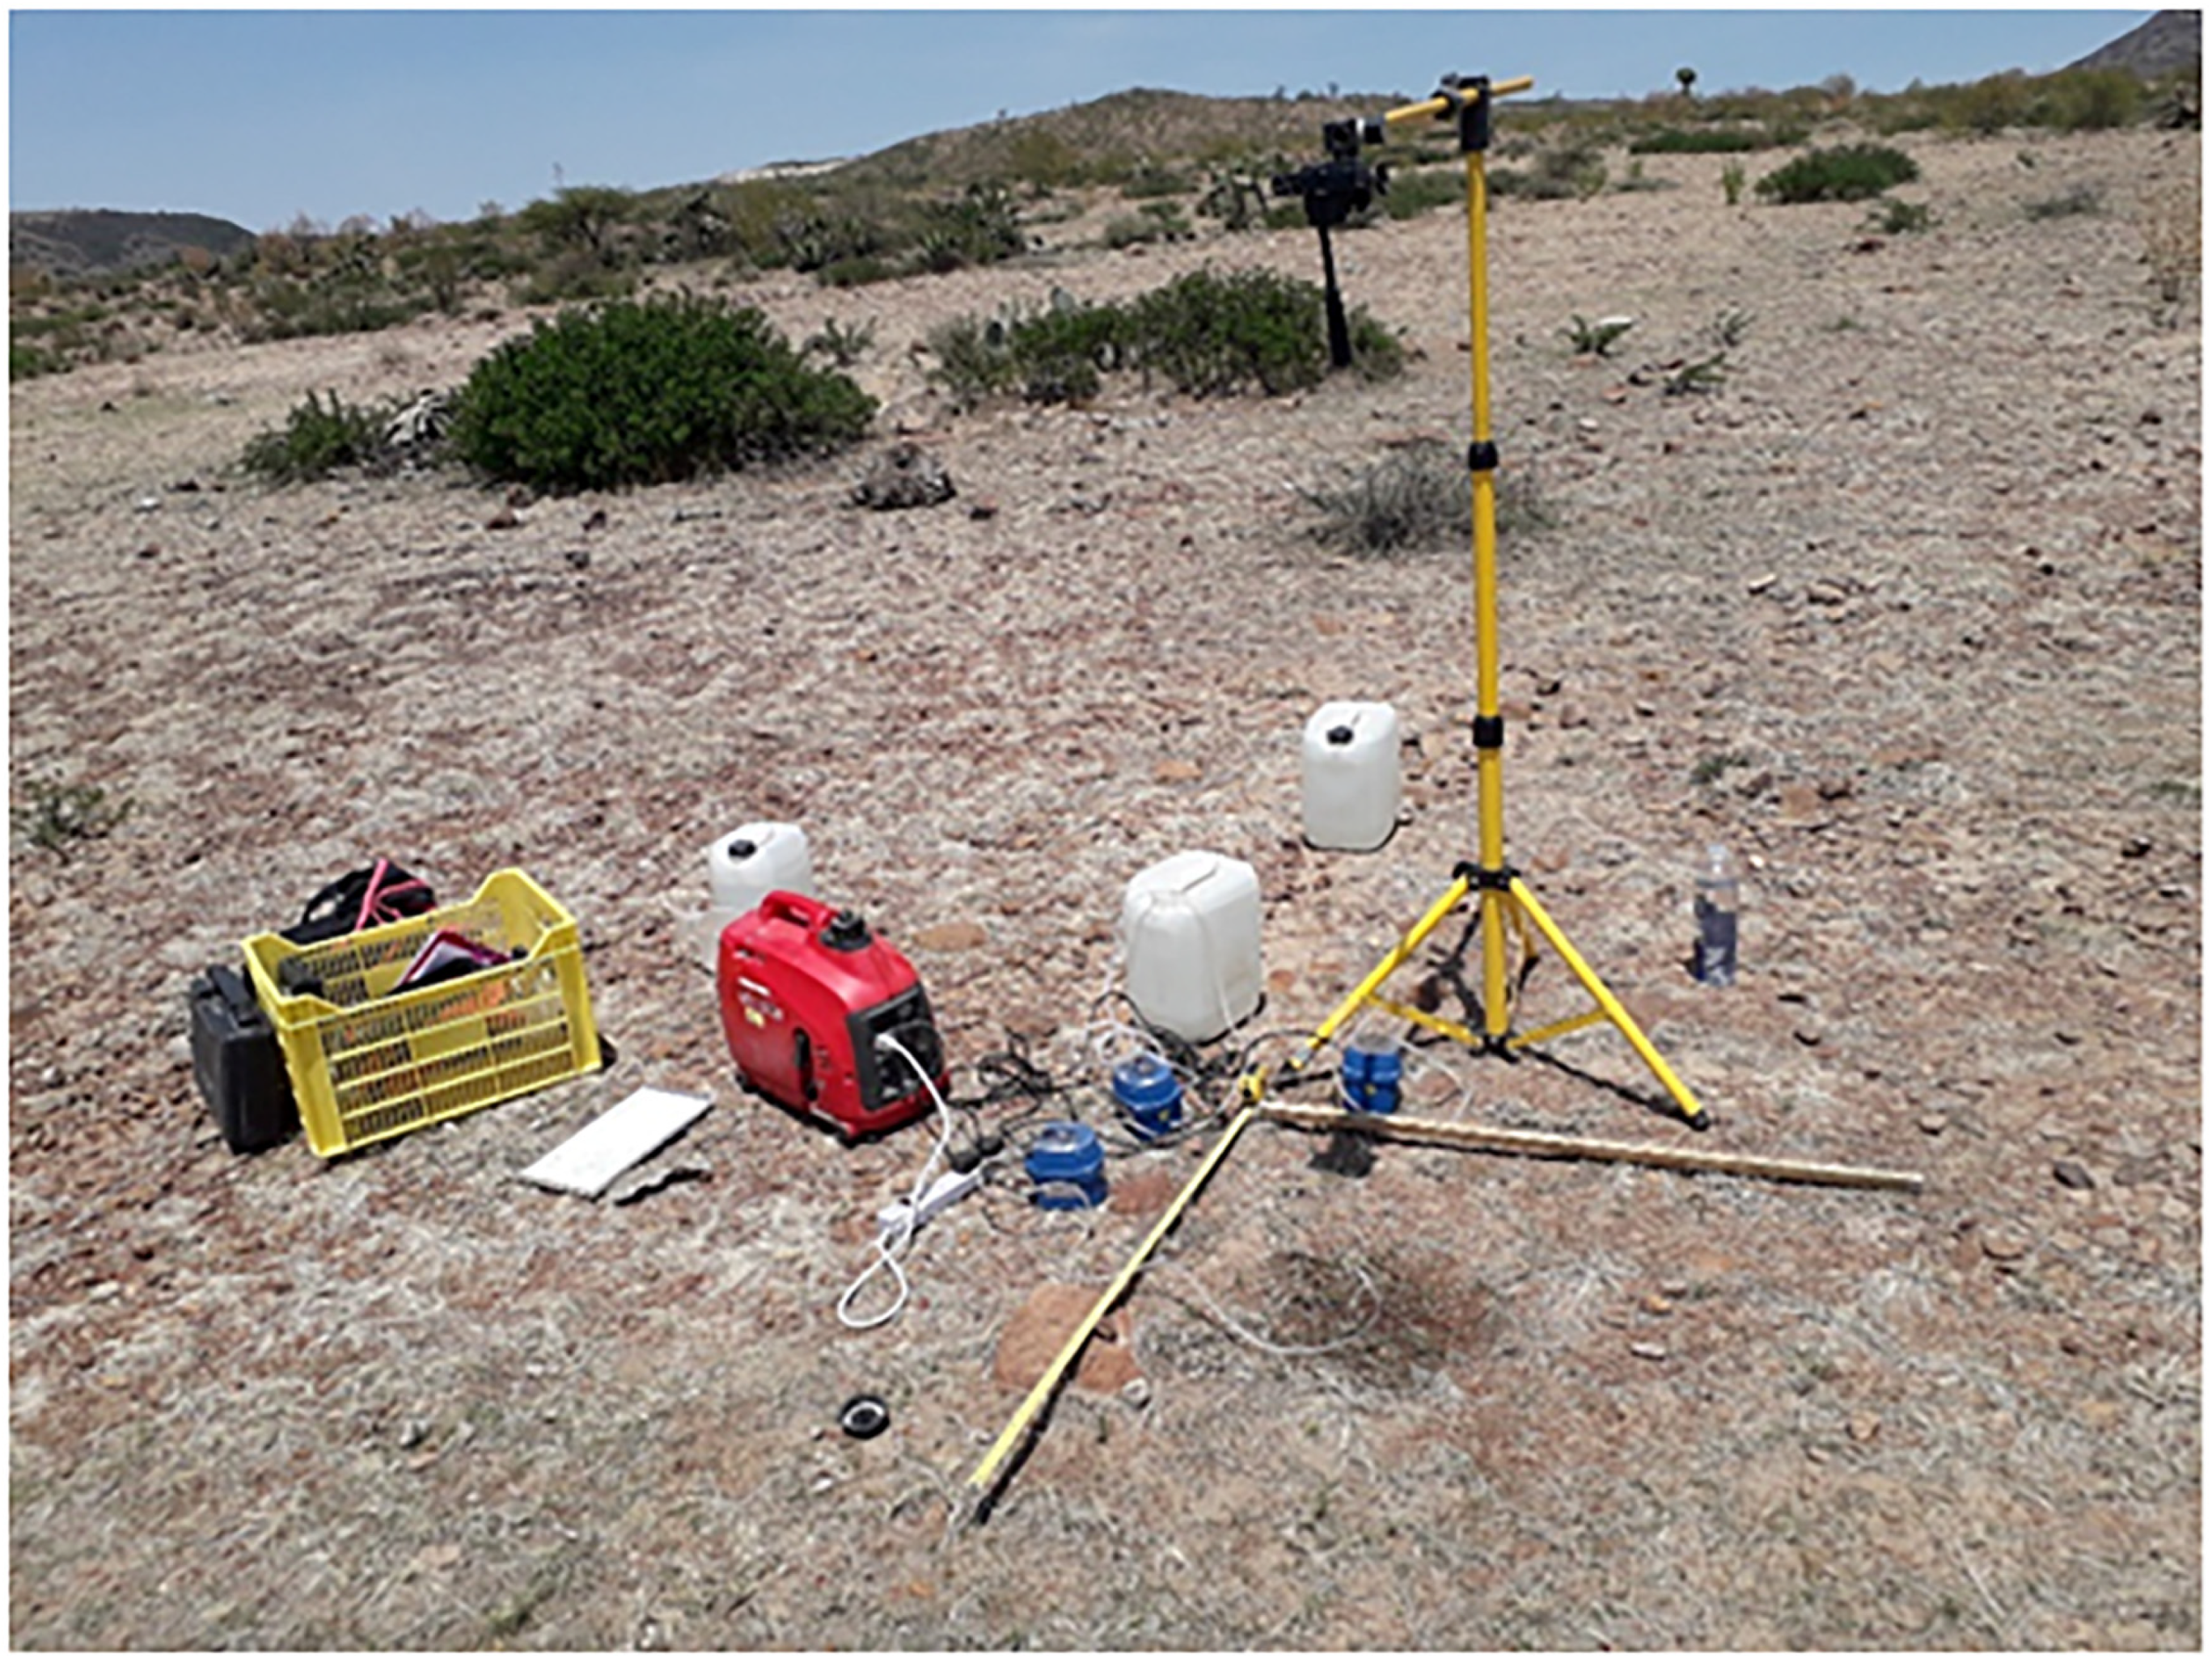
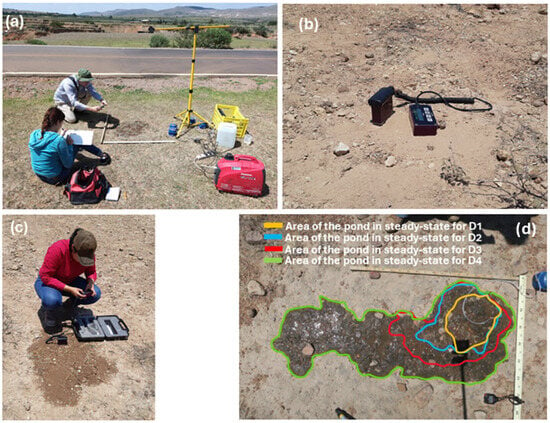
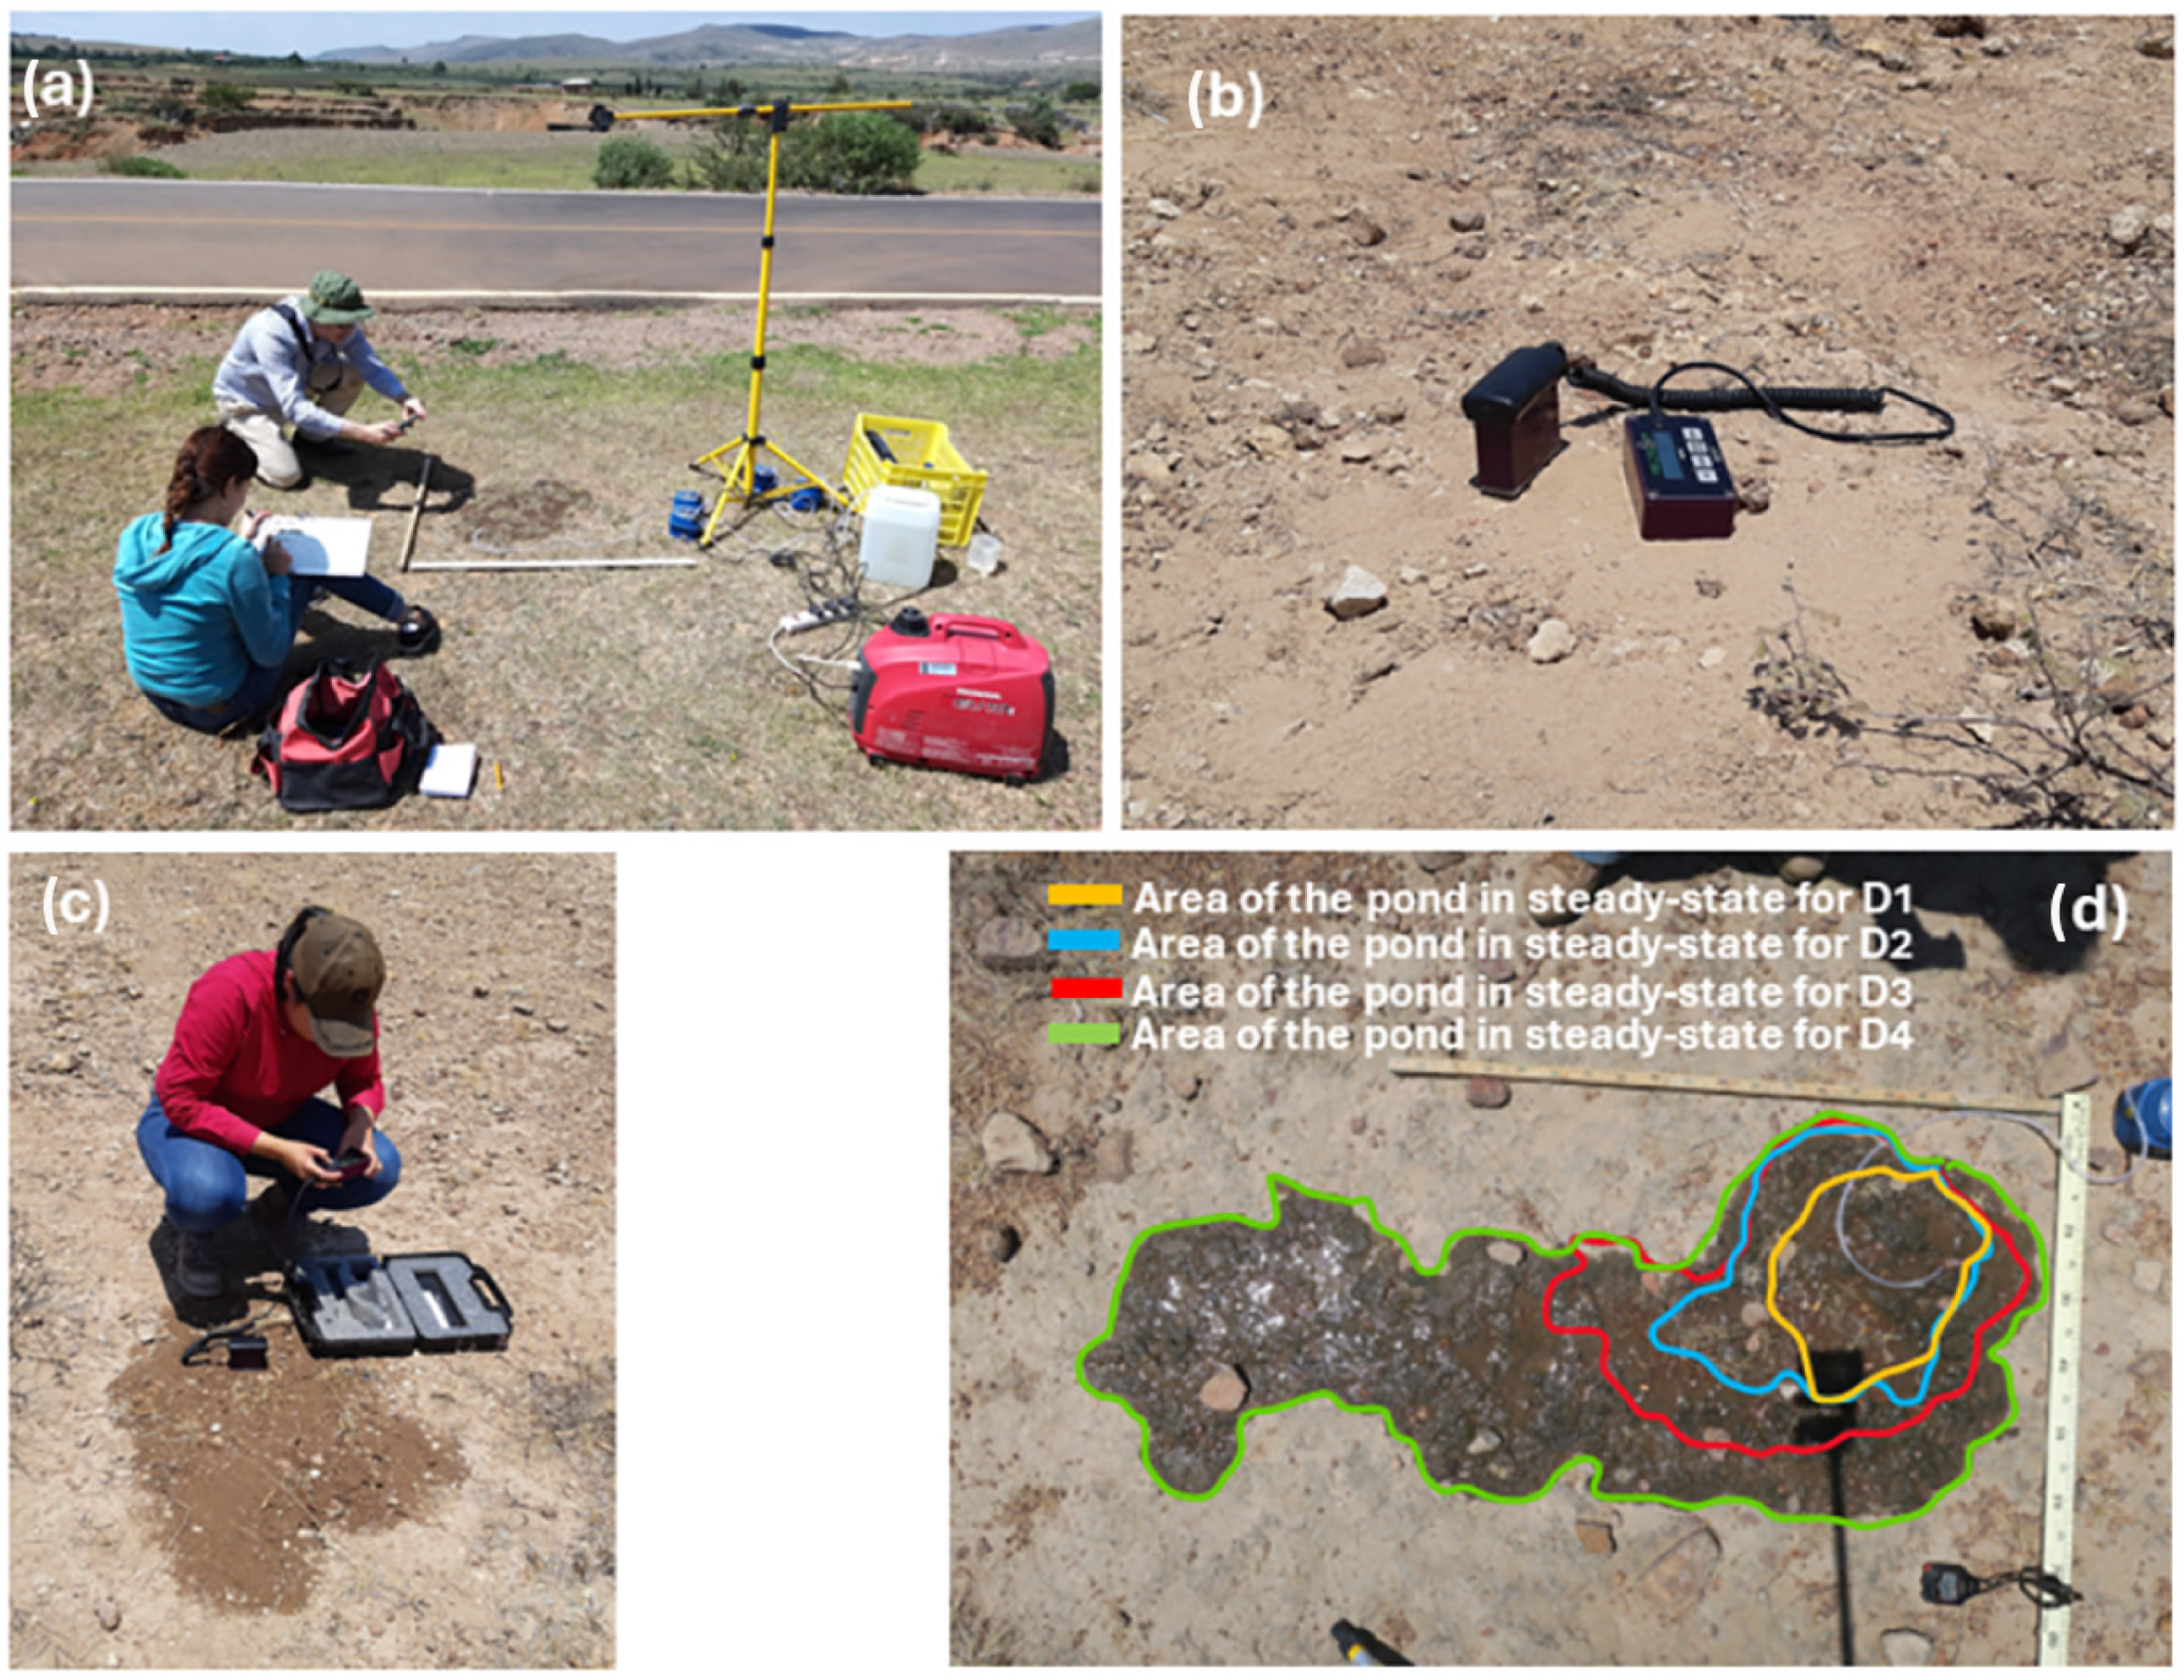
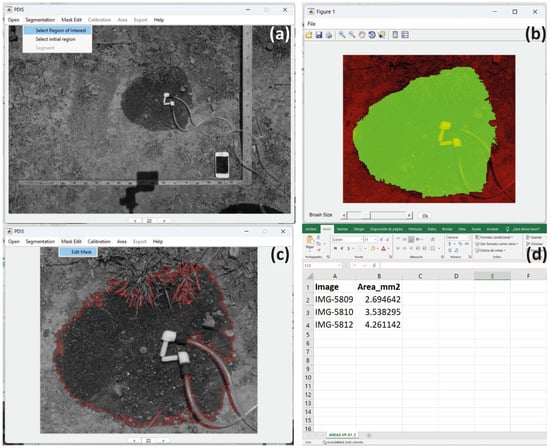
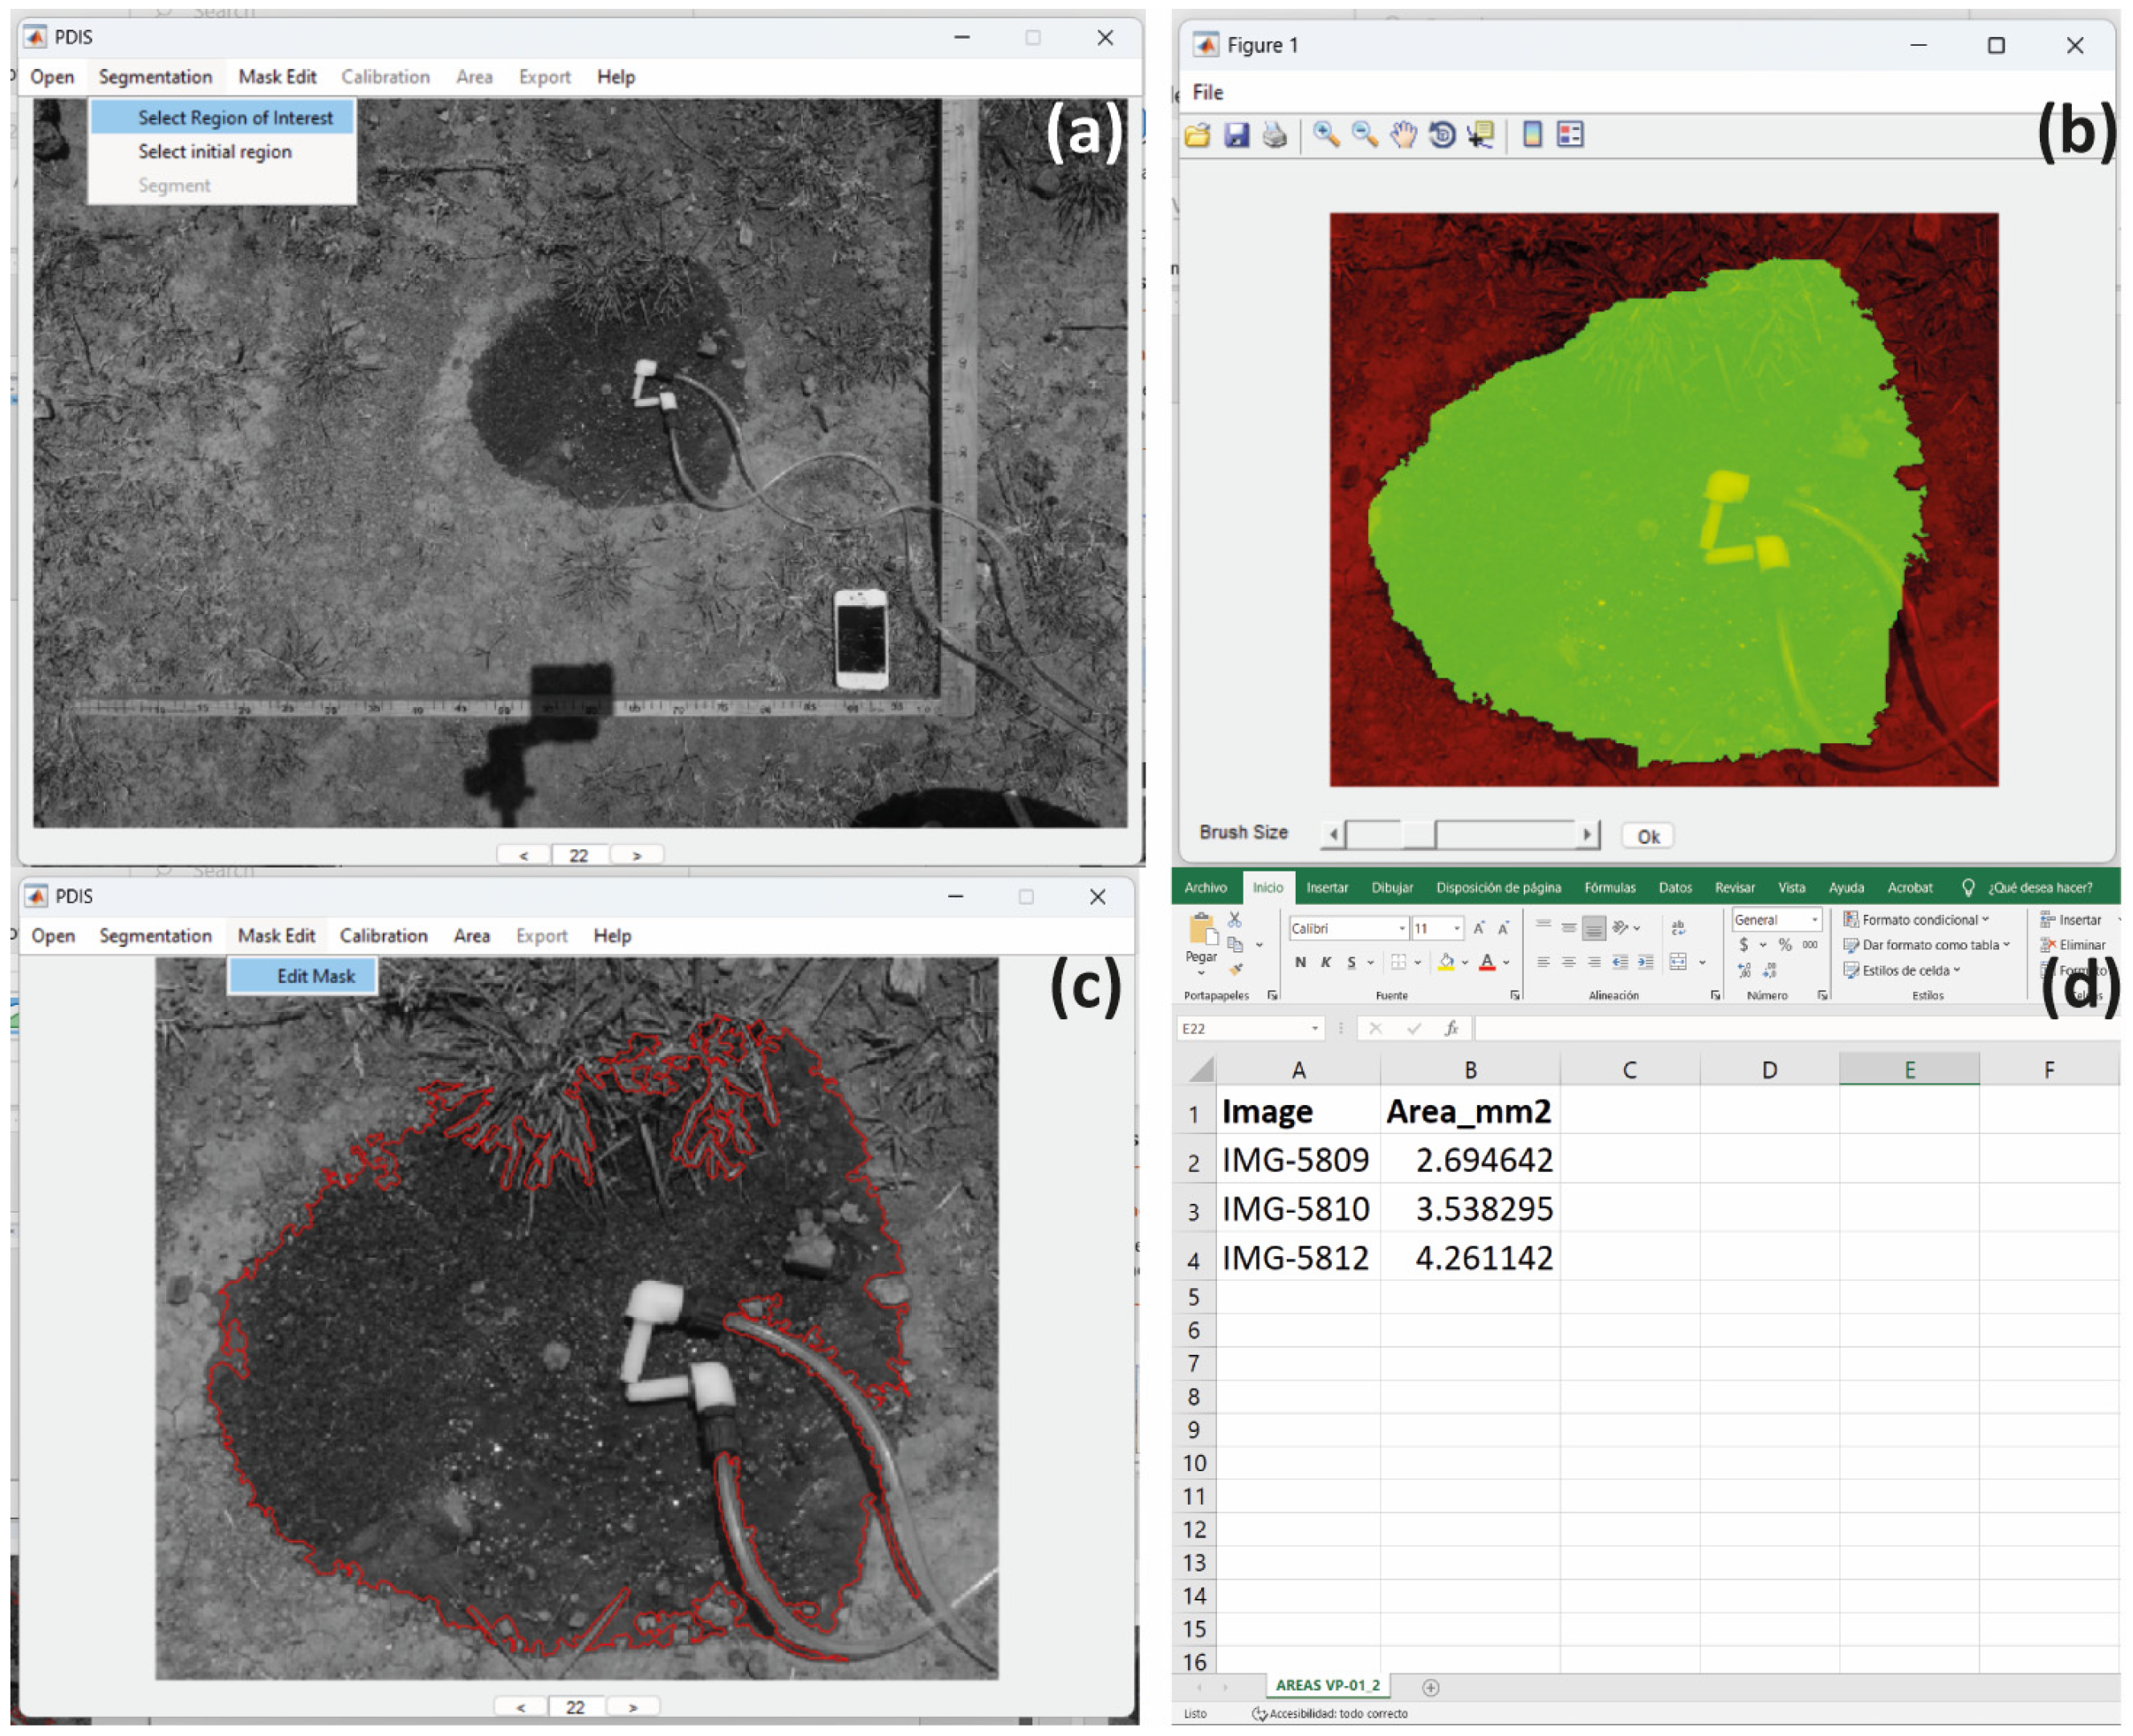

Disclaimer/Publisher’s Note: The statements, opinions and data contained in all publications are solely those of the individual author(s) and contributor(s) and not of MDPI and/or the editor(s). MDPI and/or the editor(s) disclaim responsibility for any injury to people or property resulting from any ideas, methods, instructions or products referred to in the content. |
© 2026 by the authors. Licensee MDPI, Basel, Switzerland. This article is an open access article distributed under the terms and conditions of the Creative Commons Attribution (CC BY) license.