


Abstract
The geological complexity of Java Island, Indonesia, has resulted in the extensive distribution of very soft clay soils, posing significant challenges to geotechnical design and construction. A reliable estimation of the geotechnical properties of these soils is therefore essential to address these challenges and ensure the safety and sustainability of construction projects. The cone penetration test with pore pressure measurement (CPTu) is a reliable in situ test for soil characterization, providing a continuous shear strength profile. However, the determination of a representative cone bearing factor () to estimate undrained shear strength () is critical for geotechnical design. Although several studies on CPTu have been conducted in Indonesia, there has been a lack of emphasis on establishing values for local soft, high-plasticity clays in Indonesia. This study aims to fill this gap in the literature by proposing updated correlations for specific to the soft, high-plasticity clays of Java, Indonesia, derived from the statistical analysis of combined field and laboratory data obtained from two representative sites in Western Java. These sites correspond to a coastal plain deposit in Central-North Jakarta and an alluvial deposit in Gedebage, Bandung. A comprehensive database was compiled, consisting of 20 CPTu boreholes, 84 depth points of vane shear test (VST), 29 samples of consolidated undrained (CU) triaxial tests, 26 samples of unconsolidated undrained (UU) triaxial tests, and 18 standard penetration test (SPT) boreholes. The results indicate that the representative value for these soft, high-plasticity clays in the investigated sites in Western Java ranges from 14 to 16. A refined empirical correlation between and the pore pressure ratio (Bq) is proposed, demonstrating consistent trends with recent data. Additionally, a reasonable correlation between the undrained modulus () and undrained shear strength of = 276–323 was identified, enabling the derivation of a continuous profile of the undrained modulus from CPTu data. This study also further highlighted the absence of significant relationships between and other parameters such as OCR, PI, and NSPT. These findings provide practical insight and a regionally calibrated reference that can be useful for engineers working in similar soft, high-plasticity clay environments with characteristics comparable to the investigated sites in Western Java.
1. Introduction
Java Island has a wide range of geological and topographical complexities, with the typical soil profile in this region consisting of soft clays in the upper layer [1,2,3]. These soils tend to have low shear strength values and high compressibility that influence the geotechnical design [4]. Despite these challenges, an understanding of the soil properties of the soft soils in Java is essential to ensure a safe and optimal design. Typically, in practice, engineers rely on in situ testing to determine the soil design parameters using an empirical correlation due to the limited availability of soil laboratory testing programs.
One commonly used in situ test is the cone penetration test with pore pressure measurement (CPTu/piezocone), which can provide continuous friction and cone resistance profiles compared to other in situ tests. Engineers then use these values to determine shear strength and stiffness parameters using empirical correlations. However, to determine the shear strength, extensive in situ and laboratory tests are needed to calibrate the cone bearing factor (), which can vary depending on the properties of the clay. In general, needs to be calibrated using more accurate shear strength measurements, such as the vane shear test (VST) and laboratory tests using triaxial tests. However, the research related to soil characterization using CPTu in Indonesia is still limited.
Therefore, this study evaluates the undrained shear strength of soft, high-plasticity clays on Java Island, derived from CPTu tests conducted at two selected sites in Central-North Jakarta and Gedebage, Bandung. These sites represent coastal plain and soft alluvial basin deposits, respectively. A suitable value is then proposed for engineers to estimate the undrained shear strength of soft, high-plasticity clays similar to the investigated sites in this study. The results of this study are expected to provide a practical reference for geotechnical engineers to perform more precise interpretations of soil parameters using CPTu testing.
2. Undrained Shear Strength from CPTu
It is common for practicing engineers to estimate undrained shear strength based on CPTu test results. Different theoretical solutions, such as classical bearing capacity, the strain path method, and cavity expansion theory, have been proposed by many researchers. These theories were developed based on similar failure mechanisms with deep circular foundations. The undrained shear strength can then be determined by relating it to cone resistances [5] using the following bearing capacity equation [6]:
where is the bearing capacity of cones with a diameter of 36 mm and penetrating at a speed of 20 mm/s; is the bearing capacity factor, which varies depending on the assumptions in the theoretical solutions [7]; is the mobilized shear strength of the soil in the area of the cones; and is the total overburden pressure at the depth level of the cones. According to Mesri [8], the in the cone tip is only restricted to the small volume and mobilized in a few seconds. Therefore, Equation (1) is rewritten as follows:
where is the undrained shear strength obtained from tests such as VST, unconsolidated undrained (UU) triaxial, consolidated undrained (CU) triaxial, or any undrained shear strength value obtained from other measurements. In general, the mode of failure of the cone penetration test is closest to the triaxial compression test. It is known that undrained shear strength values obtained from CPTs or various laboratory experiments do not necessarily correspond to the undrained shear strength mobilized in actual full-scale undrained failure scenarios, such as those occurring under embankments, foundations, sloping soils, and excavations [9]. This discrepancy arises because testing may fail to replicate the shear modes, shear rates, time to failure, and progressive yield observed in actual full-scale undrained failure situations [6]. Consequently, the undrained shear strength derived from cone resistance, calibrated by a test, requires correction before being used in stability calculations. However, it is also common to estimate the bearing capacity factor directly from the laboratory strength tests or the field vane shear test (VST). In this method, the bearing capacity factor () is called the cone bearing capacity factor ().
3. Typical Values
Many researchers have demonstrated the values of different clay soils. ranges from 7 to 20 for Busan clays when calibrated to Su from CU triaxial tests [10]. Based on regression analysis, the average cone factor for New Orleans clay was found to be 13.9 based on 82 clay samples [11]. Recently, different cone bearing factors for Finnish clays were developed based on the mode of failures of the laboratory tests. The values were 16.8, 17.5, and 10.7 for DSS, FV, and triaxial CU, respectively [12].
The cone bearing factor has been shown to be influenced by the overconsolidation ratio (OCR) and plasticity index (PI), with the cone bearing factor showing a decreasing trend with the plasticity index (PI) [7]. However, in a more recent study, tended to increase with OCR and PI with an overall range from 5 to 16 [13,14]. Similarly, other researchers [15] have demonstrated the value as a function of pore pressure ratio () based on 497 high-quality triaxial compression tests. factors were found to decrease with pore pressure ratio Bq with a range between = 6 for soft sensitive and quick clay and = 30 for stiff fissured overconsolidated clays.
Research from Mesri [8] provides an empirical interpretation for the calibrated value in the case of full-scale embankment stability. The cone factor was found to be independent of the plasticity index and overconsolidation ratio ( < 5). With the uncertainty in the variation in soft clay and silts, the range of values can be in the range . This study is considered applicable to organic and inorganic soft clays and silts.
The study of values in Indonesia is very limited. Using VST data, the value for very soft Jakarta marine clay was estimated to be 30 [16]. Another study was also conducted to characterize Jakarta clay using CPTu [17]. However, the study did not evaluate the . Recently, value for soft consolidating marine clay in South Kalimantan was suggested to be about 12.6 [18]. However, there is limited laboratory test data and vane shear test results to calibrate the undrained shear strength obtained from CPTu. Therefore, this study evaluates the value for soft, high-plasticity clays at two sites in Western Java based on several in situ tests and laboratory test data. The objective of this study is to propose representative values for soft, high-plasticity clays similar to those investigated that can be used by practicing engineers to evaluate the undrained shear strength from CPTu tests. Table 1 shows several previous studies that have recommended values for various soil types in many other countries.
Table 1.
Summary of previous recommendations.
4. Java Island Soft Clay
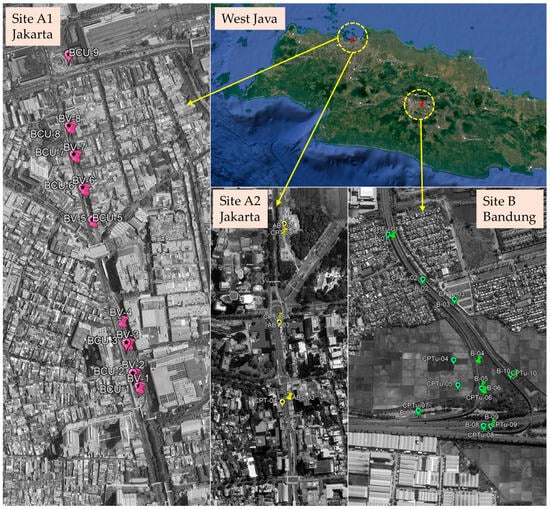
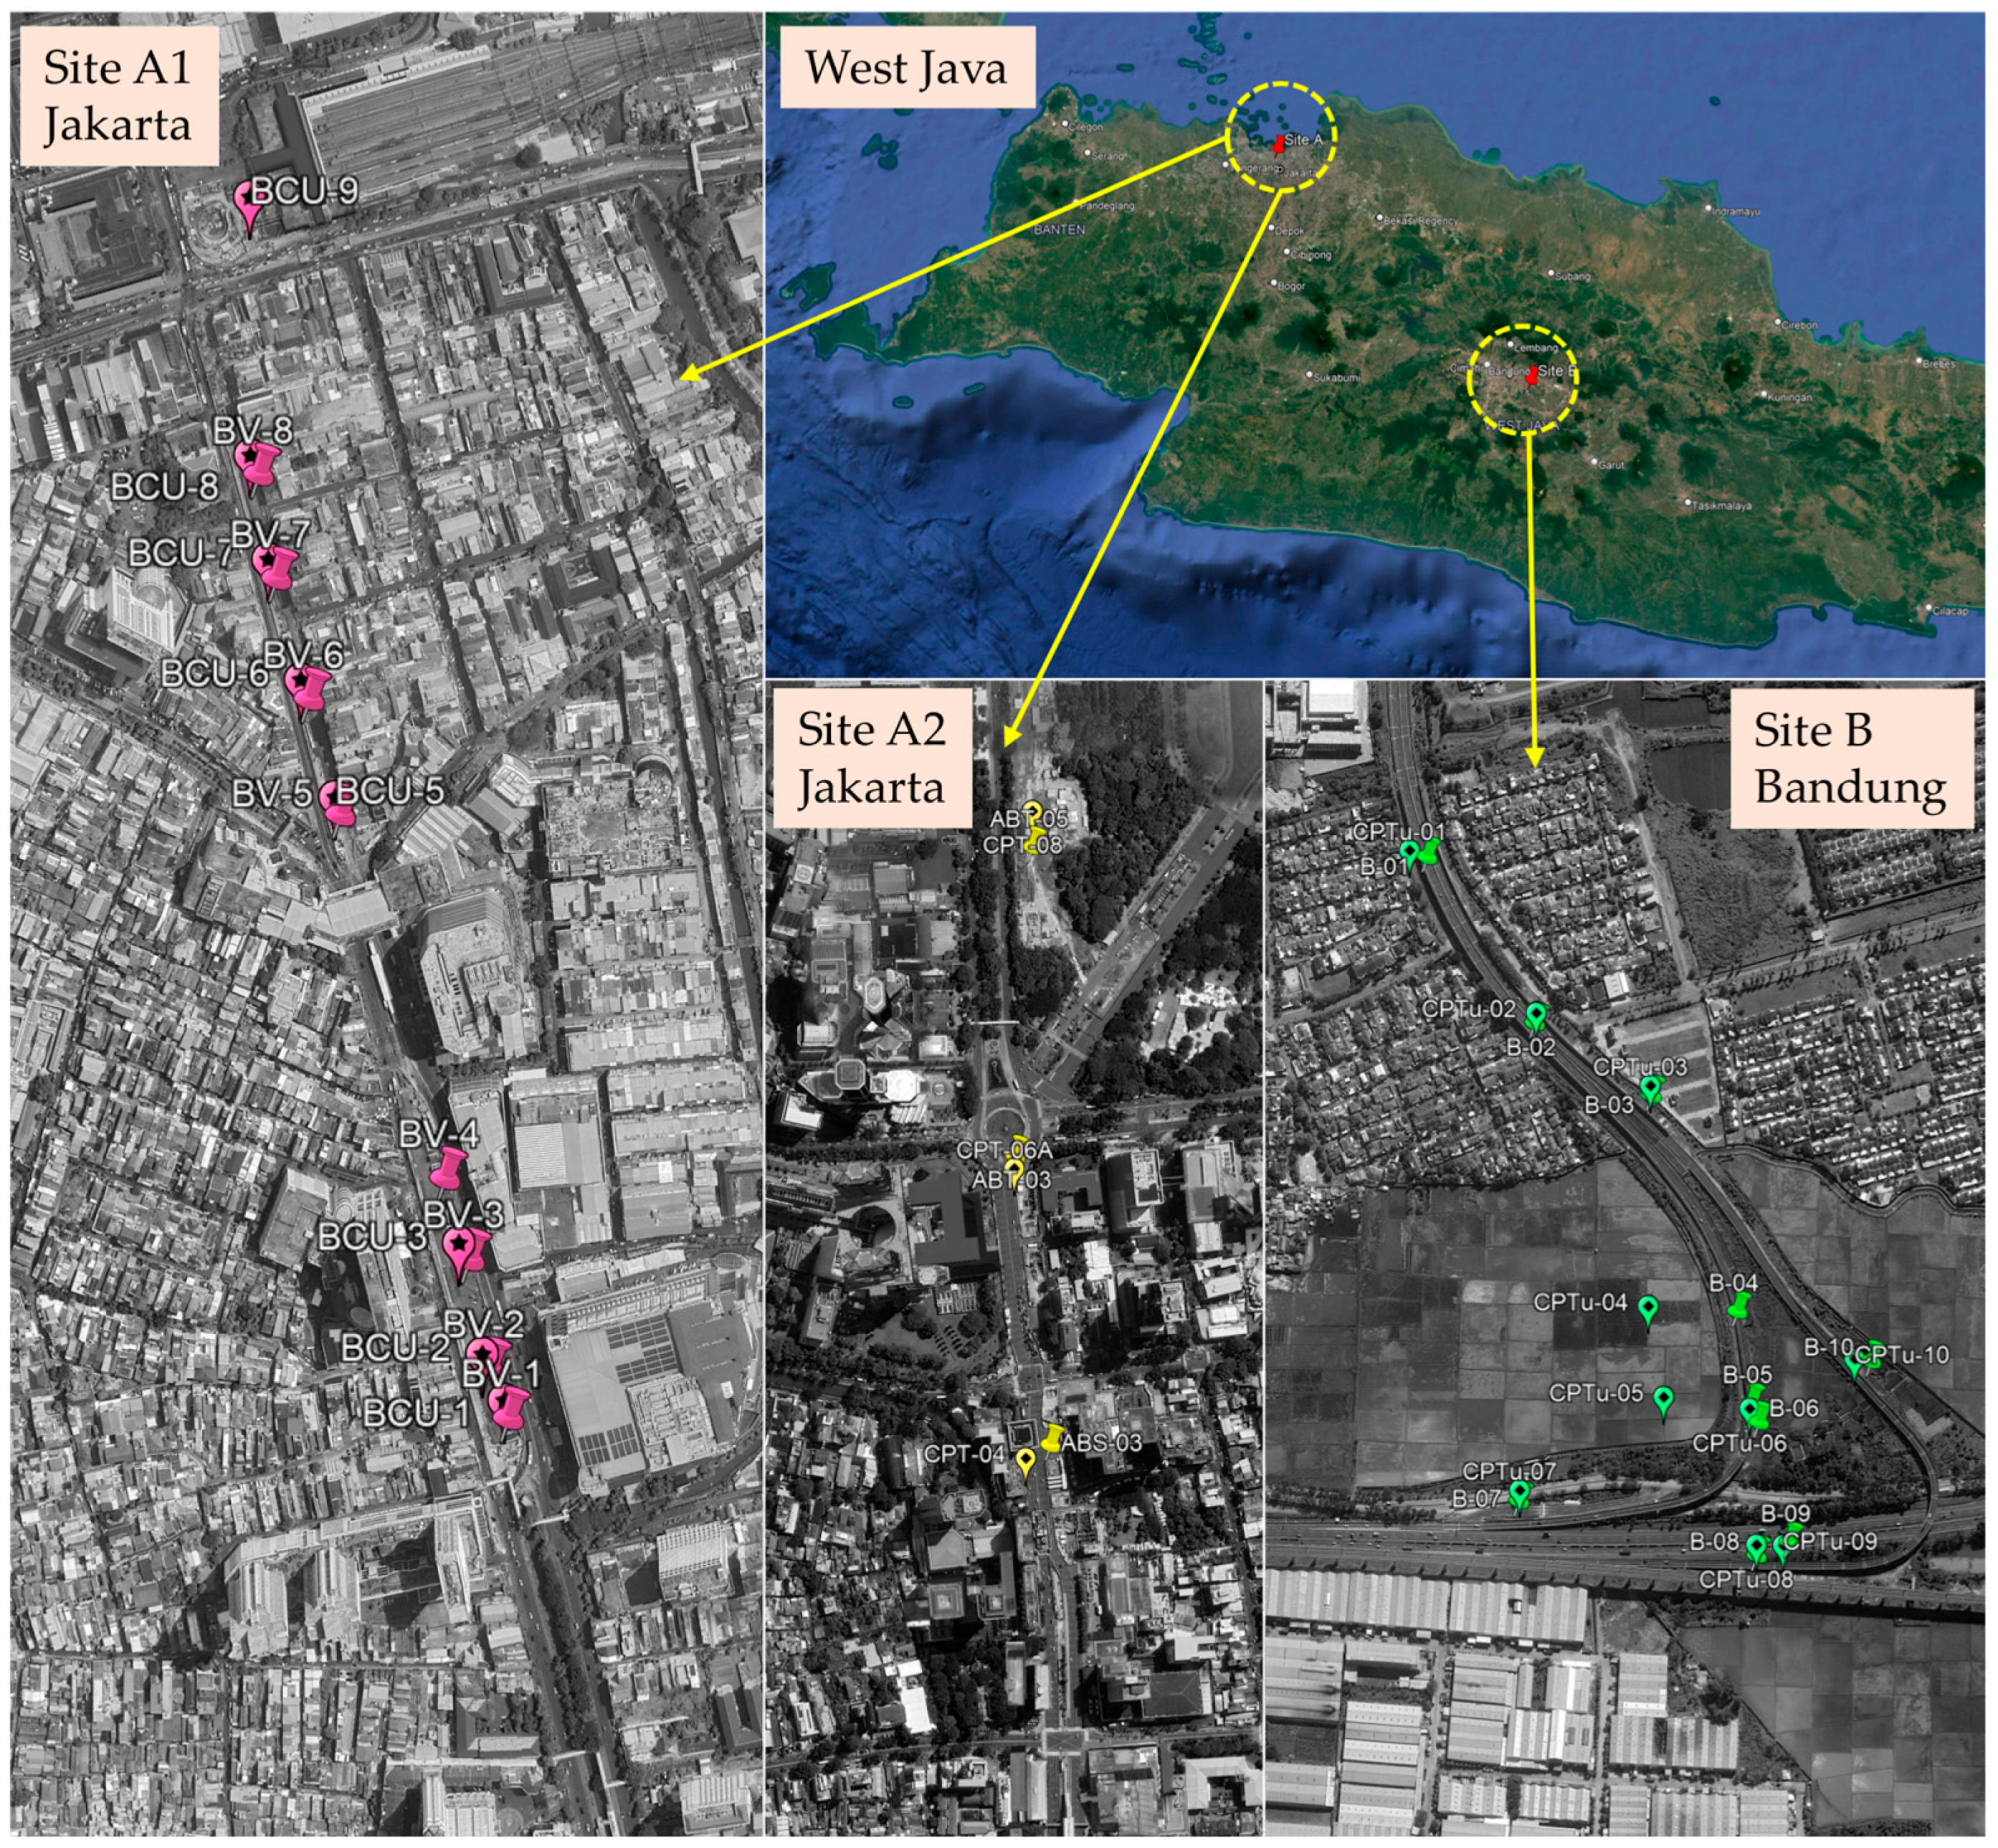
This study focuses on soft clay soil on Western Java. Two locations are evaluated: Site A for Central-North Jakarta and Site B for Gedebage area in South Bandung, as shown in Figure 1. These two sites are known to have very soft clay deposits overlying stiff soils. Soil investigations were conducted both in situ and in laboratories to identify the soil characteristics in Central Jakarta and South Bandung. The selected CPTu data included pairs of triaxial and vane shear test data adjacent to the CPTu points to ensure the reliability of the evaluation of undrained shear strength. The in situ and laboratory tests conducted to evaluate the value consisted of 20 CPTu boreholes, 84 vane shear test (VST) depth points, 29 samples of triaxial CU, 26 samples of triaxial UU, and 18 NSPT boreholes.
Figure 1.
Site locations of the soft clay deposits in Western Java. Site A (Central-North Jakarta ~ 6° 8′33″ S, 106°48′53″ E) and Site B (Bandung ~ 6°58′3″ S, 107°41′36″ E). Colored markers indicate the locations of field investigation in each location. Basemap imagery © Google Earth.
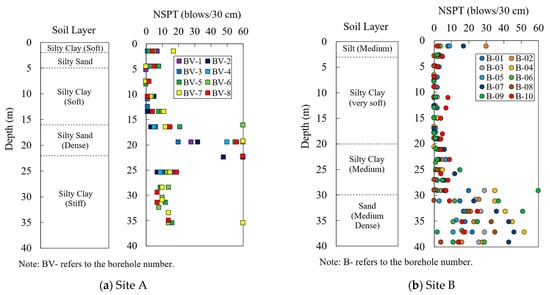
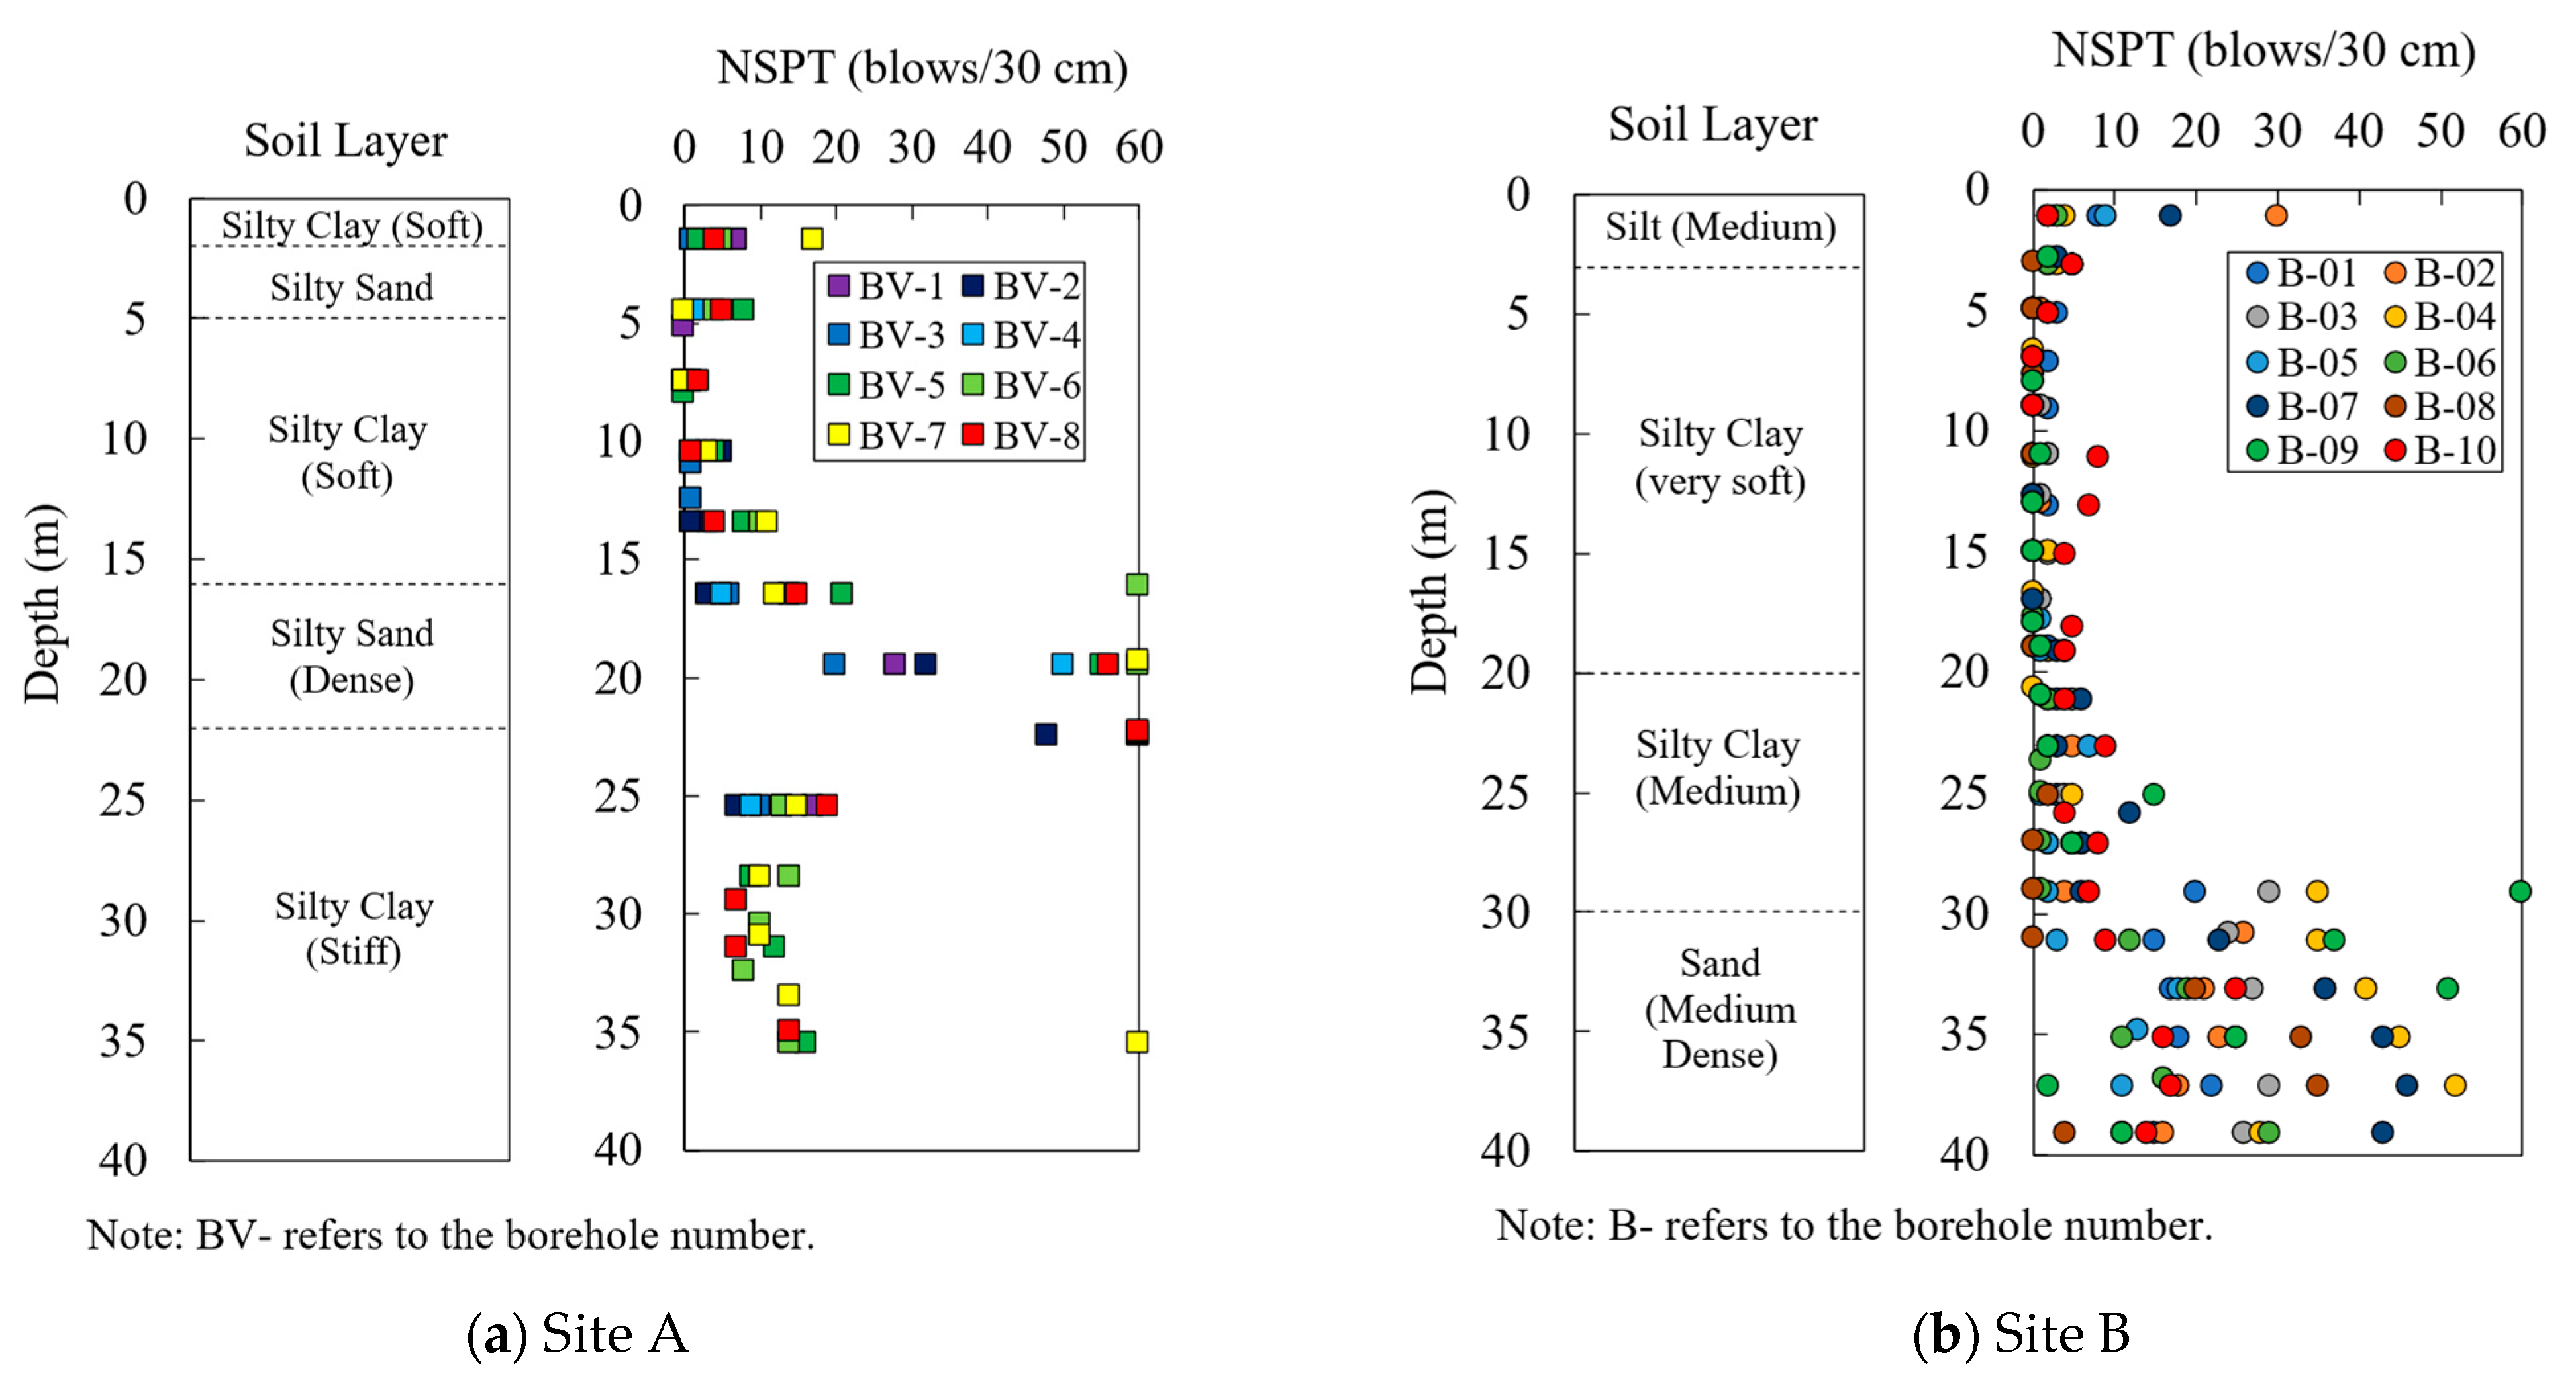
In general, the soil layer in Jakarta consists of a layer of soft clay of varying thicknesses, followed by a layer of dense sand and then deposits of diluvium clays [16]. Figure 2 shows the distribution of NSPT values from 18 bore logs for both sites. The results of the NSPT distribution show that for Site A at a depth of 0–2 m and 5–16 m, there are very soft to soft clay layers with NSPT values ranging from 0 to 5 blows/30 cm. The NSPT database also illustrates that the soil characteristics in Central Jakarta are similar to those described in previous research with some variations. At some points, there are differences in terms of the soil layer thickness.
Figure 2.
NSPT value distribution for each soil layer at (a) Site A and (b) Site B.
At Site B, the South Bandung area has a thicker, soft soil layer at a depth of 3–20 m with NSPT values ranging from 0 to 10, followed by a dense sand layer located at a depth of 30–40 m, which is deeper than the dense sand layer at Site A. However, at both Site A and Site B, there are soft clay layers in the upper part of the soil profiles with some interbedded sand layers at a lower depth.
4.1. CPTu Database on Java Island
In CPTu testing, two important parameters are cone resistance and sleeve friction which measure the tip resistance and side friction of the soils. To obtain undrained shear strength values from CPT testing, there are three methods available: (1) , (2) , and (3) [5]. All of these methods are derived from the bearing capacity theory of a single pile using tip resistance. In the Nc method, the depth term in the bearing capacity equation is ignored. The method considers the effect of depth in terms of total vertical stress. Similar to the method, the method considers the total vertical stress by using the corrected cone resistance () instead of cone resistance () to consider pore pressure effects. The corrected cone resistance () can be calculated using the following equation [5]:
where is the area ratio at the cone tip and is total water pressure acting right behind the cone. The cone area ratio () can be defined as approximately equal to the ratio of the cross-sectional area of the load cell or shaft , divided by the projected area of the cone . Many cone penetrometers have values of cone area ratios ranging from 0.9 to 0.55. For this study, a 0.8 cone area ratio was used, which is in accordance with the recommendation of Mesri [8] to use a CPT with a = 0.8 to eliminate the influence of water pressure and correction for side shear.
In addition to the pressure on the tip of the cone, the vertical force also produces resistance that occurs on the side surface of the cone, which is also called sleeve friction resistance . The ratio between sleeve friction resistance and corrected cone resistance is defined as friction ratio and can be calculated using the following equation:
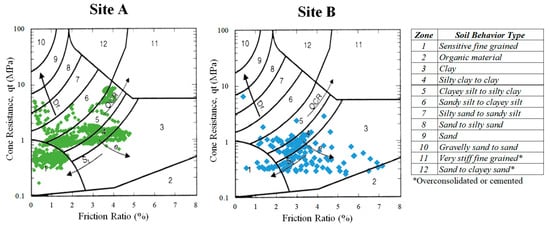
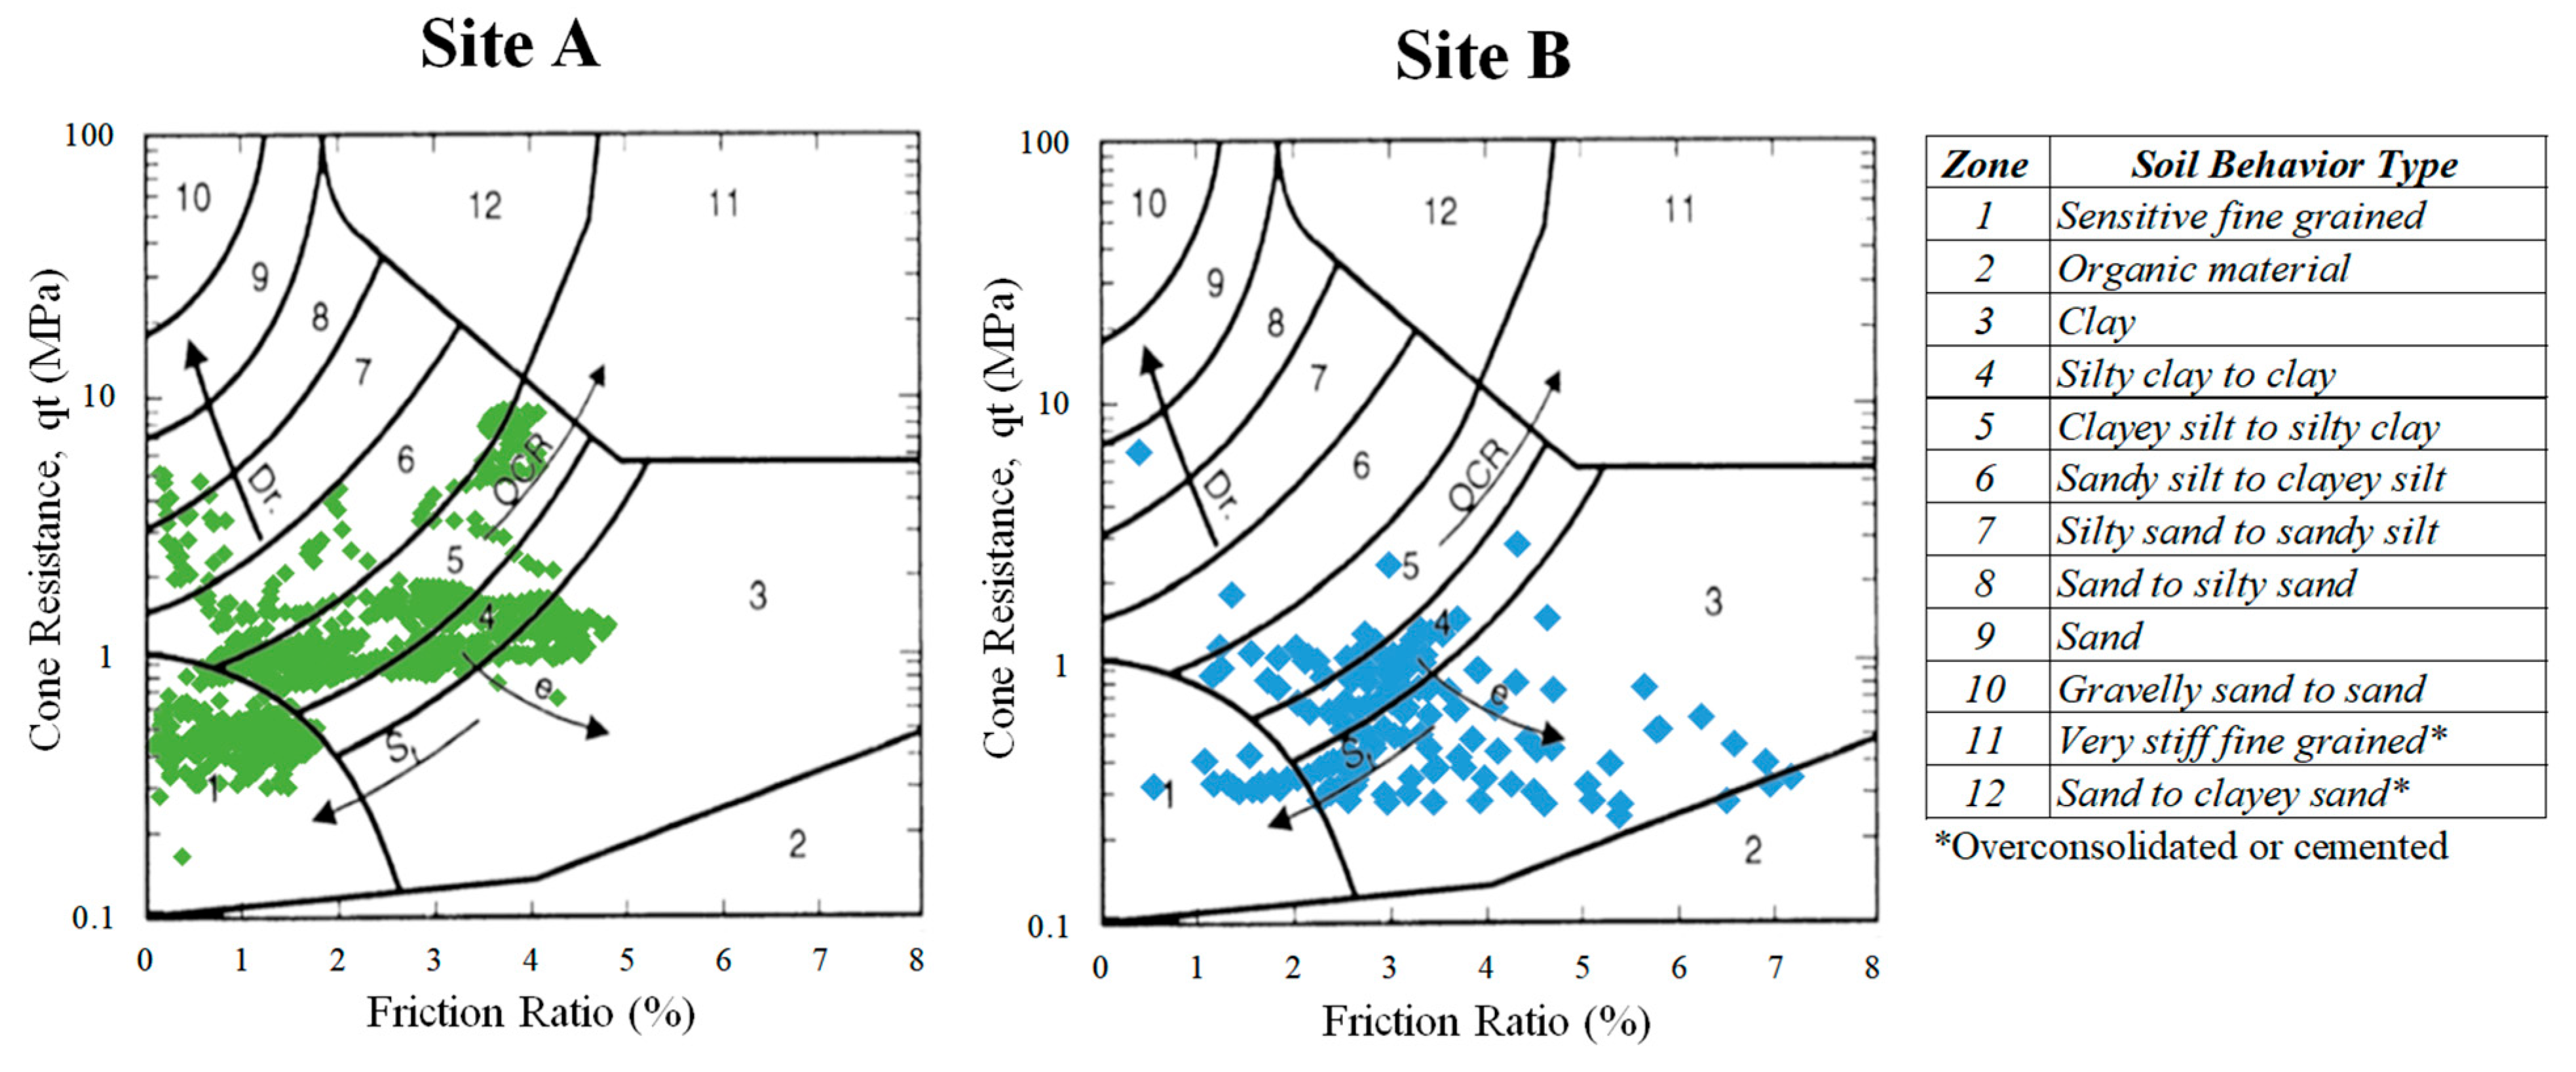
The friction ratio is generally used to estimate the soil behavior type [37]. Water pore pressure can also be measured by piezocone and is commonly presented as the pore water pressure ratio (), which is the ratio between excess pore pressure () and the net cone resistance (), defined as
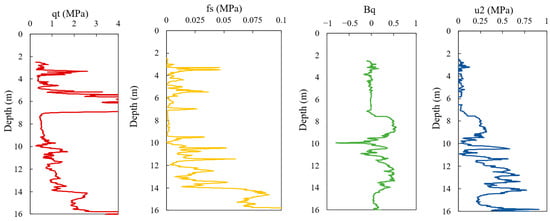
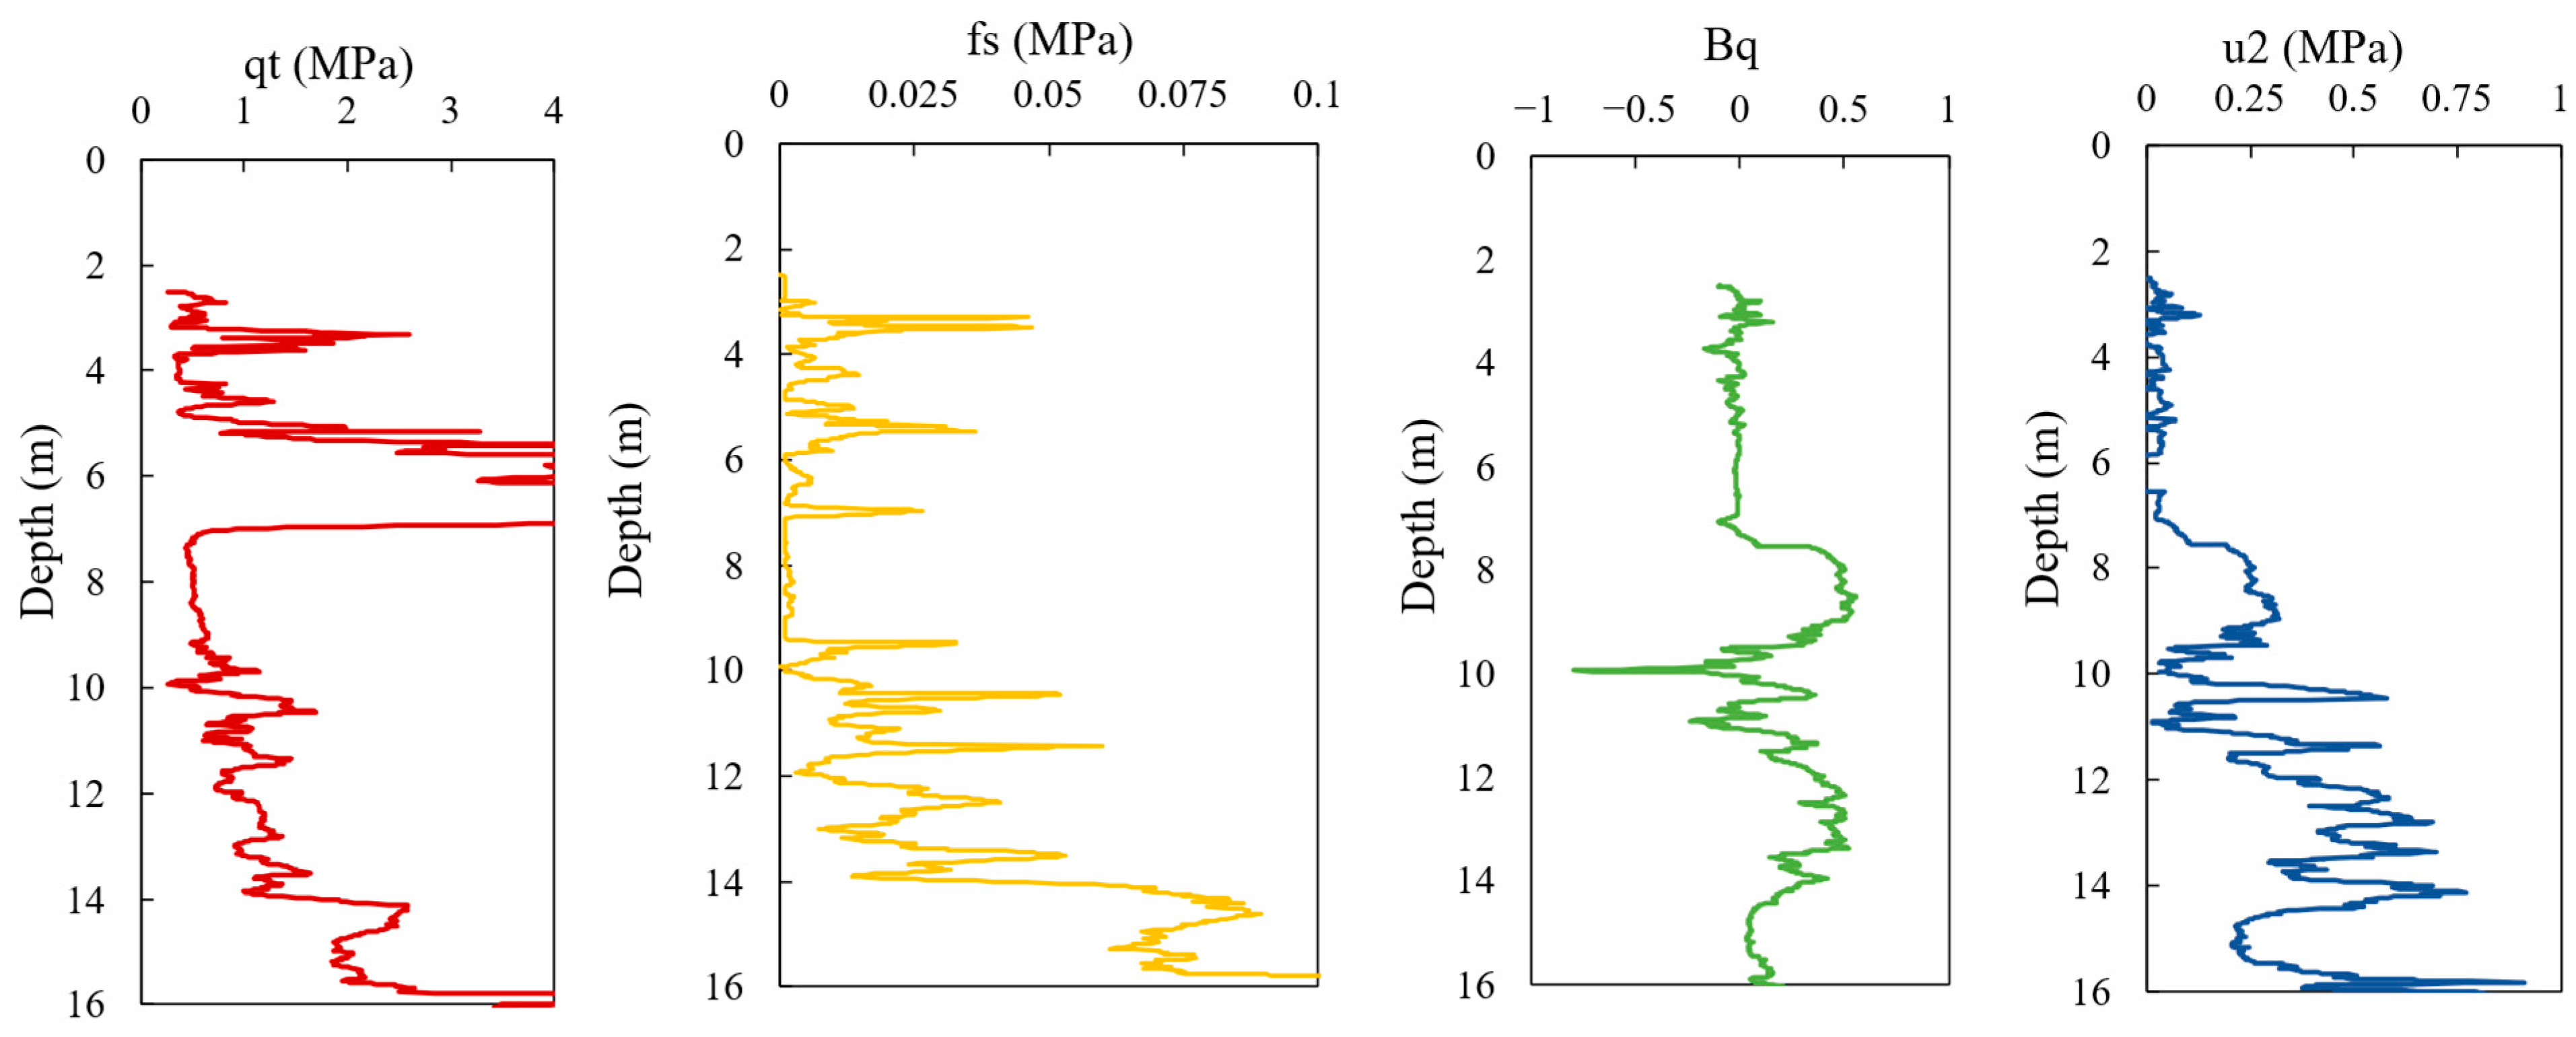
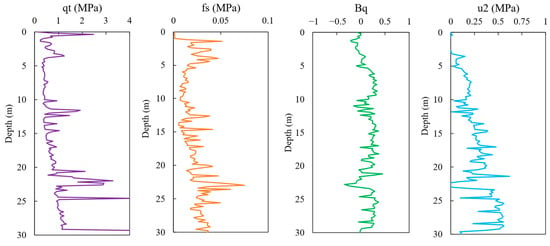
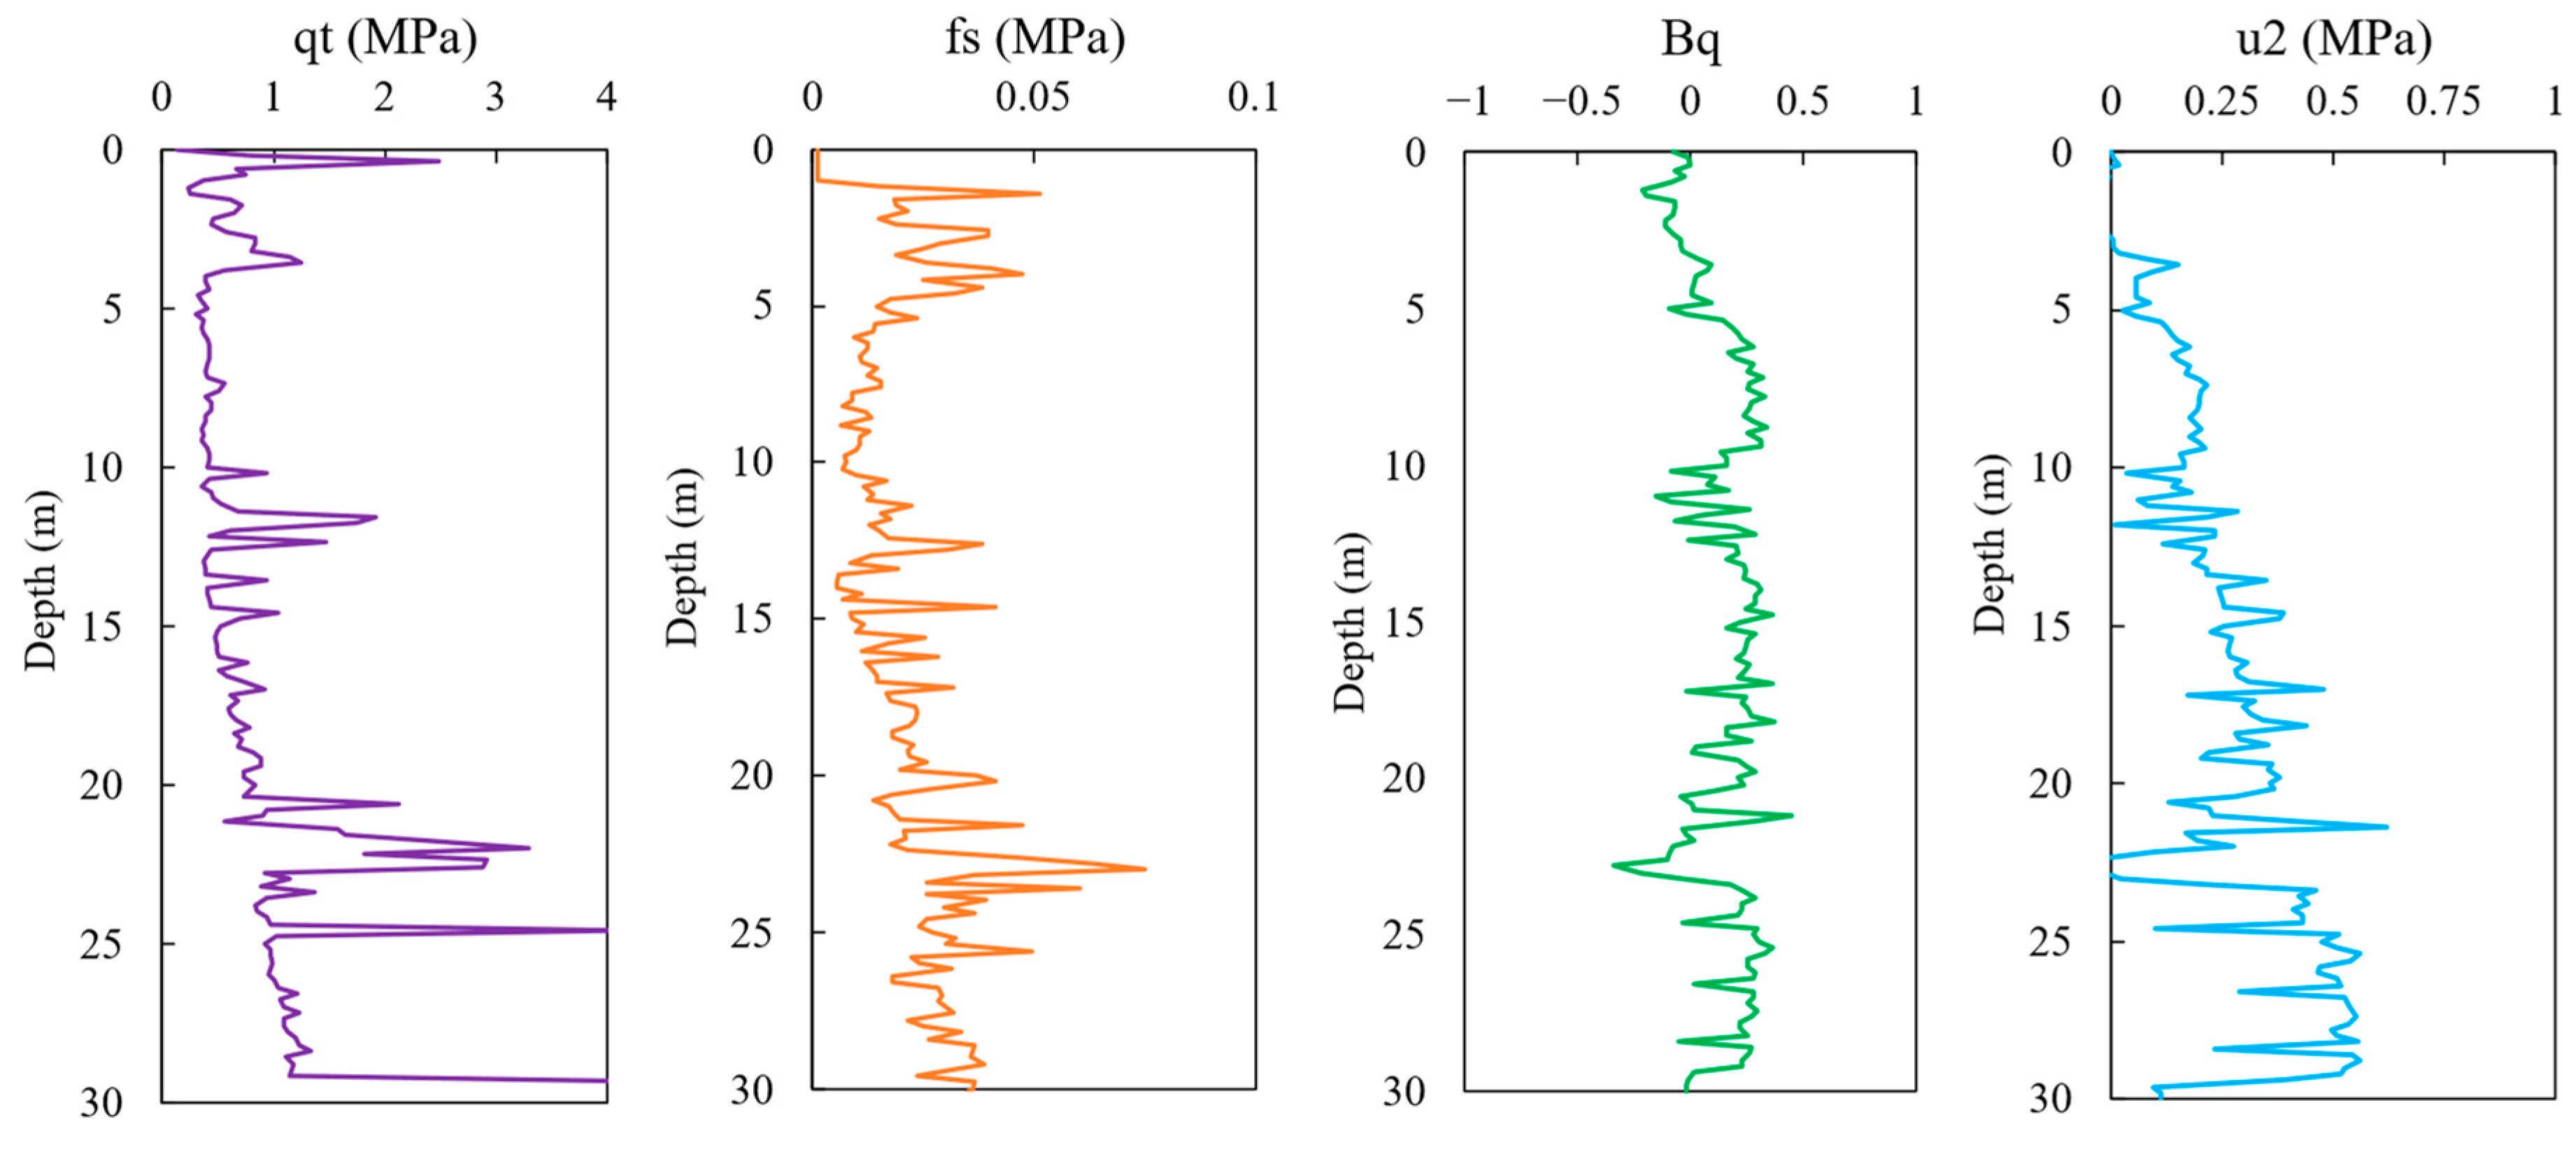
where is the total vertical overburden stress at the corresponding depth. The database was developed using 20 points of CPTu testing conducted at two different sites. Figure 3 and Figure 4 show examples of the CPTu test results for Site A and Site B. The average values for Site A and Site B are 0.148 and 0.138, respectively. The presence of soft clay layers can be identified through low values ranging from 0.25 to 0.8 MPa. The sudden spike in the value at a depth of 6–7 m indicates the presence of a sand lens at Site A. A similar spike is also observed at Site B at a depth of around 25 m, indicating a locally stiffer soil lens.
Figure 3.
Example of CPTu results at Site A.
Figure 4.
Example of CPTu results at Site B.
The soil type behavior of the soil profile can also be estimated based on the friction ratio and corrected cone resistance values according to the commonly used soil behavior type (SBT) chart from Robertson [37]. Figure 5 shows the classification of soil type behavior for both Site A and B. The dominant soil layers are classified as zones 4 to 5, or silty clay. However, at Site B, where the soft clay layer is thicker, some of the layers are zone 3, with a smaller portion of silts. In general, the soil types for both sites are fine-grained soils. Therefore, for design purposes, it is of interest to evaluate the strength parameters, such as undrained shear strength, of the clayey soil layers from these sites.
Figure 5.
Soil behavior type [37].
4.2. Undrained Shear Strength from Vane Shear Test
The vane shear test (VST) is considered one of the best in situ tests for soft to medium clays. In this test, torque is applied to the vane rods, causing the soil to shear along a cylindrical rupture surface. Field vanes typically have a height-to-diameter (H/D) ratio of 2, with common sizes being 76 mm × 38 mm, 100 mm × 50 mm, and 130 mm × 65 mm, such as the standard Swedish Geotechnical Institute (SGI) vane. To determine the shear strength of the soil, engineers utilize either empirical correlations or theoretical formulas. These methods relate the torque applied to an assumed shear stress distribution on the sides of the blades. A correction factor was proposed as a function of the plasticity index to obtain the corrected undrained shear strength from the VST, using the following equation [5]:
Bjerrum’s correction factor was originally developed for soft clays with PI up to 120. In this study, all PI values at Site A and the majority of those at Site B fall within this range, with only a limited number of data at Site B exceeding PI of 120. For very-high-plasticity clay, Bjerrum’s correction factor was then applied as a cautious extrapolation, consistent with the decreasing trend implied in the original empirical correlation to account for potentially sensitive behavior.
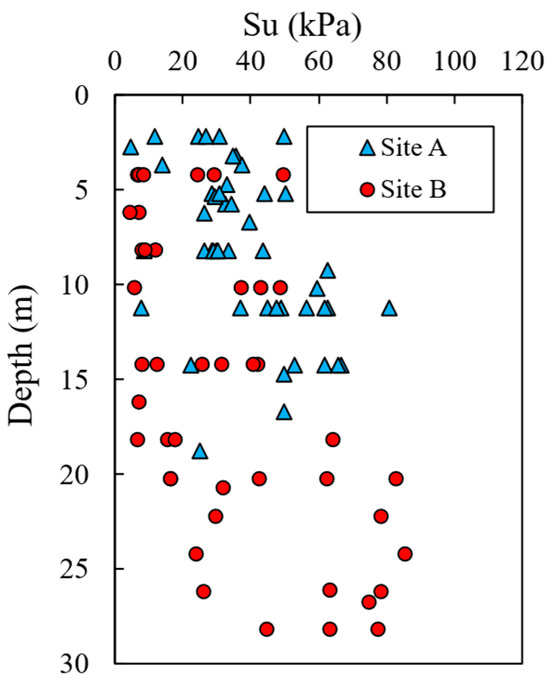
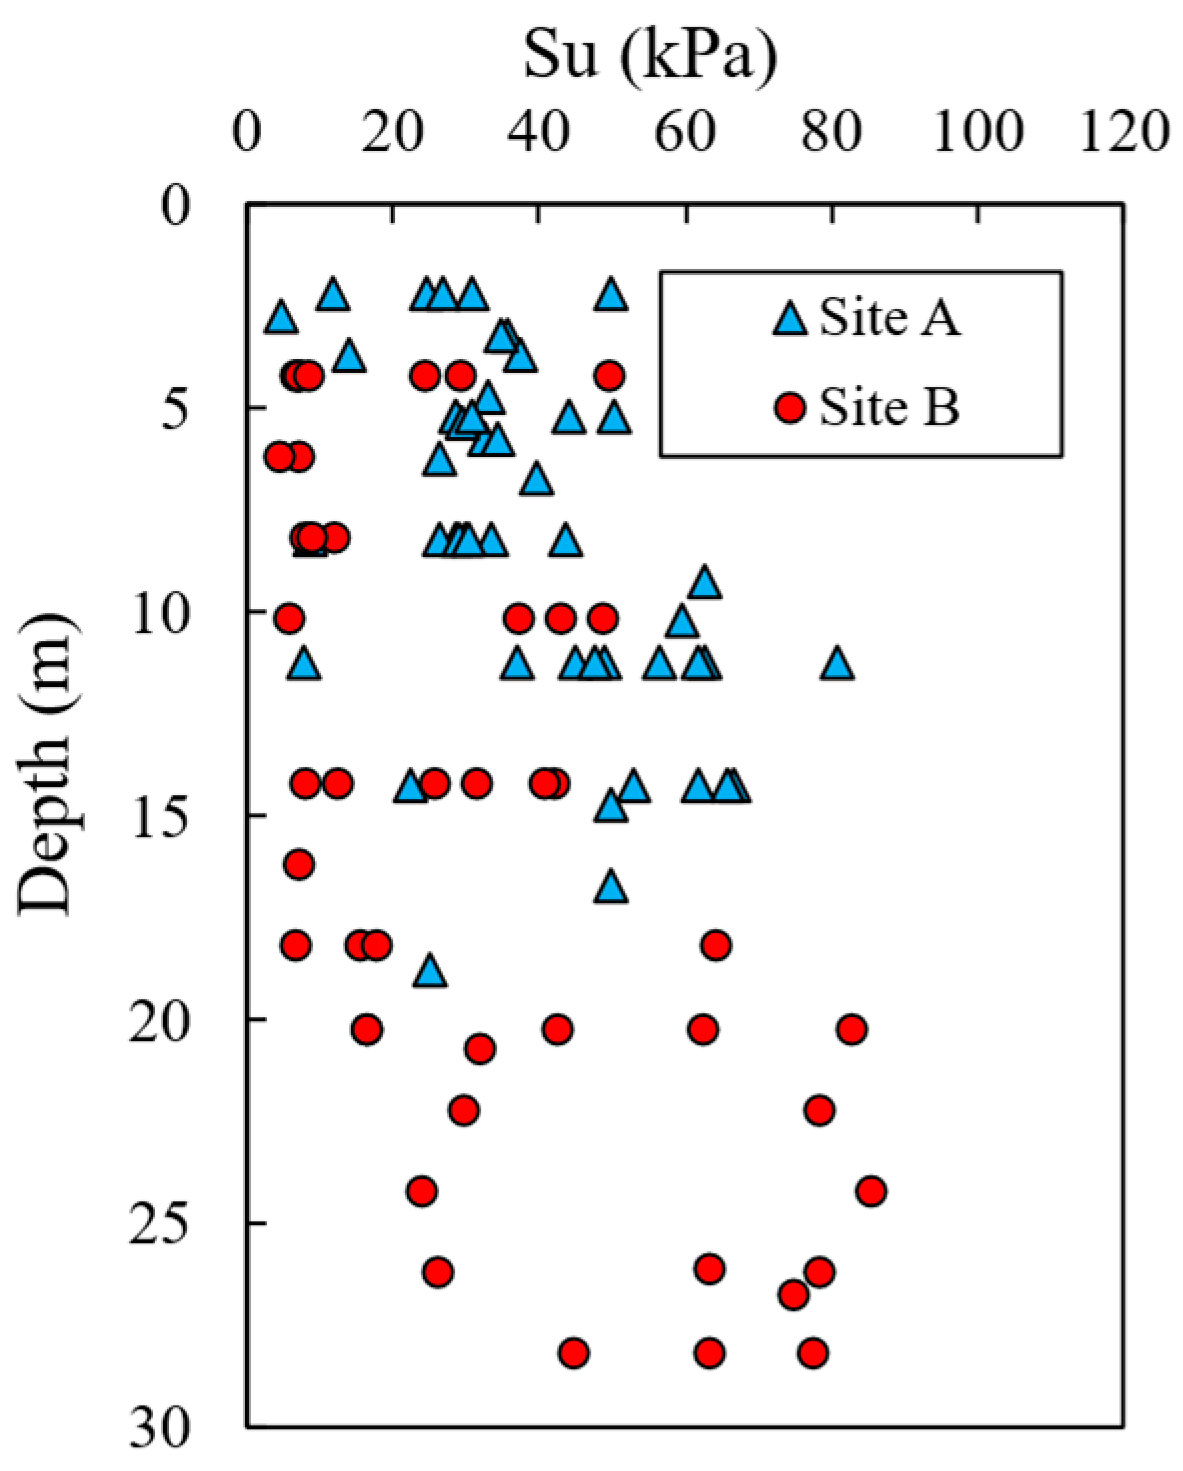
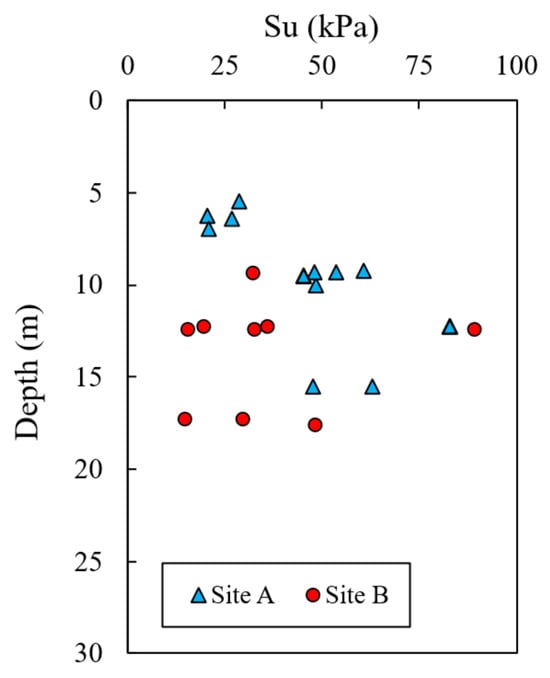
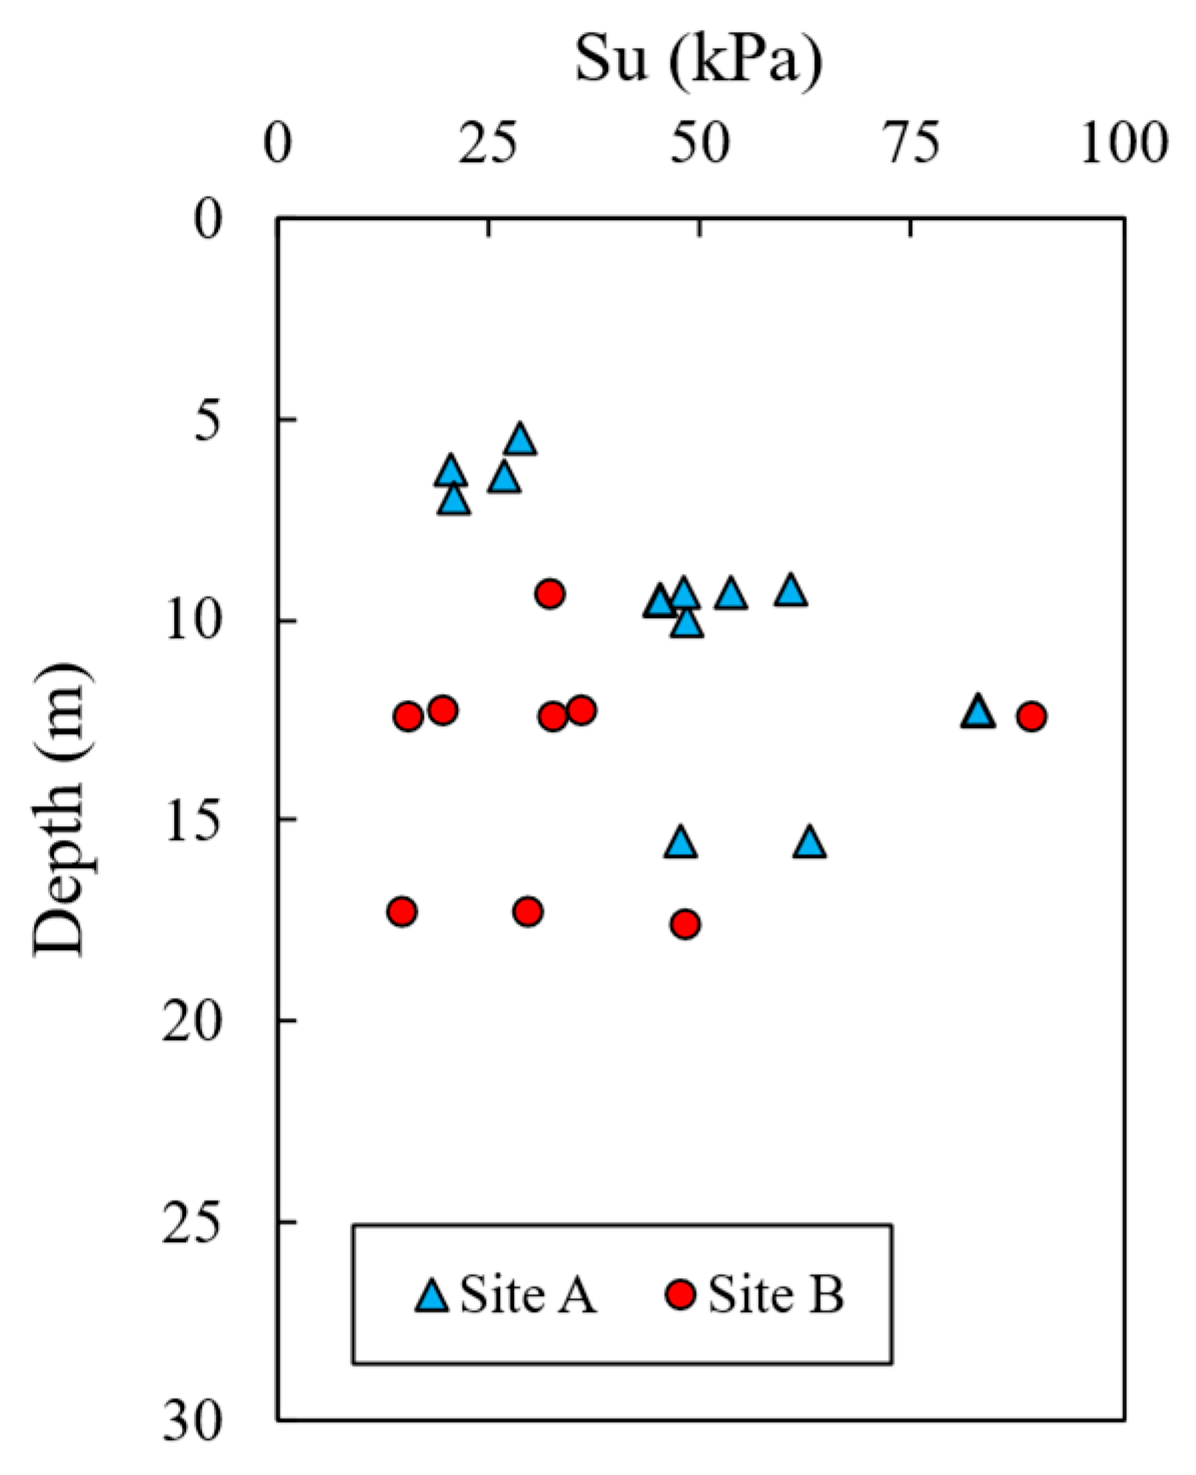
The corrected is then determined by multiplying the uncorrected with Several vane shear tests have been performed over a depth range of 2–30 m. Figure 6 shows the corrected undrained shear strength obtained from VSTs for both sites. At Site A (Central-North Jakarta), the undrained shear strength data are available only up to a depth of approximately 20 m due to the presence of an underlying dense layer, while at Site B (Gedebage, Bandung), the soft to medium stiff clay layer extends to a depth of about 30 m. The clay layers for both sites have an ranging from about 10 kPa to 80 kPa.
Figure 6.
Undrained shear strength from VST.
4.3. Undrained Shear Strength from CU Triaxial Testing
To obtain the effective shear strength parameters of the subsoil, consolidated–undrained (CU) triaxial tests with pore pressure measurements were conducted on three specimens for each representative soil sample. All CU triaxial tests were performed in accordance with ASTM D4767 [38], ensuring standardized procedures for sample preparation, saturation, consolidation, and pore pressure measurement. Prior to shearing, all specimens were fully saturated until a pore pressure coefficient (B-value) of at least 0.95 was achieved, followed by isotropic consolidation under confining pressures of , , and where represents the mean effective stress. During shearing, excess pore water pressures were continuously measured to determine the effective stress conditions at failure and develop effective Mohr circles. The undrained shear strength was then interpreted at the effective overburden stress corresponding to the sample depth, following the procedure proposed by Duncan et al. [39]. The mean effective stress was defined as = 1/3 ( + 2), where is the effective vertical stress and was estimated as K0 , with K0 values assumed as 0.8 for depths up to 10 m, 0.7 for 10–20 m, 0.6 for 20–30 m, and 0.5 for depths greater than 30 m. Unit weights ranging from 14.5 to 17 kN/m3 were adopted based on laboratory measurements, while groundwater levels were determined from field monitoring during trial pit investigations.
The quality of laboratory testing, including sample saturation, consolidation procedure, and strain rate during shearing, has a direct influence on the interpreted undrained shear strength (Su). Since the cone bearing factor is derived from the ratio between cone resistance and Su, variations in laboratory-measured Su will directly affect the calibrated values. For a given cone resistance qt, higher measured Su results in lower , while lower Su leads to higher , highlighting the importance of consistent and well-controlled laboratory testing procedures.
As summarized in Table 2, no unconsolidated undrained (UU) triaxial test data were used for Site A because the sample locations are not spatially aligned with the location of the corresponding CPTu tests. Consequently, the evaluation of the representative undrained shear strength for Site A relies primary on the consolidated undrained (CU) triaxial tests. However, both UU and CU triaxial data were used for Site B to evaluate the undrained shear strength.
Table 2.
Summary of UU and CU triaxial tests for both sites.
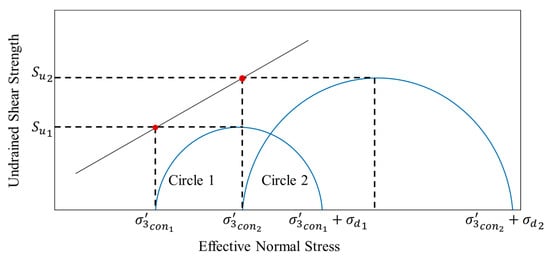
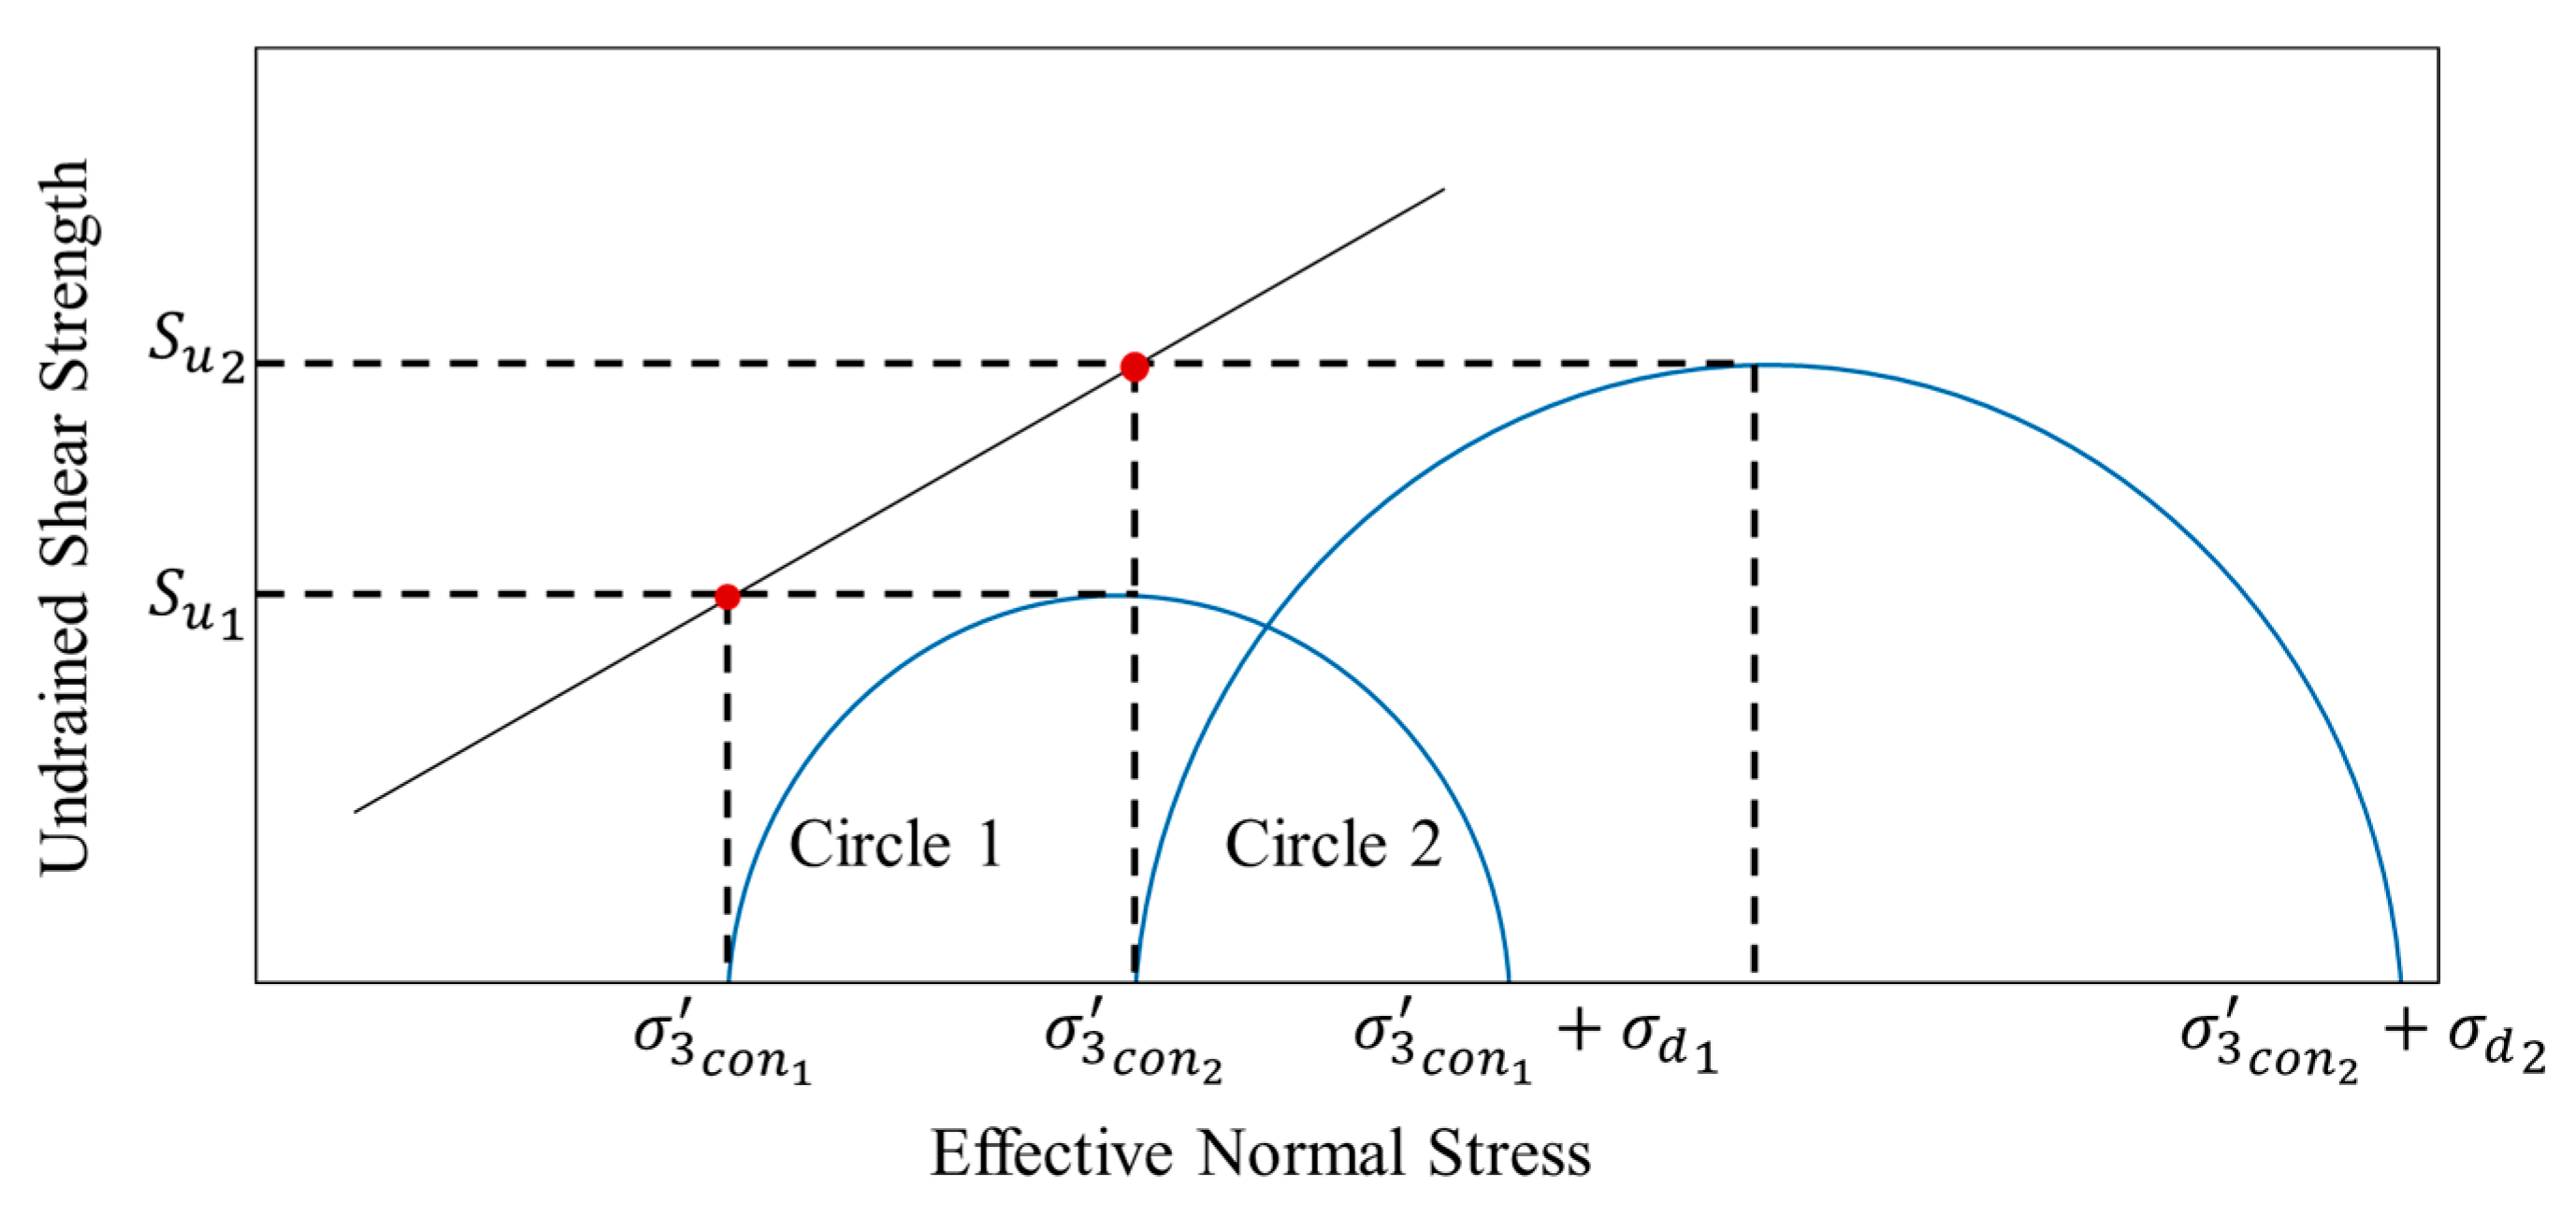
There are various loading mechanisms in triaxial testing that can influence the stress path of the tested sample. In this study, the loading mechanism employed is axial compression, where the vertical load increases while the load in the horizontal direction remains constant. The undrained shear strength values from CU triaxial testing were interpreted based on the results of the Mohr circle of the tested samples. Each specimen of the CU triaxial test was taken from three segments on the core box’s top, middle, and bottom. The undrained shear strength obtained from CU triaxial testing was performed based on the shear strength at the effective overburden pressures of the sample depths [39]. From the Mohr circle of each specimen, a point is plotted (the red points in Figure 7) at the intersection of the effective consolidation pressure () and the peak of the circle, which is the maximum undrained shear strength. A line is then drawn to connect those points to represent the line. Undrained shear strength is then determined from the line at the effective overburden pressure of the sample. The method of interpreting from CU triaxial is illustrated in Figure 7.
Figure 7.
Interpretation of undrained shear strength from CU triaxial test [39].
Figure 8 shows the undrained shear strength from the triaxial CU interpretation. The depth of the samples was taken at a range of 5–30 m. The results show that at Site A, at a depth range of 5–16 m, the value is around 20–83 kPa. For the lower layer at a depth from 18 m to 30 m, the clay soils have values in the range of 196–481 kPa. At Site B, samples that were taken at depths from 12 m to 18 m have values of around 15–49 kPa.
Figure 8.
Undrained shear strength from triaxial CU.
4.4. Index Properties
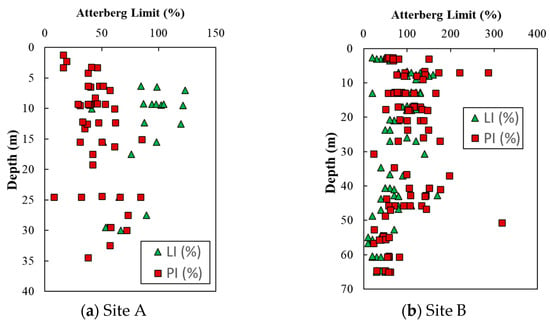
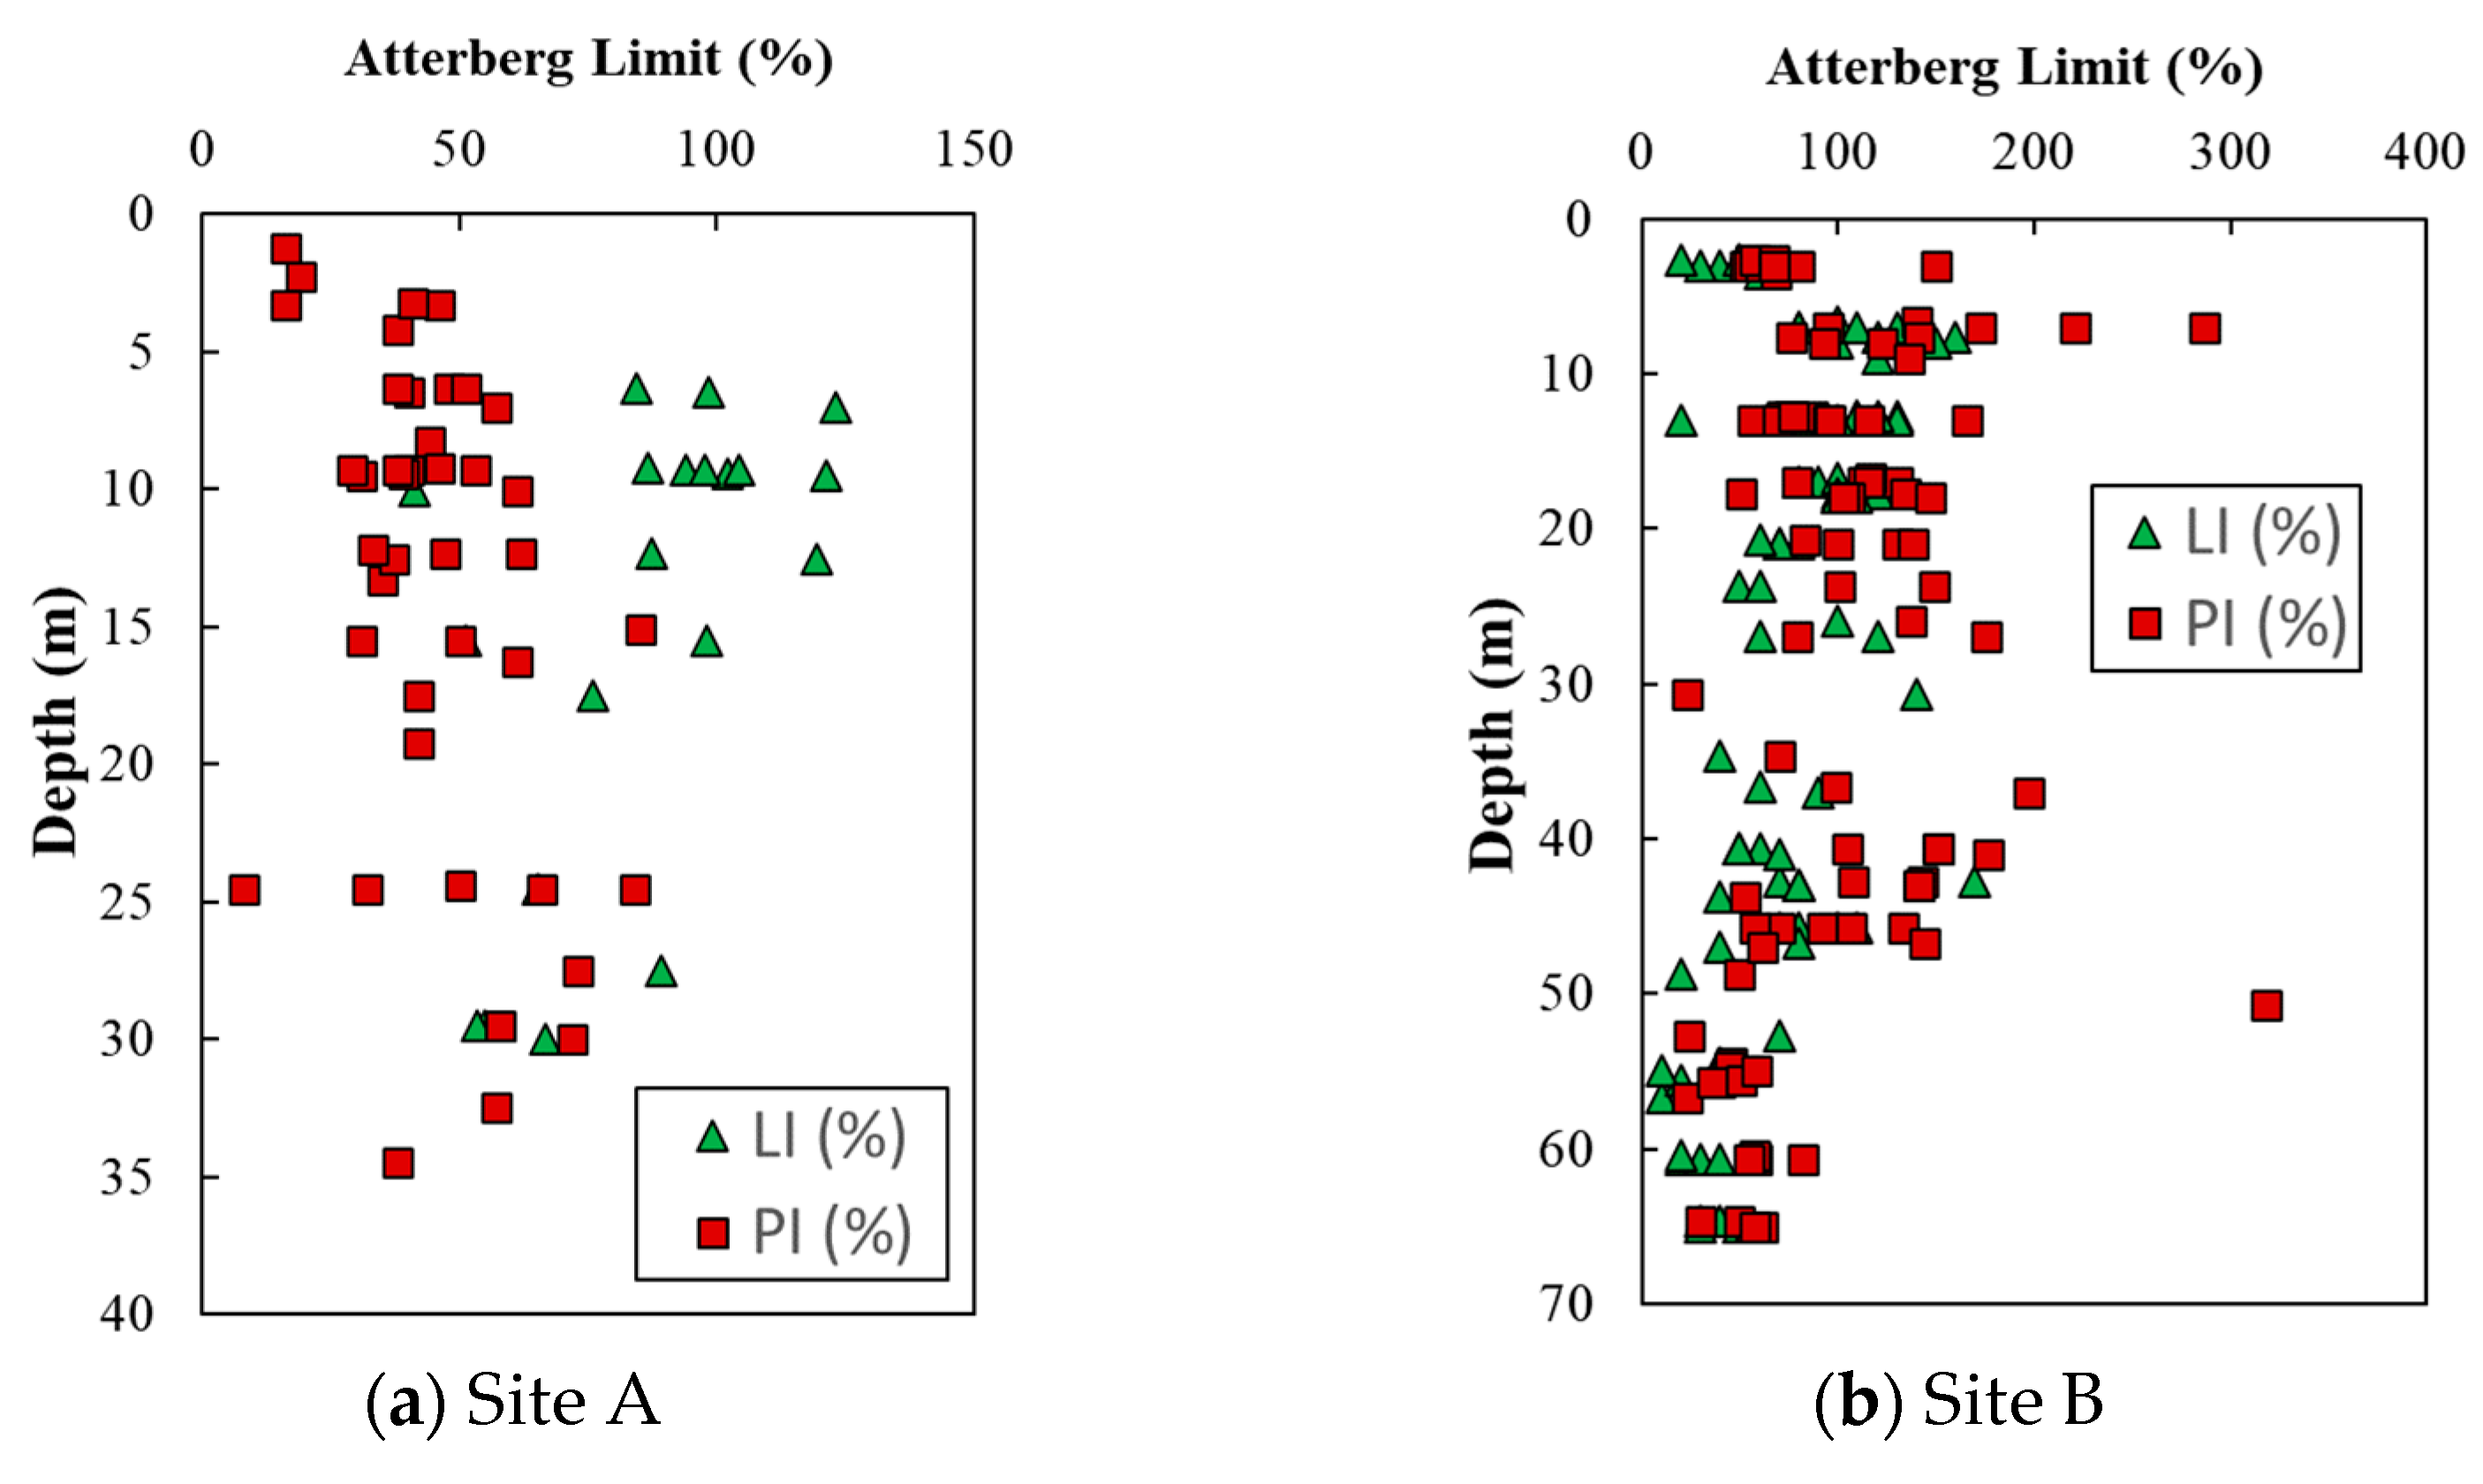
Laboratory tests were also conducted to determine the index properties of the soil, including the Atterberg limit, unit weight of soil, moisture content, grain size, void ratio, and specific gravity. At Site A, the moisture content values are generally close to or greater than the liquid limit. With liquidity index (LI) values exceeding 100% at a depth of 7–12.5 m, the soil can be classified as sensitive clay.
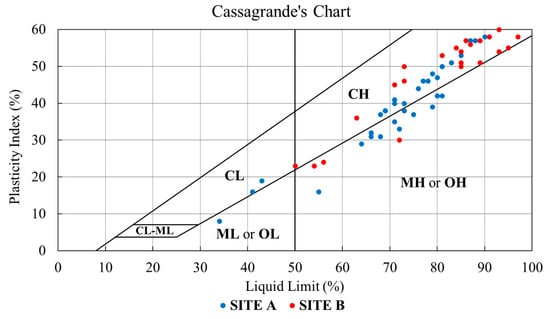
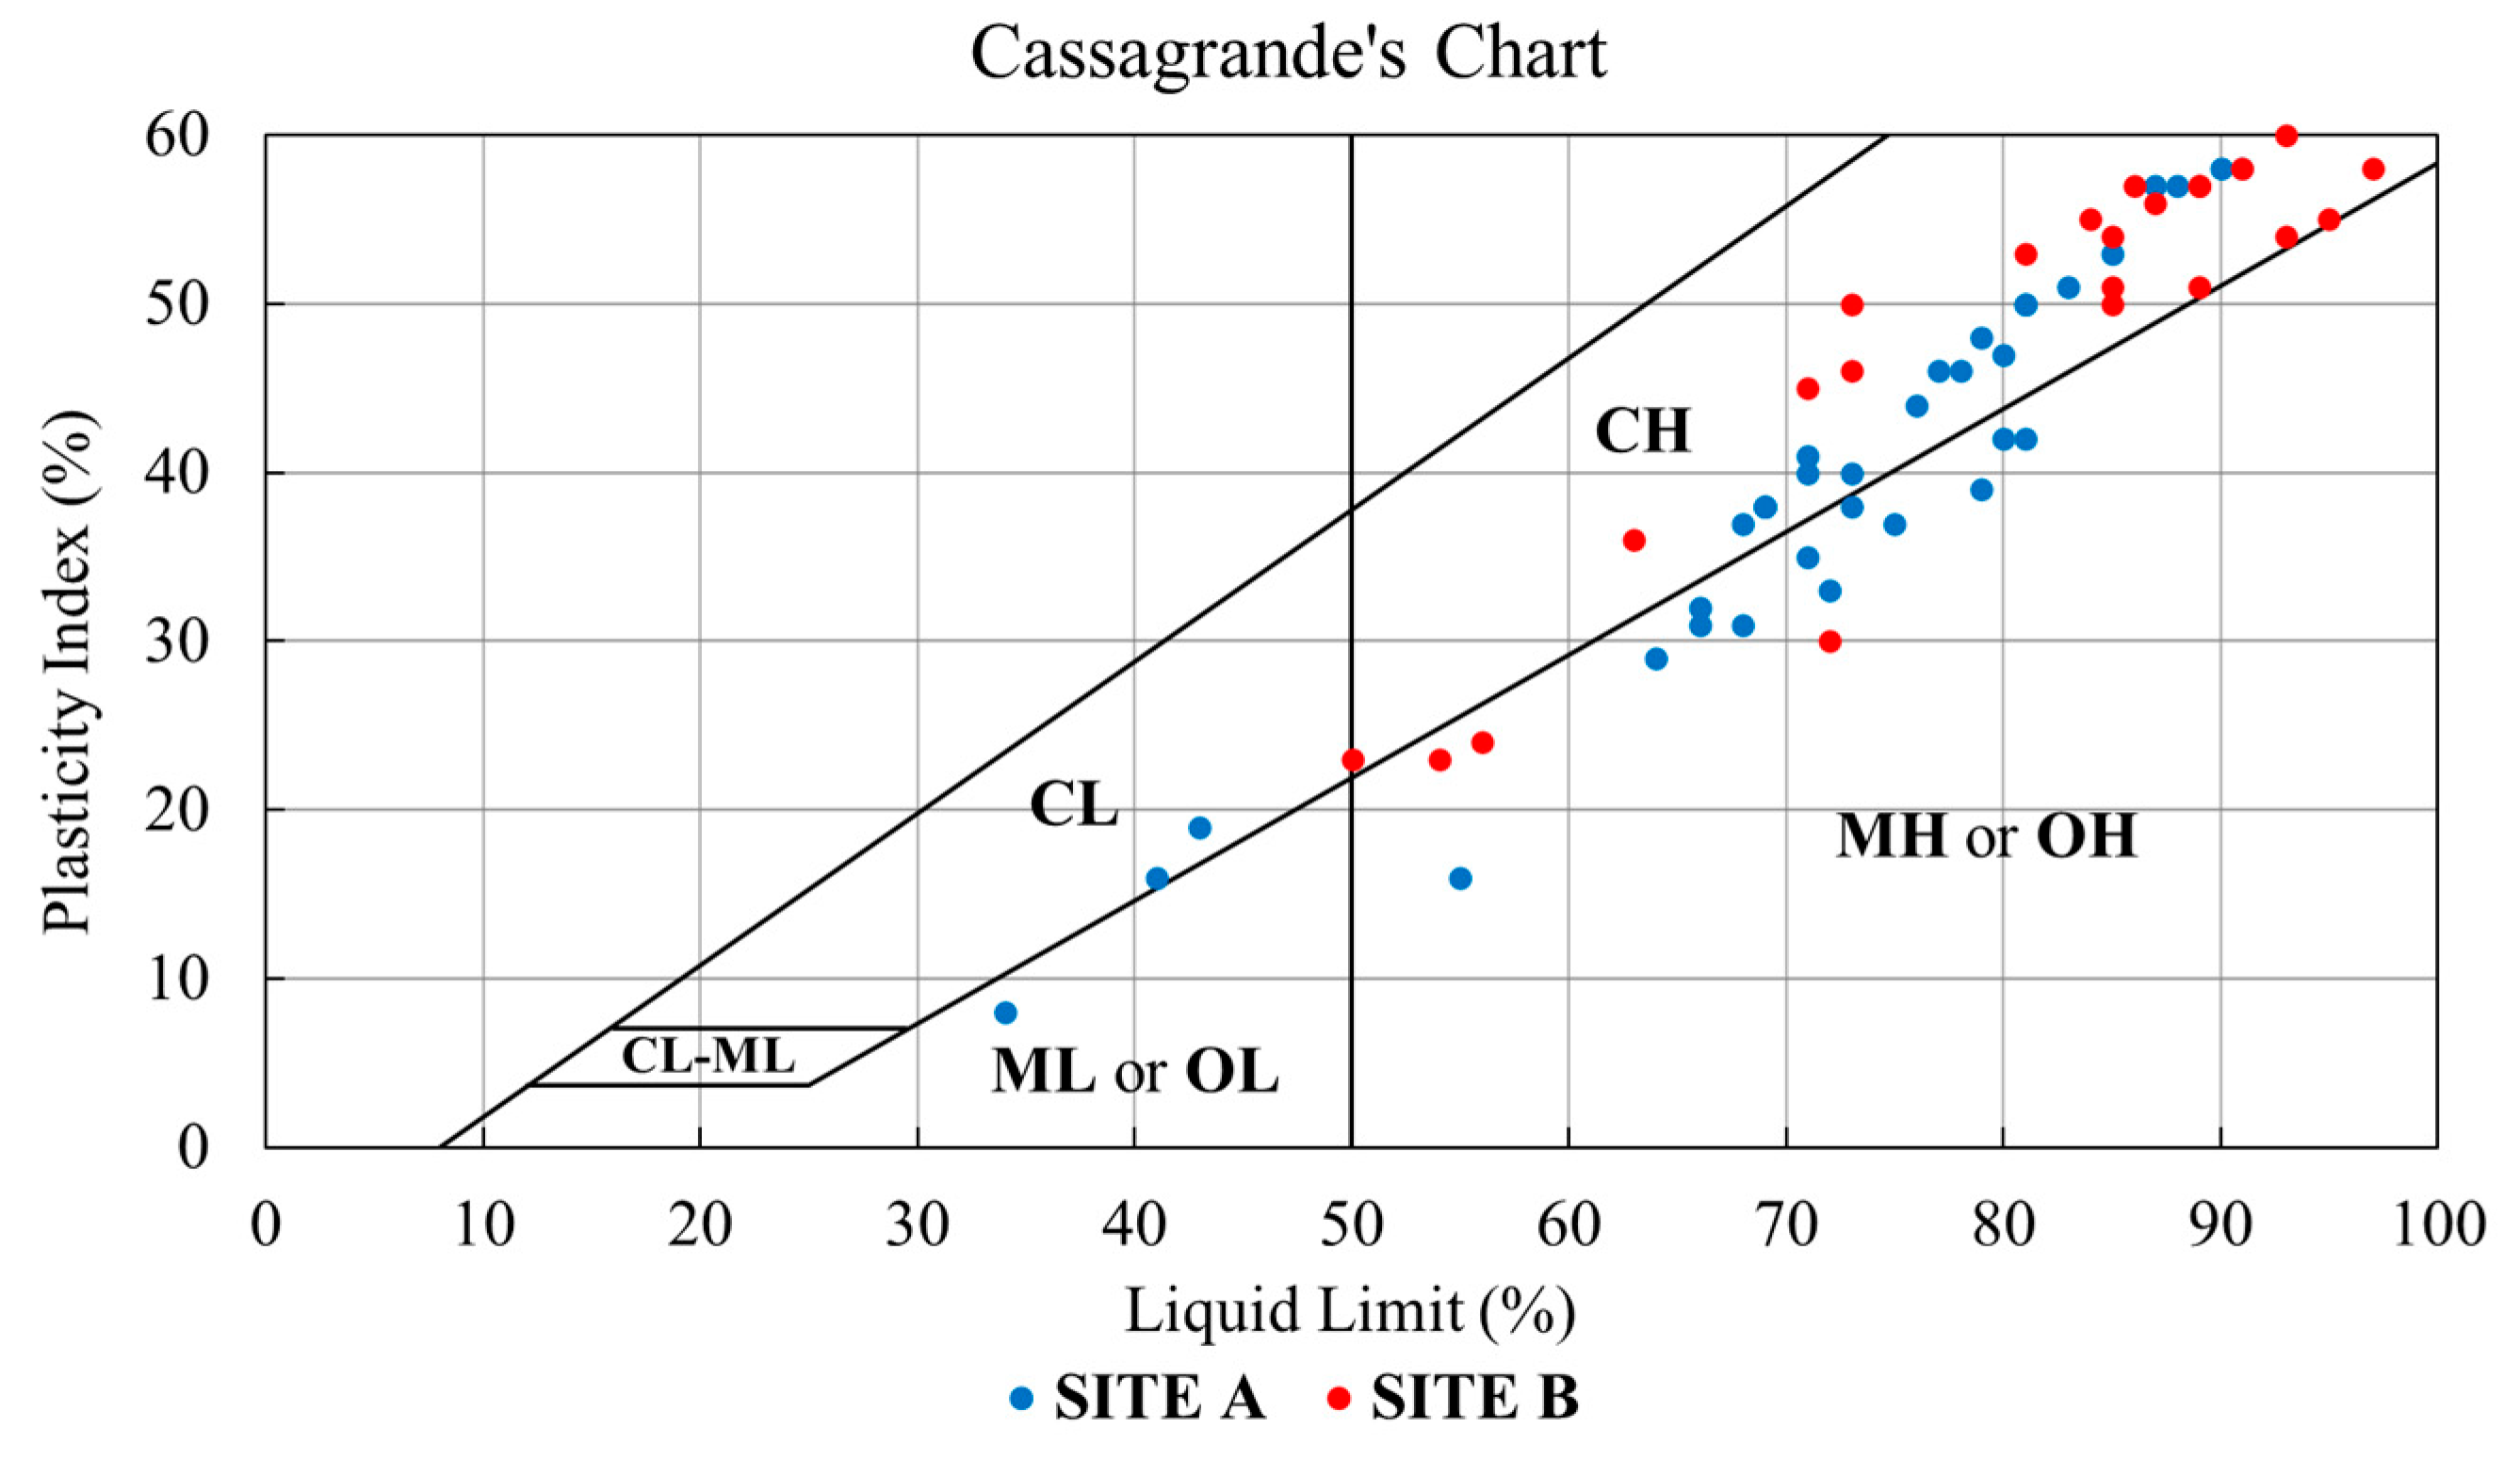
The Atterberg limit values at Site B have a larger range than those at Site A, as shown in Figure 9. At Site B, the presence of sensitive clay is detected more widely due to the LI being over 100% in many samples. Overall, almost all samples at both sites have an LL > 50%. In Indonesia, soil samples display considerable variation in plasticity index (PI), yet as a general trend, they tend to have relatively high PI values, which means that the USCS classification is between CH or MH, as shown in Figure 10. However, some test points also show the presence of soils with USCS classifications of CL, ML, and OH.
Figure 9.
Atterberg limit for Site A (a) and Site B (b).
Figure 10.
Casagrande’s chart for Sites A and B.
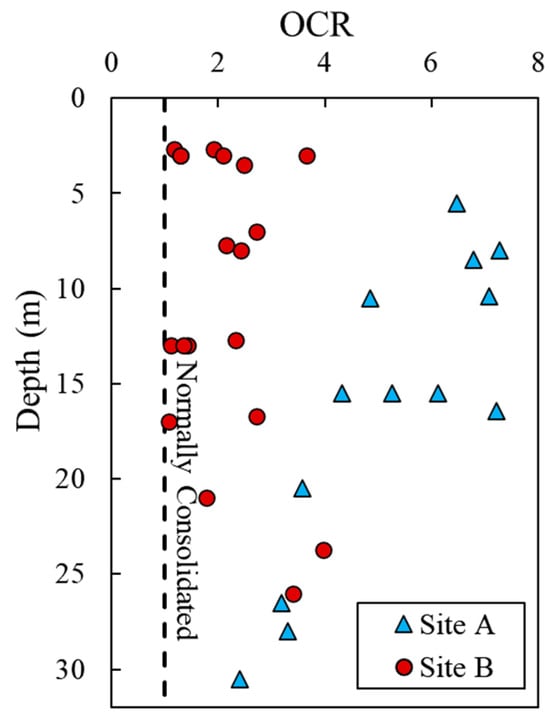
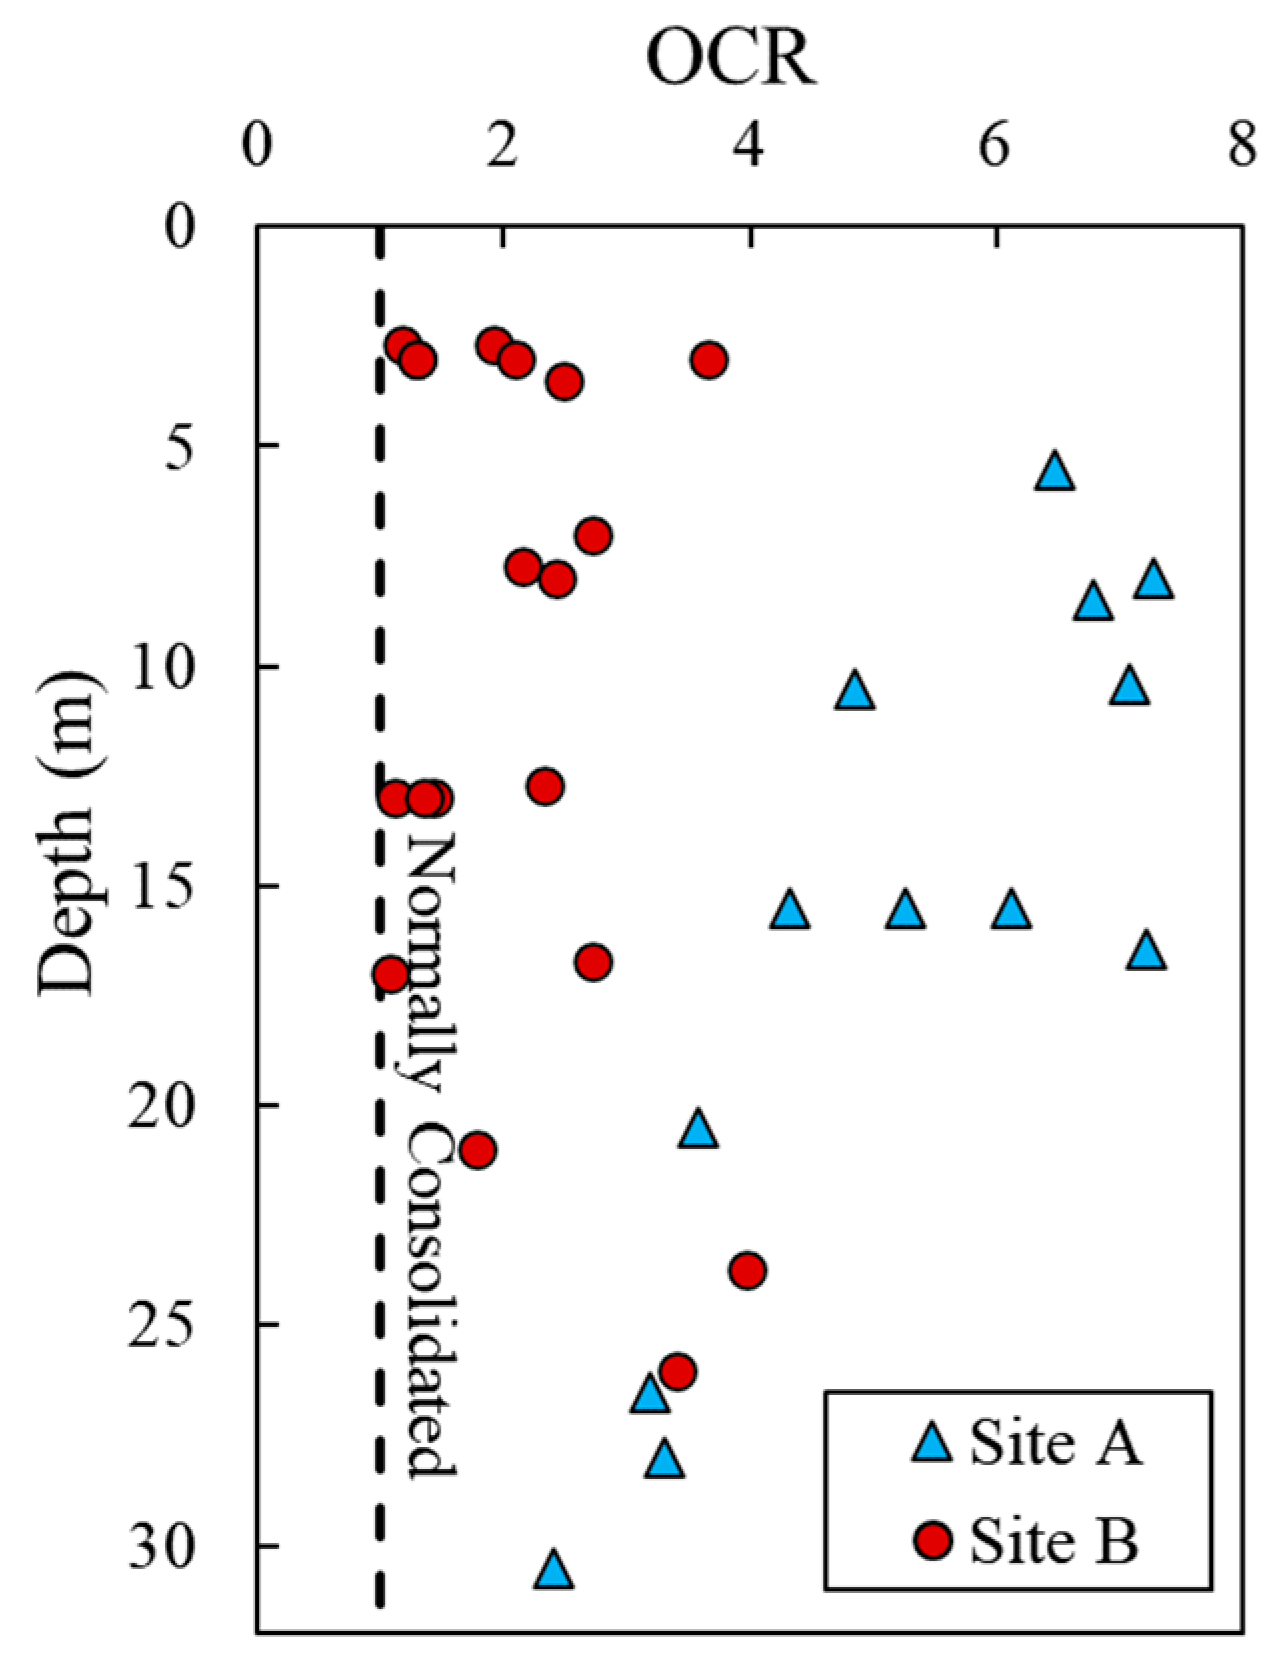
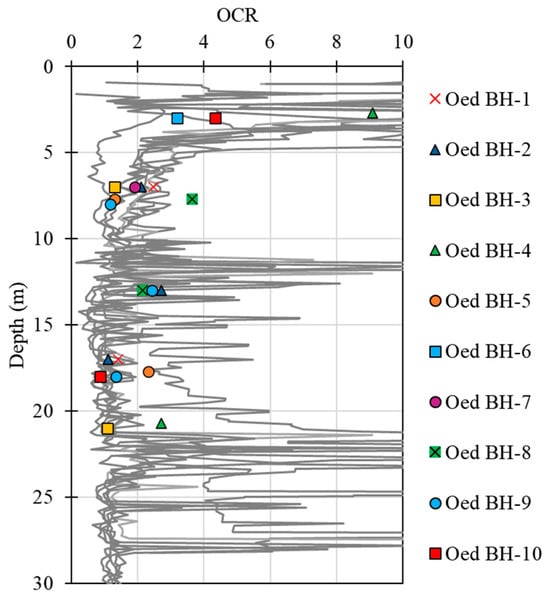
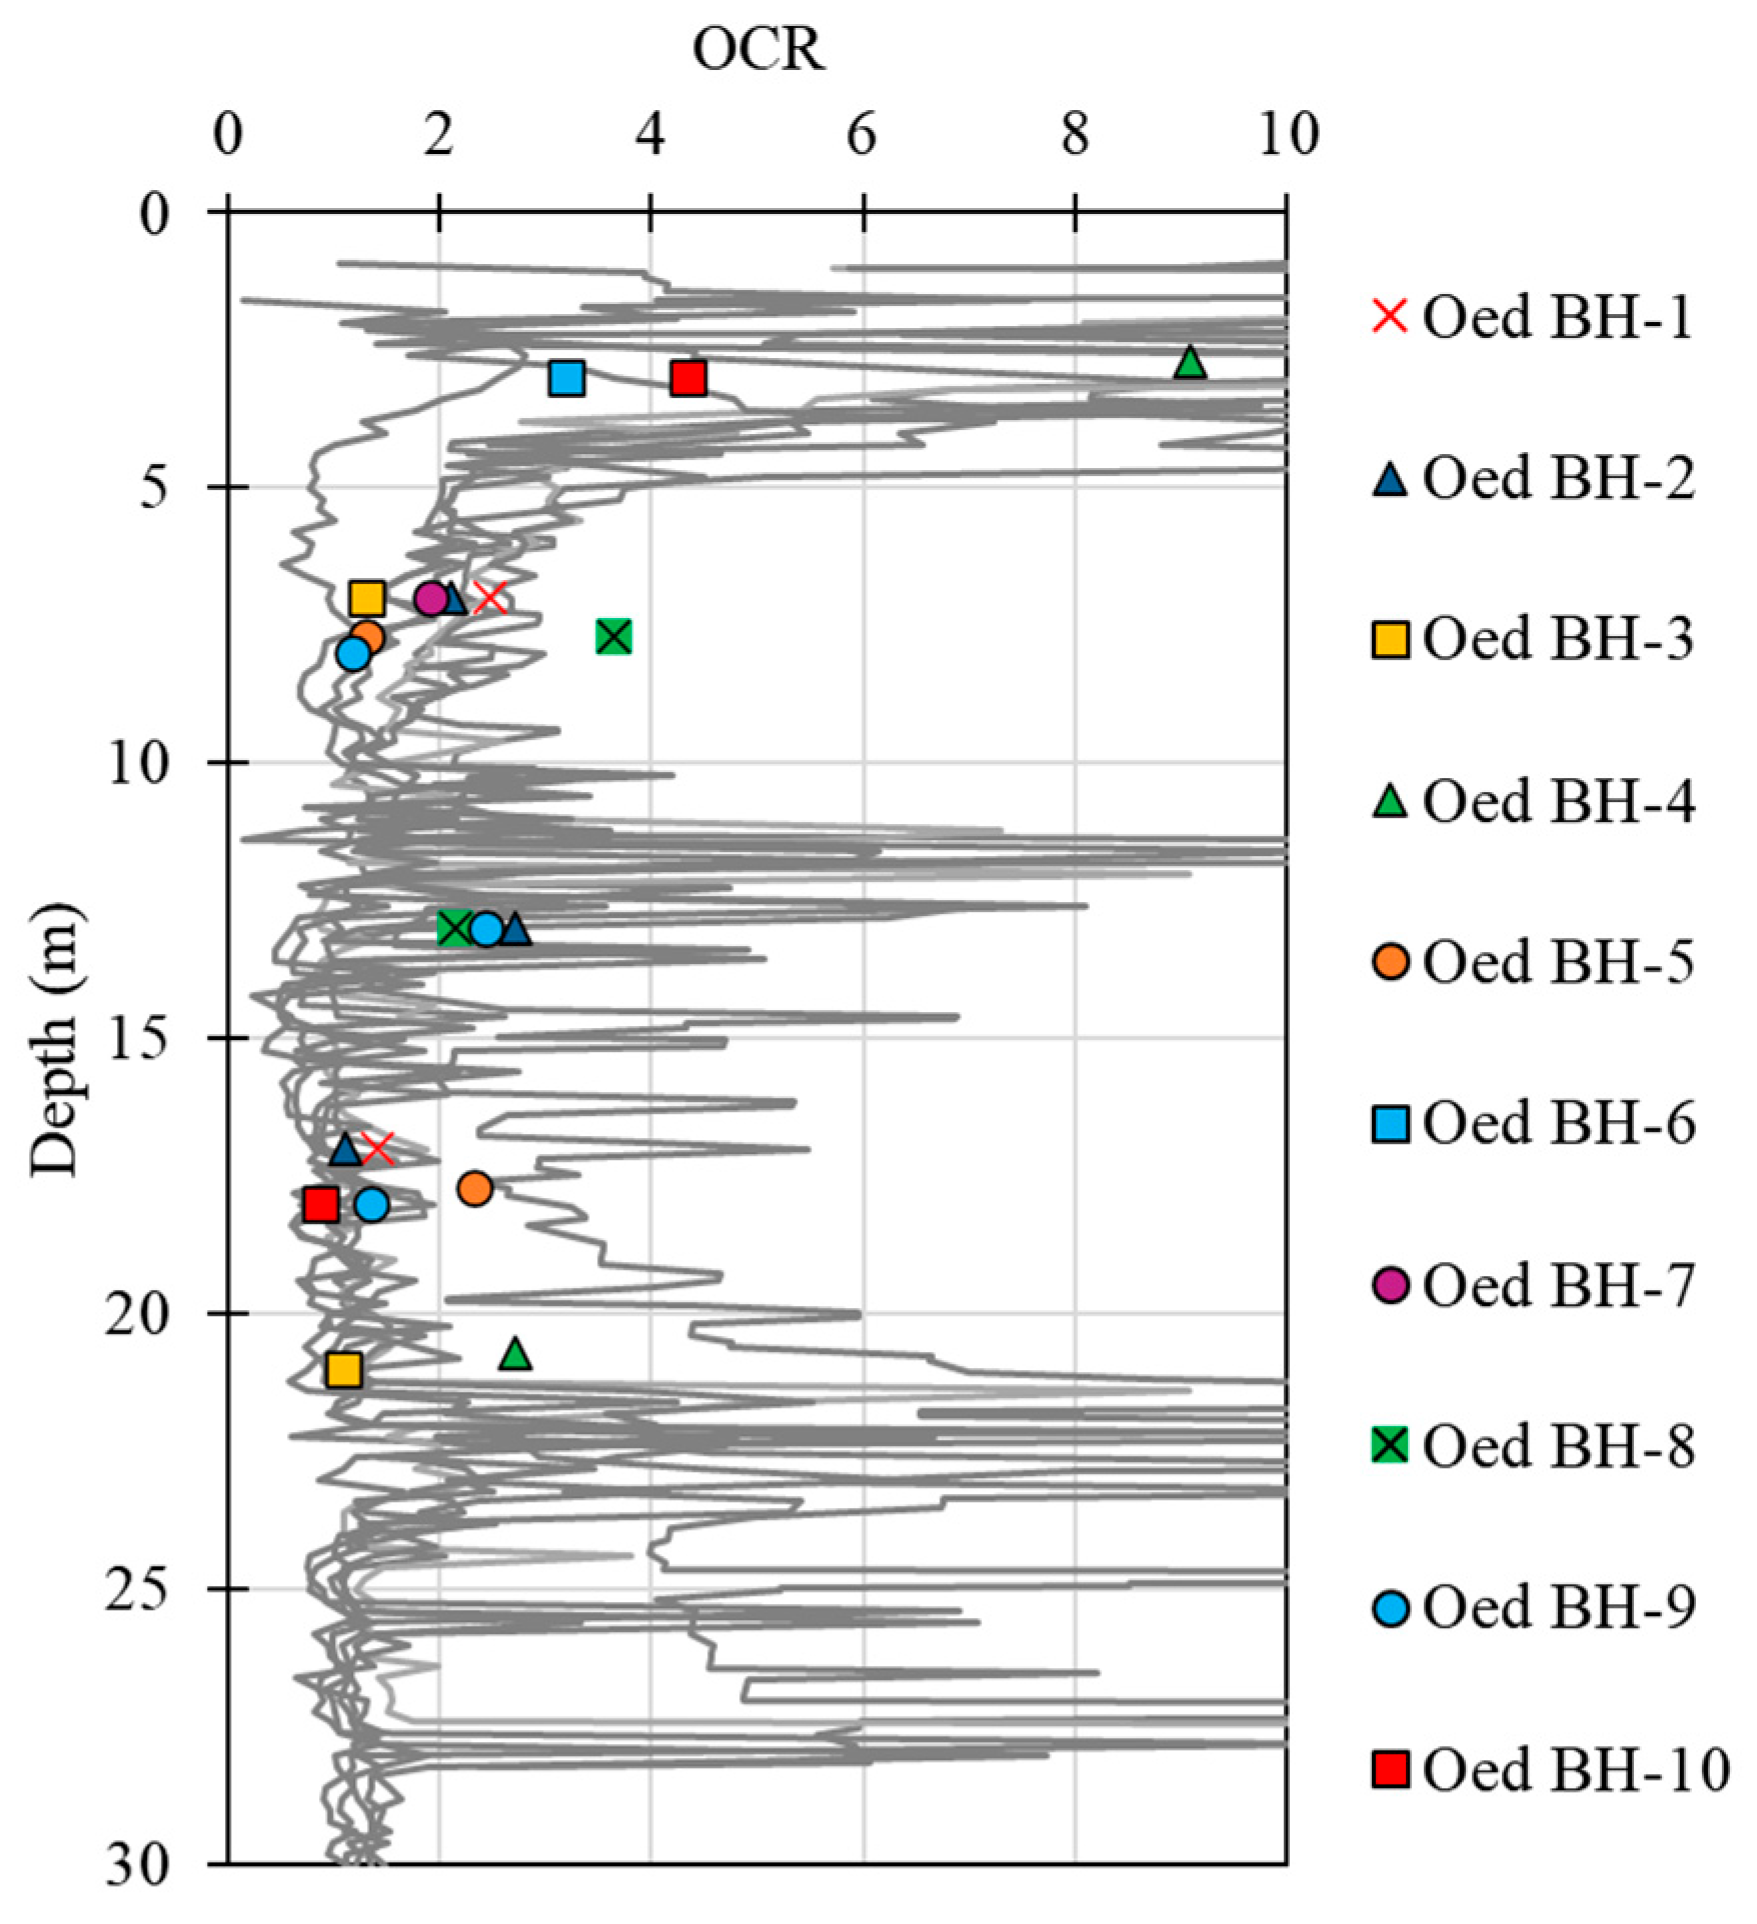
Liquid limit values greater than 50% indicate that the soil is likely to have significant plastic behavior. High liquid limit values often indicate the presence of a larger fraction of clay in the soil composition, which has high potential for volume changes in terms of swelling and shrinkage. This type of soil is often identified as expansive soil. In terms of the overconsolidation ratio () profile obtained from oedometer tests, it is evident that the soil at Site B exhibits lower characteristics than that of Site A at a depth of 0–15 m, as shown in Figure 11.
Figure 11.
OCR profiles for Site A and Site B.
5. Cone Factor () for Undrained Shear Strength
The method for estimating the cone factor starts with the selection of the closest boreholes or the same borehole between the CPTu test and another test to calibrate the value, such as VST, CU, or UU. In this study, CPTu points were paired with calibration test results obtained from the same depth and within a maximum horizontal distance of 5 m. If the CPTu points did not have a nearby calibration point from either the VST or the triaxial CU test within this distance, the data point was excluded from the analysis. Similarly, VST and CU test locations without corresponding CPTu data within a 5 m radius were also excluded.
Overall, twenty pairs of CPTu-CU-UU-VST data were taken from the same or adjacent points. Then, various parameters from the test results were calculated, such as , , and . was calculated based on the consolidation test results, and the value of was calculated using the average unit weight obtained from the laboratory test results. The database was also matched for NSPT values in the same borehole according to the depth of the sample.
evaluation is first carried out by back-calculating for each VST, UU, and CU test sample for each depth. Then, a representative is determined for each borehole. After these steps are completed, a database of values for all samples is generated and filtered to statistically produce a relevant acceptable recommendation. The soil clay samples are only evaluated for those with NSPT < 15 and tested at depths up to 20 m. The analysis in this study was intended to focus on soft to medium-stiff clays; hence, stiff and hard clays with NSPT > 15 and at greater depths were not considered in this study due to the limited reliable laboratory shear strength data for these clays. In addition, the different mechanical behavior and stress histories of stiff to hard clays might require separate calibrations. There are 49 data points excluded from the dataset, which corresponds to 42% of the total data. The filtering process caused the remaining dataset to be more consistent and representative of the targeted soil conditions. The excluded data mainly correspond to soil types and depths outside the scope of this study. Therefore, their removal did not significantly affect the overall trends of the homogeneity of the analyzed dataset.
The relationship between and values was proposed in Mayne and Peuchen [15]. The database consists of 70 clay soil types with 497 triaxial data points. The relationship between and values can be determined using Equation (7). The database used by Mayne and Peuchen [15] in determining the equation is then updated based on the results of this study.
In the first step of data processing, the value is evaluated by back-calculating the undrained shear strength results from VST and triaxial CU with the following equation:
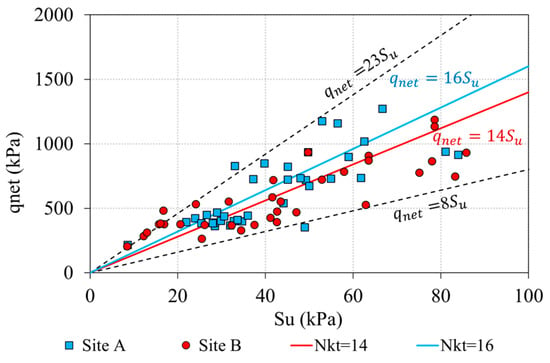
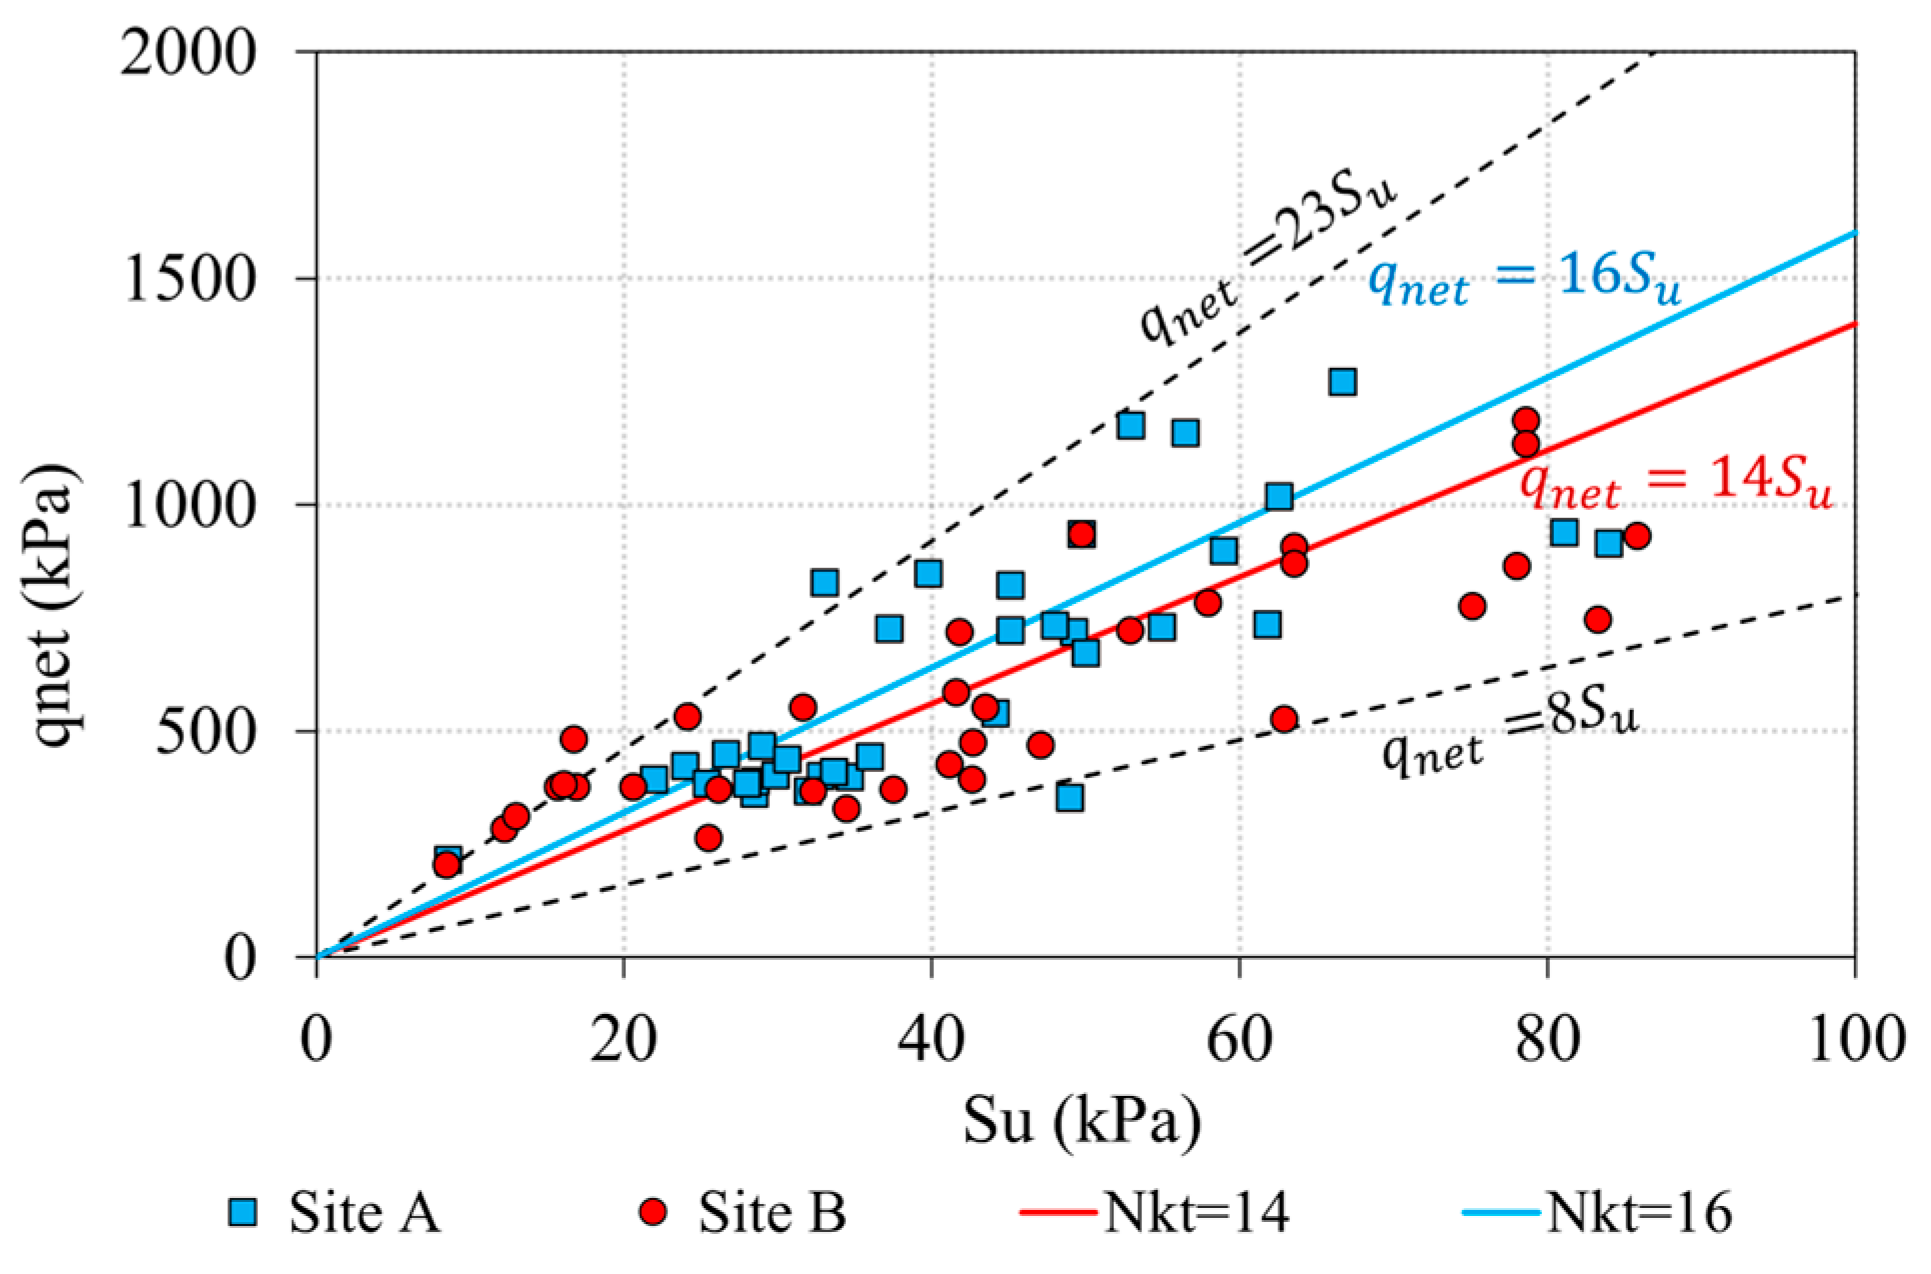
This process also calculates the standard deviation and coefficient of variation for each sample. Table 3, Table 4, Table 5 and Table 6 show the results of the back-calculated process to determine the for each location with both types of tests using VSTs and CU triaxial testing. Figure 12 shows the relationships between undrained shear strength obtained from VST and CU triaxial testing and net cone resistance to evaluate the value. Based on the Su from CU triaxial testing, the back-calculated values are in the range of 13–17 and 12–23 for Sites A and B, respectively. Similarly, the Su from VST results in an ranging from 12 to 17 and 11 to 21 for Sites A and B, respectively. The average from the CU triaxial and VST calculations are around 14–17. These results are aligned with other published data, as shown in Table 1 [8,15].
Table 3.
database for triaxial CU at Site A.
Table 4.
database for triaxial CU at Site B.
Table 5.
database for vane shear test at Site A.
Table 6.
database for vane shear test at Site B.
Figure 12.
from Site A and Site B vs. CPTu to determine the recommended .
As shown in Figure 12, linear regression analyses were conducted to estimate the cone bearing factors. The coefficient of determination (R2) was determined without a zero intercept. However, to be consistent with the - relationship, the was determined with zero intercept. At Site A, a cone factor value of 16 was obtained with an . At Site B, the cone factor value was 14 with an . The 95% confidence interval of the values derived from the CU triaxial test for Site A ranged from 11.82 to 15.5, while the confidence interval obtained from vane shear test (VST) data ranged from 14.47 to 17.85. The recommended value of = 16 for Site A is statistically supported, since it falls within the confidence interval derived from both tests. In addition, this recommendation was also supported by the relatively low coefficient of variation (COV) of 23% and 26% for both CU triaxial and VST data.
For Site B, the 95% confidence interval of the value based on CU triaxial test ranged from 11.75 to 19.42, while the confidence interval derived from the vane shear test (VST) ranged from 12.97 to 17.37. The coefficient of correlations for CU triaxial and VST data for Site B are 35% and 38%, respectively, which is considered acceptable. Therefore, the recommended value of = 14 was also statistically supported by those parameters. On the other hand, the NSPT data at Site A and B shows the coefficient of variation ranging from approximately 93% to 141%. These relatively high values were due to the NSPT range considered in this study from 1 to 15, to consider very soft to medium stiff clays.
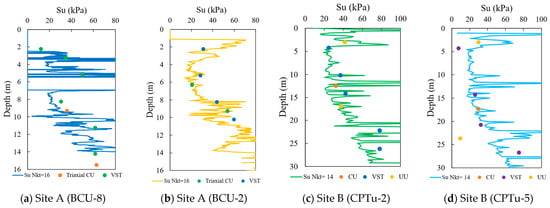
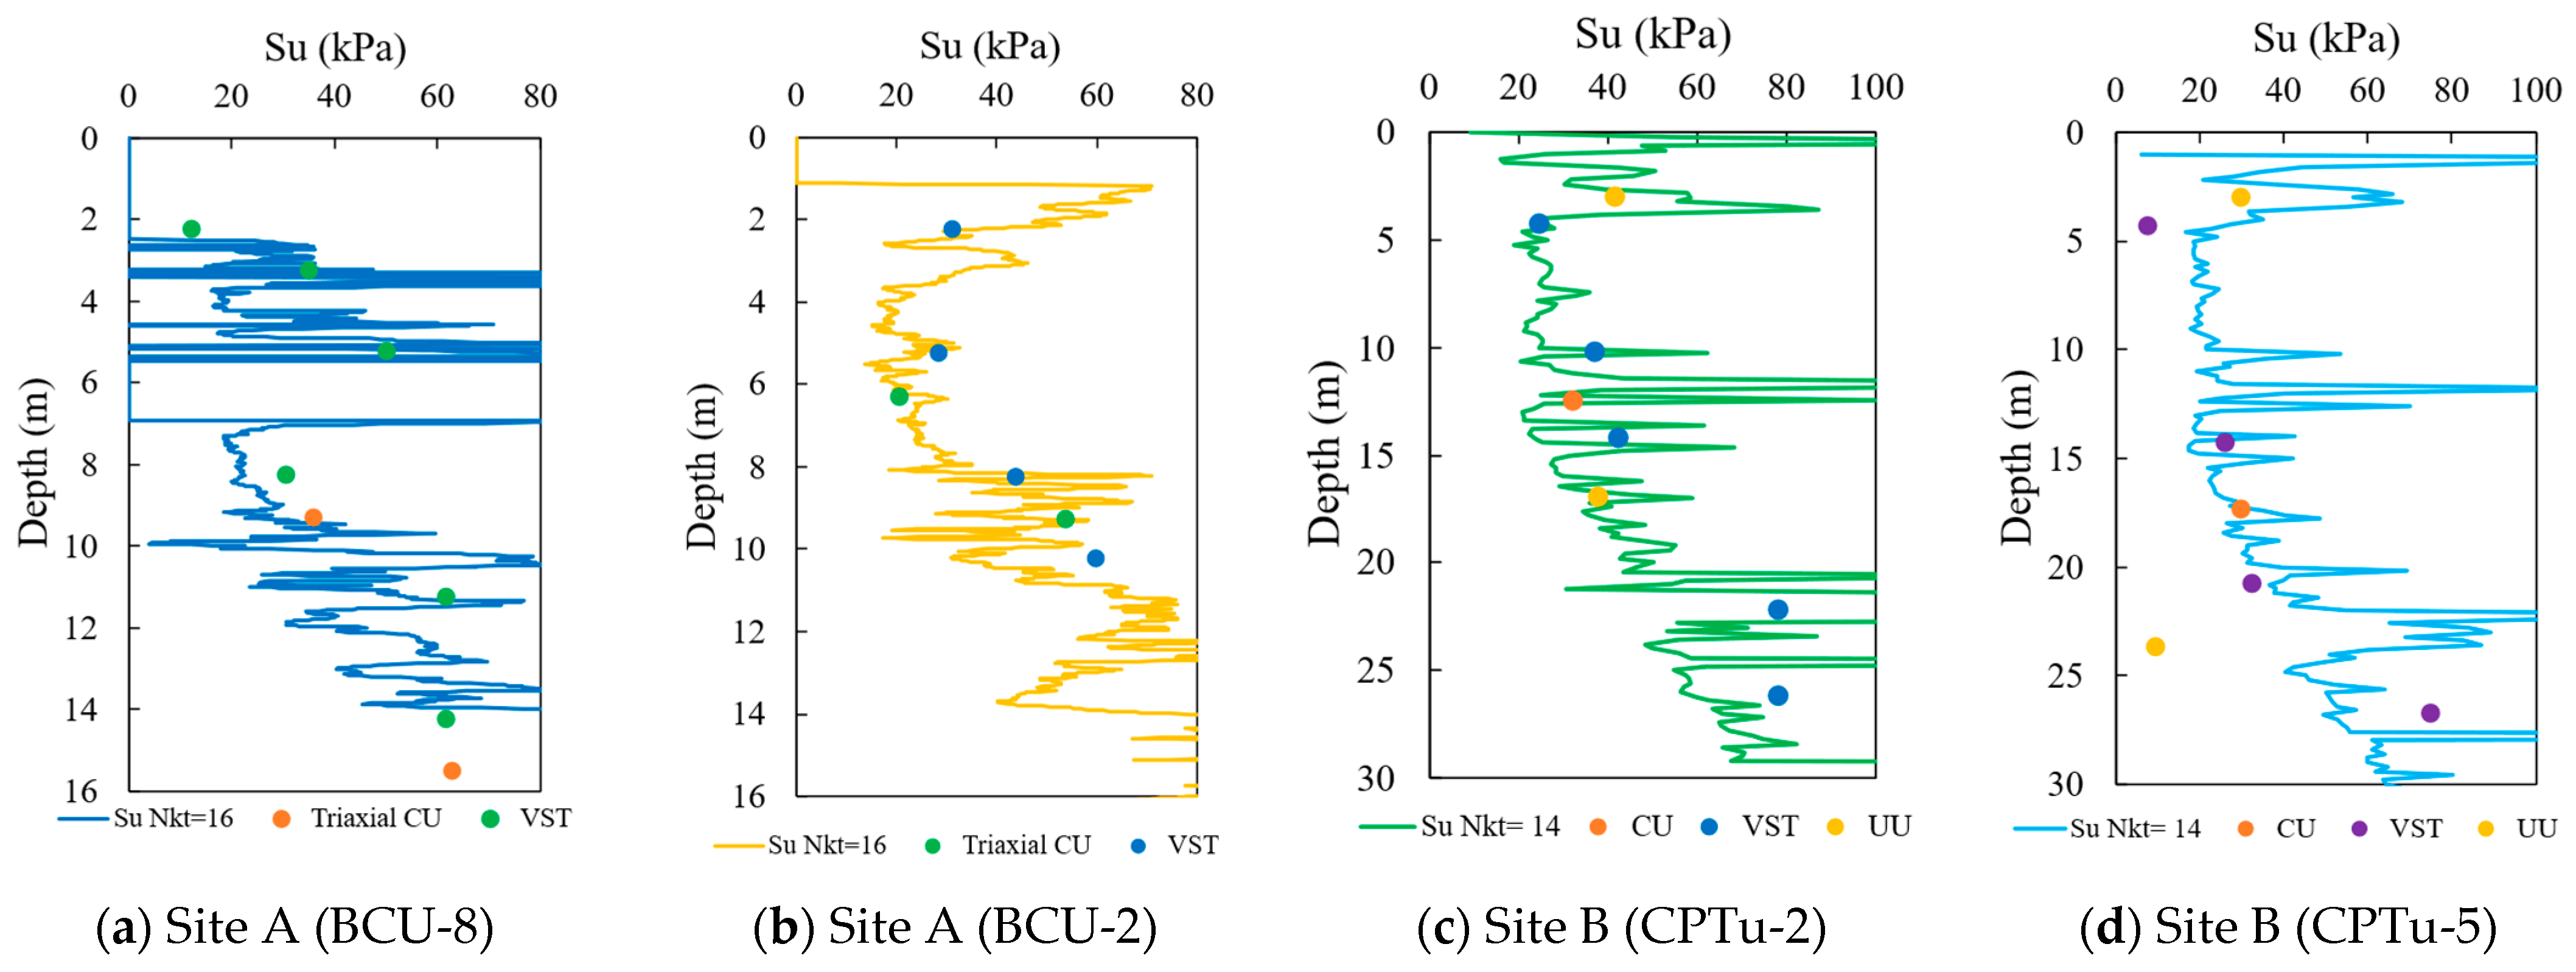
Figure 13 shows four examples of undrained shear strength profiles obtained from CPTu interpretation using an of 16 for Site A and an of 14 for Site B. Overall, the profiles are in good agreement in terms of both trends and magnitudes.
Figure 13.
Undrained shear strength from trial .
6. Correlations
6.1. Relationship Between and
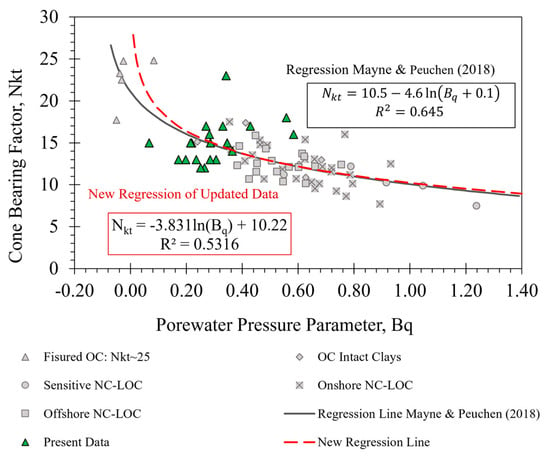
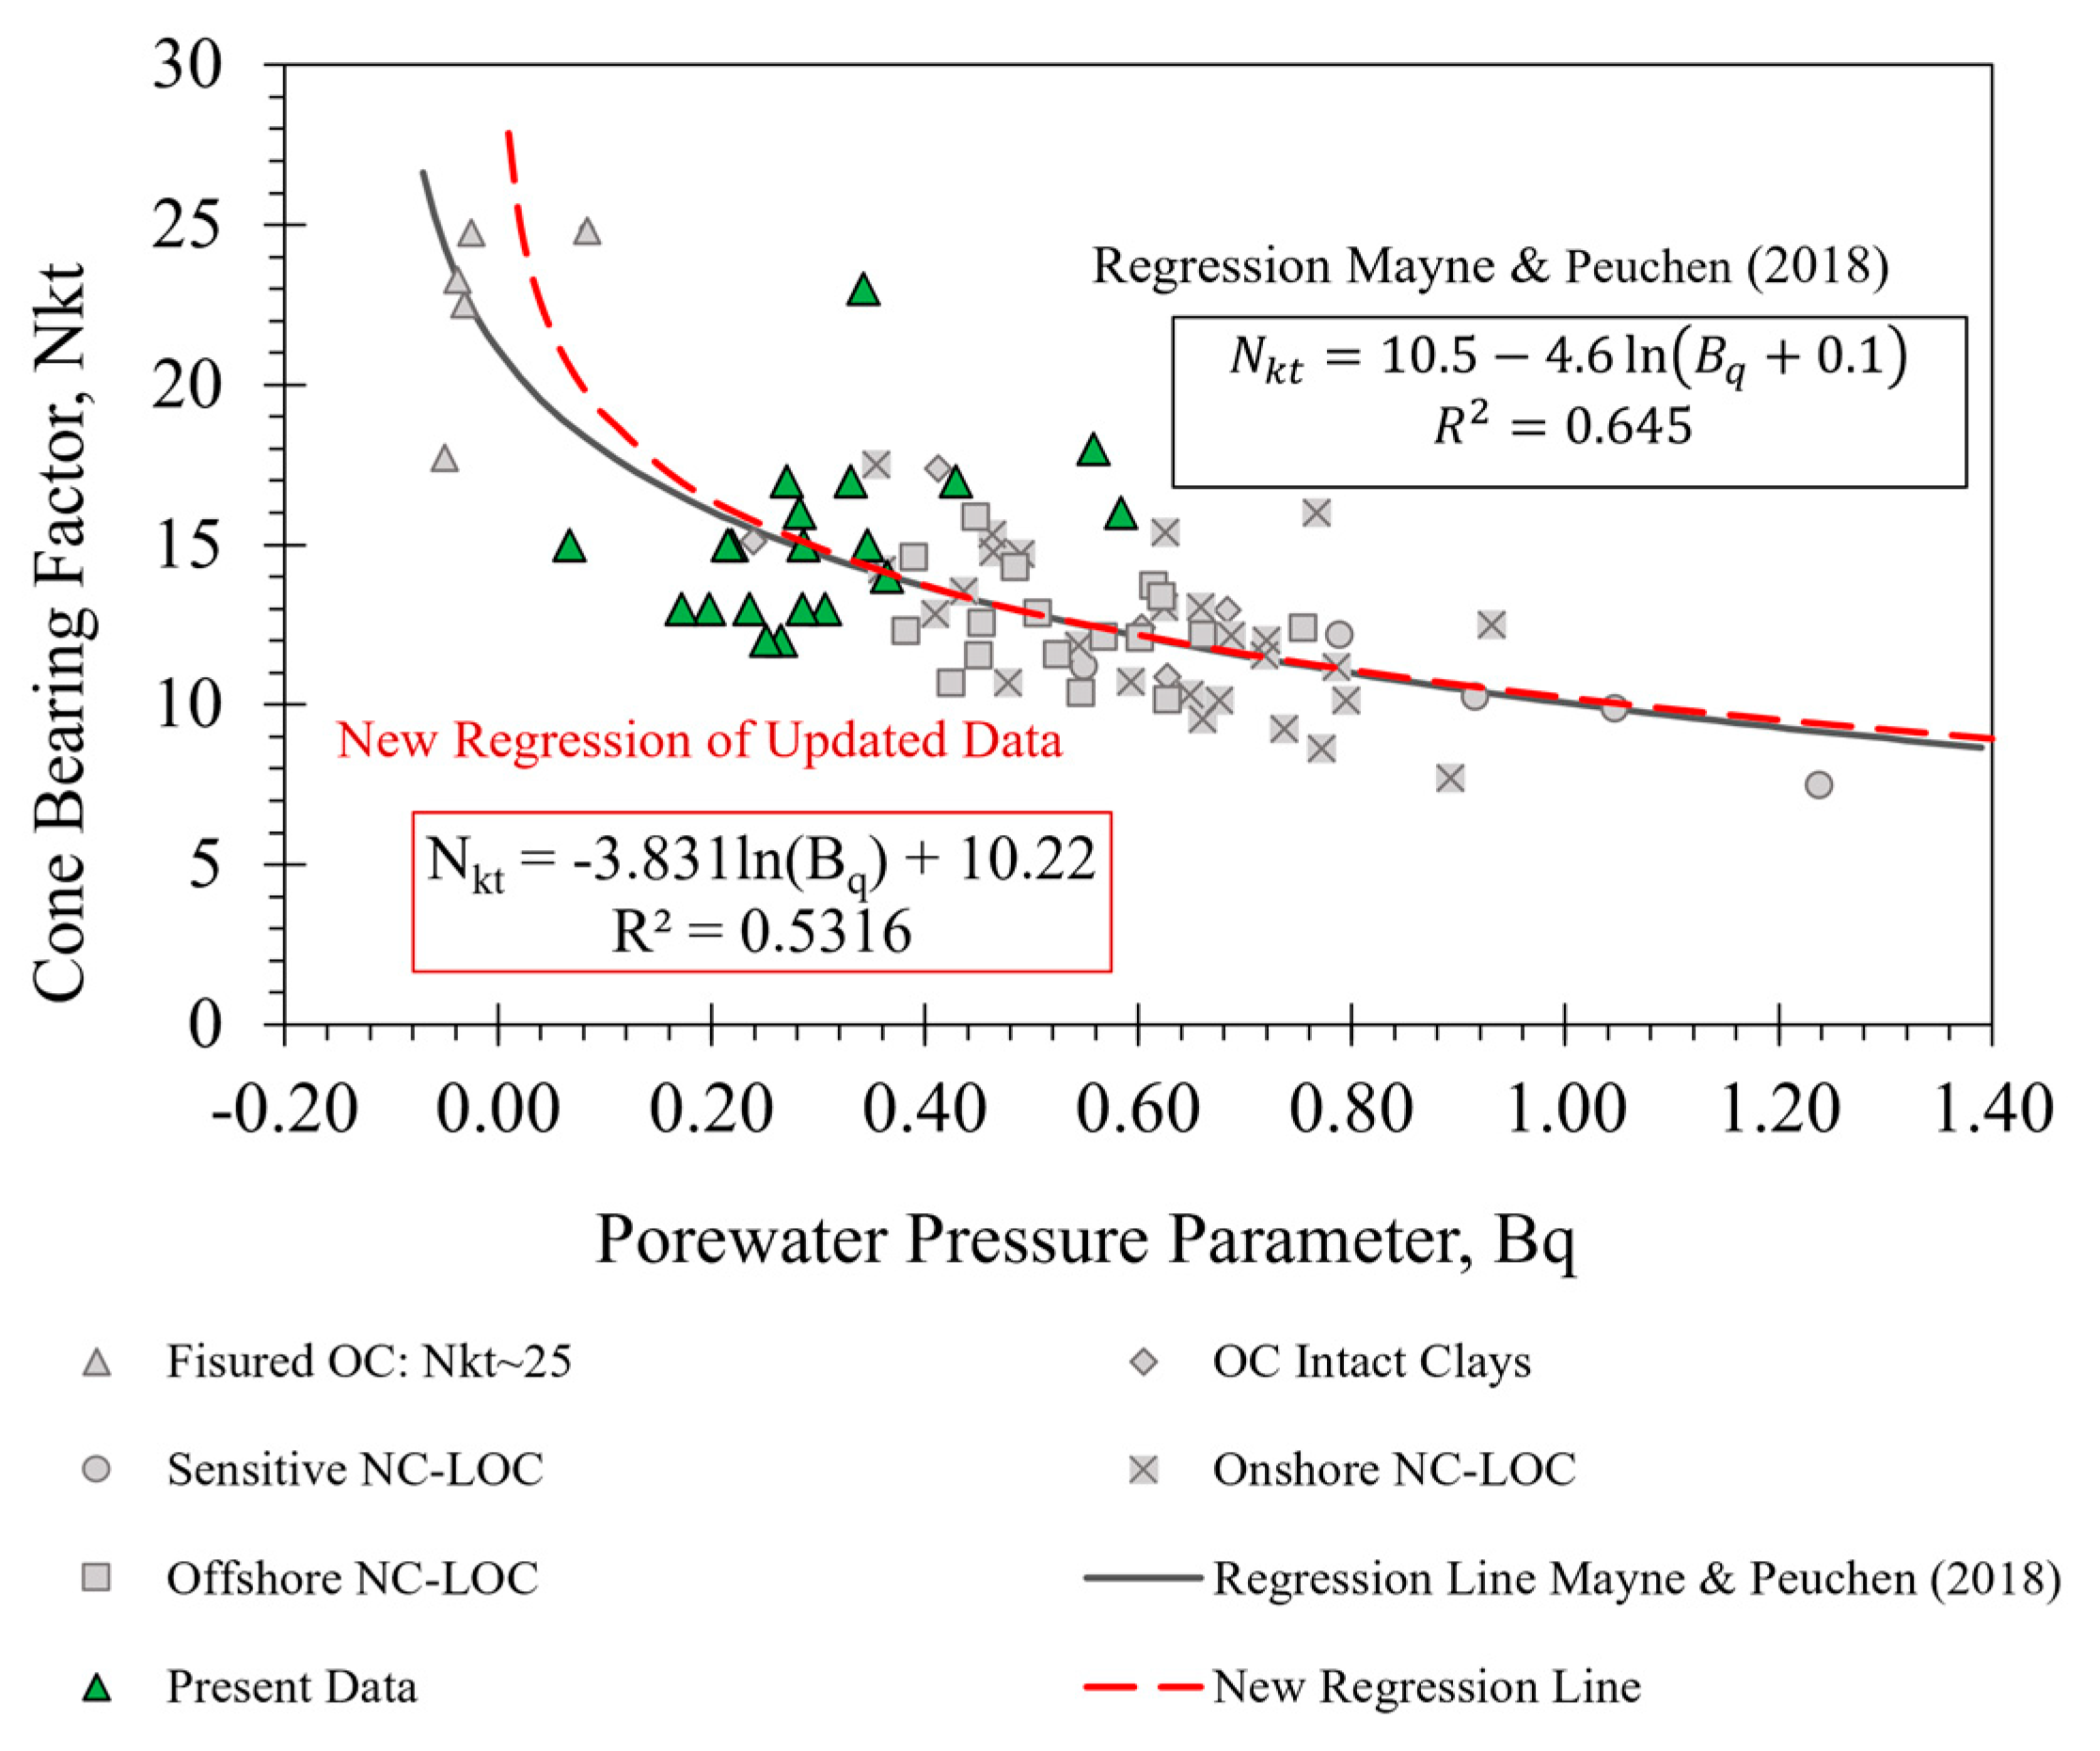
The relationship between cone bearing factor and pore pressure ratio has been demonstrated by previous researchers [22], such as the graphical trend of decreasing with . This study provides an additional database to the graph in Mayne and Peuchen [15] by representing the of each of the 20 boreholes as a single point to fill the gap, especially in the range of 0.0–0.6. The overall trend is still similar, with a higher at low and lower at high . Using regression with the additional database, a new equation was obtained.
Based on new regression after added present data, the coefficient of determination of cone factor and porewater pressure is . While statistically, the confidence interval of the value is recommended to lie within the range of 14 to 16, a limited number of data shows higher representative values around . The selection of a single representative value for each borehole was performed by taking the average obtained from CU triaxial and VST calibrations.
Negative or low values are often a characteristic feature of stiff clays. Since this study is specifically focused on soils with soft to medium consistency, samples exhibiting negative values were not included within the data distribution presented above. The correlation produced from the regression of the newly added database from the investigated sites in Java Island can be described by the following equation:
6.2. Relationship Between with
As shown in Figure 14, the cone bearing factor decreases with pore pressure ratio (Bq), indicating that, in general, normally consolidated clay has high Bq values. This implies that for overconsolidated clay, the tends to be larger than for NC clay. In this study, the relationship between the cone factor () and the overconsolidation ratio () was further examined. data were available from oedometer tests, which can be used to validate the interpreted from CPTu data. The piezocone parameters using net resistance were used for estimating with the following equation [5]:
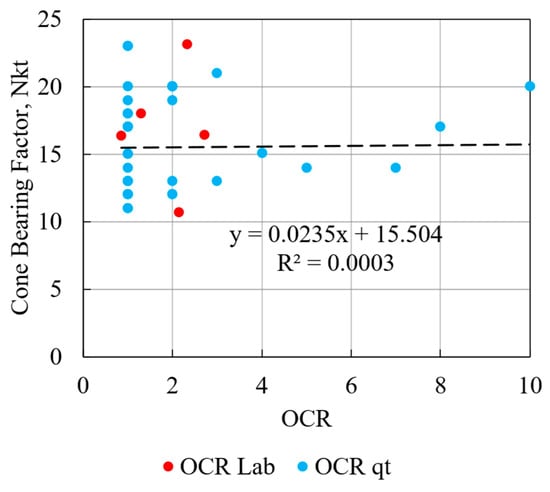
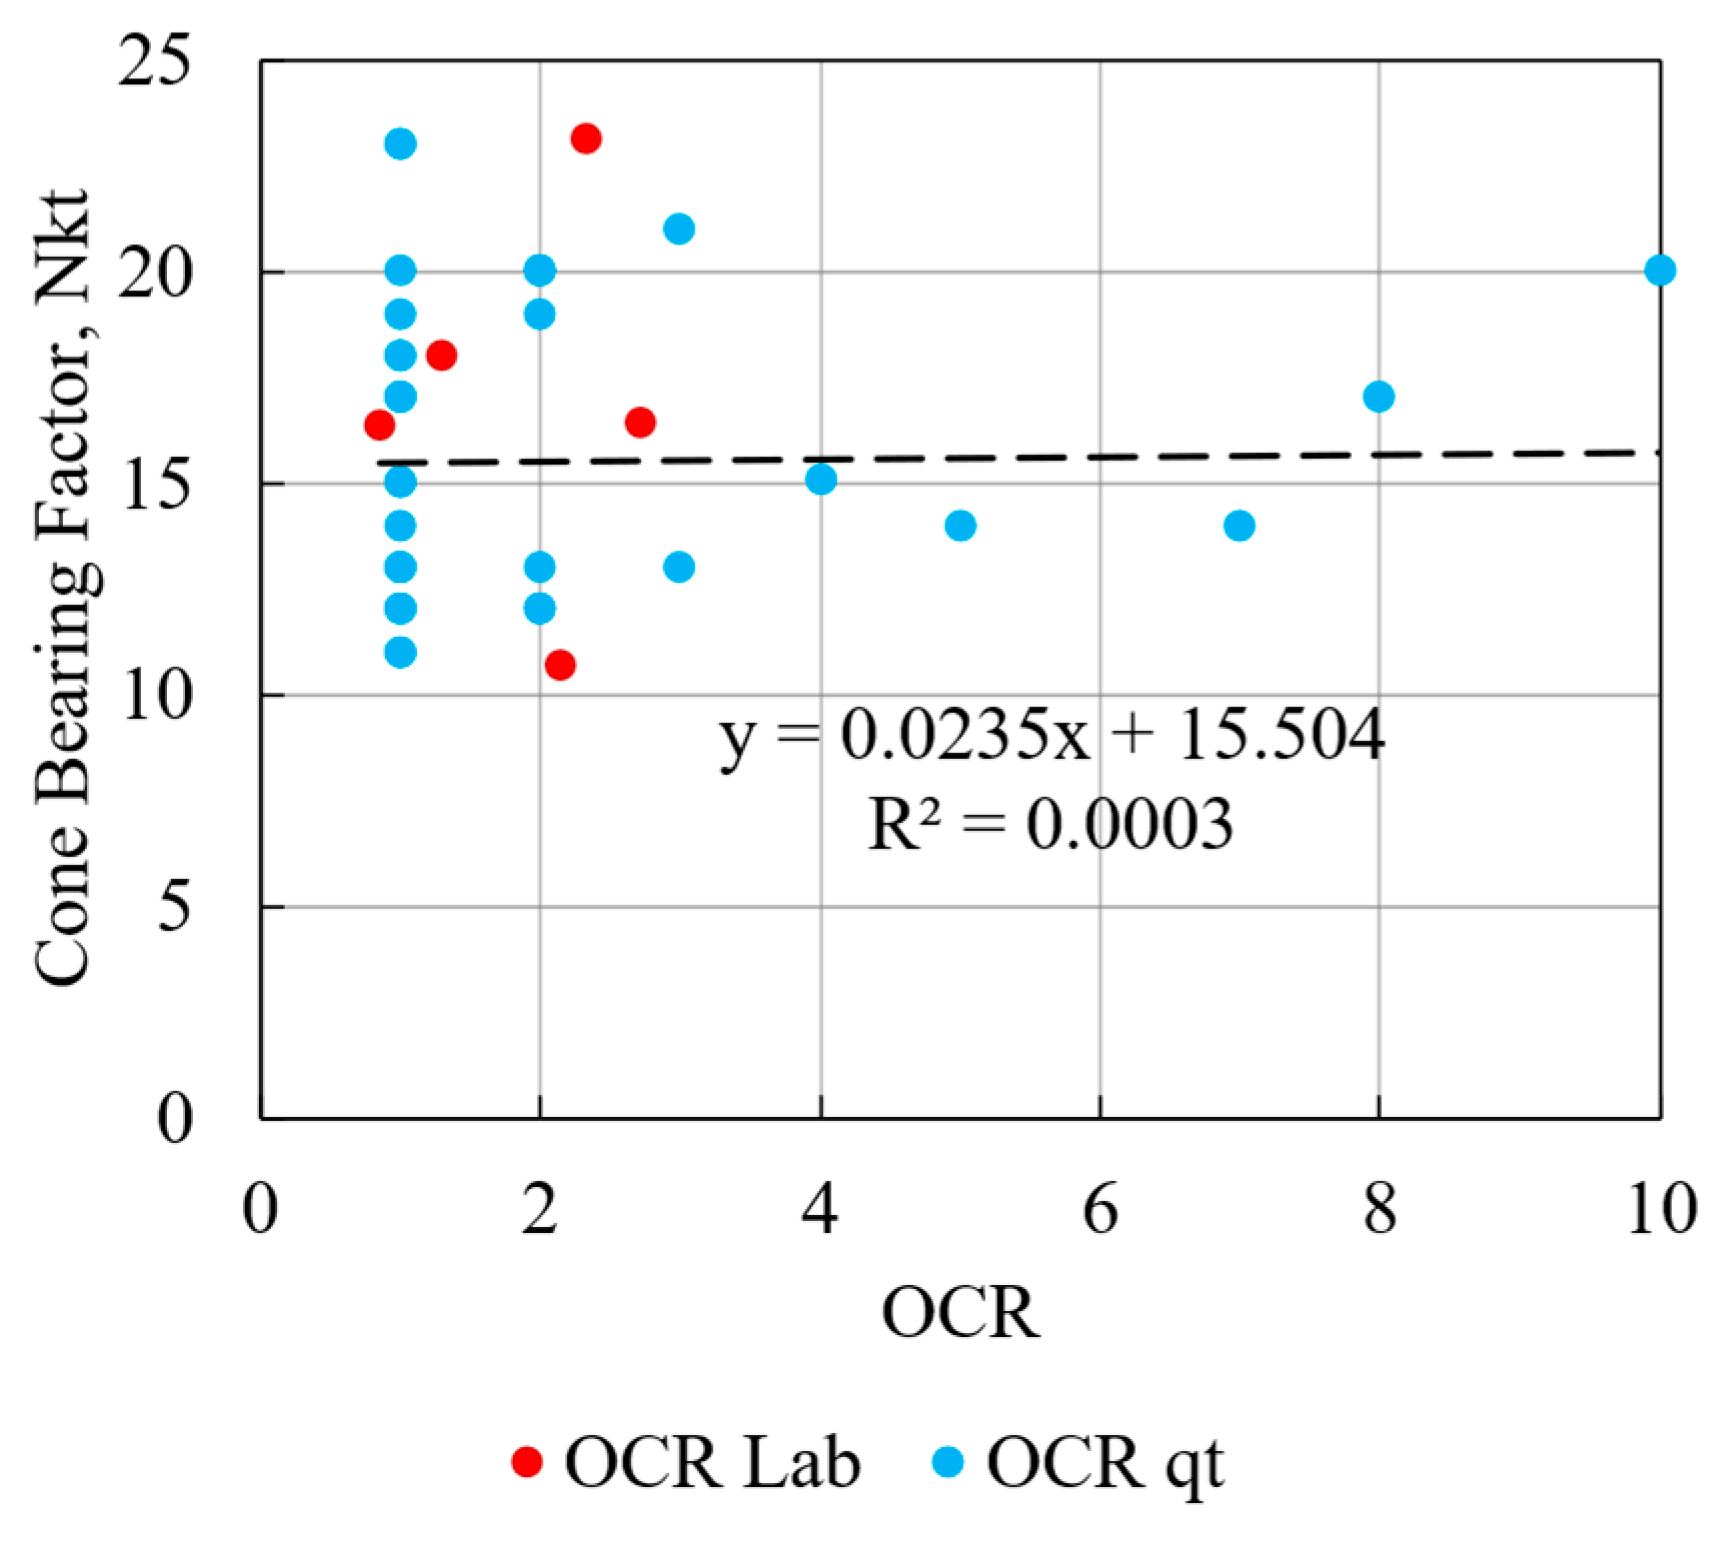
where k = 0.3 [20]. As shown in Figure 15, for highly overconsolidated soil ( > 4.0), there was an observation that the tended to increase with the increase in interpreted from cone resistance. However, for NC and slightly overconsolidated soil, the was substantially scattered. This observation was similar to the study by Aas et al. [21], which found no clear trends between and . For different types of regressions, the coefficients of determination were extremely low, with values of 0.0003 (linear and exponential), 3.0 × 10⁻⁷ (logarithmic and power), and 0.0252 (polynomial). Figure 16 shows the overall profile comparisons between the obtained from an oedometer and the interpreted from cone resistance using net cone resistance, as defined in Equation (10). In general, the interpreted from CPTu were in fairly good agreement with those determined from oedometer tests.
Figure 14.
New regression after addition of new database (modified after [15]).
Figure 15.
Relationship between and .
Figure 16.
profiles obtained from oedometer and CPTu interpretation.
6.3. Relationship Between and
Previous studies have attempted to correlate with , showing that increases slightly with [21]. In relatively uniform soils such as reclaimed land [40], a relationship between and for Singaporean reclaimed land was proposed with a typical of 40%. The relationship can be expressed by the following equation:
For soils with low sensitivity (St < 15), can be estimated from and using the following equation [14]:
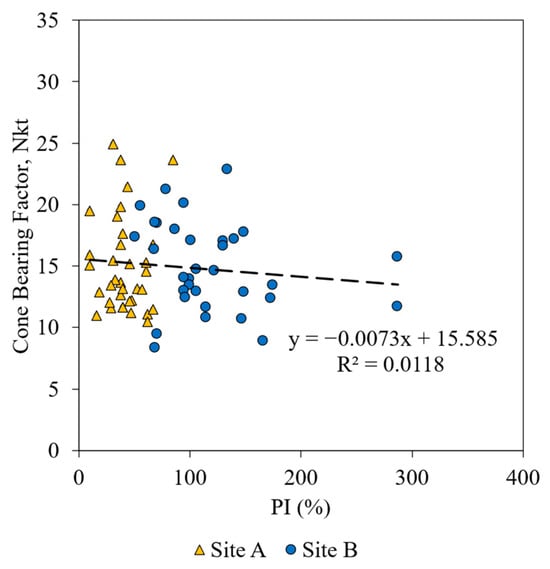
However, in other studies, no correlation was found between these two parameters [10,22]. Similarly, the obtained for soft, high-plasticity Java clays did not show any clear trends with large variability, especially for very-high-plasticity soils. Figure 17 shows the relationship between and , which indicates no correlation for either sites. The coefficient of determination for and relationships were consistently very low, with values of 0.0118 (linear), 0.0117 (exponential), 0.0084 (logarithmic), 0.0121 (polynomial), and 0.0083 (power). Even though the shear strength of soil can be dependent on the plasticity index, for normally consolidated clay, the undrained shear strength is independent of the [41].
Figure 17.
Relationship between and .
6.4. Relationship Between Undrained Shear Strength CPTu and Initial Modulus
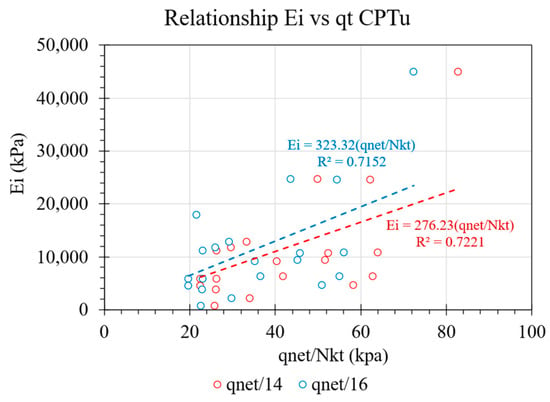
It is common to find that undrained shear strength has a substantial relationship with the undrained elastic modulus (). In this study, the undrained shear strength obtained from CPTu using the proposed of 14 and 16 was evaluated. The calculation of elastic modulus based on triaxial CU data was carried out by first estimating the initial modulus value for each sample at each borehole point. Usually, one soil sample consists of three CU triaxial specimens. From the stress–strain curves of the triaxial results, the initial modulus for each specimen at specific confining pressure was obtained. Then, the relationship between the initial modulus and confining pressure was determined. To obtain the representative undrained elastic modulus, the modulus at the effective stress value for each depth point was determined using the modulus and confining pressure regression formula. These steps were performed for each point of the 18-point CU triaxial borehole.
Usually, the correlation between undrained elastic modulus () and undrained shear strength () is defined as , where α is a multiplication factor. Using of 14 and 16, the calculated factors are about 276 and 323, respectively. Depending on the soil type, saturation conditions, loading level, soil density, stress history, cementation, age, and grain shape, the correlation factor () linking stress–strain modulus () and cone resistance () may vary. However, the ranges produced in this study are in good agreement with Duncan and Buchignani [42], whereby a relationship was found between the undrained elastic modulus, soil plasticity, and , which is often used in practice. According to Duncan and Buchignani [42], in the range above 30%, the α value varies between 150 and 600, which also depends on the . In this study, for high-plasticity clay (CH/MH), the range of α values obtained were in the reasonable range. Figure 18 shows the correlation between undrained shear strength from CPTu with the stiffness modulus obtained from triaxial CU. This shows that it is reasonable to obtain a continuous plot of the undrained elastic modulus from CPTu data, which can be useful in practice. However, these relationships always need to be validated with laboratory or other in situ tests before being applied to soils with characteristics different from those evaluated in this study.
Figure 18.
Relationship between Su from CPTu and initial modulus triaxial CU.
6.5. Relationship Between and
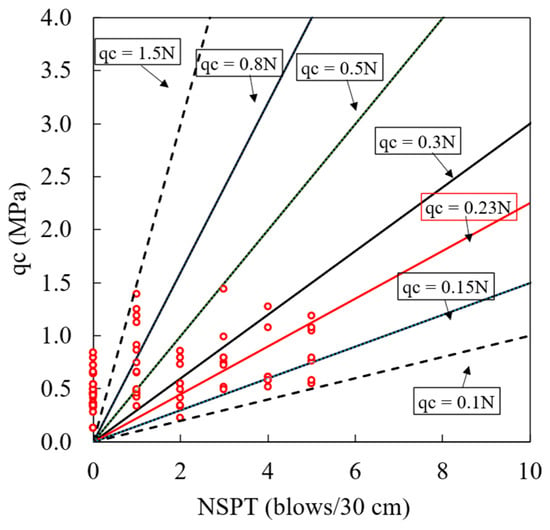
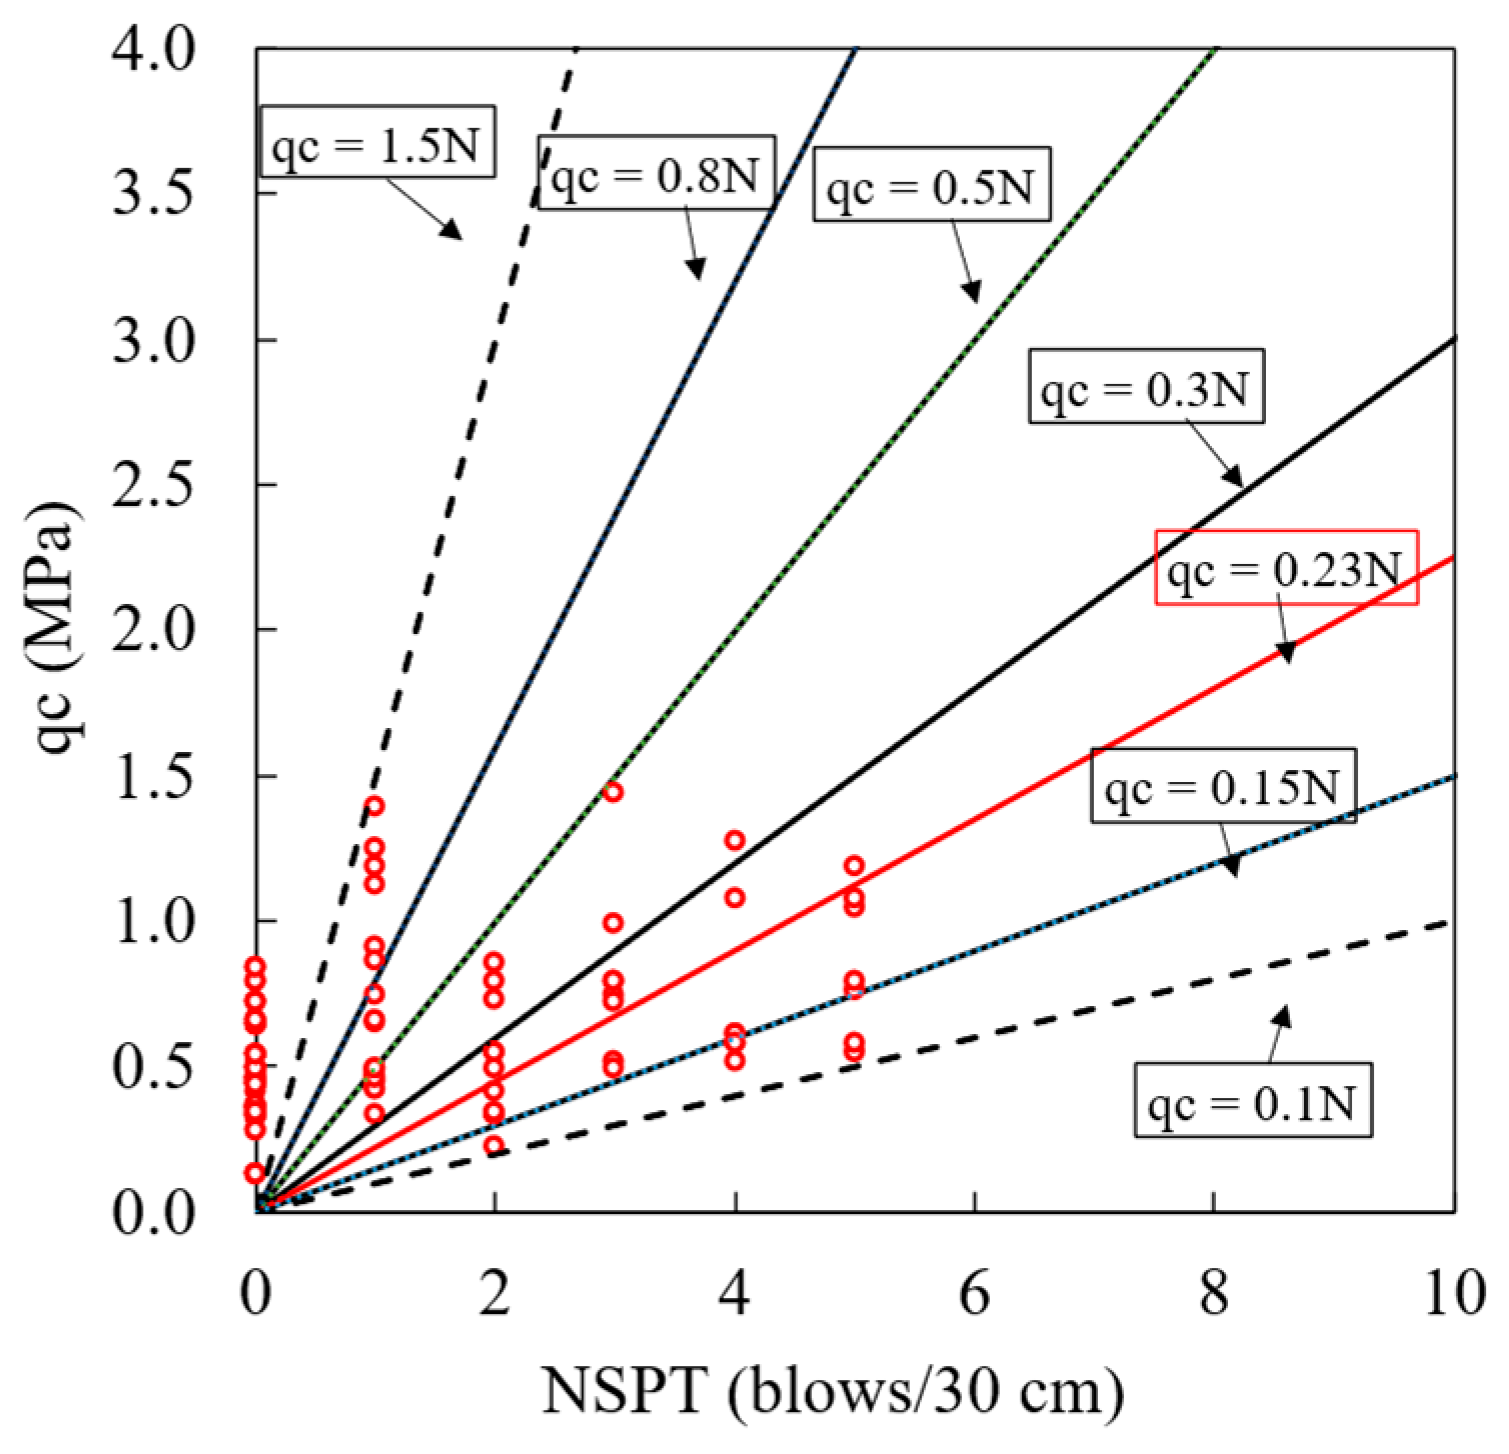
Correlations between (cone tip resistance) and values for residual soils in Africa and Singapore were provided by [43,44], respectively. For example, the relationship for African soils [43] was in the range of , while a different correlation of was observed for Singaporean soils [44] with an NSPT range of 0–20. Figure 19 shows the correlation obtained in this study. The relationship between and NSPT has a considerable range between 0.1 and 1.5 . The results of the overall data regression gave a value of with an , implying poor correlation between and . Different penetration mechanisms between SPT and CPT might be the reason why no significant relationship was observed. Therefore, it is not possible to recommend any correlation for general use [5]. The correlations obtained in this study may only be reasonable to use for cross-validating the typical resistance of soil and for preliminary design purposes using soil with characteristics similar to those evaluated in this study.
Figure 19.
Cone resistance with NSPT correlation.
7. Practical Guidelines for Engineering Applications
Based on the findings of this study, the following guidelines are proposed for CPTu interpretation of soft, high-plasticity clays with similar characteristics to the investigated sites. The proposed correlations are applicable for soft, high-plasticity clays, predominantly soft clays classified as CH and MH, similar to those investigated in Central-North Jakarta and Gedebage, Bandung. The plasticity index for these clays generally ranges from approximately 40 to 100%. The correlations are most suitable for normally consolidated clays or lightly overconsolidated clays with an overconsolidation ratio () < 2.0.
For a preliminary design, a representative cone bearing factor () in the range of 13–15 may be adopted. Once the undrained shear strength is obtained, the undrained modulus may be estimated using the proposed empirical correlation, , allowing the development of a continuous undrained stiffness profile for deformation analysis. The estimation of these two main design parameters provides a practical framework for CPTu-based preliminary design in soft, high-plasticity clay soils.
When a complete soil investigation cannot be conducted, this study suggested that the CPTu test can be reliable to estimate continuous profiles of undrained shear strength and soil modulus for soft, high-plasticity clays using a calibrated . To validate the preliminary design parameters obtained from CPTu, a limited number of unconsolidated undrained (UU) triaxial tests can be performed as these tests can be performed quickly and are cost-effective. The combination of CPTu testing for the development of continuous profiles and UU triaxial testing for verification is considered practical to implement for characterizing the shear strength and stiffness of the soft, high-plasticity clays.
8. Conclusions
This study evaluated the cone bearing factor for soft, high-plasticity clays in Java, Indonesia, using CPTu data. Other in situ VSTs and laboratory CU triaxial tests were used to calibrate the undrained shear strength. The findings suggest that the recommended representative cone bearing factor () for high-plasticity soft clays in Java ranges between 14 and 16. Although these values are within the range of typical values obtained in previous studies, the present work provides a regional calibrated through the integration of in situ and laboratory test data. Therefore, these values can be used by practical engineers to validate their estimation of undrained shear strength.
In addition, a new dataset filled the gap in the database reported by Mayne and Puechen for the range of low pore pressure ratio (Bq). A refined and updated empirical correlation was then proposed to determine as a function of Bq. The trends are consistent with previous studies; hence, this study provides an expanded database for the -Bq relationship.
For practical applications, empirical correlations were evaluated for other engineering parameters. A reasonable trend was observed between the undrained shear strength using CPTu and undrained modulus (). Using an of 14 and 16, the undrained modulus can be estimated as and , respectively, where is the undrained shear strength from CPTu data. Therefore, these correlations enable the development of a continuous undrained modulus profile directly from CPTu data which can be applied in deformation analysis and numerical modeling.
The NSPT data is often verified with cone resistance from CPTu data. Even though the relationship exhibits some variability, this study shows that for soft clays with < 6, the cone resistance is in the range between 0.1 and 1.5 , with an average of 0.23 . In contrast with undrained shear strength, there is no significant trend between the cone bearing factor () and plasticity index and , which is in agreement with other studies, demonstrating the minimal effect of stress history and plasticity on . Overall, this study provides practical values of and new empirical correlations for undrained modulus and from cone resistance that can support preliminary interpretation and design using CPTu data for soft, high-plasticity clays in Western Java, Indonesia.
Author Contributions
Conceptualization, Y.I.B. and M.I.; methodology, Y.I.B.; formal analysis, Y.I.B. and M.D.L.S.; investigation, M.D.L.S.; data curation, M.D.L.S. and J.M.; resources, M.I. and D.A.; visualization, M.D.L.S.; writing—original draft preparation, M.D.L.S.; writing—review and editing, Y.I.B., M.I., D.A., E.S. and S.K.; supervision, M.I., D.A., E.S. and S.K. All authors have read and agreed to the published version of the manuscript.
Funding
This research was supported by the Institut Teknologi Bandung under the PPMI research program (Grant No.: FTSL.PPMI-1-08-2023).
Institutional Review Board Statement
Not applicable.
Informed Consent Statement
Not applicable.
Data Availability Statement
The data presented in this study are available on request from the corresponding author due to privacy.
Conflicts of Interest
The authors declare no conflicts of interest.
Abbreviations
The following abbreviations are used in this manuscript:
| CPTu | Cone Penetration Test with Pore Pressure Measurement |
| VST | Vane Shear Test |
| CU | Consolidated Undrained (Triaxial Test) |
| UU | Unconsolidated Undrained (Triaxial Test) |
| OCR | Overconsolidation Ratio |
| PI | Plasticity Index |
| DSS | Direct Simple Shear (test) |
| FV | Field Vane |
| OC | Overconsolidated |
| FVT | Field Vane Test |
| NSPT | Standard Penetration Test blow count |
| SBT | Soil Behavior Type |
| LI | Liquidity Index |
| LL | Liquid Limit |
| USCS | Unified Soil Classification System |
| CH | Inorganic Clay of High Plasticity (USCS Classification) |
| MH | Inorganic Silt of High Plasticity (USCS Classification) |
| CL | Inorganic Clay of Low to Medium Plasticity (USCS Classification) |
| ML | Inorganic Silt of Low Plasticity (USCS Classification) |
| OH | Organic Clay or Silt of High Plasticity (USCS Classification) |
| CoV | Coefficient of Variation |
| CI | Confidence Interval |
Nomenclatures
The following nomenclatures are used in this manuscript:
| Symbol | Definition | Unit |
| Undrained shear strength | kPa | |
| Cone bearing factor for undrained shear strength interpretation | - | |
| - | ||
| Undrained Young’s modulus | MPa | |
| Corrected cone tip resistance | MPa | |
| Bearing capacity factor for undrained conditions | - | |
| Total vertical overburden stress | kPa | |
| Effective vertical overburden stress | kPa | |
| Cone factor relating cone resistance to undrained shear strength | - | |
| Cone area ratio | - | |
| Pore water pressure measured behind the cone tip | kPa | |
| Measured cone tip resistance | MPa | |
| Friction ratio, defined as | % | |
| Sleeve friction resistance | kPa | |
| Excess pore water pressure during CPTu penetration | kPa | |
| Net cone resistance, defined as | MPa | |
| Vane shear test correction factor | - | |
| Coefficient of earth pressure at rest | - | |
| Mean total stress | kPa | |
| Effective vertical stress | kPa | |
| Effective horizontal stress | kPa | |
| Effective confining stress during consolidation | kPa | |
| Empirical adhesion factor | - | |
| Initial Young’s modulus | MPa |
References
- Apriadi, D.; Mandhany, A.; Sahadewa, A.; Basarah, Y.I.; Sengara, W.; Hakim, A.M. Scaling factors for 1-D ground response amplification in a soft soil basin. Front. Built Environ. 2024, 9, 1275425. [Google Scholar] [CrossRef] [Scilit]
- Rismantojo, E.; Ginting, E.; Ochoa, M. Cyclic Resistance of High Plasticity North Java Clays and Silt. Geotech. Eng. J. SEAGS AGSSEA 2021, 52, 56–62. [Google Scholar]
- Sengara, I.W.; Sumiartha, P.; Yulman, M.A.; Yugantoro, A.; Sihombing, M.; Fathonah, W. Geotechnical Analyses and Performance of Some Highrise Buildings in Jakarta. In Proceedings of the 15th Annual International Conference on Geotechnical Engineering-Indonesian Society for Geotechnical Engineering, Jakarta, Indonesia, 24–25 November 2015. [Google Scholar]
- Irsyam, M.; Krisnanto, S.; Wardhani, S. Instrumented full scale test and numerical analysis to investigate performance of bamboo pile-mattress system as soil reinforcement for coastal embankment on soft clay. In Geotechnical Engineering for Disaster Mitigation and Rehabilitation, Proceedings of the 2nd International Conference GEDMAR08, Nanjing, China, 30 May–2 June 2008; Springer: Berlin/Heidelberg, Germany, 2008; pp. 165–170. [Google Scholar]
- Lunne, T.; Powell, J.J.; Robertson, P.K. Cone Penetration Testing in Geotechnical Practice; CRC Press: Boca Raton, FL, USA, 2002. [Google Scholar]
- Terzaghi, K.; Peck, R.B.; Mesri, G. Soil Mechanics in Engineering Practice; John Wiley & Sons: Hoboken, NJ, USA, 1996. [Google Scholar]
- Konrad, J.-M.; Law, K.T. Undrained shear strength from piezocone tests. Can. Geotech. J. 1987, 24, 392–405. [Google Scholar] [CrossRef] [Scilit]
- Mesri, G. Undrained shear strength of soft clays from push cone penetration test. Géotechnique 2001, 51, 167–168. [Google Scholar] [CrossRef]
- Bjerrum, L. Problems of soil mechanics and construction of soft clays and structually unstable soils. In Proceedings of the 8th International Conference on Soil Mechanics and Foundation Engineering, Moscow, Russia, 6–11 August 1973; Volume 3, pp. 109–159. [Google Scholar]
- Hong, S.; Lee, M.; Kim, J.; Lee, W. Evaluation of undrained shear strength of Busan clay using CPT. In Proceedings of the 2nd International Symposium on Cone Penetration Testing CPT, Huntington Beach, CA, USA, 9–11 May 2010. [Google Scholar]
- Wei, L.; Pant, R.; Tumay, M. Evaluation of undrained shear strength of soft New Orleans clay using piezocone. In Proceedings of the 2nd International Symposium on Cone Penetration Testing; ISSMGE: London, UK, 2010; pp. 2–12. [Google Scholar]
- Selänpää, J.; Di Buò, B.; Haikola, M.; Länsivaara, T.; D’Ignazio, M. Evaluation of existing CPTu-based correlations for the undrained shear strength of soft Finnish clays. In Cone Penetration Testing 2018; Hicks, M.A., Pisanò, F., Peuchen, J., Eds.; CRC Press: Boca Raton, FL, USA, 2018; pp. 571–577. [Google Scholar]
- Karlsrud, K.; Lunne, T.; Brattlien, K. Improved CPTU interpretations based on block samples. Publ. Nor. Geotek. Inst. 1997, 202, 195–201. [Google Scholar]
- Karlsrud, K.; Lunne, T.; Kort, D.; Strandvik, S. CPTU correlations for clays. In Proceedings of the 16th International Conference on Soil Mechanics and Geotechnical Engineering, Osaka, Japan, 12–16 September 2005; pp. 693–702. [Google Scholar]
- Mayne, P.; Peuchen, J. Evaluation of CPTU Nkt cone factor for undrained strength of clays. In Cone Penetration Testing 2018; CRC Press: Boca Raton, FL, USA, 2018; pp. 423–429. [Google Scholar]
- Arafianto, A.; Rahardjo, P.P. Site Characterization for Container Terminal Project at North Coast of Jakarta City by In-Situ Testing. In Geotechnics for Sustainable Infrastructure Development; Springer: Berlin/Heidelberg, Germany, 2019; pp. 1383–1390. [Google Scholar]
- Permana, A.M.; Rahardjo, P.P. The site characterization of central jakarta soft soil using CPTu and laboratory test. Indones. Geotech. J. 2022, 1, 25–40. [Google Scholar] [CrossRef] [Scilit]
- Wismanto, V.J.; Pramono Rahardjo, P.; Widjaja, B. Site Characterization of Laut Island Marine Clay in South Kalimantan Using CPTu. J. Geoengin. 2024, 19, 73. [Google Scholar]
- Ruiter, D. The static cone penetration test state-of-the-art report. In Proceedings of the 2nd European Symptoms of Penetration Testing; ESOPT: Amsterdam, The Netherlands, 1982; p. 389. [Google Scholar]
- Dobie, M. A study of cone penetration tests in the Singapore marine clay. In Proceedings of the Penetration Testing 1988: Proceedings of the 1st International Symposium (ISOPT-1), Orlando, FL, USA, 20–24 March 1988; pp. 737–744. [Google Scholar]
- Aas, G.; Lacasse, S.; Lunne, T.; Høeg, K. Use of in situ tests for foundation design on clay. In Proceedings of the ASCE Specialty Conference In Situ’86, Use of In Situ tests in Geotechnical Engineering, Blacksburg, VA, USA, 23–25 June 1986; pp. 1–30. [Google Scholar]
- Rochelle, L.; Zebdi, P.; Leroueil, S.; Tavenas, F.; Virely, D. Piezocone tests in sensitive clays of eastern Canada. In Proceedings of the First International Symposium on Penetration Testing, Orlando, FL, USA, 20–24 March 1988; pp. 831–841. [Google Scholar]
- Rad, N.; Lunne, T. Direct correlations between piezocone test results and undrained shear strength of clay. Publ. Nor. Geotek. Inst. 1989, 2, 911–917. [Google Scholar]
- Powell, J.; Quarterman, R. The interpretation of cone penetration tests in clays, with particular reference to rate effects. In Proceedings of the International Symposium on Penetration Testing ISOPT-1, Orlando, FL, USA, 20–24 March 1988; pp. 903–909. [Google Scholar]
- Lunne, T.; Randolph, M.; Chung, S.; Andersen, K.; Sjursen, M. Comparison of cone and T-bar factors in two onshore and one offshore clay sediments. In Proceedings of the International Symposium on Frontiers in Offshore Geotechnics (ISFOG), Perth, Australia, 19–21 September 2005; pp. 981–989. [Google Scholar]
- de Almeida, M.; Marques, M.; Baroni, M. Geotechnical parameters of very soft clays from CPTu. In Proceedings of the 2nd International Symposium on Cone Penetration Testing, Huntington Beach, CA, USA, 9–11 May 2010. [Google Scholar]
- Low, H.; Lunne, T.; Andersen, K.; Sjursen, M.; Li, X.; Randolph, M. Estimation of intact and remoulded undrained shear strengths from penetration tests in soft clays. Géotechnique 2010, 60, 843–859. [Google Scholar] [CrossRef] [Scilit]
- Mayne, P.; Peuchen, J.; Baltoukas, D. Piezocone evaluation of undrained strength in soft to firm offshore clays. In Frontiers in Offshore Geotechnics III, Proceedings of the 3rd International Symposium on Frontiers in Offshore Geotechnics (ISFOG 2015), Oslo, Norway, 10–12 June 2015; Taylor & Francis Books Ltd.: London, UK, 2015; pp. 1091–1096. [Google Scholar]
- De La Rosa, R.J.; López, F.F. Cone factor from CPTU tests in very soft clays at the east of Mexico’s valley. In Cone Penetration Testing 2022; CRC Press: Boca Raton, FL, USA, 2022; pp. 351–355. [Google Scholar]
- Robertson, P.K.; Cabal, K. Guide to Cone Penetration Testing for Geotechnical Engineering; Gregg Drilling & Testing, Inc.: Signal Hill, CA, USA, 2015. [Google Scholar]
- Paniagua, P.; D’Ignazio, M.; L’Heureux, J.-S.; Lunne, T.; Karlsrud, K. CPTU correlations for Norwegian clays: An update. AIMS Geosci. 2019, 5, 82–103. [Google Scholar] [CrossRef] [Scilit]
- D’Ignazio, M.; Andersen, K.; Engin, H.; Sivasithamparam, N.; Jostad, H.; Yetginer, G. Interpretation of piezocone tests in overconsolidated clays using SHANSEP. In Proceedings of the International Symposium on Frontiers in Offshore, Austin, TX, USA, 28–31 August 2020. [Google Scholar]
- Selänpää, J. Derivation of CPTu Cone Factors for Undrained Shear Strength and OCR in Finnish Clays. Ph.D. Thesis, University of Tampere, Tampere, Finland, 2021. [Google Scholar]
- O’Neill, M.; Bransby, M.; Doherty, J.; Watson, P. Spatial interpolation of sparse PCPT data to optimise infrastructure design. In Cone Penetration Testing 2022; CRC Press: Boca Raton, FL, USA, 2022; pp. 1023–1028. [Google Scholar]
- Paredes, J.; Illingworth, F.; Luque, R. Geotechnical zoning of deltaic and alluvial soils of Guayaquil (Ecuador) using CPT and Nkt calibration based on FVT. In Cone Penetration Testing 2022; CRC Press: Boca Raton, FL, USA, 2022; pp. 1042–1047. [Google Scholar]
- Rios, S.; Sousa, L.; da Fonseca, A.V.; Milheiro-Oliveira, P.; Hededal, O. Probabilistic analysis of gyttja undrained strength from CPTU data for slope stability analysis. In Cone Penetration Testing 2022; CRC Press: Boca Raton, FL, USA, 2022; pp. 1065–1070. [Google Scholar]
- Robertson, P.K. Soil classification using the cone penetration test. Can. Geotech. J. 1990, 27, 151–158. [Google Scholar] [CrossRef] [Scilit]
- ASTM D4767-11; Standard Test Method for Consolidated Undrained Triaxial Compression Test for Cohesive Soils. ASTM International: West Conshohocken, PA, USA, 2020.
- Duncan, J.M.; Wright, S.G.; Brandon, T.L. Soil Strength and Slope Stability; John Wiley & Sons: Hoboken, NJ, USA, 2014. [Google Scholar]
- Bo Myint Win, B.; Arulrajah, A.; Choa, V.; Chang, M. Site characterization for a land reclamation project at Changi in Singapore. In Geotechnical Site Characterization; CRC Press: Boca Raton, FL, USA, 1998; pp. 333–338. [Google Scholar]
- Mesri, G. Discussion of New Design Procedure for Stability of Soft Clays. J. Geotech. Eng. Div. 1975, 101, 409–412. [Google Scholar] [CrossRef] [Scilit]
- Duncan, J.M.; Buchignani, A. An Engineering Manual for Settlement Studies; Department of Civil Engineering, University of California: Oakland, CA, USA, 1976. [Google Scholar]
- Ajayi, L.; Balogun, L. Penetration testing in tropical lateritic and residual soils-Nigerian experience. In Proceedings of the International Symposium on Penetration Testing ISOPT-1, Orlando, FL, USA, 20–24 March 1988; pp. 315–328. [Google Scholar]
- Chang, M. In-situ testing of residual soils in Singapore. In Proceedings of the International Conference on Geomechanics in Tropical Soils, Singapore, 12–14 December 1988; pp. 97–108. [Google Scholar]

Disclaimer/Publisher’s Note: The statements, opinions and data contained in all publications are solely those of the individual author(s) and contributor(s) and not of MDPI and/or the editor(s). MDPI and/or the editor(s) disclaim responsibility for any injury to people or property resulting from any ideas, methods, instructions or products referred to in the content. |
© 2026 by the authors. Licensee MDPI, Basel, Switzerland. This article is an open access article distributed under the terms and conditions of the Creative Commons Attribution (CC BY) license.