


Abstract
The role of poverty, specifically the urban poor, in shaping the urban landscape is often solely linked to slums and informal settlements in urban centers. However, contrary to this common perception, this study aims to elucidate how urban poor residents contribute to shaping urban sprawl in developing countries. After identifying patterns of urban sprawl and poverty in the Jakarta Metropolitan Area (JMA) in Indonesia, the study used the Structural Equation Model (SEM) method to analyze survey data from 195 respondents with a per capita income of less than USD 2.15 (IDR 34,000) daily in Tangerang Regency, a western suburb of the JMA. This study shows that urban sprawl and poverty concentration overlap. The urban poor contribute to urban sprawl by purchasing affordable land on the urban periphery, traveling there with their motorized vehicles, and taking advantage of government subsidies. However, rather than gaining more land, they face increased public service costs, a lack of basic facilities, and habitat destruction. Most respondents own their own homes, but almost half of the respondents (41.54%) state that these homes are less than 48 m2 in size. It can be concluded that economically vulnerable populations can contribute to urban sprawl when confronted with ineffective planning institutions.
1. Introduction
The United Nations (UN) projects a 2.5 billion increase in urban residents by 2050, 90% of which will occur in Asia and Africa [1]. The rapid growth of urban populations in these two continents, the majority of which are developing countries, often exceeds the capacity of governments to plan and provide housing in urban centers [2,3]. This condition makes suburban areas the preferred residential area and encourages inefficient land consumption [2].
Overall, population growth in the Global South is faster than land consumption, making it more efficient than in the Global North [4,5]. However, land consumption in suburban areas is occurring more rapidly, resulting in decreased settlement density and urban cluster cohesion and making these areas morphologically inefficient [5]. These various conditions indicate the occurrence of urban sprawl in developing countries [6,7,8].
In contrast to developed countries, city centers in developing countries still retain a strong appeal due to a combination of factors, such as higher incomes, better amenities, and concentrated development [9,10]. Despite this, high property prices and the high cost of living force low-income populations to increasingly move to the outskirts of urban areas [11,12,13]. The resulting pattern is one in which high-income populations reside in the city center, while low-income populations and migrants are confined to the suburbs [8,10]. This pattern results in the presence of the poor overlapping with urban sprawl on the outskirts of urban areas in developing countries.
The overlap between poverty and urban sprawl requires serious attention, as suburban residents often do not benefit from the economic and social agglomeration common in city centers. Economically disadvantaged suburban residents often face higher utility costs while receiving limited benefits [14]. In the long term, urban sprawl can serve as a geographic determinant, impeding low-income residents’ ability to advance economically due to path dependency [15] and negatively affecting intergenerational mobility [16].
Nevertheless, the overlap between urban sprawl and poverty offers the potential to generate new insights into the drivers of urban sprawl. Current understanding suggests that urban sprawl is primarily driven by factors associated with wealth, such as rising incomes, a growing middle class, improved transportation infrastructure, and a car-based lifestyle [17,18,19,20]. Based on this perspective, if only low-income residents were present, urban sprawl would not occur.
The relationship between urban poverty and urban sprawl is complex. To date, studies on urban sprawl and poverty have largely viewed urban sprawl as a phenomenon that influences poverty [6,8,21,22,23,24]. However, there is a lack of research specifically examining the role of the urban poor in driving urban sprawl in developing countries. Therefore, research focused on clarifying the relationship between poverty and urban sprawl in this context is urgently needed.
Several questions arise based on this background: What are the overlapping patterns of urban sprawl in developing countries? Why do poor people live in peripheral areas, and how do they drive urban sprawl?
To answer these questions, this study aims to explore the phenomenon of urban sprawl and poverty in developing countries. The Jakarta Metropolitan Area (JMA), the largest metropolitan area in Southeast Asia, is used as a case study. This study has two main objectives: (1) identifying patterns of urban sprawl and poverty patterns in the JMA, and (2) examining the influence of the urban poor on urban sprawl in the JMA.
Contrary to the extant literature that has examined the influence of urban sprawl on urban poverty [6,14,21,22,23,24,25], this study aims to explore the role of the urban poor in driving urban sprawl. Contrary to previous studies that have claimed to be based on literature [15,26], this study aims to conduct research based on empirical data. The results of this study are expected to contribute to the existing literature on urban sprawl in developing countries. This study offers an alternative to the prevailing grand narratives that have been employed to comprehend urban sprawl. By integrating modern rationality with postmodern skepticism, it contributes to the emerging field of metamodern geography.
Following the introduction, the article discusses various perspectives on understanding urban mechanisms and their limitations. The subsequent section presents a literature review on the potential relationship between poverty and urban sprawl in developing countries. A conceptual framework is subsequently developed based on the results of this literature review. The article then outlines the identification of urban sprawl and poverty in the JMA. To further examine the relationship between poverty and urban sprawl, survey results from respondents in districts with the highest urban sprawl index and poverty concentration are analyzed and discussed.
2. Various Perspectives and Mechanisms That Are Not Yet Fully Understood
The majority of studies utilize a mixed perspective to examine the mechanisms of urban sprawl [8]. The intricacies inherent in this phenomenon complicate its comprehension through a mono-perspectival lens. A comprehensive review of the extant literature reveals at least four perspectives from which to understand urban sprawl: classical economics, Marxist economics, institutional economics, and sociology (Table 1).
From a neoclassical economic perspective, urban sprawl is attributed to the role of markets and land prices. This phenomenon is considered a regularity of market processes rather than an indication of an economy with an out-of-control system [27]. The primary factors contributing to urban sprawl are population growth, rising incomes, declining travel costs, and decreasing land prices [17,19,28]. This neoclassical perspective has served as the foundation for numerous model-based studies, which frequently employ a range of indicators with limited theoretical substantiation. Nevertheless, the market mechanisms that are operational and the relationships between the influencing factors remain inadequately understood [8].
Table 1.
The driving mechanism of urban sprawl.
This neoclassical economic perspective is also subject to critique when applied to urban sprawl in developing countries. Rural poverty is frequently cited as a contributing factor [15,26]. However, the assertion that poverty is the primary driver of urban sprawl in developing countries warrants further investigation. In the absence of income increases, the urban poor should not be responsible for urban sprawl; rather, they should be creating slums and informal settlements in urban centers, as is the case in many regions.
Conversely, the Marxist economic perspective conceptualizes urban development as an integral component of the capitalist circuit [29]. In the event of excess capital accumulation in the primary circuit (goods and services), said capital is subsequently directed towards secondary circuits, such as physical infrastructure and urban development [29]. Consequently, this excess capital accumulation has led to significant regional transformations, resulting in urban expansion [26]. Despite the scarcity of domestic capital, the process of urban development in developing countries is influenced by the global economy and foreign capital [33,34].
Researchers who adopt an institutional perspective emphasize the role of government institutions in the process of shaping urban sprawl. The phenomenon of urban sprawl is a consequence of various public policies, including subsidies and fiscal policies [28]. Public policies or subsidies that promote automobile use will play a pivotal role in shaping urban expansion [19]. Simultaneously, increased property taxes in suburban areas will likely result in a relatively more compact urban form [30]. However, this institutional mechanism is still questionable in the European context and in developing countries. Despite substantial investments in public transportation and relatively high taxes in Europe, urban sprawl remains a salient issue [26,35,36]. Concurrently, in developing countries, inadequate planning capacity enables growth patterns to emerge that diverge from the objectives delineated by government institutions [3,37].
From a sociological perspective, urban sprawl is understood as being driven by personal motivations. In fact, various government initiatives aimed at promoting more compact cities often face challenges due to negative public perceptions and the housing market [38]. The decision of middle-class residents to relocate to suburban areas is often precipitated by a number of factors. These include the perception of elevated crime rates and tax burdens, the deterioration of urban infrastructure, and the quality of education that falls below the standards desired by parents [25,31,39]. This migration is driven not only by the aspiration for a more desirable quality of life in suburban areas, but also by racial factors resulting from the presence of Black residents in the city center [14,40,41]. The sorting effect posited by Tiebout [42] can be utilized to comprehend the genesis of urban expansion. The appeal of suburban areas, as evidenced by their increased attractiveness to residents, is often attributed to their perceived amenities, including schools and housing. Conversely, urban centers are perceived to have a decline in desirability, largely due to concerns regarding crime and racial issues [19]. However, this perspective is very unique to the United States. A considerable number of countries that are not confronted with issues of racial disparity and inequitable access to fundamental amenities nevertheless grapple with the phenomenon of urban sprawl.
3. Potential Link Between Poverty and Urban Sprawl in Developing Countries
As mentioned in the introduction, previous studies on urban sprawl and poverty have largely positioned urban sprawl as a phenomenon that exacerbates poverty. The poor’s weak position in various ways may explain why this study receives less attention. However, it has long been understood that the poor urbanize faster than the population as a whole [43]. Urbanization can reduce rural poverty but increase urban poverty [44,45,46,47]. Some researchers even discuss the urbanization and suburbanization of poverty [48,49,50,51,52].
Based on these conditions, the overflow of poverty in the form of rural-to-urban migration has quickly been identified as a cause of urban sprawl in developing countries [15,26]. Nevertheless, to date, no research based on field data has explained the relationship between urban poverty and excessive land consumption. Furthermore, this statement contradicts the various processes of population growth. In reality, urban population growth in developing countries is driven by rural-to-urban migration, natural growth, and land reclassification [53,54,55,56].
It is an irrefutable fact that rural-to-urban migration persists in the majority of developing countries. A confluence of factors, including elevated income levels and enhanced urban amenities, serves as a catalyst for population migration from rural to urban regions [9]. Nevertheless, individuals with limited financial means who are migrating from rural areas to urban centers encounter significant obstacles due to the high cost of living in these locations. They are compelled to relocate and are marginalized to the periphery [10,12].
The presence of impoverished individuals in peripheral regions is not solely attributable to rural migration that is impeded from reaching the city center. The phenomenon of urban migration can be attributed to a variety of factors, including but not limited to: high land and property prices in the city center, gentrification, evictions, and resettlement [13,23,57,58]. Moreover, numerous developing countries have transformed urban peripheries into catalysts for economic growth by developing industrial and residential areas, frequently with the assistance of foreign investment [33,34,59,60]. The convergence of these phenomena has led to the transformation of suburban in developing countries into nexuses for migration from rural areas and from the city center. This has precipitated interventions from government and the private sector, resulting in subsequent growth with various incentives.
Nevertheless, the presence of impoverished individuals in peri-urban areas does not inherently result in urban sprawl. The phenomenon of peri-urban areas experiencing urban sprawl can be attributed to a complex interplay of various factors. Research conducted by Jedwab et al. [61] posits that the expansion of cities in affluent countries has been facilitated by their capacity to both extend and elevate through the construction of tall buildings. Conversely, cities in less developed countries have expanded significantly due to their capacity for further development [61].
In addition to the inability to build upwards, governments in developing countries have largely been unable to provide social housing as a welfare right for their citizens [62]. A substantial body of research has demonstrated that Indonesia, a country with the fourth largest population in the world, is capable of meeting a mere 17% of its housing needs through the formal housing sector [62]. The majority of impoverished individuals residing in urban areas are compelled to construct their own dwellings [62,63]. Indeed, self-help housing appears to be the sole viable solution to the dearth of adequate housing for the urban impoverished [63]. Consequently, substandard settlements are proliferating in numerous developing countries [15,23]. Notwithstanding the modest formal housing sector and the preeminence of self-help housing, housing in Indonesia is comparatively affordable, household formation rates are elevated, and housing supply is relatively elastic [64]. Nevertheless, Indonesia boasts one of the most stringent land registration and construction permit systems on the Asian continent [64]. Given the contradictory facts presented, it is highly probable that a significant proportion of housing in Indonesia is constructed independently and does not adhere to the relevant licensing procedures. A multitude of studies conducted in various developing countries have indicated that the utilization of unlicensed spaces is a prevalent phenomenon, often regarded as the norm [65,66].
The utilization of space without explicit authorization can be interpreted as a manifestation of informality. Although the term “informality” emerged relatively recently, the substance of this term has actually been known for a considerable time. For example, Polese [67] notes that the term was first used by Geertz in his work The Interpretation of Cultures [68]. In 1973, Scott published his seminal work, Weapons of the Weak [69]. The framework of Scott’s [69] work on everyday forms of peasant resistance is a compelling subject for analysis. According to Scott, poor citizens can contribute to state governance through small, uncoordinated acts of defiance, even if these acts are repeated millions of times [69].
Despite the focus of Scott’s work on peasant life in rural Southeast Asia, his approach, which has been characterized as rebellious, remains pertinent in the context of understanding the relationships among the urban poor when confronted with regulatory frameworks that fail to address their fundamental needs. Furthermore, in the case of Indonesia, a significant number of urban areas were formed through the reclassification of previously rural areas [70]. The recent reclassification is related to the concept of agricultural involution, which was conceptualized by Geertz [71] as a condition of increasingly diminishing agricultural land cultivated by farmers. The process of urbanization can be characterized by the following sequence of events: first, the shrinkage or exhaustion of agricultural land; second, the subsequent change in profession by farmers; and finally, the classification of the areas as urban. The cast of characters remains predominantly unchanged, with actors continuing to portray farmers or members of farming families who have transitioned to different occupations. These individuals reside in areas that have undergone a transition from rural to urban classification.
Informality can thus be defined as activities undertaken by individuals or groups of individuals who ultimately disregard the state or the bodies that regulate their lives [67]. This phenomenon can be explained by the emergence of informal practices in areas that are not subject to state regulation or by their substitution of state mechanisms that are considered ineffective [67]. In the context of East African cities described by Guma et al. [72], informality among impoverished populations in Asia can manifest not only as a survival strategy but also as a form of rebellion, characterized by clandestine rule-breaking [67]. This condition gives rise to elevated levels of informality, thereby precipitating the expansion of built-up areas in developing countries, which frequently surpasses the capacity of government planning [3,73].
A multitude of conditions are prevalent in developing countries. Among these are poorly designed road networks, spatial mismatches between housing and employment opportunities, and inadequate public transportation systems [21]. In the context of these circumstances, numerous developing countries depend on paratransit transportation that remains largely unregulated by governmental entities [74,75].
In addition to the prevailing trend, numerous developing countries in Southeast Asia have adopted motorcycles as their predominant mode of transportation. In Hanoi, Vietnam, in 2000, the number of motorcycles was 953,087, while the number of cars was only 130,746 [76]. In Jakarta, the number of motorcycles increased by more than 1000 units per day, while the number of cars increased by approximately 300 units per day [77]. By 2013, the number of motorcycles in Indonesia had reached more than 84.7 million units, while cars numbered only 11.4 million and buses only 2.2 million [77]. A study conducted in another region of Indonesia revealed that 69% of the urban poor population possessed motorcycles [78].
The possession of a motorcycle facilitates the mobility of individuals residing in urban areas who are confronted with limited financial resources, thereby obviating the necessity of reliance on public transportation. The absence of constraints on residential location can, in principle, precipitate urban sprawl [76]. Moreover, if urban expansion in developed countries is attributable to a car-based lifestyle [18], it is conceivable that in developing countries, urban poor residents will also contribute to urban expansion using motorcycles.
Motorcycles have emerged as a pivotal element in the economic and social mobility of the urban poor, facilitating their search for housing, migration, and economic activities. A study by Leitner et al. [79] in the outskirts of Jakarta demonstrated that when wealthy individuals engage in speculation, the poor also engage in similar financial activities. This phenomenon transpires when meticulously designed developmental initiatives and expansive infrastructure projects give rise to pervasive population displacement. As residents relocate to areas outside of the city center, affluent individuals utilize their financial resources to procure additional land and rental properties, thereby facilitating wealth accumulation. Concurrently, the economically disadvantaged population engages in speculation, leveraging the discrepancy in rental prices to secure more favorable housing conditions [79].
This speculation has been shown to result in market failures with regard to land and housing provision. As Brueckner [17] asserts, market failures result in the distortion of the rate of urban expansion and the disruption of land allocation between agricultural and urban uses. In the context of land use in Indonesia, there is a preponderance of vacant land and unoccupied dwellings, indicating a discrepancy between the supply and demand for urban land [80,81]. This phenomenon can be considered a market failure.
The inter-relationship among the various variables from the literature study is illustrated in Figure 1. A confluence of factors, including agricultural involution, job shortages, and rural poverty, has led to a migration of rural residents to urban areas. However, the presence of employment opportunities in the urban core is concomitant with elevated land and property costs. Consequently, the migration patterns of rural residents to the city center are impeded, with migration only reaching the urban outskirts. The migration of impoverished residents from the city center to suburban areas is a phenomenon that merits close examination. In addition to elevated land and property prices, economically disadvantaged residents migrate to suburban areas due to a combination of factors. These include the disparity between the geographical distribution of employment and residential areas; inadequate urban transportation infrastructure; the necessity of relocation due to unmet housing needs; the process of gentrification; and government subsidies.
Figure 1.
Conceptual framework of the potential relationship between poverty and urban sprawl.
The physical development of peri-urban areas in developing countries is ultimately derived from the concurrent migration of urban and rural residents. Indeed, suburban areas in developing countries are undergoing similar expansion, spurred on by government-backed initiatives promoting large-scale private industrial and residential development. Conversely, the residential development under scrutiny does not cater to the housing requirements of low-income residents. This phenomenon is exemplified by the dearth of social housing in the area.
In response to these challenges, low-income residents have been compelled to adopt proactive measures to address their housing needs. These efforts encounter impediments due to the inadequate implementation of stringent regulations in developing countries. This deficit enables low-income residents to circumvent the system and meet their needs. For instance, the inadequate road networks and public transportation systems are being utilized by means of inexpensive motorcycles. This phenomenon enables them to access numerous locations, seek affordable land, and engage in speculation regarding housing. The absence of government planning to address this housing need has resulted in market failure, which has, in turn, led to urban sprawl. This phenomenon is characterized by various negative social, economic, and ecological impacts.
4. Materials and Methods
4.1. Study Area
The city of Jakarta is the largest economic center in Indonesia, a tropical island nation in Southeast Asia. The economic functions of Jakarta exhibit significant overlap with those of its neighboring cities, collectively referred to as Jabodetabek (an acronym for Jakarta, Bogor, Depok, Tangerang, and Bekasi). This overlap renders the Jabodetabek area, henceforth referred to as the Jakarta Metropolitan Area (JMA), the second-largest urban agglomeration worldwide [82].
The JMA, as delineated in Figure 2, encompasses eight regencies and cities that are part of three provinces: The administrative regions of Jakarta Province, situated in the central or northern part of the island; Banten Province, located in the western part; and West Java Province, which occupies the eastern and southern regions. The cities of Central Jakarta, West Jakarta, North Jakarta, South Jakarta, and East Jakarta are part of Jakarta Province. The municipalities of Tangerang City, South Tangerang City, and Tangerang Regency are all part of the Banten Province. Concurrently, the municipalities of Bogor City, Bogor Regency, Depok City, Bekasi City, and Bekasi Regency constitute part of West Java Province.
Figure 2.
The Jakarta Metropolitan Area.
All cities within Jakarta Province, delineated by light green polygons, are designated as the core areas of the JMA. Five additional cities, namely Tangerang City, South Tangerang City, Depok City, and Bekasi City (depicted as dark green polygons), are classified as inner (suburban) cities. The remaining areas within the regencies/cities are defined as outer suburban areas. The utilization of the term “city” signifies that the specified geographical area is regarded as urban or is under the administration of the municipal government. Conversely, the employment of the term “regency” denotes that the area remains classified as rural and is therefore under the governance of a rural government.
According to the 2020 Census, the population of the Jakarta Metropolitan Area is 31.24 million. This figure comprises the population of Jakarta Province, which totals 10.56 million, and the population of its suburbs, which totals 20.67 million. Moreover, the population growth rate in the suburbs of the Jakarta Metropolitan Area from 2010 to 2020 exhibited a higher rate of increase than that of the core metropolitan area (Jakarta Province). From 2010 to 2020, the population growth rate of Jakarta Province was 0.95%, while the population growth rate in its suburbs averaged 1.57% [83].
The research flow is illustrated in Figure 3. An explanation of this research flow is in the next section.
Figure 3.
Research flowchart.
4.2. The Identification of Urban Sprawl
The identification of urban sprawl in this study was carried out in stages through three methods: (1) visual identification of urban physical development throughout the Jakarta metropolitan area; (2) measurement of spatial metrics of land use in suburban areas; (3) comparison of the rate of change in built-up land and the rate of population growth in the Jakarta metropolitan area. The initial two steps were executed at the district/city analysis unit, while the third step was conducted at the sub-district analysis unit. The study entailed the conduction of measurements extending down to the sub-district analysis unit, with the objectives of obtaining a comprehensive depiction of the population and identifying pertinent survey locations.
Visual identification is undertaken as an initial step because urban sprawl is an expression of deviation from compact urban development. Spatially, urban sprawl occurs when physical urban development exceeds the boundaries of city planning or administration [3,84,85]. While this step is relatively straightforward, it can identify the physical overflow of urban areas in general.
The employment of spatial metrics is instrumental in determining the physical characteristics of urban areas that are formed, as well as accentuating the occurrence of urban sprawl, given that not all forms of urban physical development are indicative of urban sprawl. The spatial metrics selected in this study (Table 2) are Patch Density (PD), Percentage of Like-Adjacency (PLADJ), and Shannon’s diversity index (SHDI) is also known as the Shannon-Wiener Index.
Table 2.
The Spatial metrics used to identify urban sprawl typologies.
Patch density is measured using PD, with higher PD values indicating a greater number of patches per unit area. They also indicate greater landscape fragmentation [87]. Concurrently, the PALDJ principle stipulates that the value of a patch is subject to diminution when it is encircled by patches of differing varieties. Pham et al. [88] posit that a low percentage of PLADJ corresponds to a high level of fragmentation. Concurrently, Shannon’s diversity index (SHDI) is a quantitative metric that calculates the diversity index of patch types within the study area. Li et al. [87] posit that an SHDI value of 0 indicates a single patch, thereby suggesting a lack of diversity (i.e., compact) and an increase with increasing land use types.
In the third stage of the study, a comparison was made between the population growth rate and the growth rate of built-up land. This phenomenon can be conceptualized as urban sprawl, which is defined as the rate of change in built-up land that exceeds the population growth rate [84,89]. This concept is relatively simple, straightforward, and understandable, yet important, as long as it is appropriately scaled and contextualized.
The determination of the growth rate of built-up land and the population rate is achieved through the utilization of the following formula [90,91]:
where Pt = total built-up area or population in a region in the last year; Po = total built-up area or population in a region in the base year; r = growth rate of built-up area or population; t = time span; e = exponential value (2.718281828).
Once the growth rate of built-up land and population is known, the sprawl index is formulated as follows:
The sprawl index value of a measured area is indicative of the extent of spatial expansion. An index value less than 1 indicates that the area is not experiencing significant spatial expansion. Conversely, if the index value exceeds 1, the area is exhibiting characteristics of sprawl. According to Andari et al. [90], an elevated index value is indicative of a more pronounced degree of urban sprawl within the specified area.
The data utilized in this study were Landsat images obtained from the United States Geological Survey (USGS) website collected in 2010 and 2020, with administrative boundaries from the Geospatial Information Agency, Indonesia (BIG). The data regarding population size was obtained from the Central Bureau of Statistics (BPS) and is derived from the 2010 and 2020 censuses. The application tools utilized in this study were ArcGIS 10.8, employed for the processing of satellite imagery, and Fragstats version 4.2, which was used to measure spatial metrics. Built-up land in this study is classified from Landsat imagery (30 m resolution) with 40 training polygon sets that reflect built-up land, such as residential land, transportation infrastructure (asphalt/concrete roads, airport runways), commercial and industrial buildings (office buildings, shopping centers, factories, and warehouses), public facilities (schools, hospitals, places of worship, stadiums), and other paved areas (parking lots, sports fields/open spaces that are paved).
4.3. The Identification of Poverty
The preliminary stage of the research entailed the identification of poverty at the regency/city level. This was accomplished by utilizing data on the percentage of impoverished individuals, as reported by the Central Bureau of Statistics (Indonesia), otherwise known as BPS-Statistics Indonesia. According to BPS-Statistics Indonesia, individuals with low incomes are defined as those whose average per capita expenditure is below the poverty line. The Poverty Line comprises two components: the Food Poverty Line (FPL or GKM) and the Non-Food Poverty Line (NPL). The Food Poverty Line (FPL) is defined as the minimum expenditure for food needs, equivalent to 2100 kilocalories per capita per day. Concurrently, the Non-Food Poverty Line (NPL) delineates the minimum requirements for housing, clothing, education, and health.
At present, BPS-Statistics Indonesia publications encompass solely the regency/city level. The present study employed the 2010 online poverty map, published by SMERU, to disaggregate the analysis into smaller units (i.e., sub-districts). The map employs the Small Area Estimation (SAE) method, as pioneered by Elbers, Lanjouw, and Lanjouw [92]. The estimation process employs a combination of Population Census, Village Potential (PODES), and National Economic Survey (SUSENAS) data. The 2010 poverty map was selected on the premise that it reflects the initial conditions prior to urban sprawl development in 2020.
4.4. The Identification of the Role of Low-Income Populations in Urban Sprawl
The Structural Equation Model (SEM) is the methodological framework employed in this study to ascertain the impact of poverty and urban sprawl. SEM is a multivariate analysis technique that combines regression and factor analysis [93]. It examines a set of relationships between one or more exogenous variables and one or more endogenous variables [94].
The present study utilized the SmartPLS 4 software tool [95], which is based on Partial Least Squares (PLS-SEM). The present study elected to utilize PLS-SEM as a methodological framework, a decision that was made in light of the approach’s demonstrated capacity to produce reliable models without the necessity of extensive requirements [94]. In addition, PLS-SEM is more appropriate for exploratory studies [93,96]. This phenomenon is pertinent to the concept of urban sprawl, which employs diverse theoretical frameworks to comprehend its nature, as previously delineated in the introductory section of this study.
The data used to determine the influence of poverty and urban sprawl in this study were collected through a survey of the residents of Tangerang Regency, Banten Province, a suburb of the Jakarta Metropolitan Area. The selection of the Tangerang Regency as a case study was predicated on the presence of two salient features: a high urban sprawl index and a high poverty rate. A survey was conducted, and questionnaires were disseminated to respondents who represented households residing in sub-districts that had been identified as experiencing urban sprawl. Subsequently, the respondents were filtered by income class to obtain the low-income category.
The questionnaire was divided into three sections: the first section included respondent profiles; the second section inquired about the causes of urban sprawl; and the third section focused on the impacts of urban sprawl. The initial section of the study employed a multiple-item questionnaire, while the subsequent sections utilized a Likert scale. The variables from the conceptual framework (Figure 1) were reduced to 94 indicators, which were subsequently packaged into questionnaires for respondents. A list of questionnaires for respondents is attached to this paper.
The sampling method was executed in a random manner within the sub-districts that were experiencing urban sprawl (i.e., cluster random sampling). The processed sample consisted of 195 respondents, who were selected to represent the low-income population in the outskirts of Metropolitan Jakarta. It is anticipated that the confidence level will be 95%, with a margin of error set at 5%. The survey was conducted over a period of three months, from January to March of 2024.
In addition to survey data, this study also utilized data published by the Ministry of Agrarian Affairs and Spatial Planning. This data set encompasses not only the financial evaluations of land but also the spatial planning suitability of each area. To corroborate the survey’s findings and offer supplementary explanations and interpretations, field observations were conducted.
5. Results
5.1. Urban Sprawl in the Jakarta Metropolitan Area
In 2010, the built-up land of the Jakarta Metropolitan Area (JMA) had already extended beyond the administrative boundaries of Jakarta Province, which is delineated as the core metropolitan area (indicated by the light green line in Figure 4). The core area appears to be saturated with built-up land. However, the pattern of built-up land in the JMA in 2010 still relatively closely follows the pattern of highways. The phenomenon of built-up land, defined as urban expansion beyond designated urban boundaries, is particularly evident along specific corridors within the Greater Jakarta area. These corridors, which extend from Jakarta to Bogor City and Jakarta to Bekasi, exhibit a concentration of built-up land.
Figure 4.
Land use changes in the Jakarta Metropolitan Area (JMA) 2010–2020. Source: Landsat image processing results.
Figure 4 demonstrates that in 2020, built-up land was identified as increasingly dense in areas directly bordering Jakarta Province. The regions delineated by dark green lines represent administrative units designated as urban areas, including Tangerang City, South Tangerang City, Depok City, and Bekasi City. However, the expansion of built-up land continues to extend beyond a 40 km radius, encroaching upon areas that are formally designated as rural regions, as evidenced in the administrative divisions of Tangerang Regency, Bogor Regency, and Bekasi Regency. The presence of urban sprawl, defined as the expansion of urban areas beyond the designated boundaries of city planning or administrative limits [3,84], has been clearly identified in the Jakarta Metropolitan Area. This phenomenon occurs when urban physical development exceeds the boundaries of city planning or administration.
Given the saturation of built-up land development in the metropolitan core of Jakarta Province, further identification of built-up land patterns using spatial metrics was conducted in the periphery of the JMA in 2010. The identification results (Table 3) corroborated the visual identification results. The built-up areas in the inner periphery are undergoing an increase in density, while those in the outer periphery are becoming more expansive and fragmented.
Table 3.
Spatial metrics of built-up land in the JMA suburbs 2010–2020. The color on the arrow is needed to mark areas that have indicators of experiencing urban expansion in the spatial con-text of the metrics in that column.
As indicated by the findings presented in Table 3, the Tangerang Regency emerged as the leading jurisdiction in terms of PD score in 2020. A comparison of the present study with the 2010 data reveals an increase in the number of patches per spatial unit in Tangerang and Bogor Regencies. This finding suggests an escalation in landscape fragmentation in these two regions. Concurrently, other regions demonstrated a decline in PD values, suggesting densification or infill development. Conversely, PLADJ values exhibited a decrease in Tangerang and Bogor Regencies. Notably, despite the substantial decline observed in Bogor Regency, Tangerang Regency demonstrated the lowest PLADJ value. Pham et al. [88] posit that this low PLADJ value is indicative of a high level of fragmentation.
Land fragmentation in the Tangerang Regency was accompanied by a diversity of patch types, as indicated by the highest SHDI value in 2020, which increased compared to 2010. Concurrently, the municipality of Bogor Regency experienced a notable surge in SHDI values. This increase signifies an augmentation in the diversity of land use patterns within the specified region [87]. However, it is noteworthy that Bogor Regency’s SHDI in 2020 remained lower compared to those of Tangerang and Bekasi Regencies. The elevated SHDI values in the regions of Tangerang and Bekasi suggest a greater variety of patch types when compared to the area of Bogor. This phenomenon can be attributed to the concurrent expansion of both residential and industrial areas within these two regencies, as evidenced by Hudalah et al. [34] and Hudalah & Firman [97].
The subsequent step involves the identification of urban sprawl through the comparison of the rate of land use change with that of population growth, as measured by spatial metrics. As illustrated in Figure 5, within the regency/city unit, the growth rate of built-up land surpasses the population growth rate. A preliminary analysis indicates that the Tangerang Regency exhibits the most significant rate of land use change among the Jakarta Metropolitan Area. Concurrently, Bogor Regency and South Tangerang City exhibit nearly equivalent rates of built-up land growth.
Figure 5.
Rate of built-up area and population growth in JMA peripheral areas. Source: Data processing results.
Figure 5 demonstrates that although Bogor Regency experienced a high rate of land growth, its population growth was the highest compared to other regencies/cities. However, a divergent scenario unfolded in Tangerang Regency and South Tangerang City. These two regions demonstrated high rates of built-up area growth; however, their population growth rates were lower than the average for the JMA suburbs. The urban sprawl index, developed with the intention of comparing built-up area growth rates and population growth rates, is presented in Table 4.
Table 4.
Sprawl index based on the comparison of built-up land and population growth rates in the JMA suburban areas 2010–2020.
As illustrated in Table 4, South Tangerang City has the highest urban sprawl index, followed by Tangerang Regency and Tangerang City. According to the data presented in the table, there was a discernible trend in urban physical development from 2010 to 2020, with a notable increase observed in the western part of the JMA (Banten Province). However, this macro-level overview within the regency/city unit does not provide a detailed description of the locations experiencing urban sprawl for further in-depth study. Consequently, this study delineates urban sprawl at a more granular level of analysis, specifically the sub-district, as illustrated in Figure 6.
Figure 6.
Urban Sprawl Index of the Jakarta Metropolitan Area 2010–2020 based on the rate of built-up land. Source: Data processing results.
As illustrated in Figure 6, the western periphery of the JMA exhibits a higher prevalence of sub-districts with elevated urban sprawl indices (index values exceeding 5). While the scale is reduced in this instance, the outcome aligns with the findings presented in Table 4. These findings indicate that western regions exhibit a higher index compared to eastern and southern regions. The western regions of the JMA, encompassing West Java and Banten Provinces, have exhibited a trend of accelerated urban physical development accompanied by a decline in population growth rates.
The final identification results, which were obtained using various criteria and measurement methods, indicate that the Tangerang Regency has the highest urban sprawl index. Despite ranking second in the comparison category of built-up land and population, the fragmentation and diversity of built-up land types in Tangerang Regency are the highest compared to other regencies/cities. Furthermore, Ewing [85] posits that the most common basic pattern for identifying urban sprawl is scattered or fragmented development. This condition is distinct from South Tangerang City, which, despite its comparatively larger land area, exhibits a higher degree of density.
5.2. Poverty in the Jakarta Metropolitan Area
A comparison of the central and peripheral regions reveals that the percentage of impoverished individuals in the JMA region exhibits variability. As illustrated in Table 5, certain peripheral regions exhibit lower poverty rates compared to their central counterparts, while other peripheral regions demonstrate higher rates of poverty. The municipalities of Depok City and South Tangerang City exhibit lower poverty rates, indicative of a phenomenon analogous to that observed in developed countries.
Table 5.
Percentage of poor people in JMA 2003–2022.
Despite having lower poverty rates, the municipalities of Depok and South Tangerang constitute a mere 16% of the population residing within the JMA suburbs. The aggregate poverty rate is higher in suburban areas than in metropolitan cores, as demonstrated in Figure 7. This finding aligns with prior studies that have documented the marginalization and suburbanization of impoverished populations in developing countries [10,12].
Figure 7.
Percentage of Poverty in Central and Suburban Areas in JMA from 2003 to 2022. Source: BPS—Statistics Indonesia.
BPS—Statistics Indonesia establishes distinct poverty lines for each district or city, considering the heterogeneity in regional prices of basic necessities. For instance, in 2023, the poverty line in South Jakarta was IDR 891,580 (equivalent to USD 59.43) per capita per month. In the same year, the population of Tangerang City was IDR 746,468 (USD 49.76), and the population of Tangerang Regency was IDR 604,362 (USD 40.29). A notable finding of the study was the observation that the poverty line exhibited a downward trend as one moved farther from the center of Jakarta. However, the prevalence of urban poverty is persistently higher in the peripheral regions of the JMA.
Within the context of districts and cities, comparisons are instrumental in the delineation of smaller units of analysis, thereby facilitating more profound examination. This study maps the results of calculations conducted by the SMERU Research Institute using the poverty line and the SAE (Small Area Estimation) method, with the sub-district serving as the unit of analysis. The data utilized in the aforementioned calculations were derived from the 2010 Population Census, the 2010 National Socio-Economic Survey, and the 2011 Village Potential Survey [98]. The distribution of poverty percentages is mapped in Figure 8.
Figure 8.
Distribution of the Percentage of the Poor Population in the Jakarta Metropolitan Area. Source: SMERU with some processing and adjustments [98].
As illustrated in Figure 8, a positive is evident between the poverty rate and distance from the city center, with higher rates of poverty observed in more remote regions. SMERU’s calculations, which are disaggregated to smaller units (i.e., sub-districts), also demonstrate that certain sub-districts within districts/cities characterized by lower average poverty rates exhibit higher poverty rates. Furthermore, a positive association has been observed between proximity to major thoroughfares and reduced poverty levels.
The Jakarta Metropolitan Area, as depicted in Figure 8, also demonstrates a concentration of poverty in the northwest. The area in question constitutes a sub-district within the administrative domain of the Tangerang Regency, as delineated by the red circle in the provided map. A juxtaposition of the urban sprawl index map in Figure 6 with the areas exhibiting the highest poverty rates reveals an overlap with the regions characterized by elevated urban sprawl indices. Consequently, the regency of Tangerang exhibits both elevated levels of urban sprawl and a pervasive prevalence of economic disadvantage.
5.3. Relationship Between Poverty and Urban Sprawl
To gain perspectives on urban sprawl from low-income residents, respondents to this study were selected based on income criteria of less than USD 2.15 (IDR 34,000) per day per capita. The survey design focused on collecting household-level data. The study found that male respondents constituted 84.10% of the sample. Public transportation use accounted for only 2.56% of all trips and served as an important indicator of the impact of a private vehicle-centric lifestyle. In this study’s context, motorcycle use was prevalent, accounting for 86.15% of all reported incidents.
Most respondents (65.64%) lived in their own homes; a total of 26.67% lived in family-owned homes, and 6.67% lived in rented homes. The remaining 1.03% lived in homes owned by companies or the government. Of respondents, 14.36% live in houses with a floor area of less than 36 m2, 27.18% live in houses with a floor area between 36 and 47 m2, 37.44% live in houses with a floor area between 48 and 60 m2, and 21.03% live in houses with a floor area of more than 60 m2.
Subsequent to a series of measurement iterations, the most appropriate model is illustrated in Figure 9. The factor loading values employed for the validation of each indicator were set to exceed 0.6, as illustrated in the figure. Reliability was gauged employing the Compost-site Reliability (CR) metric, with values exceeding 0.6 being attained for each variable. The model fit test was conducted using the Standardized Root Mean Square Residual (SRMR) metric, which yielded values of 0.079 (saturated) and 0.097 (estimated). Some sources say that an SRMR of less than 0.10 is acceptable [99,100]. In addition, a value of less than 0.08 is usually considered a good fit in CB-SEM, but this threshold is likely too low for PLS-SEM [99]. Consequently, the findings suggest that the proposed model demonstrates an acceptable level of fit, thereby substantiating its appropriateness for the data.
Figure 9.
Relationship between various causes of suburban migration and its impacts. Note: BAF, PRF, RPS, HT, and others are abbreviations of question codes in the Indonesian language that indicate each variable.
The regression coefficients, which illustrate the relationship between variables, are presented in Table 6. A result is deemed to be statistically significant if the p-value is less than 0.05, and the result is deemed to be statistically insignificant if the p-value is greater than 0.05, with a margin of error set at 5%. It has been demonstrated that a considerable proportion of the models developed exhibit a highly significant relationship, while the remainder demonstrate negligible significance.
Table 6.
Regression coefficient of the relationship between variables causing migration of low-income communities to suburban areas.
The prevalence of motorcycle use (motorization), various forms of government subsidies (including tax breaks, housing subsidies, and licensing concessions), and land prices have a significant and positive impact on migration to suburban areas. Conversely, speculation, relocation, the presence of transportation infrastructure, and rural migration have been demonstrated to exert minimal influence on low-income migration to suburban areas.
The phenomenon of unproductive suburbanization, which is indicative of urban sprawl, is characterized by a significant relationship between migration to suburban areas and the various negative impacts that result. As demonstrated in Table 6, a substantial effect has been identified between the migration of populations to suburban regions and a number of deleterious ecological consequences. These include, but are not limited to, increased public service expenditures, a paucity of fundamental amenities, and a conspicuous incongruity between the supply of available land and the demand for housing, a phenomenon that can be considered a market failure. Conversely, the satisfaction of fundamental lifestyle requirements, such as home ownership and automobile possession, does not appear to be a determining factor in the decision to migrate to suburban regions. The relationship between suburban migration and social segregation is not statistically significant.
6. Discussion
6.1. Poverty Concentration and Urban Sprawl Patterns in the Jakarta Metropolitan Area (JMA)
The identification results show that economically disadvantaged individuals are predominantly concentrated in suburban areas, a phenomenon that stands in contrast to the patterns observed in developed countries. In developed countries, such as the United States, studies have shown that poverty is concentrated in urban centers [39,40]. In contrast, within the context of developing countries, particularly within the Jakarta metropolitan area, there is a notable concentration of poverty in suburban regions. Despite the utilization of disparate poverty lines and higher cost standards in the city center relative to those in the suburbs, poverty remains concentrated in suburban areas of the Jakarta Metropolitan Area (JMA). This research is consistent with the findings of the study by Janssen et al. [12], which indicated that Jakarta residents’ incomes tend to decrease with increasing distance from the Central Business District (CBD). The phenomenon of declining incomes concomitant with a lower cost of living should not result in the prevalence of poverty within suburban regions. However, the cost of living in suburban areas continues to be high, which further reduces the purchasing power of individuals residing in these areas. This finding aligns with research indicating that residing in suburban areas can result in a higher cost of living compared to urban centers [14].
The association between urban sprawl and poverty concentration in the JMA region indicates that urban sprawl may be driven by factors beyond mere wealth. Despite the presence of slight variations in the geographical characteristics of these regions, such as increased building and population densities in developing countries compared to developed countries [6,89], other indicators of urban sprawl persist. Urban physical development that extends beyond city administrative boundaries and exceeds population growth occurs in the JMA. Concurrently, an augmentation in the variety of land use and an escalation in landscape fragmentation have been observed in suburban regions.
6.2. The Role of the Urban Poor in Shaping Urban Sprawl
The results of the SEM analysis demonstrate that the prevalence of motorcycle utilization exerts a significant influence on the phenomenon of suburban migration. This finding serves to substantiate the notion that urban expansion, characterized by a preponderance of automobiles or private vehicles, serves as a consequence of a particular lifestyle [18]. The predominant use of motorcycles indicates that the development of transportation infrastructure, such as toll roads, does not exhibit a significant effect with the migration to suburban areas. Nonetheless, government subsidies related to housing development (e.g., subsidized housing and streamlined permitting processes) have been found to be associated with the migration of the urban poor. As asserted by Nechyba and Walsh [19], policies that directly facilitate the rise in cars or cars themselves can also contribute to urban sprawl. However, it should be noted that subsidies for housing development can also be a significant contributing factor.
The fact that relocation has no significant effect on migration to the suburbs indicates that the urban poor are making unforced efforts to migrate. However, these efforts are also driven by external factors, such as high land prices in urban centers. The urban poor want to speculate on obtaining better housing and land, as reported by Leitner et al. [79], but these efforts are not accompanied by ownership of resources. Thus, this speculation variable does not significantly affect the migration of low-income communities to suburban areas.
The absence of an observed impact on migration from rural areas stands in contrast to the assertions put forth by Bueno-Suárez & Coq-Huelva [26], who proposed that urban expansion is driven by economic hardship, manifesting in the form of rural–urban migration. In reality, the phenomenon of migration from rural areas has no significant impact on urban growth in the JMA from the perspective of the urban poor. This finding lends support to a World Bank report that asserts migration from rural areas plays a less significant role in driving urbanization in urban areas compared to China and India [70]. The expansion of growth areas in Indonesia is predominantly influenced by natural population growth within these regions and the reclassification of rural areas as urban zones. This finding is consistent with the research conducted by Firman [54], which indicates that the rise in the urban population of Indonesia, particularly in Java, has occurred in situ, indicating that it has not been accompanied by migration.
The insignificant effect of migration to the suburbs on social segregation indicates that social segregation in suburban areas is not felt by the urban poor. This phenomenon is particularly intriguing from a scholarly perspective, as it deviates from patterns observed in developed countries and contrasts with the actual conditions in the Jakarta metropolitan area. It is plausible that these individuals brought the vibrant atmosphere characteristic of their previous communities to the rural environment, thereby infusing it with a sense of dynamism despite the area’s transformation into an urban space [79].
The findings on the role of the urban poor in driving urban sprawl reinforce the notion that grand narratives are inadequate for understanding the formation of urban landscapes. Urban sprawl is not exclusively linked to the accumulation of wealth in suburban areas, as has been traditionally understood. Additionally, postmodernist ideas that disregard the regularities that shape urban landscapes are also inadequate. This phenomenon is clearly illustrated by the relationship between various variables that drive the urban poor to live in the suburbs. Metamodern geography, which oscillates between structured analysis and reflective engagement [101], is a relevant lens for understanding this phenomenon.
6.3. Limitations of the Study
The findings of this study do not comprehensively delineate and substantiate all the variables obtained in the conceptual framework developed at the inception of this paper. The endeavor to attain a comprehensive description is impeded not solely by the accessibility of data but also by the caliber of the obtained data. It was necessary to remove several indicators from the SEM test because they did not meet the required outer loadings, as indicated by the results of the survey. Another limitation of this study is the relatively small survey sample size, which hinders the ability to adequately represent the broader JMA population.
Moreover, employing PLS-SEM in this study suggests that the research is exploratory and predictive in developing new theories about urban sprawl, particularly in developing countries where the existing literature is scarce. Using PLS-SEM involves less stringent assumptions than using a covariance-based SEM (CB-SEM). In this context, further research is urgently needed to improve our understanding of urban sprawl in developing countries.
Further research is necessary to explore the motivations of the urban poor residing in suburban areas in greater depth and with a qualitative approach. The utilization of survey-based inquiries can impose constraints on the extent to which respondents are willing to disclose information. Research endeavors aimed at elucidating the underlying motivations for the decision to reside in suburban areas could serve as a foundation for the mitigation of the deleterious effects of urban sprawl.
7. Conclusions
This research has shown an overlap between urban sprawl and poverty concentration in the periphery of the Jakarta Metropolitan Area (JMA). This overlap shows a different pattern compared to developed countries, where poverty is concentrated in the city center.
The widespread use of motorized vehicles, coupled with government subsidies, underscores the government’s limited capacity for integrated planning and policy formulation. Economically disadvantaged residents living in urban areas, who are vulnerable to economic vulnerability, have the potential to contribute to urban sprawl when faced with a lack of strong planning institutions. This reinforces previous research on low planning capacity in developing countries.
The urban poor, with their motorized vehicles, have driven urban sprawl by taking advantage of government subsidies and seeking affordable land in the suburbs. However, these communities often face challenges such as rising public service costs, a lack of basic facilities, and the negative impacts of habitat destruction. In the long term, these conditions will become geographic determinants that make it difficult for poor individuals to climb the economic ladder and achieve a better life.
Author Contributions
Conceptualization, A.N. and D.H.; methodology, A.N. and D.H.; software, A.N.; validation, D.H., D.Z. and N.W.; formal analysis, A.N.; investigation, A.N.; resources, A.N.; data curation, A.N.; writing—original draft preparation, A.N.; writing—review and editing, D.H., D.Z. and N.W.; visualization, A.N.; supervision, D.H., D.Z. and N.W. All authors have read and agreed to the published version of the manuscript.
Funding
This research is partially funded by Kemdiktisaintek and ITB.
Institutional Review Board Statement
Ethical review and approval were waived for this study due to this research does not involve more than minimal risk to potential participants and does not involve sensitive topics.
Informed Consent Statement
Informed consent was obtained from all subjects involved in the study.
Data Availability Statement
The data presented in this study are available on request from the corresponding author due to participant data containing potentially identifying information.
Acknowledgments
During the preparation of this manuscript, the authors used DeepL Write Free to edit and improve its readability. The authors have reviewed and edited the output and take full responsibility for the content of this publication.
Conflicts of Interest
The authors declare no conflicts of interest.
Abbreviations
The following abbreviations are used in this manuscript:
| JMA | the Jakarta Metropolitan Area |
| BPS | Badan Pusat Statistik, Central Bureau of Statistics Indonesia |
| SMERU | The Social Monitoring and Early Response Unit is an independent institution that conducts research and studies public policy |
References
- UNDESA. World Urbanization Prospects: The 2018 Revision (ST/ESA/SER.A/420); United Nations, Department of Economic and Social Affairs, Population Division: New York, NY, USA, 2019; ISBN 9789211483192. [Google Scholar]
- Myers, G. Urbanisation in the Global South BT. In Urban Ecology in the Global South; Shackleton, C.M., Cilliers, S.S., Davoren, E., du Toit, M.J., Eds.; Springer International Publishing: Cham, Switzerland, 2021; pp. 27–49. ISBN 978-3-030-67650-6. [Google Scholar]
- Sudhira, H.S.; Ramachandra, T.V.; Bala Subrahmanya, M.H. Integrated Spatial Planning Support Systems for Managing Urban Sprawl. In Proceedings of the 10th International Conference on Computers in Urban Planning and Urban Management, (CUPUM 2007), Iguassu Falls, Brasil, 11–13 July 2007; Utrecht University: Utrecht, The Netherlands, 2007; pp. 1–14. [Google Scholar]
- Estoque, R.C.; Ooba, M.; Togawa, T.; Hijioka, Y.; Murayama, Y. Monitoring Global Land-Use Efficiency in the Context of the UN 2030 Agenda for Sustainable Development. Habitat Int. 2021, 115, 102403. [Google Scholar] [CrossRef] [Scilit]
- Schiavina, M.; Melchiorri, M.; Freire, S.; Florio, P.; Ehrlich, D.; Tommasi, P.; Pesaresi, M.; Kemper, T. Land Use Efficiency of Functional Urban Areas: Global Pattern and Evolution of Development Trajectories. Habitat Int. 2022, 123, 102543. [Google Scholar] [CrossRef] [Scilit]
- Adaku, E. Urban Sprawl: A View from Developing and Developed Countries. Afr. J. Geogr. Reg. Plan. 2014, 1, 193–207. [Google Scholar]
- Bhatta, B. Urban Growth and Sprawl. In Analysis of Urban Growth and Sprawl from Remote Sensing Data; Springer: Berlin/Heidelberg, Germany, 2010; pp. 1–16. [Google Scholar] [CrossRef] [Scilit]
- Wei, Y.D.; Ewing, R. Urban Expansion, Sprawl and Inequality. Landsc. Urban Plan. 2018, 177, 259–265. [Google Scholar] [CrossRef] [Scilit]
- Selod, H.; Shilpi, F. Rural-Urban Migration in Developing Countries: Lessons from the Literature. Reg. Sci. Urban Econ. 2021, 91, 103713. [Google Scholar] [CrossRef] [Scilit]
- Zhao, P. The Impact of Urban Sprawl on Social Segregation in b Eijing and a Limited Role for Spatial Planning. Tijdschr. Econ. Soc. Geogr. 2013, 104, 571–587. [Google Scholar] [CrossRef] [Scilit]
- Clapson, M.; Hutchison, R. Introduction: Suburbanization in Global Society. In Suburbanization in Global Society; Clapson, M., Hutchison, R., Eds.; Research in Urban Sociology; Emerald Group Publishing Limited: Leeds, UK, 2010; Volume 10, pp. 1–14. ISBN 978-0-85724-348-5, 978-0-85724-347-8. [Google Scholar]
- Janssen, K.M.J.; Mulder, P.; Yudhistira, M.H. Spatial Sorting of Rich Versus Poor People in Jakarta; Taylor & Francis: Abingdon, UK, 2021; ISBN 0002957892. [Google Scholar]
- Zhou, J.; Chi-Man Hui, E. Housing Prices, Migration, and Self-Selection of Migrants in China. Habitat Int. 2022, 119, 102479. [Google Scholar] [CrossRef] [Scilit]
- Anderson, M.W. Cities Inside Out: Race, Poverty, and Exclusion at The Urban Fringe. UCLA Law Rev. 2008, 55, 1095–1160. [Google Scholar] [CrossRef] [Scilit]
- Coq-Huelva, D.; Asián-Chaves, R. Urban Sprawl and Sustainable Urban Policies. A Review of the Cases of Lima, Mexico City and Santiago de Chile [Expansión Urbana y Políticas Urbanas Sostenibles. Una Revisión de Los Casos de Lima, Ciudad de México y Santiago de Chile]. Sustainability 2019, 11, 5835. [Google Scholar] [CrossRef] [Scilit]
- Xiong, N.; Wei, Y.D.; Rey, S.J. Urban Sprawl and Racial Inequality in Intergenerational Mobility. J. Econ. Geogr. 2024, 24, 309–332. [Google Scholar] [CrossRef] [Scilit]
- Brueckner, J. Urban Sprawl: Diagnosis and Remedies. Int. Reg. Sci. Rev. 2000, 23, 160–171. [Google Scholar] [CrossRef] [Scilit]
- Glaeser, E.L.; Kahn, M.E. Sprawl and Urban Growth, Discussion Paper No 2004. Handb. Urban Reg. Econ. 2003, 4, 2481–2527. [Google Scholar]
- Nechyba, T.J.; Walsh, R.P. Urban Sprawl. J. Econ. Perspect. 2004, 18, 177–200. [Google Scholar] [CrossRef] [Scilit]
- Pirotte, A.; Madre, J.L. Determinants of Urban Sprawl in France. Urban Stud. 2011, 48, 2865–2886. [Google Scholar] [CrossRef] [Scilit]
- Cervero, R. Linking Urban Transport and Land Use in Developing Countries. J. Transp. Land Use 2013, 6, 7–24. [Google Scholar] [CrossRef] [Scilit]
- Cobbinah, P.B.; Erdiaw-Kwasie, M.O.; Amoateng, P. Africa’s Urbanisation: Implications for Sustainable Development. Cities 2015, 47, 62–72. [Google Scholar] [CrossRef] [Scilit]
- Suazo-Vecino, G.; Muñoz, J.C.; Arce, L.F. The Displacement of Santiago de Chile’s Downtown during 1990–2015: Travel Time Effects on Eradicated Population. Sustainability 2020, 12, 289. [Google Scholar] [CrossRef] [Scilit]
- Twumasi-Ankrah, K. Rural-Urban Migration and Socioeconomic Development in Ghana: Some Discussions. J. Soc. Dev. Afr. 1995, 10, 13–22. [Google Scholar]
- Downs, A. Some Realities about Sprawl and Urban Decline. Hous. Policy Debate 1999, 10, 955–974. [Google Scholar] [CrossRef] [Scilit]
- Bueno-Suárez, C.; Coq-Huelva, D. Sustaining What Is Unsustainable: A Review of Urban Sprawl and Urban Socio-Environmental Policies in North America and Western Europe. Sustainability 2020, 12, 4445. [Google Scholar] [CrossRef] [Scilit]
- Brueckner, J.; Fansler, D.A. The Economics of Urban Sprawl: Theory and Evidence on the Spatial Sizes of Cities. Rev. Econ. Stat. 1983, 65, 479–482. [Google Scholar] [CrossRef] [Scilit]
- Colsaet, A.; Laurans, Y.; Levrel, H. What Drives Land Take and Urban Land Expansion? A Systematic Review. Land Use Policy 2018, 79, 339–349. [Google Scholar] [CrossRef] [Scilit]
- Harvey, D. The Urban Process under Capitalism: A Framework for Analysis. Int. J. Urban Reg. Res. 1978, 2, 101–131. [Google Scholar] [CrossRef] [Scilit]
- Zenou, Y.; Song, Y. How Differences in Property Taxes within Cities Affect Urban Sprawl? Research Institute of Industrial Economics: Stockholm, Sweden, 2008. [Google Scholar]
- Batchis, W. Urban Sprawl and the Constitution: Educational Inequality as an Impetus to Low Density Living. Urban Lawyer 2010, 42, 95–133. [Google Scholar]
- Jargowsky, P.A.; Park, Y. Cause or Consequence? Suburbanization and Crime in US Metropolitan Areas. Crime Delinq. 2009, 55, 28–50. [Google Scholar] [CrossRef] [Scilit]
- Cohen, B. Urban Growth in Developing Countries: A Review of Current Trends and a Caution Regarding Existing Forecasts. World Dev. 2004, 32, 23–51. [Google Scholar] [CrossRef] [Scilit]
- Hudalah, D.; Viantari, D.; Firman, T.; Woltjer, J. Industrial Land Development and Manufacturing Deconcentration in Greater Jakarta. Urban Geogr. 2013, 34, 950–971. [Google Scholar] [CrossRef] [Scilit]
- Christiansen, P.; Loftsgarden, T. Drivers behind Urban Sprawl in Europe. TØI Rep. 2011, 1136, 2011. [Google Scholar]
- Franz, G.; Maier, G.; Schröck, P. Urban Sprawl How Useful Is This Concept? In Proceedings of the ERSA Conference Papers from European Regional Science Association; European Regional Science Association: Vienna, Austria, 2006; pp. 1–29. [Google Scholar]
- Cobbinah, P.B.; Amoako, C. Urban Sprawl and the Loss of Peri-Urban Land in Kumasi, Ghana. Int. J. Soc. Hum. Sci. 2012, 6, e397. [Google Scholar]
- Tóth, B.Z. Mixed-Use Developments in Phoenix and Tempe, Arizona. Folia Geogr. 2023, 65, 53–77. [Google Scholar]
- Jargowsky, P.A. Sprawl, Concentration of Poverty, and Urban Inequality. In Urban Sprawl: Causes, Consequences and Policy Responses; Urban Institute: Singapore, 2001; pp. 1–47. [Google Scholar]
- Powell, J. Race, Poverty, and Urban Sprawl: Access to Opportunities through Regional Strategies. Forum Soc. Econ. 1999, 28, 1–20. [Google Scholar] [CrossRef] [Scilit]
- Zenou, Y.; Boccard, N. Racial Discrimination and Redlining in Cities. J. Urban Econ. 2000, 48, 260–285. [Google Scholar] [CrossRef] [Scilit]
- Tiebout, C.M. A Pure Theory of Local Expenditures. J. Polit. Econ. 1956, 64, 416–424. [Google Scholar] [CrossRef] [Scilit]
- Ravallion, M. Urban Poverty. Financ. Dev. 2007, 44, 15–17. [Google Scholar]
- Xu, G.; Jiao, L.; Liu, J.; Shi, Z.; Zeng, C.; Liu, Y. Understanding Urban Expansion Combining Macro Patterns and Micro Dynamics in Three Southeast Asian Megacities. Sci. Total Environ. 2019, 660, 375–383. [Google Scholar] [CrossRef] [Scilit] [PubMed]
- Christiaensen, L.; Todo, Y. Poverty Reduction During the Rural-Urban Transformation: The Role of the Missing Middle. World Dev. 2014, 63, 43–58. [Google Scholar] [CrossRef] [Scilit]
- Ramachandran, H. Urbanisation: A Solution to Poverty? Soc. Change 2014, 44, 593–603. [Google Scholar] [CrossRef] [Scilit]
- Viviani, V.R.; Rocha, M.Y.; Hagen, O. Bioluminescent Beetles (Coleoptera: Elateroidea: Lampyridae, Phengodidae, Elateridae) in the Municipalities of Campinas, Sorocaba-Votorantim and Rio Claro-Limeira (SP, Brazil): Biodiversity and Influence of Urban Sprawl; Fauna de Besouros Bioluminescente. Biota Neotrop. 2010, 10, 103–116. [Google Scholar] [CrossRef] [Scilit]
- Cooke, T.J.; Denton, C. The Suburbanization of Poverty? An Alternative Perspective. Urban Geogr. 2015, 36, 300–313. [Google Scholar] [CrossRef] [Scilit]
- Hochstenbach, C.; Musterd, S. Gentrification and the Suburbanization of Poverty: Changing Urban Geographies through Boom and Bust Periods. Urban Geogr. 2018, 39, 26–53. [Google Scholar] [CrossRef] [Scilit]
- Kneebone, E.; Garr, E. The Suburbanization of Poverty; Brookings Inst.: Washington, DC, USA, 2010. [Google Scholar]
- Liddle, B. Urbanization and Inequality/Poverty. Urban Sci. 2017, 1, 35. [Google Scholar] [CrossRef] [Scilit]
- Ravallion, M. On the Urbanization of Poverty. J. Dev. Econ. 2002, 68, 435–442. [Google Scholar] [CrossRef] [Scilit]
- Farrell, K. The Rapid Urban Growth Triad: A New Conceptual Framework for Examining the Urban Transition in Developing Countries. Sustainability 2017, 9, 1407. [Google Scholar] [CrossRef] [Scilit]
- Firman, T. The Urbanisation of Java, 2000–2010: Towards ‘the Island of Mega-Urban Regions. Asian Popul. Stud. 2017, 13, 50–66. [Google Scholar] [CrossRef] [Scilit]
- Gross, J.; Ouyang, Y. Types of Urbanization and Economic Growth. Int. J. Urban Sci. 2021, 25, 71–85. [Google Scholar] [CrossRef] [Scilit]
- Jedwab, R.; Christiaensen, L.; Gindelsky, M. Rural Push, Urban Pull and… Urban Push? New Historical Evidence from Developing Countries; Institute for International Economic Policy: Washington, DC, USA, 2014. [Google Scholar]
- Harris, R. Meaningful Types in a World of Suburbs. In Suburbanization in Global Society; Clapson, M., Hutchison, R., Eds.; Research in Urban Sociology; Emerald Group Publishing Limited: Leeds, UK, 2010; Volume 10, pp. 15–47. ISBN 978-0-85724-348-5, 978-0-85724-347-8. [Google Scholar]
- Rérat, P.; Söderström, O.; Piguet, E. New Forms of Gentrification: Issues and Debates. Popul. Space Place 2010, 16, 335–343. [Google Scholar] [CrossRef] [Scilit]
- Kessides, C. The Urban Transition in Sub-Saharan Africa: Implications for Economic Growth and Poverty Reduction; Cities Alliance: Washington, DC, USA, 2006. [Google Scholar]
- Winarso, H.; Firman, T. Residential Land Development in Jabotabek, Indonesia: Triggering Economic Crisis? Habitat Int. 2002, 26, 487–506. [Google Scholar] [CrossRef] [Scilit]
- Jedwab, R.; Loungani, P.; Yezer, A. Comparing Cities in Developed and Developing Countries: Population, Land Area, Building Height and Crowding. Reg. Sci. Urban Econ. 2021, 86, 2021–2023. [Google Scholar] [CrossRef] [Scilit]
- Yip, N.M. Social Housing Landlords: Asia Pacific. In International Encyclopedia of Housing and Home; Smith, S.J., Elsinga, M., Eds.; Elsevier: San Diego, CA, USA, 2012; pp. 426–431. ISBN 978-0-08-047171-6. [Google Scholar]
- Tunas, D.; Peresthu, A. The Self-Help Housing in Indonesia: The Only Option for the Poor? Habitat Int. 2010, 34, 315–322. [Google Scholar] [CrossRef] [Scilit]
- Monkkonen, P. Urban Land-Use Regulations and Housing Markets in Developing Countries: Evidence from Indonesia on the Importance of Enforcement. Land Use Policy 2013, 34, 255–264. [Google Scholar] [CrossRef] [Scilit]
- Cobbinah, P.B.; Aboagye, H.N. A Ghanaian Twist to Urban Sprawl. Land Use Policy 2017, 61, 231–241. [Google Scholar] [CrossRef] [Scilit]
- Talen, E. Do-It-Yourself Urbanism: A History. J. Plan. Hist. 2015, 14, 135–148. [Google Scholar] [CrossRef] [Scilit]
- Polese, A. What Is Informality? (Mapping) “The Art of Bypassing the State” in Eurasian Spaces—And Beyond. Eurasian Geogr. Econ. 2023, 64, 322–364. [Google Scholar] [CrossRef] [Scilit]
- Geertz, C. The Interpretation of Cultures; Basic Books: New York, NY, USA, 1973; 470p. [Google Scholar]
- Scott, J.C. Weapons of the Weak: Everyday Forms of Peasant Resistance; Yale University Press: New Haven, CT, USA, 1985; ISBN 0300036418. [Google Scholar]
- World Bank. Indonesia Economic Quarterly: Urbanization for All; World Bank: Washington, DC, USA, 2018. [Google Scholar]
- Geertz, C. Agricultural Involution: The Processes of Ecological Change in Indonesia; University of California Press: Oakland, CA, USA, 1963; ISBN 0520004590. [Google Scholar]
- Guma, P.K.; Mwaura, M.; Njagi, E.W.; Akallah, J.A. Urban Way of Life as Survival: Navigating Everyday Life in a Pluriversal Global South. City 2023, 27, 275–293. [Google Scholar] [CrossRef] [Scilit]
- Roy, A. Why India Cannot Plan Its Cities: Informality, Insurgence and the Idiom of Urbanization. Plan. Theory 2009, 8, 76–87. [Google Scholar] [CrossRef] [Scilit]
- Cabrera, J.E.; Moyano, B.D.M. Paratransit and Urban Sprawl: Informal Transport as an Urbanization Device. urbe. Rev. Bras. Gestão Urbana 2022, 14, e20210408. [Google Scholar] [CrossRef] [Scilit]
- Klopp, J.M.; Cavoli, C. Mapping Minibuses in Maputo and Nairobi: Engaging Paratransit in Transportation Planning in African Cities. Transp. Rev. 2019, 39, 657–676. [Google Scholar] [CrossRef] [Scilit]
- Alshammari, T.O.; Hassan, A.M.; Arab, Y.; Hussein, H.; Khozaei, F.; Saeed, M.; Ahmed, B.; Zghaibeh, M.; Beitelmal, W.; Lee, H. The Compactness of Non-Compacted Urban Developments: A Critical Review on Sustainable Approaches to Automobility and Urban Sprawl. Sustainability 2022, 14, 11121. [Google Scholar] [CrossRef] [Scilit]
- Soehodho, S. Public Transportation Development and Traffic Accident Prevention in Indonesia. IATSS Res. 2017, 40, 76–80. [Google Scholar] [CrossRef] [Scilit]
- Firman, T.; Fahmi, F.Z. The Privatization of Metropolitan Jakarta’s (Jabodetabek) Urban Fringes: The Early Stages of “Post-Suburbanization” in Indonesia. J. Am. Plan. Assoc. 2017, 83, 68–79. [Google Scholar] [CrossRef] [Scilit]
- Leitner, H.; Nowak, S.; Sheppard, E. Everyday Speculation in the Remaking of Peri-Urban Livelihoods and Landscapes. Environ. Plan. A Econ. Space 2023, 55, 388–406. [Google Scholar] [CrossRef] [Scilit]
- Ardiwijaya, V.S.; Sumardi, T.P.; Suganda, E.; Temenggung, Y.A. Rejuvenating Idle Land to Sustainable Urban Form: Case Study of Bandung Metropolitan Area, Indonesia. Procedia Environ. Sci. 2015, 28, 176–184. [Google Scholar] [CrossRef] [Scilit]
- Adianto, J.; Gabe, R.T. Determinants of Vacant Subsidized House in Greater Metropolitan Jakarta Area, Indonesia. J. Hous. Built Environ. 2021, 36, 1813–1830. [Google Scholar] [CrossRef] [Scilit]
- Martinez, R.; Masron, I.N. Jakarta: A City of Cities. Cities 2020, 106, 102868. [Google Scholar] [CrossRef] [Scilit]
- Badan Pusat Statistik. Hasil Sensus Penduduk 2020; Badan Pusat Statistik: Central Jakarta, Indonesia, 2021; pp. 1–12. [Google Scholar]
- Dadashpoor, H.; Shahhoseini, G. Defining Urban Sprawl: A Systematic Review of 130 Definitions. Habitat Int. 2024, 146, 103039. [Google Scholar] [CrossRef] [Scilit]
- Ewing, R. Characteristics, Causes, and Effects of Sprawl: A Literature Review. In Urban Ecology: An International Perspective on the Interaction Between Humans and Naturel; Springer: Boston, MA, USA, 2008; Volume 21, pp. 519–535. [Google Scholar] [CrossRef] [Scilit]
- McGarigal, K.; Cushman, S.A.; Neel, M.C.; Ene, E. FRAGSTATS v4: Spatial Pattern Analysis Program for Categorical Maps. Available online: https://www.fragstats.org (accessed on 12 January 2024).
- Li, H.; Peng, J.; Yanxu, L.; Yi’na, H. Urbanization Impact on Landscape Patterns in Beijing City, China: A Spatial Heterogeneity Perspective. Ecol. Indic. 2017, 82, 50–60. [Google Scholar] [CrossRef] [Scilit]
- Pham, H.M.; Yamaguchi, Y.; Bui, T.Q. A Case Study on the Relation between City Planning and Urban Growth Using Remote Sensing and Spatial Metrics. Landsc. Urban Plan. 2011, 100, 223–230. [Google Scholar] [CrossRef] [Scilit]
- Bhatta, B.; Saraswati, S.; Bandyopadhyay, D. Urban Sprawl Measurement from Remote Sensing Data. Appl. Geogr. 2010, 30, 731–740. [Google Scholar] [CrossRef] [Scilit]
- Andari, M.T.; Pravitasari, A.E.; Anwar, S. Analisis Urban Sprawl Sebagai Rekomendasi Pengendalian Pemanfaatan Ruang Untuk Pengembangan Lahan Pertanian Di Kabupaten Karawang. J. Reg. Rural Dev. Plan. 2022, 6, 74–88. [Google Scholar] [CrossRef] [Scilit]
- Holobâcă, I.-H.; Benedek, J.; Ursu, C.-D.; Alexe, M.; Temerdek-Ivan, K. Ratio of Land Consumption Rate to Population Growth Rate in the Major Metropolitan Areas of Romania. Remote Sens. 2022, 14, 6016. [Google Scholar] [CrossRef] [Scilit]
- Elbers, C.; Lanjouw, J.O.; Lanjouw, P. Micro-Level Estimation of Poverty and Inequality. Econometrica 2003, 71, 355–364. [Google Scholar] [CrossRef] [Scilit]
- Garson, G.D. Partial Least Squares: Regression and Structural Equation Models; Statistical Associates Publishers: Asheboro, NC, USA, 2016. [Google Scholar]
- Muhson, A. Analisis Statistik Dengan SmartPLS: Path Analysis, Confirmatory Factor Analysis, & Structural Equation Modeling; Universitas Negeri Yogyakarta: Depok, Indonesia, 2022. [Google Scholar]
- Ringle, C.M.; Wende, S.; Becker, J.-M. SmartPLS 4; SmartPLS GmbH: Oststeinbek, Germany, 2022. [Google Scholar]
- Hair, J.F.; Risher, J.J.; Sarstedt, M.; Ringle, C.M. When to Use and How to Report the Results of PLS-SEM. Eur. Bus. Rev. 2019, 31, 2–24. [Google Scholar] [CrossRef] [Scilit]
- Hudalah, D.; Firman, T. Beyond Property: Industrial Estates and Post-Suburban Transformation in Jakarta Metropolitan Region. Cities 2012, 29, 40–48. [Google Scholar] [CrossRef] [Scilit]
- Smeru. Poverty and Livelihood Map of Indonesia 2010; Smeru: Jakarta, Indonesia, 2013. [Google Scholar]
- Hair, J.F.; Hult, G.T.M.; Ringle, C.M.; Sarstedt, M. A Primer on Partial Least Squares Structural Equation Modeling (PLS-SEM); Sage Publications: Thousand Oaks, CA, USA, 2017; ISBN 1452217440. [Google Scholar]
- Schermelleh-Engel, K.; Moosbrugger, H.; Müller, H. Evaluating the Fit of Structural Equation Models: Tests of Significance and Descriptive Goodness-of-Fit Measures. Methods Psychol. Res. Online 2003, 8, 23–74. [Google Scholar]
- Matlovič, R.; Matlovičová, K. The Metamodern Shift in Geographical Thought: Oscillatory Ontology and Epistemology, Post-Disciplinary and Post-Paradigmatic Perspectives. Folia Geogr. 2025, 67, 22. [Google Scholar]
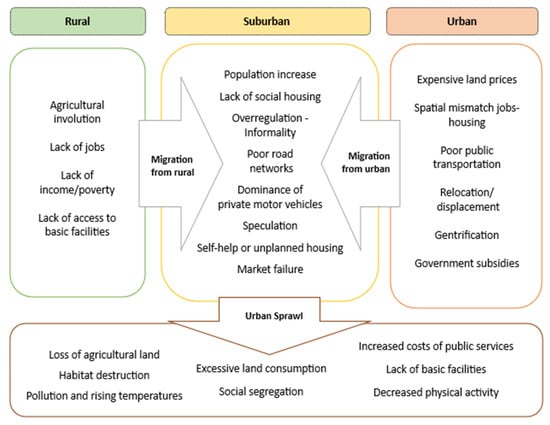
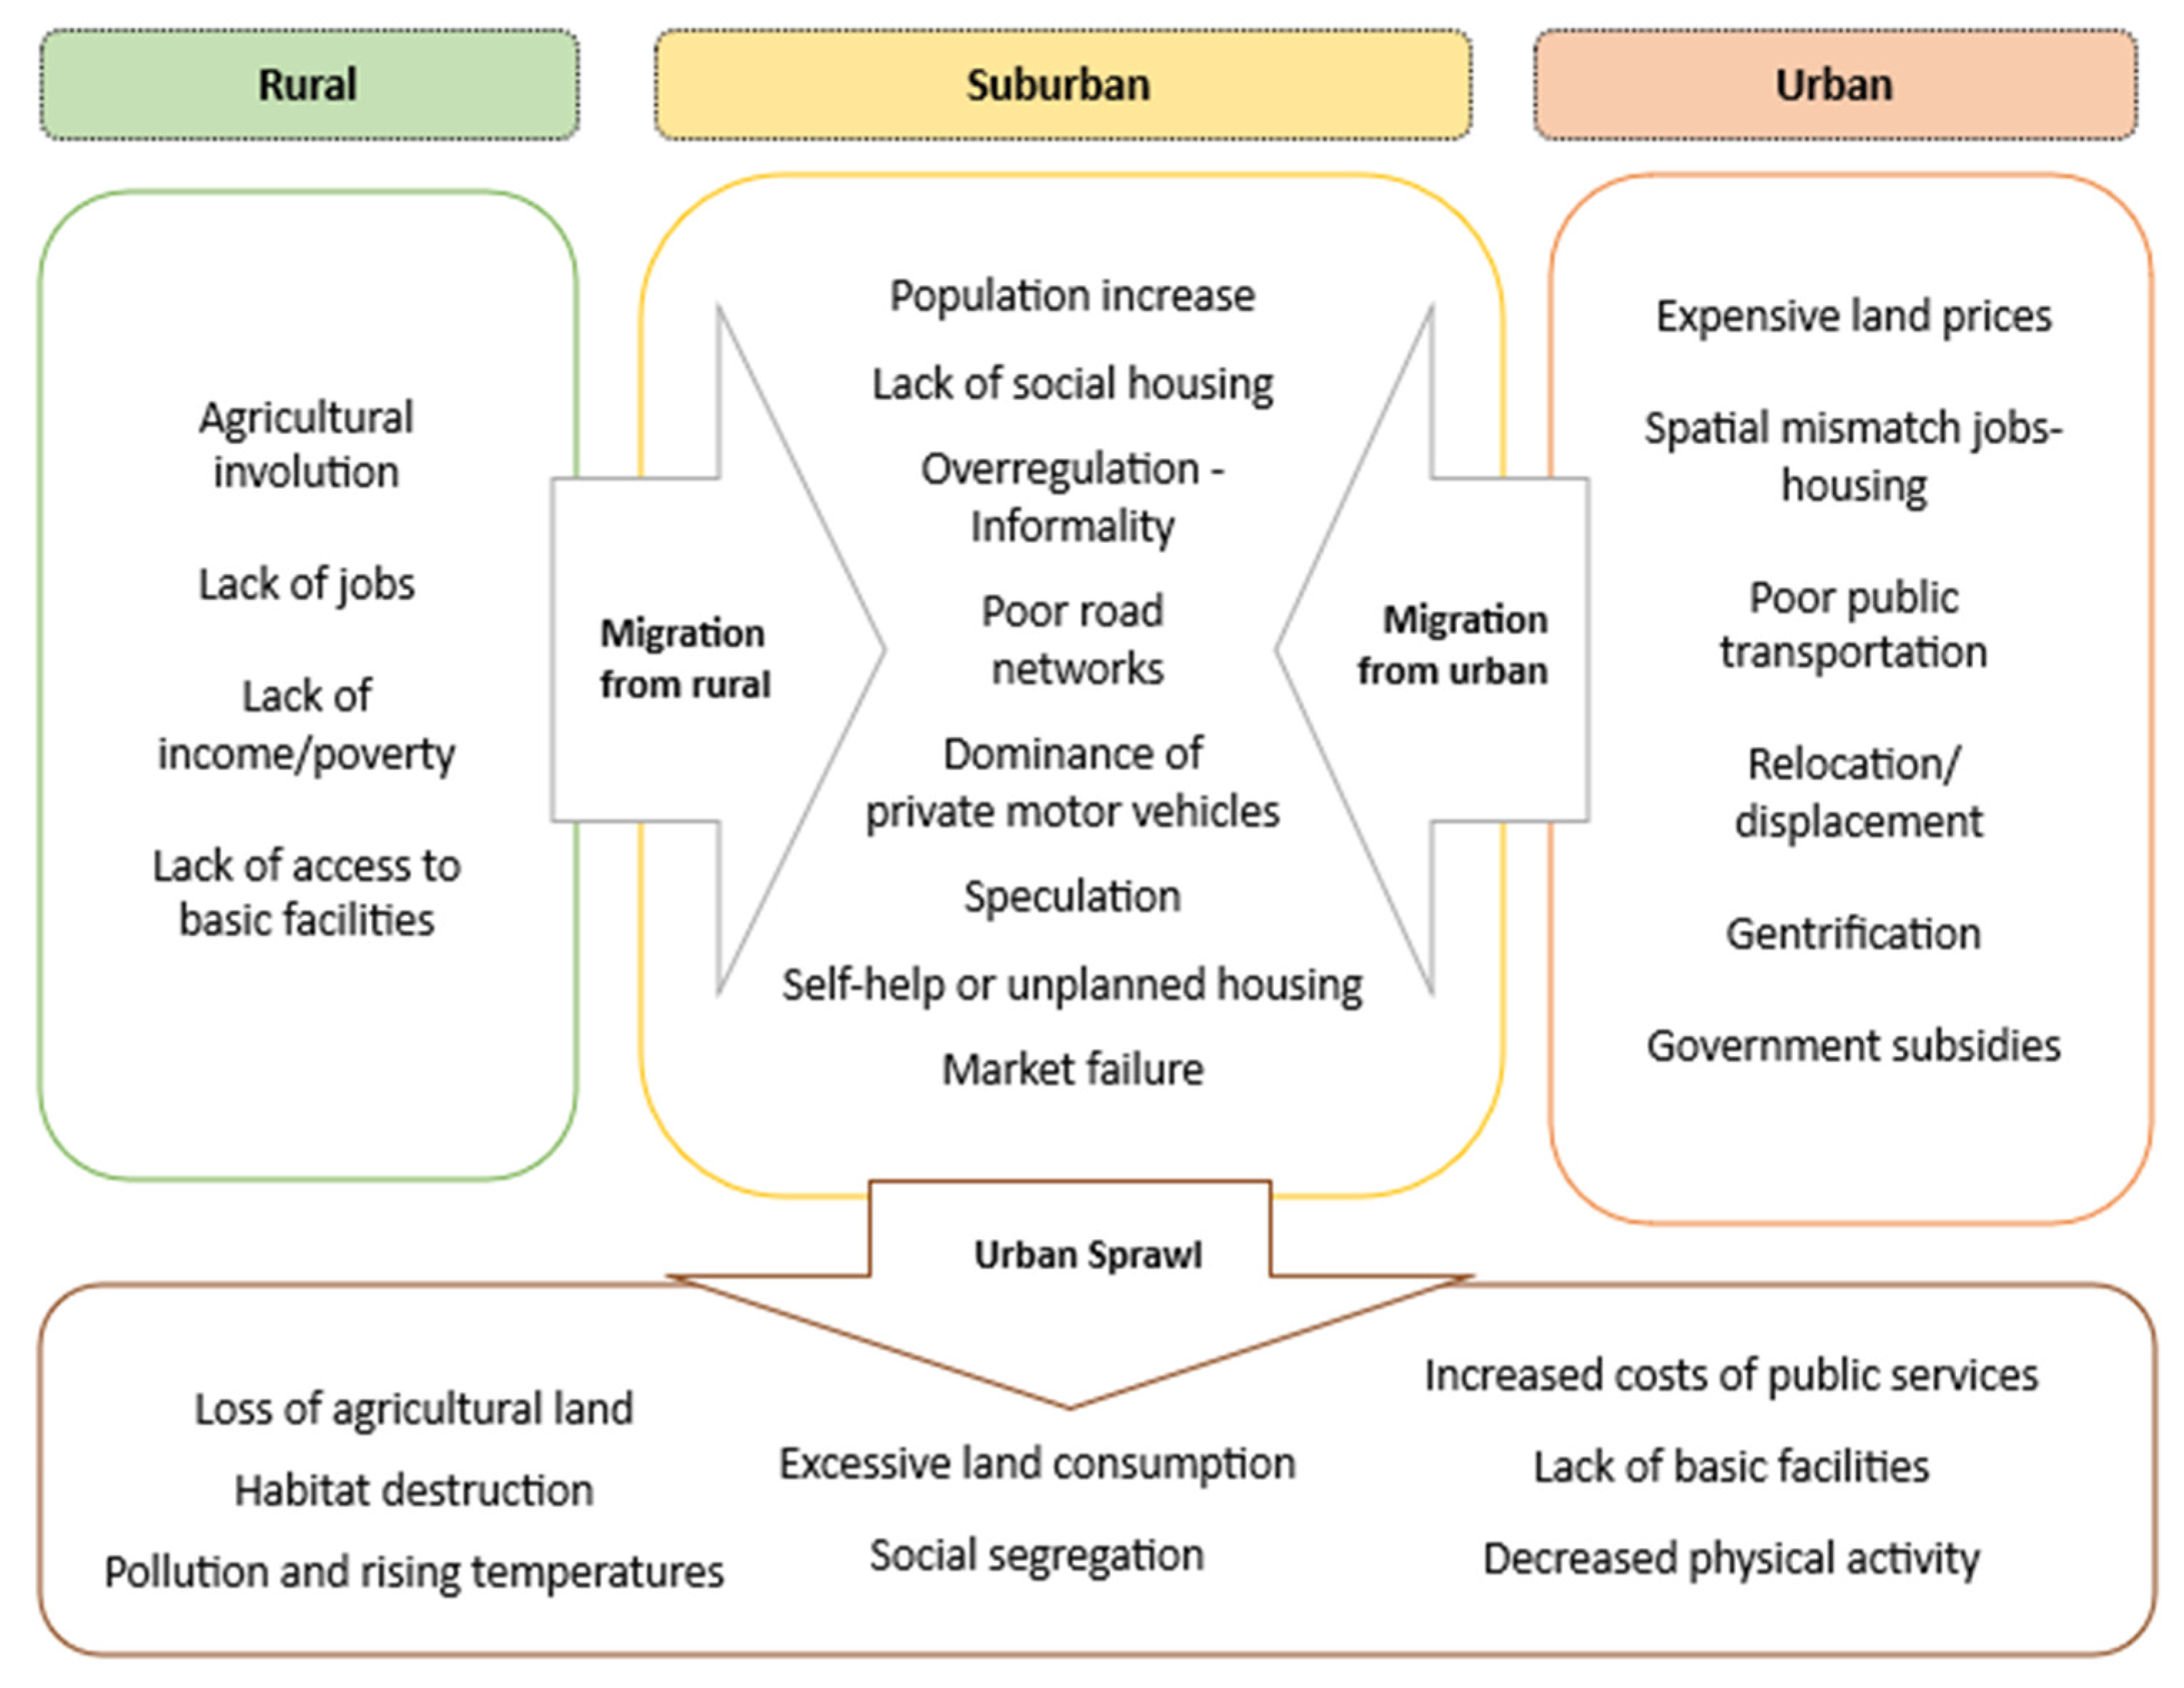
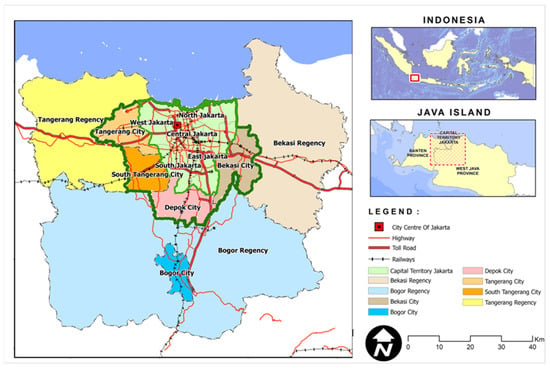
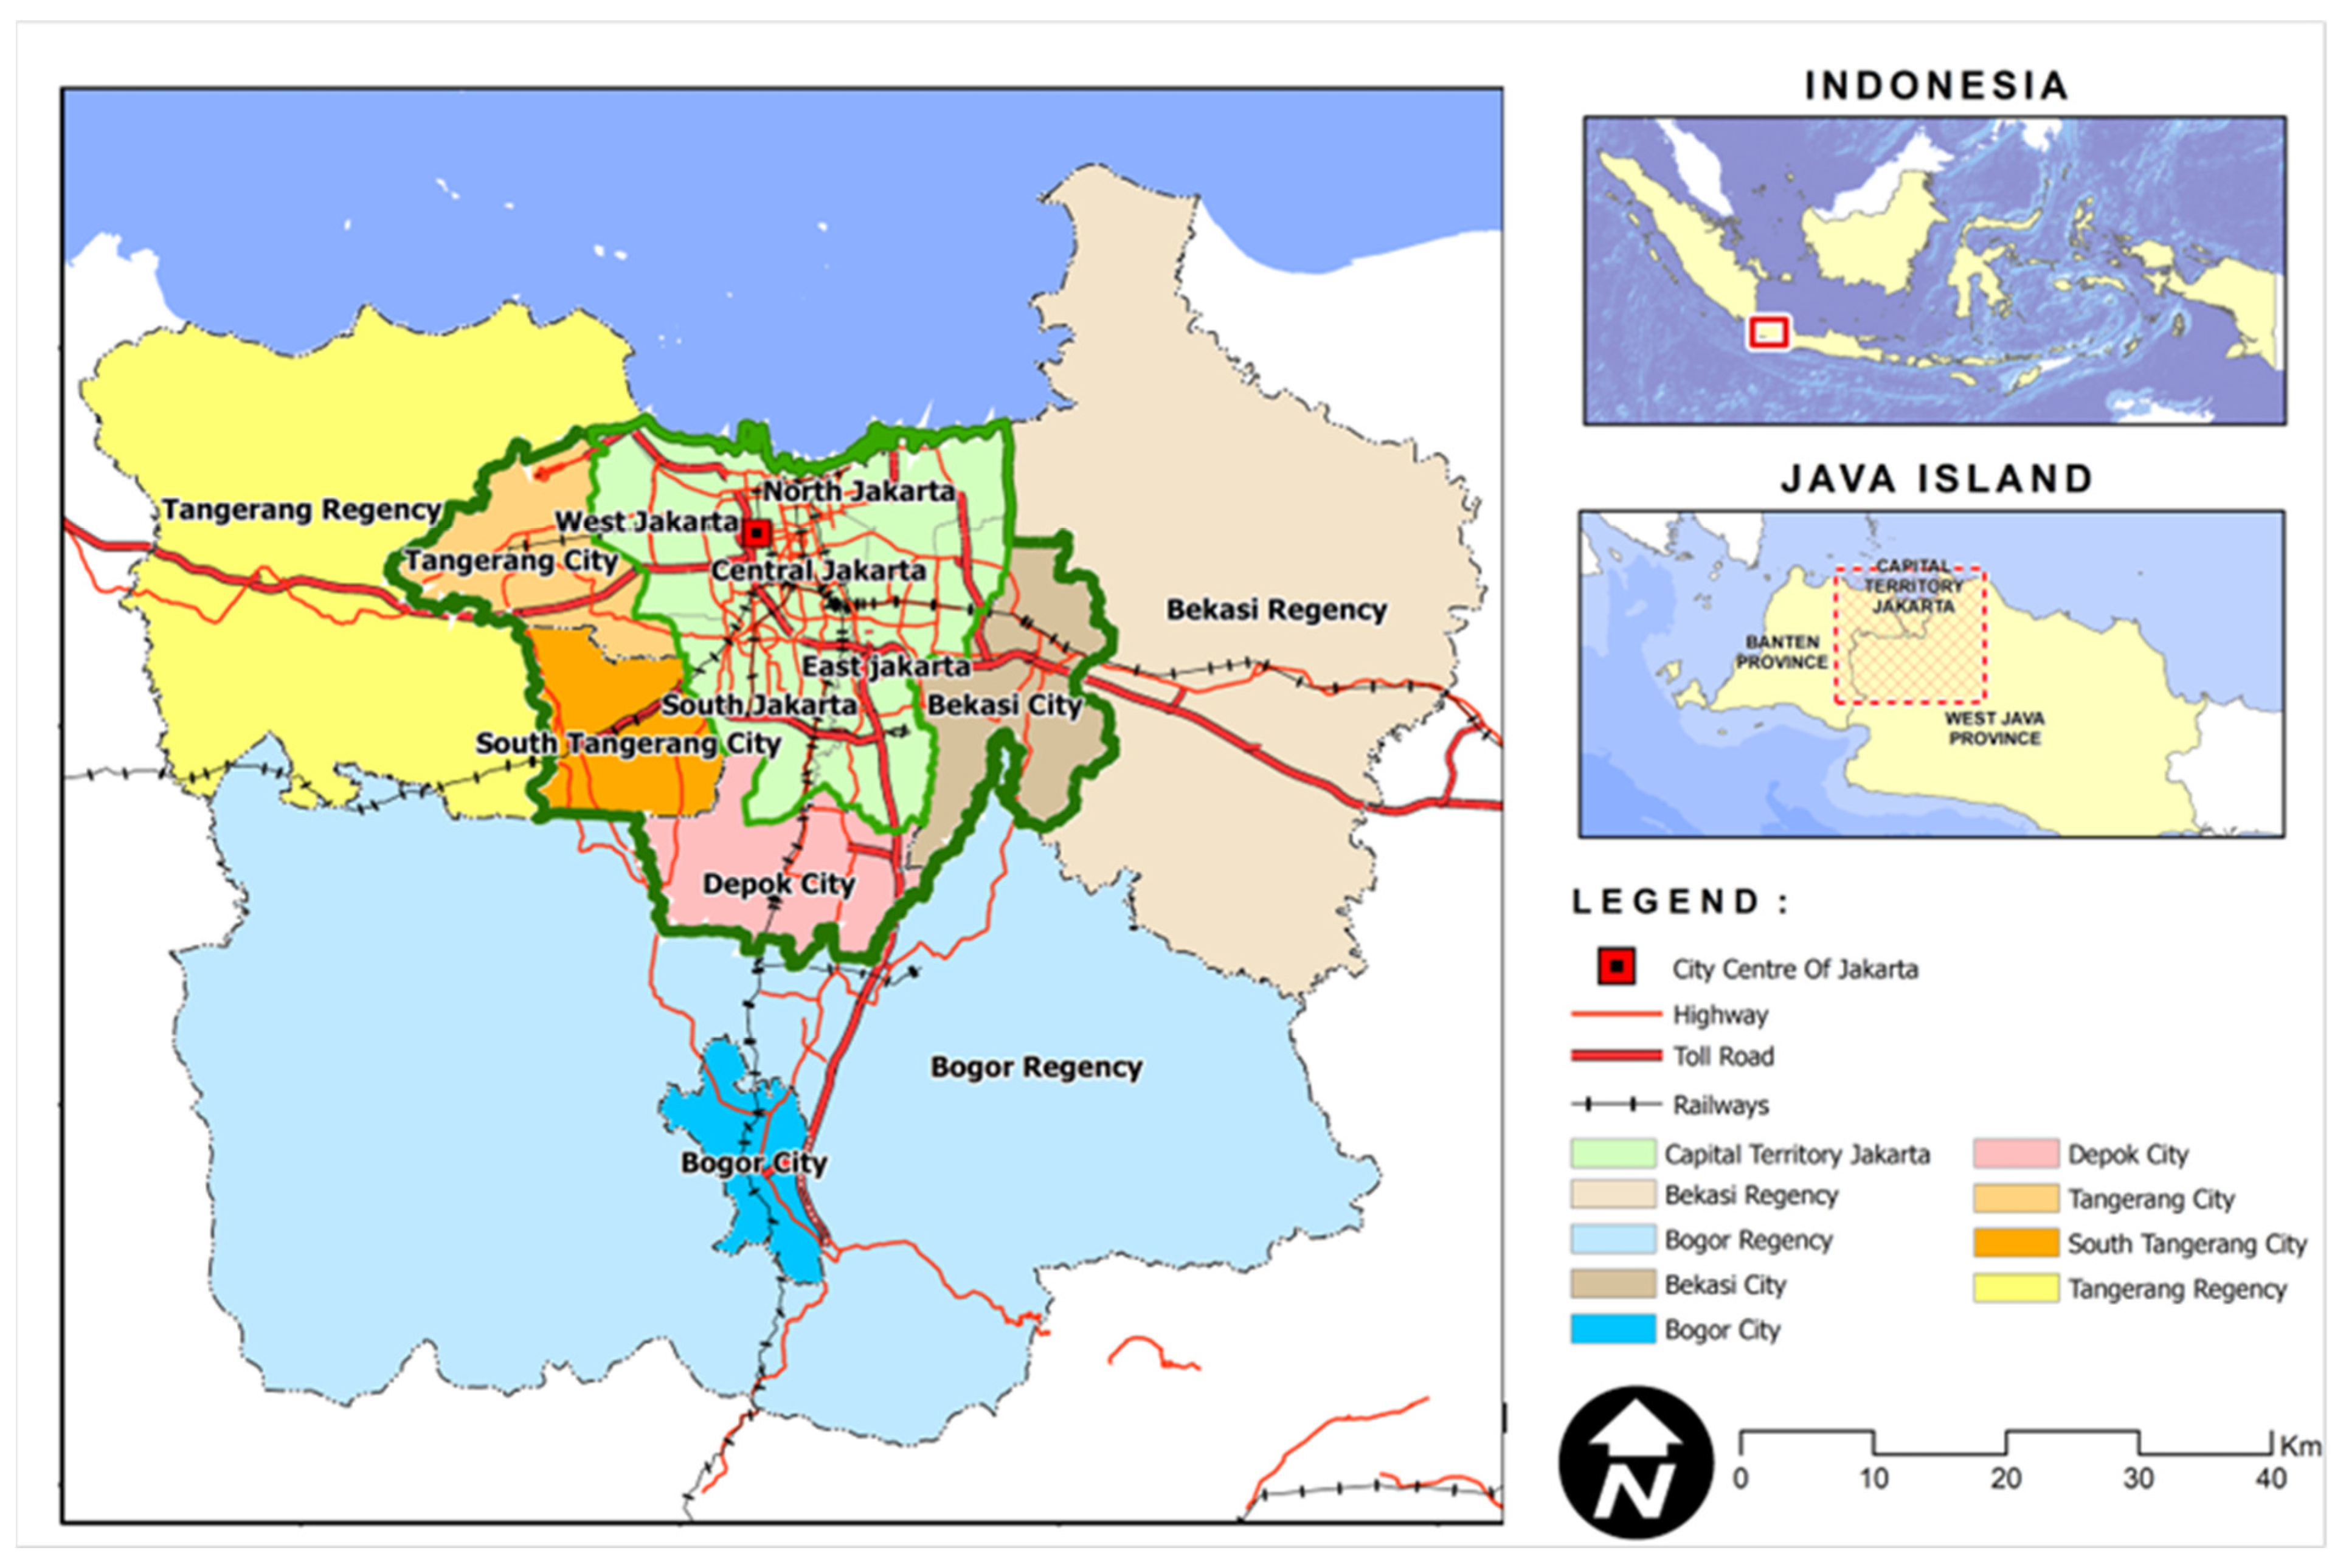
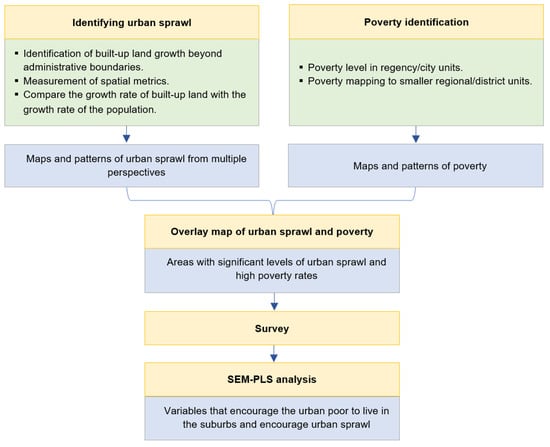
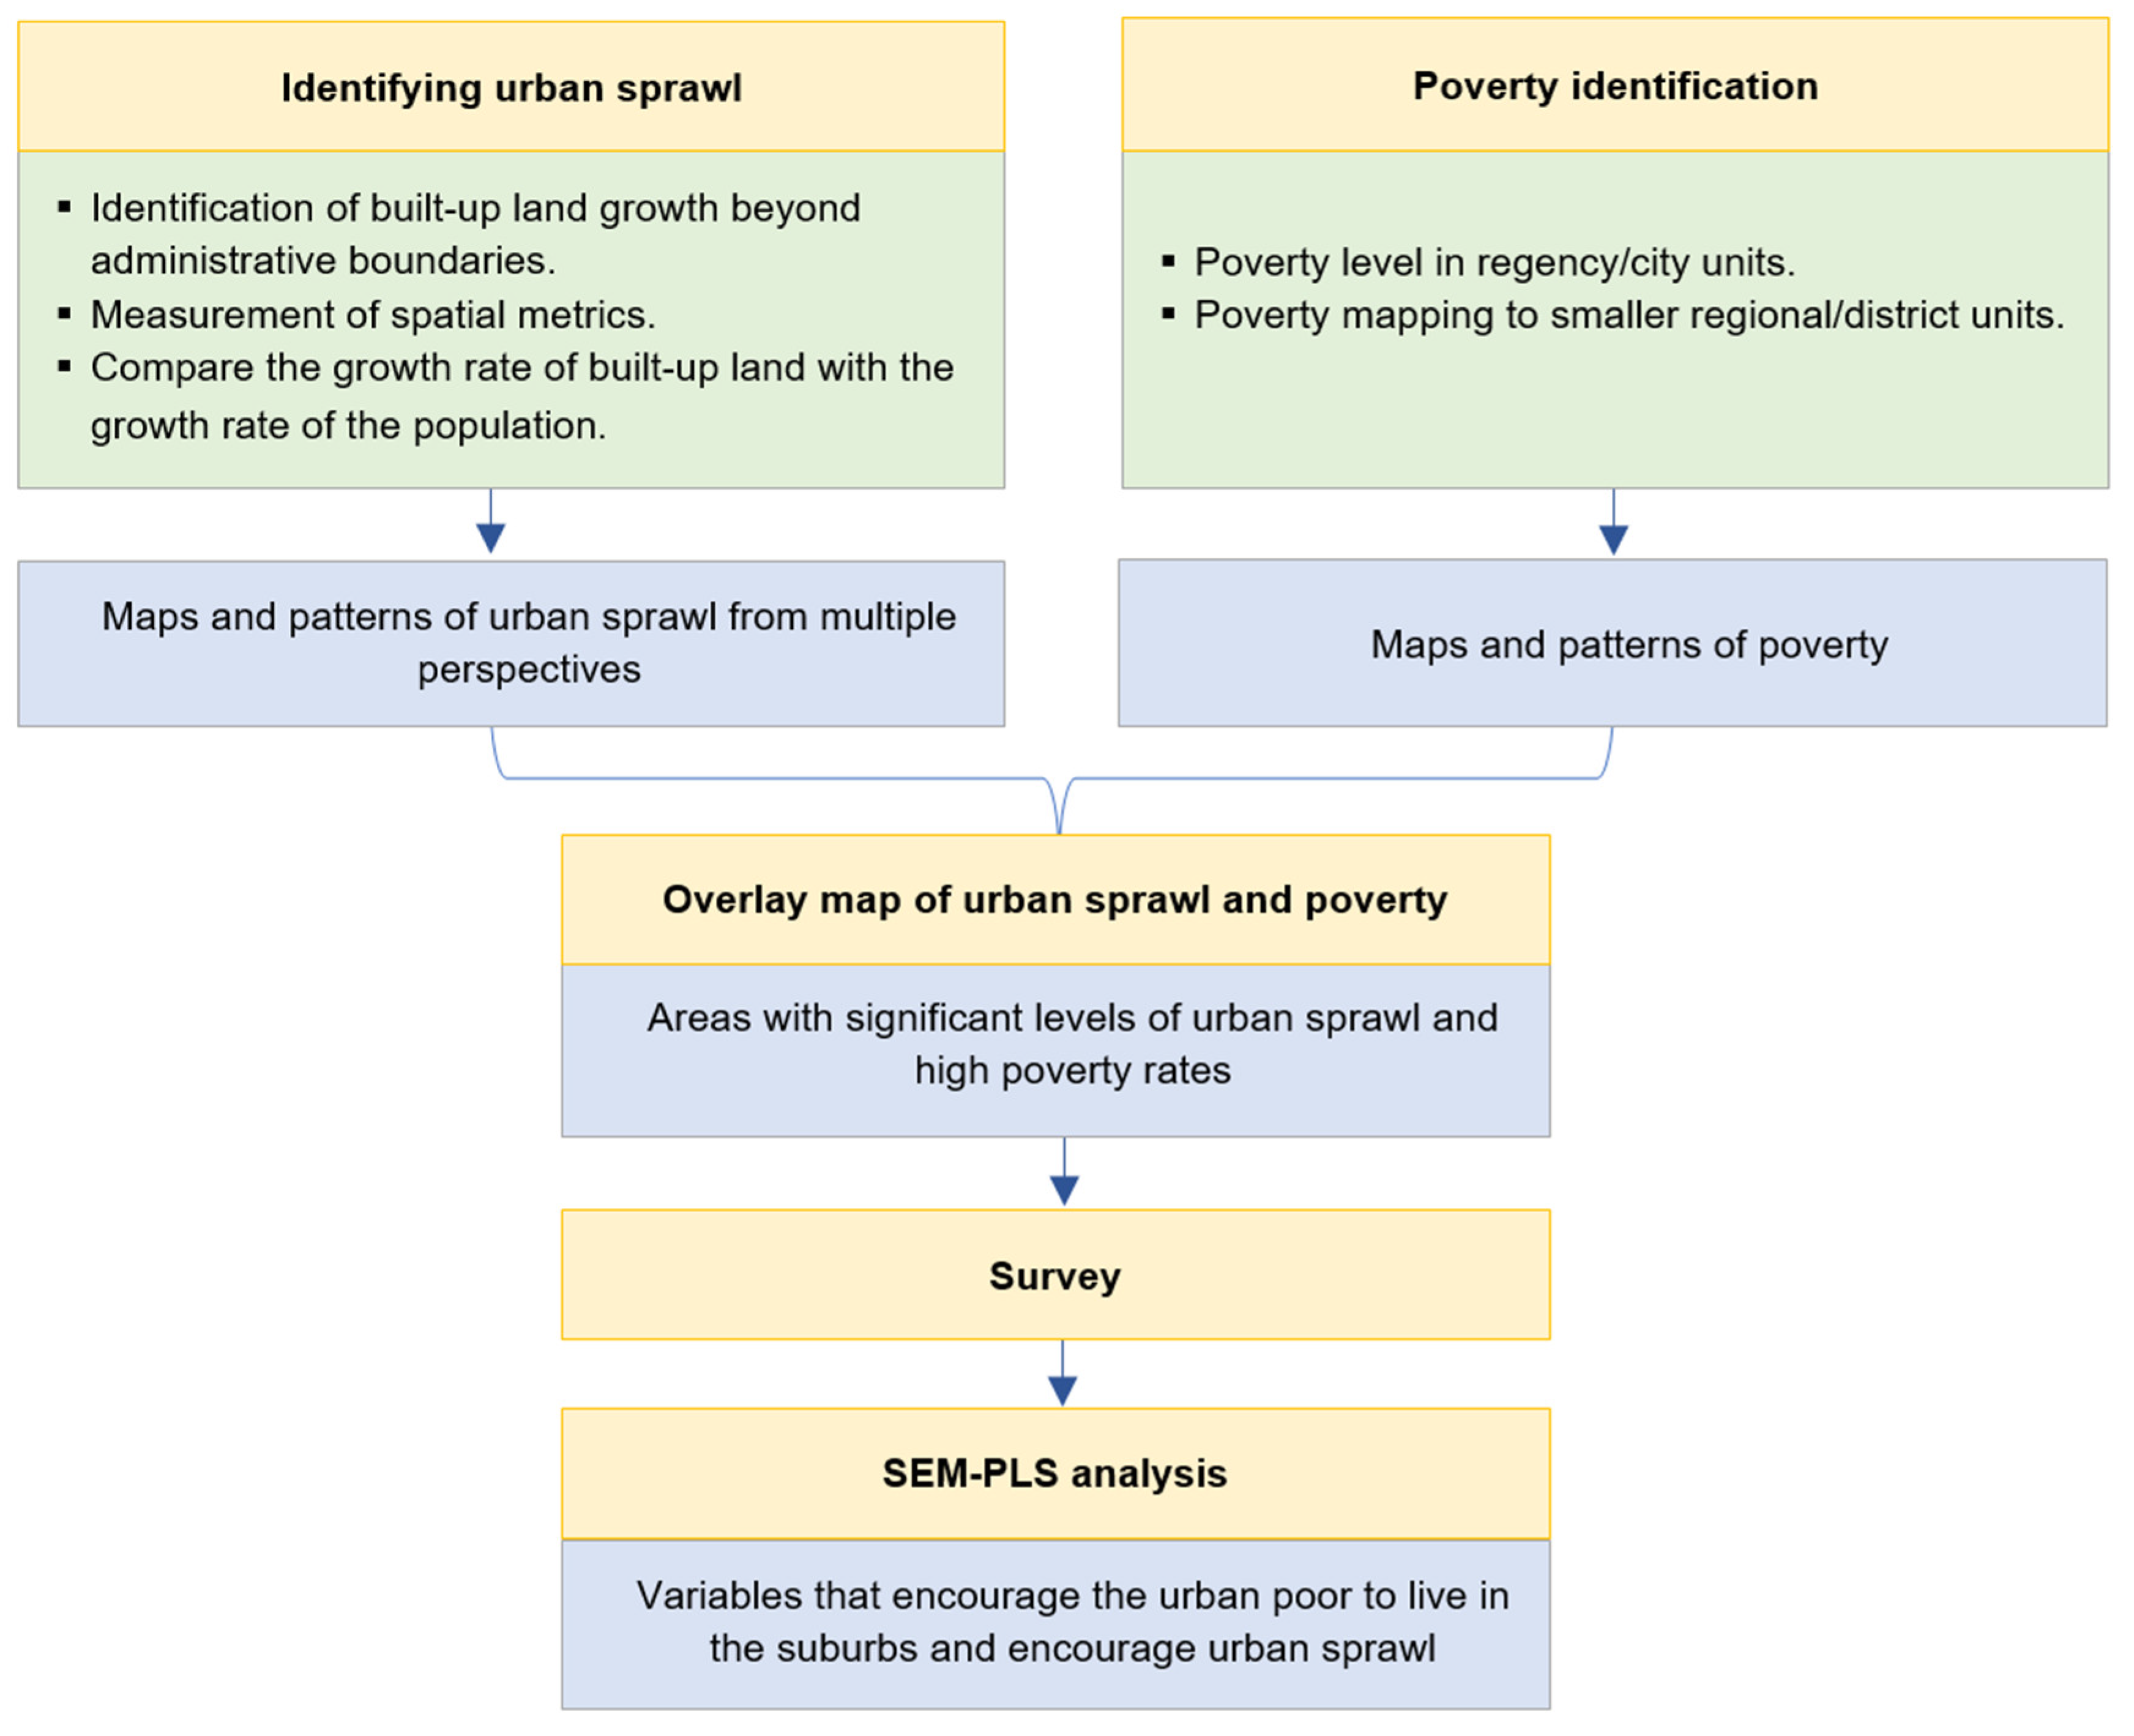
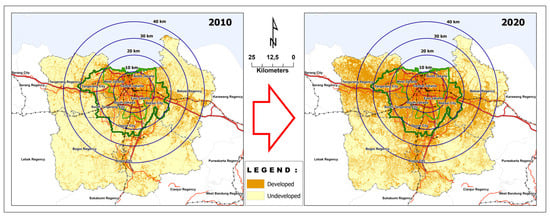
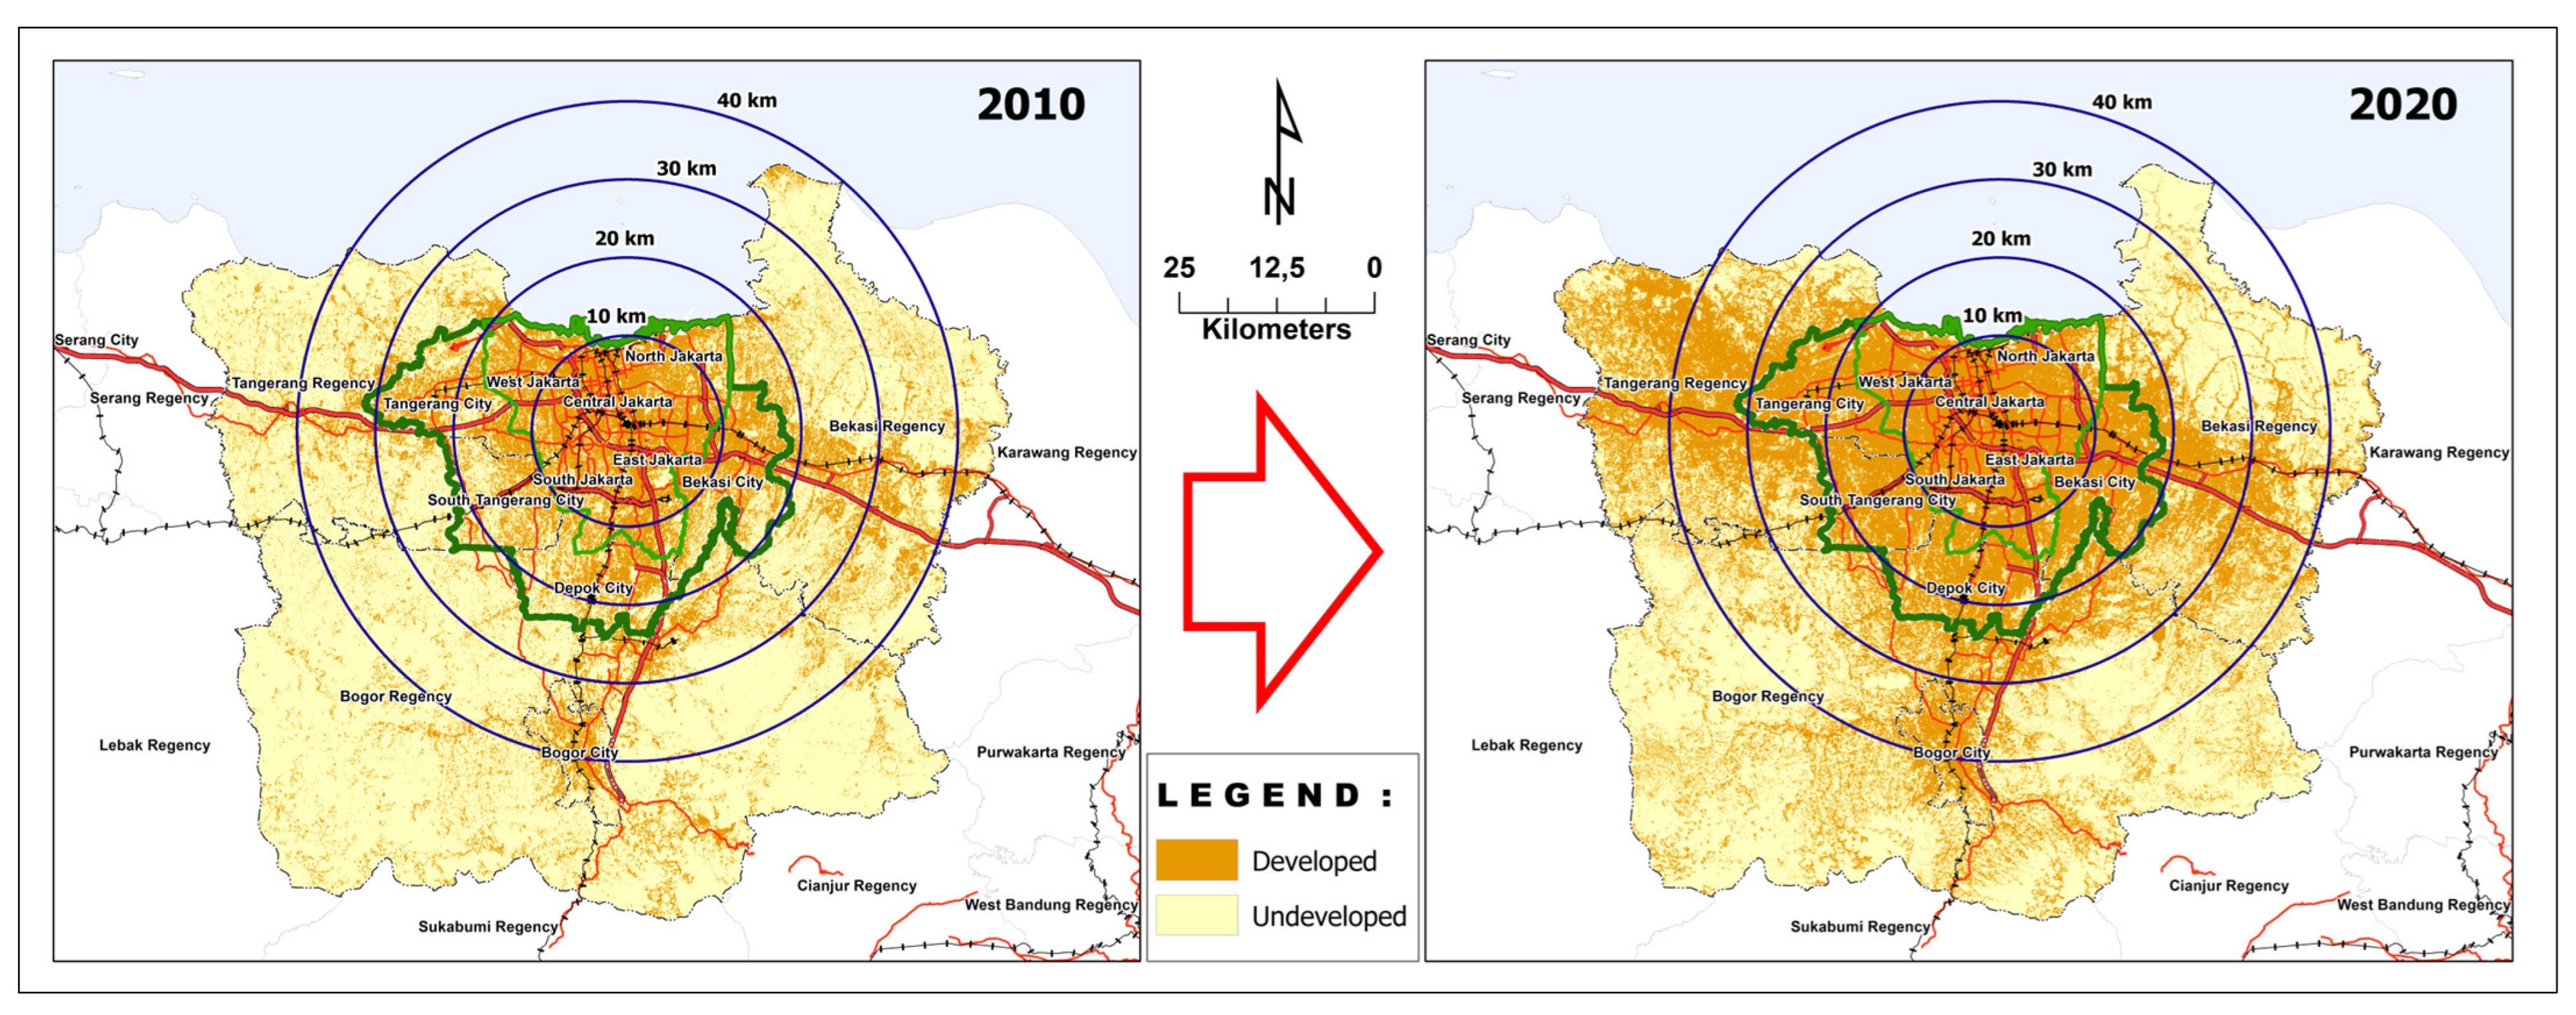
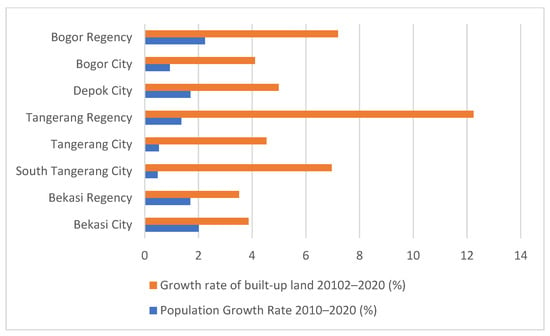
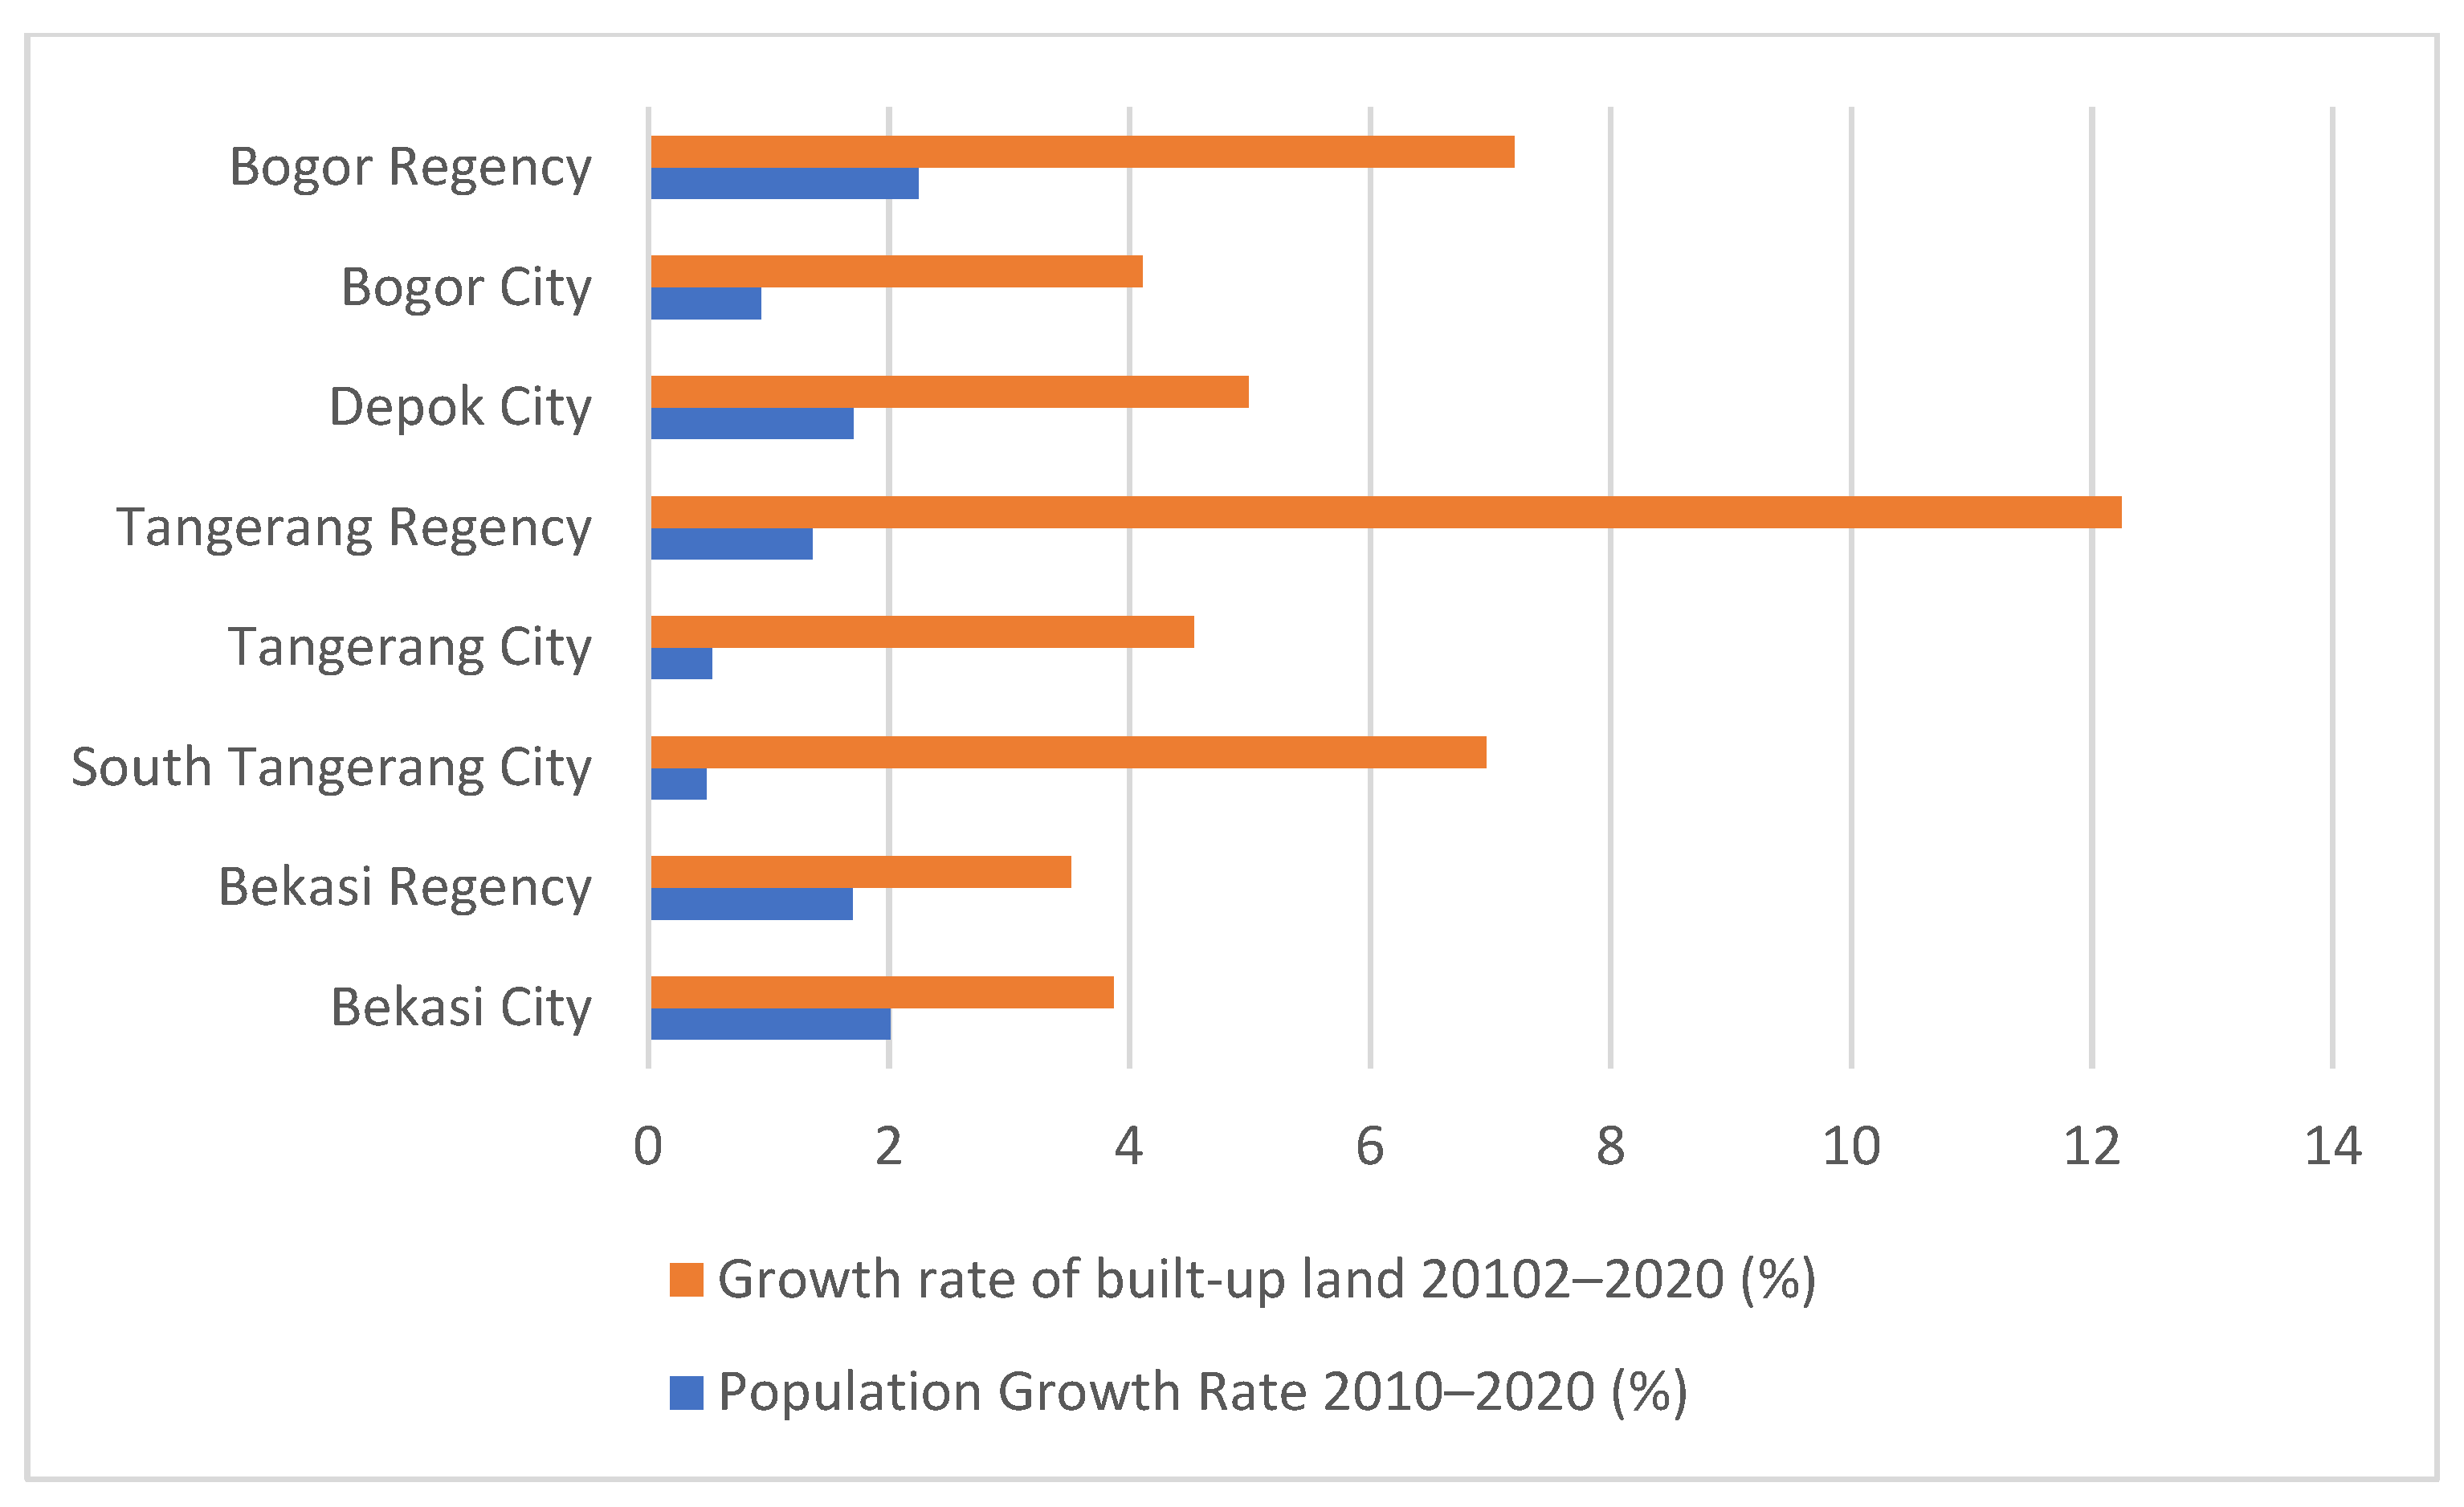
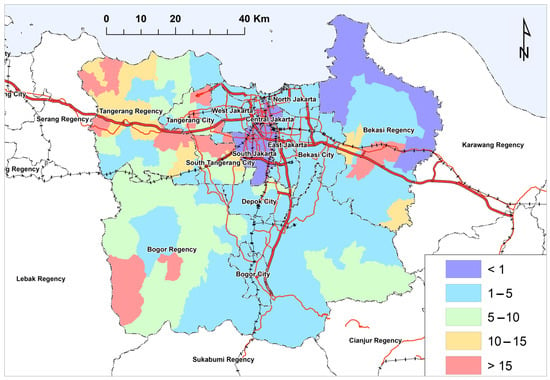
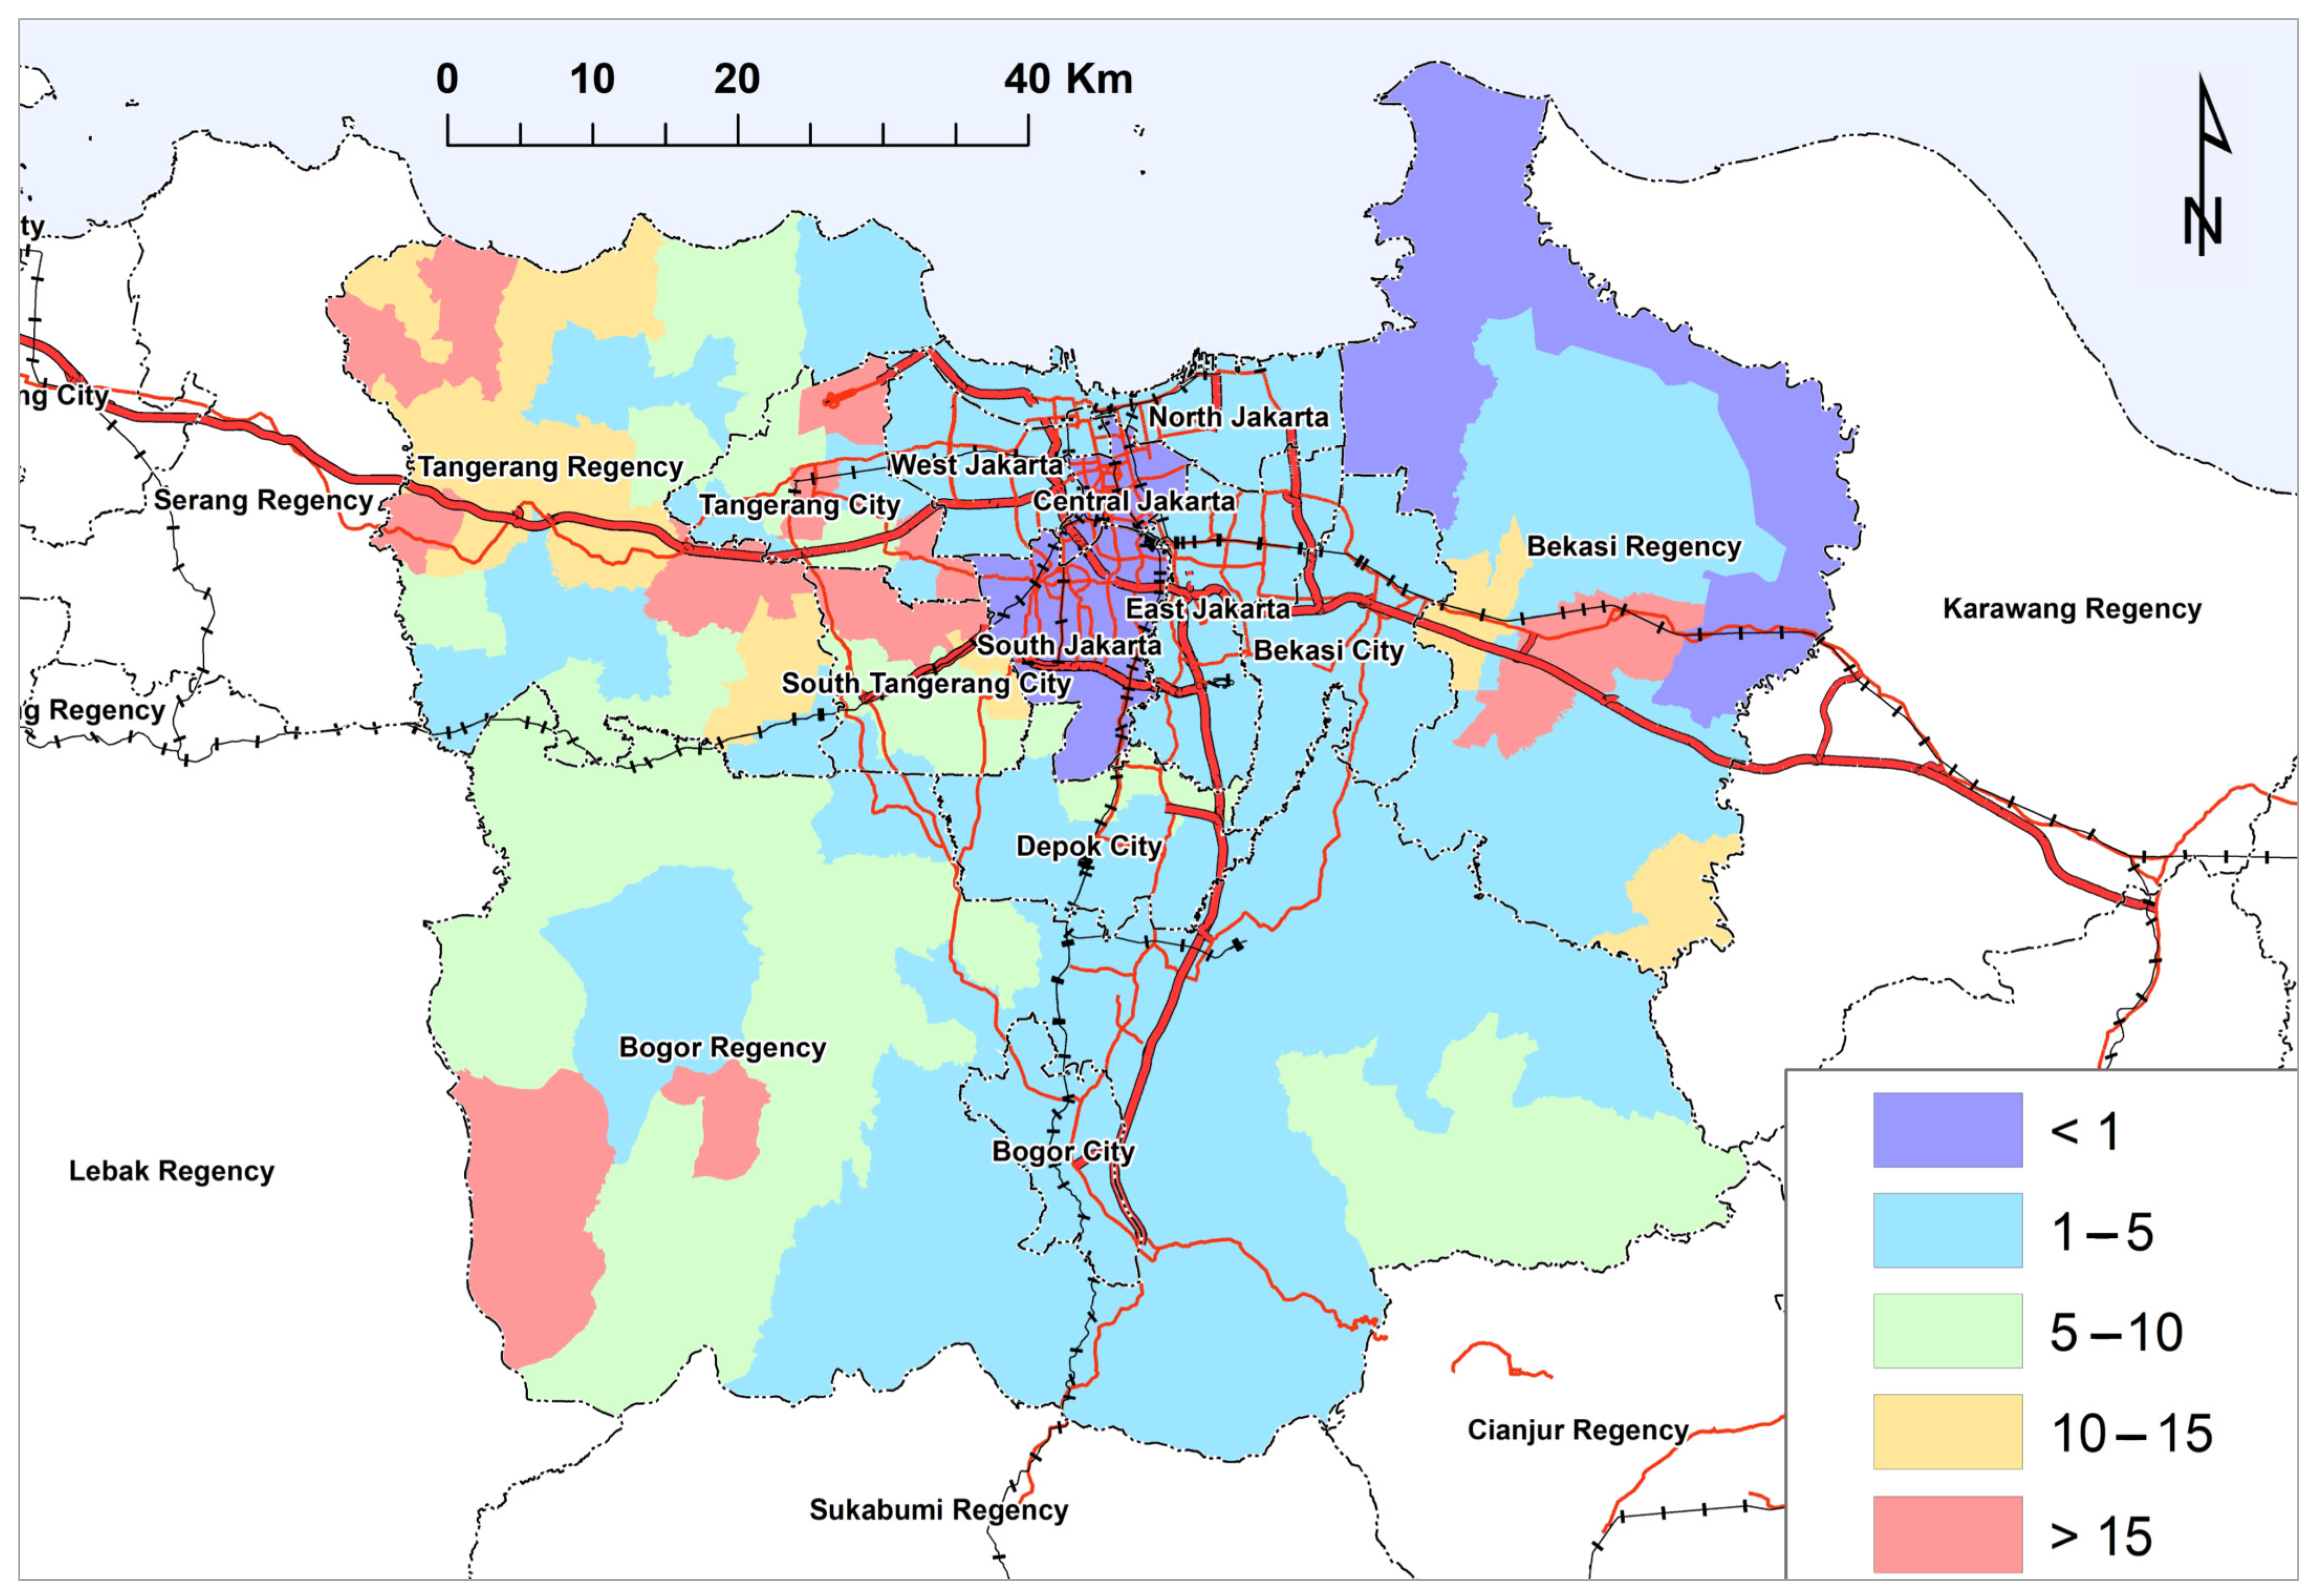
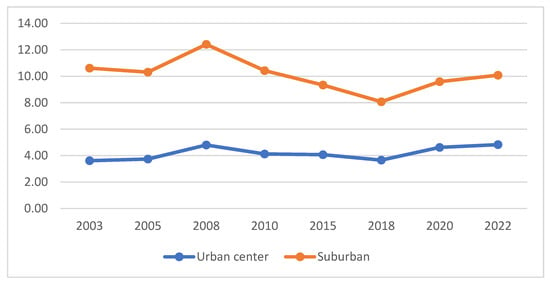
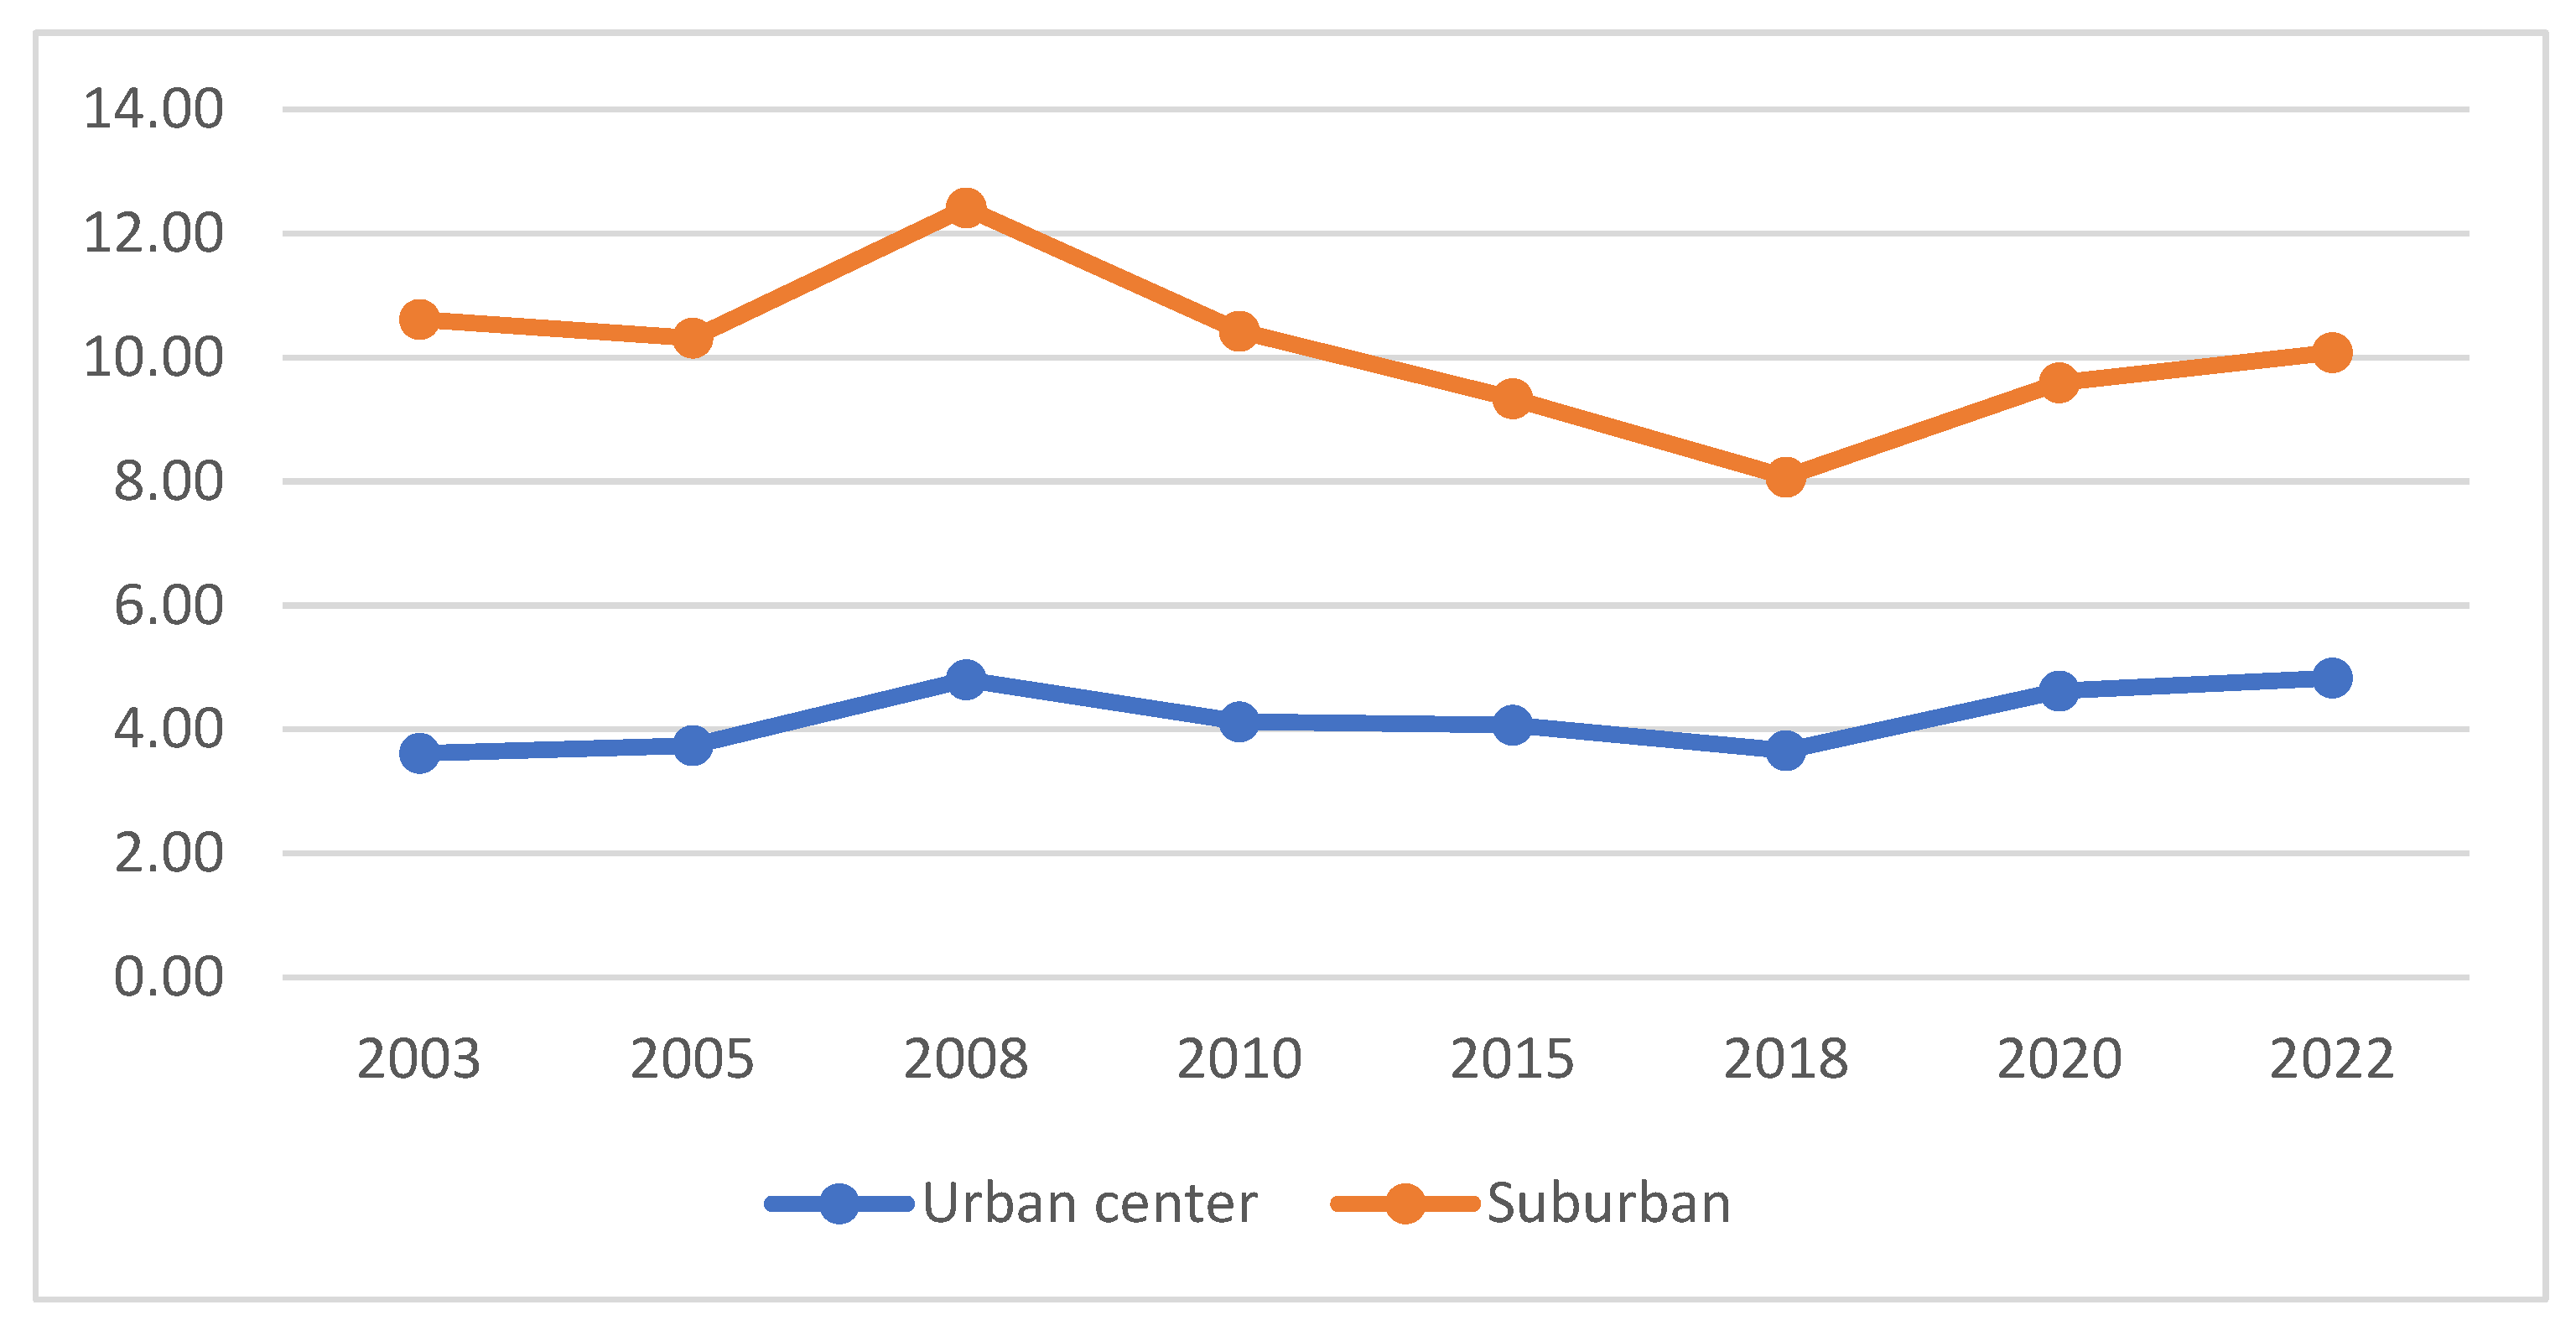
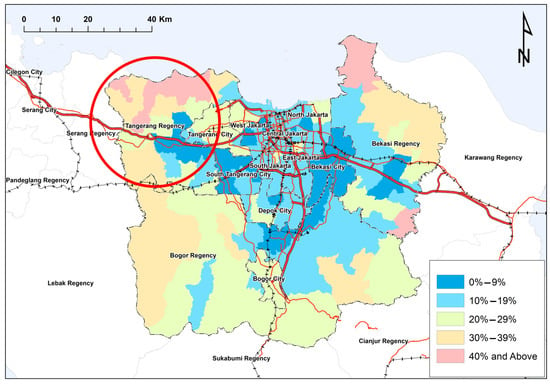
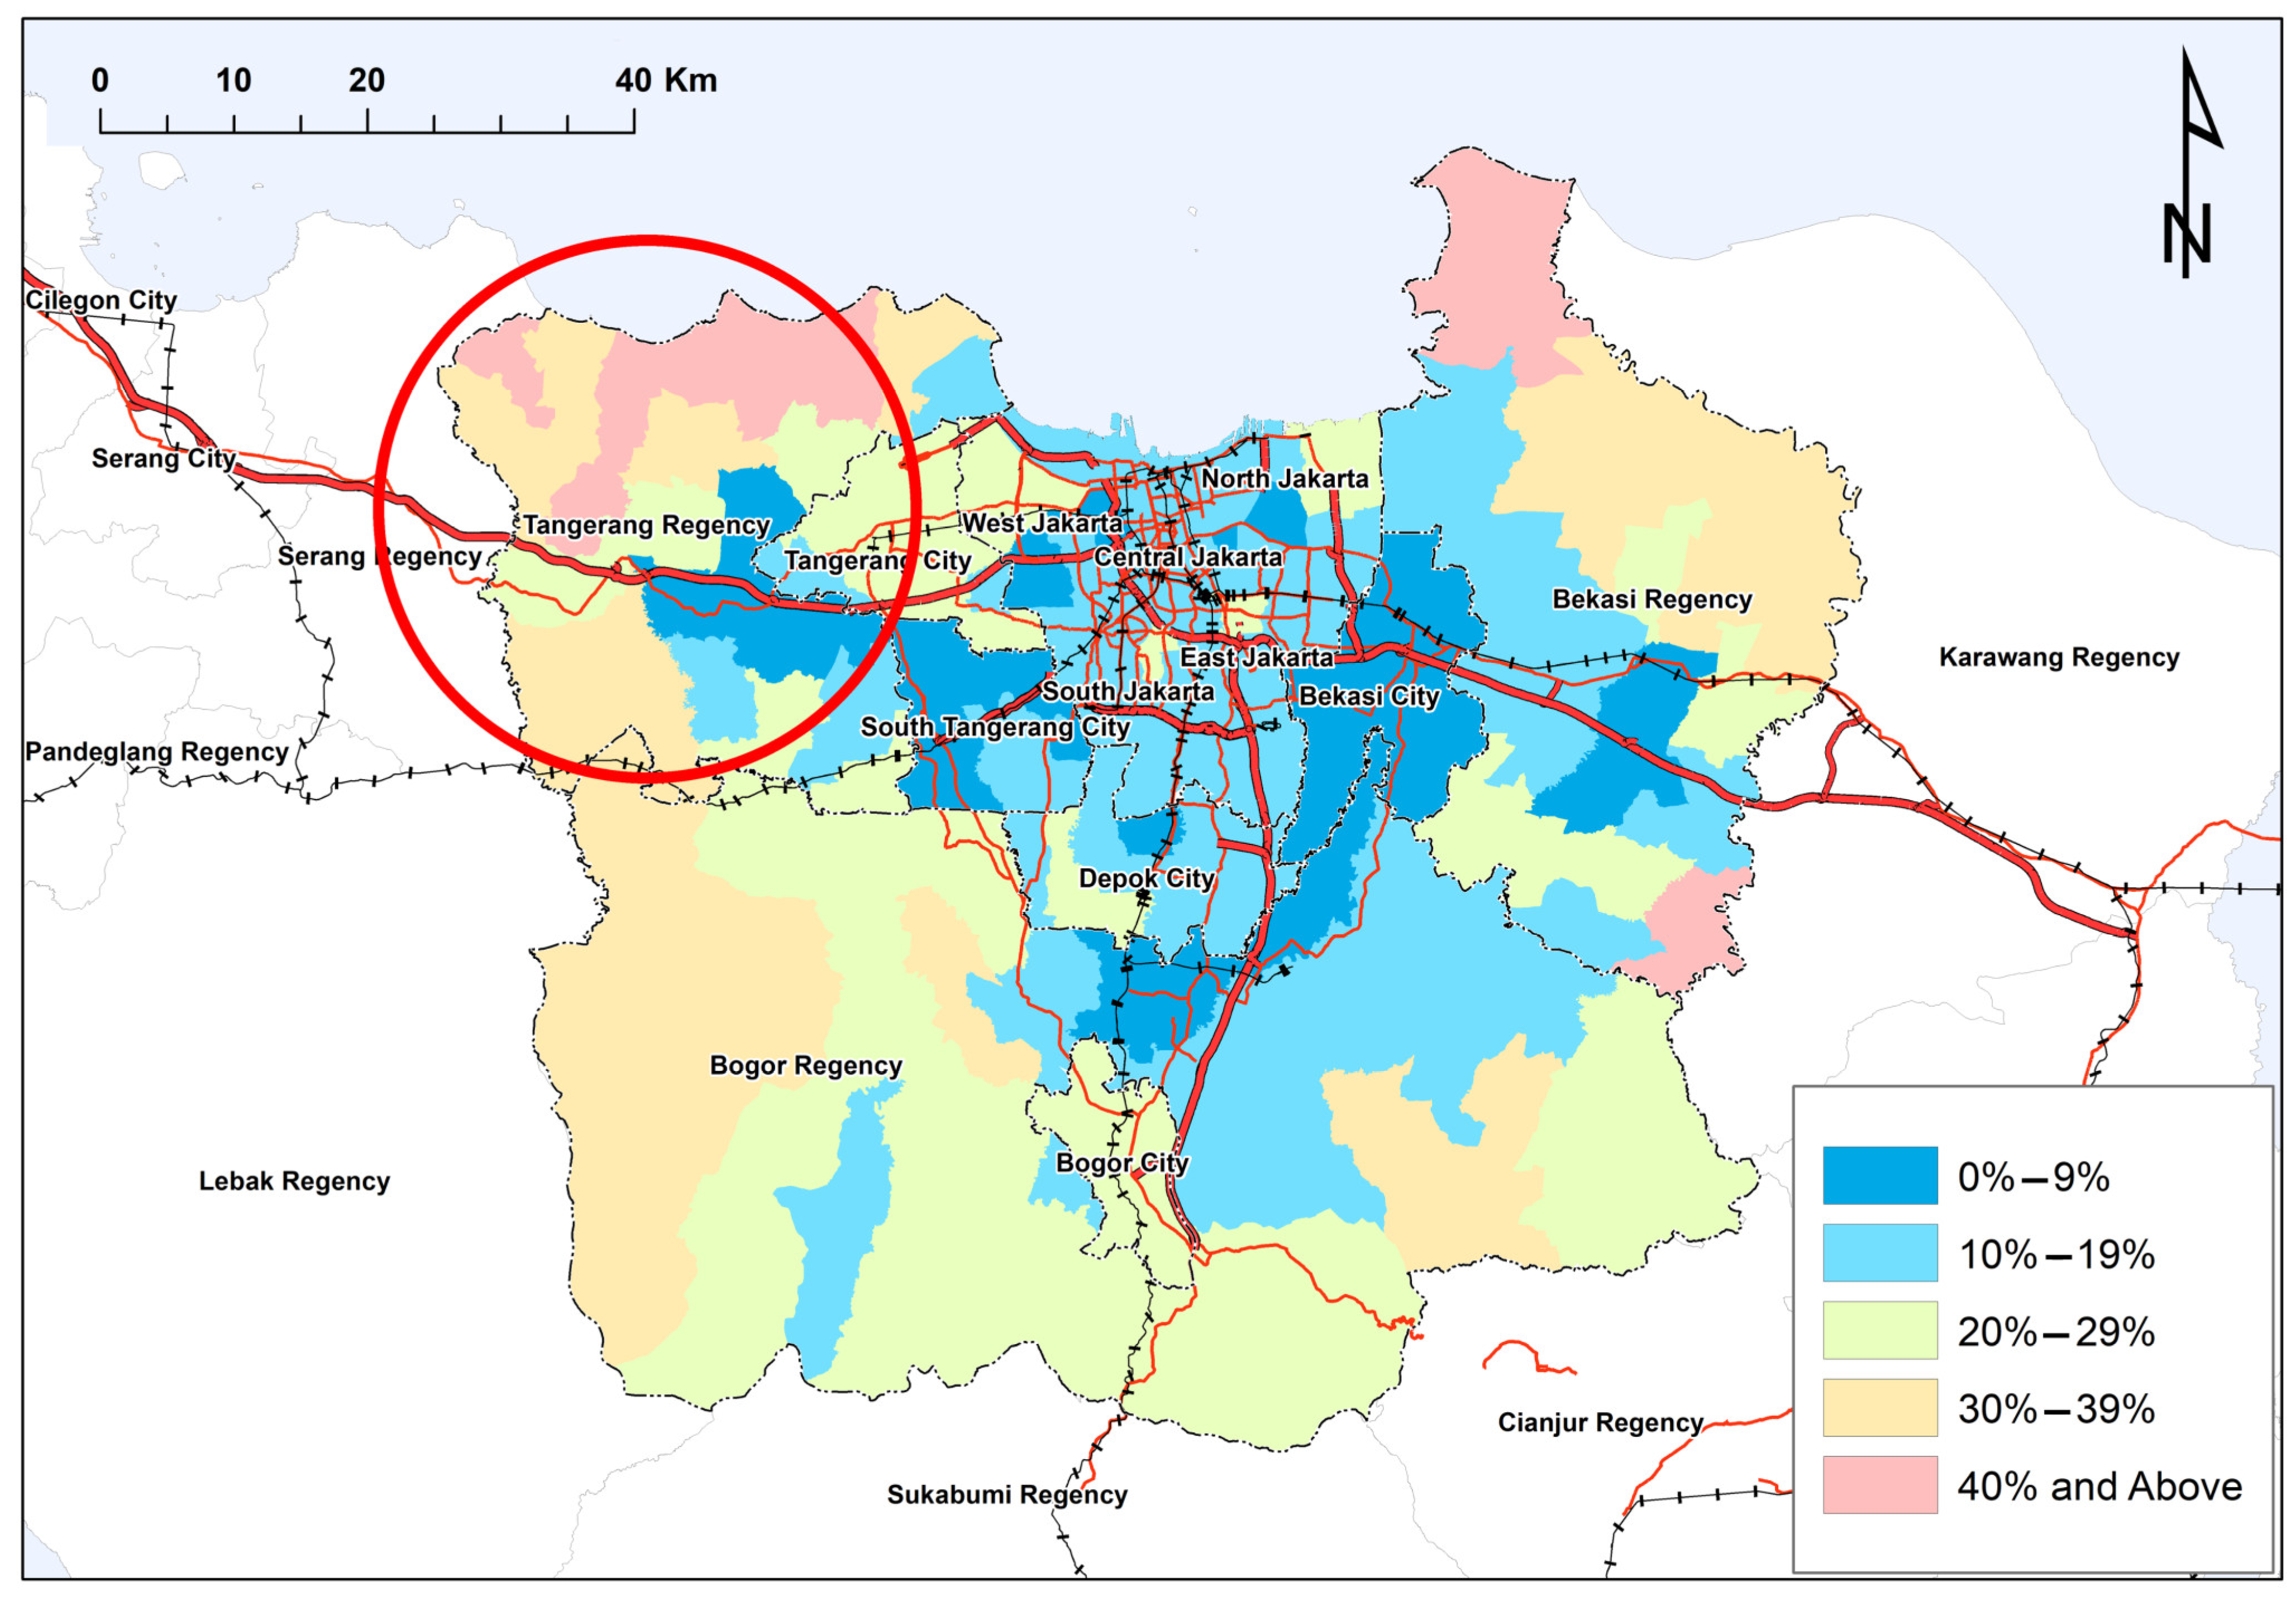
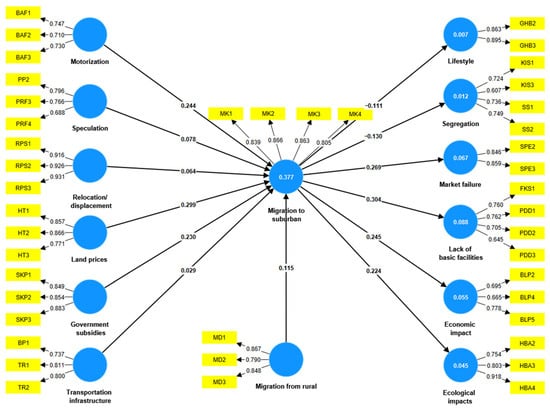
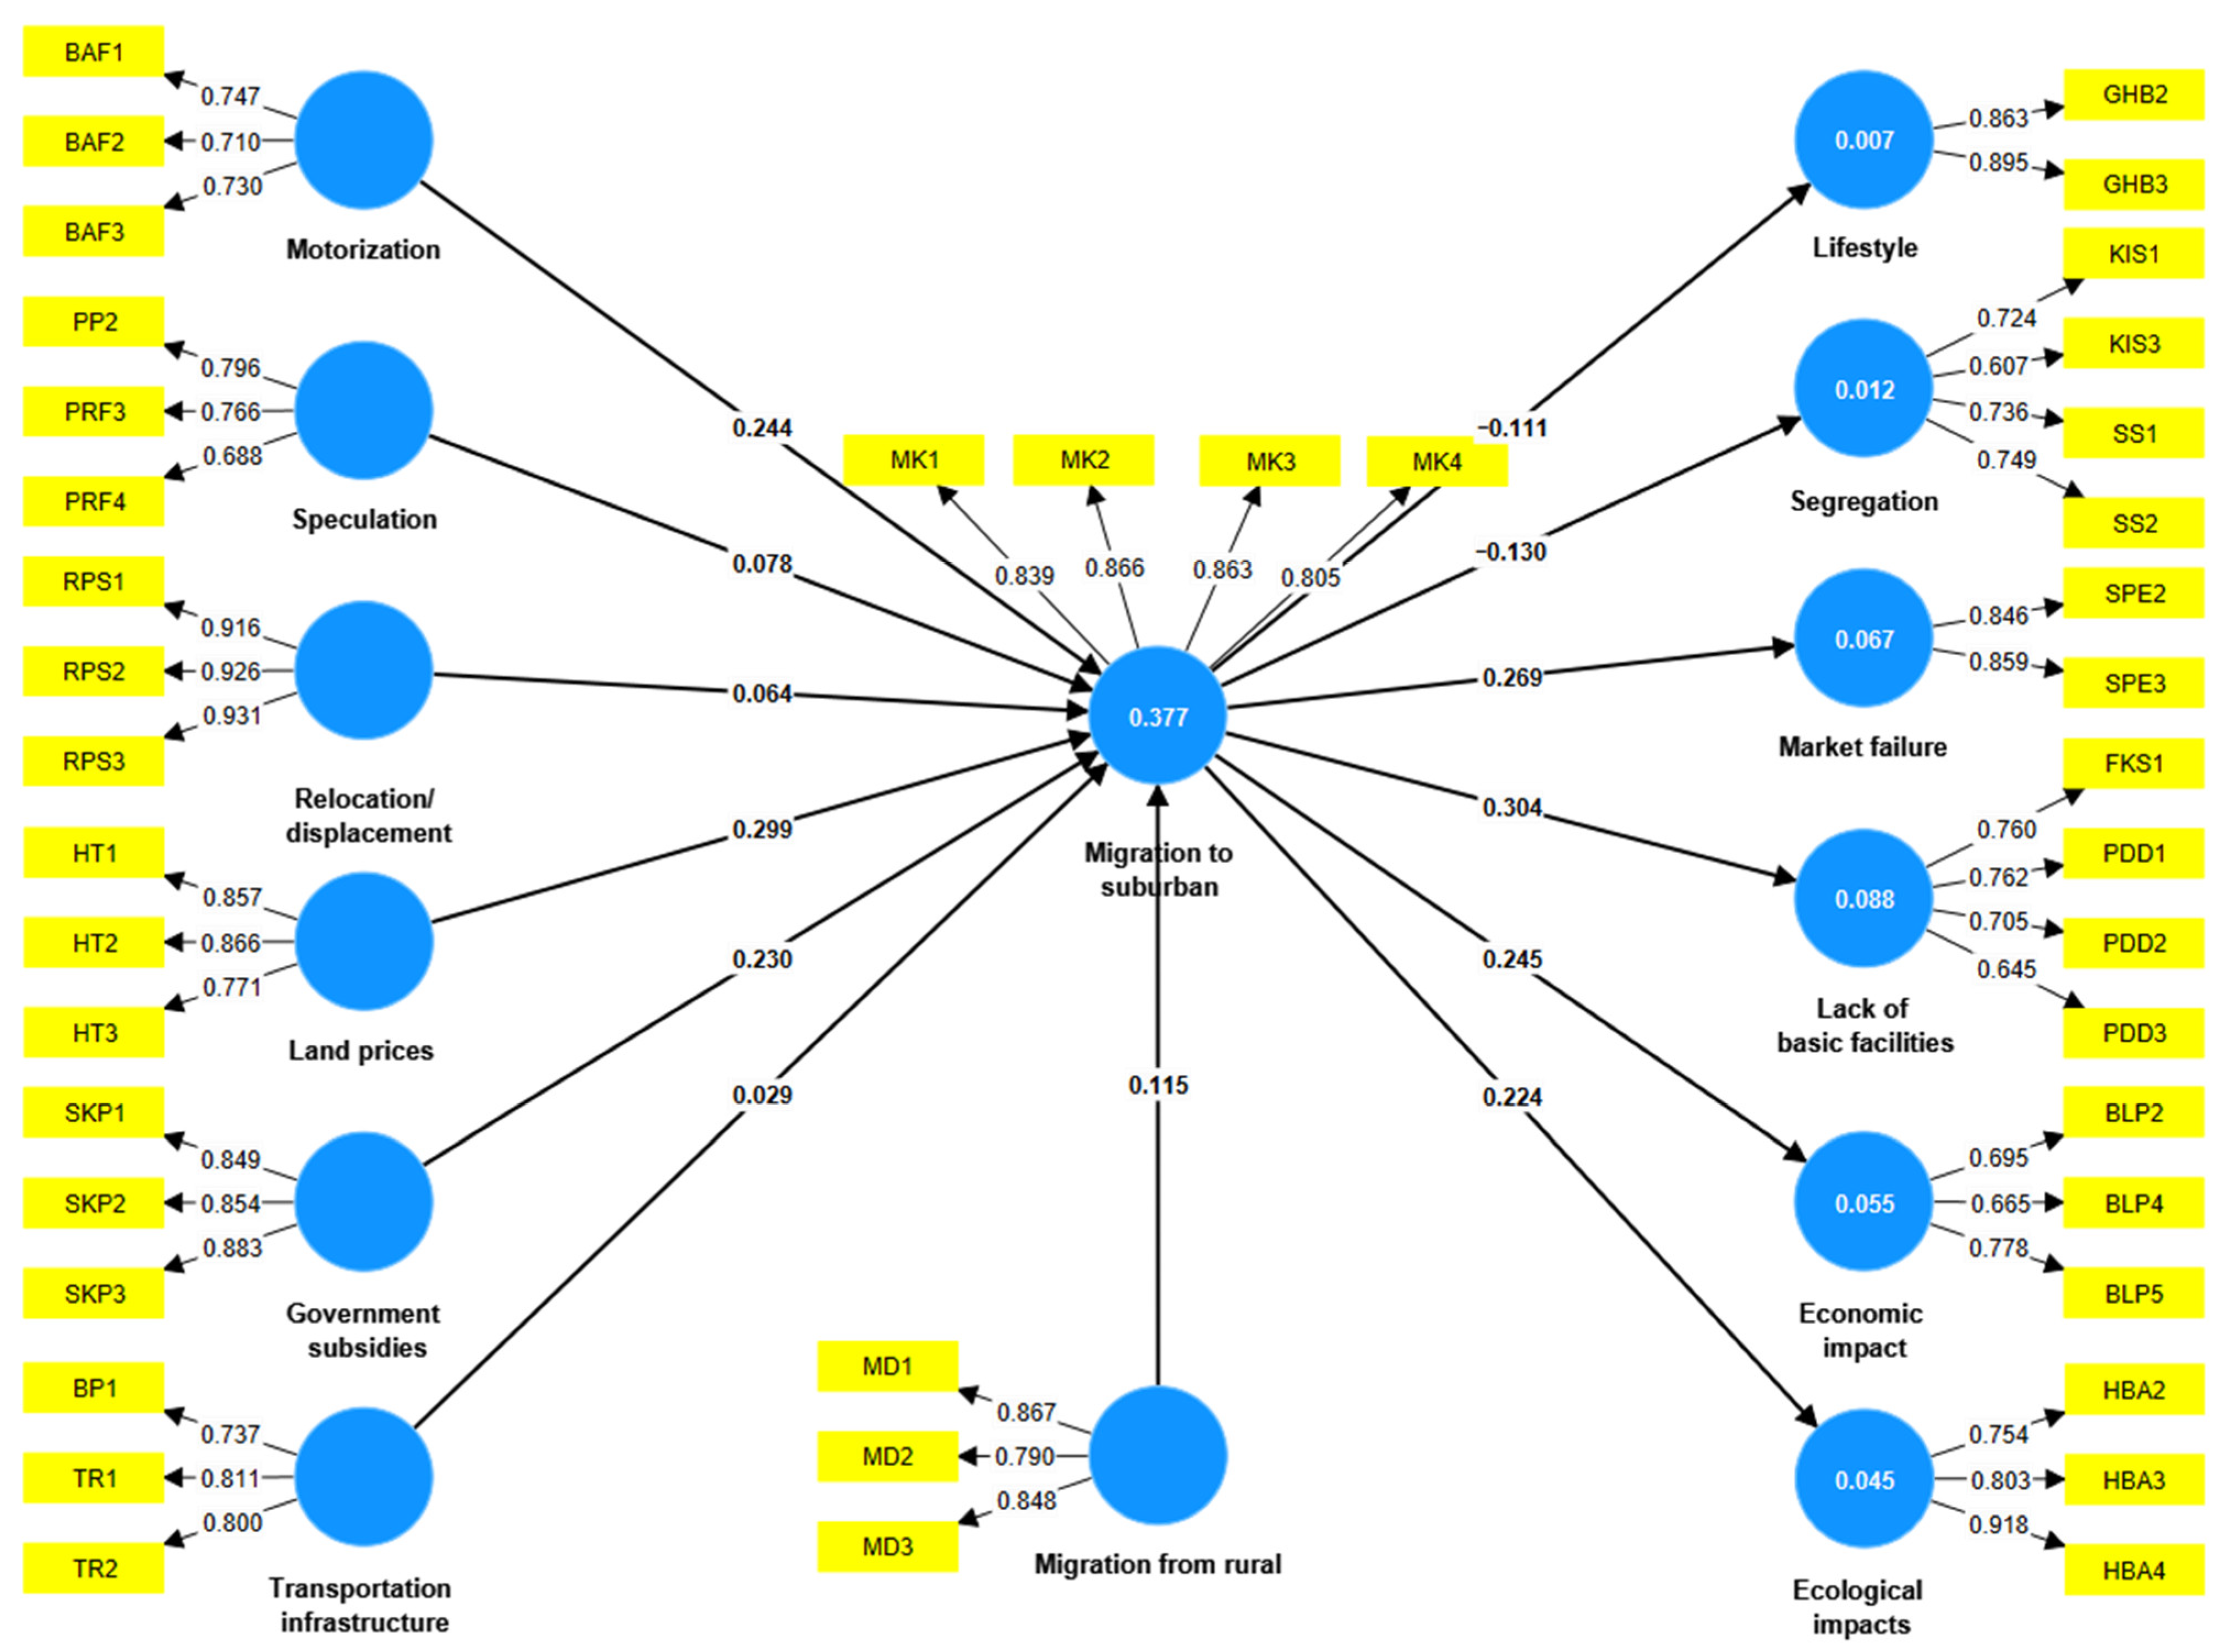

Disclaimer/Publisher’s Note: The statements, opinions and data contained in all publications are solely those of the individual author(s) and contributor(s) and not of MDPI and/or the editor(s). MDPI and/or the editor(s) disclaim responsibility for any injury to people or property resulting from any ideas, methods, instructions or products referred to in the content. |
© 2026 by the authors. Licensee MDPI, Basel, Switzerland. This article is an open access article distributed under the terms and conditions of the Creative Commons Attribution (CC BY) license.