


Abstract
Objective: The effects of fatigue on swimming propulsion are unclear. This study examined upper-limb propulsive force and bilateral coordination during constant-speed front crawl performed until exhaustion. Methods: Twelve competitive swimmers completed a visually paced front-crawl trial performed at a constant speed (95% of maximal speed) until volitional exhaustion. Upper-limb propulsion (pressure-derived) was quantified using wearable differential-pressure mini-paddles synchronized with high-speed video. Propulsive force and impulse were analyzed at ten standardized time points (10–100% of test duration), distinguishing the early (entry–catch–pull) phase and the push phase of the stroke cycle. Results: Total overall propulsive impulse (time-integral of propulsive force) and mean propulsive force decreased significantly as early as 30–40% of test duration, with the largest reductions occurring during the push phase. Interestingly, push-phase impulse declined earlier in the non-dominant left arm (from 20% of test duration) compared to the dominant right arm (from 40%), whereas force generated during the early phase did not change. Peak propulsive force decreased at later stages, while intra-cycle timing indices (peak timing and force centroid) and inter-limb asymmetry remained unchanged. Stroke frequency increased from mid-test onward and was strongly negatively associated with stroke efficiency (r = −0.79). Stroke efficiency correlated positively with push-phase impulse and peak force. Conclusions: During constant-speed front crawl performed to exhaustion, propulsion progressively declines, primarily through reduced force and impulse during the push phase rather than changes in the early (entry–catch–pull) phase or temporal and asymmetry-related variables. Increased stroke frequency initially compensates for declining propulsion but ultimately fails to maintain the imposed swimming velocity.
1. Introduction
Swimming propulsion arises from the interaction between biomechanical and fluid dynamic principles [1]. Two main mechanisms have been described: drag-based propulsion, generated by the backward acceleration of water according to Newton’s third law, and lift-based propulsion, produced by pressure differentials created by the angled motion of the hand relative to the flow [2]. At the relatively low velocities typical of human swimming (approximately 1.5–2.0 m/s), the contribution of lift is generally considered more limited, whereas form drag is often regarded as a predominant, though not exclusive, contributor to net thrust [3,4].
Within this framework, the propulsive effectiveness of the hand–forearm complex depends on its orientation, angle of attack, and relative velocity with respect to the surrounding water, which together determine the capacity to generate force against hydrodynamic resistance that increases nonlinearly with swimming speed [5,6,7]. Upper-limb motion induces vortex formation, facilitating momentum transfer to the water. Flow visualization and computational fluid dynamics studies have shown that stable vortical structures are associated with greater propulsive efficiency and higher forward velocities [8]. Consequently, swimming performance is highly sensitive to even minor neuromuscular or kinematic disturbances, which can markedly alter the fluid–mechanical behavior of the stroke [9].
Beyond instantaneous force generation, swimming performance also depends on the capacity to sustain effective propulsion as the race progresses [10]. As fatigue develops, the vulnerability of the propulsion system becomes particularly evident. Swimmers progressively lose the ability to generate and effectively direct propulsive force [11,12,13]. This decline is accompanied by a reorganization of muscle activation, characterized by a reduced contribution of primary propulsive muscles, such as the latissimus dorsi and triceps brachii, and an increased recruitment of synergistic and stabilizing muscles, including the pectoralis major, deltoid, and trapezius [14,15].
From a technical perspective, fatigue-related adaptations include reductions in stroke length, a shortening of the propulsive phase, and alterations in inter-limb coordination [16,17]. Although these adjustments may initially compensate for declining force output, their effectiveness decreases with continued effort, leading to increased variability, asymmetry, and reduced efficiency [13,18,19].
Despite its central role in swimming performance, quantifying propulsive force remains challenging because propulsion is generated through distributed and unsteady pressure fields rather than against fixed reaction surfaces. Early approaches, such as active drag estimation and tethered swimming, provided indirect indices of propulsion but substantially altered natural stroke mechanics [10,20,21]. The introduction of hand-mounted pressure sensors enabled more ecological assessments of propulsion during free swimming by quantifying pressure differences between the palmar and dorsal surfaces of the hand [22]. Subsequent differential pressure systems implemented through instrumented mini-paddles allowed the estimation of net thrust during the underwater arm action without constraining movement [23]. More recently, wearable platforms integrating pressure sensors and inertial measurements have provided synchronized information on propulsive force and limb kinematics under fully ecological conditions [24,25]. However, the continuous, phase-resolved assessment of propulsive force during progressive and controlled fatigue conditions remains limited.
From a biomechanical standpoint, the front crawl stroke is inherently phase dependent [26]. The early underwater action—encompassing entry, catch, and pull—is primarily associated with water engagement and force development, whereas the push phase contributes substantially to forward impulse and final body acceleration [27,28]. Fatigue-related impairments may therefore emerge preferentially in phases characterized by higher force demands and sustained muscle activation. However, most previous studies have relied on cycle-averaged or peak propulsion measures, limiting the ability to detect phase-specific deterioration and to distinguish between reductions in force magnitude and alterations in stroke coordination.
A further challenge lies in separating fatigue-induced mechanical decline from voluntary pacing strategies. When swimmers self-select speed, changes in propulsion and stroke mechanics may reflect conscious adjustments rather than true neuromuscular limitations. Constant-speed protocols address this limitation by constraining velocity and forcing mechanical adaptations as fatigue accumulates, thereby revealing the temporal evolution of propulsive capacity [29].
In light of these considerations, the present study investigated the evolution of upper-limb propulsive force and bilateral coordination during a front crawl protocol performed to exhaustion at a constant, visually controlled speed. Using wearable pressure-sensing mini-paddles synchronized with high-speed video, we analyzed stroke-cycle–resolved force variables across the test duration, with particular emphasis on phase-dependent responses of the entry–catch–pull and push phases, to determine whether fatigue-related performance decline is driven primarily by impaired coordination or by a selective reduction in force-generating capacity.
2. Materials and Methods
2.1. Study Design
This study followed a prospective observational design. After a personalized warm-up, each swimmer performed a 200 m front crawl maximal test (Test A) in a 50 m pool (water temperature ≈ 27.5 °C). The test was conducted at the same time of day and with the same experimental setup as the subsequent test, but without activating the measurement devices. The trial started from a water start, without diving. At the end of the test, blood lactate concentration and perceived exertion were recorded.
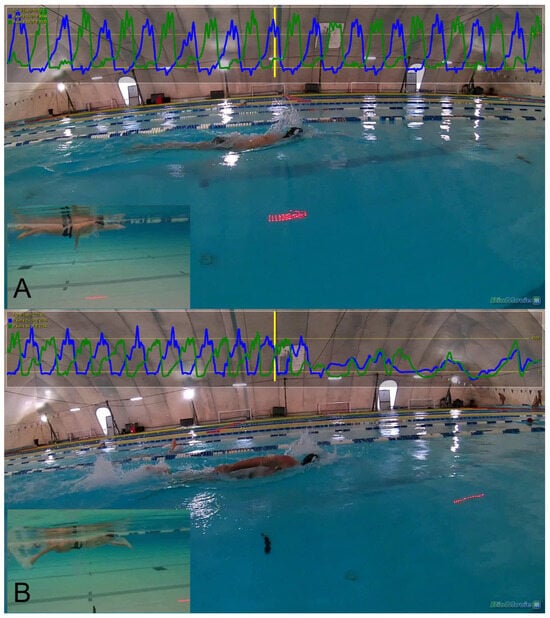
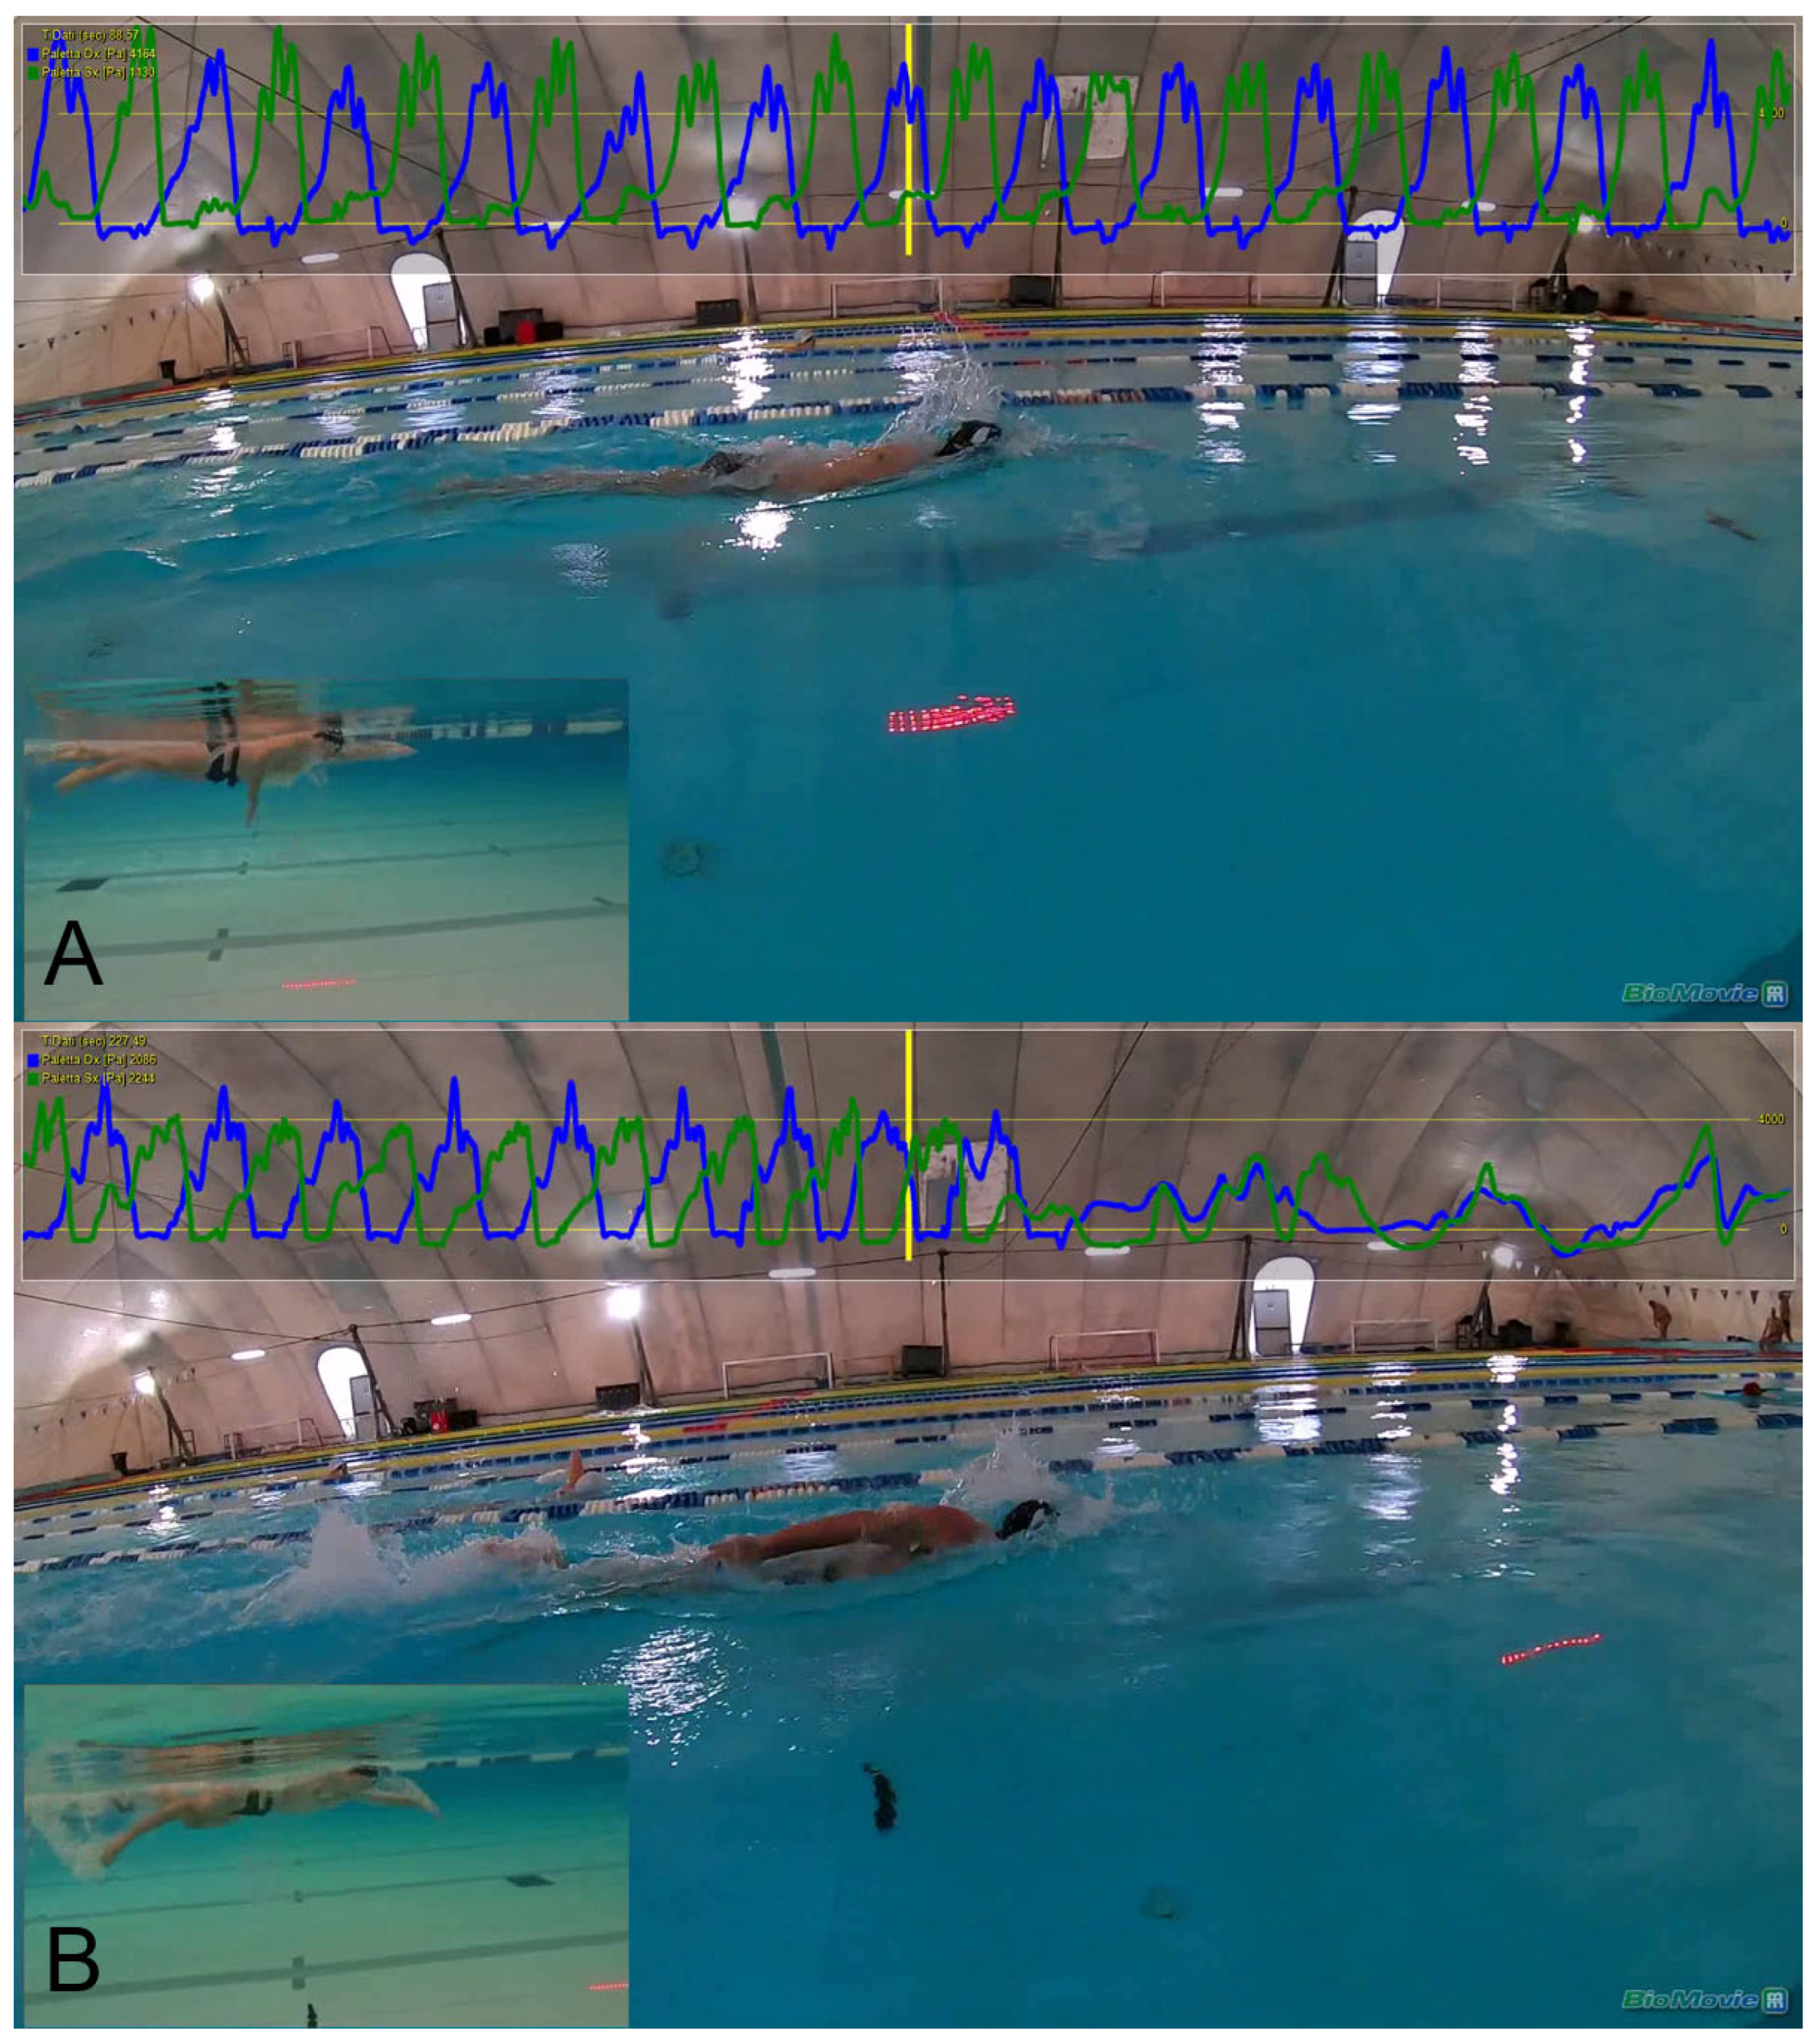
One week later, the swimmers performed a second test (Test B) in which they aimed to cover the greatest possible distance while maintaining 95% of the average speed recorded in Test A. To help them maintain the target speed, the swimmers were given a visual guidance system using LEDs (Virtual Swim Trainer, Turin, Italy), which was positioned at the bottom of the pool. The test ended when the LED moved approximately 1 m ahead of the swimmer’s head, indicating that they were unable to maintain the required pace (see Figure 1). To avoid premature termination due to transient fluctuations, this condition had to be maintained for at least two consecutive stroke cycles by all participants. The exact distance between the swimmer’s head and the LED (approximately 1 m) was subsequently determined using synchronized video analysis (see Section 2.4).
Figure 1.
Panel (A) shows the swimmer during the initial meters of the task, captured from both aerial and underwater views. In this early phase, the athlete is able to keep the LED light aligned perpendicularly with the head, as required by the task. Panel (B) shows the athlete after approximately 200 m, approaching the point of stopping, as they are no longer able to maintain the target speed: the LED is now about one meter ahead of the head. The force curves represent the temporal profile of the propulsive output: blue lines correspond to the right arm, green lines to the left arm, and the yellow line indicates the time synchronized with the video footage.
Blood lactate and perceived exertion were recorded again at the end of Test B.
2.2. Participants
Participants were competitive middle- and long-distance swimmers with at least three years of national-level experience, all affiliated with Superba, one of the leading swimming clubs in the Liguria region (Italy). Exclusion criteria included recent musculoskeletal injuries and inability to provide informed consent. Twelve swimmers met the inclusion criteria and were recruited (2 females, 10 males; age 19.4 ± 4.4 years; height 177.8 ± 8.3 cm; body mass 69.2 ± 8.3 kg).
All participants were right-handed and exhibited a preferential unilateral breathing pattern on the right side, breathing every stroke cycle. Competitive level was confirmed by a mean World Aquatics Points score of 728.5 ± 54.4, calculated from each athlete’s best performances in middle- and long-distance events. Mean weekly in-water training volume was 55.5 ± 9.4 km.
The study was conducted in accordance with the Declaration of Helsinki and approved by the local ethics committee (Comitato Etico per la Ricerca di Ateneo—CERA, University of Genoa, Italy; approval no. 2024/62, 12 June 2024). Written informed consent was obtained from all participants and, in the case of minors, from their legal guardians. All data were collected between July 2024 and August 2025.
2.3. Instrumentation and Data Acquisition
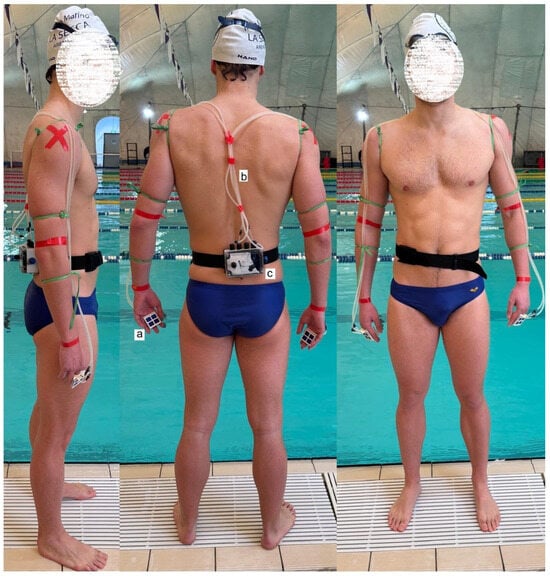
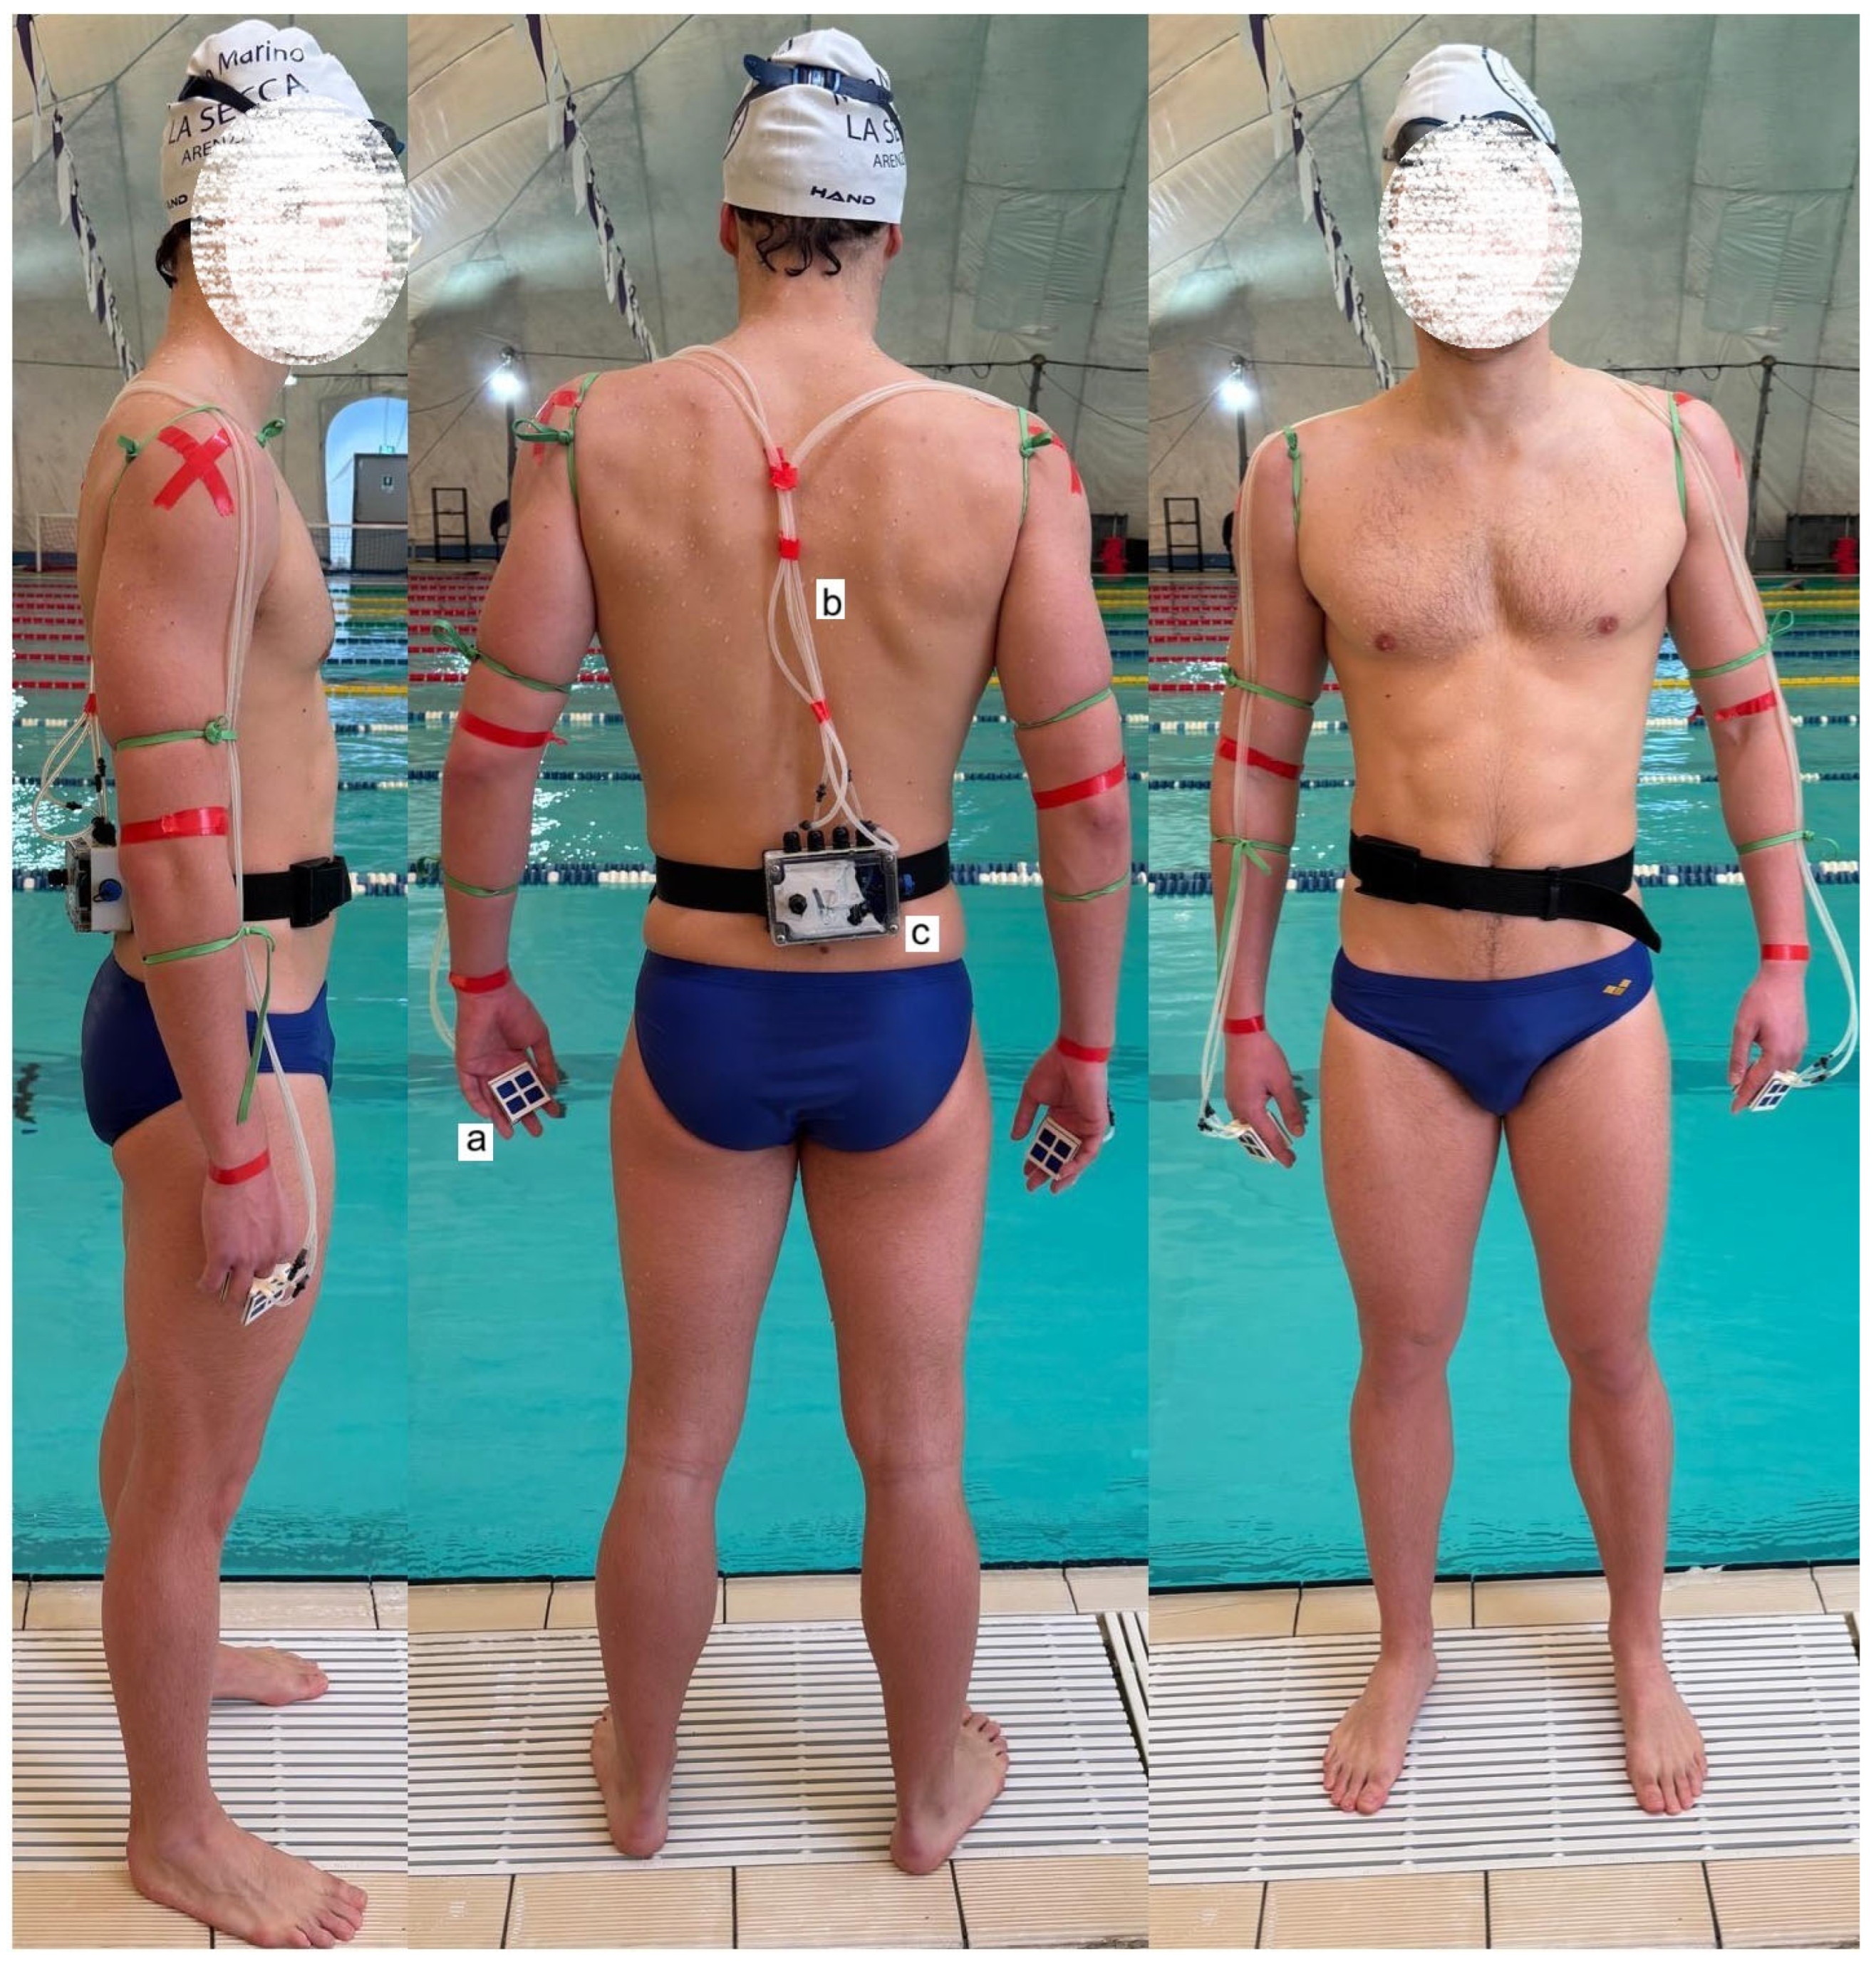
Upper-limb propulsive force was assessed using the KZ+ system (APLab, Rome, Italy), consisting of two specially designed paddles worn on the hands (for technical details of the system, see [24]. The paddles cover the metacarpals and phalanges and are secured by a central aperture positioned at the middle finger. Each paddle is equipped with a differential pressure sensor measuring the pressure difference between the palmar and dorsal surfaces of the hand, providing a pressure-derived proxy of propulsive force, corresponding to the resultant pressure field acting on the hand. Hydrostatic pressure, acting equally on both sides of the hand, is inherently removed by the differential measurement. Similar differential pressure-based systems have been previously used and validated for the assessment of stroke propulsion in ecological swimming conditions [23]. No direct conversion to absolute force units (N) was performed. Therefore, all variables are expressed as relative, within-subject changes over time rather than absolute force values.
The paddles were connected to an electronic acquisition unit housed in a waist-mounted box with neutral buoyancy via small silicone tubes transmitting pressure signals sampled at 100 Hz. To avoid interference with natural swimming mechanics, the tubes were routed along the arms and shoulders and secured using adhesive insulating tape (Figure 2).
Figure 2.
The differential pressure signal is measured by the paddle (a), transmitted through the silicon tube (b) and processed in the waterproof box (c).
2.4. Video Synchronization
The BioMovie software application (v. PRO; Infolabmedia, Turin, Italy) was used to integrate mobile high-resolution video acquisition with wearable sensor data. Two synchronized Full HD cameras (one underwater and one above water), recording at 100 fps, were mounted on a custom trolley manually operated along the poolside. Synchronization between video and pressure signals was achieved using a manual visual trigger consisting of a brief tap on the paddle membrane, clearly visible in the video and identifiable in the pressure signal, ensuring precise spatiotemporal alignment of kinetic and kinematic data.
The synchronized video recordings were also used to determine the exact relative position between the swimmer and the LED pacer during Test B, allowing precise identification of the threshold distance (1 m) used as the stopping criterion.
2.5. Physiological Measurements
Blood lactate concentration was measured using a validated portable analyzer (Lactate Pro 2, Arkray, Japan) from capillary blood samples collected from the earlobe within 1–3 min after each test and expressed in mmol·L−1 [30]. Perceived exertion was assessed immediately after each test using the 6–20 Rating of Perceived Exertion (RPE) scale [31].
2.6. Pre- and Post-Test Calibration Procedure
Immediately before and after each trial, a calibration procedure was performed to verify sensor stability following prolonged immersion and repeated mechanical stress. With the swimmer out of the water, both paddles were rigidly fixed to a horizontal support bar and immersed vertically in the pool. Only the tubes supplying the palmar pressure signal were left connected, while the tubes from the back of the hand were disconnected, leaving atmospheric pressure act on the sensors. The system was lowered in 10 cm increments from the surface to increasing depths. At each depth, paddles were held stationary to allow signal stabilization, after which pressure values were recorded and averaged, generating reference levels corresponding to increasing hydrostatic loads with respect to atmospheric pressure (See Supplementary Figure S1). Since all variables were analyzed in normalized units, this calibration procedure was not intended for absolute scaling, but rather to verify signal linearity and assess potential drift or hysteresis of the sensors. The difference in measured pressure before and after the test was negligible, showing that the membranes on the paddles did not experience any permanent deformation or hysteresis.
2.7. Stroke Selection and Time Normalization
For each swimmer, three representative stroke cycles were selected at each of the ten standardized time points (10–100% of total trial duration). Stroke selection was performed using synchronized video recordings (see Section 2.4), allowing frame-by-frame identification of stroke boundaries. Strokes near turns, the first stroke after each lap, and phases influenced by underwater glide were excluded to ensure consistent and comparable conditions across time points.
Three consecutive stroke cycles were selected within the central portion of each time window to provide a stable and representative estimate of the force–time profile while minimizing stroke-to-stroke variability.
Each stroke was time-normalized over 101 equidistant points (0–100% of the stroke cycle). The three force–time curves were averaged to obtain a representative stroke profile for each swimmer and time point, denoted as F^i(x).
Because analyses focused on temporal evolution and waveform shape, force values were retained in arbitrary units, as analyses focused on relative within-subject temporal changes rather than absolute force magnitude. Accordingly, all force-related variables should be interpreted as pressure-derived proxies rather than direct measurements of force.
2.8. Stroke-Phase Definition
The normalized stroke cycle was divided into two equal temporal windows, i.e., first half (0–50%) and second half (50–100%), used as standardized proxies for early and late underwater propulsion. In front crawl terminology, the first half corresponds to entry, catch, and pull phases, whereas the second half corresponds to the push phase. The correspondence between these temporal windows and visually identifiable stroke sub-phases was qualitatively verified using synchronized video recordings.
2.9. Extracted Variables
From each mean force–time curve (See Supplementary Figure S2), the following variables were computed:
2.9.1. Total Area Under the Curve
Represents the normalized impulse applied during the entire stroke cycle and provides a global indicator of propulsive output:
where Δx = 1 is the constant computing step. This variable provides a global indicator of stroke propulsive output.
2.9.2. Area of the First and Second Halves
These variables quantify the partial impulse produced during the first and second halves of the stroke cycle:
2.9.3. Peak Force
The maximum instantaneous force applied during the stroke:
where F^i is the vector of sampled force values at time point i.
2.9.4. Peak Index
The temporal location of the peak force within the stroke cycle, expressed as an index:
This variable indicates whether peak force application shifts earlier or later with fatigue.
2.9.5. Mean Force
The mean force applied throughout the stroke duration:
This serves as a general measure of stroke intensity.
Although mean force and total area under the curve are mathematically related due to time normalization, they were retained as complementary descriptors of propulsive output. Specifically, total area under the curve reflects the overall propulsive impulse generated during the stroke cycle, whereas mean force represents the average force level sustained throughout the movement. This distinction allows differentiation between cumulative force production and its temporal distribution across the stroke.
2.9.6. Force Centroid
The temporal center of mass of the applied force:
It summarizes the mean timing of force application, independent of magnitude.
2.9.7. Asymmetry Index
Quantifies the relative imbalance between the first and second halves of the stroke:
Positive values indicate greater force in the second half, while negative values suggest early effort concentration.
2.9.8. Stroke Frequency
Stroke frequency was estimated over three consecutive stroke cycles for each time point.
2.9.9. Stroke Efficiency Index
At each time point (10–100% of trial duration), stroke efficiency was defined as the ratio between the imposed swimming speed and the stroke frequency. The index was computed using the following formula:
This index provides an estimate of the effectiveness with which swimmers convert their cyclic upper-limb actions into forward displacement and was used as a functional indicator of stroke efficiency across the trial.
2.10. Statistical Analysis
All statistical analyses were performed using R software (version 4.5.1, R Foundation for Statistical Computing, Vienna, Austria). For each swimmer, force- and stroke-related variables were averaged across three representative cycles at each of ten standardized time points (10% to 100% of trial duration), resulting in one aggregated value per variable per time point. To evaluate the effects of fatigue across the test duration, repeated-measures analyses of variance (ANOVA) were conducted using the afex and ez packages, with “time” (10 levels) as the within-subject factor. For bilateral variables (e.g., propulsive force in right and left arms), two-way repeated-measures ANOVAs were applied with “time” and “side” (right vs. left) as within-subject factors. Where assumptions of sphericity were violated (as assessed via Mauchly’s test), Greenhouse–Geisser corrections were applied. Post hoc pairwise comparisons were conducted using Bonferroni-adjusted emmeans. For all outcome variables, 95% confidence intervals were computed for pairwise comparisons to provide an estimate of the precision of the observed effects. Effect sizes for repeated-measures ANOVA were reported as partial eta squared (η2p), interpreted according to conventional benchmarks: small (0.01), medium (0.06), and large (0.14) (Lakens). Blood lactate concentration and RPE, measured once per condition (Test A and Test B), were compared using paired-samples t-tests. Spearman’s correlation coefficients were calculated to explore associations between stroke frequency, stroke efficiency, and selected force metrics. For this analysis, all variables were averaged across the ten standardized time points for each participant, and correlations were computed at the participant level. Correlation strength was classified as weak (|r| < 0.3), moderate (0.3 ≤ |r| < 0.5), or strong (|r| ≥ 0.5). A two-tailed significance threshold of p < 0.05 was adopted. Data visualization, including boxplots, time-course graphs, and heat maps, was performed using ggplot2, ggpubr, and pheatmap packages to enhance interpretability of results. A sensitivity power analysis was conducted using G*Power v. 3.1.9.7 (repeated-measures ANOVA, within factors; 10 measurements; α = 0.05; power = 0.80) [32]. Assuming a conservative correlation among repeated measures (ρ = 0.50) and a nonsphericity correction (ε = 0.75), the available sample size (n = 12) was sufficient to detect a minimum within-subject effect size of Cohen’s f = 0.29, corresponding to η2p ≈ 0.08.
3. Results
3.1. Blood Lactate and Perceived Exertion
No statistically significant differences were found between the first (Test A) and second trial (Test B) for either blood lactate concentration or RPE. Mean lactate values were 12.0 ± 3.5 mmol/L in Test A and 11.6 ± 1.6 mmol/L in Test B (t(11) = 0.97, p = 0.355). Mean RPE values were 17.6 ± 0.5 in Test A and 18.4 ± 1.1 in Test B (t(11) = −1.39, p = 0.191), indicating consistent physiological and perceptual responses across the two efforts.
In Test B, the distance covered was 206.67 ± 48.91 m at a velocity of 1.45 ± 0.08 m/s, corresponding to approximately 95% of the mean velocity recorded in Test A, confirming a comparable intensity of effort despite the absence of significant differences in physiological and subjective markers.
3.2. Qualitative Analysis of Force–Time Profiles
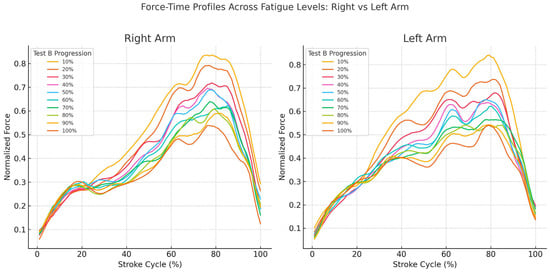
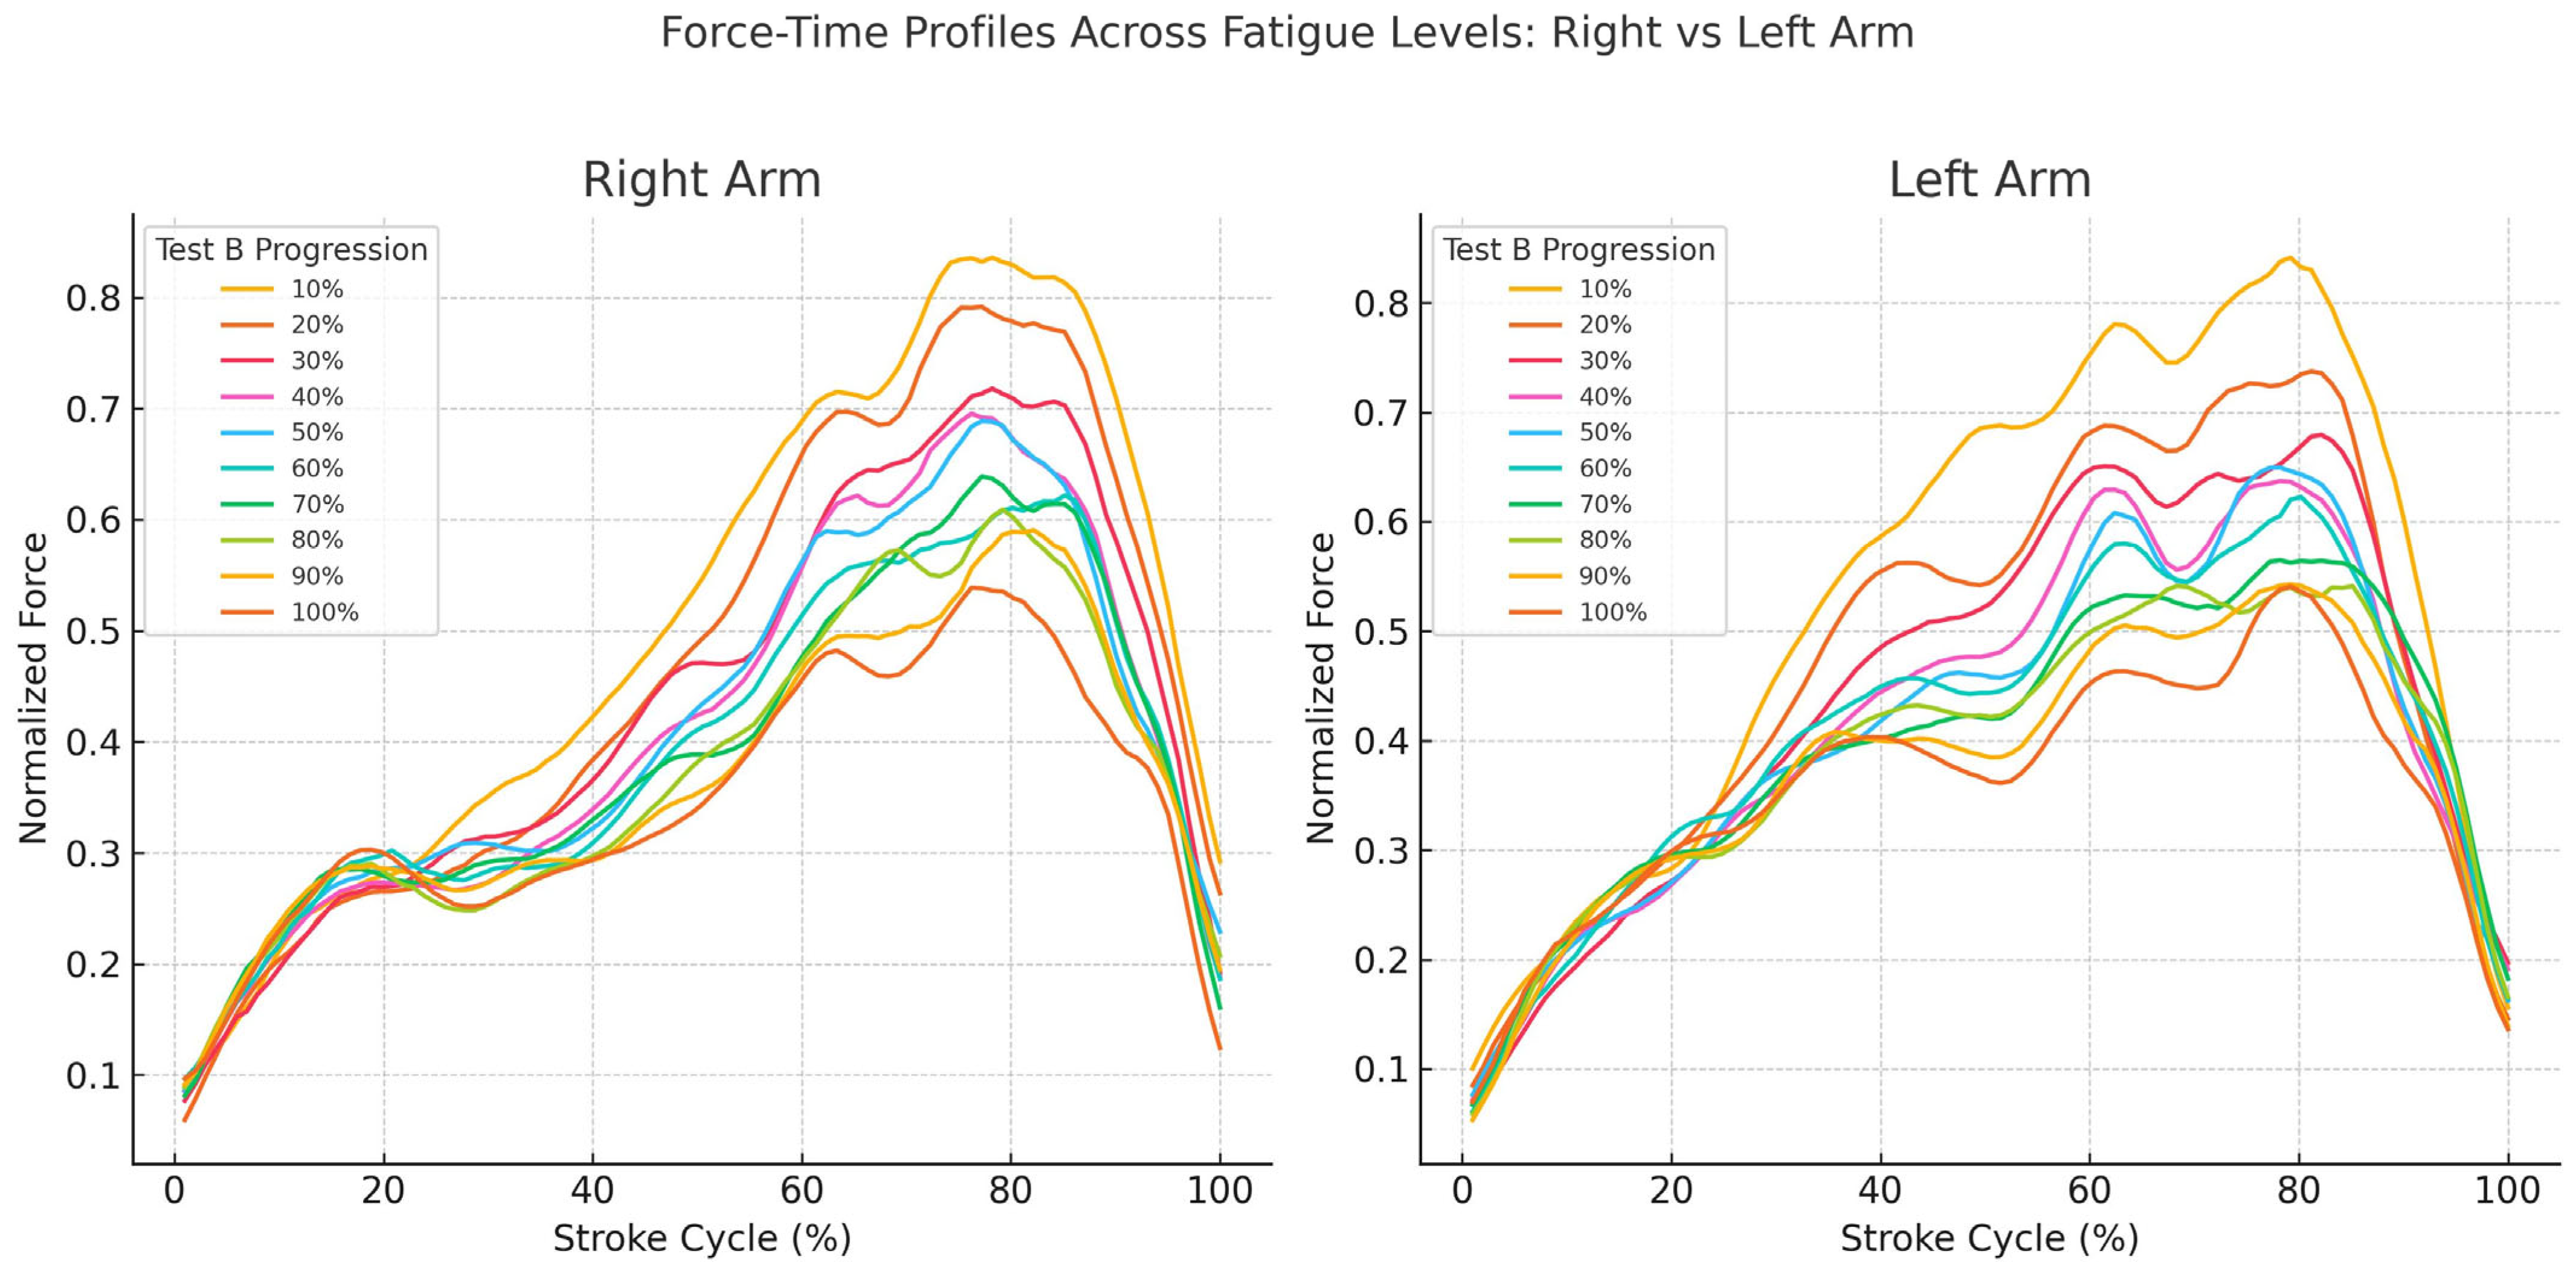
Figure 3 displays the normalized force–time profiles across the stroke cycle (0–100%) for the right and left arms at each stage of Test B progression, from 10% to 100%. In both limbs, the shape of the curves remained consistent throughout the test, with a single peak occurring in the latter part of the cycle and a comparable force distribution pattern across all conditions.
Figure 3.
Force–time profiles for the right and left arms across the progression of Test B. Normalized force curves are plotted over the stroke cycle (0–100%) for both the right arm (left panel) and the left arm (right panel). Each line represents the mean force profile at a specific percentage of Test B progression (from 10% to 100%), as indicated in the legend. The vertical axis shows normalized force values, while the horizontal axis represents the relative time within the stroke cycle.
For the right arm, the force profile showed a gradual increase during the first half of the stroke (pull phase), followed by a clear peak around 75% of the cycle (initial push phase) and a subsequent decline (terminal push phase). The same temporal pattern was observed for the left arm, with minor variations in the steepness and height of the peak across test stages.
Despite the decrease in force amplitude with test progression, no visible alterations in the timing of force onset, peak, or offset were observed in either arm. The profiles maintained their general morphology across all percentages, suggesting a consistent temporal organization of force application throughout Test B.
Post hoc comparisons are reported with reference to the 10% condition as a reference. Full statistical details are provided in the Supplementary Table (Supplementary Table S1).
3.3. Total Area Under the Curve
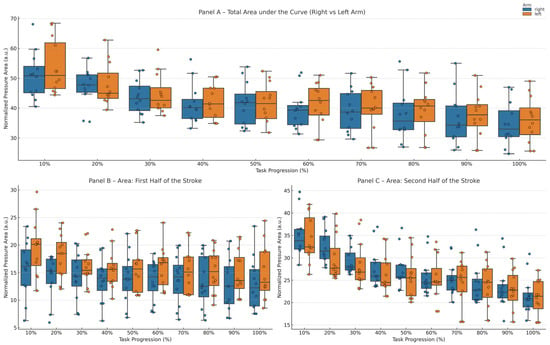
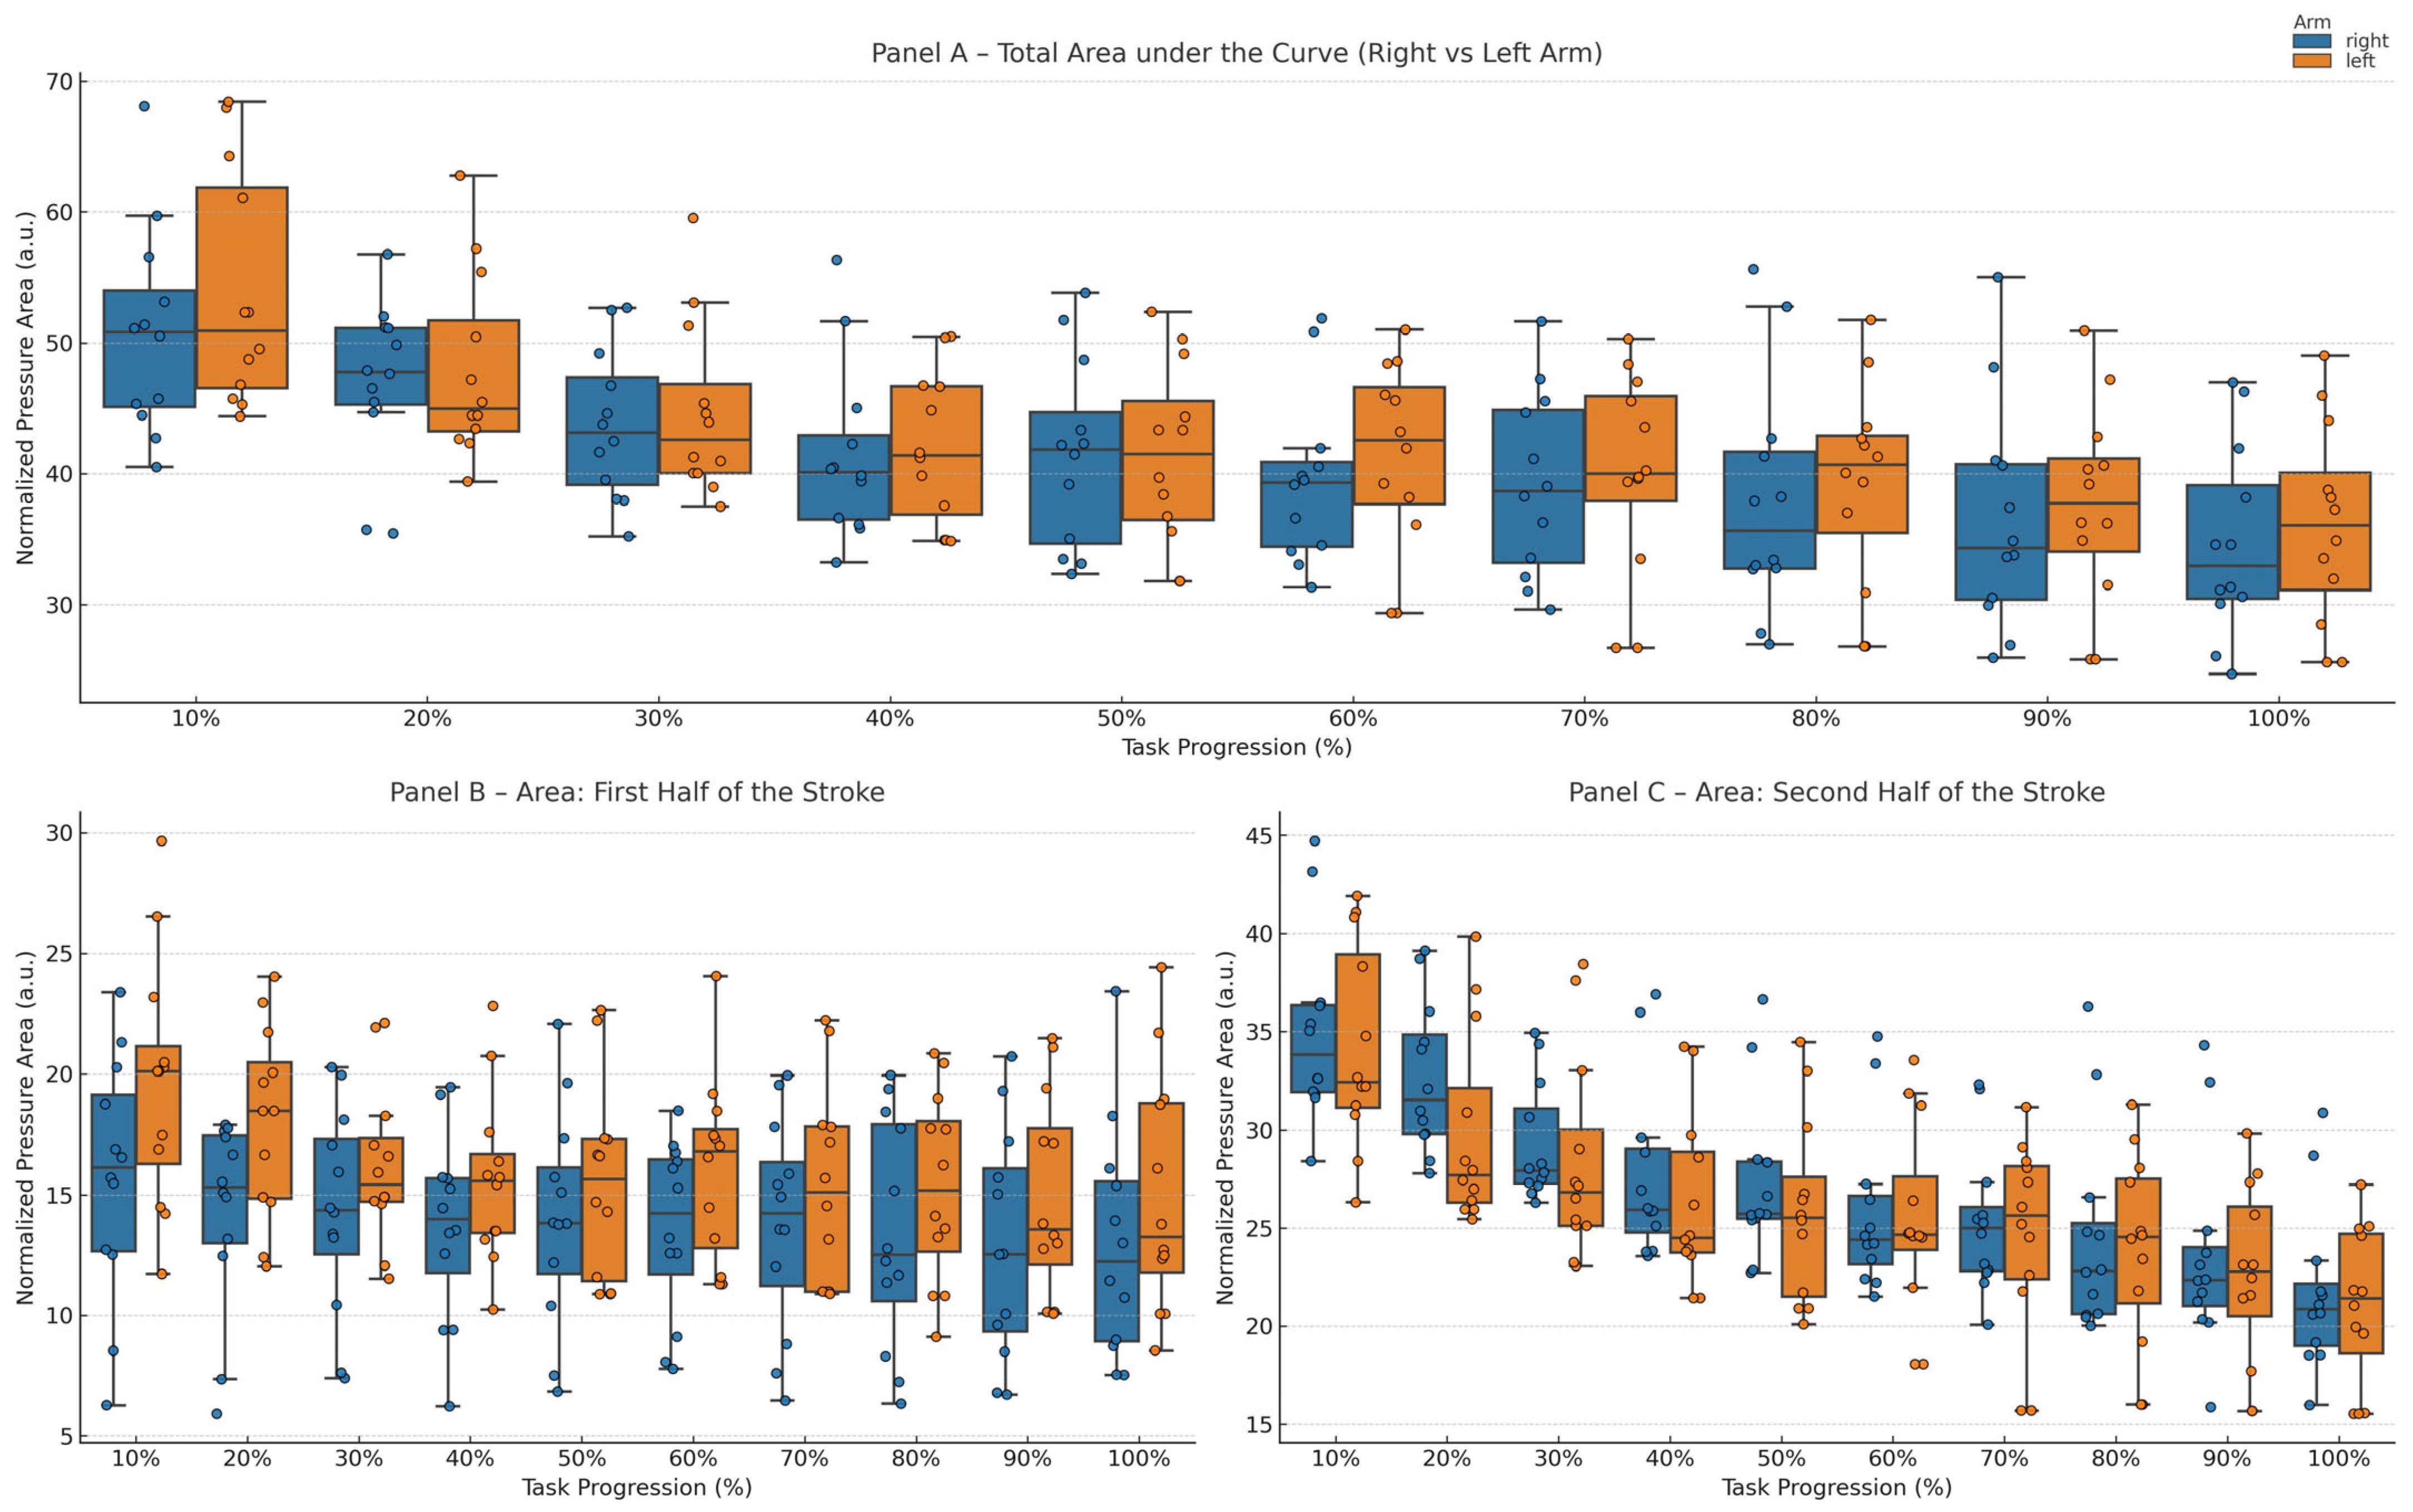
Total propulsive impulse across the trial is shown in Figure 4A. A significant main effect of time was observed in both the right (F(9,99) = 23.3, p < 0.001, η2p = 0.68) and left arm (F(9,99) = 22.7, p < 0.001, η2p = 0.66). Post hoc analysis revealed that, in the right arm, no differences were observed at 20%, whereas significant decreases emerged from 30% of test duration onward (p = 0.036; 95% CI [3.66, 10.48]) and persisted until exhaustion, with the largest difference observed at 100% (p < 0.001; 95% CI [11.34, 20.80]). In the left arm, reductions became statistically significant slightly later, from 40% onward (p = 0.008; 95% CI [7.20, 16.60]), and remained significant at all subsequent time points (all p ≤ 0.026), with the largest difference observed at exhaustion (100%: p = 0.002; 95% CI [11.70, 23.88]). No significant main effect of side (F(1,22) = 0.20, p = 0.644, η2p = 0.01) or time × side interaction (F(9,198) = 0.32, p = 0.968, η2p = 0.01) was detected.
Figure 4.
Total area under the pressure–time curve (i.e., normalized propulsive impulse) for the right and left arms across task progression. Panel (A) shows the total area under the curve computed over the entire underwater phase of the stroke. Panel (B) reports the area limited to the first half of the underwater stroke, while Panel (C) reports the area limited to the second half of the underwater stroke. Values are normalized to reduce inter-individual variability. Boxplots represent the distribution across participants at each time point (10–100% of task progression), with individual data points overlaid. The right arm is shown in blue and the left arm in orange.
3.4. Area of the First Halves
Force impulse during the first half of the stroke cycle, corresponding to the entry–catch–pull phases, is shown in Figure 4B. A significant main effect of time was observed in the left arm (F(9,99) = 5.2, p < 0.001, η2p = 0.32), whereas no significant effect was found in the right arm (F(9,99) = 1.9, p = 0.062, η2p = 0.15). No significant main effect of side (F(1,22) = 2.2, p = 0.152, η2p = 0.09) or time × side interaction (F(9,198) = 0.9, p = 0.533, η2p = 0.04) was detected. Post hoc analysis did not reveal statistically significant pairwise differences across time points in either arm (all p ≥ 0.302). Overall, these findings indicate that early underwater propulsion was relatively preserved throughout the test.
3.5. Area of the Second Halves
In contrast, force impulse during the second half of the stroke cycle (push phase) showed a clear and early decline (Figure 4C). A significant main effect of time was observed in both the right (F(9,99) = 35.0, p < 0.001, η2p = 0.76) and left arm (F(9,99) = 39.0, p < 0.001, η2p = 0.79). Post hoc analysis revealed that, in the left arm, a significant reduction was already evident at 20% of test duration (p = 0.047; 95% CI [2.19, 6.55]), with consistent decreases at all subsequent time points (all p ≤ 0.009), and progressively larger differences toward exhaustion (100%: p < 0.001; 95% CI [10.26, 16.07]). In the right arm, significant reductions emerged from 40% onward (p = 0.007; 95% CI [4.45, 10.18]) and persisted until exhaustion (all p ≤ 0.011), with progressively larger differences observed at later time points (100%: p < 0.001; 95% CI [9.98, 16.57]). No significant main effect of side (F(1,22) = 0.4, p = 0.527, η2p = 0.02) or time × side interaction (F(9,198) = 0.6, p = 0.828, η2p = 0.03) was detected. These findings identify the push phase as the primary locus of force loss, independent of limb dominance.
3.6. Peak Force
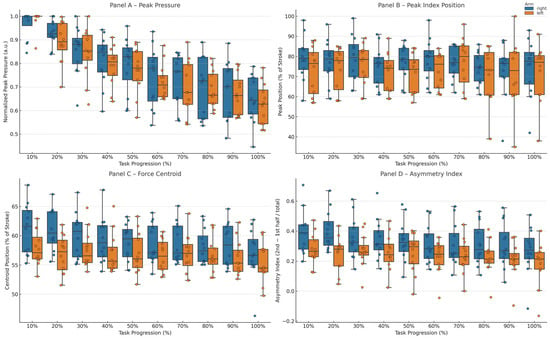
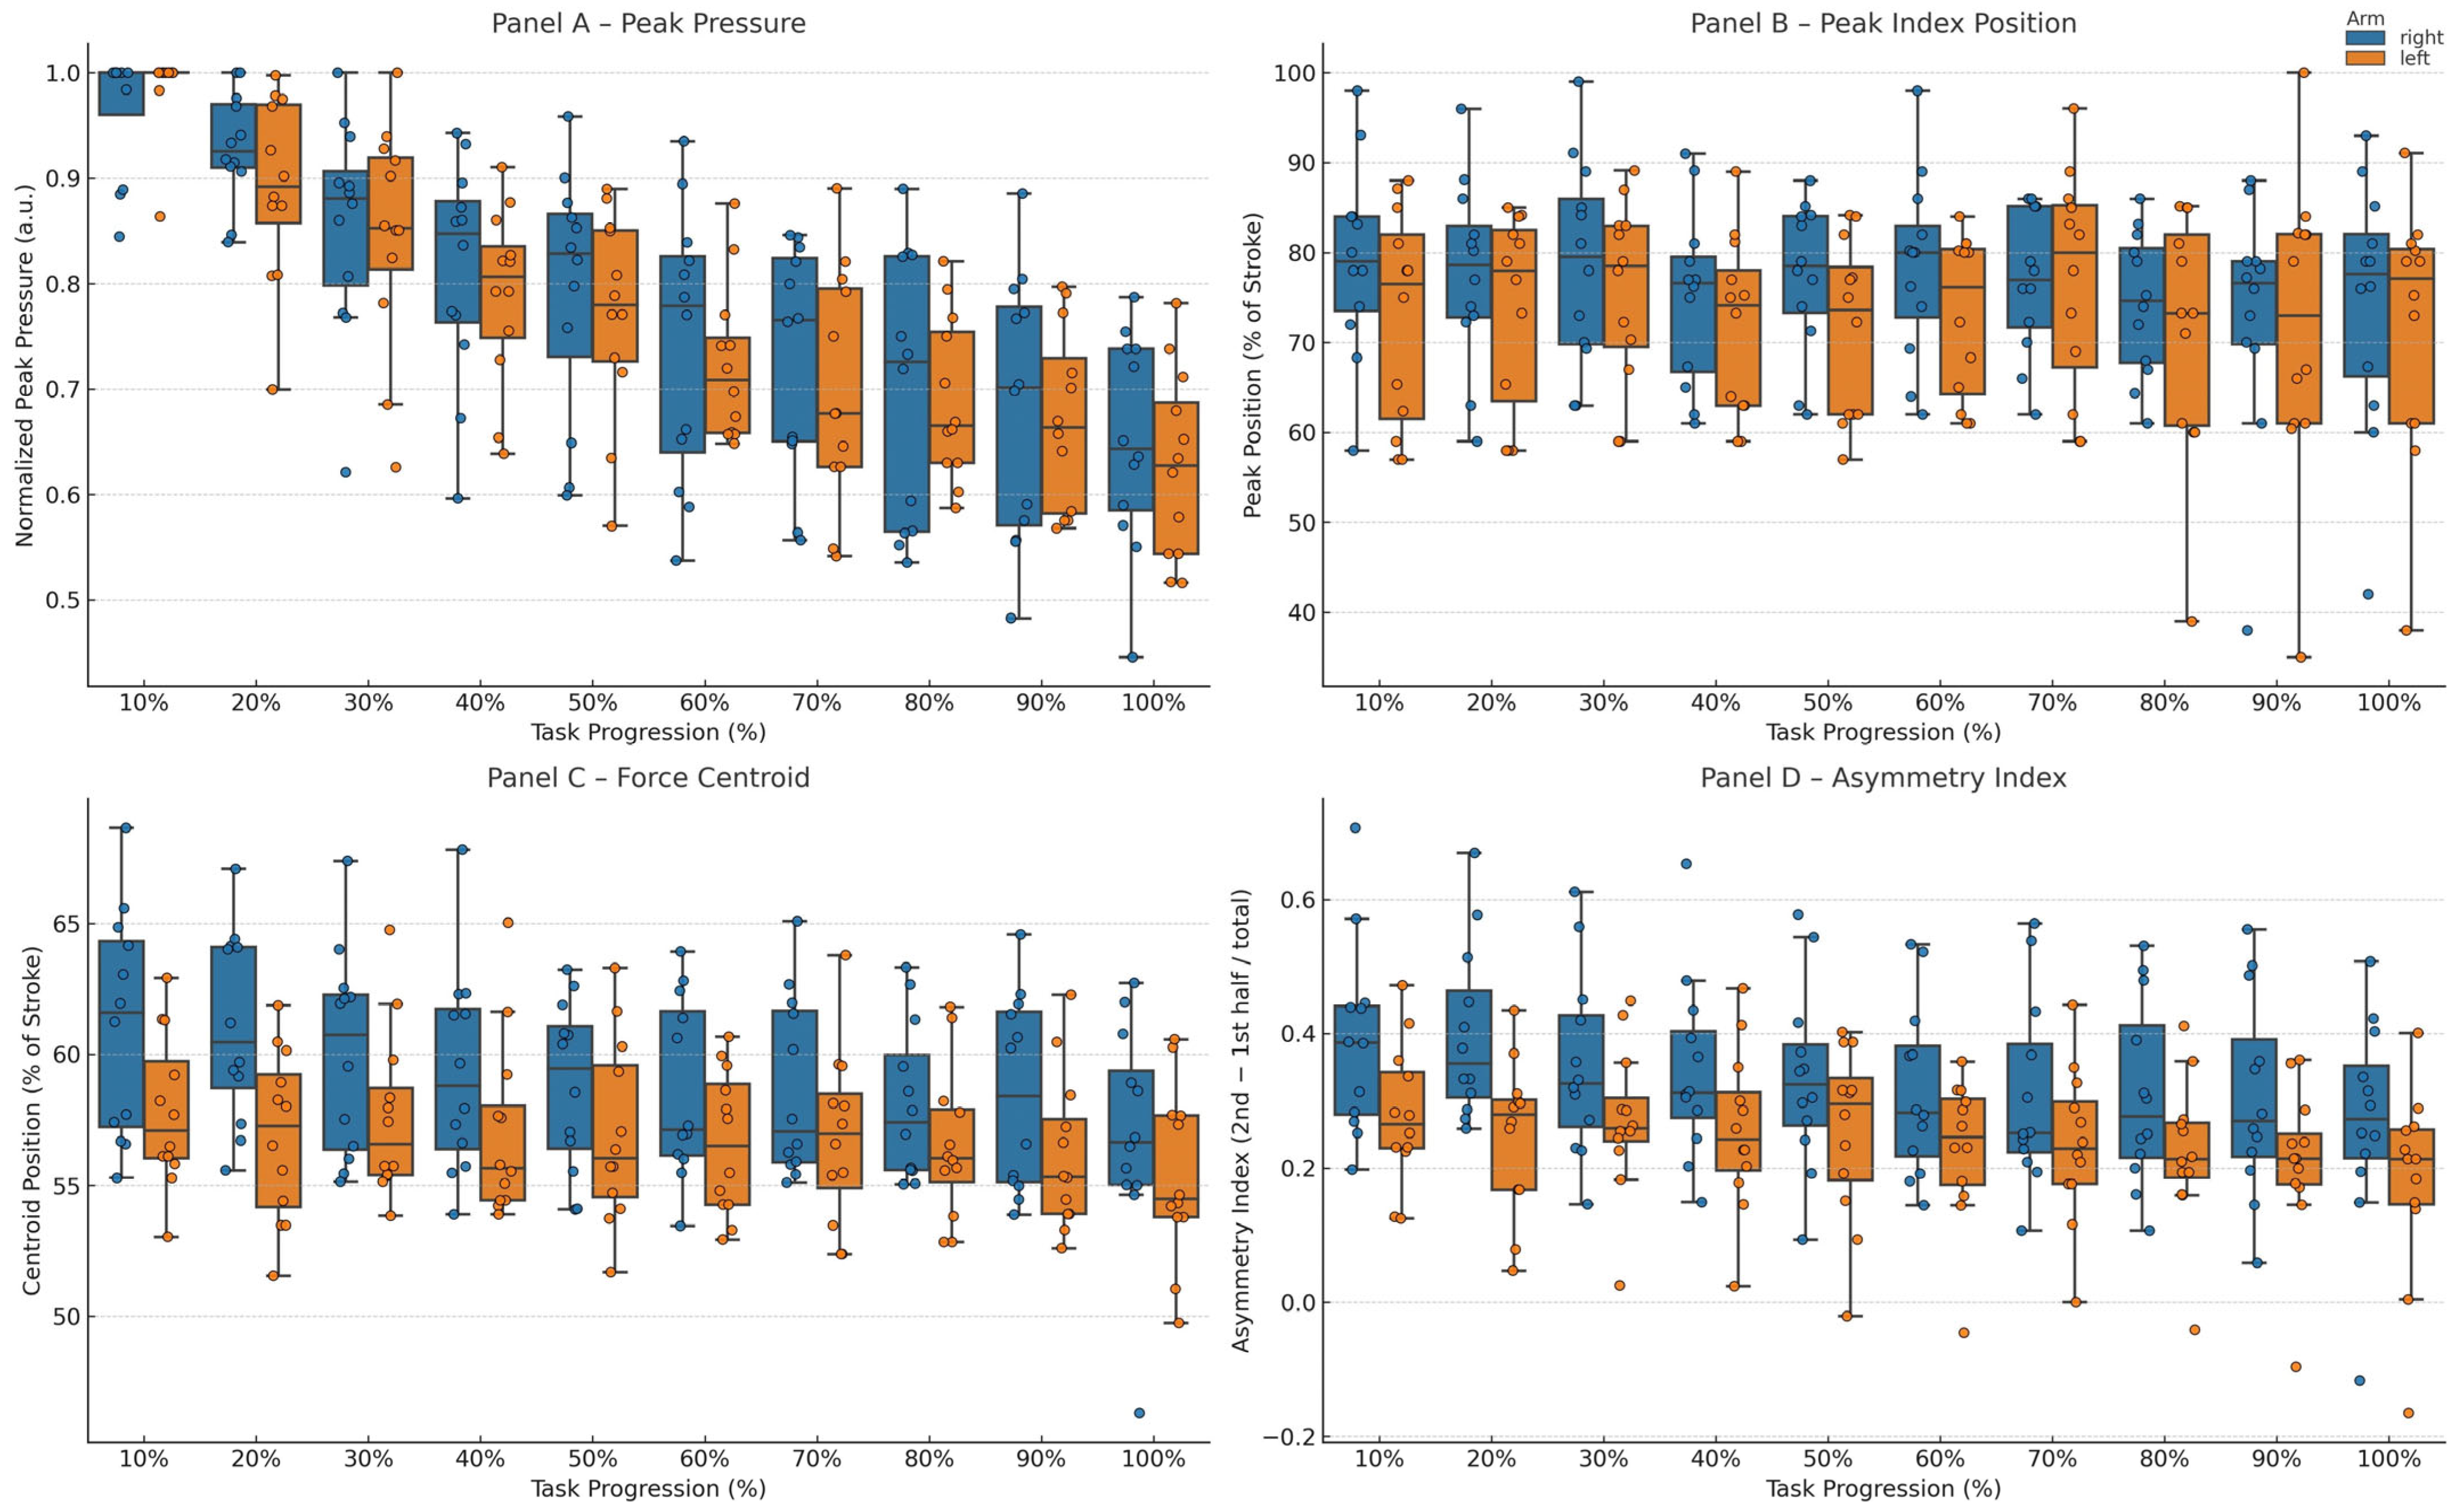
Peak force is shown in Figure 5A and declined progressively over the course of the trial. A significant main effect of time was observed in both the right (F(9,99) = 31.9, p < 0.001, η2p = 0.74) and left arm (F(9,99) = 64.0, p < 0.001, η2p = 0.86). Post hoc analysis revealed that, in the left arm, a significant reduction was detected at 30% of test duration (p = 0.043; 95% CI [0.07, 0.21]), with stronger effects from 40% onward (all p < 0.001), and progressively larger differences toward exhaustion (100%: p < 0.001; 95% CI [0.30, 0.42]). In the right arm, peak force decreased later, becoming significant from 60% onward (p = 0.010; 95% CI [0.13, 0.32]) and remaining reduced until exhaustion (all p ≤ 0.002), with the largest difference observed at 100% (p < 0.001; 95% CI [0.25, 0.38]).No significant main effect of side (F(1,22) = 0.3, p = 0.622, η2p = 0.01) or time × side interaction (F(9,198) = 0.5, p = 0.899, η2p = 0.02) was observed.
Figure 5.
Temporal and magnitude characteristics of hand pressure during the underwater phase of the stroke for the right and left arms across task progression. Panel (A) shows the normalized peak pressure. Panel (B) reports the relative position of the peak pressure within the stroke cycle (% of stroke duration). Panel (C) depicts the force centroid position (% of stroke), representing the temporal center of pressure distribution. Panel (D) shows the asymmetry index between the second and first halves of the stroke. Boxplots represent the distribution across participants at each time point (10–100% of task progression), with individual data points overlaid. The right arm is shown in blue and the left arm in orange.
3.7. Peak Index
The temporal location of peak force within the stroke cycle is shown in Figure 5B. No significant main effect of time was observed in either the right (F(9,99) = 0.9, p = 0.552, η2p = 0.08) or left arm (F(9,99) = 0.5, p = 0.841, η2p = 0.04). No significant main effect of side (F(1,22) = 1.2, p = 0.283, η2p = 0.05) or time × side interaction (F(9,198) = 0.3, p = 0.965, η2p = 0.01) was detected. Post hoc comparisons, for which p = 1.000 values corresponded to Bonferroni-adjusted results, did not reveal statistically significant differences across time points. These findings indicate that fatigue did not alter the timing of peak force application.
3.8. Mean Force
Mean force exhibited a temporal pattern closely mirroring that of total propulsive impulse. A significant main effect of time was observed in both the right (F(9,99) = 23.4, p < 0.001, η2p = 0.69) and left arm (F(9,99) = 22.7, p < 0.001, η2p = 0.68). Post hoc analysis revealed that, in the right arm, significant reductions appeared from 30% of test duration onward (p = 0.036; 95% CI [0.04, 0.10]), whereas in the left arm they emerged from 40% onward (p = 0.007; 95% CI [0.07, 0.16]). In both limbs, mean force continued to decline progressively until exhaustion, with the largest differences observed at 100% (right: p < 0.001; 95% CI [0.11, 0.21]; left: p = 0.002; 95% CI [0.12, 0.24]). No significant main effect of side (F(1,22) = 0.2, p = 0.642, η2p = 0.01) or time × side interaction (F(9,198) = 0.3, p = 0.968, η2p = 0.02) was observed, confirming a global reduction in force-generating capacity.
3.9. Force Centroid and Asymmetry Index
Force centroid and asymmetry index are shown in Figure 5C,D. A significant main effect of time was observed for the force centroid in both the right (F(9,99) = 4.4, p < 0.001, η2p = 0.40) and left arm (F(9,99) = 2.3, p = 0.024, η2p = 0.17). Similarly, a significant effect of time was found for the asymmetry index in both the right (F(9,99) = 5.0, p < 0.001, η2p = 0.31) and left arm (F(9,99) = 3.8, p < 0.001, η2p = 0.26). No significant time × side interaction was detected for either variable (centroid: F(9,198) = 1.2, p = 0.319, η2p = 0.06; asymmetry index: F(9,198) = 0.9, p = 0.539, η2p = 0.04), and no significant main effect of side was observed (centroid: F(1,22) = 3.71, p = 0.067, η2p = 0.14; asymmetry index: F(1,22) = 3.9, p = 0.062, η2p = 0.02).
Post hoc analysis did not reveal statistically significant pairwise differences across time points in either arm (all p ≥ 0.351). These findings indicate that, despite statistically detectable temporal effects, the overall temporal distribution of force within the stroke cycle and bilateral coordination remained functionally stable throughout the test.
3.10. Stroke Frequency
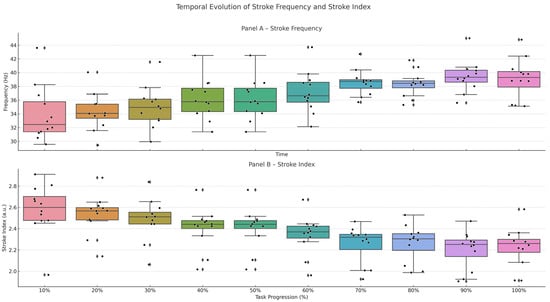
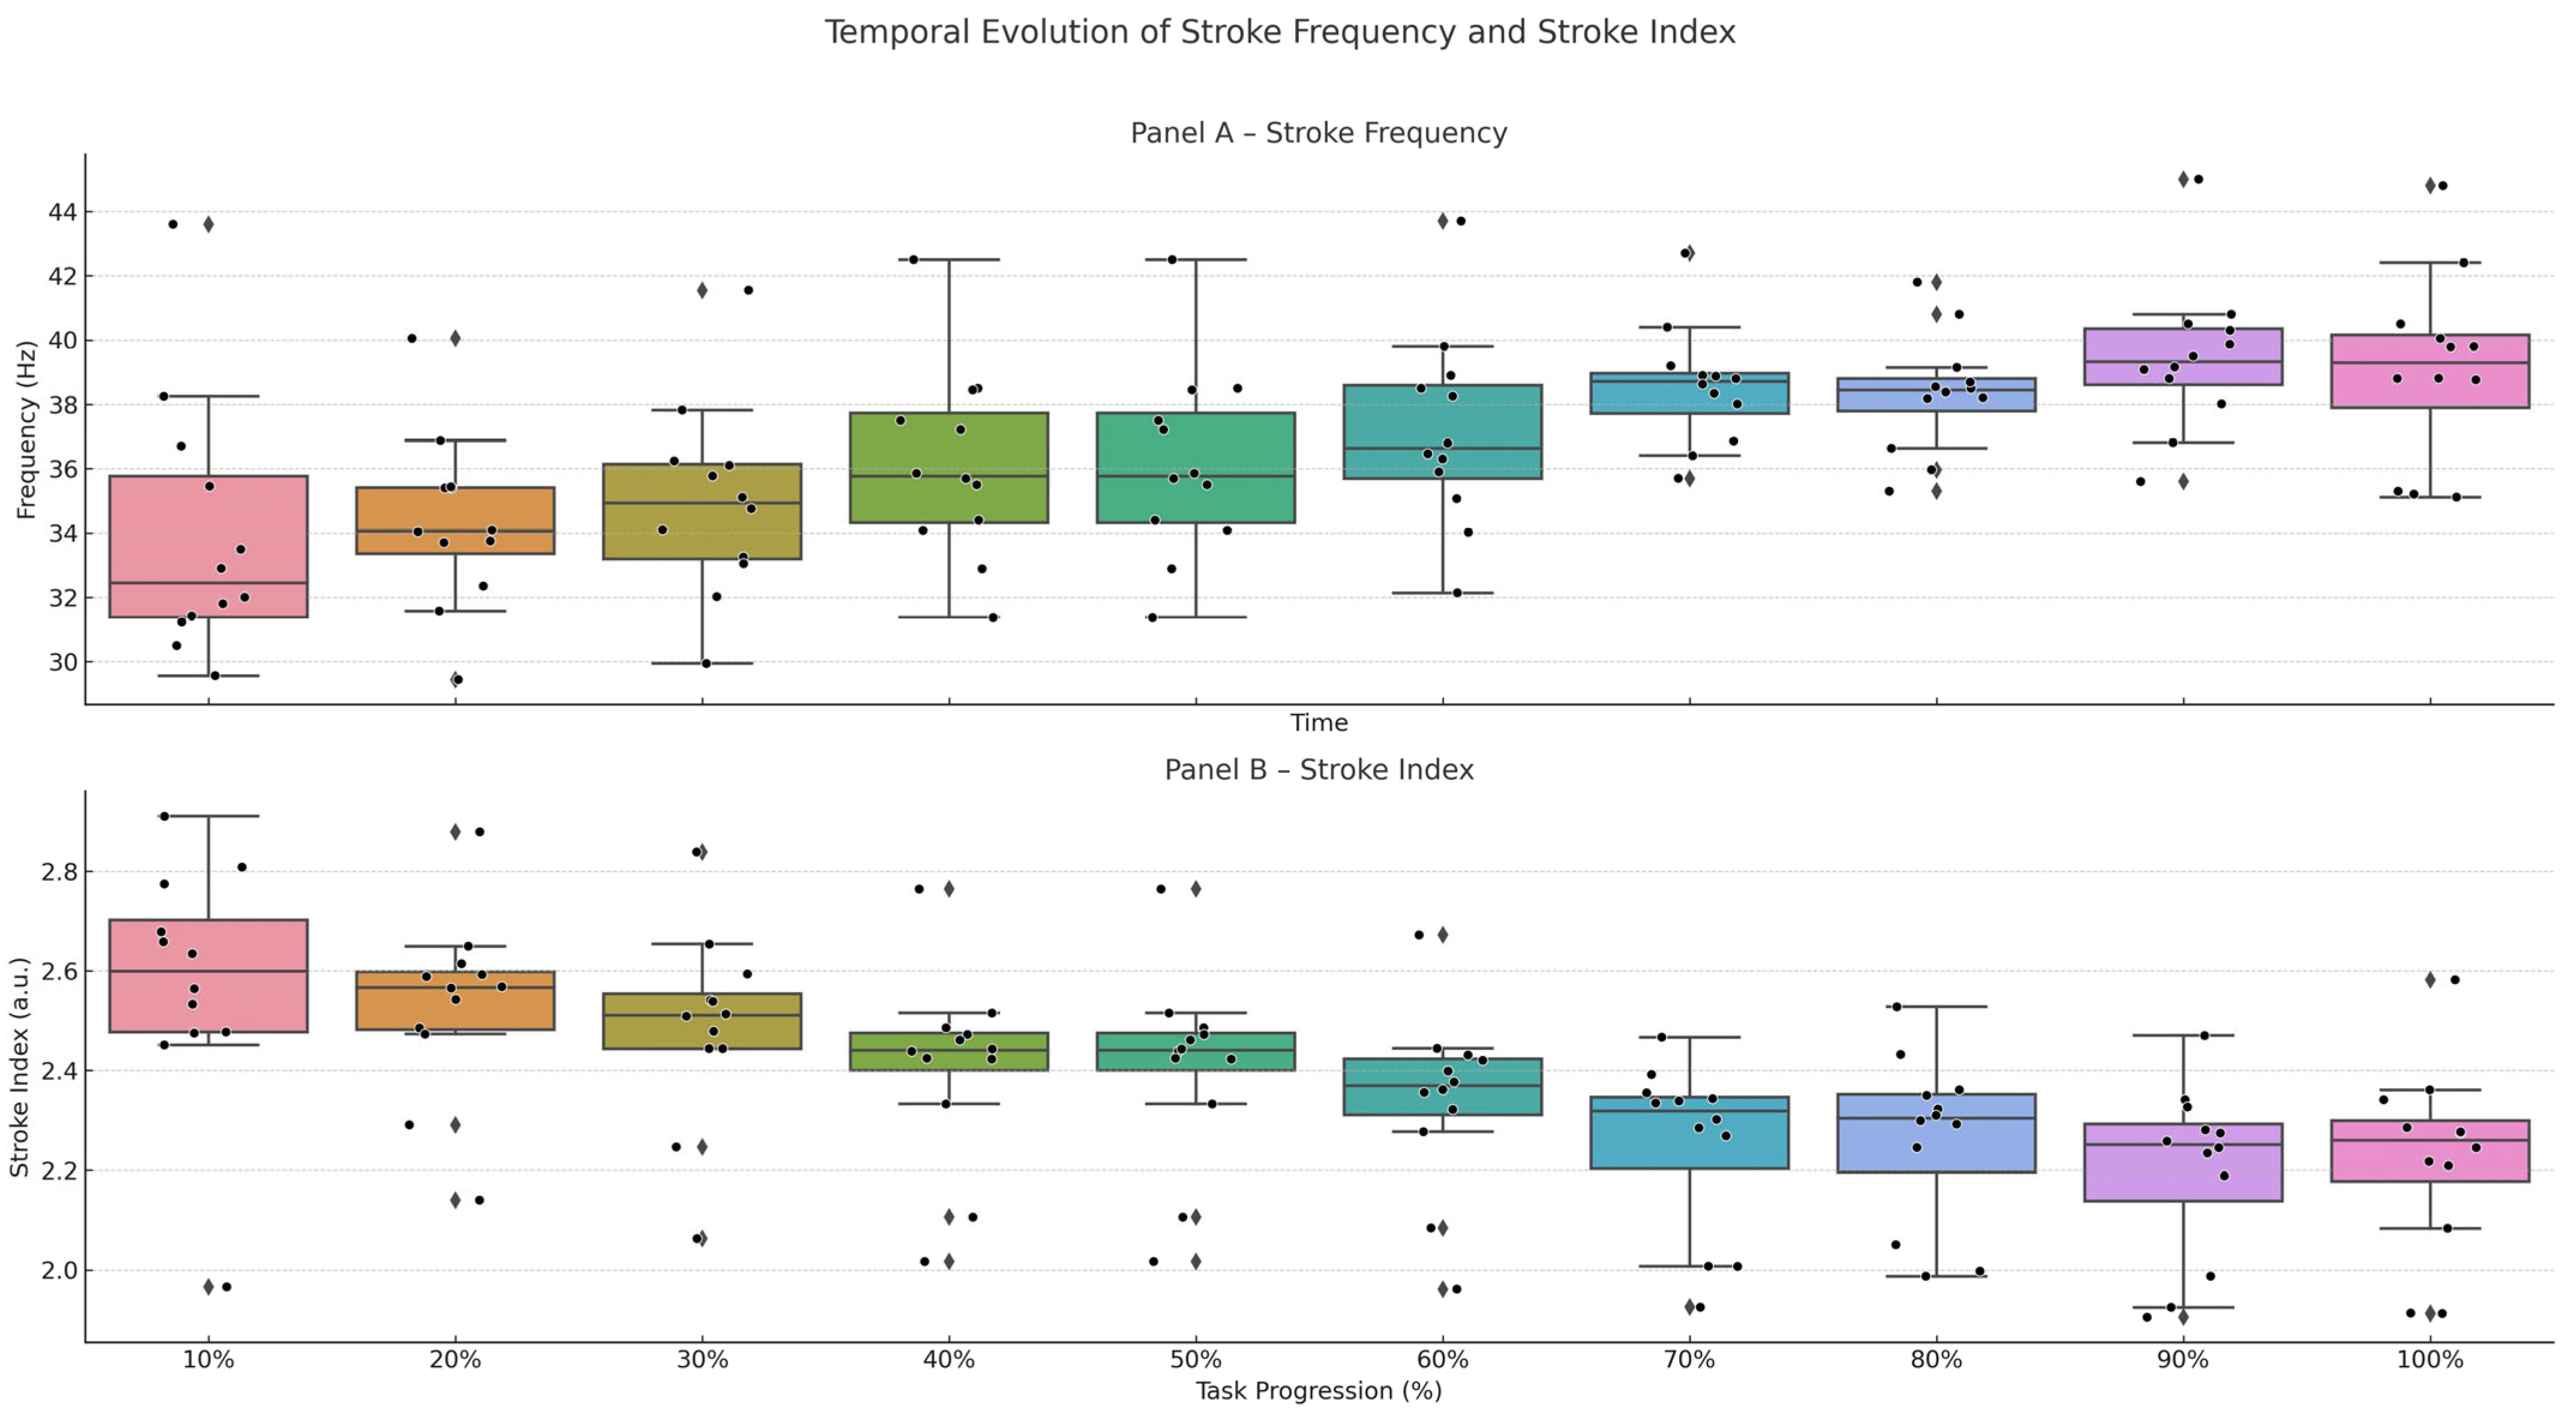
Stroke frequency is shown in Figure 6A and increased progressively over the course of the trial. A significant main effect of time was observed (F(9,99) = 40.1, p < 0.001, η2p = 0.79). Post hoc analysis revealed that stroke frequency increased from 50% of test duration onward (p = 0.009), and remained elevated until exhaustion (all p ≤ 0.033), with progressively larger increases observed at later time points (100%: 95% CI [−7.55, −3.90]). This pattern indicates a compensatory adjustment aimed at maintaining the imposed swimming velocity in response to the progressive reduction in propulsive force per stroke.
Figure 6.
Temporal evolution of stroke frequency and stroke efficiency index across task progression. Panel (A) shows stroke frequency, while Panel (B) reports stroke efficiency index values. Boxplots represent the distribution across participants at each time point (10–100% of task progression), with individual data points overlaid.
3.11. Stroke Efficiency Index
Stroke efficiency index is shown in Figure 6B. A significant main effect of time was observed (F(9,99) = 39.5, p < 0.001, η2p = 0.78). Post hoc analysis revealed that stroke efficiency remained stable during the early stages of the test but decreased significantly from 50% of test duration onward (p = 0.008; 95% CI [0.11, 0.33]), with progressively larger reductions observed at later time points (all p ≤ 0.033; 100%: 95% CI [0.26, 0.51]). This pattern indicates a progressive loss of mechanical efficiency, reflecting a reduced distance traveled per stroke despite the maintenance of swimming velocity.
3.12. Correlation Analysis
Stroke frequency exhibited consistent negative correlations with force-related variables, including mean force, total area under the curve, area of the second halves, and peak force (Spearman’s r ranging from −0.22 to −0.46, p < 0.05 to p < 0.001), indicating a progressive reduction in propulsive force production with increasing stroke rate. Stroke efficiency index showed weak-to-moderate positive correlations with key propulsive and coordination-related variables, including area of the second halves (r = 0.31, p < 0.01), peak force (r = 0.46, p < 0.001), force centroid (r = 0.26, p < 0.05), and asymmetry index (r = 0.51, p < 0.001). Conversely, it was negatively associated with variables reflecting early-phase force production and temporal characteristics, such as area of the first halves (r = −0.25, p < 0.05) and peak index (r = −0.29, p < 0.01).
A strong inverse correlation was observed between stroke frequency and stroke efficiency index (r = −0.79, p < 0.001), highlighting a marked decline in mechanical efficiency as swimmers increase stroke rate under fatigue conditions (see Table 1).
Table 1.
Correlation analysis between stroke parameters and force-related variables.
4. Discussion
4.1. General Framework and Validity of the Experimental Protocol
The present study examined the effects of progressive fatigue on upper-limb propulsive force during front crawl swimming using a pressure-based measurement system synchronized with video analysis. The adoption of a constant-speed protocol with visual pacing allowed the evolution of force production to be investigated under controlled conditions, minimizing the influence of voluntary pacing strategies that typically characterize self-selected swimming.
The absence of significant differences in blood lactate concentration and perceived exertion between Test A (maximal effort) and Test B indicates that the constant-speed protocol elicited a comparable metabolic and perceptual load, despite being performed at a lower velocity. This finding supports the validity of Test B as an experimental model of controlled fatigue, suitable for isolating the effects of fatigue on propulsive force production independently of pacing-related confounding factors.
4.2. Global and Bilateral Decline in Propulsive Force
A clear and progressive decline in propulsive force was observed over the duration of the trial. Both Total Area Under the Curve, reflecting global propulsive output per stroke, and Mean Force showed significant reductions as fatigue developed. These reductions occurred symmetrically in the right and left arms, with no inter-limb differences or interaction effects, indicating a bilateral and coordinated deterioration in force-generating capacity.
This pattern is consistent with previous evidence of intra-cycle acceleration decay and power loss during fatiguing swimming tasks. Tella et al. [13] reported substantial reductions in peak power and spectral area under fatigue conditions, while Dos Santos et al. [10] observed decreases in mean propulsive force during incremental front crawl swimming without alterations in upper-limb symmetry. Although differences in experimental protocols and biomechanical metrics may explain variations in the timing and magnitude of the observed effects, these studies converge in suggesting that fatigue is associated with a coordinated reduction in propulsive output rather than unilateral technical deterioration.
Overall, these findings indicate that prolonged constant-pace swimming is associated with a reduced ability to sustain propulsive force production, without introducing asymmetries or imbalances between the upper limbs.
4.3. Phase-Dependent Vulnerability of Propulsive Impulse
Time-resolved analysis of the stroke cycle revealed a clear dissociation between the two halves of the propulsive cycle. Force production during the first half of the cycle—corresponding to the entry, catch, and pull phases—remained largely preserved throughout the trial. In contrast, the second half of the cycle—the push phase—exhibited an early and pronounced decline in propulsive impulse, identifying this phase as the primary locus of fatigue-induced force loss.
This phase-specific vulnerability is biomechanically plausible and strongly supported by literature. Pressure-based measurements at the hand have consistently demonstrated that the late underwater phase contributes the largest proportion of total propulsive impulse and is characterized by the highest force demands [22,23]. Consequently, this phase is inherently more susceptible to fatigue, making the selective reduction in push-phase impulse observed in the present study consistent with a reduction in force-generating capacity rather than a reorganization of the propulsive movement pattern.
4.4. Temporal Organization of Propulsive Force Under Fatigue
Despite the progressive decline in the magnitude of propulsive force, its temporal organization remained remarkably stable throughout the trial. Peak force consistently occurred at approximately 75% of the stroke cycle, in agreement with experimental and computational fluid dynamics studies describing the temporal structure of front crawl propulsion [33]. Similarly, Force Centroid and Asymmetry Index did not show significant changes over time.
Qualitative analysis of normalized force–time profiles further corroborated this observation. Although force amplitude progressively decreased, the overall shape of the curves remained unchanged, with no evident shifts in onset, peak timing, or offset of force application. This morphological stability indicates that fatigue was associated with a reduction in force magnitude without altering the temporal distribution of propulsive impulse within the stroke cycle, suggesting preservation of the temporal organization of force application.
Comparable findings have been reported in studies using wearable pressure sensors, in which the temporal organization of propulsive force remained robust under fatigue despite reductions in force magnitude [23,24].
4.5. Compensatory Adjustments Based on Stroke Frequency and Efficiency
In response to the decline in propulsive force, swimmers progressively increased stroke frequency to maintain the imposed velocity. This behavior has traditionally been interpreted as a compensatory strategy aimed at preserving speed despite a reduction in force per stroke [17,19]. Consistent with this interpretation, the increase in stroke frequency observed in the present study was associated with a reduction in mechanical output per stroke.
However, increases in stroke frequency may also reflect an initially preventive strategy. Franken et al. [34] demonstrated that higher stroke frequencies can improve oxygen uptake kinetics and prolong time to exhaustion at submaximal intensities. In the present study, this strategy appears to have initially contributed to maintaining velocity but progressively reached its mechanical limit under constant-speed conditions. It should also be considered that perceptual or strategy-related factors may have contributed to this response. In particular, swimmers may increase stroke frequency based on the belief that a higher rate can help maintain speed, even when propulsive force is declining. While this behavioral component cannot be excluded, the present study was not designed to distinguish between physiological and perceptual contributions to this adjustment.
Stroke efficiency was positively associated with push-phase impulse, peak force, and indices of force timing and symmetry, underscoring the critical role of late-phase force production for economical swimming. Conversely, efficiency declined in association with a greater relative contribution of the early phases of the stroke cycle, despite the absence of alterations in the temporal structure of propulsive force.
4.6. Limitations
One limitation of this study is its exclusive focus on upper-body propulsion. While performance in the crawl stroke during middle- and long-distance races is primarily driven by the arms [35], the contribution of the lower limbs, particularly under conditions of fatigue, warrants further investigation.
Furthermore, the relatively small sample size (n = 12) and gender imbalance may limit the generalizability of the results, although the consistency of the observed trends and sensitivity analysis mitigate this concern to some extent. The results may not be directly transferable to other swimming strokes (e.g., backstroke, breaststroke and butterfly), as these involve different coordination patterns and propulsion strategies.
Methodological limitations should also be acknowledged. Using arbitrary units for strength-related variables may limit comparability with other studies, and uniform breathing on one side across all trials may have influenced coordination patterns and asymmetry. Furthermore, a detailed kinematic analysis of upper limb joint angles was not performed; therefore, it was not possible to account for subtle, technique-related variations.
In addition, no direct neuromuscular measurements were collected (e.g., surface electromyography or muscle fatigue indices). Consequently, it is not possible to attribute the observed changes to specific physiological fatigue mechanisms. Therefore, the findings should be interpreted as reflecting alterations in propulsive output related to fatigue rather than as direct evidence of underlying neuromuscular processes.
Nevertheless, the use of normalized variables allows a robust assessment of relative within-subject changes over time. This approach is particularly appropriate in fatigue analyses, where the focus is on the temporal evolution of performance and the characterization of intra-individual responses rather than on absolute force quantification.
5. Conclusions
Progressive fatigue during constant-pace front crawl swimming induces a marked and symmetrical reduction in upper-limb propulsive force, with the most pronounced decline occurring during the push phase. Importantly, this loss of force magnitude is not accompanied by alterations in the temporal organization of propulsion, as stroke timing, bilateral coordination, and the morphology of force–time profiles remain largely preserved throughout the effort. Although swimmers increase stroke frequency to maintain the imposed velocity, this compensatory adjustment proves mechanically inefficient and ultimately insufficient to sustain performance. Together, these findings suggest that performance decline under prolonged, controlled swimming is primarily associated with a reduction in force-generating capacity, likely reflecting fatigue-related mechanisms, rather than a degradation of stroke technique or coordination. From an applied perspective, these results highlight the importance of assessing not only overall force magnitude but also its phase-specific distribution and temporal structure when monitoring fatigue and designing training strategies aimed at preserving late-phase propulsive capacity in competitive swimmers.
Supplementary Materials
The following supporting information can be downloaded at: https://www.mdpi.com/article/10.3390/biomechanics6020035/s1, Table S1: A summary of the ANOVA results for each variable, comparing the right and left arms; Figure S1: Paddles calibration setup and graph of hydrostatic pressure measured by right (blue line) and left (green line) paddles; Figure S2: Force curve analysis method. Panel (A) shows the force–time curve of the entire test for the right arm of a representative swimmer. For each of the 10 time points (from 10% to 100% of the trial duration), three consecutive stroke cycles were selected, excluding those near turns and avoiding the first stroke of each lap. These were resampled at 101 points and averaged to obtain a single representative curve per time point. Panels (B–G) illustrate the stroke-by-stroke force variables extracted from each averaged curve: (B) Total Area Under the Curve, (C) Force Area of the First and Second Halves, (D) Peak Force, (E) Peak Index, (F) Mean Force, (G) Force Centroid. Panel H displays the Asymmetry Index, calculated as the normalized difference between the second and first half areas. These variables quantify the intensity, timing, and distribution of propulsive force during the stroke.
Author Contributions
Conceptualization, L.P.; methodology, L.P.; software, L.P.; validation, M.P. and G.A.; formal analysis, L.P., M.P., G.A. and V.F.; investigation, M.P., G.A. and V.F.; data curation, L.P., M.P. and G.A.; writing—original draft preparation, L.P.; writing—review and editing, L.P., M.P., G.A., V.F., P.R. and E.L.F.; visualization, P.R. and E.L.F.; supervision, P.R. and E.L.F.; project administration, P.R. and E.L.F. All authors have read and agreed to the published version of the manuscript.
Funding
This research received no external funding.
Institutional Review Board Statement
The study was conducted in accordance with the Declaration of Helsinki and approved by the local ethics committee (Comitato Etico per la Ricerca di Ateneo—CERA, University of Genoa, Italy; approval no. 2024/62, 12 June 2024).
Informed Consent Statement
Written informed consent was obtained from all participants and, in the case of minors, from their legal guardians.
Data Availability Statement
The original contributions presented in this study are included in the article/Supplementary Materials. Further inquiries can be directed to the corresponding author.
Conflicts of Interest
The authors declare no conflicts of interest.
References
- Toussaint, H.; Truijens, M. Biomechanical aspects of peak performance in human swimming. Anim. Biol. 2005, 55, 17–40. [Google Scholar] [CrossRef] [Scilit]
- Sprigings, E.J.; Koehler, J.A. The Choice between Bernoulli’s or Newton’s Model in Predicting Dynamic Lift. Int. J. Sport Biomech. 1990, 6, 235–245. [Google Scholar] [CrossRef] [Scilit]
- Schreven, S.; Smeets, J.B.J.; Beek, P.J. Sprint Performance in Arms-Only Front Crawl Swimming Is Strongly Associated With the Power-To-Drag Ratio. Front. Sports Act. Living 2022, 4, 758095. [Google Scholar] [CrossRef] [Scilit]
- Van Houwelingen, J.; Schreven, S.; Smeets, J.B.J.; Clercx, H.J.H.; Beek, P.J. Effective Propulsion in Swimming: Grasping the Hydrodynamics of Hand and Arm Movements. J. Appl. Biomech. 2017, 33, 87–100. [Google Scholar] [CrossRef] [Scilit]
- Koga, D.; Tsunokawa, T.; Sengoku, Y.; Homoto, K.; Nakazono, Y.; Takagi, H. Relationship Between Hand Kinematics, Hand Hydrodynamic Pressure Distribution and Hand Propulsive Force in Sprint Front Crawl Swimming. Front. Sports Act. Living 2022, 4, 786459. [Google Scholar] [CrossRef] [Scilit]
- Tsunokawa, T.; Mankyu, H.; Takagi, H.; Ogita, F. The effect of using paddles on hand propulsive forces and Froude efficiency in arm-stroke-only front-crawl swimming at various velocities. Hum. Mov. Sci. 2019, 64, 378–388. [Google Scholar] [CrossRef] [Scilit]
- Takagi, H.; Nakashima, M.; Sengoku, Y.; Tsunokawa, T.; Koga, D.; Narita, K.; Kudo, S.; Sanders, R.; Gonjo, T. How do swimmers control their front crawl swimming velocity? Current knowledge and gaps from hydrodynamic perspectives. Sports Biomech. 2023, 22, 1552–1571. [Google Scholar] [CrossRef] [Scilit] [PubMed]
- Soh, J.; Sanders, R. The clues are in the flow: How swim propulsion should be interpreted. Sports Biomech. 2021, 20, 798–814. [Google Scholar] [CrossRef] [Scilit]
- Vorontsov, A.; Rumyantsev, V. Propulsive Forces in Swimming. In Biomechanics in Sport; International Olympic Committee: Lausanne, Switzerland, 2000; pp. 205–231. [Google Scholar]
- Dos Santos, K.B.; Pereira, G.; Papoti, M.; Bento, P.C.B.; Rodacki, A. Propulsive Force Asymmetry during Tethered-Swimming. Int. J. Sports Med. 2013, 34, 606–611. [Google Scholar] [CrossRef] [Scilit]
- Figueiredo, P.; Morais, P.; Vilas-Boas, J.P.; Fernandes, R.J. Changes in arm coordination and stroke parameters on transition through the lactate threshold. Eur. J. Appl. Physiol. 2013, 113, 1957–1964. [Google Scholar] [CrossRef] [Scilit] [PubMed]
- Lomax, M.; Castle, S. Inspiratory Muscle Fatigue Significantly Affects Breathing Frequency, Stroke Rate, and Stroke Length during 200-m Front-Crawl Swimming. J. Strength Cond. Res. 2011, 25, 2691–2695. [Google Scholar] [CrossRef] [Scilit] [PubMed]
- Tella, V.; Toca-Herrera, J.L.; Gallach, J.E.; Benavent, J.; González, L.M.; Arellano, R. Effect of fatigue on the intra-cycle acceleration in front crawl swimming: A time–frequency analysis. J. Biomech. 2008, 41, 86–92. [Google Scholar] [CrossRef] [Scilit]
- Ikuta, Y.; Matsuda, Y.; Yamada, Y.; Kida, N.; Oda, S.; Moritani, T. Relationship between decreased swimming velocity and muscle activity during 200-m front crawl. Eur. J. Appl. Physiol. 2012, 112, 3417–3429. [Google Scholar] [CrossRef] [Scilit]
- Stirn, I.; Jarm, T.; Kapus, V.; Strojnik, V. Evaluation of muscle fatigue during 100-m front crawl. Eur. J. Appl. Physiol. 2011, 111, 101–113. [Google Scholar] [CrossRef] [Scilit]
- Alberty, M.; Sidney, M.; Huot-Marchand, F.; Hespel, J.M.; Pelayo, P. Intracyclic Velocity Variations and Arm Coordination During Exhaustive Exercise in Front Crawl Stroke. Int. J. Sports Med. 2005, 26, 471–475. [Google Scholar] [CrossRef] [Scilit]
- Figueiredo, P.; Rouard, A.; Vilas-Boas, J.P.; Fernandes, R.J. Upper- and lower-limb muscular fatigue during the 200-m front crawl. Appl. Physiol. Nutr. Metab. 2013, 38, 716–724. [Google Scholar] [CrossRef] [Scilit]
- Fernandes, A.; Afonso, J.; Noronha, F.; Mezêncio, B.; Vilas-Boas, J.P.; Fernandes, R.J. Intracycle Velocity Variation in Swimming: A Systematic Scoping Review. Bioengineering 2023, 10, 308. [Google Scholar] [CrossRef] [Scilit]
- Alberty, M.; Sidney, M.; Pelayo, P.; Toussaint, H.M. Stroking Characteristics during Time to Exhaustion Tests. Med. Sci. Sports Exerc. 2009, 41, 637–644. [Google Scholar] [CrossRef] [Scilit]
- Morouço, P.; Keskinen, K.L.; Vilas-Boas, J.P.; Fernandes, R.J. Relationship Between Tethered Forces and the Four Swimming Techniques Performance. J. Appl. Biomech. 2011, 27, 161–169. [Google Scholar] [CrossRef] [Scilit] [PubMed]
- Morais, J.E.; Barbosa, T.M.; Garrido, N.D.; Cirilo-Sousa, M.S.; Silva, A.J.; Marinho, D.A. Agreement between Different Methods to Measure the Active Drag Coefficient in Front-Crawl Swimming. J. Hum. Kinet. 2023, 86, 41–49. [Google Scholar] [CrossRef] [Scilit] [PubMed]
- Takagi, H.; Sanders, R. Measurement of Propulsion by the Hand during Competitive Swimming. In The Engineering of Sport 4; Blackwell Science: Malden, MA, USA, 2002; pp. 631–637. [Google Scholar]
- Bottoni, A.; Lanotte, N.; Boatto, P.; Bifaretti, S.; Bonifazi, M. Technical skill differences in stroke propulsion between high level athletes in triathlon and top level swimmers. J. Hum. Sport Exerc. 2011, 6, 351–362. [Google Scholar] [CrossRef] [Scilit]
- Lanotte, N.; Annino, G.; Bifaretti, S.; Gatta, G.; Romagnoli, C.; Salvucci, A.; Bonaiuto, V. A New Device for Propulsion Analysis in Swimming. Proceedings 2018, 2, 285. [Google Scholar] [CrossRef] [Scilit]
- Kadi, T.; Wada, T.; Narita, K.; Tsunokawa, T.; Mankyu, H.; Tamaki, H.; Ogita, F. Novel Method for Estimating Propulsive Force Generated by Swimmers’ Hands Using Inertial Measurement Units and Pressure Sensors. Sensors 2022, 22, 6695. [Google Scholar] [CrossRef] [Scilit] [PubMed]
- Cortesi, M.; Giovanardi, A.; Gatta, G.; Mangia, A.L.; Bartolomei, S.; Fantozzi, S. Inertial Sensors in Swimming: Detection of Stroke Phases through 3D Wrist Trajectory. J. Sports Sci. Med. 2019, 18, 438–447. [Google Scholar]
- Schnitzler, C.; Seifert, L.; Chollet, D. Arm Coordination and Performance Level in the 400-m Front Crawl. Res. Q. Exerc. Sport 2011, 82, 1–8. [Google Scholar] [CrossRef] [Scilit] [PubMed]
- Samson, M.; Monnet, T.; Bernard, A.; Lacouture, P.; David, L. Kinematic hand parameters in front crawl at different paces of swimming. J. Biomech. 2015, 48, 3743–3750. [Google Scholar] [CrossRef] [Scilit]
- Puce, L.; Chamari, K.; Marinelli, L.; Mori, L.; Bove, M.; Faelli, E.; Fassone, M.; Cotellessa, F.; Bragazzi, N.L.; Trompetto, C. Muscle Fatigue and Swimming Efficiency in Behind and Lateral Drafting. Front. Physiol. 2022, 13, 835766. [Google Scholar] [CrossRef] [Scilit] [PubMed]
- Goodwin, M.L.; Harris, J.E.; Hernández, A.; Gladden, L.B. Blood Lactate Measurements and Analysis during Exercise: A Guide for Clinicians. J. Diabetes Sci. Technol. 2007, 1, 558–569. [Google Scholar] [CrossRef] [Scilit] [PubMed]
- Borg, G.A. Psychophysical bases of perceived exertion. Med. Sci. Sports Exerc. 1982, 14, 377–381. [Google Scholar] [CrossRef] [Scilit]
- Faul, F.; Erdfelder, E.; Lang, A.-G.; Buchner, A. G*Power 3: A flexible statistical power analysis program for the social, behavioral, and biomedical sciences. Behav. Res. Methods 2007, 39, 175–191. [Google Scholar] [CrossRef] [Scilit]
- Cohen, R.C.Z.; Cleary, P.W.; Mason, B.R.; Pease, D.L. Forces during front crawl swimming at different stroke rates. Sports Eng. 2018, 21, 63–73. [Google Scholar] [CrossRef] [Scilit]
- Franken, M.; Figueiredo, P.; De Assis Correia, R.; Feitosa, W.G.; Lazzari, C.D.; Diefenthaeler, F.; Castro, F.S. Manipulation of Stroke Rate in Swimming: Effects on Oxygen Uptake Kinetics. Int. J. Sports Med. 2023, 44, 56–63. [Google Scholar] [CrossRef] [Scilit] [PubMed]
- Morouço, P.G.; Marinho, D.A.; Izquierdo, M.; Neiva, H.; Marques, M.C. Relative Contribution of Arms and Legs in 30 s Fully Tethered Front Crawl Swimming. Biomed Res. Int. 2015, 2015, 563206. [Google Scholar] [CrossRef] [Scilit] [PubMed]

Disclaimer/Publisher’s Note: The statements, opinions and data contained in all publications are solely those of the individual author(s) and contributor(s) and not of MDPI and/or the editor(s). MDPI and/or the editor(s) disclaim responsibility for any injury to people or property resulting from any ideas, methods, instructions or products referred to in the content. |
© 2026 by the authors. Licensee MDPI, Basel, Switzerland. This article is an open access article distributed under the terms and conditions of the Creative Commons Attribution (CC BY) license.