


Abstract
Enclosed reinforced concrete structures subjected to internal blast loading represent a critical safety concern in infrastructure applications where detonations may occur within confined spaces. Although circular cross-sections have been widely adopted for blast-resistant containment structures, systematic quantitative comparisons of internal blast responses between circular and square enclosed configurations under progressive charge weight conditions remain limited. LS-DYNA finite element simulations are conducted under four trinitrotoluene (TNT) charge weight conditions ranging from 1200 to 2500 kg, and the failure-inducing blast load is defined as the minimum charge weight at which continuous concrete element deletion first occurs in the roof or side-wall region. In this study, the failure-inducing blast load is interpreted as an erosion-based comparative indicator under the adopted empirical blast-loading framework rather than as an absolute real-world confined-blast failure threshold. The roof failure-inducing blast load is identical for both structures at 1200 kg, whereas the side-wall failure-inducing blast loads are 2500 kg for the circular structure and 1500 kg for the square structure, indicating approximately 67% higher side-wall blast resistance in the circular structure. This difference is attributed to the membrane action of the curved wall, which redistributes internal blast-induced lateral pressure along the circumferential direction and limits out-of-plane deformation. Under the 2500-kg condition, the peak side-wall displacement of the square structure is 161.6% higher than that of the circular structure, whereas its peak roof displacement is 33.3% lower. Axial strains at all reinforcement locations remain within the elastic range, confirming that concrete damage is governed by the low tensile capacity of concrete rather than reinforcement yielding.
1. Introduction
Concrete structures are among the most widely used structural systems in buildings and civil infrastructure. Large-scale critical infrastructure facilities, such as nuclear power plant containment structures and spent nuclear fuel storage buildings, are typically constructed using reinforced concrete (RC) or prestressed concrete (PSC) systems. These structures provide high stiffness, durability, and shielding capacity under conventional design loads. However, when subjected to short-duration extreme loads, such as explosions, they may experience cracking, spalling, localized damage, and rapid stiffness degradation [1,2,3,4]. Internal blast loading is particularly critical because, unlike external blast loading, blast pressures can be repeatedly reflected and superimposed within a confined space. Consequently, the pressure duration, impulse, and structural response may differ significantly even for the same explosive charge weight [5,6,7]. Previous studies have reported that the internal blast response varies with the degree of opening, internal space geometry, and boundary constraints. In confined or partially confined spaces, repeated reflection and superposition of blast waves can produce spatially and temporally nonuniform pressure distributions on internal structural surfaces that differ from those under external or open-field blast conditions. However, experimentally reproducing internal blast loading in fully enclosed structures and directly measuring the resulting reflected pressure and structural response involve substantial practical limitations. Pressure and strain gauges installed on internal surfaces can be damaged immediately after detonation by high-intensity reflected pressure, fragments, and localized structural damage. Consequently, continuous measurement of internal reflected pressure and local structural response remains challenging [8,9,10,11]. Because of these experimental limitations, previous studies have primarily investigated internal blast loading using scaled specimens under open-ended or partially open conditions. Although limited, these studies have provided valuable response data, including free-field pressure, displacement, strain, and crack patterns. In particular, studies on RC tubular structures evaluated the fundamental structural response to internal blast loading using scaled specimens based on containment-type structures, whereas those on PSC tubular structures investigated the effect of prestressing on internal blast resistance under similar geometric configurations. These studies are significant because they provided fundamental response data under experimentally feasible conditions using simplified circular or tubular specimens that capture the key structural characteristics of containment-type structures [8,9,12]. Recently, to overcome these experimental limitations, numerical approaches have been adopted in which finite element models are validated against displacement–time histories and damage patterns obtained from scaled specimens or partially open tests and subsequently extended to more constrained internal blast conditions [13,14,15,16,17,18,19]. Recent studies have further investigated internal explosions in confined RC structures using experimental, numerical, and simplified predictive approaches. Internal trinitrotoluene (TNT) explosion tests and LS-DYNA simulations of RC shear-wall structures have shown that confinement can amplify blast-load duration, impulse, and structural damage [20]. Subsequent parametric studies have also demonstrated that detonation location significantly influences the internal pressure distribution and structural response [21]. In addition, simplified and data-driven methods have been proposed to predict pressure–time histories for fully or partially confined explosions by accounting for repeated reflections and pressure accumulation [22,23]. Recent experimental and numerical studies on enclosed or partially enclosed RC room and frame structures have also provided valuable data on blast-induced damage modes and structural response [24]. These numerical approaches are useful for evaluating internal reflected pressure, damage evolution, and the structural response of confined systems, which are difficult to measure directly in experiments. In simulations of RC structures subjected to blast loading, selecting an appropriate concrete constitutive model is essential because the predicted damage pattern, stiffness degradation, strain-rate-dependent response, and element deletion behavior are strongly influenced by the material model and erosion formulation [25,26,27,28]. Nevertheless, existing experimental and numerical studies have primarily focused on circular RC or PSC tubular structures, rectangular rooms, shear-wall systems, frame structures, or multi-box configurations. Studies directly comparing the effects of cross-sectional shape, particularly the internal blast response of circular and square enclosed structures with identical material properties, blast location, wall thickness, and comparable internal space conditions, remain limited. In addition, numerical studies comparing the local damage and global displacement responses of full-scale enclosed RC structures with different cross-sectional shapes are scarce. Therefore, a quantitative evaluation of the influence of cross-sectional shape on the structural response of enclosed concrete structures subjected to internal blast loading is needed. In circular structures, the continuous curvature of the internal surface may promote more uniform blast-wave reflection and load transfer. In contrast, square structures comprise flat wall surfaces and corner regions, which may exhibit different pressure reflection characteristics, local stress concentrations, and displacement responses between wall-center and corner regions. Moreover, the corner regions of square structures represent geometric discontinuities that can influence local displacement and load redistribution. These shape-dependent effects cannot be adequately explained solely by previous studies of circular tubular structures [8,9]. In this study, a three-dimensional nonlinear dynamic analysis framework is developed using LS-DYNA (ver. 4.10.) for a full-scale enclosed RC structure based on the spent nuclear fuel storage building at the Hanul Nuclear Power Plant in Uljin, Korea. Circular and square structures are modeled with identical concrete material properties, reinforcement ratios, wall thicknesses, blast location, boundary conditions, and comparable internal effective space, with cross-sectional shape as the primary variable. The effects of internal blast loading on pressure transfer, element-deletion-based local damage, displacement, and strain responses are compared between the circular and square enclosed RC structures. The findings extend previous studies of circular tubular structures to a comparative evaluation of cross-sectional shape and provide fundamental numerical data for assessing the internal blast response of full-scale enclosed concrete structures.
2. Numerical Modeling and Analysis Methods
This study establishes a three-dimensional nonlinear dynamic analysis framework using LS-DYNA (ver. 4.10.) to compare the internal blast responses of full-scale enclosed RC structures with circular and square cross-sections. The numerical models represent full-scale RC structures based on the geometry of a spent nuclear fuel storage building at the Hanul Nuclear Power Plant in Uljin, Korea. The objective is not to reproduce a specific experimental result but to establish a comparative numerical framework that independently evaluates the influence of cross-sectional shape under identical material properties, wall thickness, reinforcement ratio, blast-source location, boundary conditions, and loading conditions. The circular and square models have identical structural height, wall thickness, concrete and reinforcement material properties, reinforcement ratio, blast-source location, boundary conditions, and loading conditions. Consequently, cross-sectional shape is the primary variable in this study. Using this modeling strategy, differences in pressure transfer, local damage, element deletion, displacement, and strain responses are evaluated with respect to the cross-sectional shape of the enclosed RC structures.
2.1. Analysis Framework and Geometric Modeling
The square structure has external dimensions of 34,000 mm × 34,000 mm, a height of 19,000 mm, and a wall thickness of 1750 mm, resulting in an internal effective space measuring 30,500 mm × 30,500 mm. The circular structure has an inner diameter of 34,500 mm, an outer diameter of 38,000 mm, a height of 19,000 mm, and the same wall thickness of 1750 mm. The inner diameter provides an internal area comparable to the effective internal space of the square structure, while the outer diameter maintains the same wall thickness. This geometric configuration enables comparison of the effects of cross-sectional shape while maintaining identical full-scale structural height, wall thickness, and comparable internal blast-affected space.
As shown in Figure 1 and Table 1, the circular and square models represent fully enclosed RC structures with different cross-sectional shapes. In both models, the blast source is located at the geometric center of the internal hollow space. This configuration represents the confinement condition of the target enclosed structure and ensures identical initial blast-loading conditions for both models. However, as described in Section 2.4, the adopted empirical blast-loading formulation does not explicitly account for the gas-dynamic processes associated with repeated shock-wave reflections, pressure accumulation, or quasi-static pressure development. Therefore, the fully enclosed geometry is used to define the structural boundaries and internal blast-loaded surfaces for comparative evaluation under identical loading assumptions.
Figure 1.
Geometry of the full-scale enclosed reinforced concrete structures: (a) square structure and (b) circular structure (unit: mm).
Table 1.
Comparison of the internal geometric properties of the square and circular structures.
2.2. Finite Element Discretization and Reinforcement Modeling
The concrete structures are modeled using three-dimensional solid elements. A uniform nominal element size of 500 mm is adopted throughout the structures to ensure numerical stability and computational efficiency in the full-scale analysis. The same element size is used for both the circular and square structures to minimize numerical bias arising from differences in mesh density and to isolate the effect of cross-sectional shape on the structural response. However, the uniform 500-mm element size may limit the ability of the model to accurately capture highly localized damage, steep stress gradients, and mesh-dependent element deletion behavior. Therefore, the adopted mesh strategy is appropriate for the comparative assessment of shape-dependent global responses, whereas finer mesh convergence studies are required in future work for a detailed quantitative evaluation of local failure and damage progression. The reinforcement is explicitly modeled using discrete beam elements embedded within the concrete solid elements. As shown in Figure 2, three reinforcement layers are arranged through the wall thickness, corresponding to the outer, middle, and inner regions. Each layer consists of vertical and horizontal reinforcing bars. The roof and base slabs are reinforced with a double-layer orthogonal grid comprising upper and lower reinforcement layers that provide the same reinforcement ratio as the wall regions. This reinforcement configuration represents a full-scale RC structure and accounts for the contribution of reinforcement to global stiffness, post-cracking load redistribution, and local damage propagation under internal blast loading.
Figure 2.
Finite element models and reinforcement layouts of the enclosed reinforced concrete structures: (a) concrete model and (b) reinforcement model.
For the circular structure, the wall reinforcement is arranged in the circumferential and vertical directions to follow the curved wall geometry. In the square structure, horizontal and vertical reinforcing bars are arranged on each wall face, with reinforcement continuity maintained at the corners. The reinforcement quantity is adjusted to achieve the same reinforcement ratio in both structures, ensuring that differences in structural response primarily result from cross-sectional shape rather than reinforcement quantity. The composite behavior of the concrete and reinforcement is modeled using the *CONSTRAINED_BEAM_IN_SOLID technique, which embeds beam elements within the concrete solid domain to capture their combined load-resisting behavior under internal blast loading. Bond slip between the concrete and reinforcement is not explicitly modeled. Instead, a perfect bond is assumed because the primary objective is to compare the overall structural response and the effect of cross-sectional shape in full-scale enclosed RC structures.
2.3. Material Modeling
The concrete is modeled using the *MAT_CONCRETE_DAMAGE_REL3 material model in LS-DYNA. This model accounts for nonlinear behavior, stiffness degradation, and damage accumulation under compressive and tensile loading. It is selected because it has been widely used in LS-DYNA simulations of concrete structures subjected to blast and impact loading, particularly to represent stiffness degradation, strain-rate-dependent behavior, and progressive damage accumulation. The concrete compressive strength is set to 27.58 MPa, corresponding to the specified concrete strength of the spent nuclear fuel storage building considered in this study. Accordingly, this value is adopted from the design specification of the target structure rather than selected arbitrarily. The strain-rate dependency of concrete is incorporated using the LCRATE curve, enabling the material model to account for the dynamic effects of blast loading, under which concrete behavior differs significantly from that under quasi-static loading. It should be noted that the present study does not include direct validation against full-scale internal blast experiments for the target structure because such experimental data are unavailable. Therefore, the material model is employed within a comparative numerical framework, and the predicted damage and failure-inducing blast loads are interpreted as relative indicators under identical modeling assumptions. The analysis employs *MAT_ADD_EROSION to prevent excessive element distortion during damage progression and to numerically represent regions that satisfy the prescribed erosion criteria. In this study, two erosion criteria are activated: the maximum pressure criterion (MXPRES) and the effective plastic strain criterion (EFFEPS). The MXPRES value is set to 28.0 MPa, whereas the EFFEPS value is set to −0.5, indicating that the absolute value (0.5) is used as the effective plastic strain at failure. The NUMFIP and NCS parameters are both set to 1; therefore, a concrete element is deleted when a single integration point satisfies either erosion criterion. All other erosion criteria are deactivated by assigning their corresponding input values to the exclusion value. In this study, element deletion does not represent the physical disappearance of concrete. Instead, it indicates that the corresponding concrete element has reached the defined erosion criterion and no longer contributes to load resistance. Therefore, element deletion is used as a numerical indicator of severe local damage or failure initiation under internal blast loading. The reinforcement is modeled using *MAT_PIECEWISE_LINEAR_PLASTICITY, which represents the elastoplastic behavior of reinforcing steel and enables the reinforcing bars to contribute to post-cracking load redistribution and overall structural resistance under internal blast loading. The interaction between the concrete and reinforcement is modeled using the *CONSTRAINED_BEAM_IN_SOLID technique described in Section 2.2.
2.4. Internal Blast Loading and Boundary Conditions
The internal blast load is applied using *LOAD_BLAST_ENHANCED in LS-DYNA. This keyword provides an analytical blast-loading formulation in which the pressure–time history is generated from the specified TNT charge weight, detonation location, unit system, and blast type without explicitly modeling the explosive material, detonation products, or surrounding air domain. Consequently, the blast load is applied directly to the structural surfaces as a pressure load, reducing the computational cost compared with fully coupled fluid–structure interaction approaches. In this study, this formulation is adopted to provide a consistent and computationally efficient loading condition for comparing the shape-dependent responses of circular and square enclosed RC structures. The blast source is located at the geometric center of the internal hollow space in both structures. The same blast-source location and loading conditions are applied to both models to ensure that differences in standoff distance, internal surface orientation, applied pressure distribution, and structural response can be attributed to cross-sectional shape rather than loading conditions. The TNT charge weight is varied to identify the erosion-based comparative failure-inducing blast load and to examine post-critical damage evolution, while all other loading parameters remain identical. In the *LOAD_BLAST_ENHANCED definition, the blast type is specified as a spherical free-air burst. This option assumes that the initial shock wave propagates spherically from the detonation point and does not account for amplification of the initial shock wave resulting from interaction with the ground or floor surface.
This assumption is appropriate for the present analysis because the explosive charge is located at the center of the internal cavity rather than on the bottom surface. Accordingly, the initial blast wave is treated as a free-air burst until it reaches the internal surfaces of the enclosed structure. Within the fully enclosed space, the blast wave subsequently interacts with the surrounding roof and wall surfaces, generating reflected pressures that can increase the local pressure demand compared with that under open-field conditions. Therefore, the analysis considers the direct action of the initial blast wave and the resulting pressure acting on the internal roof and wall surfaces under confined internal blast-loading conditions. However, it should be noted that *LOAD_BLAST_ENHANCED is based on empirical free-air blast formulations and does not explicitly model the surrounding air domain, detonation-product expansion, multiple shock-wave reflections, pressure accumulation, or quasi-static pressure development, as achieved using Arbitrary Lagrangian–Eulerian (ALE) or computational fluid dynamics (CFD) approaches. Therefore, the blast pressure history predicted in this study should not be interpreted as a complete representation of the gas-dynamic processes associated with a fully confined internal explosion. Instead, the present analysis provides a comparative finite element framework for evaluating the relative shape-dependent structural responses of circular and square enclosed RC structures under identical analytically defined blast-loading conditions. More advanced ALE, CFD, or coupled fluid–structure interaction (FSI) analyses are required in future work to quantify the effects of repeated reflections, pressure accumulation, and quasi-static pressure on the absolute internal blast demand. The base of each structure is fixed to represent the restraint provided by the foundation or surrounding support, whereas the upper portion remains free of additional external restraints. The same boundary conditions are applied to both the circular and square structures to ensure a consistent comparative analysis framework. As shown in Figure 3, the blast source is located at the center of the internal cavity, and the initial pressure wave propagates toward the surrounding roof and wall surfaces. This loading configuration provides a consistent basis for comparing the internal blast responses of the two cross-sectional shapes.
Figure 3.
Internal blast loading and boundary conditions of the enclosed reinforced concrete structures: (a) side view of the square structure with a fixed bottom boundary; (b) side view of the circular structure with a fixed bottom boundary; (c) top view of the square structure showing the spherical free-air burst condition; and (d) top view of the circular structure showing the spherical free-air burst condition.
2.5. Definition of Failure-Inducing Blast Load and Evaluation Locations
This study defines the failure-inducing blast load to compare the damage resistance of circular and square enclosed RC structures subjected to internal blast loading. Structural damage or failure can generally be evaluated using maximum displacement, residual displacement, strain, stress, or damage indices. However, in full-scale RC structures with high global stiffness, global displacement may remain relatively small even when severe local damage develops on the internal surface. Moreover, once concrete elements are deleted, the stress and strain histories of those elements no longer provide physically meaningful response information. Therefore, displacement- or strain-based criteria alone are insufficient to define the onset of severe local damage in the present analysis.
Accordingly, this study defines the failure-inducing blast load as the minimum TNT charge weight at which a continuous zone of deleted concrete elements first appears. The deletion of an isolated element is not considered structural failure because it may result from local numerical instability or mesh dependency. Failure initiation is identified when adjacent concrete elements are continuously deleted, forming a distinct local damage zone. In this study, isolated deletion is defined as the deletion of a single concrete element that is not directly connected to another deleted element through a shared face. In contrast, continuous deletion is defined as the deletion of two or more adjacent concrete elements connected through shared faces, thereby forming a spatially continuous local damage zone in the roof or side-wall region. Elements connected only through an edge or a node are not considered continuously deleted because such connectivity may reflect local numerical instability rather than physically meaningful damage propagation. Therefore, the failure-inducing blast load is determined only when a face-connected cluster of deleted concrete elements first appears within the damage evaluation region. The failure-inducing blast load is evaluated separately for each damage location because the internal blast response varies with the relative position of the blast source and the structural surface. The blast source is located at the center of the internal cavity, and the distance to the inner roof surface is shorter than that to the inner wall surface. Consequently, concrete element deletion may initiate in the roof region before developing in the side walls. The roof response is primarily governed by the direct action of the blast wave on the nearest internal surface, whereas the side-wall response is influenced by radial blast-wave propagation, reflected pressure, and shape-dependent lateral resistance.
For both the circular and square structures, the roof and side-wall regions are selected as the primary damage evaluation regions for determining the failure-inducing blast load. In the circular structure, the side-wall response is evaluated at a representative wall region because the circular cross-section has a constant radial distance from the center to the inner wall surface. In the square structure, the side-wall response is evaluated at the wall-center region to ensure a consistent comparison with the representative side-wall response of the circular structure. The corner region of the square structure is not used to define the failure-inducing blast load; instead, its response is considered only as an additional displacement evaluation location in Section 4.2. Accordingly, the failure-inducing blast load is determined based on the occurrence of continuous concrete element deletion in the roof and side-wall regions. The critical failure-inducing blast load of the entire structure is defined as the minimum TNT charge weight at which continuous element deletion first occurs in any of the designated damage evaluation regions. This definition provides a consistent basis for comparing the damage resistance of the circular and square structures under identical material properties, wall thickness, reinforcement ratio, blast-source location, and boundary conditions.
3. Failure-Inducing Blast Loads and Sensitivity Analysis
3.1. Failure-Inducing Blast Loads Based on Continuous Element Deletion
This section evaluates the failure-inducing blast loads of the circular and square enclosed RC structures based on the occurrence of continuous concrete element deletion. As defined in Section 2.5, the failure-inducing blast load is the minimum TNT charge weight at which a face-connected cluster of two or more deleted concrete elements first appears, forming a distinct local damage zone. The deletion of an isolated element is not considered failure initiation because it may result from local numerical instability or mesh dependency. Accordingly, the failure-inducing blast load is defined by the formation of a continuous local damage zone rather than an isolated element deletion event.
The flexural tensile resistance of concrete is estimated using the ACI 318 modulus of rupture equation for normal-weight concrete, as given in Equation (1), where is the specified concrete compressive strength and is the concrete density modification factor. Because normal-weight concrete is used in this study, = 1.0. Substituting = 27.58 MPa into Equation (1) yields a modulus of rupture of 3.26 MPa, as shown in Equation (2).
As summarized in Table 2, the square structure exhibits different failure-inducing blast loads depending on the evaluation region. In the roof region, continuous concrete element deletion first occurs at a TNT charge weight of 1200 kg. Accordingly, the roof failure-inducing blast load is determined to be 1200 kg. Under this loading condition, the peak reflected pressure at the inner roof center is 12.0 MPa, and the maximum roof and side-wall displacements are 6.54 and 5.05 mm, respectively. In the side-wall region, continuous concrete element deletion first occurs at a TNT charge weight of 1500 kg.
Table 2.
Failure-inducing TNT charge weights and corresponding peak reflected pressures and maximum displacements.
Accordingly, the side-wall failure-inducing blast load of the square structure is determined to be 1500 kg. Under this loading condition, the peak reflected pressure at the inner roof center is 13.7 MPa, and the maximum roof and side-wall displacements are 13.4 and 7.34 mm, respectively. As shown in Figure 4, continuous concrete element deletion first occurs in the roof region at a TNT charge weight of 1200 kg, whereas a continuous local damage zone develops in the side-wall region at 1500 kg. These results indicate that the roof region reaches the critical damage state earlier than the side-wall region.
Figure 4.
Continuous concrete element deletion at the failure-inducing blast loads of the square structure: (a) roof region at a TNT charge weight of 1200 kg and (b) side-wall region at a TNT charge weight of 1500 kg.
For the circular structure, continuous concrete element deletion also occurs at different TNT charge weights depending on the evaluation region. In the roof region, continuous concrete element deletion first occurs at a TNT charge weight of 1200 kg, which is identical to that of the square structure. Accordingly, the roof failure-inducing blast load is determined to be 1200 kg. Under this loading condition, the peak reflected pressure at the inner roof center is 12.0 MPa, and the maximum roof and side-wall displacements are 9.28 and 2.06 mm, respectively. In the side-wall region, continuous concrete element deletion first occurs at a TNT charge weight of 2500 kg. Accordingly, the side-wall failure-inducing blast load is determined to be 2500 kg. Under this loading condition, the peak reflected pressure at the inner roof center is 20.5 MPa, and the maximum roof and side-wall displacements are 19.6 and 3.63 mm, respectively. As shown in Figure 5, adjacent concrete elements are continuously deleted in the roof region of the circular structure at a TNT charge weight of 1200 kg, forming a distinct local damage zone near the roof center. Continuous element deletion is also observed on the inner surface of the side wall at a TNT charge weight of 2500 kg. These results indicate that the roof region reaches the critical damage state earlier than the side-wall region. The peak reflected pressures listed in Table 2 are 12.0 MPa for the square roof, 13.7 MPa for the square side wall, 12.0 MPa for the circular roof, and 20.5 MPa for the circular side wall. These values are substantially higher than the estimated modulus of rupture of the concrete. However, the reflected pressure is an external load acting on the structural surface and should not be interpreted directly as the internal stress within the concrete. Instead, the comparison indicates that the applied pressure is sufficient to generate flexural tensile demand, shear–tension interaction, and localized strain concentrations that can lead to concrete damage and element deletion. Therefore, continuous element deletion is more appropriately interpreted as an indicator of local tensile or combined shear–tension damage rather than pure compressive crushing. The maximum displacements listed in Table 2 remain small relative to the full-scale dimensions of the structures. This does not contradict the occurrence of continuous concrete element deletion because the failure-inducing blast load in this study is defined by the initiation of local damage rather than global deformation. Owing to the large dimensions and high global stiffness of the analyzed structures, severe local damage can develop on the internal surface while the overall displacement remains relatively small. These results support the use of continuous element deletion as the failure criterion because displacement-based criteria alone may underestimate the onset of severe local damage in full-scale enclosed RC structures.
Figure 5.
Continuous concrete element deletion at the failure-inducing blast loads of the circular structure: (a) roof region at a TNT charge weight of 1200 kg and (b) side-wall region at a TNT charge weight of 2500 kg.
The orientation of the continuous element deletion zone differs between the square and circular structures. As shown in Figure 4 and Figure 5, the side-wall damage zone of the square structure extends predominantly in the horizontal direction, whereas that of the circular structure develops predominantly in the vertical direction. In the square structure, the horizontal damage pattern is associated with the out-of-plane bending response of the flat wall and the concentration of blast-induced demand at the elevation of the detonation point. In contrast, the vertical damage pattern in the circular structure is associated with the radial expansion of the curved wall and the resulting circumferential tensile response under internal pressure. Therefore, the cross-sectional shape affects not only the failure-inducing blast load but also the orientation and distribution of local damage. In contrast, the roof failure-inducing blast load is identical for both structures (1200 kg TNT). This result indicates that, under identical internal blast-loading conditions, the roof resistance is governed primarily by the standoff distance between the detonation point and the inner roof surface rather than by the cross-sectional geometry, because this distance is the same in both structures. Although the roof failure-inducing blast load is identical for both structures, their displacement responses differ markedly at this load level. The square structure exhibits a maximum roof displacement of 6.54 mm and a maximum side-wall displacement of 5.05 mm, whereas the circular structure exhibits corresponding values of 9.28 and 2.06 mm. The side-wall displacement of the square structure is approximately 2.5 times that of the circular structure, indicating that the flat wall is more susceptible to lateral deformation under the same TNT charge weight. The difference between the two structural shapes is more pronounced in the side-wall region. The side-wall failure-inducing blast load is 1500 kg for the square structure and 2500 kg for the circular structure, indicating that the circular structure provides approximately 67% greater side-wall blast resistance. Furthermore, the difference between the roof and side-wall failure-inducing blast loads is only 300 kg for the square structure, compared with 1300 kg for the circular structure. This indicates that the square structure reaches side-wall failure soon after roof damage initiation, whereas the circular structure maintains substantially greater side-wall resistance following roof damage initiation. Although the circular side wall is subjected to a higher peak reflected pressure at its failure-inducing blast load, its maximum side-wall displacement remains smaller than that of the square structure. Specifically, the square structure exhibits a maximum side-wall displacement of 7.34 mm at a TNT charge weight of 1500 kg, whereas the circular structure exhibits a maximum displacement of 3.63 mm at 2500 kg. These results indicate that the side-wall displacement is governed not only by the magnitude of the reflected pressure but also by the cross-sectional geometry and lateral load-resisting mechanism. The flat wall of the square structure is more susceptible to out-of-plane deformation, whereas the curved wall of the circular structure distributes the blast-induced load circumferentially through membrane action. Consequently, the circular structure exhibits greater resistance to side-wall damage under identical material properties, wall thickness, reinforcement ratio, blast-source location, and boundary conditions. In this study, the critical failure-inducing blast load of the entire structure is defined as the minimum TNT charge weight at which continuous element deletion first occurs in any designated evaluation region. Based on this criterion, the critical failure-inducing blast load is 1200 kg for both the square and circular structures. Although the two structures have the same critical failure-inducing blast load, the circular structure exhibits substantially greater side-wall blast resistance, with a side-wall failure-inducing blast load approximately 67% higher than that of the square structure. Moreover, at the same critical failure-inducing blast load, the side-wall displacement of the square structure is approximately 2.5 times that of the circular structure, indicating greater susceptibility to lateral wall deformation under identical internal blast-loading conditions. Therefore, the circular cross-section provides a clear advantage in overall blast resistance under internal blast loading.
3.2. Sensitivity Analysis of the Failure-Inducing Blast Load
A sensitivity analysis was conducted to examine the effects of small variations in key material and structural parameters on the structural response at the failure-inducing blast load. The roof failure-inducing blast load of 1200 kg was selected for both the circular and square structures because it corresponds to the critical failure-inducing blast load of each structure. The concrete compressive strength and reinforcement ratio were independently varied by ±5% from their baseline values, while all other parameters were kept constant. As shown in Figure 6, the roof-center displacement–time histories obtained for the sensitivity cases are presented for the circular and square structures. In both structures, the displacement–time histories for the varied parameter cases show negligible deviation from the baseline response throughout the 50-ms analysis period. The overall response, including the initial rise, peak displacement, and subsequent decay, remains nearly unchanged across all sensitivity cases, indicating that the structural response is not significantly affected by small variations in the examined parameters.
Figure 6.
Roof-center displacement–time histories for the sensitivity analysis cases: (a) square structure and (b) circular structure.
As summarized in Table 3, the maximum roof-center displacement of the circular structure under the baseline condition is 9.38 mm. Increasing the concrete compressive strength by 5% slightly reduces the maximum displacement to 9.17 mm, corresponding to a decrease of 2.27% from the baseline. Conversely, a 5% reduction in compressive strength increases the maximum displacement to 9.55 mm, corresponding to an increase of 1.77%. When the reinforcement ratio is varied by ±5%, the maximum displacements are 9.21 and 9.56 mm, representing decreases and increases of 1.86% and 1.91%, respectively. For the square structure under the baseline TNT charge weight of 1200 kg, the maximum roof-center displacement is 6.60 mm. Increasing and decreasing the concrete compressive strength by 5% result in maximum displacements of 6.47 and 6.80 mm, corresponding to decreases and increases of 1.88% and 2.99%, respectively. Similarly, varying the reinforcement ratio by ±5% produces maximum displacements of 6.56 and 6.68 mm, corresponding to changes of −0.65% and +1.30%, respectively. In both structures, all variations in the maximum roof-center displacement remain within approximately 3% of the baseline value. These results indicate that the failure-inducing blast load and the associated structural response are not significantly affected by small variations in concrete compressive strength or reinforcement ratio. Therefore, the shape-dependent response differences discussed in the subsequent sections are primarily governed by the cross-sectional geometry rather than uncertainties in the material or reinforcement parameters.
Table 3.
Sensitivity analysis results for the maximum roof-center displacement at the failure-inducing blast load.
4. Comparative Analysis of Structural Response Under Progressive Internal Blast Loading
4.1. Damage Pattern Comparison Under Progressive Blast Loading
The resultant displacement and effective strain distributions of the square and circular structures under progressive internal blast loading are presented in Table 4 and Table 5, respectively. All contours are obtained at the end of the analysis (t = 50 ms) and represent the residual structural response following the primary blast event. The following discussion focuses on the spatial distribution, response symmetry, and evolution of the deformation and strain fields with increasing charge weight, rather than on specific numerical values. For the square structure, the resultant displacement and effective strain distributions are presented in Table 4. Under a 1200-kg charge, the displacement distribution exhibits a centrally concentrated elliptical pattern, reflecting the influence of the flat walls and corner restraints on the roof deformation response. Unlike the circular structure, the displacement contours are not perfectly symmetric and exhibit slight elongation in specific directions due to the geometric discontinuities at the corners.
Table 4.
Resultant displacement and effective strain contours of the square structure under progressive internal blast loading (t = 50 ms).
Table 5.
Resultant displacement and effective strain contours of the circular structure under progressive internal blast loading (t = 50 ms).
As the charge weight increases to 1500 kg, the displacement field expands significantly, and pronounced deformation develops in the wall region in addition to the roof center. This observation is consistent with the side-wall failure-inducing blast load of the square structure (1500 kg), at which continuous element deletion is first observed in the side-wall region. Under 2000 and 2500 kg, the displacement distribution exhibits simultaneous concentration at the roof center and progressive expansion throughout the wall region, indicating substantial deformation in both the roof and side-wall regions at higher charge weights.
The effective strain distribution of the square structure similarly reflects the progressive evolution of the deformation field with increasing charge weight. Under a 1200-kg charge, the strain is concentrated near the roof center, with a relatively broad and uniform distribution across the roof surface, which is more spatially extensive than that of the circular structure under the same loading condition. As the charge weight increases, the effective strain field expands toward the roof corners, where geometric stress concentrations at the wall–corner junctions produce locally elevated strain levels. Under 2000 and 2500 kg, pronounced strain concentrations develop at the corners, while the strain distribution in the wall region becomes more extensive, particularly in the lower wall area. This pattern differs from that of the circular structure, in which the strain distribution remains circumferentially uniform without pronounced corner concentrations. In the circular structure, the resultant displacement distribution exhibits a consistently radially symmetric pattern across all charge weight conditions, as shown in Table 5. Under a 1200-kg charge, the displacement is concentrated in a compact circular zone at the roof center, with the magnitude gradually and uniformly decreasing toward the roof edge and wall region. As the charge weight increases to 1500 and 2000 kg, the central high-displacement zone progressively expands while maintaining radial symmetry, indicating that blast-induced deformation propagates outward from the roof center in a uniform and geometrically consistent manner. Under 2500 kg, the displacement field extends further across the roof surface, and localized deformation begins to develop along the wall region, reflecting the initiation of side-wall damage at this charge weight level. The effective strain distribution of the circular structure provides further insight into the spatial evolution of the deformation field. Under a 1200-kg charge, the strain is concentrated in a relatively compact region near the roof center, exhibiting a smooth and symmetric distribution. As the charge weight increases to 1500 and 2000 kg, the high-strain zone evolves from a compact central pattern into a cross-shaped (+) distribution, which is attributed to the orthogonal reinforcement grid arrangement within the roof slab. This strain pattern highlights the influence of reinforcement layout on the spatial distribution of deformation under increasing blast demand. Under 2500 kg, the effective strain distribution extends further across the roof surface, and additional strain concentration develops along the lower wall region, consistent with the occurrence of side-wall damage at this charge weight level. Throughout all loading stages, the effective strain distribution of the circular structure maintains a fundamentally symmetric pattern, reflecting the axisymmetric geometry of the circular cross-section and its ability to distribute blast-induced responses uniformly along the circumferential direction. Comparatively, the square structure exhibits a nonuniform response, with localized deformation concentrations at the roof center and corner regions that become more pronounced with increasing charge weight. In contrast, the circular structure consistently demonstrates a radially symmetric and circumferentially uniform response pattern under all loading stages, reflecting the efficient load redistribution capability of its curved wall geometry. These shape-dependent differences in deformation and strain distributions indicate that cross-sectional geometry influences not only the magnitude of structural response but also the spatial evolution of blast-induced damage in enclosed RC structures.
4.2. Displacement and Reinforcement Strain Response Comparison
To quantitatively evaluate the shape-dependent structural response under progressive internal blast loading, the displacement and reinforcement strain responses are compared at selected measurement locations in the square and circular structures. These locations are selected to capture the representative response of key structural regions, including the roof center, side-wall mid-height, and corner areas, as shown in Figure 7. The roof-center measurement points are defined at the geometric center of the inner roof surface for both structures. In the square structure, S-R1, S-R2, and S-R3 are located along the roof centerline at intervals of 8500 mm from the roof center. In the circular structure, C-R1 is located at the roof center, while C-R2 and C-R3 are positioned at radial distances of 9500 mm from the center along the roof surface. These points are selected to capture the displacement response at the internal surface closest to the detonation point, where the highest reflected pressure is expected under internal blast loading. The side-wall measurement points are defined at the mid-height of the inner wall surface in both structures. In the square structure, S-W1 and S-W2 are positioned at heights of 9500 and 0 mm from the base, respectively, on the inner wall surface at the wall-center region. This region is selected as the representative side-wall evaluation location, consistent with the failure-inducing blast load assessment described in Section 2.5. In the circular structure, C-W1 and C-W2 are similarly located on the inner wall surface at heights of 9500 and 0 mm from the base, respectively, along the representative side-wall region. These points are selected to evaluate the out-of-plane lateral deformation response of the walls under internal blast pressure, which is governed by the shape-dependent lateral load-resisting mechanisms of each structure.
Figure 7.
Evaluation locations for failure-inducing blast load and structural response: (a) square structure; (b) circular structure.
In addition to the roof and side-wall measurement points, corner measurement points S-K1, S-K2, and S-K3 are defined for the square structure at the corner region, with heights of 9500, 19,000, and 0 mm from the base, respectively. These corner points are included because the corners of the square structure represent geometric discontinuities where local stress concentrations and displacement amplification may occur under internal blast loading. No corresponding corner measurement points are defined for the circular structure because its circular cross-section maintains a constant radial distance from the center to the inner wall surface and lacks geometric corner discontinuities.
This measurement configuration enables evaluation of the shape-dependent differences in roof, side-wall, and corner displacement responses under progressive internal blast loading conditions.
4.2.1. Quantitative Comparison of Displacement and Reinforcement Strain Responses
As shown in Table 6, the maximum resultant displacements at each measurement location are compared between the circular and square structures under four charge weight conditions (1200, 1500, 2000, and 2500 kg). For both structures, the maximum resultant displacement increases with increasing charge weight at nearly all measurement locations, confirming a consistent load–response relationship under progressive internal blast loading. In the circular structure, the largest displacement occurs at C-R1, located at the roof center, which represents the closest internal surface point to the detonation source. The maximum displacement at C-R1 increases from 9.276 mm at 1200 kg to 19.561 mm at 2500 kg, corresponding to a 110.9% increase over the considered charge weight range.
Table 6.
Maximum resultant displacement at each measurement location.
C-R2, located at a radial distance of 9500 mm from the roof center, exhibits a similar increasing trend, with a maximum displacement of 12.872 mm at 2500 kg. C-R3, positioned at the outermost roof measurement point, shows a comparatively smaller displacement response, with a maximum value of 1.274 mm at 2500 kg, reflecting the attenuation of blast-induced deformation with increasing radial distance from the detonation point. For the side-wall measurement points, C-W1, located at the mid-height of the inner wall surface, records a maximum displacement of 3.616 mm at 2500 kg, whereas C-W2, located at the wall base, exhibits a significantly smaller response of 0.116 mm, consistent with the fixed-base boundary condition applied at the bottom of the structure. In the square structure, the maximum displacement occurs at S-R1, the roof center point, with a value of 13.044 mm at 2500 kg, representing a 99.4% increase from 6.541 mm at 1200 kg. Compared with C-R1 of the circular structure under the same charge weight condition, S-R1 exhibits a 33.3% lower displacement, suggesting that the roof of the square structure has greater resistance to vertical deformation under internal blast loading. S-R2 records a maximum displacement of 9.519 mm at 2500 kg, while S-R3 exhibits a non-monotonic response, with a peak value of 2.256 mm at 2000 kg, followed by a reduction to 1.787 mm at 2500 kg. This behavior is attributed to the nonlinear dynamic response of the roof slab, where phase differences in the transient displacement response can reduce the observed peak displacement at higher charge weights. For the side-wall measurement points, S-W1 records a maximum displacement of 9.459 mm at 2500 kg, which is 161.6% higher than that of C-W1 (3.616 mm) under the same condition. This indicates that the flat wall of the square structure undergoes substantially greater out-of-plane lateral deformation than the curved wall of the circular structure. At the corner measurement points, S-K1 and S-K2 exhibit maximum displacements of 1.135 mm and 1.614 mm at 2500 kg, respectively. Although these corner displacements are smaller than the wall-center displacement at S-W1, this does not imply that the corner regions are structurally insignificant. The lower displacement at the corner points is attributed to the geometric restraint provided by the intersection of two orthogonal wall panels, which limits out-of-plane deformation compared with the flat wall-center region. However, the corner regions remain local discontinuity zones where blast-induced stress and strain concentrations can develop. This tendency is consistent with the effective strain contours of the square structure, where relatively elevated strain regions develop near the roof–wall and wall–corner junctions with increasing charge weight. Therefore, the corner response should be interpreted not as a dominant global displacement response but as a local damage-sensitive region associated with geometric discontinuity and load redistribution in the square structure. Similarly, in the circular structure, the roof–wall interface should be regarded as a local damage-sensitive region because changes in curvature and boundary stiffness can promote strain concentration and load redistribution under internal blast loading. Thus, although the circular cross-section lacks corner discontinuities, the roof–wall interface still requires careful consideration when evaluating local damage development in the enclosed circular structure. S-K1 also exhibits a non-monotonic response, consistent with that observed at S-R3, with a peak displacement of 1.423 mm at 2000 kg followed by a reduction at 2500 kg. As shown in Table 7, the maximum tensile and compressive axial strains at each reinforcement location are compared between the circular and square structures. The yield strain of the modeled reinforcement is calculated as . Under all charge weight conditions and at all reinforcement locations, the recorded axial strains remain well below the yield strain. The maximum observed strain is 2.10 × 10⁻⁴ at the inner horizontal reinforcement of the circular structure under 2500 kg, corresponding to approximately 10.1% of . This confirms that all reinforcement remains within the elastic range throughout the considered charge weight range. However, reinforcement remaining elastic does not preclude concrete damage or failure. As indicated by the ACI 318 modulus of rupture of 3.26 MPa estimated in Section 3.1, the flexural tensile resistance of concrete is substantially lower than the reinforcement yield strength. Therefore, blast-induced tensile and spalling stresses can exceed the tensile capacity of concrete, leading to local concrete damage and element deletion while the reinforcement remains elastic, as confirmed by the element deletion results presented in Section 3. In the circular structure, the inner and outer horizontal reinforcements exhibit the largest strain magnitudes, with maximum tensile strains of 2.10 × 10⁻⁴ and 1.89 × 10⁻⁴ at 2500 kg, respectively. Both reinforcements show a consistent increasing trend with charge weight. The roof reinforcements exhibit opposite strain polarities. The inner roof reinforcement is dominated by compressive strain, reaching −9.20 × 10⁻⁵ at 2500 kg, whereas the outer roof reinforcement is predominantly tensile, with a maximum strain of 9.60 × 10⁻⁵ at the same charge weight. This opposing strain response reflects the bending behavior of the roof slab under internal blast pressure, where the inner surface experiences compression and the outer surface experiences tension. In the square structure, the outer horizontal reinforcement exhibits the largest tensile strain, increasing monotonically from 6.20 × 10⁻⁵ at 1200 kg to 1.22 × 10⁻⁴ at 2500 kg. In contrast, the inner horizontal reinforcement shows a decreasing tensile strain with increasing charge weight, from 6.20 × 10⁻⁵ at 1200 kg to 4.50 × 10⁻⁵ at 2500 kg, while its compressive strain increases from −6.90 × 10⁻⁵ to −9.70 × 10⁻⁵ over the same range.
Table 7.
Maximum axial strain (ε) at each reinforcement location.
This indicates that the inner horizontal reinforcement transitions toward a compression-dominant response with increasing charge weight, consistent with the increasing out-of-plane lateral deformation of the flat wall observed in the displacement results. The roof reinforcements of the square structure exhibit smaller strain magnitudes than the horizontal reinforcements, with all values remaining within the elastic range.
4.2.2. Overall Deformation Distribution
As shown in Figure 8, the displacement–time histories at the roof center and side-wall mid-height measurement points are compared for the square and circular structures under a 2500-kg TNT charge. In both structures, the roof-center displacement (S-R1 and C-R1) increases rapidly after detonation and reaches its peak within the first 35 ms, followed by gradual attenuation with oscillations. The side-wall mid-height displacement (S-W1 and C-W1) exhibits a similar temporal evolution but shows a notably different magnitude depending on the cross-sectional geometry.
Figure 8.
Displacement–time histories at key measurement locations under 2500-kg TNT internal blast loading: (a) resultant displacement–time histories at the roof center (S-R1) and side-wall mid-height (S-W1) of the square structure; (b) resultant displacement–time histories at the roof center (C-R1) and side-wall mid-height (C-W1) of the circular structure.
In the square structure, the roof-center displacement S-R1 reaches a maximum of 13.04 mm at approximately 34.5 ms and exhibits more gradual attenuation than the circular structure. The side-wall mid-height displacement S-W1 reaches a maximum of 9.46 mm at approximately 28.1 ms. The ratio of the peak roof displacement to the peak side-wall displacement is approximately 1.4, indicating that roof and side-wall deformations are of comparable magnitude. Furthermore, the side-wall displacement of the square structure remains relatively large throughout the analysis duration, reflecting the limited capacity of the flat wall to resist out-of-plane lateral deformation under internal blast pressure. In the circular structure, the roof-center displacement C-R1 reaches a maximum of 19.56 mm at approximately 23.8 ms and subsequently decreases with damped oscillations, stabilizing at a residual displacement of approximately 18.5 mm at the end of the analysis. The C-R1 displacement is 50.0% higher than that of S-R1 in the square structure. The side-wall mid-height displacement C-W1 reaches a maximum of 3.62 mm at approximately 20.7 ms, then rapidly decreases to near zero before recovering to a small residual level. The C-W1 displacement is 61.7% lower than that of S-W1 in the square structure.
To further examine the temporal relationship between local pressure demand and deformation development, the local element pressure and resultant displacement–time histories are compared at representative locations of the square structure under the 2500-kg TNT condition, as shown in Figure 9. The selected locations are the roof center S-R1, wall center S-W1, and corner region S-K2, which represent the primary roof response, side-wall out-of-plane response, and local response near a geometric discontinuity, respectively. At S-R1, the local pressure response develops immediately after detonation and exhibits several transient peaks during the early stage of the analysis. The displacement response subsequently increases and reaches its peak after the dominant pressure response, indicating that the roof deformation develops as a delayed dynamic response to the local blast-induced pressure demand. At S-W1, the local pressure response develops later than at S-R1, and the corresponding displacement increases gradually before reaching its peak. This behavior indicates that the flat wall segment undergoes delayed out-of-plane deformation following the pressure demand acting on the side-wall region. At S-K2, the magnitude of the displacement response is smaller than that at S-R1 and S-W1 because the intersection of the orthogonal wall panels provides geometric restraint. Nevertheless, the pressure and displacement histories at S-K2 show a transient local pressure response and subsequent oscillatory deformation, indicating that the corner region remains a local damage-sensitive region despite its limited global displacement. It should be noted that the local element pressure histories do not represent explicit gas-domain shock-wave reflection or quasi-static pressure accumulation as obtained from ALE, CFD, or coupled fluid–structure interaction simulations. Rather, they represent the local pressure response of structural elements under the empirical *LOAD_BLAST_ENHANCED loading condition. Therefore, the coupled pressure–displacement histories are used to support the relative interpretation of location-dependent pressure demand, delayed deformation development, and rebound-like oscillatory structural response, rather than to reproduce the complete gas-dynamic process of a fully confined internal explosion.
Figure 9.
Time histories of local element pressure and resultant displacement at representative locations of the square structure under 2500-kg TNT internal blast loading: (a) roof center S-R1; (b) wall center S-W1; and (c) corner region S-K2.
The ratio of the peak roof displacement to the peak side-wall displacement is approximately 5.4, indicating that the deformation response of the circular structure is dominated by roof deformation rather than side-wall deformation. This behavior reflects the membrane action of the curved wall, which efficiently redistributes internal blast-induced lateral pressure along the circumferential direction, thereby limiting out-of-plane wall deformation. As illustrated schematically in Figure 10, the overall deformation patterns of the two structures under internal blast loading differ significantly. In both structures, the base is fixed, resulting in zero displacement at the wall base. The side-wall displacement increases from the base, reaches a maximum slightly above the wall mid-height due to the combined effects of the fixed-base boundary condition and distributed blast pressure along the wall height, and then decreases toward the upper wall region. The roof slab deforms outward and upward, with the maximum displacement occurring at the roof center. In the square structure, both roof and side-wall deformations are significant, with the side-wall deformation substantially greater than that of the circular structure under the same charge weight condition. In contrast, the circular structure exhibits dominant roof deformation and comparatively limited side-wall deformation.
Figure 10.
Schematic deformation profiles of the circular and square structures under 2500-kg TNT internal blast loading: (a) deformation profile of the square structure, showing comparable roof and side-wall displacements with significantly greater out-of-plane wall deformation than the circular structure; (b) deformation profile of the circular structure, showing dominant roof displacement and limited side-wall deformation due to the membrane action of the curved wall.
The present results are generally consistent with previous internal blast studies, which indicate that internal blast loading produces localized concrete damage, concentrated deformation near blast-facing surfaces, and response patterns strongly influenced by confinement and geometry. Internal explosions in RC frame structures with infill walls can generate localized damage and deformation patterns governed by internal layout and boundary conditions [10]. Large-scale multi-box structures subjected to internal blast loading can exhibit nonuniform damage distributions associated with reflected waves, compartment geometry, and structural discontinuities [11]. In addition, studies on RC tubular structures under internal explosions have shown that tubular geometry influences the distribution of blast-induced deformation and damage [8]. Compared with these studies, the present work focuses on a full-scale enclosed RC configuration and directly compares circular and square cross-sectional shapes under identical material properties, boundary conditions, and loading assumptions. The displacement magnitudes obtained in this study are not directly comparable with those reported in the literature due to differences in structural scale, explosive type and charge weight, confinement conditions, reinforcement layouts, and boundary conditions. Nevertheless, the results demonstrate a consistent trend that internal blast damage is governed by local concrete tensile damage and that geometric configuration significantly affects deformation and damage distributions. In particular, the comparison shows that the circular structure limits side-wall deformation through circumferential load redistribution, whereas the square structure exhibits greater out-of-plane wall displacement and localized strain concentrations near geometric discontinuities.
5. Conclusions
This study presents a comparative numerical investigation of the internal blast response of enclosed circular and square RC structures under progressive TNT charge weight conditions using LS-DYNA finite element analysis. Although the overall superiority of circular sections for blast-resistant structural applications has been widely recognized, full-scale quantitative comparisons of fully enclosed RC structures under progressive internal blast loading, particularly those based on numerical damage evolution criteria, remain limited. Therefore, this study focuses on the shape-dependent internal blast response of full-scale enclosed RC structures by defining the failure-inducing blast load based on the first occurrence of continuous concrete element deletion and quantitatively evaluating displacement and reinforcement strain responses at selected measurement locations. It should be noted that the failure-inducing blast load discussed in this study does not represent an absolute real-world confined-blast failure threshold. Instead, it should be interpreted as an erosion-based comparative indicator under the adopted empirical blast-loading and material-modeling assumptions. The following conclusions are drawn from the results of this study.
- The failure-inducing blast loads determined based on continuous concrete element deletion reveal a clear shape-dependent difference in the side-wall blast resistance of the two structural types. The roof failure-inducing blast load is identical for both structures at 1200 kg, indicating that roof resistance under internal blast loading is governed primarily by the standoff distance between the detonation point and the inner roof surface rather than the cross-sectional geometry. In contrast, the side-wall failure-inducing blast loads are 1500 kg for the square structure and 2500 kg for the circular structure, indicating that the circular structure exhibits approximately 67% higher side-wall blast resistance than the square structure. This difference is attributed to the membrane action of the curved wall, which redistributes internal blast-induced lateral pressure along the circumferential direction and limits out-of-plane deformation.
- The orientation and distribution of the continuous element deletion zones differ between the two structural shapes. In the circular structure, the side-wall damage zone develops primarily in the vertical direction, associated with the circumferential tensile response under internal pressure. In the square structure, the side-wall damage zone extends mainly in the horizontal direction, reflecting the out-of-plane bending response of the flat wall and the concentration of blast-induced demand at the detonation height. These results indicate that cross-sectional shape influences not only the failure-inducing blast load but also the pattern and orientation of local damage.
- Under progressive internal blast loading, the displacement responses of the two structures exhibit distinctly different characteristics. In the circular structure, roof-center displacement dominates, with a peak value of 19.56 mm at 2500 kg, whereas the side-wall mid-height displacement remains comparatively small at 3.62 mm, resulting in a roof-to-wall displacement ratio of approximately 5.4. In the square structure, the roof-center displacement of 13.04 mm at 2500 kg is 33.3% lower than that of the circular structure, whereas the side-wall mid-height displacement of 9.46 mm is 161.6% higher, resulting in a roof-to-wall displacement ratio of approximately 1.4. These results confirm that the curved wall geometry of the circular structure provides significantly greater resistance to lateral wall deformation under internal blast loading.
- The displacement–time histories at 2500 kg demonstrate that the peak roof displacement of the circular structure occurs at approximately 23.8 ms, followed by damped oscillations with a large residual displacement. In contrast, the side-wall displacement of the circular structure rapidly decreases after reaching its peak, whereas that of the square structure remains relatively high throughout the analysis duration. This sustained lateral deformation of the square wall reflects the limited lateral resistance of the flat wall geometry under continued internal blast pressure.
- Under all charge weight conditions and at all evaluated reinforcement locations, the recorded axial strains remain well below the yield strain of the modeled reinforcement ( = 0.00207), confirming that the reinforcement remains within the elastic range throughout the considered charge weight range. The maximum observed strain is 2.10 × 10⁻⁴ at the inner horizontal reinforcement of the circular structure under 2500 kg, corresponding to approximately 10.1% of . This result indicates that concrete damage and element deletion under internal blast loading are governed by the low tensile capacity of concrete ( = 3.26 MPa) rather than reinforcement yielding. It also demonstrates that displacement- or strain-based assessment of reinforcement alone is insufficient to characterize the initiation of local structural damage in enclosed RC structures.
- A sensitivity analysis conducted by independently varying the concrete compressive strength and reinforcement ratio by ±5% from their baseline values confirms that the structural response under failure-inducing blast load conditions is not significantly affected by minor parametric variations, with all peak displacement differences remaining within approximately 3% of the baseline values. These results indicate that the shape-dependent response differences identified in this study are governed primarily by cross-sectional geometry rather than by uncertainties in material properties or reinforcement parameters.
- Future work should include full-scale experimental validation to further verify the numerical simulation results presented in this study. In addition, ALE, CFD, or coupled fluid–structure interaction simulations are required to explicitly evaluate repeated shock-wave reflections, pressure accumulation, and quasi-static pressure development under fully confined internal blast conditions. Simulations considering different detonation heights and blast-source locations are also needed to evaluate the influence of charge position on pressure distribution, local damage evolution, and global structural response in fully enclosed RC structures.
Author Contributions
Investigation, data analysis, main writing, H.J.; conceptualization, methodology, J.-H.J.K. All authors have read and agreed to the published version of the manuscript.
Funding
This work was supported by the Nuclear Safety Research Program through the Korea Foundation of Nuclear Safety (KOFONS), using financial resources granted by the Nuclear Safety and Security Commission (NSSC) of the Republic of Korea (RS-2021-KN058010).
Data Availability Statement
The original contributions presented in this study are included in the article. Further inquiries can be directed to the corresponding author.
Conflicts of Interest
The authors declare no conflicts of interest.
Abbreviations
The following abbreviations are used in this manuscript:
| RC | Reinforced Concrete |
| PSC | Prestressed Concrete |
| TNT | Trinitrotoluene |
| ACI | American Concrete Institute |
Nomenclature
| Symbol | Description | Unit |
| Specified compressive strength of concrete | MPa | |
| Modulus of rupture of concrete | MPa | |
| Modification factor for concrete density (ACI 318) | - | |
| Yield strength of reinforcement | MPa | |
| Elastic modulus of reinforcement | MPa | |
| Yield strain of reinforcement | - | |
| Axial strain of reinforcement | - | |
| Reinforcement ratio per wall face | - |
References
- Ngo, T.; Mendis, P.; Gupta, A.; Ramsay, J. Blast loading and blast effects on structures–an overview. Electron. J. Struct. Eng. 2007, 1, 76–91. [Google Scholar] [CrossRef]
- Acosta, P.F. Overview of UFC 3-340-02 structures to resist the effects of accidental explosions. In Structures Congress; ASCE: Reston, VA, USA, 2011; pp. 1454–1469. [Google Scholar] [CrossRef]
- Choi, J.H.; Choi, S.J.; Cho, C.M.; Kim, T.K.; Kim, J.H.J. Experimental evaluation of bi-directionally unbonded prestressed concrete panel blast resistance behavior under blast loading scenario. J. Korea Concr. Inst. 2016, 28, 673–683. [Google Scholar] [CrossRef]
- Choi, J.H.; Choi, S.J.; Kim, K.T.; Kim, J.H.J. Damage evaluation of bi-directionally prestressed concrete panels under blast-fire combined loading. J. Korea Concr. Inst. 2017, 29, 237–248. [Google Scholar] [CrossRef]
- Kingery, C.N.; Bulmash, G. Airblast Parameters from TNT Spherical Air Burst and Hemispherical Surface Burst; US Army Armament and Development Center, Ballistic Research Laboratory: Aberdeen Proving Ground, MD, USA; Adelphi, MD, USA, 1984. [Google Scholar]
- Karlos, V.; Solomos, G.; Larcher, M. Analysis of Blast Parameters in the Near-Field for Spherical Free-Air Explosions; Publications Office of the European Union: Luxembourg, 2016. [Google Scholar] [CrossRef] [PubMed]
- Karlos, V.; Solomos, G.; Larcher, M. Analysis of the blast wave decay coefficient using the Kingery–Bulmash data. Int. J. Prot. Struct. 2016, 7, 409–429. [Google Scholar] [CrossRef]
- Choi, S.J.; Lee, T.H.; Noor, N.M.; Kim, J.H.J. Blast resistance of RC tubular structure under internal ANFO explosion. Sci. Rep. 2022, 12, 21736. [Google Scholar] [CrossRef] [PubMed]
- Jung, H.; Choi, S.J.; Kim, J.H.J. Stiffness analysis at failure state of reinforced concrete and prestressed concrete tubular members under internal blast loading. Appl. Sci. 2026, 16, 1435. [Google Scholar] [CrossRef]
- Zhang, Z.; Jia, B.; Lu, Y.; Li, J.; Feng, X. Experimental and numerical investigation of internal explosions in RC frame structures with foam concrete infill walls. Structures 2025, 81, 110261. [Google Scholar] [CrossRef]
- Yao, S.; Chen, F.; Wang, Y.; Ma, Y.; Zhao, N.; Zhang, D.; Lu, F. Experimental and numerical investigation on the dynamic response and damage of large-scale multi-box structure under internal blast loading. Thin-Walled Struct. 2023, 183, 110430. [Google Scholar] [CrossRef]
- Choi, J.H.; Choi, S.J.; Kim, J.H.J.; Hong, K.N. Evaluation of blast resistance and failure behavior of prestressed concrete under blast loading. Constr. Build. Mater. 2018, 173, 550–572. [Google Scholar] [CrossRef]
- Abd-El-Nabi, E.; El-Helloty, A.; Summra, A. Numerical analysis of reinforced concrete buildings subjected to blast load. Struct. Concr. 2023, 24, 3727–3743. [Google Scholar] [CrossRef]
- Wu, J.; Zhou, Y.; Zhang, R.; Liu, C.; Zhang, Z. Numerical simulation of reinforced concrete slab subjected to blast loading and the structural damage assessment. Eng. Fail. Anal. 2020, 118, 104926. [Google Scholar] [CrossRef]
- Maazoun, A.; Matthys, S.; Mourao, R.; Vantomme, J. Numerical prediction of the dynamic response of prestressed concrete hollow core slabs under blast loading. In Proceedings of the 11th European LS-DYNA Conference, Salzburg, Austria, 9–11 May 2017; pp. 1–8. [Google Scholar]
- Xu, J.; Lu, Y. Numerical Modelling for Reinforced Concrete Response to Blast Load: Understanding the Demands on Material Models; SP-306; American Concrete Institute: Singapore, 2016. [Google Scholar]
- Wang, L.; Cheng, S.; Liao, Z.; Yin, W.; Liu, K.; Ma, L.; Wang, T.; Zhang, D. Blast resistance of reinforced concrete slabs based on residual load-bearing capacity. Materials 2022, 15, 6449. [Google Scholar] [CrossRef] [PubMed]
- Schwer, L.; Teng, H.; Souli, M. LS-DYNA air blast techniques: Comparisons with experiments for close-in charges. In Proceedings of the 10th European LS-DYNA Conference, Würzburg, Germany, 15–17 June 2015; pp. 15–17. [Google Scholar]
- Wilson, D.; Blass, D.; Noli, S. Implementation of MCEER TR 14-0006 blast load curves in LS-DYNA and benchmark to commonly practiced blast loading application methods. In Proceedings of the 15th International LS-DYNA Users Conference, Dearborn, MI, USA, 10–12 June 2018; pp. 1–18. [Google Scholar]
- Guo, X.; Li, Y.; McCrum, D.P.; Hu, Y.; Bai, Z.; Zhang, H.; Li, Z.; Wang, X. A reinforced concrete shear wall building structure subjected to internal TNT explosions: Test results and numerical validation. Int. J. Impact Eng. 2024, 190, 104950. [Google Scholar] [CrossRef]
- Guo, X.; Li, Y.; McCrum, D.P.; Hu, Y.; Bai, Z. A reinforced concrete shear wall building structure subjected to internal TNT explosions: TNT location parameter study and new simplified uniformly distributed overpressure calculation model. Eng. Struct. 2025, 341, 120867. [Google Scholar] [CrossRef]
- Yao, S.; Wang, Y.; Hu, Y.; Zhang, D. A fast calculation method for internal blast shock wave in confined structures. J. Vib. Control 2025, 31, 2181–2193. [Google Scholar] [CrossRef]
- Huang, Y.; Chen, S.; Chen, X. Pressure–time history prediction for fully and partially confined explosions by combining physical and deep learning models. Eng. Struct. 2025, 339, 120575. [Google Scholar] [CrossRef]
- Liu, J.; Wang, W.; Xu, Z.; Li, Y.; Ouyang, X.; Zhou, Y. Experimental and numerical simulation investigation of reinforced concrete single-room structures under internal explosion loading. Structures 2026, 88, 111870. [Google Scholar] [CrossRef]
- Malvar, L.J.; Crawford, J.E.; Wesevich, J.W.; Simons, D. A plasticity concrete material model for DYNA3D. Int. J. Impact Eng. 1997, 19, 847–873. [Google Scholar] [CrossRef]
- Schwer, L.E.; Malvar, L.J. Simplified concrete modeling with MAT_CONCRETE_DAMAGE_REL3. In Proceedings of the JRI LS-DYNA User Week, Nagoya, Japan, 29–30 November 2005; pp. 49–60. [Google Scholar]
- Wu, Y.; Crawford, J.E.; Magallanes, J.M. Performance of LS-DYNA Concrete Constitutive Models. In Proceedings of the 12th International LS-DYNA Users Conference, Dearborn, MI, USA, 3–5 June 2012; Volume 1, pp. 1–14. [Google Scholar]
- Wu, Y.; Crawford, J.E.; Lan, S.; Magallanes, J.M. Validation studies for concrete constitutive models with blast test data. In Proceedings of the 13th International LS-DYNA Users Conference, Dearborn, MI, USA, 8–10 June 2014; pp. 1–12. [Google Scholar]
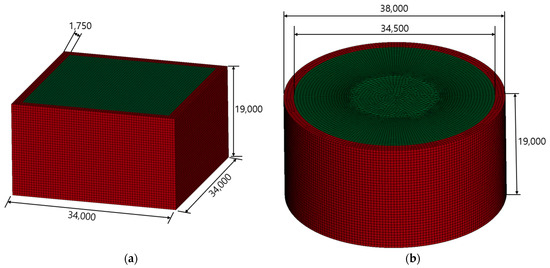
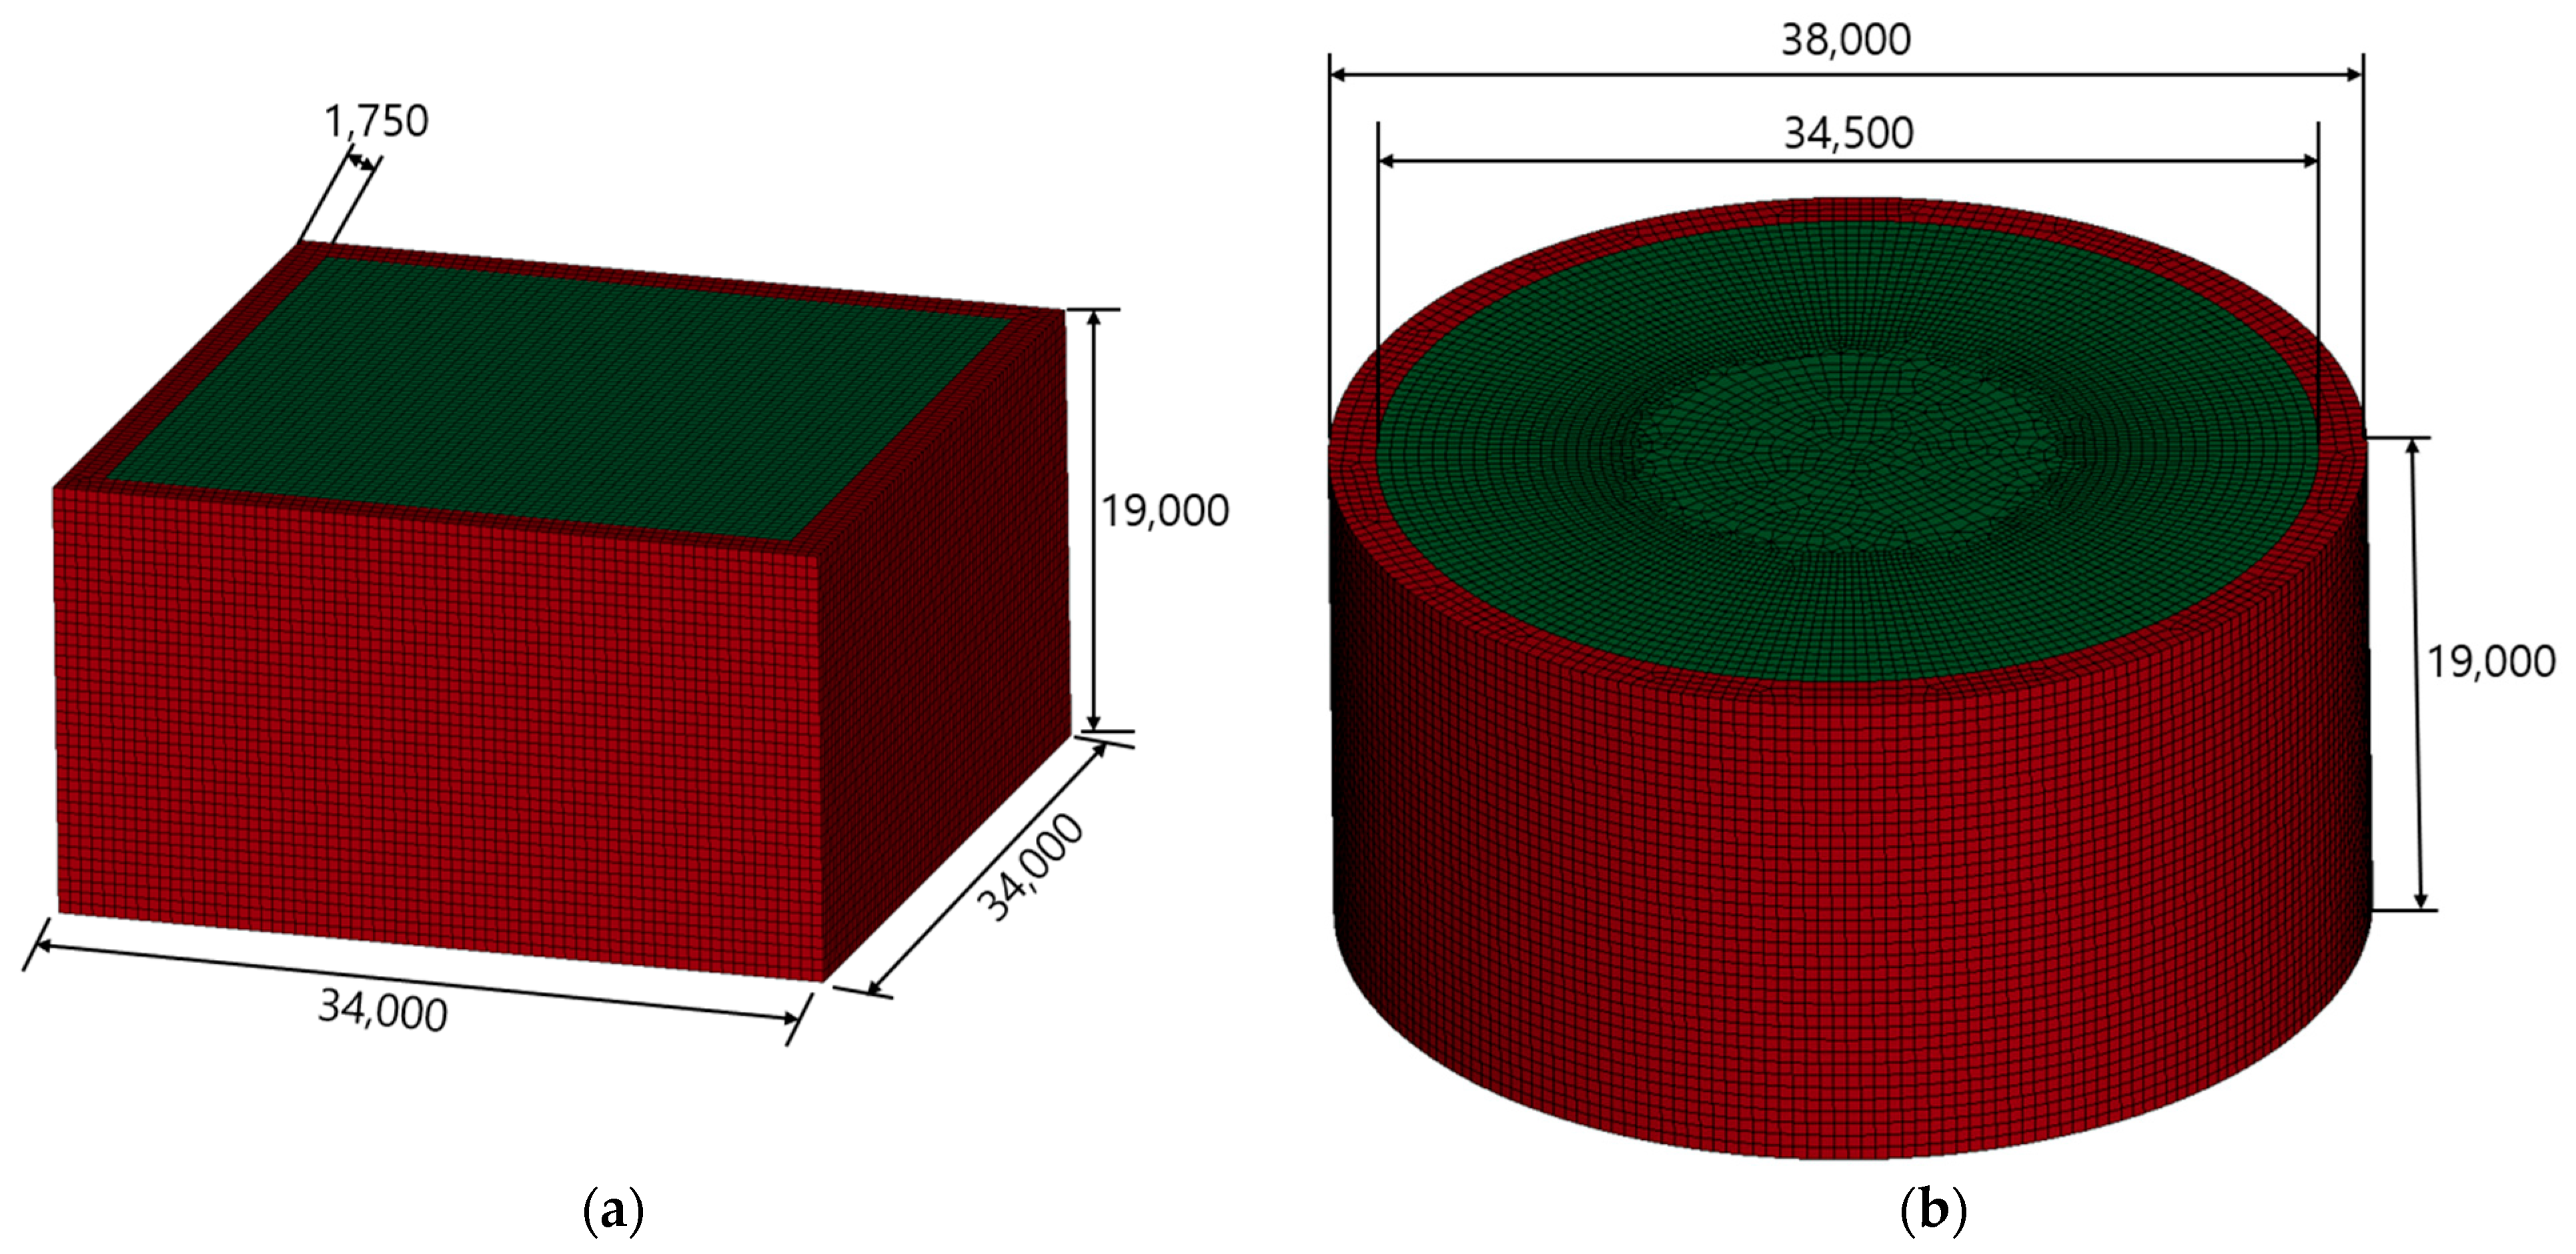
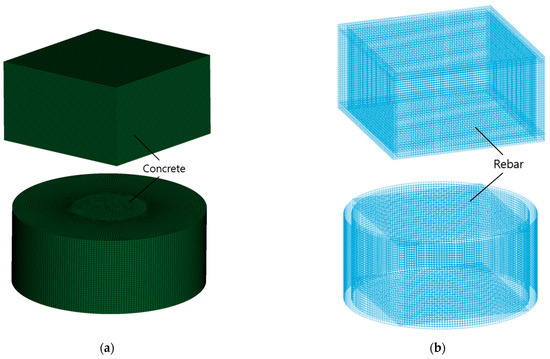
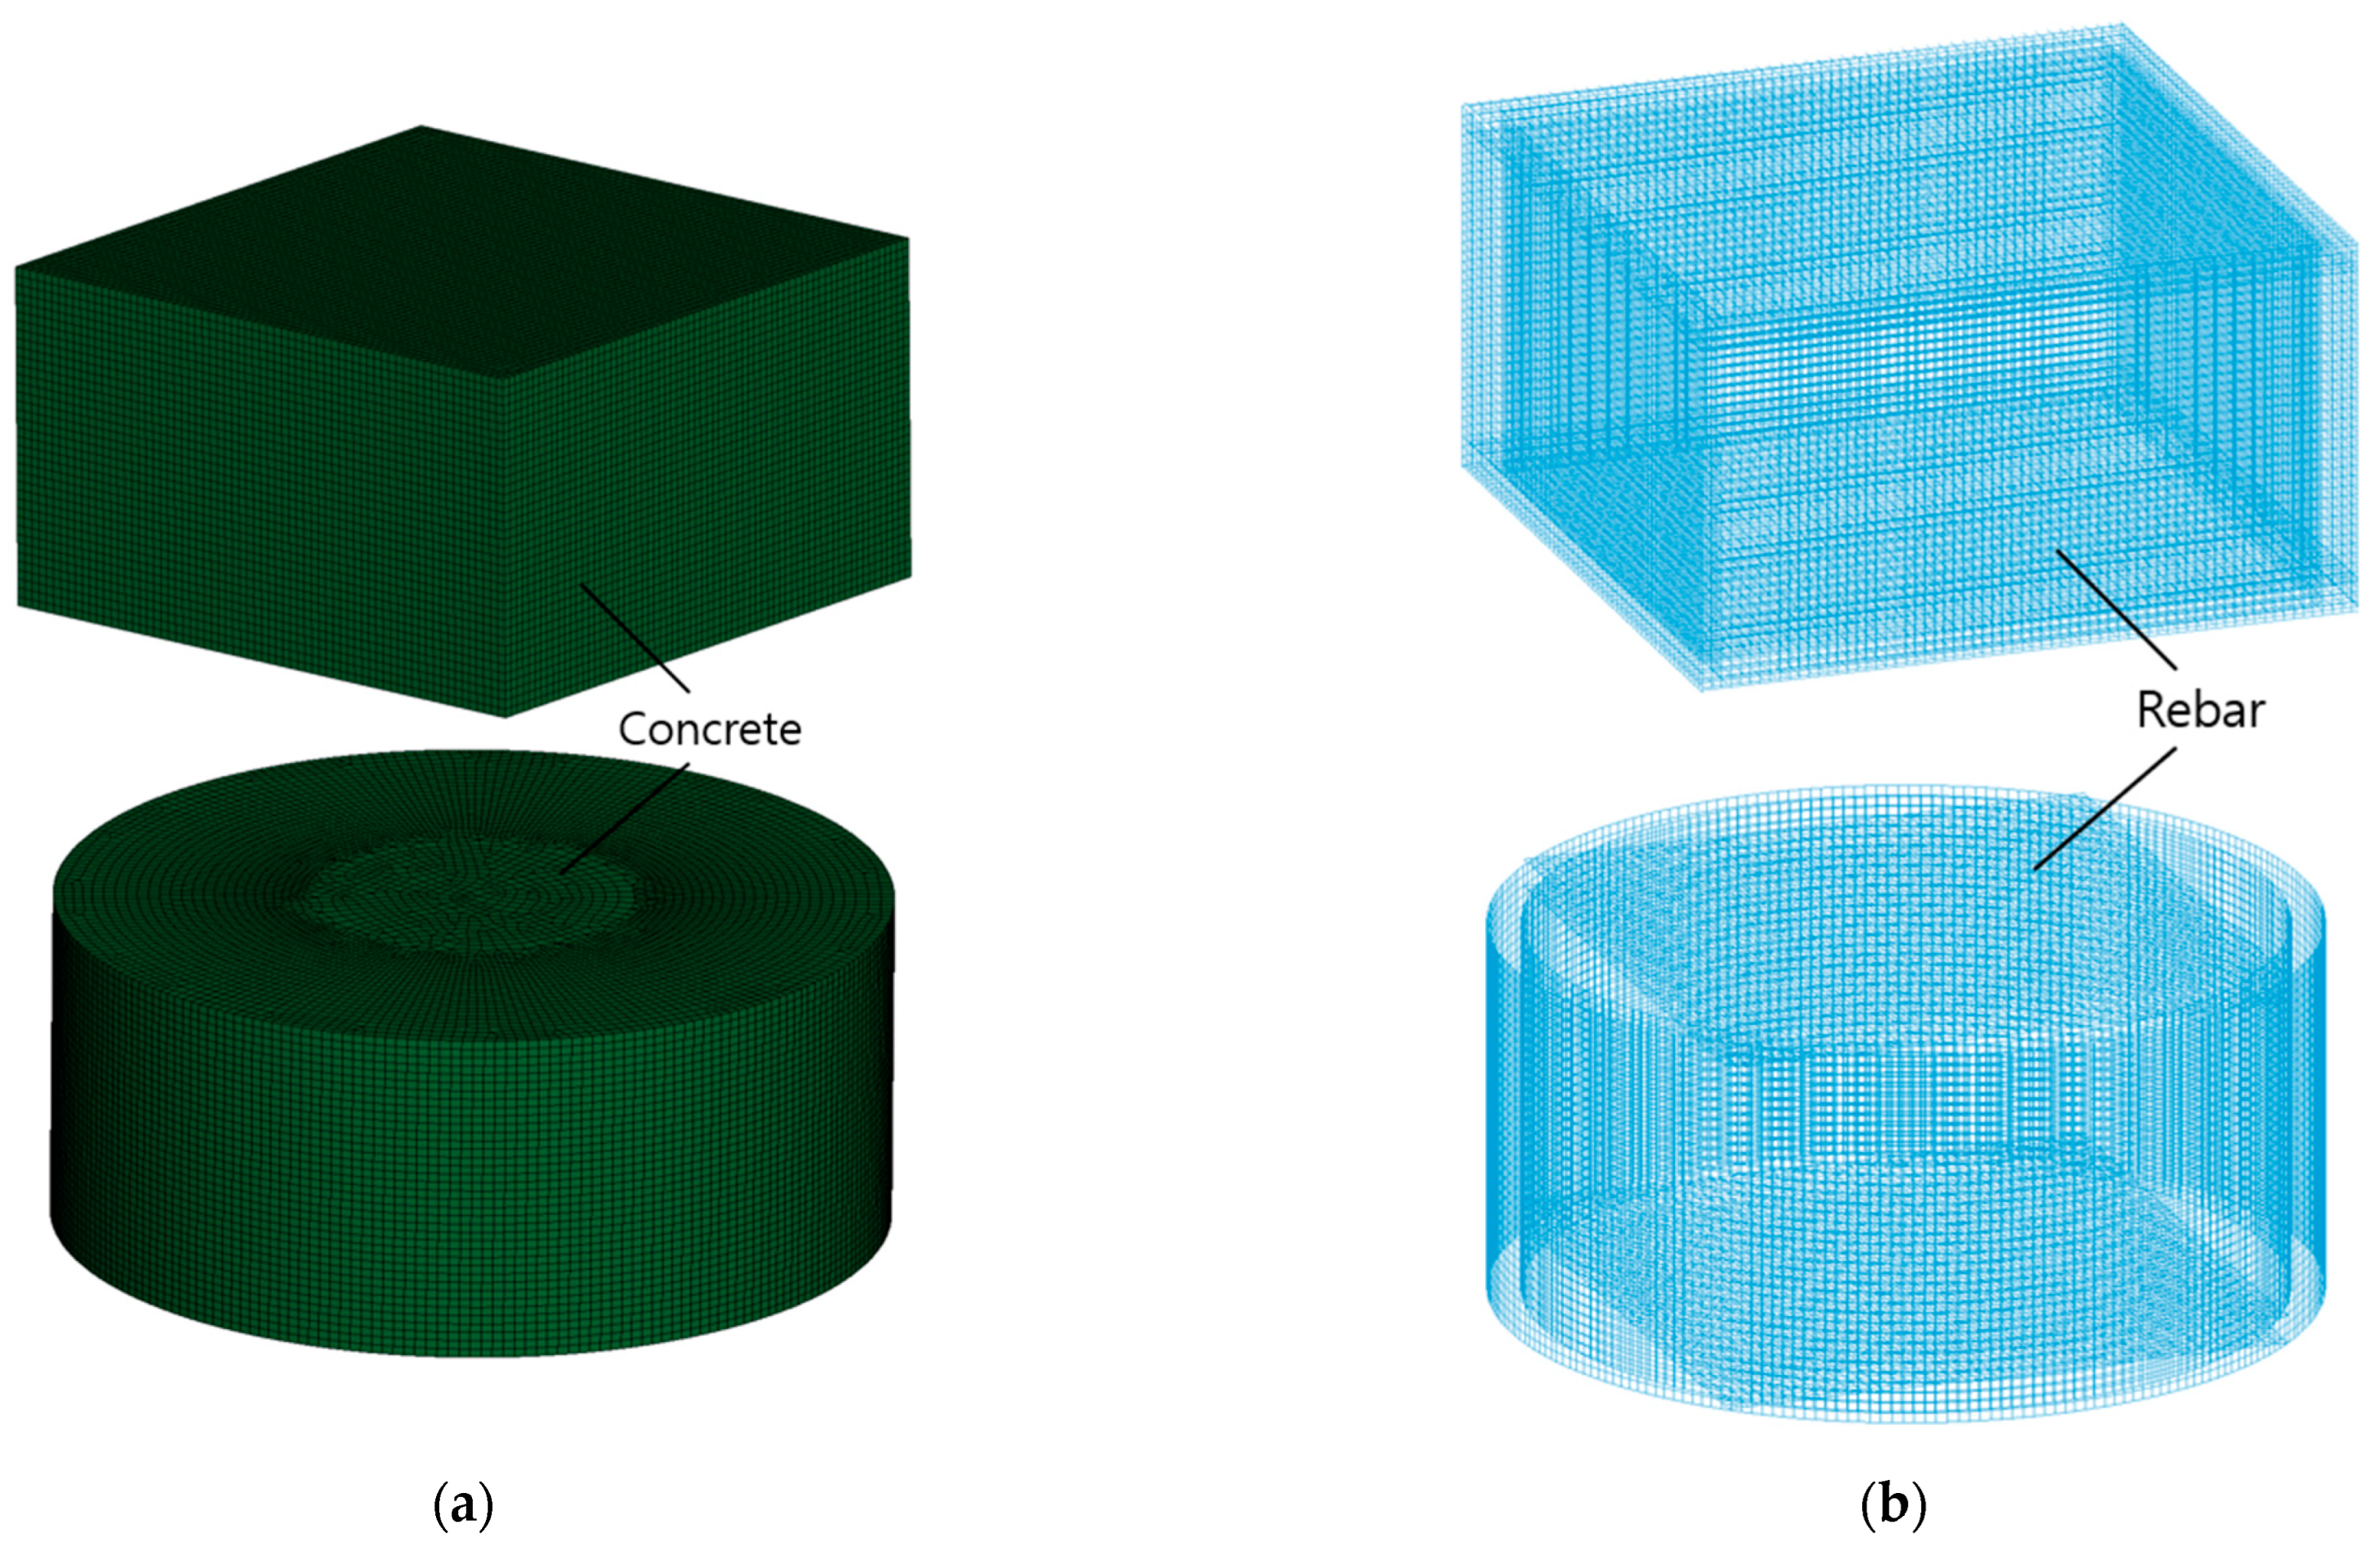
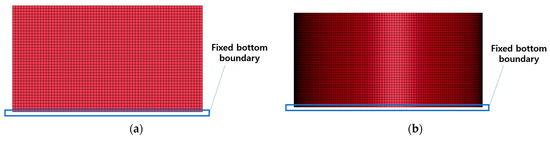
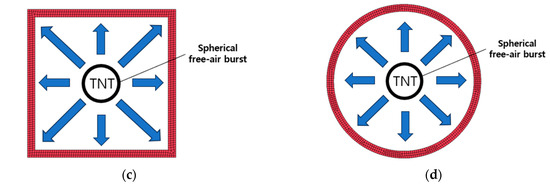
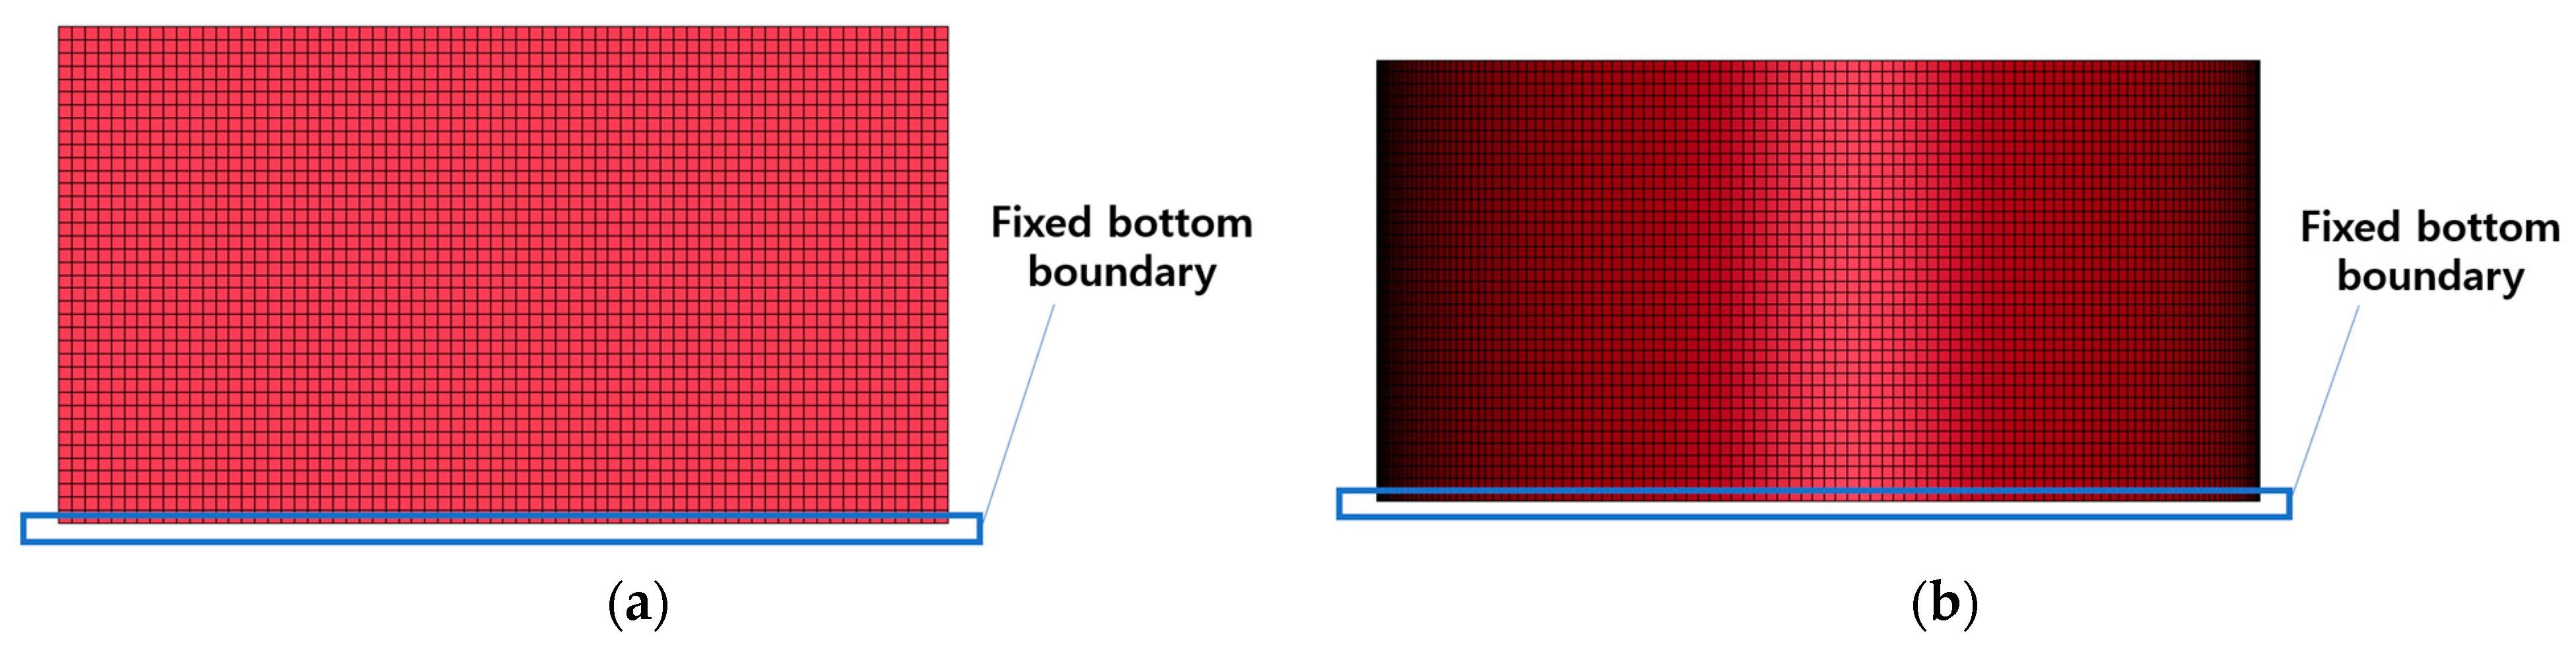
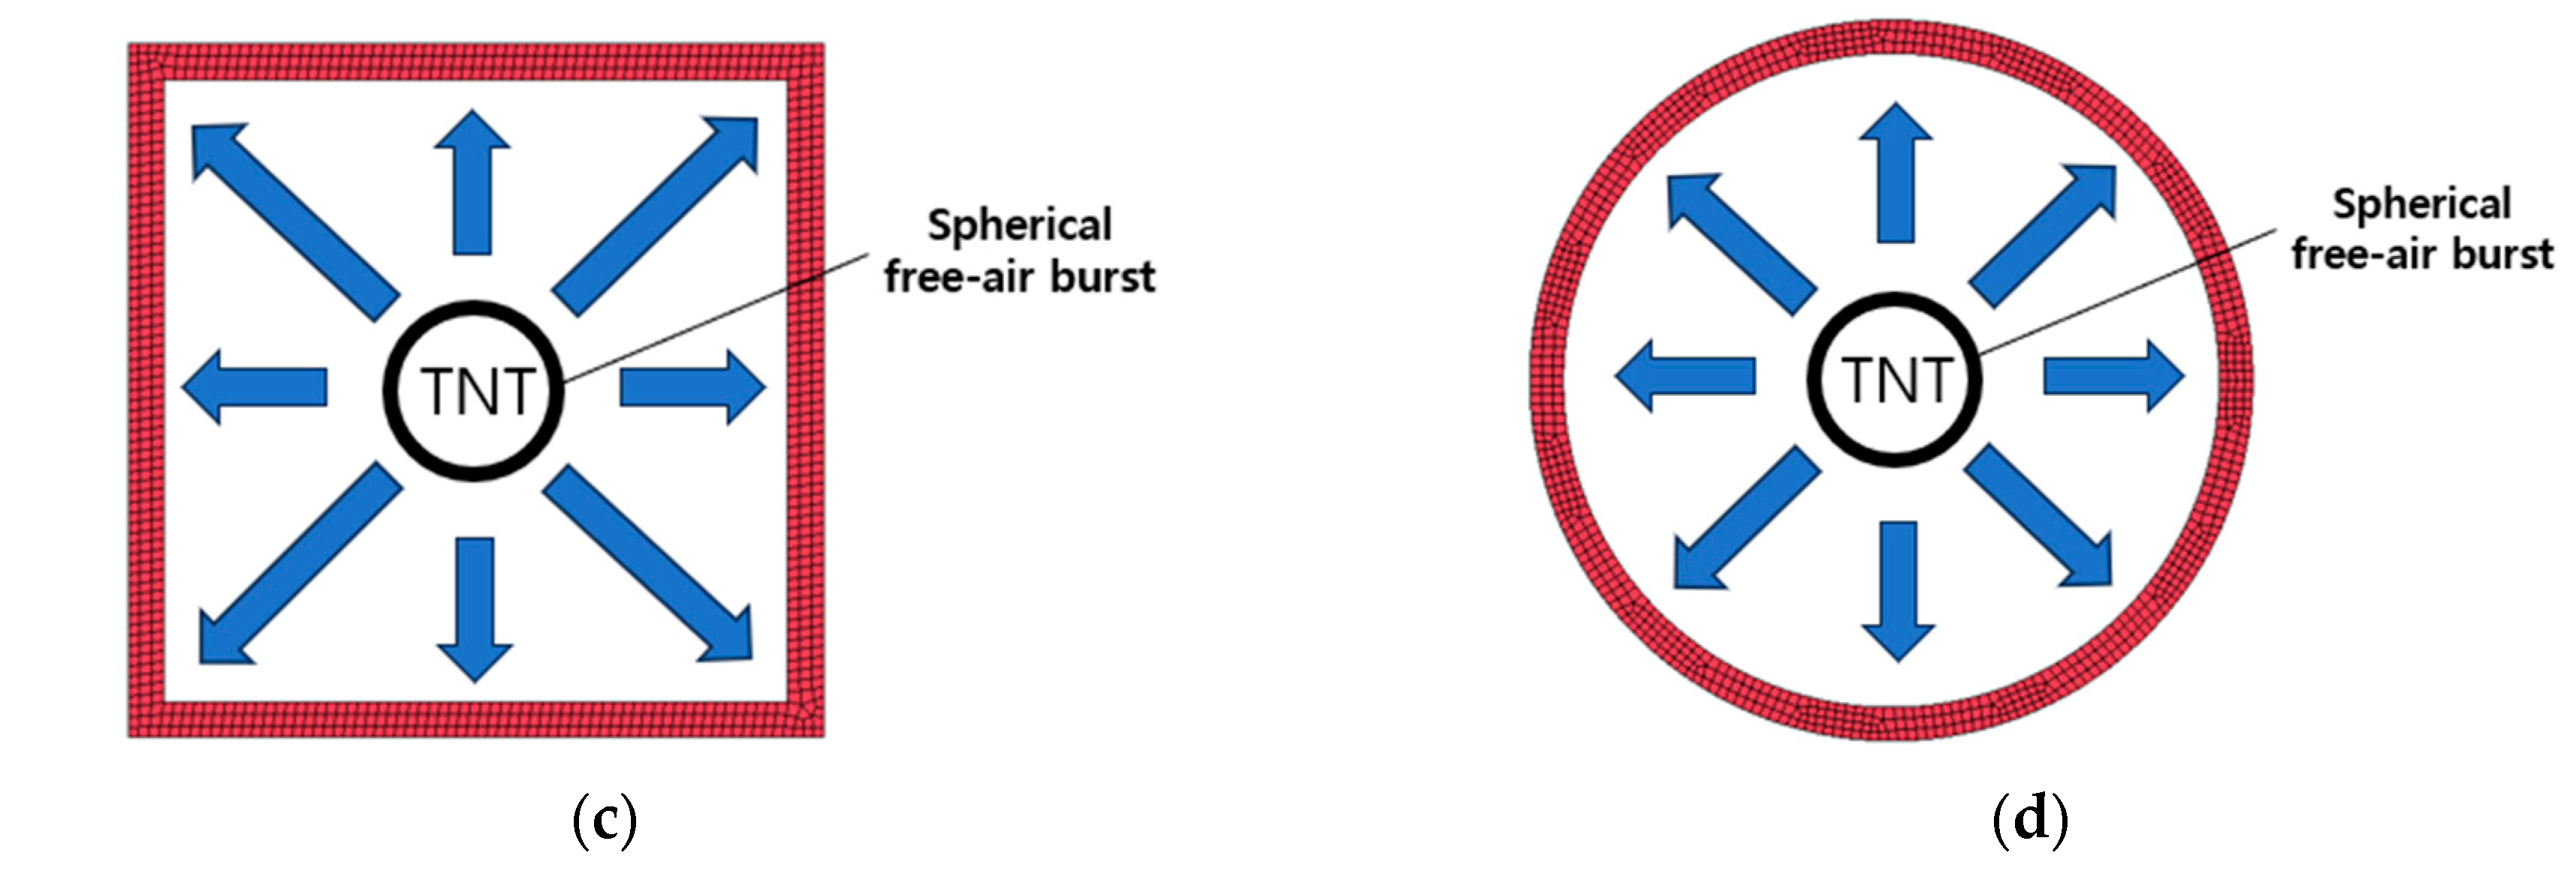
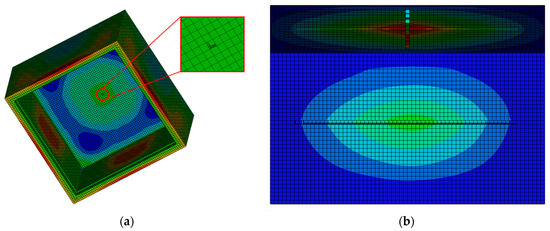
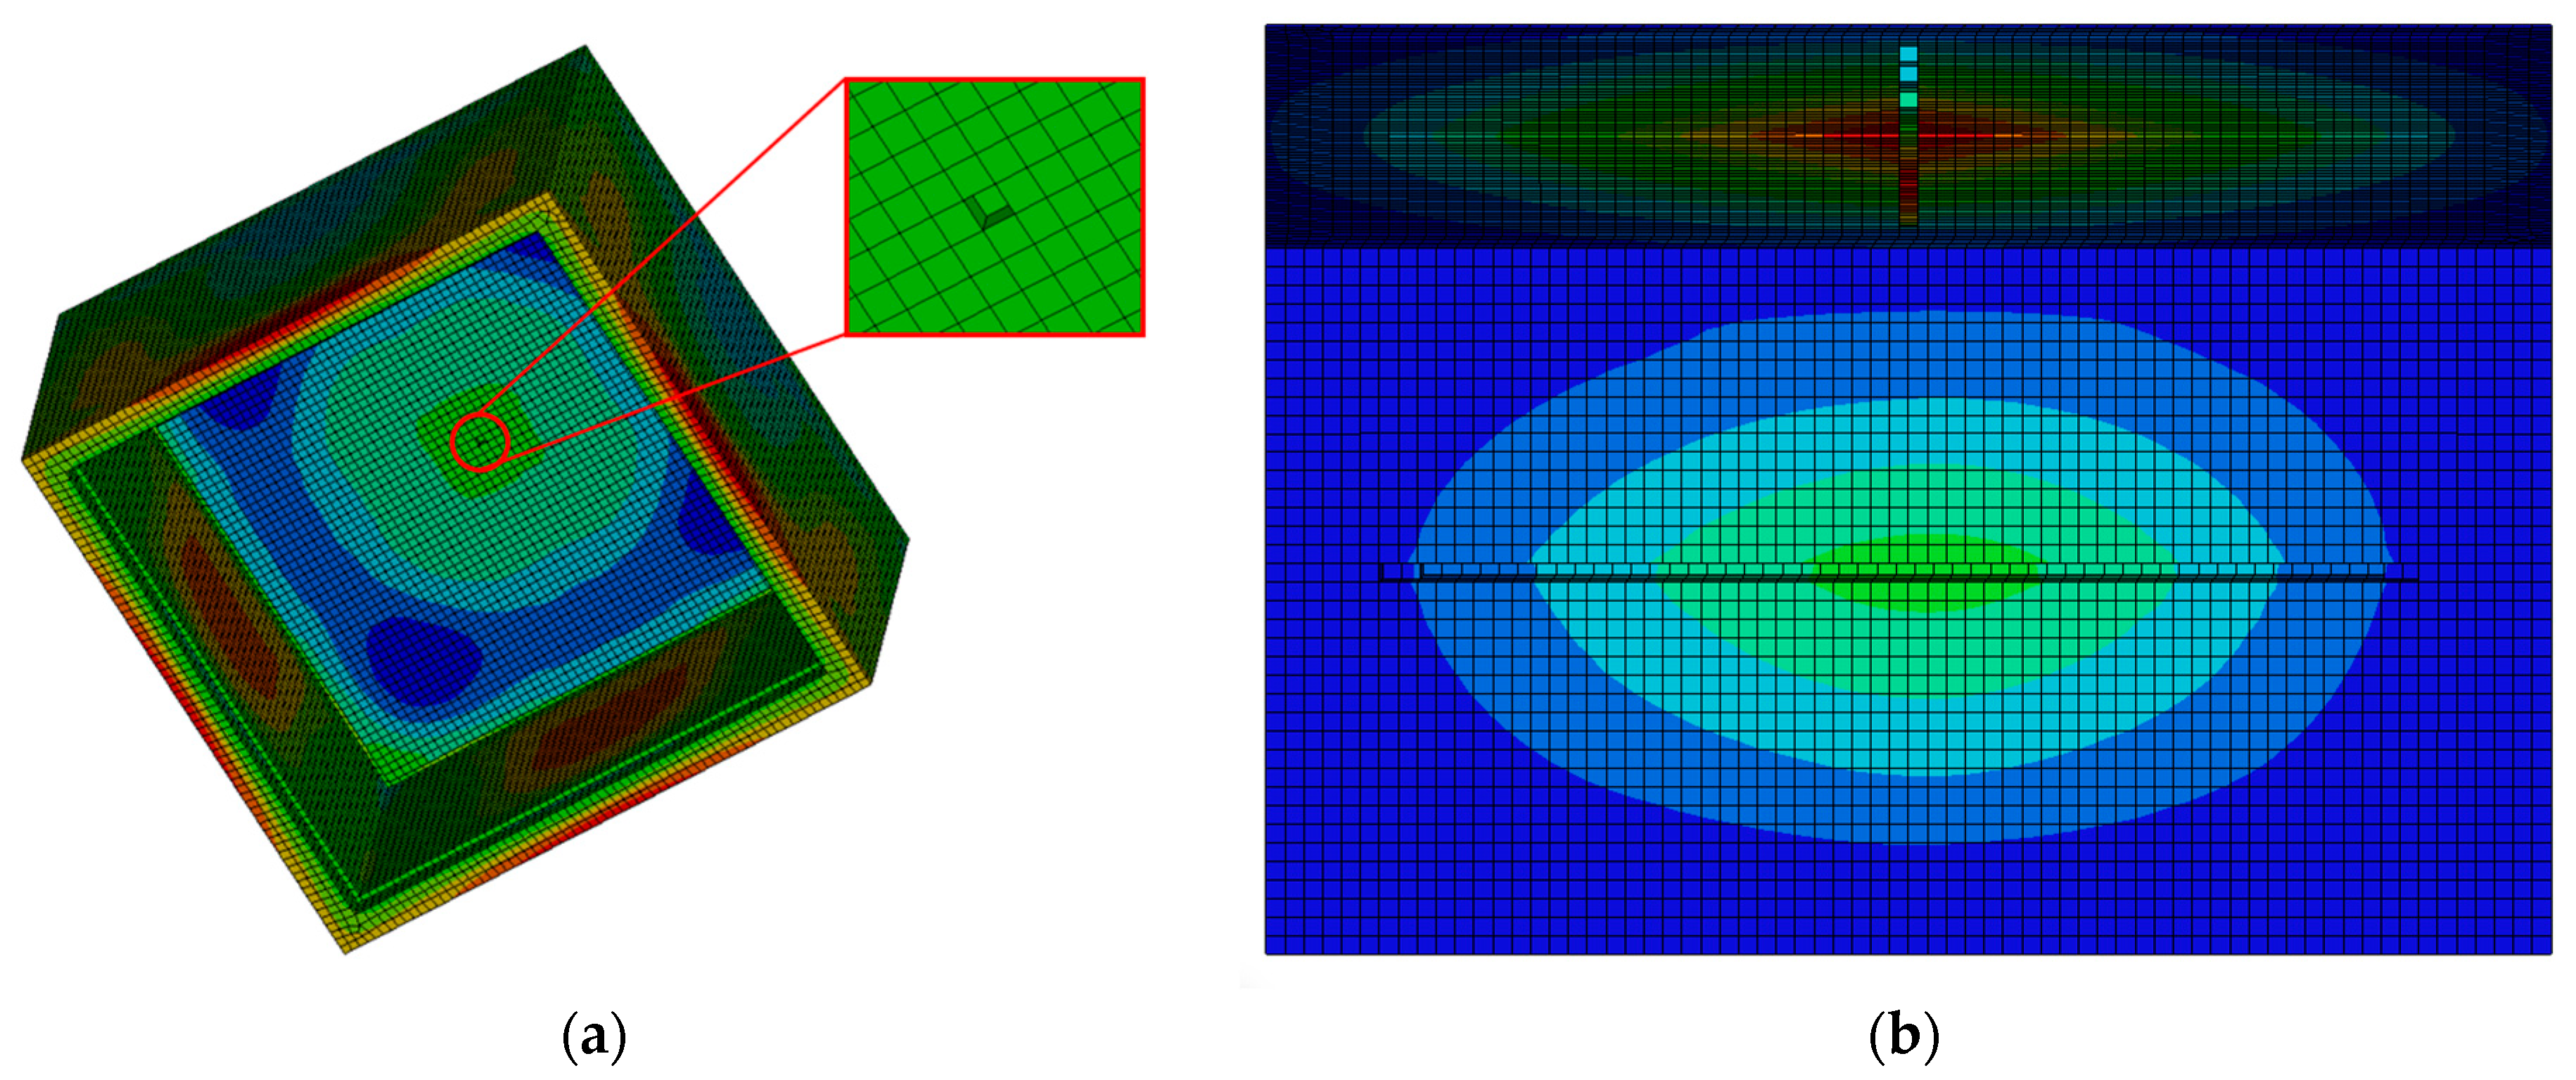
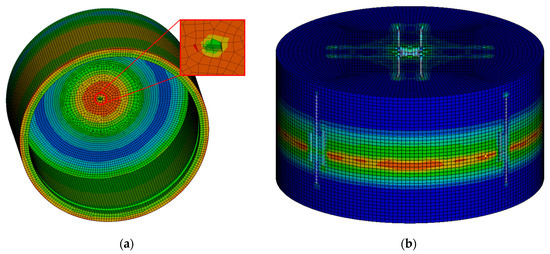
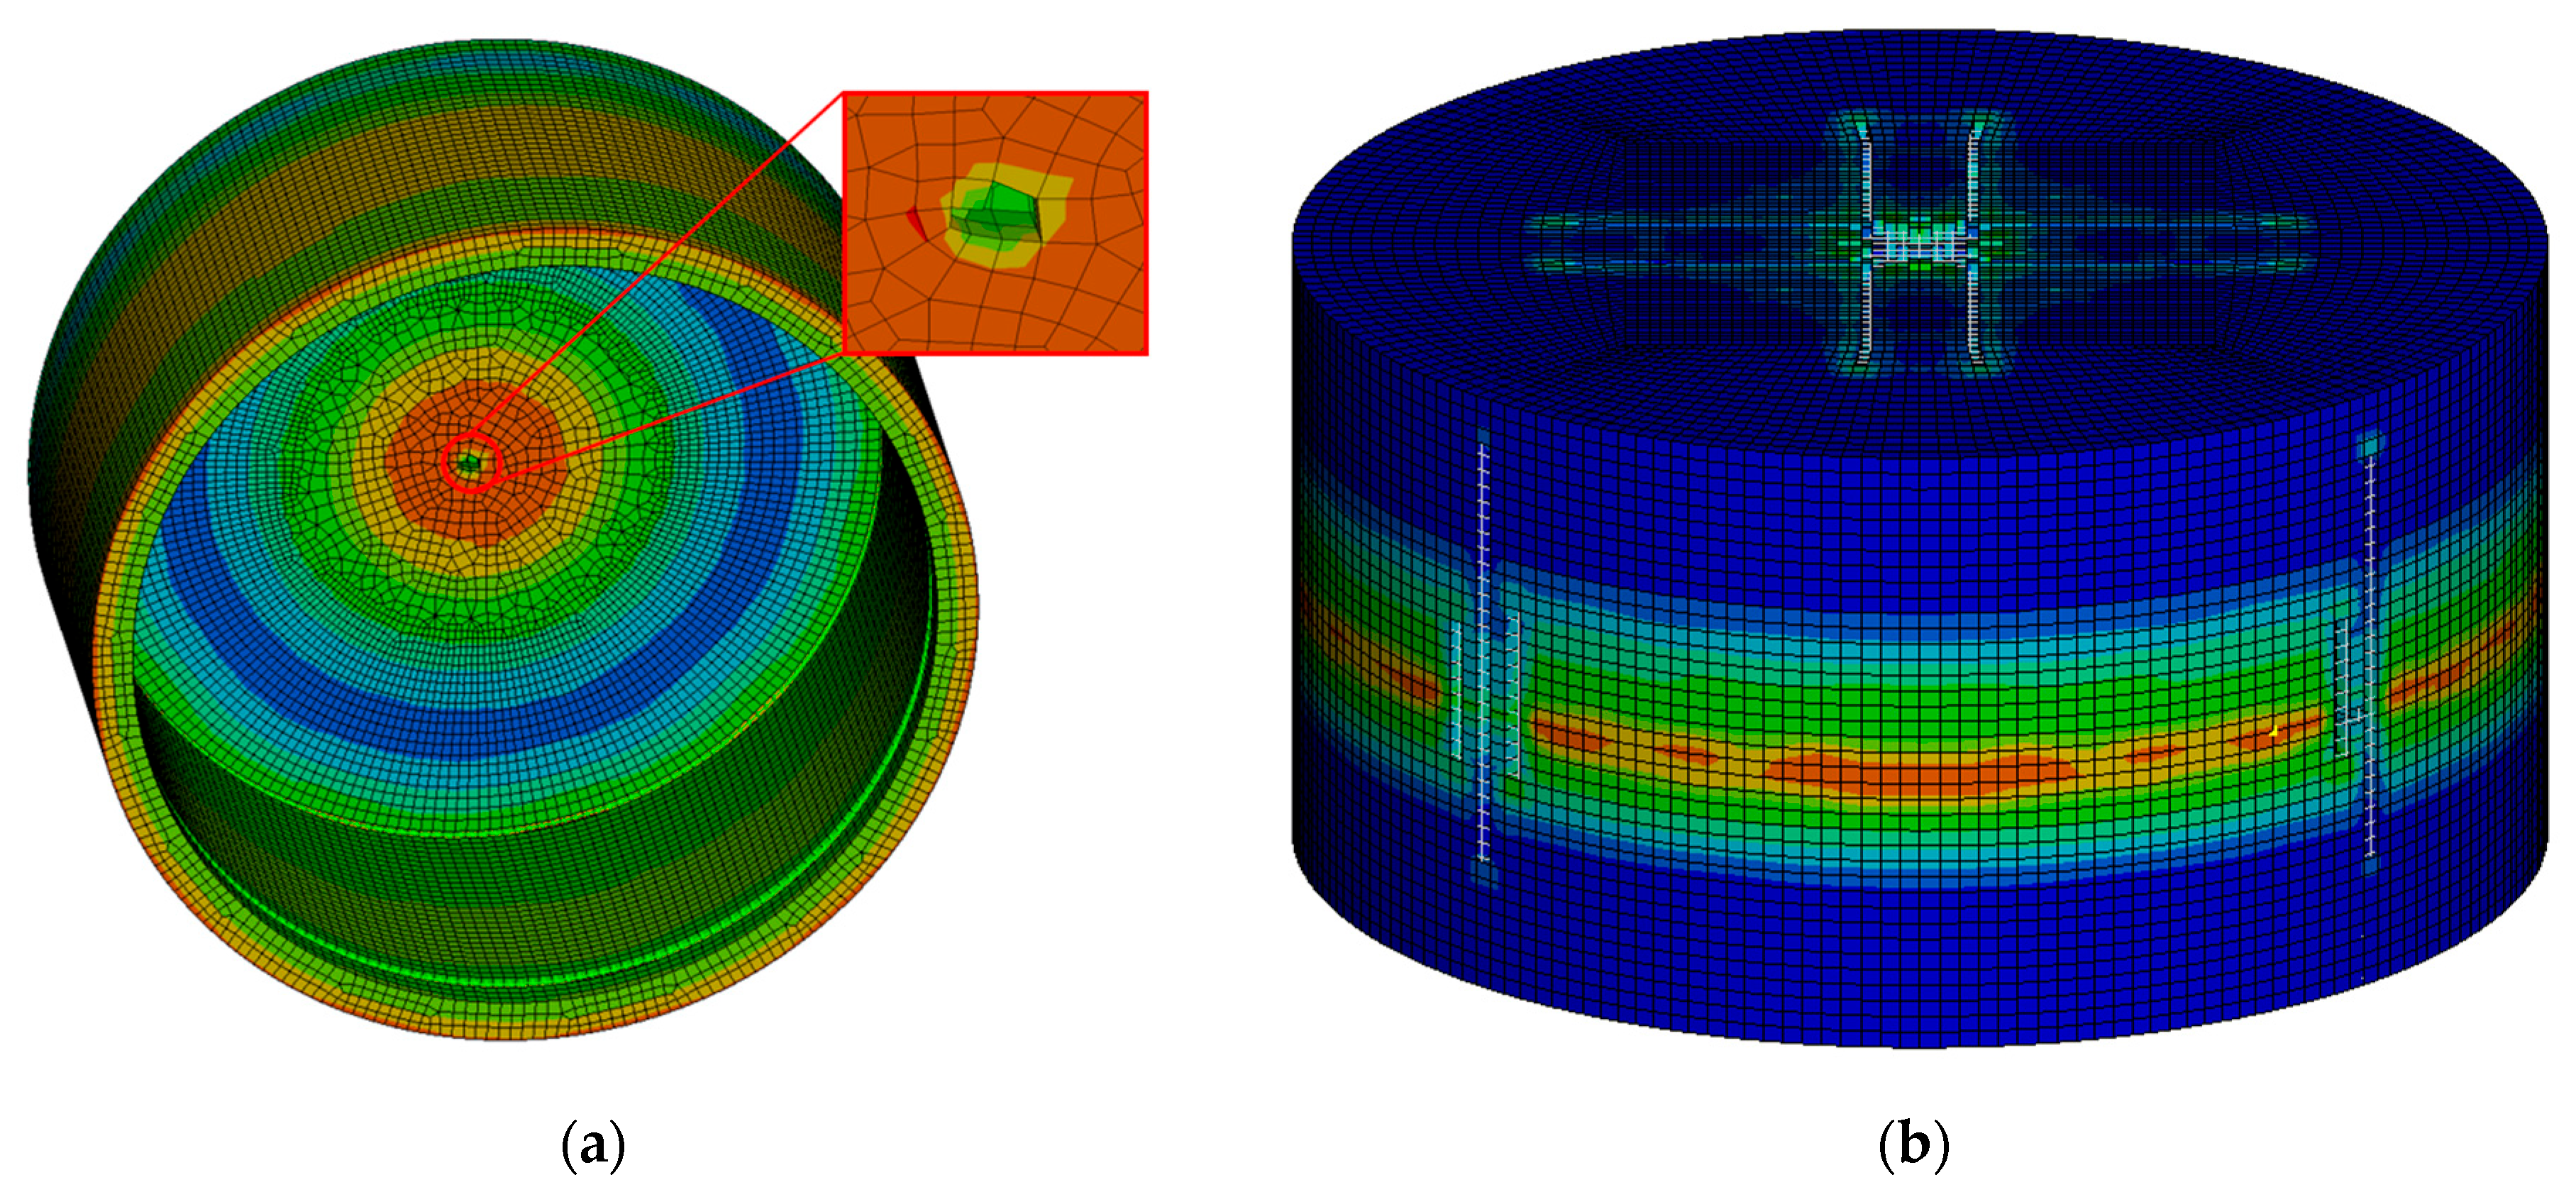
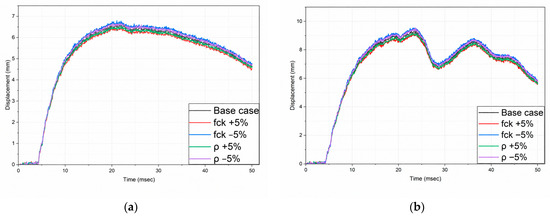
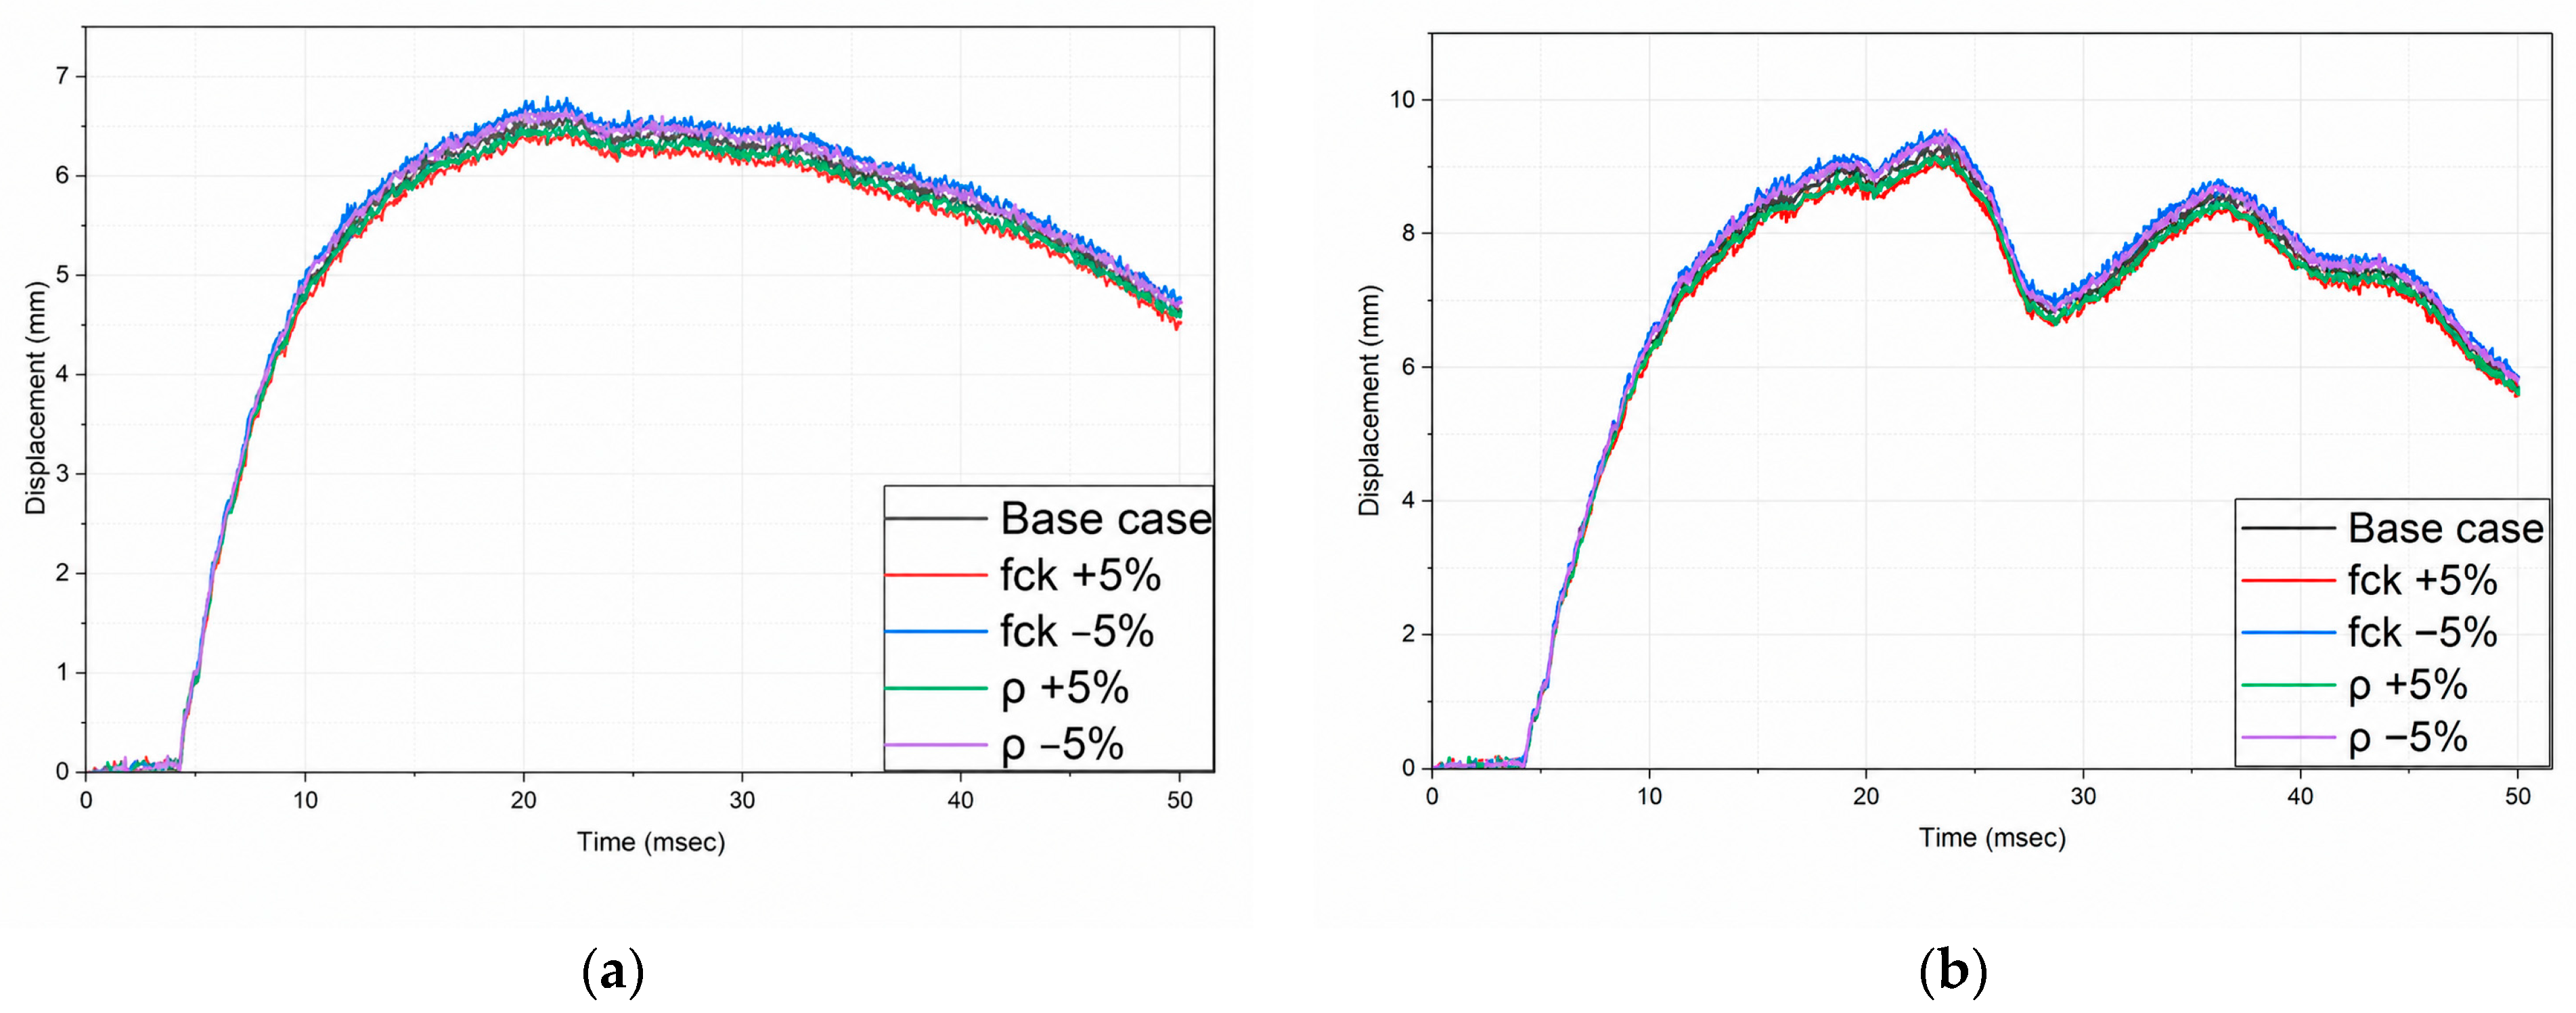
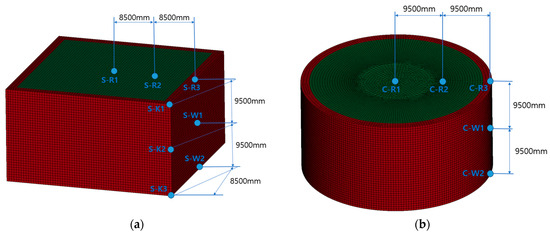
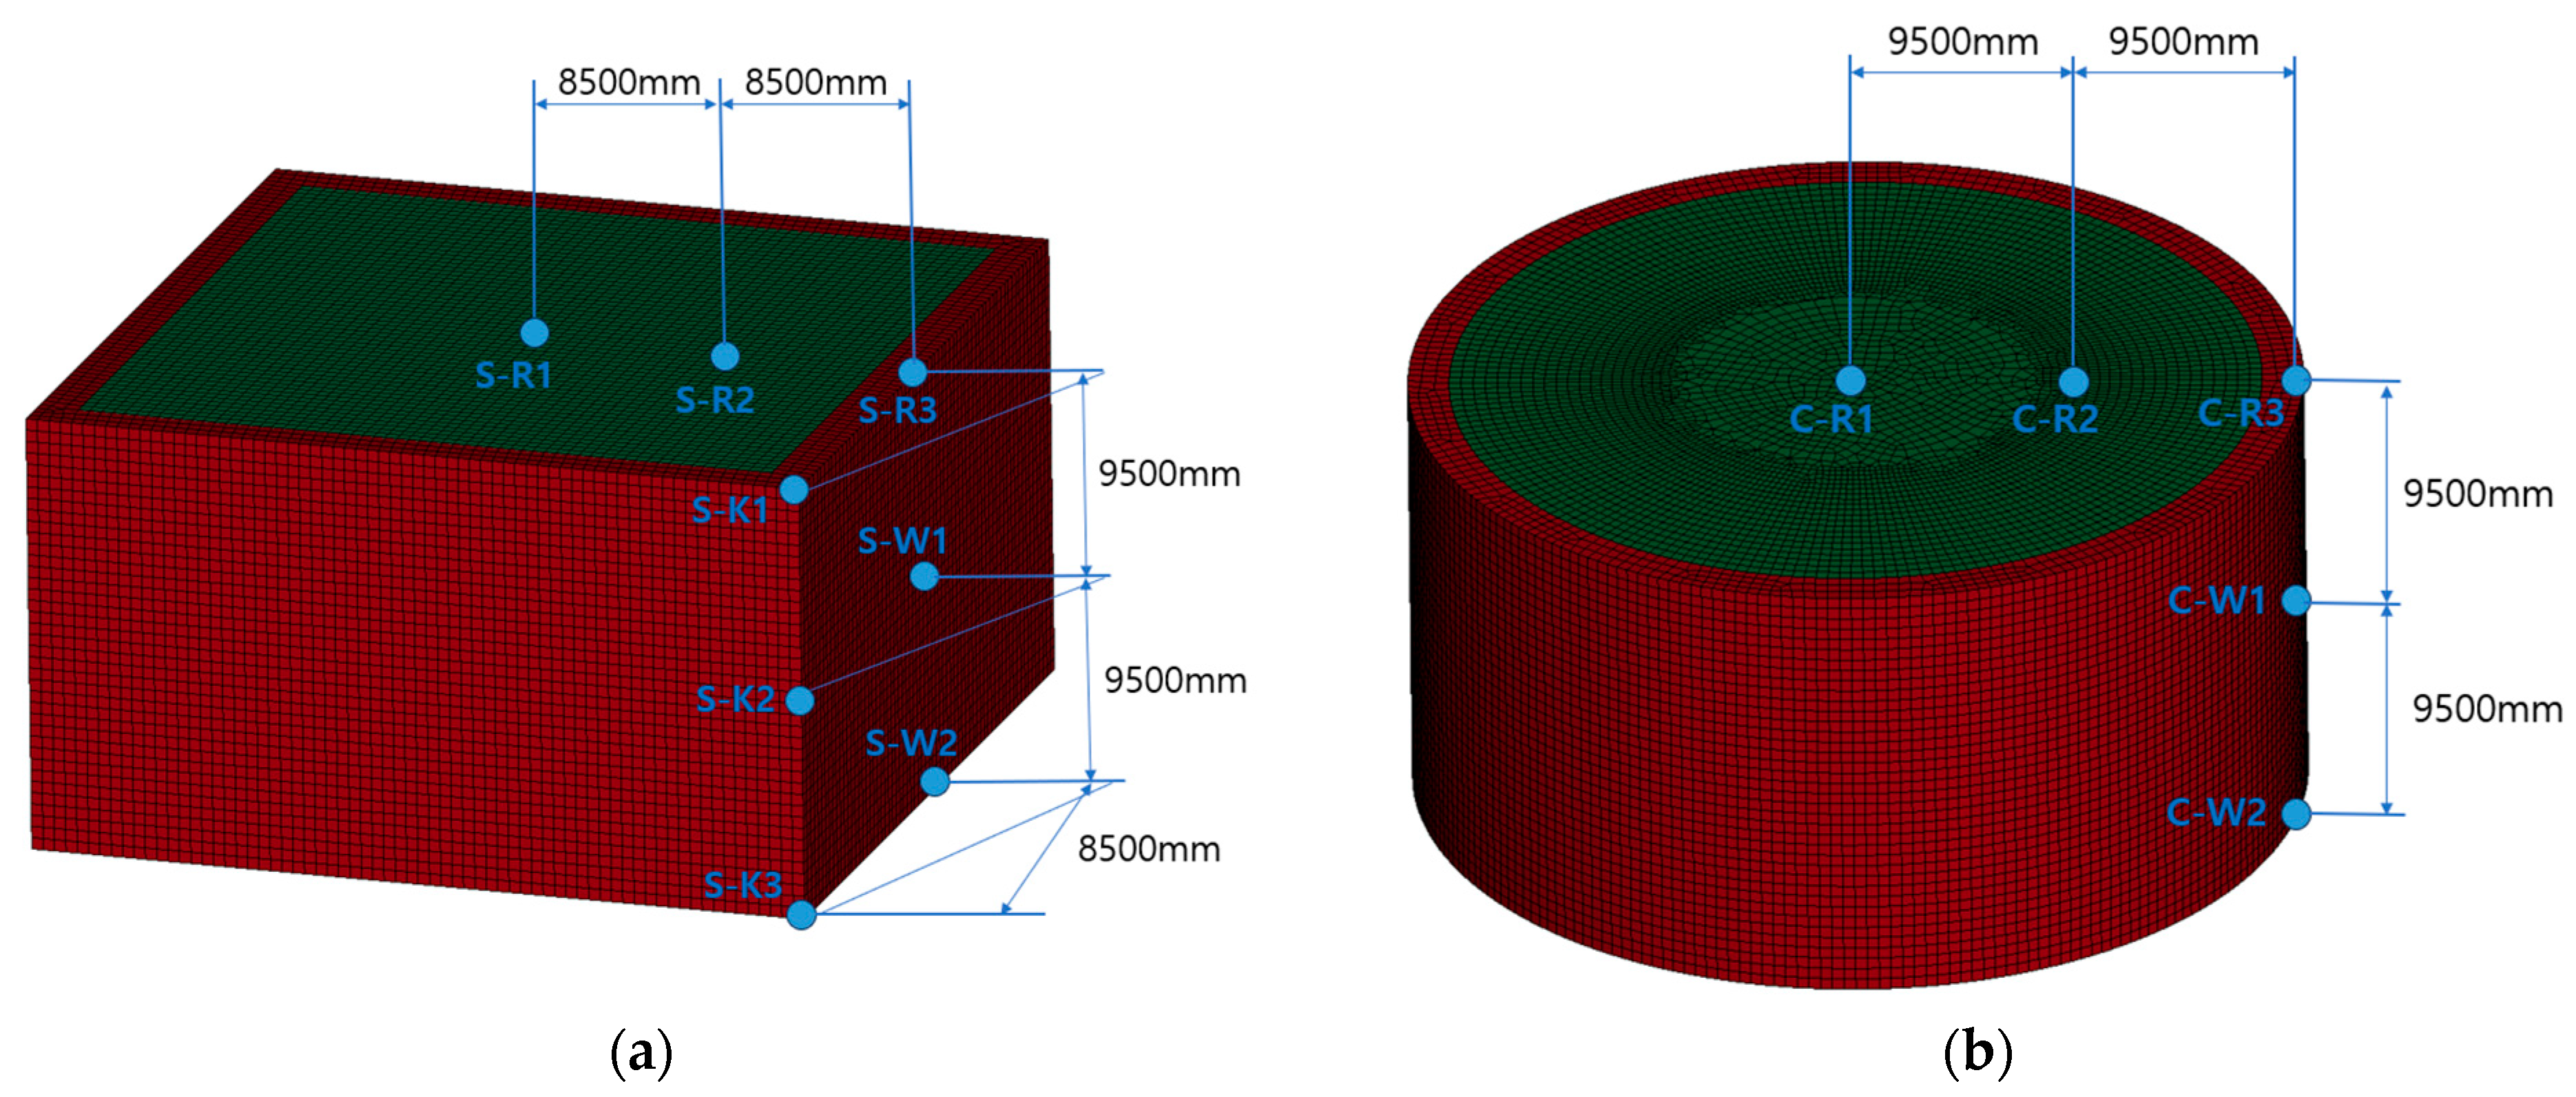
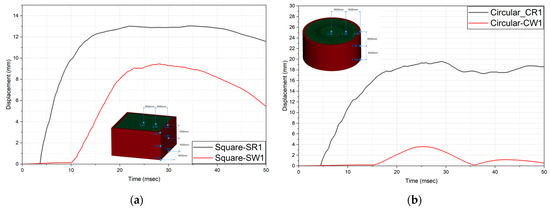
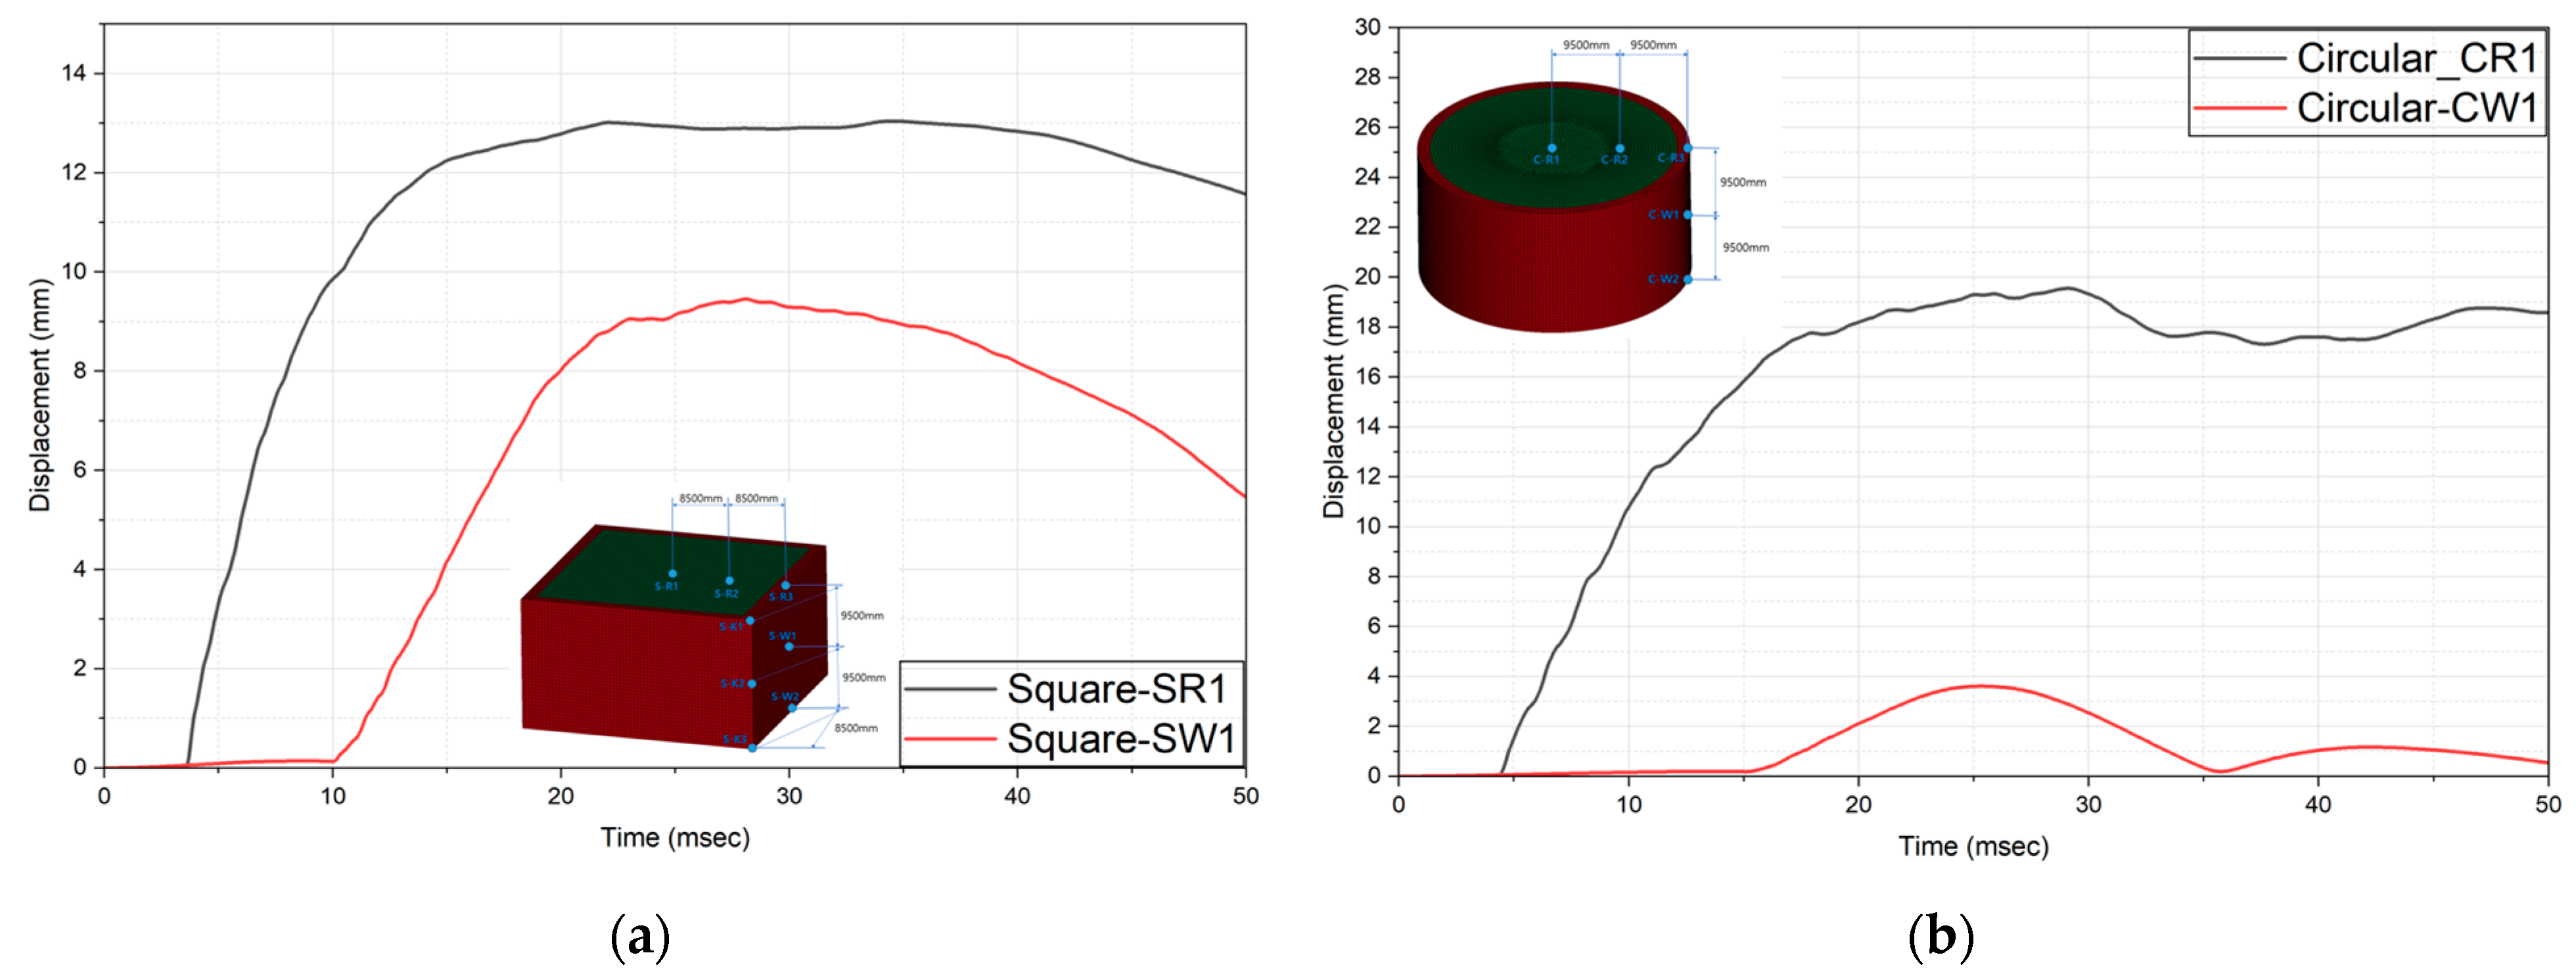
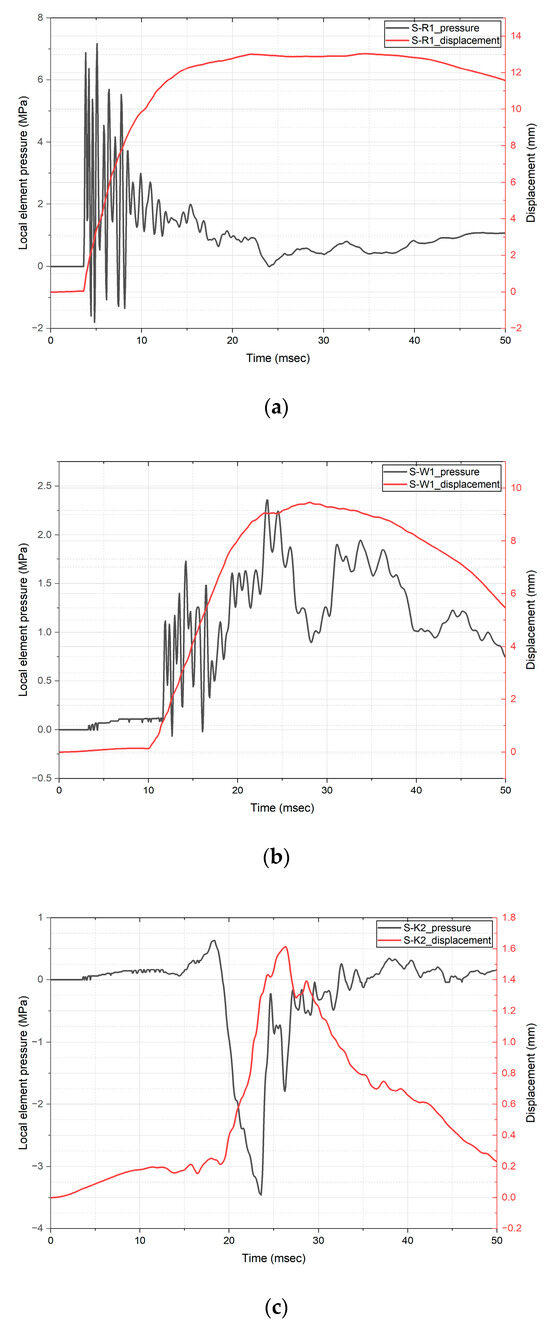
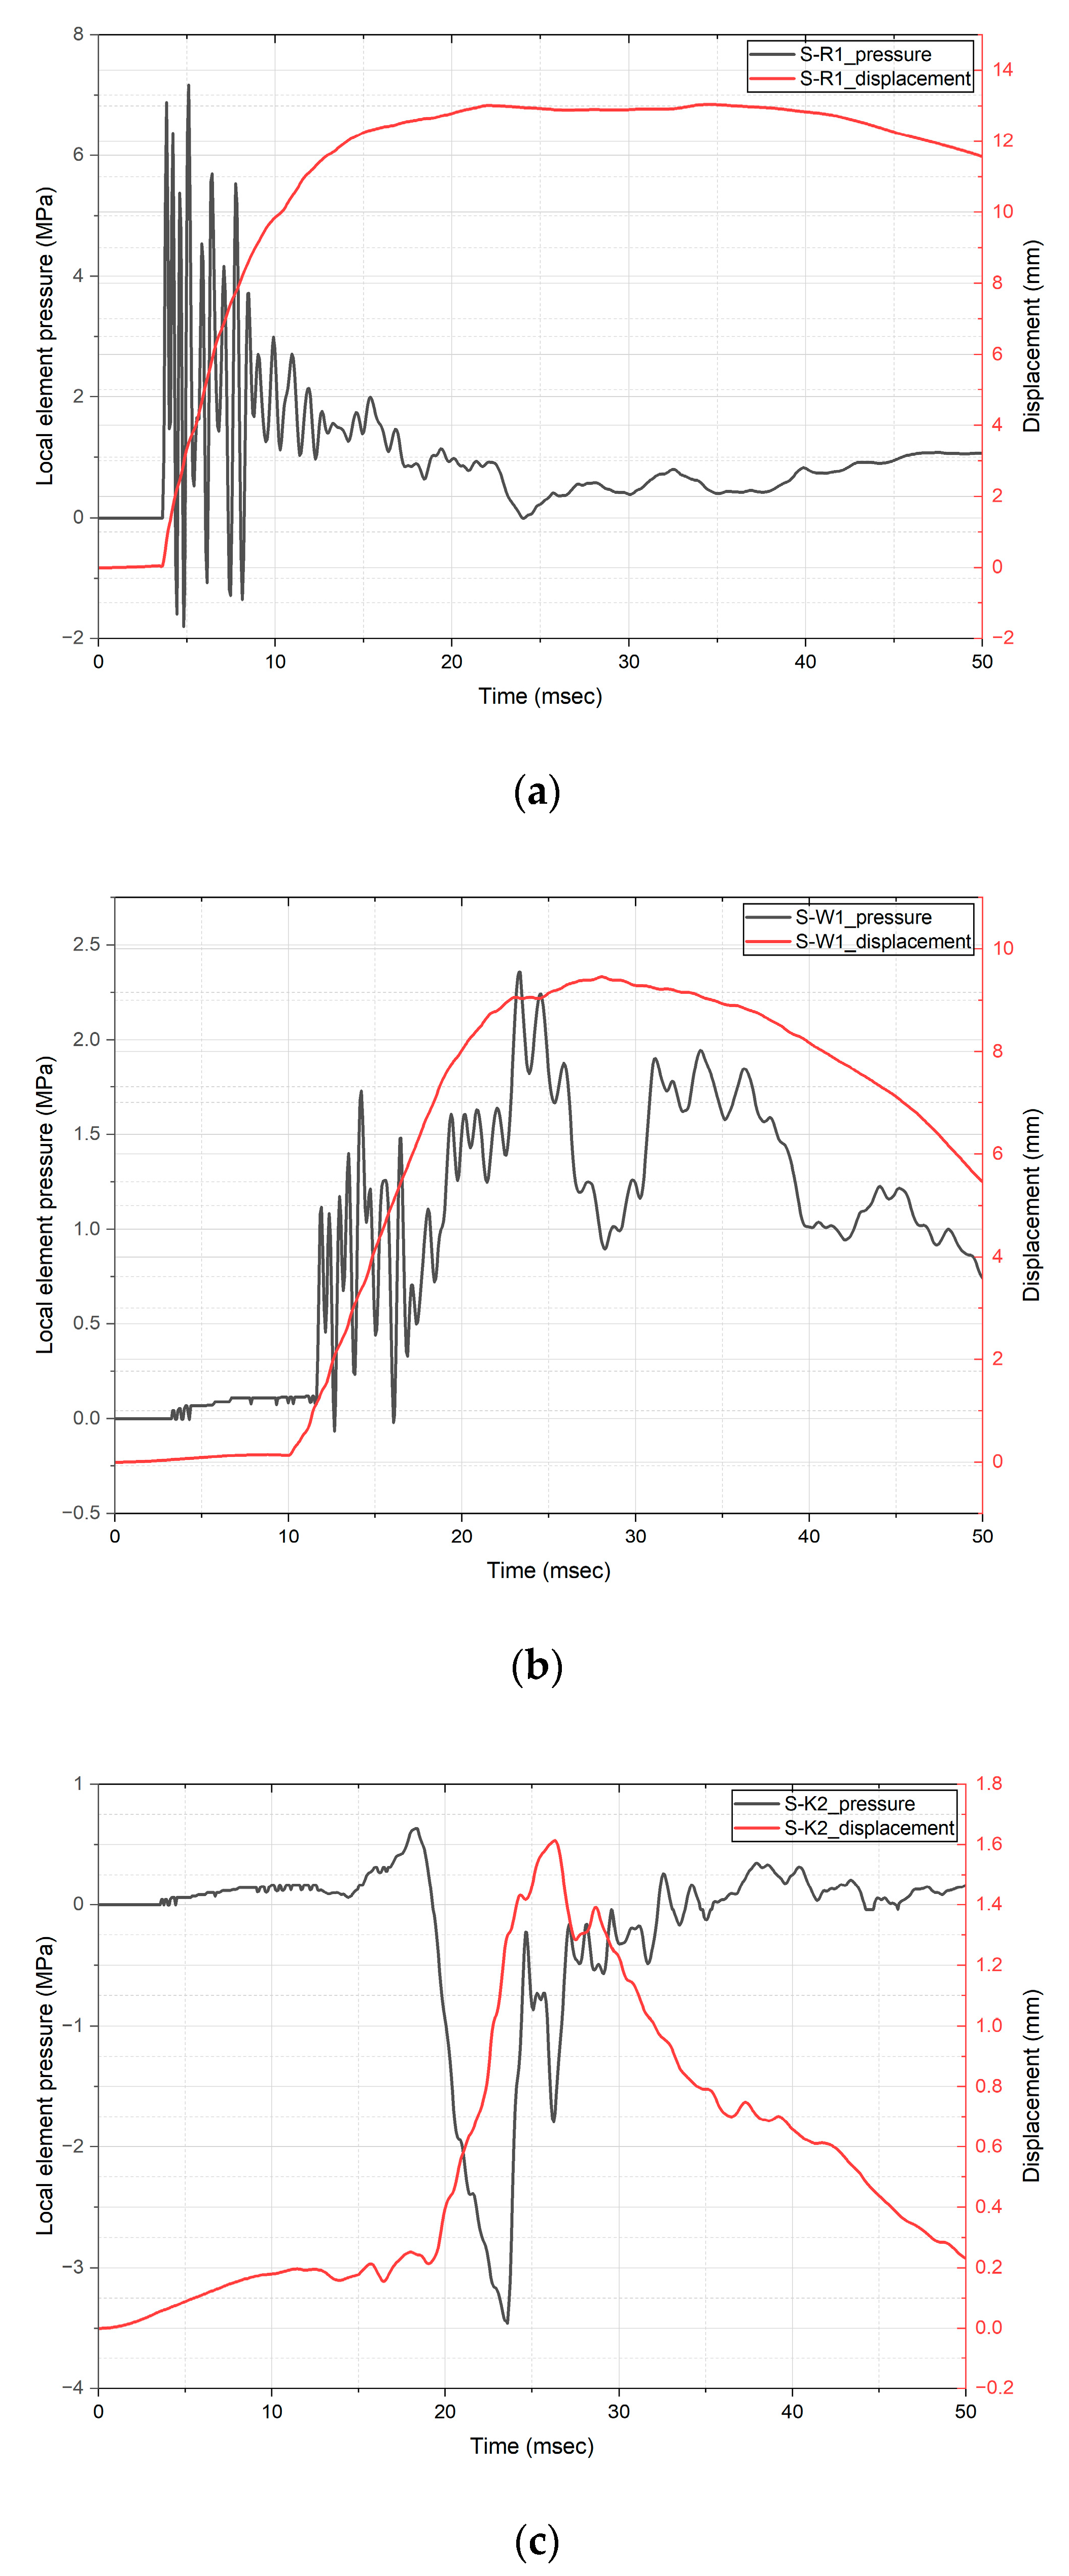
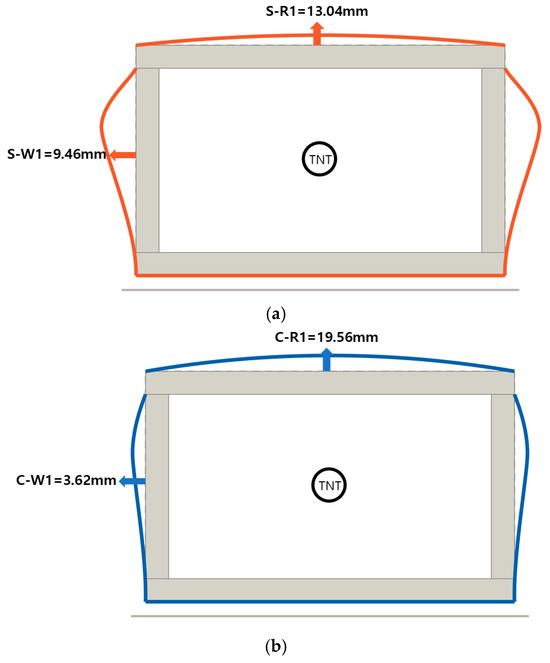

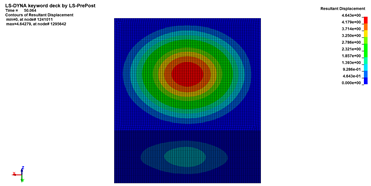
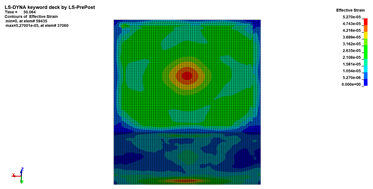
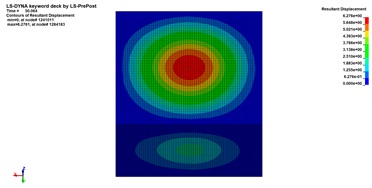
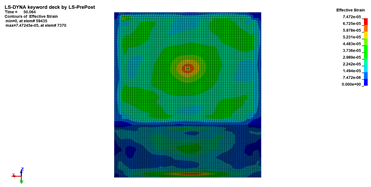
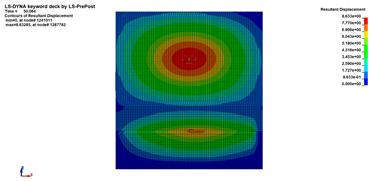
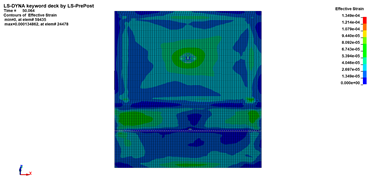
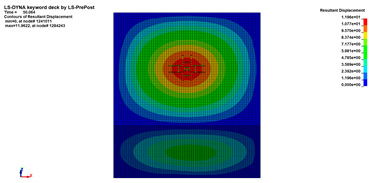
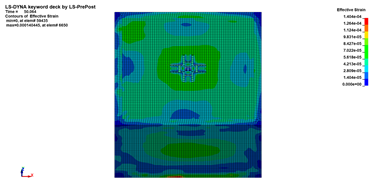
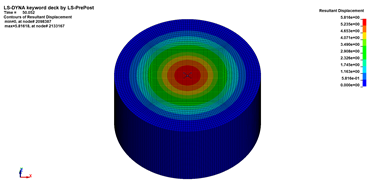
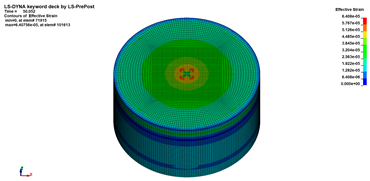
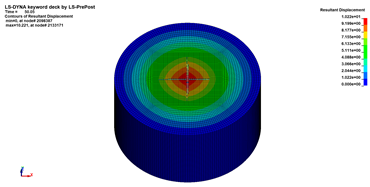
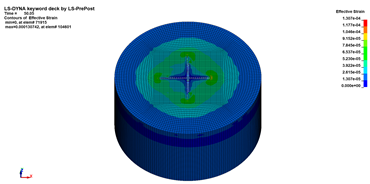
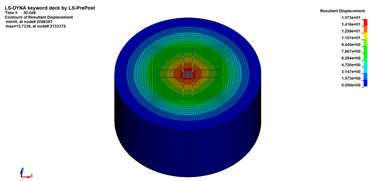
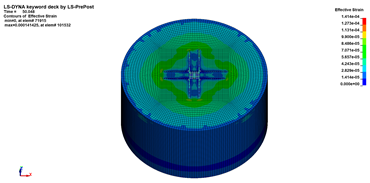
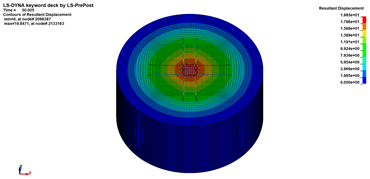
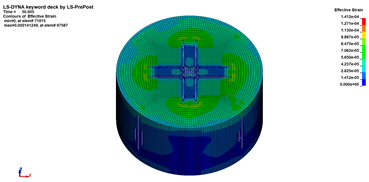
Disclaimer/Publisher’s Note: The statements, opinions and data contained in all publications are solely those of the individual author(s) and contributor(s) and not of MDPI and/or the editor(s). MDPI and/or the editor(s) disclaim responsibility for any injury to people or property resulting from any ideas, methods, instructions or products referred to in the content. |
© 2026 by the authors. Licensee MDPI, Basel, Switzerland. This article is an open access article distributed under the terms and conditions of the Creative Commons Attribution (CC BY) license.