


Abstract
KTaO3 (KTO) is a quantum paraelectric perovskite oxide which belongs to the cubic space group Pmm in a large temperature range. Polar optical modes with a T1u symmetry of KTO are infrared-active and Raman-inactive according to the centrosymmetric exclusion principle of the selection rule. In general, the soft modes responsible for ferroelectric instability are infrared-active and Raman-inactive in the paraelectric phase. Therefore, there are still not enough studies on Raman-inactive soft modes and related phonon polaritons. In the present study, Raman-inactive polar modes and related polaritons of KTO crystals are studied by Terahertz Time-Domain spectroscopy (THz-TDS) and FTIR. The real and imaginary parts of a dielectric constant along the [100] axis are uniquely determined by transmission and reflection THz-TDS without any fitting in the low-frequency range between 6 and 225 cm−1, which covers the two lowest-frequency polar modes. The reflectivity is determined by reflection FTIR in the range between 50 and 1200 cm−1, and the complex dielectric constant is also estimated by the fitting in the range between 6 and 1200 cm−1. The phonon–polariton dispersion relations of the real and imaginary parts of the polariton wavevector are also studied in the range between 6 and 1200 cm−1. The crossover from photon-like to phonon-like polaritons and related polariton decay are observed, while no anomaly related to polariton scattering and coupling to other elementary excitations is observed in the polariton dispersion.
Keywords:
soft mode; polariton; quantum paraelectric; perovskite; KTaO3; terahertz; time-domain spectroscopy 1. Introduction
In ferroelectric materials, compounds with a perovskite structure play a dominant role in fundamental physics with applications in industry [1]. The phenomenon of ferroelectricity in pseudo-cubic perovskite crystals was discussed by Cochran in terms of the normal modes of vibration [2]. It was shown that the parameters which determine the lattice vibrations are chosen in such a way that the crystal exhibits ferroelectric properties, and that ferroelectric or anti-ferroelectric phase transitions are regarded as the result of lattice instability during a certain normal mode of vibration.
Perovskite ferroelectrics undergo a structural phase transition upon heating and transform into a prototypic cubic phase with space group Pmm. Ferroelectric and anti-ferroelectric lattice instability has been discussed using the tolerance factor defined by
Here, RA, RB, and RO are the ionic radii of A, B, and O ions, respectively [3]. The ideal packing occurs at t = 1.0, and the perovskite structure is stable in 0.9 < t < 1.1. For t > 1.0, a larger space is available in an oxygen octahedron for B ion and the off-center of the B ion induces ferroelectricity. The ferroelectric soft modes in noncentrosymmetric ferroelectric phases were extensively studied by Raman scattering [4]. However, in a paraelectric cubic phase, ferroelectric instability is related to polar soft phonon modes with T1u symmetry, which are Raman-inactive. Ferroelectric soft modes in a cubic phase were studied by far-infrared spectroscopy, hyper-Raman scattering, and neutron inelastic scattering. However, the understanding of soft modes in the paraelectric phase is still insufficient.
For t = 1.0, quantum paraelectricity was suggested to occur very low temperatures by Barrett [5]. KTaO3 and BaZrO3 do not undergo any phase transition above 10 K [6,7]. Such phenomena are called quantum paraelectric, in which quantum fluctuations suppress the appearance of ferroelectricity at very low temperatures. Quantum paraelectric perovskite oxide KTaO3 belongs to the cubic space group Pmm in a large temperature range [6]. At an early stage, a ferroelectric phase transition at 13.2 K was reported [8]. However, in a pure crystal, no phase transition was observed above 1.6 K. The ferroelectric-like activity of KTaO3 is induced by uniaxial stress or very low-level doping of impurities on either the K or Ta site [6]. Therefore, a cubic phase of pure KTaO3 is stable in a large temperature range. Recently, KTaO3 has attracted much attention regarding the physical phenomena associated with the discovery of the 2D electron gas (2DEG) trapped at the interfaces of KTaO3-based heterostructures [9].
In the paraelectric phase, the triply degenerated soft optic mode with T1u symmetry, which is responsible for the ferroelectric instability, is Raman-inactive but infrared-active. The dispersion relations of the transverse acoustic (TA) and the low-frequency optical (TO) phonon modes of KTaO3 were measured in the temperature range between 4 and 300 K using neutron inelastic scattering [10]. The soft TO mode frequency at room temperature is 86 cm−1, which is nearly equal to the frequencies observed by far-infrared spectroscopy and hyper-Raman scattering. When squared to the soft TO-mode frequency, this obeys the Curie–Weiss law in the temperature range from 400 to 90 K. Remarkable temperature dependences were also observed in the scattering intensities of the TO and TA phonons with q along the a-axis. The difference in elastic anomaly between neutron scattering and ultrasonic measurements was attributed to the quasi-harmonic coupling of TO and TA phonons [11]. This transformation is driven by the softening of an optic-phonon mode at k = 0; however, at first, the lattice instability is induced by a coupled excitation with a nonzero wave vector.
It is known that vibrational spectroscopy is a powerful tool to investigate various phonon modes. Raman scattering spectroscopy measures the inelastic light scattering by optical phonons, which are Raman-active [4]. Infrared spectroscopy measures the absorption by optical phonons, which are infrared-active. A ferroelectric phase does not have a center of symmetry; therefore, the ferroelectric soft modes are Raman- and infrared-active. Due to the existence of a center of symmetry the exclusion principle holds, namely, the Raman-active mode is infrared-inactive and vice versa. Since the point group is centrosymmetric in a paraelectric cubic phase, ferroelectric soft modes are Raman-inactive and infrared-active. Therefore, it is impossible to measure ferroelectric soft modes in a paraelectric phase using Raman spectroscopy. A ferroelectric soft mode of KTaO3 (TO1) with T1u symmetry was measured by hyper-Raman scattering between 5 and 300 K [12]. A “soft” mode was reported, with frequency lowering as the temperature is lowered towards the “Curie” temperature. This is in accordance with the temperature dependence of the dielectric constant, interpreted using Cochran’s theory [2]. Normal optical modes of KTaO3 crystals [13,14] and ceramics [15] were studied using infrared spectroscopy. Three polar modes with the expected T1u symmetry (TO1, TO2, and TO4 modes) for the cubic structure were observed. The lowest-frequency TO1 mode (soft mode) strongly softens upon cooling, while the TO2 and TO4 mode frequencies do not change with temperature.
The disadvantage of using infrared spectroscopy to observe soft modes in the far-infrared region using an incoherent light source is the weak signals and the uncertainty of Kramers–Kronig analysis. In contrast, the development of terahertz time-domain spectroscopy (THz-TDS), using a coherent THz radiation excited by a femto-second pulse laser, enables the accurate determination of the real and imaginary parts of a dielectric constant [16,17].
In this study, the infrared-active and Raman-inactive TO and LO modes with the T1u symmetry of a cubic KTaO3 crystal were studied. Transmission and reflection broadband Terahertz Time-Domain Spectroscopy (THz-TDS) was used to determine the real and imaginary parts of a dielectric constant in the frequency range from 6 to 225 cm−1. Frequencies higher than 50 cm−1 were also measured by an FTIR spectrometer in the frequency range from 50 to 1200 cm−1. Three Raman-inactive polar modes and related polariton dispersion relations with T1u symmetry were studied in the large frequency range between 6 and 1200 cm−1.
2. Experimental Methods
High-speed asynchronous optical sampling (AOS) enables ultrafast THz-TDS measurement [17]. Despite the mechanical delay line, two femtosecond lasers were used with slightly modulated repetition rates. The AOS remarkably reduces acquisition time down to about 10 milliseconds for a THz pulse. For the broadband THz spectroscopy, a widely tunable monochromatic Cherenkov phase-matched THz wave generator made using high-quality optic crystals of MgO-doped LiNbO3 was used [18]. THz light is opaque for the metallic compounds due to the high conductivity and for ferroelectric materials due to the high dielectric constant. The reflection THz-TDS has a marked advantage for conventional FT-IR spectroscopy in the far-infrared region. The THz reflection was measured at room temperature using ultrafast THz-TDS (TAS7500SU, Advantest Co., Tokyo, Japan) with a Cherenkov-type THz generator and the high-speed AOS technique. For the configuration of reflection measurement, the incident beam is near normal and the incident angle is about 12°. A mirror-polished aluminum plate was used as a reference.
Infrared reflection spectra were measured by a Biorad 575C FT-IR spectrometer (Hercules, CA, USA) with a fixed-angle specular reflectance accessory. Spectra were measured with the spectral resolution 2 cm−1 in the frequency range between 50 and 1200 cm−1 [19].
The purity of KTaO3 transparent and colorless crystals is 99.99% (from Crystal Base. Co., Ltd., Toyonaka, Japan). The crystals were annealed in O2 to saturate oxygen defects after slicing. Optically polished (100) KTaO3 crystal plates with sizes of 10 × 10 × 0.5 mm3 and 5 × 5 × 0.5 mm3 were used for the THz-TDS and FTIR measurements, respectively.
3. Complex Dielectric Constant
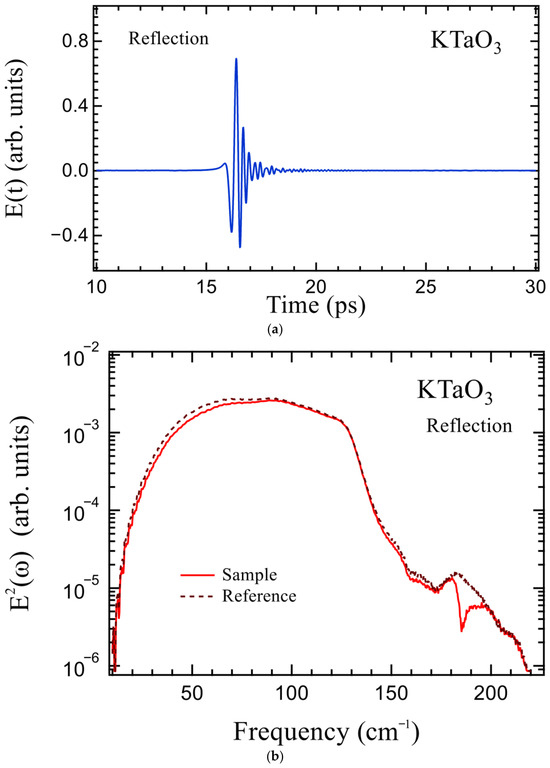
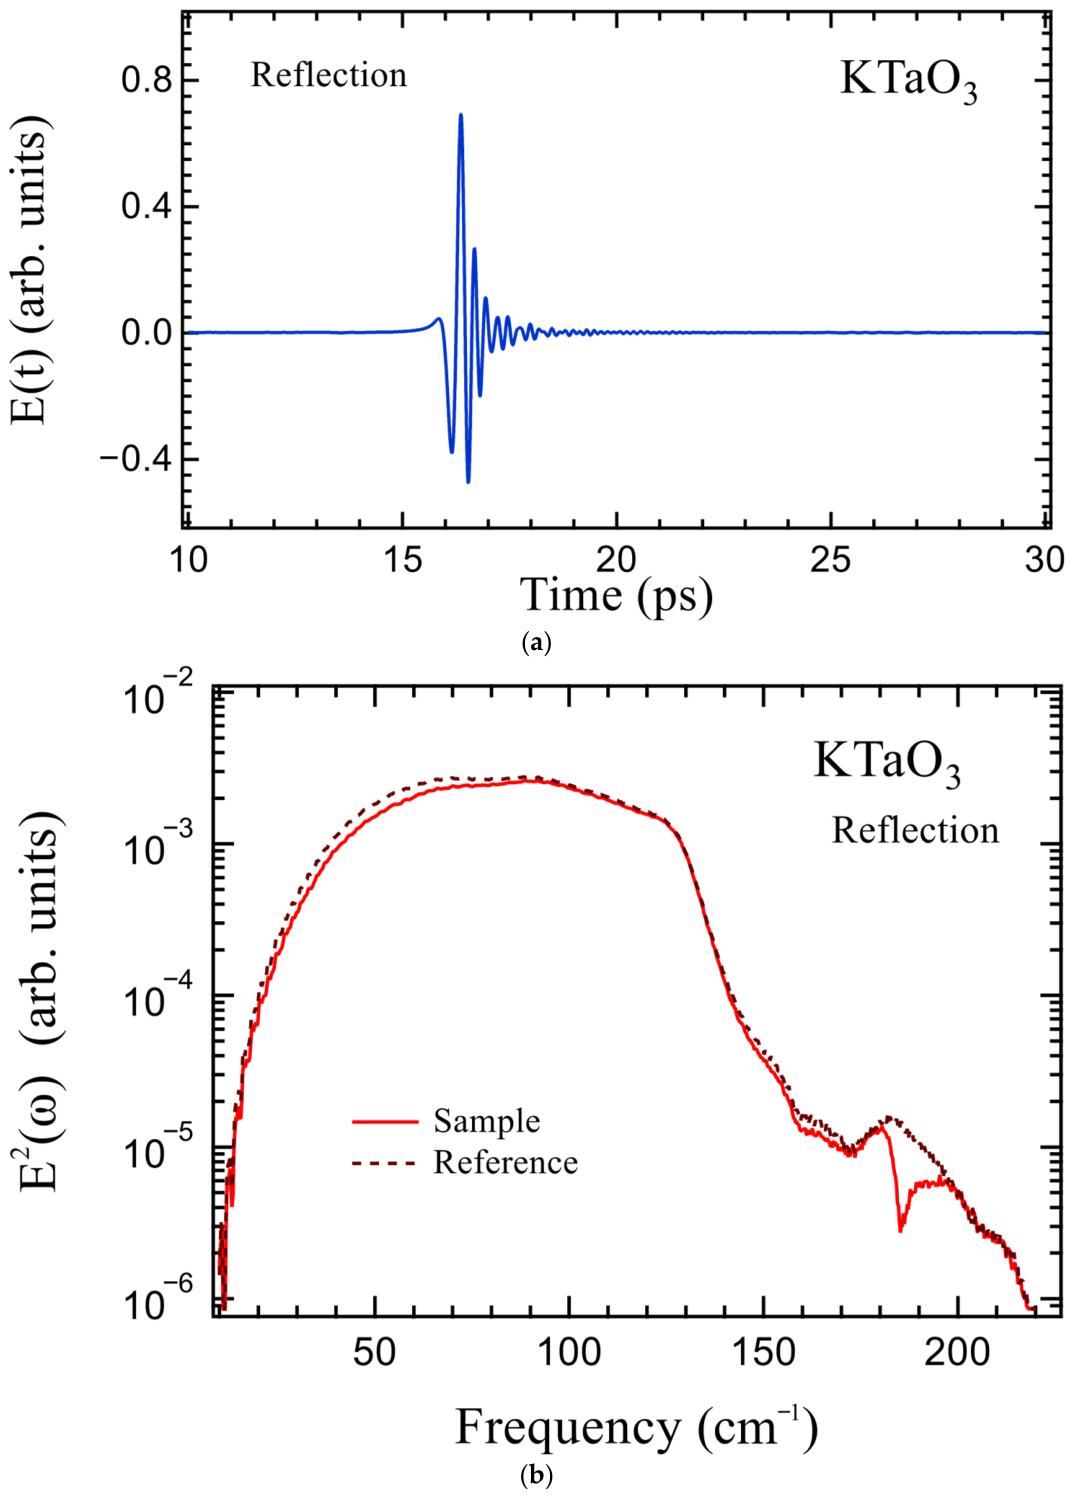
Figure 1a shows the time dependence of the THz electric field of a KTaO3 plate. Figure 1b shows the frequency dependences of the squared electric field and the reflectivity reference THz spectra, determined by Fourier transformation in the frequency range between 6 and 225 cm−1.
Figure 1.
(a) Time dependence of the THz electric field of a KTaO3 crystal and (b) frequency dependence of the squared electric field measured by the reflection THz-TDS. Reference was measured by the replacement of a KTaO3 crystal by an aluminum mirror.
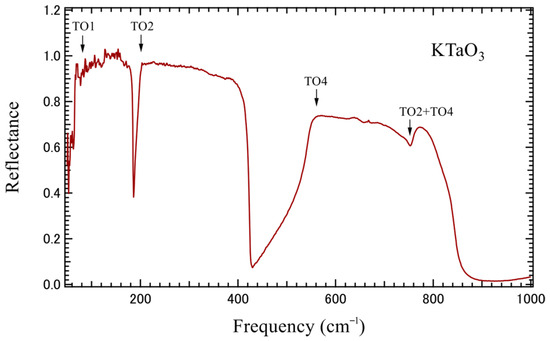
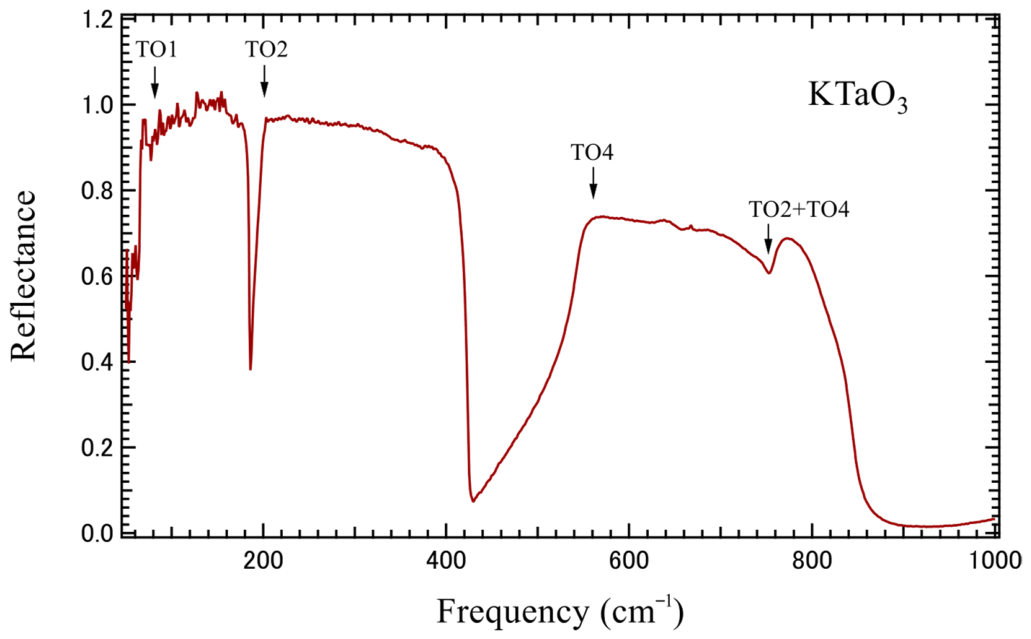
Infrared reflection spectra were also measured at room temperature in the frequency range from 50 to 1200 cm−1 with a Biorad 575C FT-IR spectrometer using a fixed-angle specular reflectance accessory. The spectral resolution was 2 cm−1. The (100) plate of KTaO3 crystal, whose size is 5 × 5 × 0.5 mm3 with two optically polished surfaces, was used in this study. The frequency dependence of the reflectance of a KTaO3 crystal measured by FTIR is shown in Figure 2 in the frequency range from 50 to 1200 cm−1. Three infrared-active fundamental vibrations with T1u symmetry, TO1, TO2, and TO4 modes, were observed. The dip at about 755 cm−1 shown by TO2 + TO4 is attributed to the two-phonon combination band of the TO2 and TO4 modes [13]. This combination band was also observed by Raman scattering at 760 cm−1 [20]. The frequency of the combination band is ωcb (q = 0) = ω2 (q) + ω4 (−q). The result is in agreement with the IR literature data on KTaO3 single crystals [13,14] and ceramics [15].
Figure 2.
Reflectivity spectrum of a KTaO3 crystal in the frequency range from 50 to 1000 cm−1, measured by FTIR. Approximate positions for the TO1, TO2, and TO4 polar modes are marked. TO2 + TO4 indicates two phonon combination bands for the TO2 and TO4 modes.
In the early analysis of IR spectra [13], the classical dispersion model of the damped harmonic oscillator model with four modes was used; the two phonon combination bands were included as an additional mode. In this model, a complex dielectric constant is written by
Here, , m, , , and γj are the high-frequency dielectric constant, number of normal modes, strength, mode frequency, and damping constant of the j-th mode, respectively. However, attempts to fit the reflectivity spectrum by Equation (2) using 13 parameters were not completely satisfactory. For an accurate fitting, the frequency-dependent damping constant for the TO1 mode γ1 was suggested, because strong anharmonicity was expected for a ferroelectric soft mode. The γ1 in the low-frequency range is controlled by the decay of phonons of the TO1 branch of the vibrational spectrum by a two-phonon process into a pair of phonons, which were probably acoustic, so that the total phonon wavevector is zero. Therefore, the estimated frequency dependence of damping constant by reflectivity fitting showed a complicated frequency dependence, and it is very difficult to analyze the spectra by the fitting, including the complicated, frequency-dependent damping constant.
When fitting the reflectivity spectra of KTaO3 ceramics, the following factorized form of a dielectric constant with 17 fitting parameters, including the damping constants of LO modes, was used. In this equation, the frequency dependence of the damping constants is not included, while the number of fitting parameters increases by four in comparison with the damped oscillator model in Reference [13], in which the damping constants of LO modes were not included.
where ωLOj and γLOj are the frequency and damping of j-th longitudinal optic (LO) mode, and ωLOj and γLOj are the frequency and damping of j-th transverse optic (TO) mode, respectively. In the damped oscillator mode shown in Equation (2), the number of fitting parameters is three, while Equation (3) includes four parameters for each mode because the damping constant of an LO mode is added.
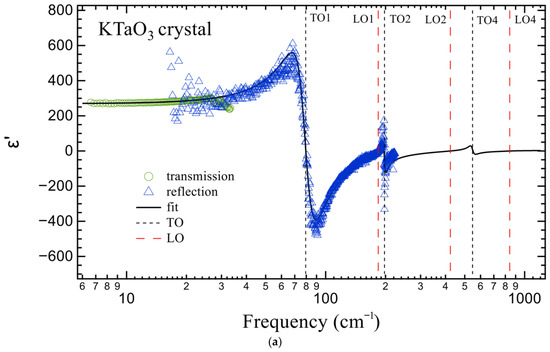
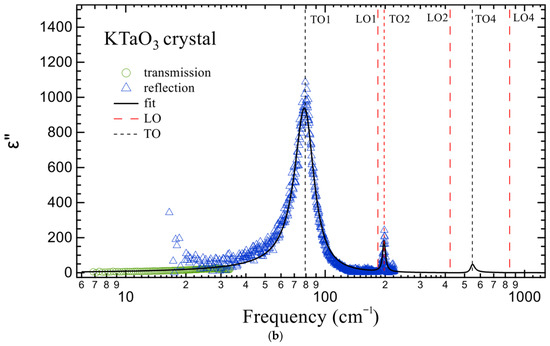
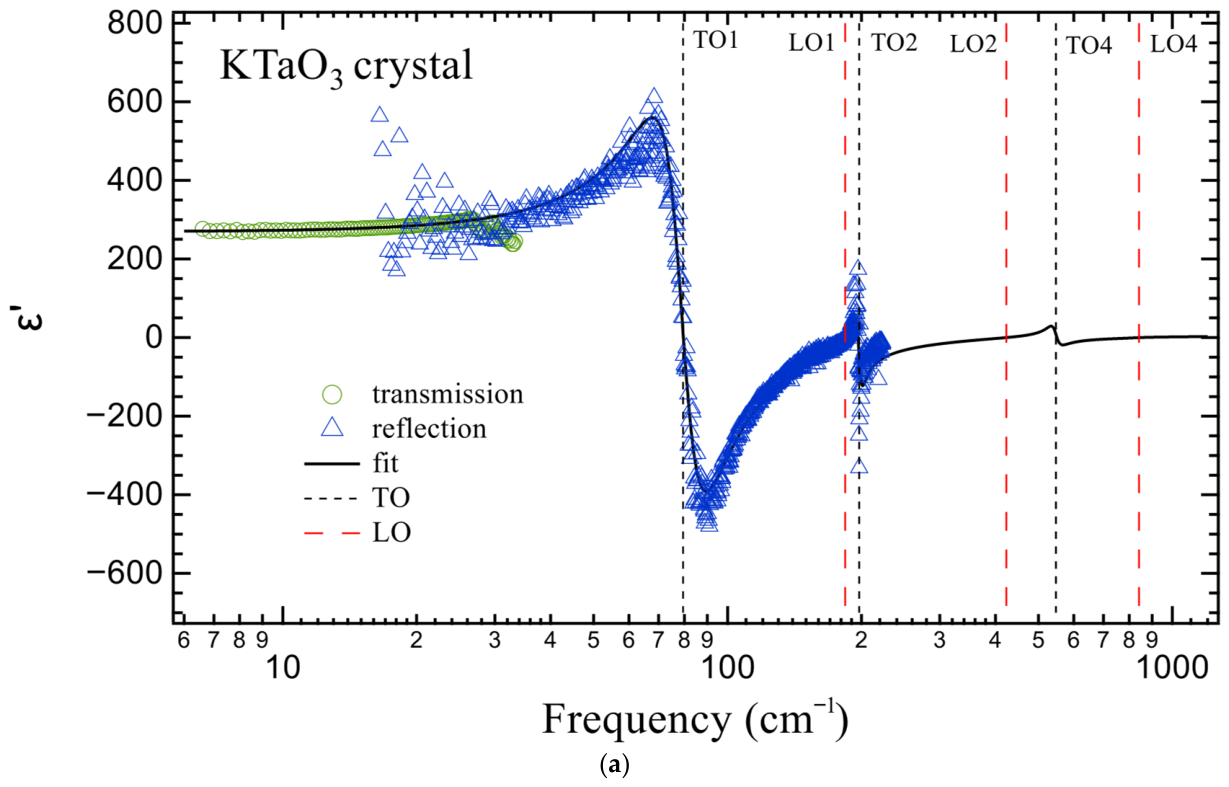
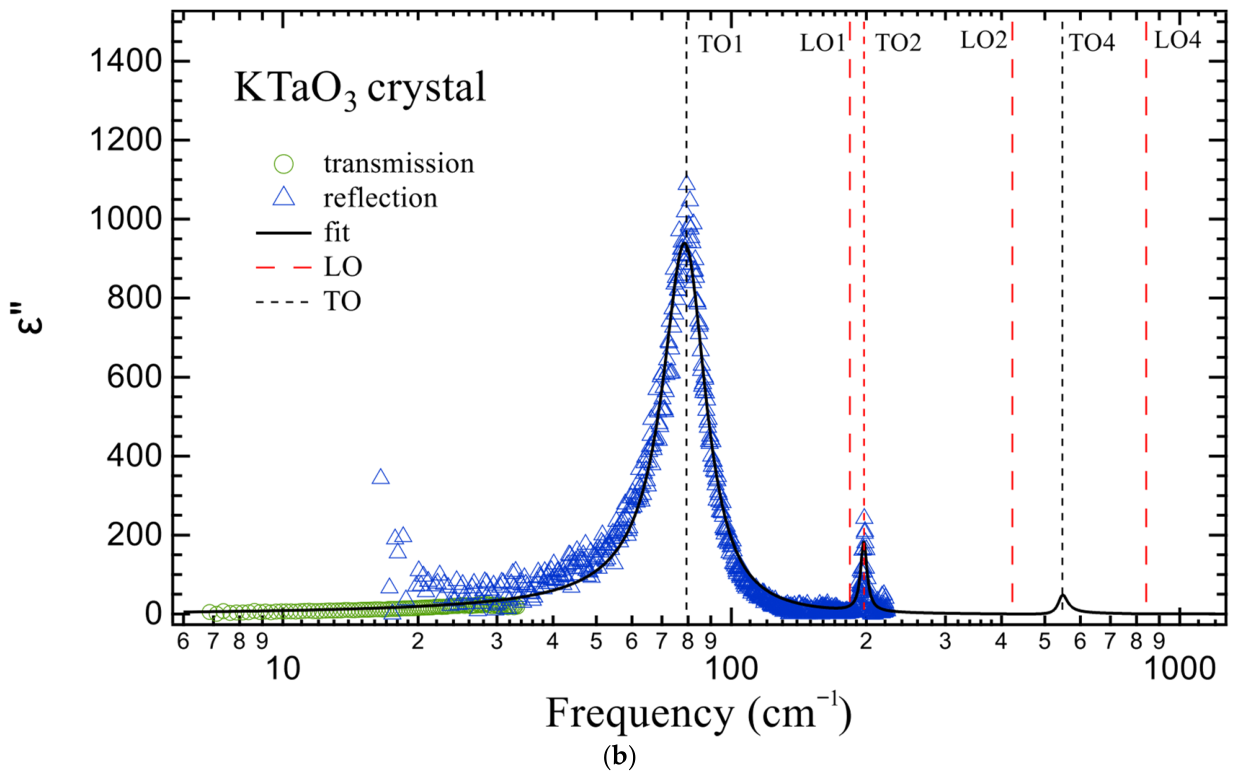
The real and imaginary parts of a dielectric constant along the [100] axis are uniquely determined by transmission and reflection THz-TDS, without any fitting in the frequency range between 6 and 225 cm−1, as shown in Figure 3a,b. The low-frequency, two infrared-active fundamental vibrations with T1u symmetry, TO1 and TO2 modes, allowed by the lattice symmetry have been observed. The strength of the lowest frequency TO1 mode accounts for the large low-frequency dielectric constant of the material. The observed results by THz-TDS and FTIR in the range between 6 and 1200 cm−1 were fitted by Equation (3), and Figure 3a,b show the frequency dependences of real and imaginary parts of the fitted dielectric constant, respectively. Values of fitting parameters in Equation (3) are listed in Table 1, where the combination bands are included as a background (BG).
Figure 3.
(a) real and (b) imaginary parts of a complex dielectric constant of a KTaO3 crystal in the frequency range from 6 to 1200 cm−1 at room temperature. Results obtained via transmission and reflection THz-TDS are shown as circles and triangles, respectively. The low-frequency two infrared-active TO1 and TO2 modes with T1u symmetry were observed by THz-TDS. The fitted curves obtained using Equation (3) are shown by solid lines.
Table 1.
Values of fitting parameters in Equation (3), where BG is a background ε∞ = 4.5.
4. Dispersion of Raman Inactive Phonon–Polariton
A coupled excitation between a photon and other quasiparticles is called a polariton [21]. The wavevector dependence of polariton frequency was first experimentally observed on a GaP crystal by the angular dependence of the forward Raman scattering spectra at small scattering angles [22]. The dispersion of phonon polaritons in the THz range is important for technological applications to a tunable Raman laser, a tunable terahertz radiation source, etc. [23,24].
According to the theory by Huang [21], the relation between polariton frequency and polariton wavevector is given by the following equation:
where ω, k, c, and ε(k,ω) are the polariton frequency, amplitude of the polariton wavevector, phase velocity of the photon, and the dielectric constant of a medium, respectively. To date, polaritons have mostly been studied via frequency-domain observation using far-infrared, forward Raman scattering, and impulsive stimulated Raman scattering [25].
When the potential of atomic displacements is anharmonic, attenuation occurs in the propagation of polaritons, which is related to the damping of phonons. This damping is related to a complex dielectric constant ε(k,ω). According to Equation (4), k or ω can also be complex. For the spatial decay, k has nonzero imaginary parts [26],
k(ω) = k′(ω) + ik″(ω).
The real part k′ defines the propagation with a wavelength λ = 2π/k′ and the imaginary part k″ defines the attenuation. The refractive index is also complex:
ε(k,ω) = {n(k,ω) + iκ(k,ω)}2.
Here, n(k,ω) is the refractive index of the material and κ(k,ω) is the extinction coefficient. The relation between polariton frequency and the real and imaginary parts of the k(ω) is given by
k′(ω) = ω/c n(k,ω), k″(ω) = ω/c κ(k,ω).
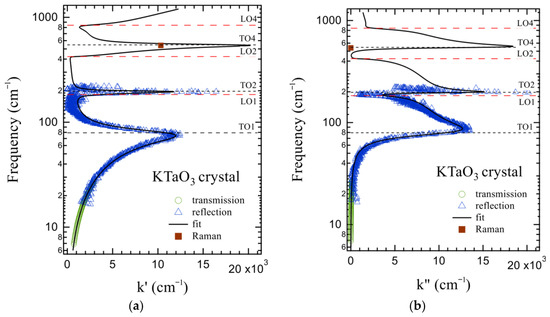
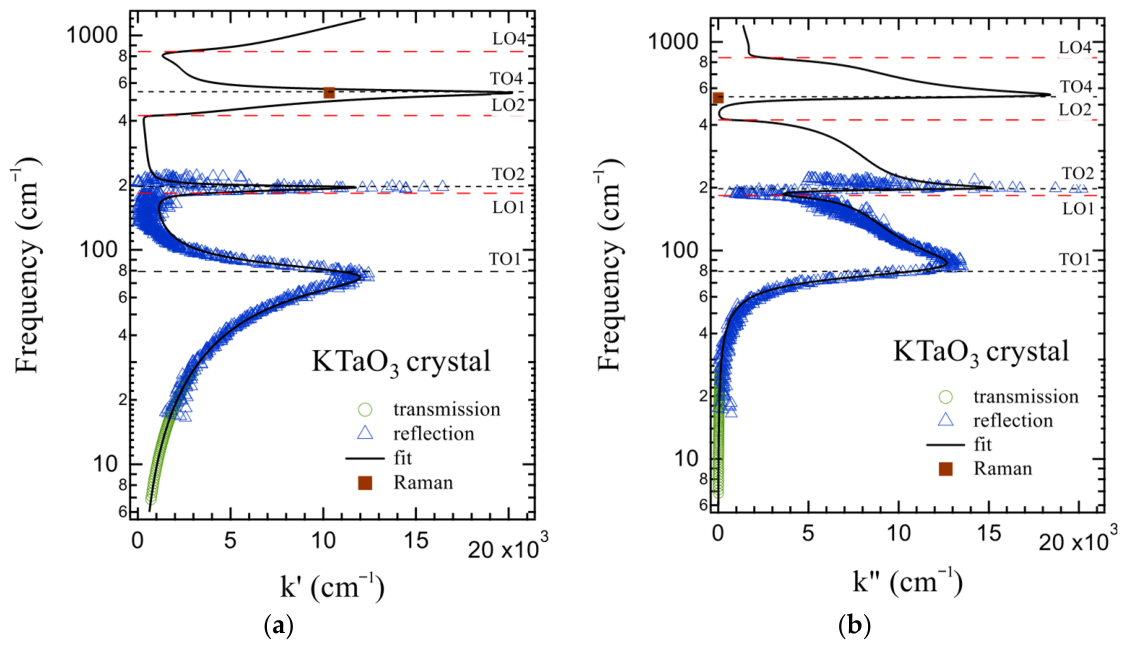
The observed and calculated polariton frequency dependences on the real and imaginary parts of a complex wavevector in the T1u polariton of KTaO3 in the frequency range from 6 to 1200 cm−1 were shown in Figure 4a,b, in which the observed values by transmission, reflection THz-TDS and the fitted value by Equation (3) are plotted. The T1u polariton is Raman-inactive by the center of symmetry, while it becomes Raman-active through the break of the center of symmetry resulting from the application of electric fields. The polariton dispersion of a KTaO3 crystal under external electric fields was also studied using the small-angle Raman scattering measurement by Scott [27]. The TO3-polariton peak was observed at 540 cm−1 for the scattering angle 2°, while TO1-polariton and TO2-polariton peaks were not observed. The result of Reference [27] are also plotted in Figure 4a,b for comparison with the present results. The result by Scott is in agreement with the present result within experimental uncertainty.
Figure 4.
Polariton frequency dispersion for (a) real and (b) imaginary parts of the polariton wave number of a KTaO3 crystal in the frequency range from 6 to 1200 cm−1 at room temperature. Results observed by transmission and reflection THz TDS are shown as circles and triangles, respectively. The fitted curves obtained using Equation (3) are shown by solid lines. The result of electric field-induced Raman scattering [26] is shown by the squares. Mode frequencies are shown by color/dash lines.
In the low-frequency region far below the TO1 mode frequency, ωTO1 = 79.4 cm−1, the polariton dispersion of k′ is photon-like and nearly linear as the polariton frequency increases, as shown in Figure 4a. As the frequency increases, the polariton becomes phonon like and the nonlinearity is enhanced towards ωTO1. Regarding the polariton dispersion of the lowest-frequency A1(z) mode of LiNbO3, Penna et al. reported the disappearance of the photon-like linear polariton dispersion below 50 cm−1 for the unpoled lithium tantalate crystal. They discussed this phenomenon using the assumption of the scattering of polariton propagation by multi-domain structures [28]. However, such a disappearance of polariton dispersion below 50 cm−1 was not observed in poled LiNbO3 crystals [29]. Since a KTaO3 crystal does not include any domain and scattering defects, such an anomalous dispersion related to static heterogeneity is not observed. The quasi-harmonic coupling of optic- and acoustic-like excitations observed by neutron inelastic scattering [11] is not detected in the polariton dispersion because the polaritons were observed in the long wavelength region.
For the polariton dispersion of the imaginary part k″, in a low-frequency region of far below ωTO1 = 79.4 cm−1 the dispersion is photon-like and the k″ is very small, as shown in Figure 4b. As the polariton frequency approaches ωTO1, the polariton becomes phonon-like and k″ rapidly increases towards ωTO1. If there is a coupling between TO1 phonon and other excitations, an additional increase in k″ is observed. In a van der Waals multiferroic NiI2 crystal, in which ferroelectricity is induced by the helimagnetic spin order, the additional shoulder peak of k″ was observed via the coupling between optic phonons and magnons [30,31]. KTaO3 likely has no elementary excitations that couple to T1u modes, as no shoulder is observed in the k″ dispersion within experimental uncertainty. However, it was suggested that magnetism likely arises from the Ta4+ local moments created in the presence of oxygen vacancies [9]. In such a case, there is the possibility of observing the anomaly in the k″ dispersion through the coupling between optic phonons and magnons.
If the damping constants of optical modes are zero, there is a gap between TO1- and LO1-mode (ωLO1 = 183.7 cm−1) frequencies. However, for the nonzero damping constant the dispersion appears between the TO1 and LO1 gap. For further increases from LO1, the TO2 (νTO2 = 197.6 cm−1) polariton frequency increases to LO2 (ωLO2 = 423.3 cm−1) through the photon-like region just above ωLO1 as shown in Figure 4a.
The frequency dependence of the TO1-polariton damping constant is very small in the photon-like region, while it gradually increases, the polariton becomes phonon-like and the damping constant increases toward ωTO1 as the k″ increases, as shown in Figure 4b. The important physical quantities of a polariton peak in Raman scattering are the peak frequency and the peak width. However, Reference [27] is only the observed value of the polariton peak frequency, and the peak width was not reported. The observed polariton peak width includes not only the damping of polariton but also the distribution of scattering angles related to the entrance slit of a spectrometer in a small-angle scattering experiment [29]. Therefore, the polariton dispersion studies using Raman scattering reported dispersion with no damping [26]. Therefore, THz-TDS is a unique, valuable method to determine the complex dispersion relation of polaritons, in addition to using the advantage of the centrosymmetric exclusive selection rule to observe infrared-active modes.
Regarding the use of new surface physics, such as 2DEG, in the KTaO3-based heterostructure [9], subterahertz surface optical phonons of KTaO3 were studied by surface-sensitive spintronic terahertz spectroscopy (SSTS) below 2.5 THz (81 cm−1) [32]. The mode frequency of the TO1 soft mode was determined by the deep minimum of THz emission, while the complex dielectric constant was not determined as a function of frequency. The present THz spectroscopy may determine the complex dielectric constant and can be used to study the polariton dispersion of not only bulk phonon polariton but also surface phonon-polariton [33] in the broad frequency range. Regarding the Raman-inactive soft phonons of inorganic oxide perovskite material that is not quantum paraelectric, the soft phonon and its polariton dispersion relation was studied using THz-TDS [34].
5. Conclusions
To date, the dispersion of phonon–polariton frequency was mainly studied by Raman scattering. However, it is difficult to determine the polariton damping due to the uncertainty of the very small scattering angle in Raman scattering. Therefore, the study of dispersion relations of Raman inactive phonon–polariton and frequency and damping is quite rare. Quantum paraelectric perovskite oxide KTaO3 belongs to the cubic space group Pmm in a large temperature range. Polar optical modes with T1u symmetry, which are responsible for ferroelectric instability, are infrared-active and Raman-inactive according to the exclusion principle of the selection rule. In general, the polar modes, which are responsible for ferroelectric instability, are infrared-active and Raman-inactive in a paraelectric phase. Therefore, there are still not enough studies on Raman-inactive soft modes, and related phonon polaritons. In the present study, Raman-inactive polar modes and related polaritons with T1u symmetry are studied by Terahertz Time-Domain spectroscopy (THz-TDS) and FTIR in the large frequency range between 6 and 1200 cm−1. The real and imaginary parts of a dielectric constant along the [100] axis are uniquely determined by transmission and reflection THz-TDS without any fitting in the range between 6 and 225 cm−1, which covers two lowest-frequency polar modes. The reflectivity is determined by reflection FTIR in the range between 50 and 1200 cm−1, and the complex dielectric constant is estimated by the fitting in the range between 6 and 1200 cm−1. The phonon–polariton dispersion relations of the real and imaginary parts of a polariton wavevector are also investigated in the range between 6 and 1200 cm−1. The crossover from photon-like to phonon-like polaritons and related polariton damping is observed in the polariton dispersion. No anomaly related to polariton scattering and coupling to other elementary excitations is observed. In KTaO3 the carrier electrons, by doping heterovalent ions or oxygen vacancies, induces new ideas in physics such as 2D heterostructures, superconductivity, ferroelectricity, etc., and the observed physical properties are very important as they are the standard physical properties of bulk pure crystals.
Author Contributions
Conceptualization, S.K.; Methodology, T.M., M.M. and S.K.; Formal analysis, T.M. and M.M.; Investigation, T.M. and S.K.; Writing—original draft, S.K.; Writing—review & editing, T.M. and M.M. All authors have read and agreed to the published version of the manuscript.
Funding
This research was funded by JSPS KAKENHI, Grant Number JP23K25836 (to T.M.), and The Asahi Glass Foundation (to T.M.). The APC was funded by MDPI.
Data Availability Statement
The original contributions presented in this study are included in the article material. Further inquiries can be directed to the corresponding author.
Acknowledgments
The authors thank the staff of Advantest Corporation for technical assistance during the reflection THz-TDS measurements.
Conflicts of Interest
The authors declare no conflicts of interest.
References
- Xu, Y. Ferroelectric Materials and Their Applications, 1st ed.; North-Holland: Amsterdam, The Netherlands, 1991. [Google Scholar]
- Cochran, W. Crystal Stability and the Theory of Ferroelectricity. Adv. Phys. 1960, 9, 387–423. [Google Scholar] [CrossRef] [Scilit]
- Goldschmidt, V.M. Die Gesetze der Krystallochemie. Naturwissenschaften 1926, 14, 477–485. [Google Scholar] [CrossRef] [Scilit]
- Kojima, S. Vibrational Spectroscopy of Perovskite Ferroelectrics. Solids 2024, 5, 593–616. [Google Scholar] [CrossRef] [Scilit]
- Barrett, J.H. Dielectric Constant in Perovskite Type Crystals. Phys. Rev. 1952, 86, 118–120. [Google Scholar] [CrossRef] [Scilit]
- Wemple, S.H. Some Transport Properties of Oxygen-Deficient Single-Crystal Potassium Tantalate (KTaO3). Phys. Rev. 1965, 137, A1575–A1582. [Google Scholar] [CrossRef] [Scilit]
- Akbarzadeh, A.R.; Kornev, I.; Malibert, C.; Bellaiche, L.; Kiat, J.M. Combined theoretical and experimental study of the low-temperature properties of BaZrO3. Phys. Rev. B 2005, 72, 205104. [Google Scholar] [CrossRef] [Scilit]
- Matthias, B.T.; Remeika, J.P. Ferroelectricity in the Ilmenite Structure. Phys. Rev. 1949, 76, 1886–1887. [Google Scholar] [CrossRef] [Scilit]
- Gupta, A.; Silotia, H.; Kumari, A.; Dumen, M.; Goyal, S.; Tomar, R.; Wadehra, N.; Ayyub, P.; Chakraverty, S. KTaO3—The new kid on the spintronics block. Adv. Mater. 2022, 34, 2106481. [Google Scholar] [CrossRef] [Scilit] [PubMed]
- Shirane, G.; Nathans, R.; Minkiewicz, V.J. Temperature Dependence of the Soft Ferroelectric Mode in KTaO3. Phys. Rev. 1967, 157, 396–399. [Google Scholar] [CrossRef] [Scilit]
- Axe, J.D.; Harada, J.; Shirane, G. Anomalous Acoustic Dispersion in Centrosymmetric Crystals with Soft Optic Phonons. Phys. Rev. B 1970, 1, 1227–1234. [Google Scholar] [CrossRef] [Scilit]
- Vogt, H. Refined treatment of the model of linearly coupled anharmonic oscillators and its application to the temperature dependence of the zone-center soft-mode frequencies of KTaO3 and SrTiO3. Phys. Rev. B 1995, 51, 8046–8059. [Google Scholar] [CrossRef] [Scilit] [PubMed]
- Miller, R.C.; Spitzer, W.G. Far Infrared Dielectric Dispersion in KTaO3. Phys. Rev. 1963, 129, 94–98. [Google Scholar] [CrossRef] [Scilit]
- Perry, C.H.; McNelly, T.F. Ferroelectric “Soft” Mode in KTaO3. Phys. Rev. 1967, 154, 456–458. [Google Scholar] [CrossRef] [Scilit]
- Glinšek, S.; Nuzhnyy, D.; Petzelt, J.; Malič, B.; Kamba, S.; Bovtun, V.; Kempa, M.; Skoromets, V.; Kužel, P.; Gregora, I.; et al. Lattice dynamics and broad-band dielectric properties of the KTaO3 ceramics. J. Appl. Phys. 2012, 111, 104101. [Google Scholar] [CrossRef] [Scilit]
- Kojima, S.; Shibata, T.; Igawa, H.; Mori, T. Broadband terahertz time-domain spectroscopy: Crystalline and glassy drug materials. IOP Conf. Ser. Mater. Sci. Eng. 2014, 54, 12001. [Google Scholar] [CrossRef] [Scilit]
- Mori, T.; Igawa, H.; Kojima, S. Progress of ultrafast terahertz time-domain spectroscopy: Raman inactive soft mode in quantum paraelectric SrTiO3. IOP Conf. Ser. Mater. Sci. Eng. 2014, 54, 12006. [Google Scholar] [CrossRef] [Scilit]
- Shibuya, T.; Suizu, K.; Kawase, K. Widely Tunable Monochromatic Cherenkov Phase-Matched Terahertz Wave Generation from Bulk Lithium Niobate. Appl. Phys. Express 2010, 3, 82201. [Google Scholar] [CrossRef] [Scilit]
- Kojima, S.; Maczka, M. Raman inactive phonon-polariton dispersion in quantum paraelectric SrTiO3 crystals studied by FTIR. Ferroelectrics 2018, 524, 1–8. [Google Scholar] [CrossRef] [Scilit]
- Perry, C.H.; Fertel, J.H.; Mcnelly, T.F. Temperature Dependence of the Raman Spectrum of SrTiO3 and KTaO3. J. Chem. Phys. 1967, 47, 1619–1625. [Google Scholar] [CrossRef] [Scilit]
- Born, M.; Huang, K.; Lax, M. Dynamical Theory of Crystal Lattices; Oxford University Press: Oxford, UK, 1954. [Google Scholar]
- Henry, C.H.; Hopfield, J.J. Raman Scattering by Polaritons. Phys. Rev. Lett. 1965, 15, 964–966. [Google Scholar] [CrossRef] [Scilit]
- Lee, A.J.; Spence, D.J.; Pask, H.M. Terahertz sources based on stimulated polariton scattering. Prog. Quantum Electron. 2020, 71, 100254. [Google Scholar] [CrossRef] [Scilit]
- Lee, A.J.; Pask, H.M. Continuous wave, frequency-tunable terahertz laser radiation generated via stimulated polariton scattering. Opt. Lett. 2014, 39, 442–445. [Google Scholar] [CrossRef] [Scilit]
- Wiederrecht, G.P.; Dougherty, T.P.; Dhar, L.; Nelson, K.A.; Leaird, D.E.; Weiner, A.M. Explanation of anomalous polariton dynamics in LiTaO3. Phys. Rev. B 1995, 51, 916–931. [Google Scholar] [CrossRef] [Scilit] [PubMed]
- Claus, R.; Merten, L.; Brandmüller, J. Light Scattering by Phonon-Polaritons; Springer: Berlin/Heidelberg, Germany, 1975. [Google Scholar]
- Scott, J.F.; Fleury, P.A.; Worlock, J.M. Light Scattering from Polaritons in Centrosymmetric Crystals. Phys. Rev. 1969, 177, 1288–1291. [Google Scholar] [CrossRef] [Scilit]
- Penna, A.F.; Porto, S.P.S.; Wiener-Avnear, E. Anomalous polariton dispersion in LiTaO3 near Tc. Solid State Commun. 1977, 23, 377–378. [Google Scholar] [CrossRef] [Scilit]
- Kojima, S.; Maczka, M. Broadband phonon-polariton dispersion relation of ferroelectric LiTaO3 crystals. Ferroelectrics 2018, 533, 124–131. [Google Scholar] [CrossRef] [Scilit]
- Luo, T.; Ilyas, B.; von Hoegen, A.; Lee, Y.; Park, J.; Park, J.-G.; Gedik, N. Time-of-flight detection of terahertz phonon polariton. Nat. Commun. 2024, 15, 2276. [Google Scholar] [CrossRef] [Scilit]
- Song, Q.; Occhialini, C.A.; Ergeçen, E.; Ilyas, B.; Amoroso, D.; Barone, P.; Kapeghian, J.; Watanabe, K.; Taniguchi, T.; Botana, A.S.; et al. Evidence for a single-layer van der Waals multiferroic. Nature 2022, 602, 601–605. [Google Scholar] [CrossRef] [Scilit] [PubMed]
- Chu, Z.; Yang, J.; Li, Y.; Hwangbo, K.; Wen, J.; Bielinski, A.R.; Zhang, Q.; Martinson, A.B.F.; Hruszkewycz, S.O.; Fong, D.D.; et al. Revealing subterahertz atomic vibrations in quantum paraelectrics by surface- sensitive spintronic terahertz spec troscopy. Sci. Adv. 2024, 10, eads8601. [Google Scholar] [CrossRef] [Scilit] [PubMed]
- Carini, G.; Niemann, R.; Mueller, N.S.; Wolf, M.; Paarmann, A. Surface Phonon Polariton Ellipsometry. ACS Photonics 2025, 12, 792–800. [Google Scholar] [CrossRef] [Scilit]
- Helal, M.A.; Mori, T.; Kojima, S. Softening of infrared-active mode of perovskite BaZrO3 proved by terahertz time domain spectroscopy. Appl. Phys. Lett. 2015, 106, 182904. [Google Scholar] [CrossRef] [Scilit]

Disclaimer/Publisher’s Note: The statements, opinions and data contained in all publications are solely those of the individual author(s) and contributor(s) and not of MDPI and/or the editor(s). MDPI and/or the editor(s) disclaim responsibility for any injury to people or property resulting from any ideas, methods, instructions or products referred to in the content. |
© 2026 by the authors. Licensee MDPI, Basel, Switzerland. This article is an open access article distributed under the terms and conditions of the Creative Commons Attribution (CC BY) license.