


Abstract
Blast-induced flyrock is one of the most critical hazards in surface mining and quarrying, posing significant risks to occupational safety, nearby structures, and the environment. Accurate prediction of flyrock distance is therefore essential for safe blast design and effective risk management. In this study, Random Forest (RF), Extra Trees (ET), and Support Vector Regression (SVR) models were developed to predict flyrock distance, and their hyperparameters were optimized using the Secretary Bird Optimization Algorithm (SBOA) and the Spider-Tailed Horned Viper Optimizer (STHVO). Prior to optimization, six cross-validation strategies were compared using GridSearchCV to identify the most appropriate strategy for each model. The final models were evaluated on an independent test dataset using the coefficient of determination (R2), root mean square error (RMSE), mean absolute error (MAE), mean absolute percentage error (MAPE), variance accounted for (VAF), and Nash–Sutcliffe efficiency (NSE). Model interpretability was investigated using SHapley Additive exPlanations (SHAP). The results showed that appropriate cross-validation and metaheuristic hyperparameter optimization improved predictive performance, with the ET–STHVO model achieving the best overall results. SHAP analysis identified B/D, PF, H/B, RBS, and U/B as the most influential predictors. The proposed framework provides an accurate, robust, and interpretable decision-support tool for safer blasting operations.
1. Introduction
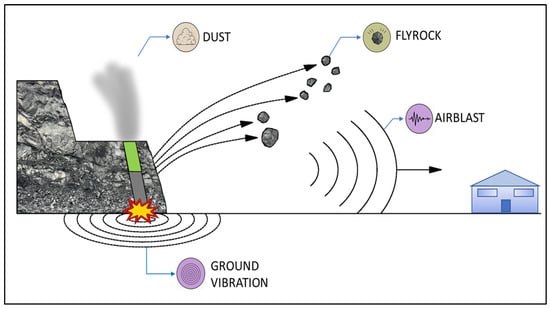
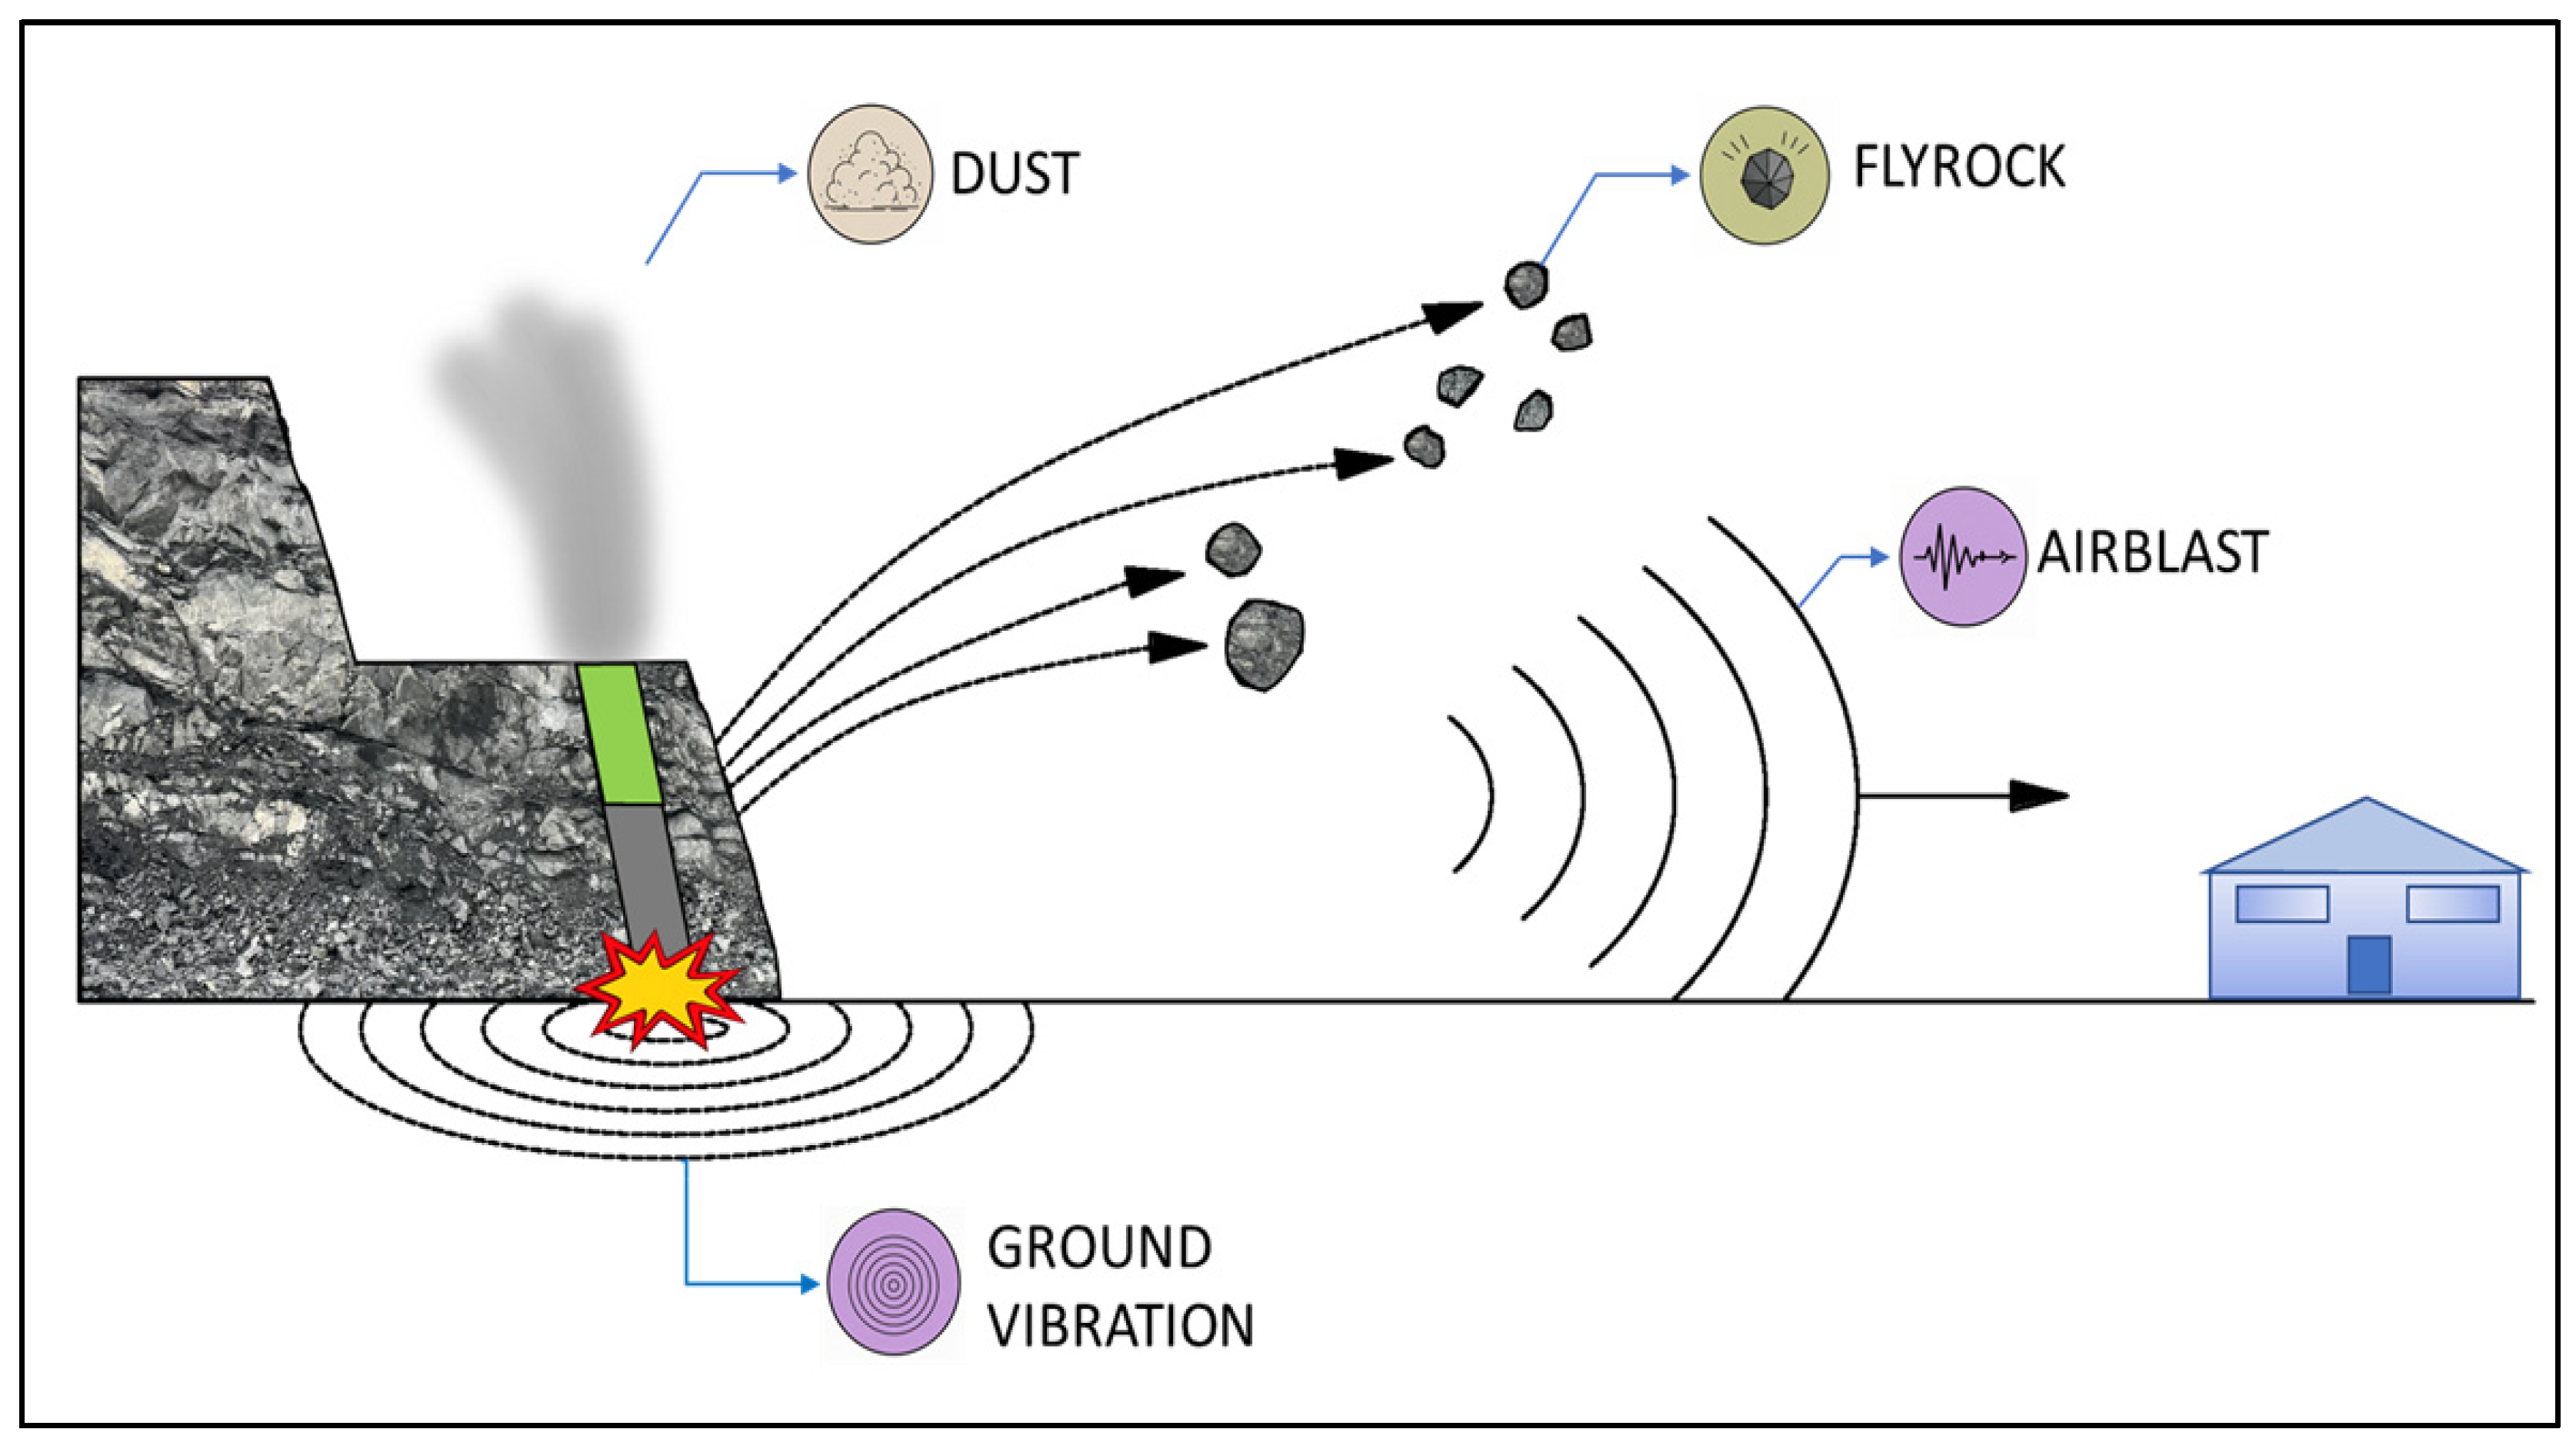
Blasting is a widely employed excavation technique in surface and underground mining for the economical and efficient extraction of rock masses. A well-designed blasting operation aims to achieve the desired fragmentation while maximizing production efficiency. In surface mining operations, however, blasting is also associated with several environmental and safety-related hazards. Only a portion of the explosive energy is utilized for rock fragmentation, whereas a considerable amount is dissipated in the form of ground vibration, air overpressure, dust generation, and flyrock (Figure 1). Flyrock is defined as the uncontrolled projection of rock fragments over unexpected distances due to the uncontrolled release of high-pressure gases generated during explosive detonation [1]. These rock fragments pose serious hazards to personnel, equipment, and nearby structures, and flyrock has been reported as one of the leading causes of blasting-related fatal accidents [2,3]. Therefore, the reliable prediction of flyrock distance is considered a fundamental requirement for safe blast design.
Figure 1.
Adverse effects of bench blasting.
Early studies on the prediction of flyrock distance primarily focused on theoretical and mathematical approaches based on blasting mechanics. Lundborg [4] investigated the relationship between blasthole diameter and flyrock distance, while Roth [5] and Chiappetta et al. [6] developed analytical approaches based on ballistic trajectory principles to estimate flyrock travel distance and related trajectory characteristics. These theoretical developments were subsequently extended toward empirical and probabilistic approaches incorporating field-specific blasting and material parameters. Gupta [7] considered burden and stemming length, St. George and Gibson [8] incorporated air resistance through a Monte Carlo-based approach, and Richards and Moore [9] distinguished flyrock generation according to three mechanisms—face burst, cratering, and rifling. Other empirical approaches incorporated safety factors, rock density, blasthole geometry, stemming conditions, and additional blasting parameters [10,11,12,13,14,15]. Some studies also introduced rock mass descriptors such as Rock Mass Rating (RMR) [13,14,15], reflecting the influence of geological conditions on flyrock generation. Although these approaches progressively expanded the range of physical, operational, and geological parameters considered in flyrock prediction, most were derived from site-specific datasets. Consequently, their applicability beyond the geological and operational conditions for which they were developed remains limited.
In subsequent studies, artificial intelligence-based approaches, including Fuzzy Logic (FL), Artificial Neural Networks (ANN), Support Vector Machines (SVM), Adaptive Neuro-Fuzzy Inference Systems (ANFIS), and Genetic Programming (GP), were increasingly employed for flyrock prediction [16,17,18,19,20]. These studies demonstrated the capability of data-driven approaches to capture the nonlinear relationships between blasting parameters and flyrock distance, with several models achieving high predictive performance. Rezaei et al. [16] reported that Fuzzy Logic outperformed conventional statistical methods, while Amini et al. [18] demonstrated superior performance of SVM compared with ANN. ANN, ANFIS, and GP models were also successfully applied using different combinations of blasting and rock mass parameters [17,19,20]. Importantly, some studies extended the input space beyond conventional blast-design parameters by incorporating rock mass characteristics. Hudaverdi et al. [21], for example, combined blasting design parameters with rock mass characteristics and developed ANFIS models using variables selected through Stepwise Regression and Factor Analysis. Their results showed that the model incorporating the burden-to-diameter ratio (B/D), in situ block size (Xb), and specific charge (q) achieved superior predictive performance. This finding indicates that incorporating structural characteristics of the rock mass may provide relevant information for modeling flyrock generation beyond that represented by blast-design parameters alone.
Optimization methods have been widely employed to solve complex mining engineering problems, including long-term production planning, pit optimization, and more recently machine learning-based prediction models for blasting applications [22,23]. In flyrock prediction, various metaheuristic algorithms have been successfully integrated with machine learning models. Ding et al. [24] optimized CFNN and LSSVM models using ABC and WOA and identified WOA-LSSVM as the best-performing model. Wang et al. [25] employed PSO and JS for ANN optimization and reported superior performance for the JS-ANN model. Similarly, Ding et al. [26] compared PSO, ABC, WOA, and ACO for GMDH optimization, with WOA-GMDH providing the best performance, whereas Nguyen et al. [27] evaluated BA, FA, SSO, and LJ for ANFIS optimization and identified LJ-ANFIS as the most accurate model. More recently, Mohammed and Hamza [28] investigated RF, XGBoost, and CatBoost, while Rouhani et al. [29] optimized LightGBM and CatBoost using AOA, JSO, HHO, and GMO and identified JSO-CatBoost as the best-performing configuration. Collectively, these studies demonstrate the effectiveness of metaheuristic optimization for improving machine learning-based flyrock prediction; however, they also show that different search strategies can provide competitive solutions for this complex optimization problem. It should also be noted that these studies were developed using datasets of different sizes and site-specific blasting conditions, which complicates direct comparison of their reported predictive performances. Moreover, particularly for relatively small blasting datasets, highly flexible or extensively optimized models may be susceptible to overfitting, emphasizing the importance of robust validation and independent testing. Despite the growing diversity of optimization algorithms applied to flyrock prediction, the recently developed SBOA and STHVO, which employ distinct exploration and exploitation mechanisms, have not yet been investigated for this problem. Their application therefore provides an opportunity to evaluate alternative search dynamics for hyperparameter optimization in flyrock modeling. To further clarify the methodological differences among previous flyrock prediction studies and position the present study within the existing literature, a comparative summary is provided in Table 1.
Table 1.
Methodological comparison of previous flyrock prediction studies and the present study.
In parallel with the development of metaheuristically optimized models, several emerging approaches have broadened the methodological scope of blasting-related prediction studies. In flyrock prediction, Bayesian-based ensemble learning and SHAP have been employed to improve predictive modeling and model interpretability [30], while uncertainty has been addressed through Z-number-based modeling [31] and uncertainty-band analysis [26]. Probabilistic approaches have also been proposed to estimate the probability of flyrock exceeding prescribed distances, providing an alternative perspective to deterministic distance prediction [32]. More recently, developments in the broader blasting literature have included AutoML for rock fragmentation prediction [33], Optuna-based automated hyperparameter optimization and physics-informed learning for blast-induced vibration prediction [34], and graph neural networks for blast-induced backbreak prediction [35]. These developments illustrate the increasing methodological diversity of data-driven blasting research and highlight complementary directions for improving model automation, interpretability, uncertainty characterization, and physical consistency.
Although hybrid machine learning models enhanced by metaheuristic optimization algorithms have demonstrated remarkable predictive performance, existing studies have generally evaluated these models using a single cross-validation strategy, without systematically investigating the influence of the selected validation strategy on model stability and generalization capability. This limitation is particularly important for blasting applications, where available datasets are typically of limited size. From an engineering perspective, the choice of cross-validation strategy can influence model selection and estimated generalization performance, thereby affecting the reliability of flyrock predictions used to support blast-design and safety-related decisions. A stable validation strategy is therefore important for reducing the risk of basing engineering decisions on overly optimistic or unstable model performance estimates. Furthermore, although rock mass parameters have been considered in some previous studies, flyrock prediction models have predominantly focused on blast-design parameters. Given the influence of rock mass discontinuities on blast-induced rock breakage and displacement, incorporating structural characteristics of the rock mass may provide additional physically relevant information for flyrock prediction. To the best of the authors’ knowledge, systematic investigations into the influence of different cross-validation strategies on flyrock prediction remain limited.
In this study, 3-fold, 5-fold, 7-fold, 10-fold, and Repeated k-fold cross-validation strategies were systematically evaluated using GridSearchCV to identify the most stable validation strategy for each machine learning model. GridSearchCV was employed solely for the comparative evaluation of cross-validation strategies and not for final hyperparameter optimization. Based on the selected validation strategy, the hyperparameters of Random Forest (RF), Extra Trees (ET), and Support Vector Regression (SVR) models were subsequently optimized using the recently developed Secretary Bird Optimization Algorithm (SBOA) and Spider-Tailed Horned Viper Optimizer (STHVO) algorithms. To better represent the structural characteristics of the rock mass, apparent in situ rock block size (RBS) was incorporated as an input variable. The developed hybrid models were evaluated using multiple statistical performance metrics, and their predictions were interpreted using SHapley Additive exPlanations (SHAP). Accordingly, the principal contributions of this study are: (i) the systematic evaluation of multiple cross-validation strategies prior to hyperparameter optimization; (ii) the application of two recently developed nature-inspired optimization algorithms, SBOA and STHVO, to blast-induced flyrock prediction; (iii) the incorporation of apparent in situ rock block size (RBS) to represent rock mass structural characteristics; and (iv) the use of SHAP to provide an interpretable assessment of the influence of the selected input variables on flyrock predictions. Together, these components provide a validation-aware, geologically informed, and interpretable framework for flyrock distance prediction.
2. Materials and Methods
2.1. Site Investigation and Data Acquisition
The field investigations were conducted at the Akdağlar sandstone quarry located in the Kemerburgaz district of Istanbul, Türkiye. Owing to the proximity of active quarries, industrial facilities, and residential areas, controlling blasting-induced environmental impacts is an important operational requirement. The quarry is situated within the Lower Carboniferous Thrace Formation, which mainly comprises sandstone with interbedded siltstone, claystone, shale, and limestone [36,37]. The rock mass is highly fractured due to Hercynian and Alpine tectonic deformation, with dominant joint sets trending NE–SW and NW–SE and joint apertures ranging from 0.1 to 1.0 mm [21]. Previous investigations reported a mean rock density of approximately 2.70 g/cm3, a mean uniaxial compressive strength of 69 MPa, and an elastic modulus of approximately 16 GPa [21].
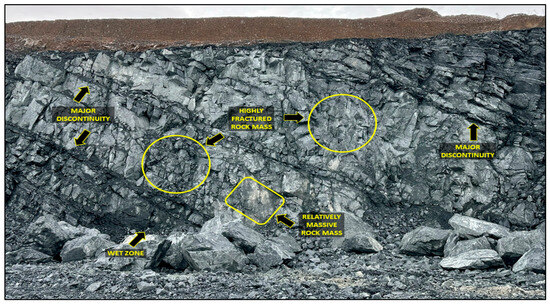
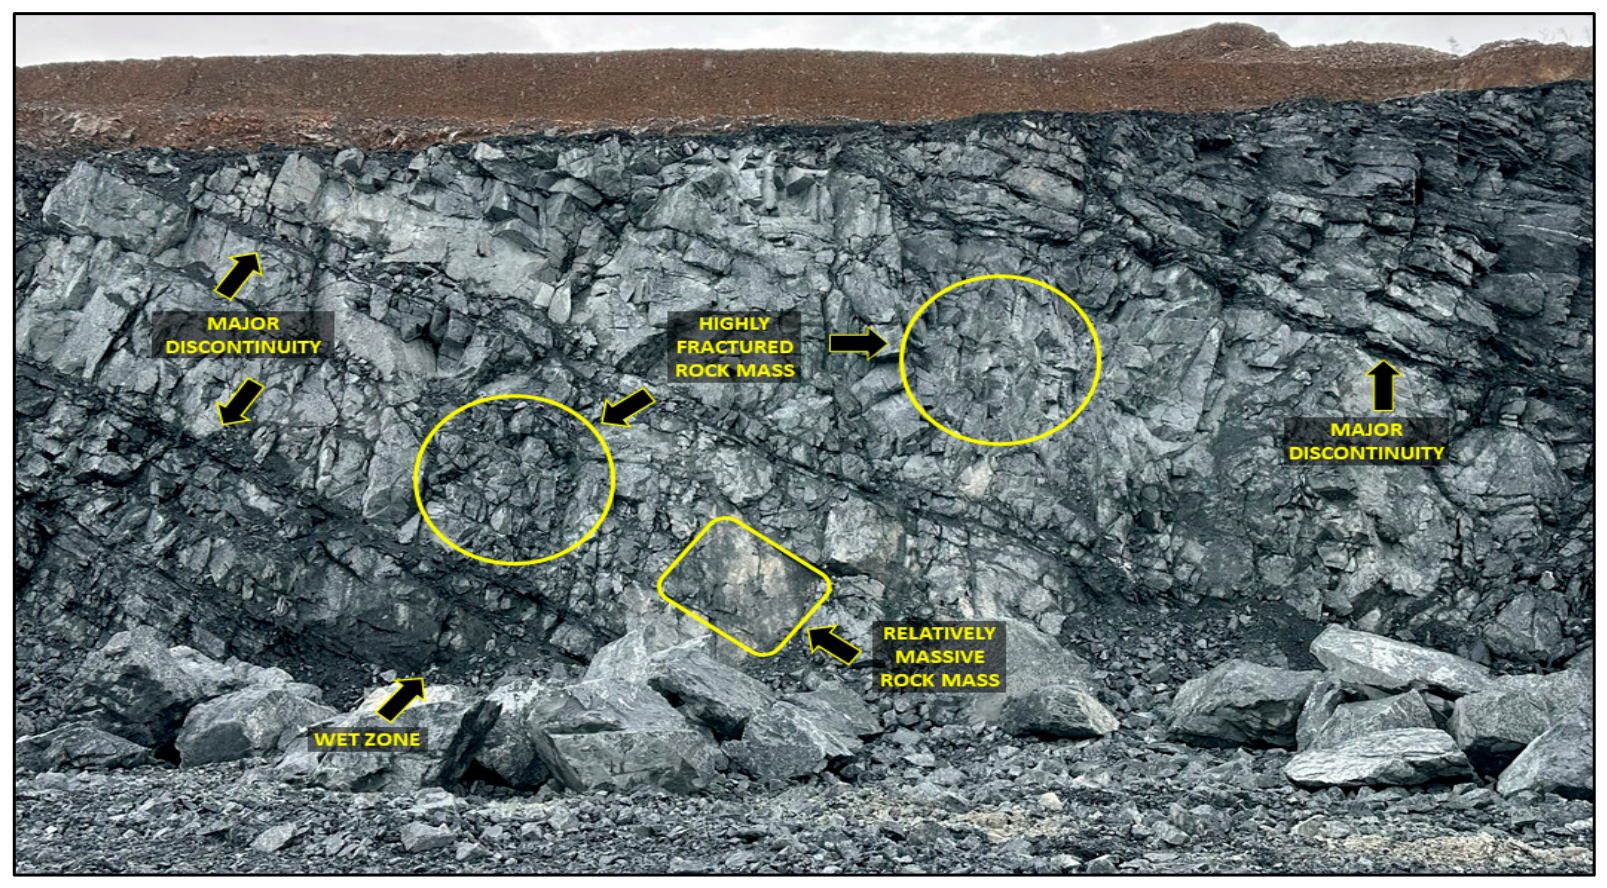
The rock mass characteristics observed at the study site are presented in Figure 2. Highly fractured zones, relatively massive rock blocks, and prominent discontinuities coexist along the blast face. In addition, localized groundwater seepage was observed along several discontinuity surfaces. This structural heterogeneity of the rock mass directly influences the propagation of stress waves, the confinement and subsequent release of explosive gases within the rock mass, and the fragmentation mechanism. Consequently, even under blasting operations conducted within the same quarry, flyrock behavior may vary considerably, making the reliable prediction of flyrock distance more challenging.
Figure 2.
Geological and structural features of the investigated bench.
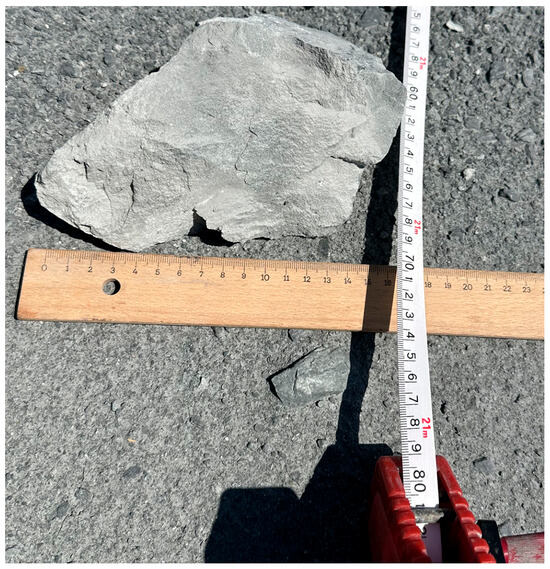
Production blasting at the quarry is carried out using 89 mm diameter blastholes. ANFO was used as the primary explosive under dry ground conditions, with emulsion explosives serving as primers. During the field investigation, a total of 111 production blasts were monitored. For each blast, bench height (H), burden (B), spacing (S), stemming length (T), blasthole diameter (D), powder factor (PF), and apparent in situ rock block size (RBS) were measured. In addition, the blasting design ratios H/B, S/B, T/B, U/B, and B/D, proposed by Ash [38], were calculated and used as input variables. RBS was included to represent the structural characteristics of the rock mass and the influence of discontinuities on flyrock generation. RBS was determined prior to each blast using WipFrag 2.7.28 image-analysis software. Scaled photographs of the corresponding bench face were analyzed to identify visible discontinuity traces and construct the discontinuity network. The closed polygons bounded by the detected discontinuities were interpreted as apparent in situ blocks, from which the apparent block-size distribution was obtained. The mean apparent block size obtained from this distribution was used as the RBS value for each blast. Flyrock distance (FRD) was defined as the maximum horizontal distance between the blast face and the farthest rock fragment capable of causing damage (Figure 3). Following recommendations in the literature, only rock fragments with diameters of approximately 10 cm or larger were considered in the flyrock assessment [39,40]. Field observations indicated that face burst was the dominant flyrock generation mechanism; therefore, the maximum horizontal flyrock distance (FRD) was selected as the target variable for the machine learning models.
Figure 3.
Field measurement of flyrock distance.
2.2. Data Exploration and Preprocessing
Prior to model development, an Exploratory Data Analysis (EDA) was performed to characterize the dataset. Table 2 summarizes the descriptive statistics of the 111 production blasts. The variables exhibited different scales and generally low skewness values, indicating approximately symmetric distributions. RBS and T/B exhibited relatively higher positive skewness than the remaining variables, whereas S/B showed slight negative skewness. For model development, only the input variables were standardized using Z-score normalization (StandardScaler), while the target variable (FRD) was retained at its original scale. To prevent data leakage, the scaler was fitted only to the training dataset and subsequently applied to the test dataset.
Table 2.
The descriptive statistics of the dataset.
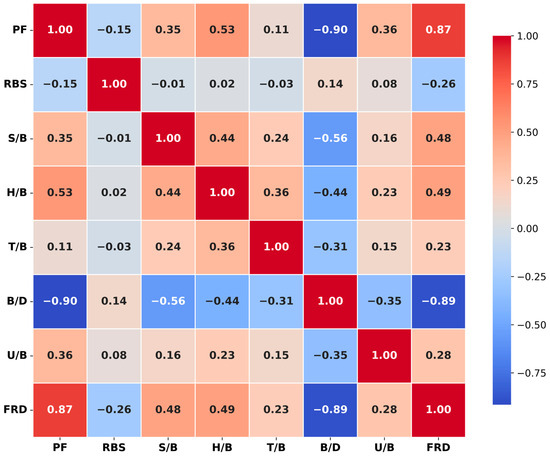
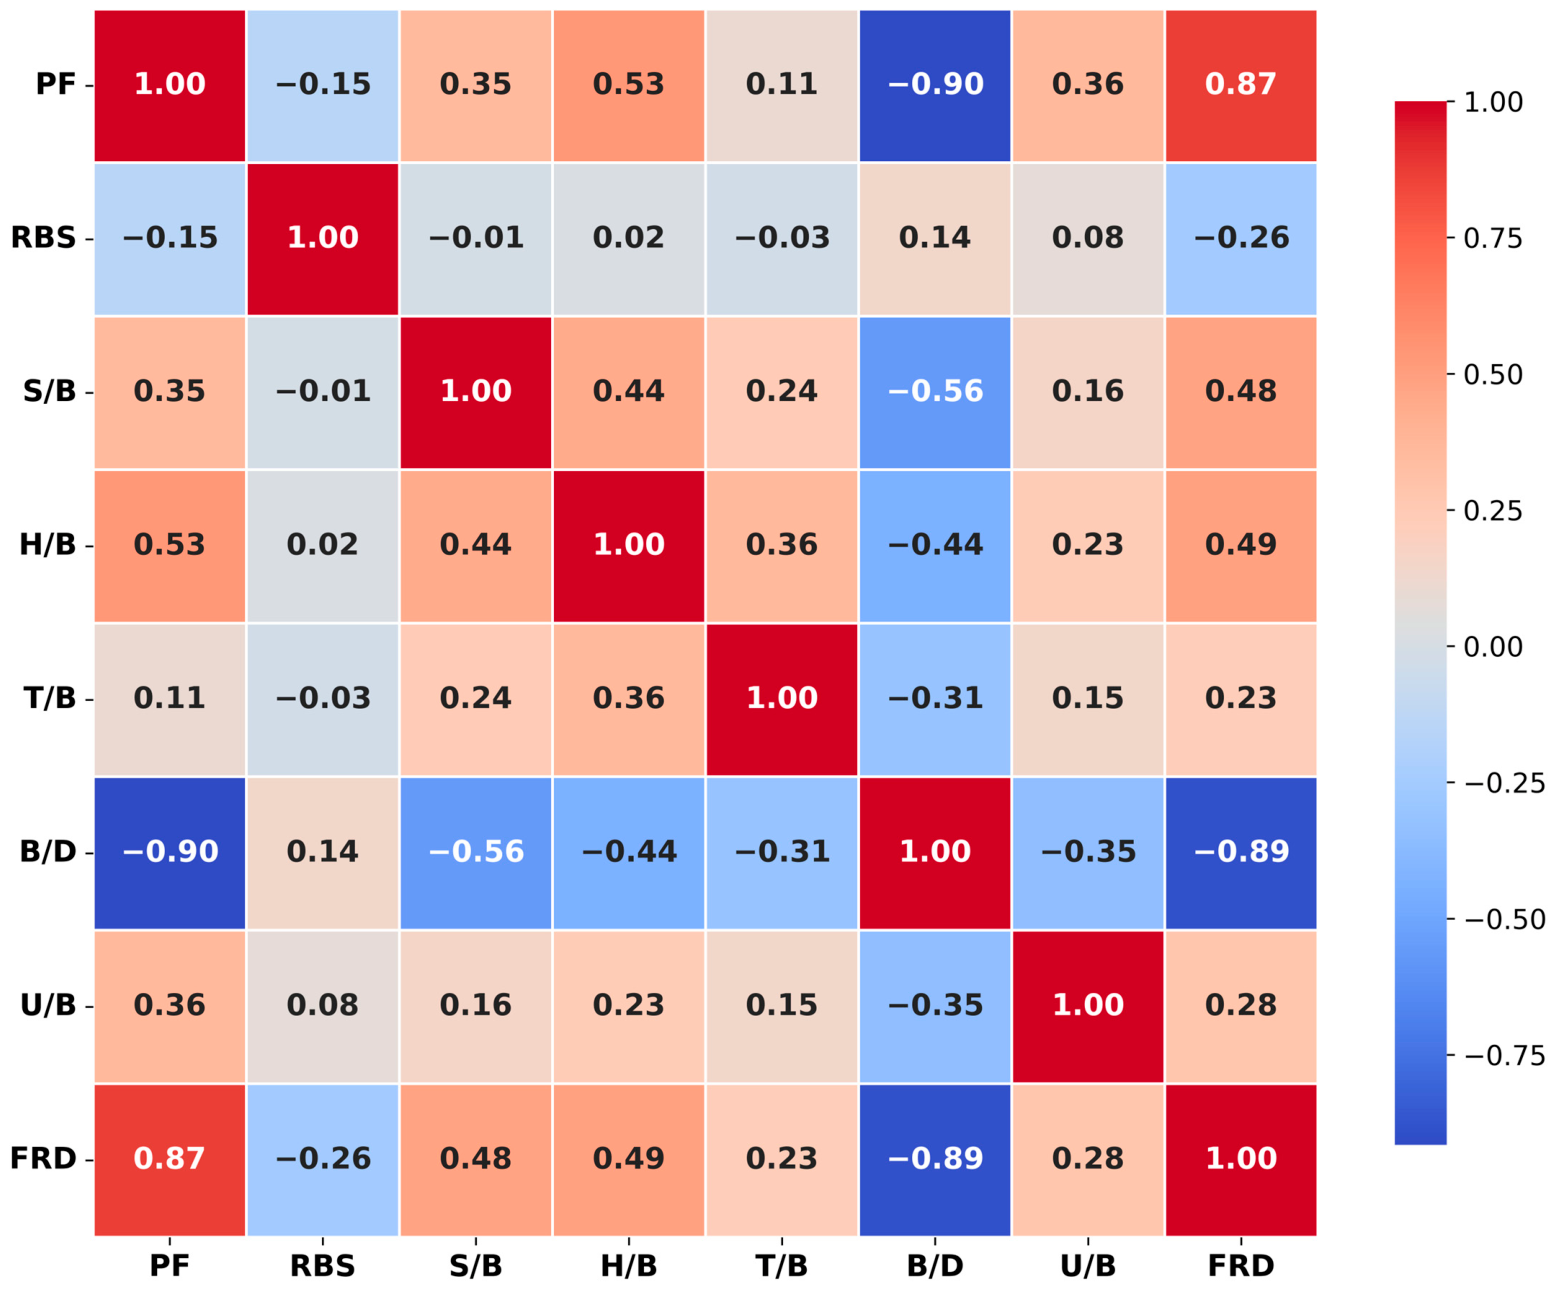
As part of the exploratory data analysis, Pearson correlation analysis was performed using the entire dataset to examine the linear relationships among the variables (Figure 4). Powder factor (PF) exhibited the strongest positive correlation with flyrock distance (FRD) (r = 0.87), whereas the burden-to-diameter ratio (B/D) showed the strongest negative correlation (r = −0.89). In contrast, U/B, RBS, and T/B exhibited relatively weak correlations with FRD.
Figure 4.
Pearson correlation matrix of the input and target variables.
In this study, none of the Pearson correlation coefficients among the independent variables exceeded the commonly accepted threshold of 0.90, indicating that multicollinearity was not a concern [41]. However, several variables exhibited relatively weak correlations with flyrock distance (FRD). Since Pearson correlation only quantifies linear relationships and cannot capture nonlinear dependencies or interactions among variables [42], feature selection was not based solely on correlation coefficients. Instead, Random Forest feature importance and Permutation Importance analyses were employed to provide a more comprehensive evaluation of the contribution of each variable to model performance.
2.3. Feature Selection
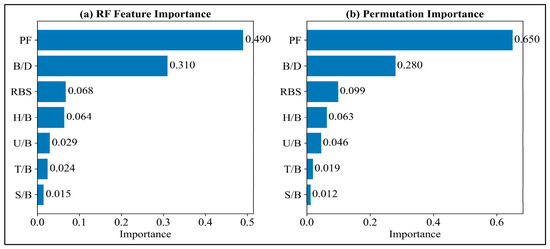
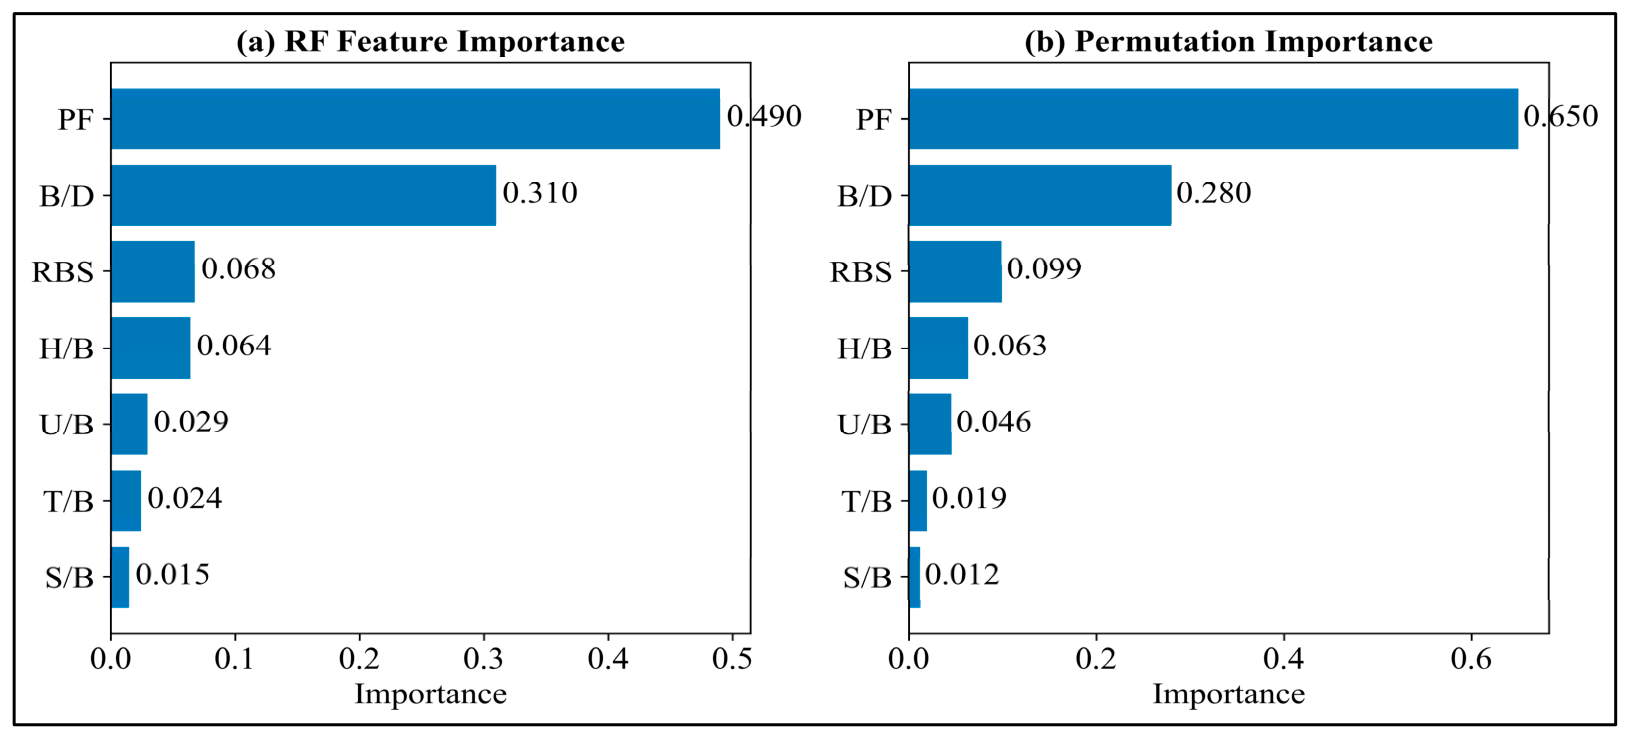
To identify the most influential variables affecting flyrock distance, Random Forest Feature Importance and Permutation Importance analyses were performed using the training dataset. As shown in Figure 5a,b, both methods identified powder factor (PF) and the burden-to-diameter ratio (B/D) as the most influential variables, whereas T/B and S/B exhibited the lowest importance scores. The consistent rankings obtained from both methods increased confidence in the selection of the final input variables. Accordingly, T/B and S/B were excluded to reduce model complexity and improve model parsimony. Hyperparameter optimization and model development were subsequently performed using the remaining variables (PF, B/D, RBS, H/B, and U/B). Feature Importance analyses were used solely for feature selection, whereas SHAP analysis was employed to interpret the final models.
Figure 5.
Feature importance rankings obtained using (a) Random Forest and (b) Permutation Importance.
3. Methodology
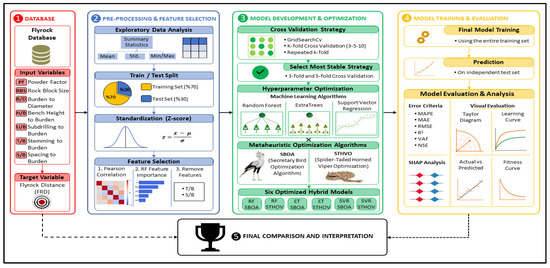
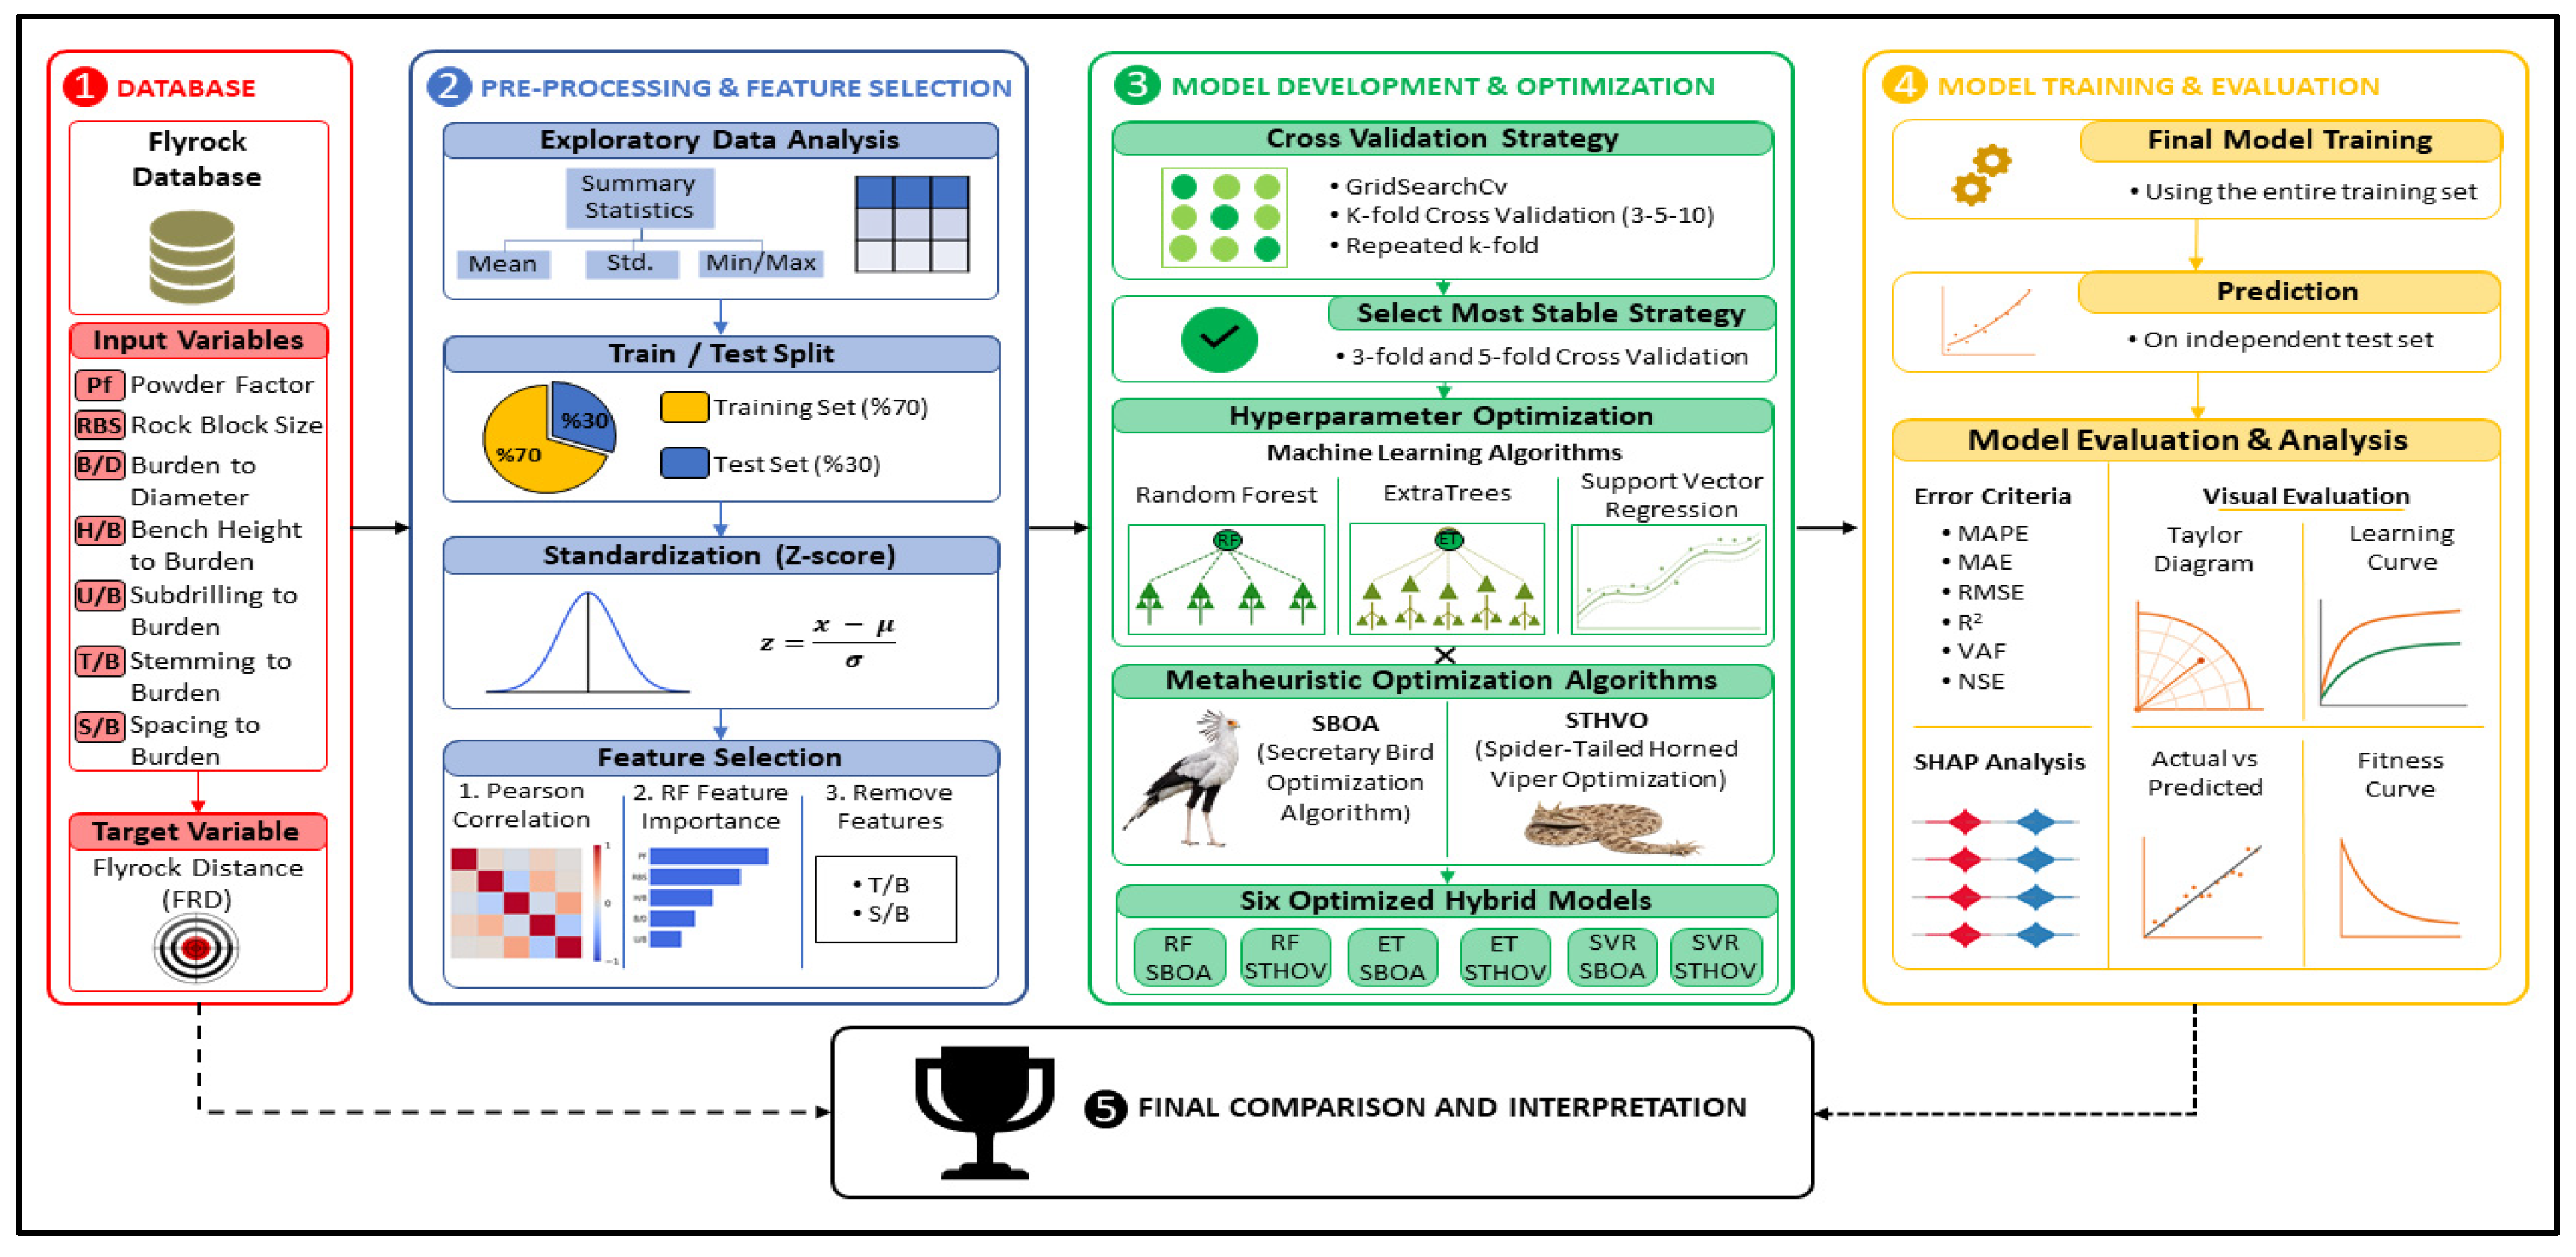
The methodological framework proposed in this study is illustrated in Figure 6. Following data collection, exploratory data analysis, and data preprocessing, the model development procedure consisted of four main stages. First, different cross-validation (CV) strategies were systematically evaluated to identify the most appropriate validation framework for each machine learning model. Subsequently, the hyperparameters of the machine learning models were optimized using the selected cross-validation strategy. After obtaining the optimal hyperparameters, the models were retrained using the entire training dataset. Finally, the predictive performance of the developed models was evaluated on an independent test dataset.
Figure 6.
Flowchart of the proposed machine learning framework.
The performance and generalization capability of machine learning models can be substantially influenced by the choice of cross-validation strategy, particularly when dealing with datasets of limited size. Therefore, before performing hyperparameter optimization, the stability of different cross-validation strategies was systematically investigated. For this purpose, 3-fold, 5-fold, 7-fold, 10-fold, and Repeated k-fold cross-validation strategies were evaluated.
GridSearchCV was not employed in its conventional role of identifying the optimal hyperparameter combination. Instead, it was used as an analytical tool to systematically evaluate all predefined hyperparameter combinations under different cross-validation strategies. Consequently, each validation strategy was assessed using the same hyperparameter search space, minimizing the influence of individual hyperparameter combinations and enabling an objective comparison among validation strategies. For each strategy, the mean cross-validation performance across all predefined hyperparameter combinations was calculated and used to identify the most appropriate validation strategy for each machine learning model. The Selection Score, based on the mean R2 and its fold-to-fold variability, was used exclusively for selecting the most stable cross-validation strategy. This criterion was not used during hyperparameter optimization; after the cross-validation strategy was selected, RMSECV was adopted as the objective function and minimized by SBOA and STHVO.
After selecting the optimal cross-validation strategy, the hyperparameters of the Random Forest (RF), Extra Trees (ET), and Support Vector Regression (SVR) models were optimized using two recently developed metaheuristic algorithms: the Secretary Bird Optimization Algorithm (SBOA) and the Spider-Tailed Horned Viper Optimizer (STHVO). Each candidate solution represented a specific hyperparameter combination, and its fitness was evaluated using the selected cross-validation strategy. The optimization algorithms iteratively generated new candidate solutions until the stopping criterion was satisfied.
Hyperparameter optimization was therefore performed under the most stable cross-validation strategy identified for each machine learning model. After the optimal hyperparameter configuration had been identified, each machine learning model was retrained using the entire training dataset to obtain the final model. Finally, the developed hybrid models were evaluated on the independent test dataset using multiple statistical performance metrics. The machine learning algorithms, metaheuristic optimization methods, and performance evaluation metrics employed in this study are described in detail in the following sections.
3.1. Random Forest
Random Forest (RF) is an ensemble learning algorithm based on decision trees, originally proposed by Breiman [43]. The algorithm combines Classification and Regression Trees (CART) with bootstrap sampling (bagging) and random feature selection to construct a large number of independent decision trees [44]. Each tree is trained using a different bootstrap sample drawn from the training dataset, while only a randomly selected subset of features is considered at each node split. This strategy increases the diversity among individual trees, thereby improving the model’s generalization capability [45].
For regression problems, Random Forest constructs multiple regression trees using bootstrap samples of the training dataset. At each node, the optimal split is determined from a randomly selected subset of input features, and the final prediction is obtained by averaging the outputs of all individual trees [43,46]. In addition, observations that are not included in the bootstrap samples, referred to as Out-of-Bag (OOB) samples, provide an internal estimate of the model’s generalization error without requiring a separate validation dataset [43,47].
3.2. Extra Trees
Extra Trees (ET), also known as Extremely Randomized Trees, is an ensemble learning algorithm based on decision trees, originally proposed by Geurts et al. [48]. Similarly to Random Forest (RF), ET combines the predictions of multiple decision trees to achieve strong predictive performance in both classification and regression tasks [48]. However, unlike RF, ET uses the entire training dataset by default rather than bootstrap sampling and determines node splits from randomly generated split thresholds instead of searching for the optimal threshold. This additional randomization increases the diversity among individual trees, thereby reducing model variance and computational cost while maintaining strong generalization performance [49].
For regression problems, ET generates multiple regression trees and produces the final prediction by averaging the outputs of all individual trees [48]. Owing to its computational efficiency, robustness against overfitting, and strong predictive capability, ET has been successfully applied to a wide range of engineering applications [50].
3.3. Support Vector Regression
Support Vector Regression (SVR) is a regression-based extension of the Support Vector Machine (SVM) algorithm originally proposed by Vapnik [51]. SVR aims to construct a regression function that maintains prediction errors within a predefined tolerance margin (ε) while minimizing model complexity, thereby achieving strong generalization performance [51]. Owing to this capability, SVR has been widely applied to regression problems involving nonlinear relationships and limited datasets.
SVR maps the input variables into a higher-dimensional feature space through kernel functions, where the regression function is constructed [52]. Among the available kernel functions, including linear, polynomial, and Radial Basis Function (RBF) kernels, the RBF kernel is widely preferred because of its ability to model complex nonlinear relationships. The predictive performance of SVR is highly dependent on the appropriate selection of the penalty parameter (C), the ε-insensitive loss parameter (ε), and the kernel parameter (γ). Therefore, optimizing these hyperparameters can substantially improve model performance [53].
3.4. Secretary Bird Optimization Algorithm
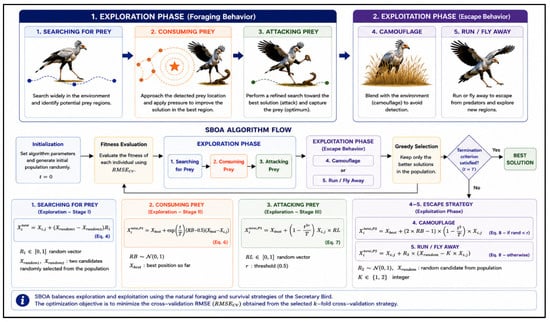
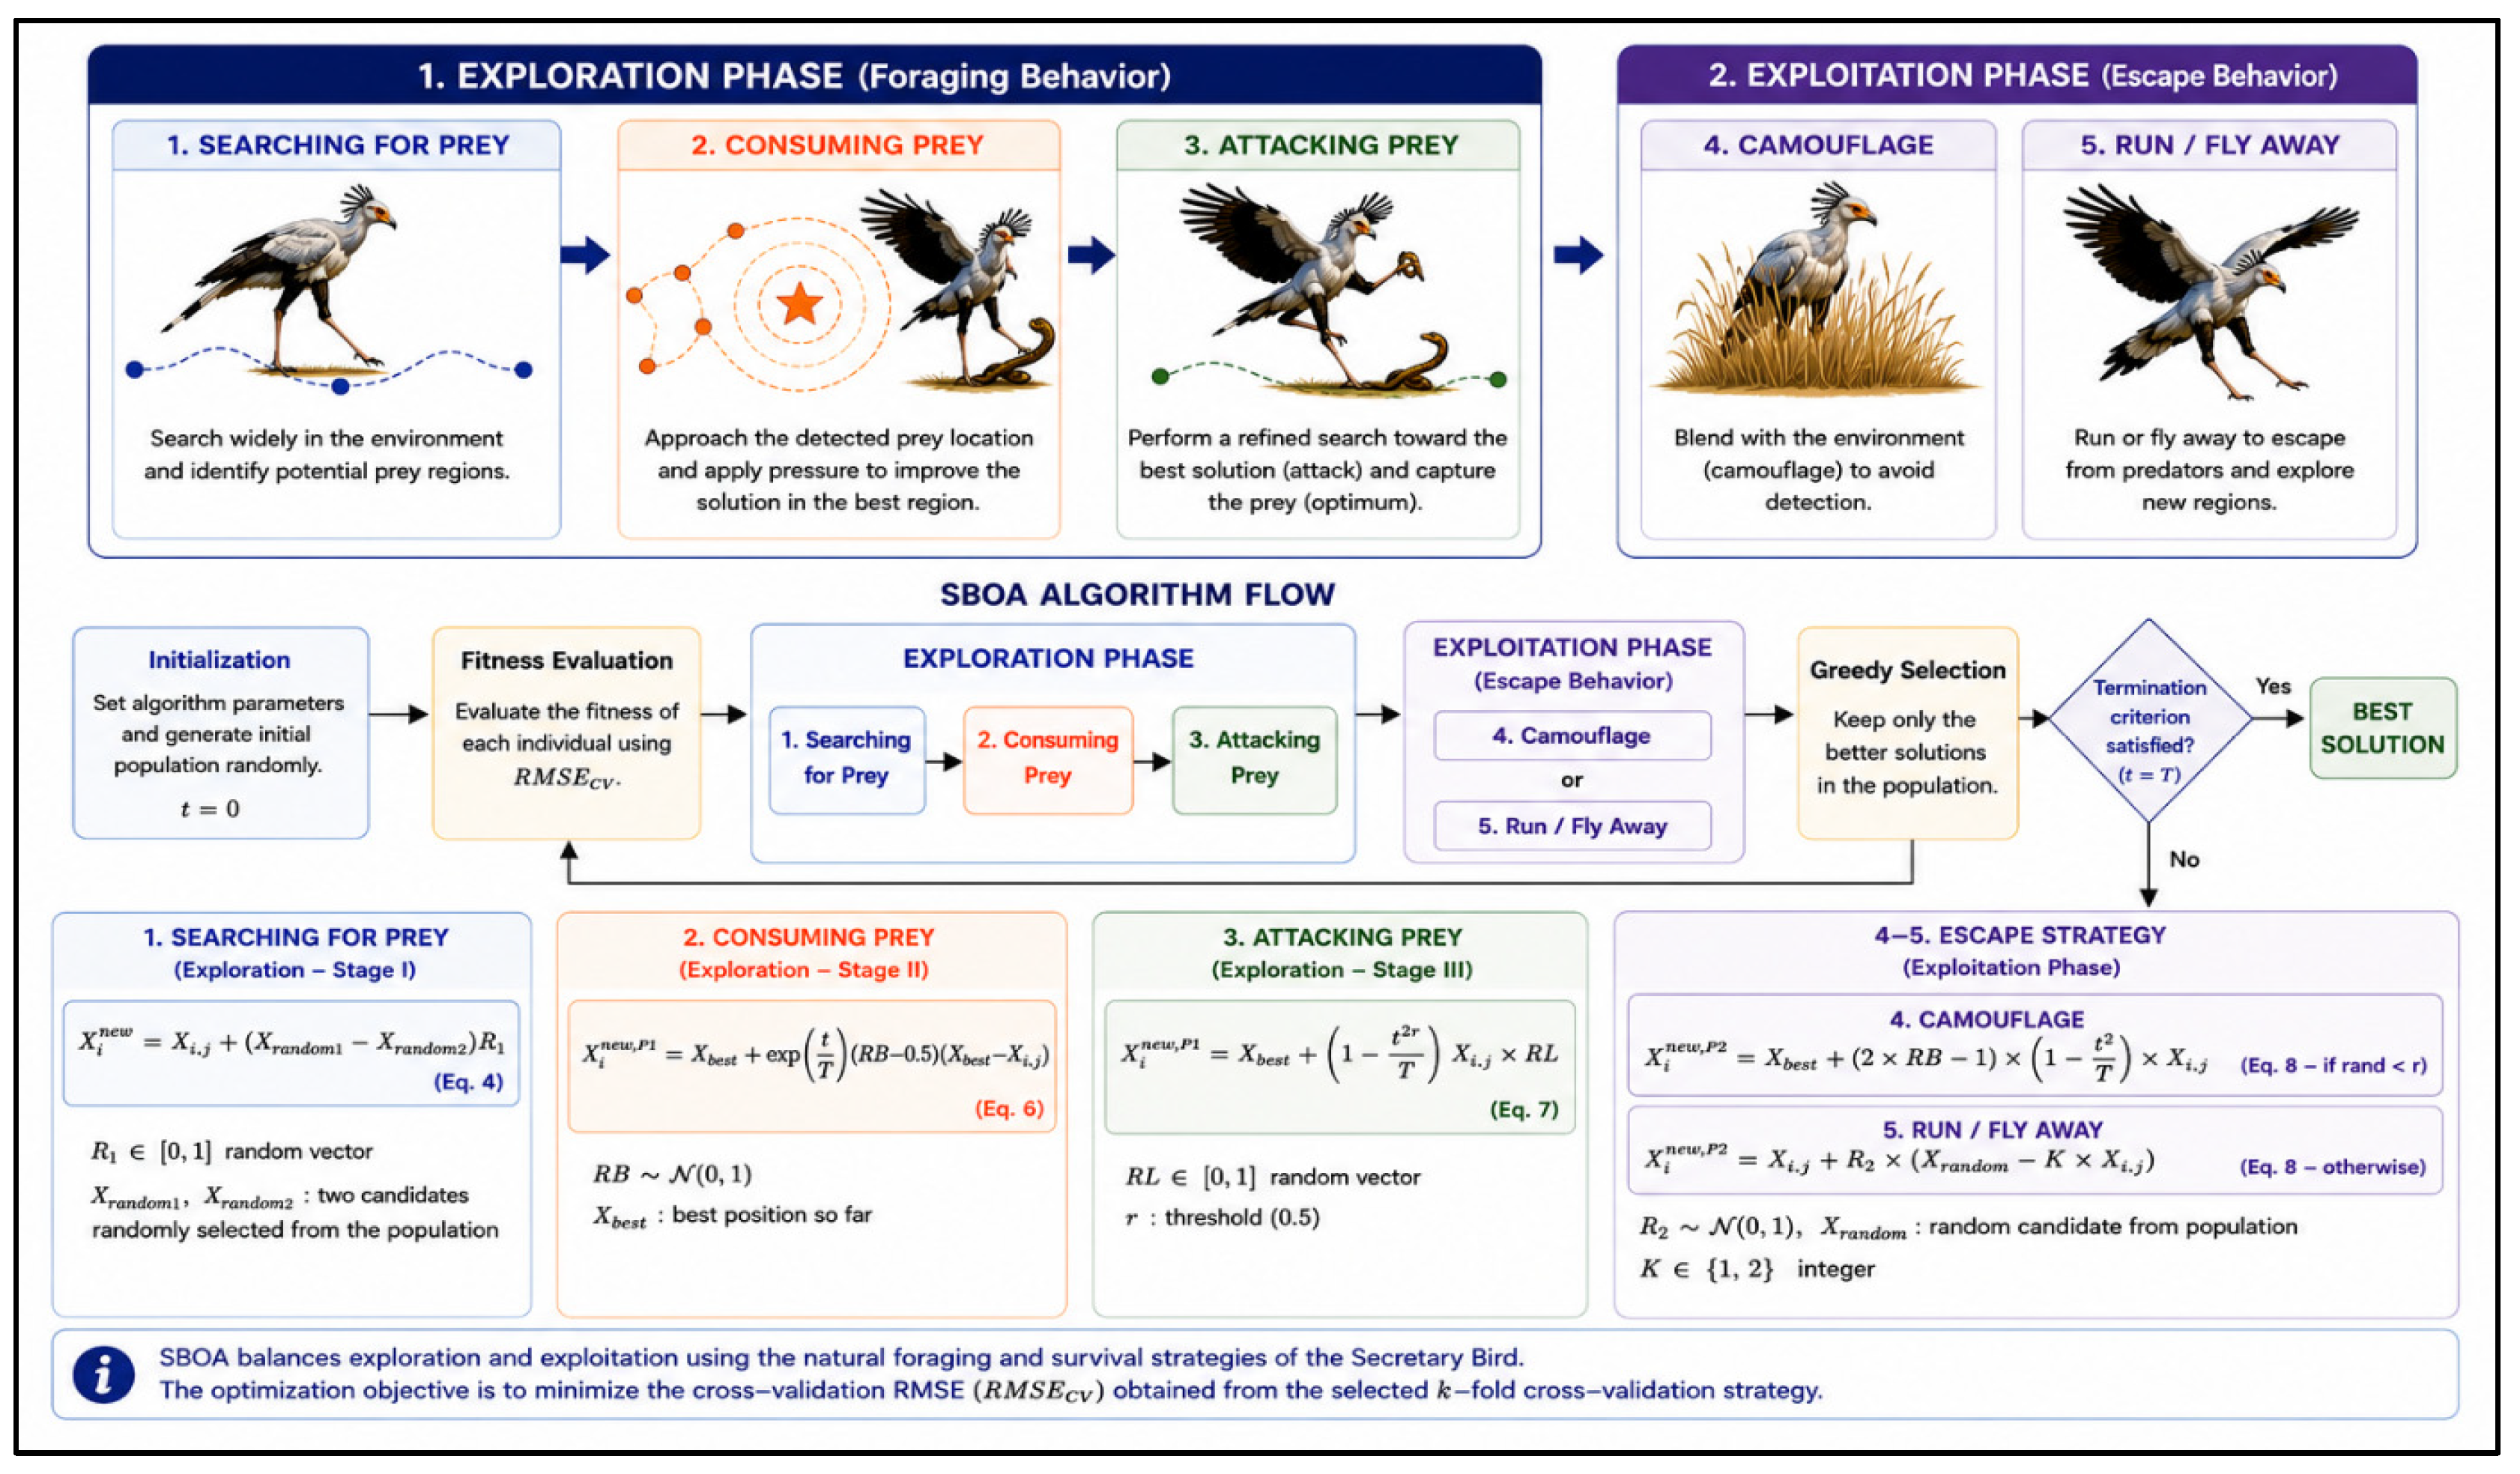
The Secretary Bird Optimization Algorithm (SBOA), proposed by Fu et al. [54], is a metaheuristic inspired by the hunting and predator-avoidance behaviors of secretary birds. Its optimization process combines exploration strategies based on Differential Evolution, Brownian motion, and Lévy flight with exploitation mechanisms representing predator-escape behavior. The overall workflow of SBOA is illustrated in Figure 7. The main search mechanisms are briefly described below, while further mathematical details can be found in the original study [54].
Figure 7.
Overview of the Secretary Bird Optimization Algorithm (SBOA).
Step 1. Population Initialization
Initially, N Secretary Birds are generated, where each individual represents a candidate solution in the hyperparameter search space. The initial population is randomly initialized according to the following equation:
where denotes the value of the j-th hyperparameter of the i-th candidate solution, and represent the lower and upper bounds of the j-th hyperparameter, respectively, and α ∈ [0, 1] is a uniformly distributed random number. The initial population is represented by the following position matrix:
where N denotes the population size, and D is the number of decision variables (hyperparameters).
Step 2. Fitness Evaluation
The fitness value of each Secretary Bird is evaluated. In general, the fitness function in SBOA is defined according to the objective function of the optimization problem. In this study, the objective function is the cross-validation root mean square error (RMSECV) obtained from the selected k-fold cross-validation strategy. Accordingly, the optimization objective is to minimize:
where J() denotes the fitness value of the i-th candidate solution. The individual with the lowest (RMSECV) value is designated as the current best solution, Xbest.
Step 3. Exploration Phase
The exploration phase simulates the prey-searching behavior of the Secretary Bird.
Stage I—Searching for prey:
During the initial search stage (t < T⁄3) the Secretary Birds explore different regions of the search space using a Differential Evolution (DE)-based update mechanism. Each individual generates a new candidate solution by utilizing the difference vector between two randomly selected individuals from the population.
where and are two candidate solutions randomly selected from the population, R1 is a random vector with elements uniformly distributed in the interval [0, 1] and denotes the updated candidate solution.
Stage II—Consuming prey:
During the second stage (T⁄3 < t < 2T⁄3), the Secretary Birds exploit the search space by performing a local search around the best solution found so far. For this purpose, the position of each individual is updated relative to the current best solution using Brownian motion (RBR_BRB)-based random movements.
where is a 1 × Dim random vector generated from a standard normal distribution, represents the best candidate solution obtained so far, and denotes the updated candidate solution generated during the second stage.
Stage III—Attacking prey
During the third stage (2T⁄3 < t < T), the Secretary Birds perform a more refined local search toward the current best solution. In this stage, the positions of the individuals are updated using a Lévy flight (RL) based update mechanism. Owing to its random walk pattern consisting of both short and long steps, Lévy flight reduces the risk of the algorithm becoming trapped in local optima while enhancing the search capability around the best solution and improving convergence performance.
Step 4. Escape Strategy (Exploitation Phase)
During the escape phase, the Secretary Bird exhibits two distinct behaviors to avoid predators. In the first behavior (Camouflage), the individual’s position is updated around the current best solution using a dynamic perturbation coefficient. In the second behavior (Run/Fly Away), the individual modifies its position with respect to a randomly selected candidate solution from the population, thereby exploring different regions of the search space. These two behaviors are selected with equal probability and are mathematically modeled by the following equation. This mechanism preserves population diversity, maintains a balance between exploration and exploitation, and reduces the risk of premature convergence to local optima.
where r is a fixed threshold set to 0.5, R2 is a 1 × Dim random vector generated from a normal distribution, denotes a candidate solution randomly selected from the population, and K is a randomly generated integer with a value of either 1 or 2.
Step 5. Greedy Selection
At each iteration, the newly generated candidate solution is evaluated against the current solution. The solution yielding the lower objective function value is retained in the population, whereas the inferior solution is discarded. Consequently, the optimization process proceeds by preserving only the better-performing solutions throughout the search.
where denotes the updated candidate solution, and represents the current candidate solution [54].
Step 6. Termination
The algorithm terminates when the maximum number of iterations is reached. The best candidate solution obtained in the final iteration is selected as the final solution of the algorithm, as expressed by
where t denotes the current iteration number, and T represents the maximum number of iterations.
3.5. Spider-Tailed Horned Viper Optimizer
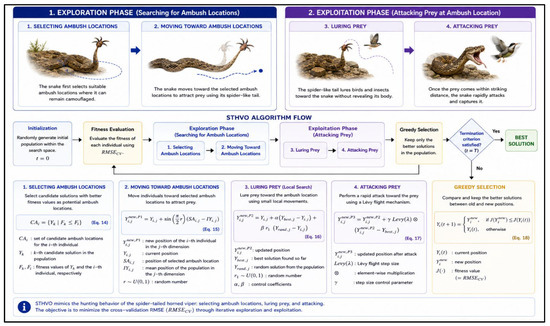
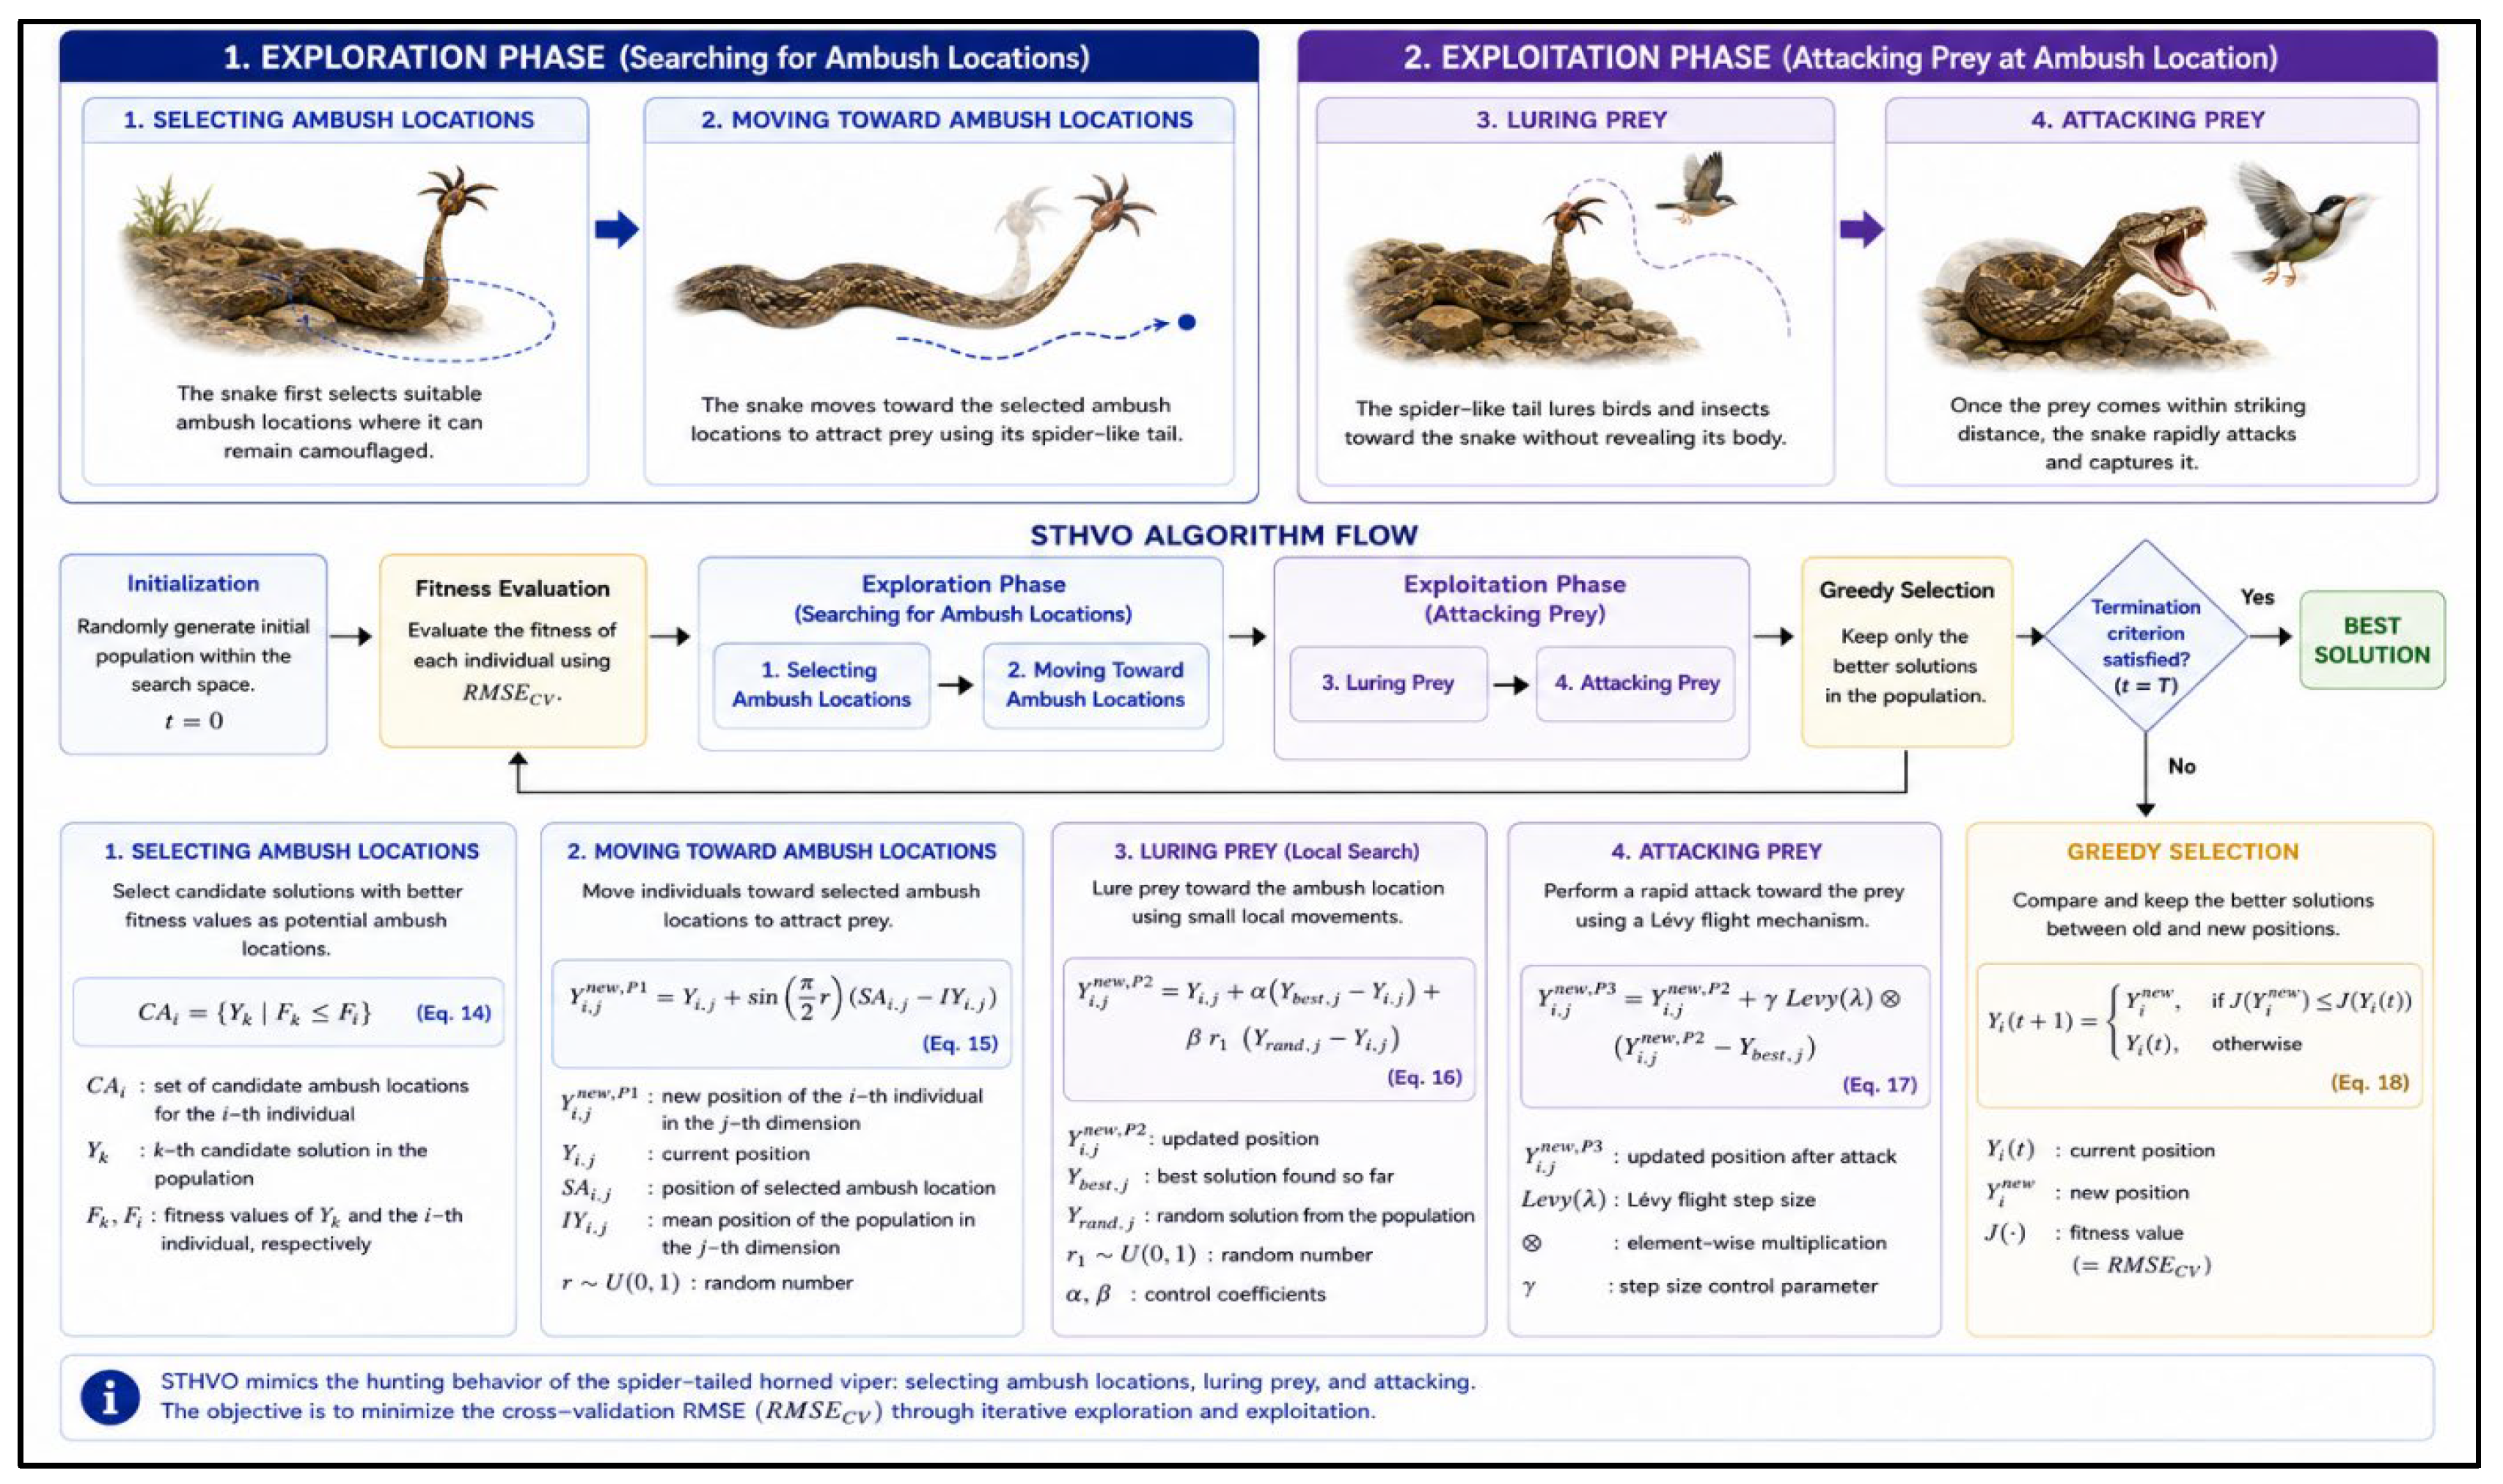
The Spider-Tailed Horned Viper Optimizer (STHVO), proposed by Hamadneh et al. [55], is a population-based metaheuristic inspired by the hunting behavior of the spider-tailed horned viper. The algorithm models its prey-luring and attacking behaviors through two complementary mechanisms: exploration and exploitation. Candidate solutions are initialized within the predefined search bounds and iteratively updated through these mechanisms. The overall workflow of STHVO is illustrated in Figure 8, while the main mathematical formulations used in the optimization process are presented below.
Figure 8.
Overview of the Spider-Tailed Horned Viper Optimizer (STHVO).
Step 1. Initialization
During the initialization stage, all candidate solutions are randomly generated within the search space to form the initial population.
where denotes the position of the i-th individual in the d-th dimension, and represent the lower and upper bounds of the corresponding decision variable, respectively, and r is a random number uniformly generated within the interval [0, 1]. The random initialization of the population promotes a well-distributed set of candidate solutions throughout the search space, thereby enhancing the initial diversity of the population. The initial population can be represented by the following matrix.
where N and m are the population size and the number of decision variables, respectively.
Step 2. Fitness Evaluation
After the initial population is generated, the objective (fitness) function value of each individual is evaluated. In the original STHVO algorithm, the fitness value is generally determined using the objective function associated with the optimization problem under consideration. In the present study, however, the root mean square error obtained from k-fold cross-validation RMSECV was adopted as the objective function.
The objective of the algorithm is to minimize . The individual with the lowest value is identified as the best solution, denoted by Ybest. The best individual in the population, Ybest, is tracked throughout the optimization process and updated at each iteration whenever a superior solution is found. However, unlike many population-based metaheuristic algorithms, Ybest is not directly incorporated into the position update equations.
Step 3. Exploration Phase
The exploration phase is inspired by the spider-tailed horned viper’s behavior of moving toward suitable ambush locations prior to hunting. During this phase, each individual explores promising regions of the search space by treating the positions of individuals with superior objective (fitness) values as potential ambush sites.
where denotes the set of candidate ambush locations for the i-th individual, represents the k-th candidate solution in the population, and and denote the objective function values of and the i-th individual, respectively.
Step 4. Exploitation
The exploitation phase models the spider-tailed horned viper’s behavior of attracting prey to its ambush location using its spider-like tail. In this strategy, the snake camouflages its body while exposing only the spider-like tip of its tail, which is moved to lure birds and insects toward its position. Once the prey approaches within striking distance, the snake rapidly attacks and captures it. Throughout this process, the snake remains at its current ambush location and performs only small movements in its immediate vicinity. In metaheuristic optimization, this behavior represents the local search (exploitation) process conducted in the neighborhood of the current solution.
To model this behavior, a new candidate solution is generated in the vicinity of the current position of each individual using the following equation. In this equation, the parameter t denotes the current iteration number, and its inclusion enables the search step size to decrease gradually as the optimization process progresses, thereby enhancing the local search capability in the later stages of the algorithm.
The greedy selection mechanism and the termination criterion are identical to those described for the SBOA in Section 3.4 and are therefore omitted for brevity.
SBOA and STHVO differ from previously employed metaheuristic optimizers in flyrock prediction in the mechanisms through which candidate solutions are updated and exploration and exploitation are coordinated. SBOA employs a multi-stage search mechanism that integrates Differential Evolution-based exploration, Brownian motion, Lévy flight, and predator-escape strategies, allowing the search dynamics to change across different stages of the optimization process. STHVO, in contrast, explores the search space by selecting better-performing individuals as potential ambush locations and subsequently performs progressively localized searches around the current solutions; notably, the global best solution is tracked but is not directly incorporated into the position-update equations. Thus, SBOA and STHVO represent two structurally different search mechanisms rather than simple variants of the same optimization strategy. Their inclusion in this study is therefore intended not merely to replace previously employed optimizers or to seek higher predictive accuracy, but to investigate whether these alternative exploration–exploitation dynamics can provide effective hyperparameter search strategies for flyrock prediction.
4. Results and Discussion
4.1. Performance Evaluation Metrics
The predictive performance of the developed models was evaluated using six complementary regression metrics: the coefficient of determination (R2), root mean square error (RMSE), mean absolute error (MAE), mean absolute percentage error (MAPE), variance accounted for (VAF), and Nash–Sutcliffe efficiency (NSE) [21,56]. Similar combinations of performance metrics have also been employed for comprehensive model validation in previous blasting-related prediction studies [57,58], providing complementary information regarding prediction accuracy, error magnitude, and goodness-of-fit. The mathematical formulations of RMSE, R2, MAE, MAPE, and VAF are given in Equations (17)–(21). Since NSE is mathematically equivalent to R2 in regression analysis, its formulation is omitted for brevity.
where is the observed flyrock distance of the u-th sample, is the corresponding predicted flyrock distance, is the mean observed flyrock distance, U denotes the total number of samples, and var(⋅) represents the variance operator.
4.2. Selection of the Most Appropriate Cross-Validation Strategy
Cross-validation is widely employed to estimate the generalization performance of machine learning models by repeatedly partitioning the available data into training and validation subsets. Compared with a single hold-out split, cross-validation generally provides a more reliable estimate of predictive performance by repeatedly evaluating the model over multiple train-validation partitions [26,59]. Since different cross-validation strategies may lead to different performance estimates, several validation schemes have been comparatively investigated in the literature to identify an appropriate validation strategy for predictive modeling [60]. In addition to predictive performance, the variability of cross-validation estimates was also considered, since datasets of limited size may produce substantial uncertainty in performance estimation [61].
In the present study, the dataset was first divided into independent training and test sets using the hold-out method. Subsequently, six validation strategies, namely 3-fold, 5-fold, 7-fold, 10-fold, repeated 3 × 5-fold cross-validation (3-fold cross-validation repeated five times), and repeated 5 × 5-fold cross-validation (5-fold cross-validation repeated five times), were comparatively evaluated using only the training set. For each validation strategy, all predefined hyperparameter combinations within the corresponding search space were evaluated using GridSearchCV. The independent test set was excluded from both the cross-validation strategy comparison and the subsequent hyperparameter optimization process to prevent information leakage. The comparative evaluation of the candidate validation strategies is presented in Table 3.
Table 3.
Comparison of cross-validation strategies.
To jointly consider predictive performance and the variability of cross-validation estimates, a selection score was defined as
where denotes the mean cross-validation coefficient of determination, and represents the mean standard deviation of the cross-validation scores obtained from the predefined hyperparameter search space. The criterion was introduced as a simple heuristic measure to balance two desirable properties of a cross-validation strategy: high predictive performance and low variability across folds. Selecting a strategy solely according to the mean R2 may favor a validation scheme with relatively high predictive performance but unstable estimates across different folds. Conversely, selecting a strategy solely according to fold variability may favor a stable strategy with comparatively poor predictive performance. Therefore, the mean fold standard deviation was treated as a penalty on the mean cross-validation R2. For example, the 7-fold strategy yielded a relatively high mean R2 of 0.751, but its high standard deviation of 0.087 reduced the Selection Score to 0.663. This illustrates that a seemingly good average performance may not necessarily indicate a reliable validation strategy when substantial variability exists across folds, particularly for a relatively small dataset. Since both quantities are dimensionless and expressed on the same scale, their difference provides a directly interpretable criterion in which higher predictive performance increases the score, whereas greater variability decreases it. The proposed score was not intended as a universal statistical measure of cross-validation robustness, but rather as a practical criterion for consistently ranking the candidate validation strategies within the present dataset and modeling framework. Accordingly, for each machine learning model, the validation strategy with the highest selection score was considered the most appropriate and subsequently adopted for hyperparameter optimization using the SBOA and STHVO algorithms. After the optimal hyperparameter configuration had been identified, each model was retrained using the entire training dataset before being evaluated on the independent test dataset.
4.3. Hyperparameter Optimization Using SBOA and STHVO
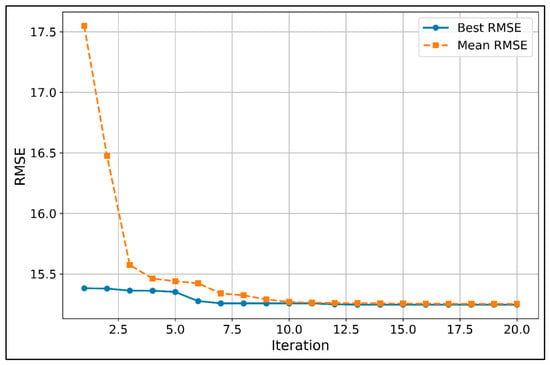
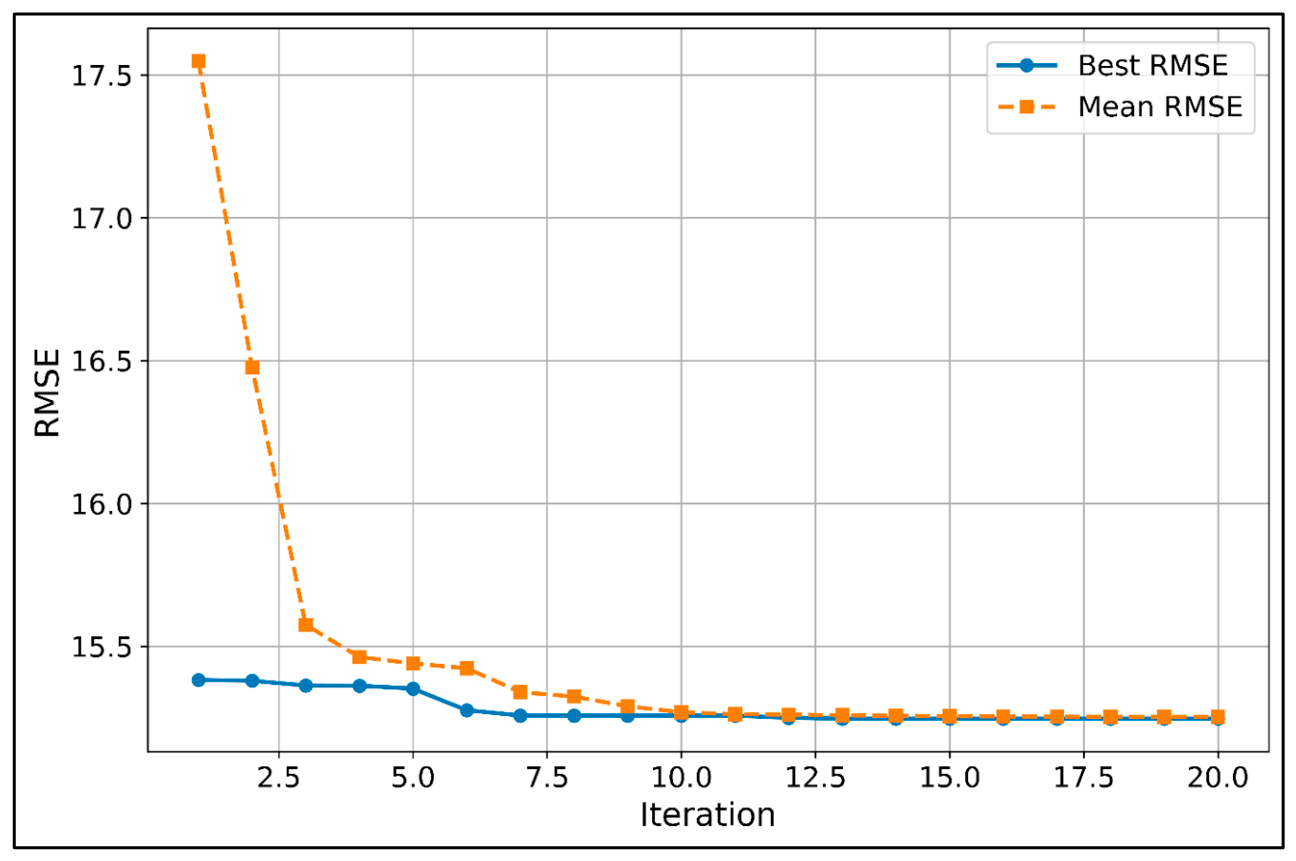
Based on the most appropriate cross-validation strategies identified in the previous section, the hyperparameters of the RF, ET, and SVR models were optimized using the SBOA and STHVO algorithms. As a representative example of the optimization process, the convergence behavior of the ET–SBOA model is presented in Figure 9. As can be seen, the objective function decreased rapidly during the early iterations and subsequently exhibited only minor improvements before converging to a stable solution. This behavior indicates that the SBOA effectively explored the hyperparameter search space and achieved stable convergence.
Figure 9.
Convergence behavior of the ET-SBOA.
The optimal hyperparameter configurations obtained through the optimization process are summarized in Table 4. While both metaheuristic algorithms converged to similar hyperparameter configurations for the ET and RF models, different values of the SVR hyperparameters (C, ε, and γ) were obtained. The optimal hyperparameter configurations were subsequently used to retrain the corresponding machine learning models on the entire training dataset, and their predictive performances were finally evaluated using the independent test dataset.
Table 4.
Optimal hyperparameter configurations obtained using SBOA and STHVO.
To provide an additional benchmark for SBOA, Bayesian optimization was also evaluated using the ET model. ET was selected as the representative base learner because the ET-based hybrid models exhibited the highest overall predictive performance among the investigated machine learning algorithms. To ensure a consistent comparison, the same dataset, input variables, training–test partition, and cross-validation strategy were used. The predictive performances of ET-SBOA and ET-Bayesian are compared in Table 5.
Table 5.
Benchmark comparison of SBOA and Bayesian optimization using the Extra Trees model.
Under the same modeling conditions, ET-SBOA achieved higher predictive performance than ET-Bayesian across all evaluation metrics, with a higher R2 and lower RMSE, MAE, and MAPE. These results indicate that SBOA provided an effective hyperparameter optimization strategy for the ET model in the present dataset.
4.4. Predictive Performance of the Developed Hybrid Models
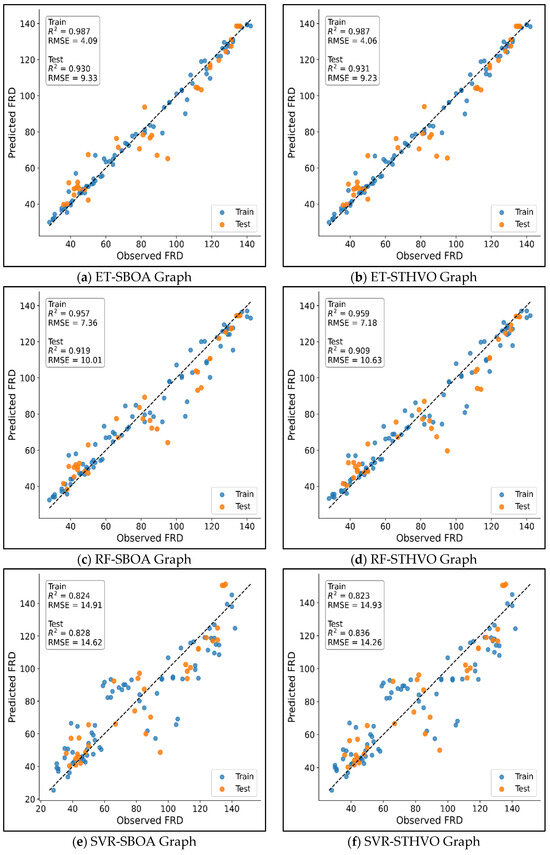
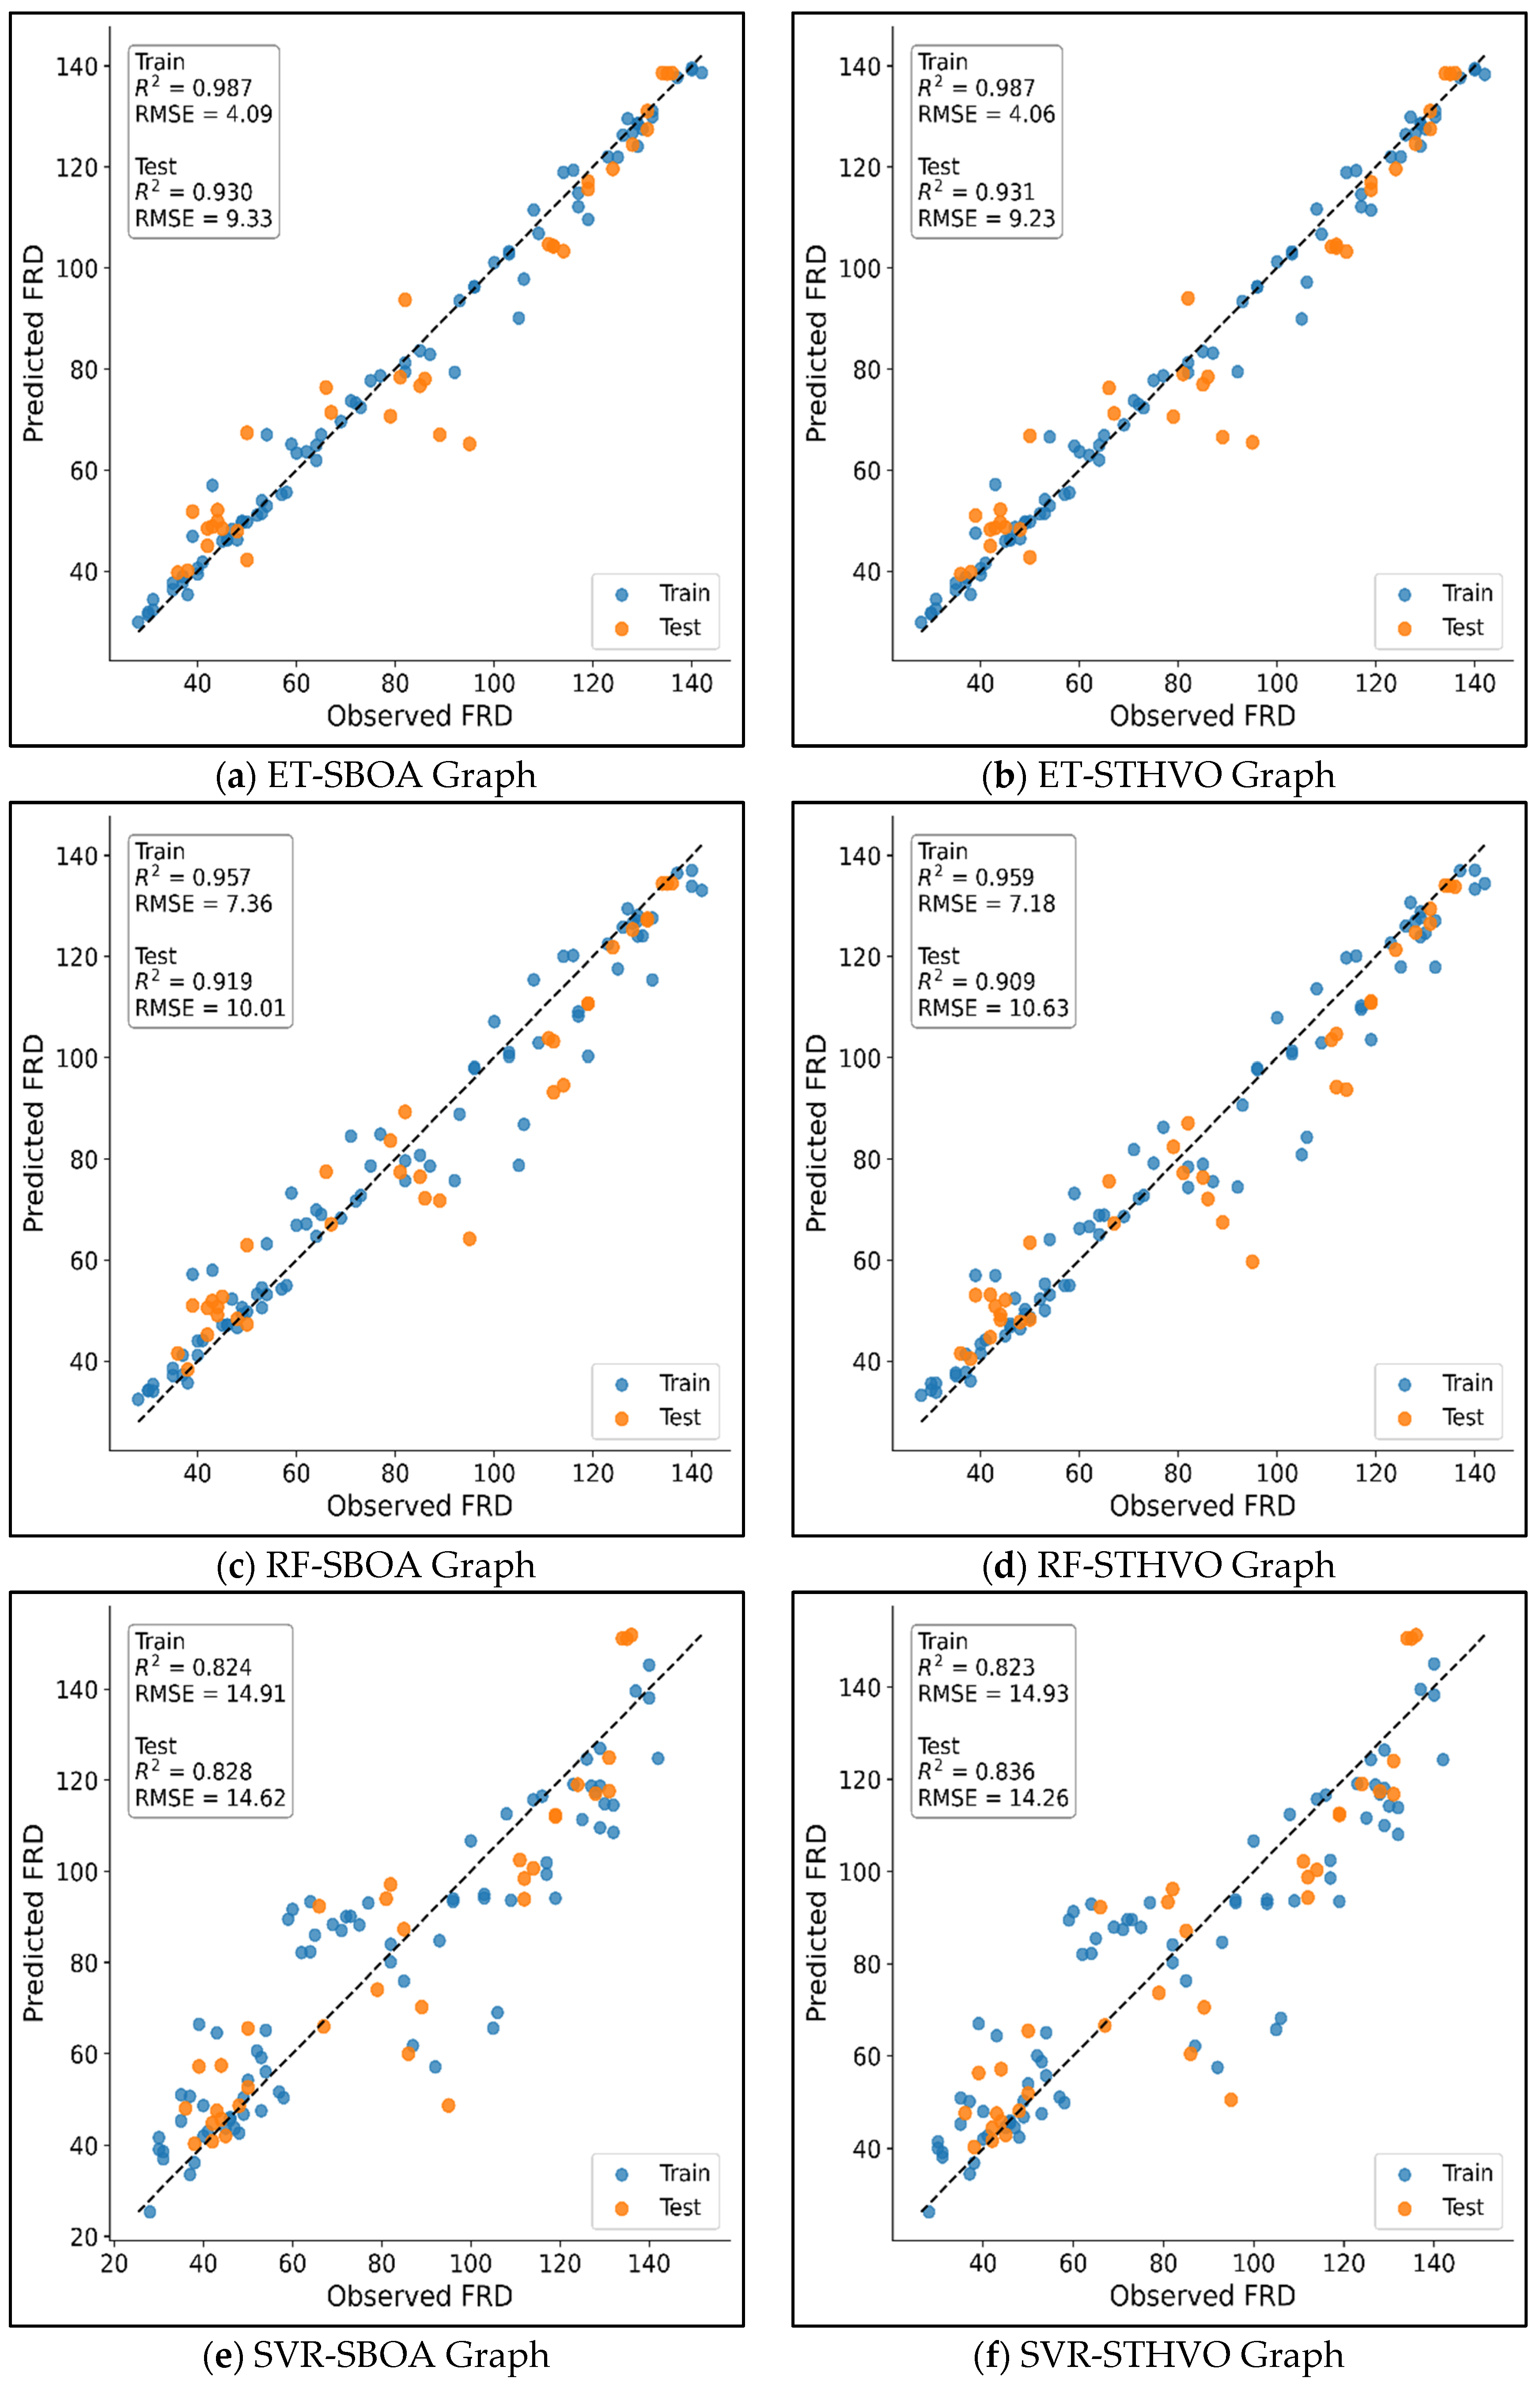
The predictive performance of the developed hybrid models was evaluated using an independent test dataset. Figure 10 presents the observed versus predicted flyrock distances obtained by the ET-SBOA, ET-STHVO, RF-SBOA, RF-STHVO, SVR-SBOA, and SVR-STHVO models. Overall, the Extra Trees-based hybrid models exhibited the highest prediction accuracy, with the predicted values most closely following the 1:1 reference line for both the training and independent test datasets. The Random Forest-based models also demonstrated satisfactory predictive capability, whereas the SVR-based models exhibited comparatively lower prediction accuracy. The full range of observed FRD values (28–142 m), including the extreme observations, was retained in the modeling process, and the strong performance of the ET-based models indicates their ability to accommodate the variability associated with these observations.
Figure 10.
Observed versus predicted flyrock distances for the developed hybrid models. The dashed line represents the 1:1 reference line.
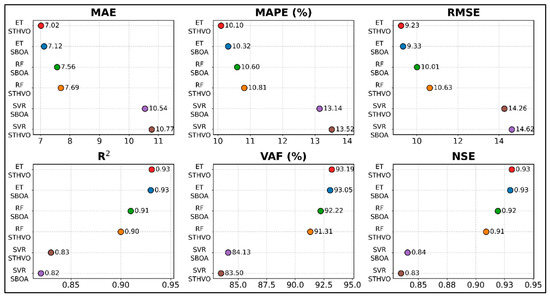
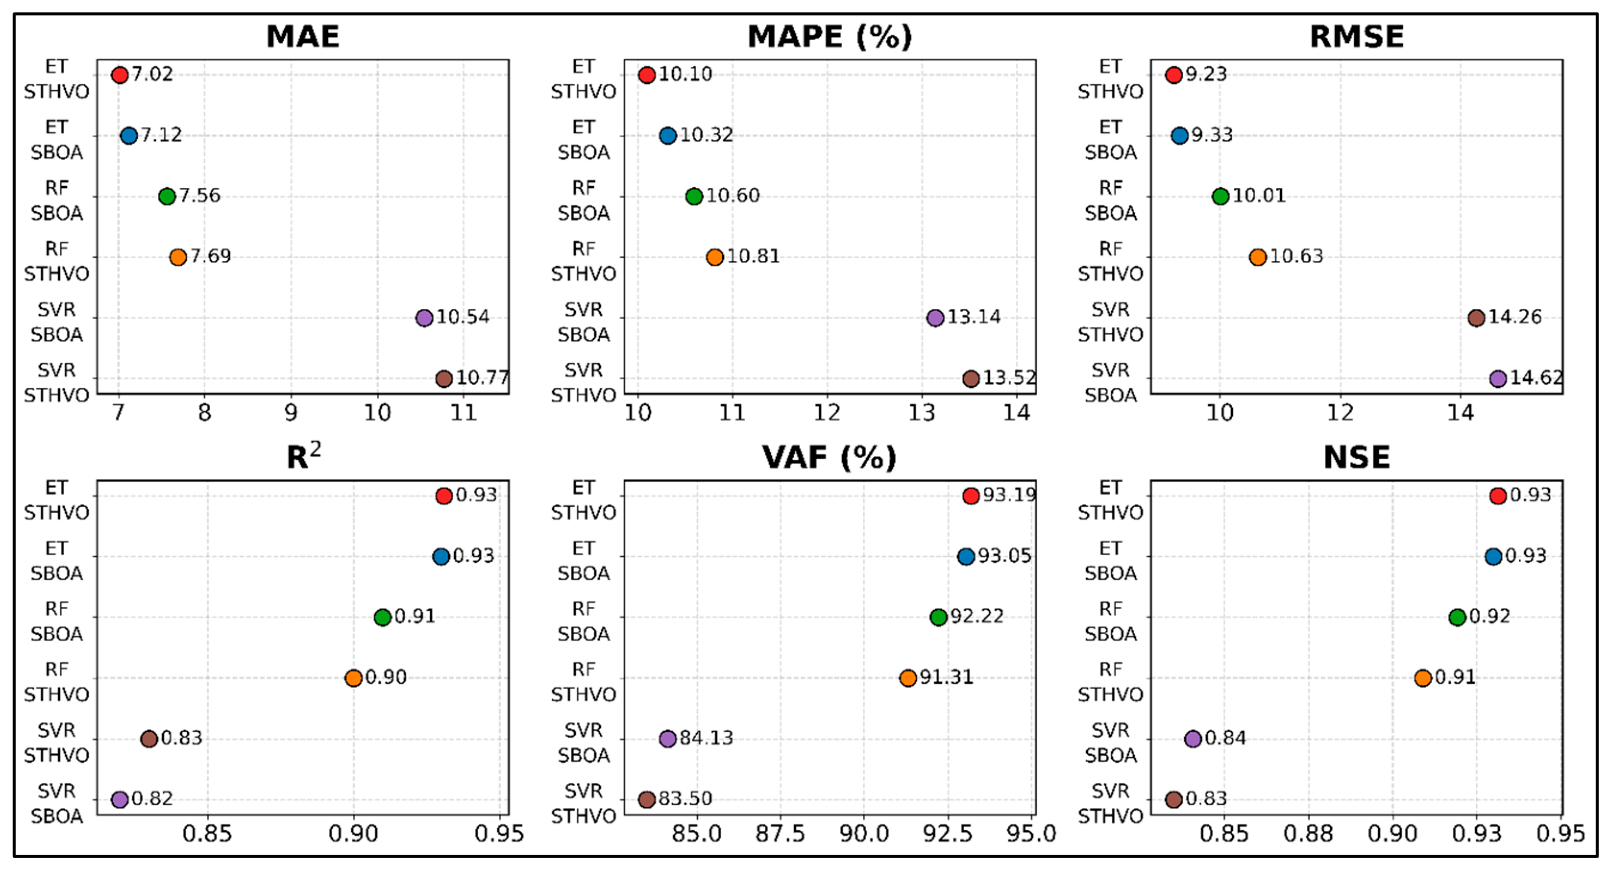
Figure 11 provides a quantitative comparison of the predictive performance metrics. Consistent with the results shown in Figure 10, the ET-STHVO model achieved the lowest prediction errors and the highest goodness-of-fit among all developed models, closely followed by ET-SBOA. Although both metaheuristic algorithms improved the predictive performance of the machine learning models, the Extra Trees-based hybrid models consistently outperformed the Random Forest- and Support Vector Regression-based counterparts across all evaluation metrics. The superior performance of ET may be attributed to the additional randomization introduced during tree construction. Unlike RF, ET also randomizes the split thresholds, which increases diversity among individual trees and can reduce model variance. This characteristic may be particularly advantageous for capturing the nonlinear relationships between blasting parameters, rock-mass characteristics, and flyrock distance in the relatively limited dataset used in this study. However, this result is specific to the present dataset and does not imply that ET will universally outperform RF or SVR in flyrock prediction.
Figure 11.
Comparison of predictive performance metrics.
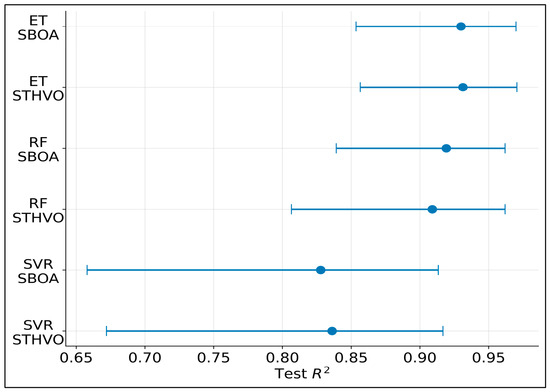
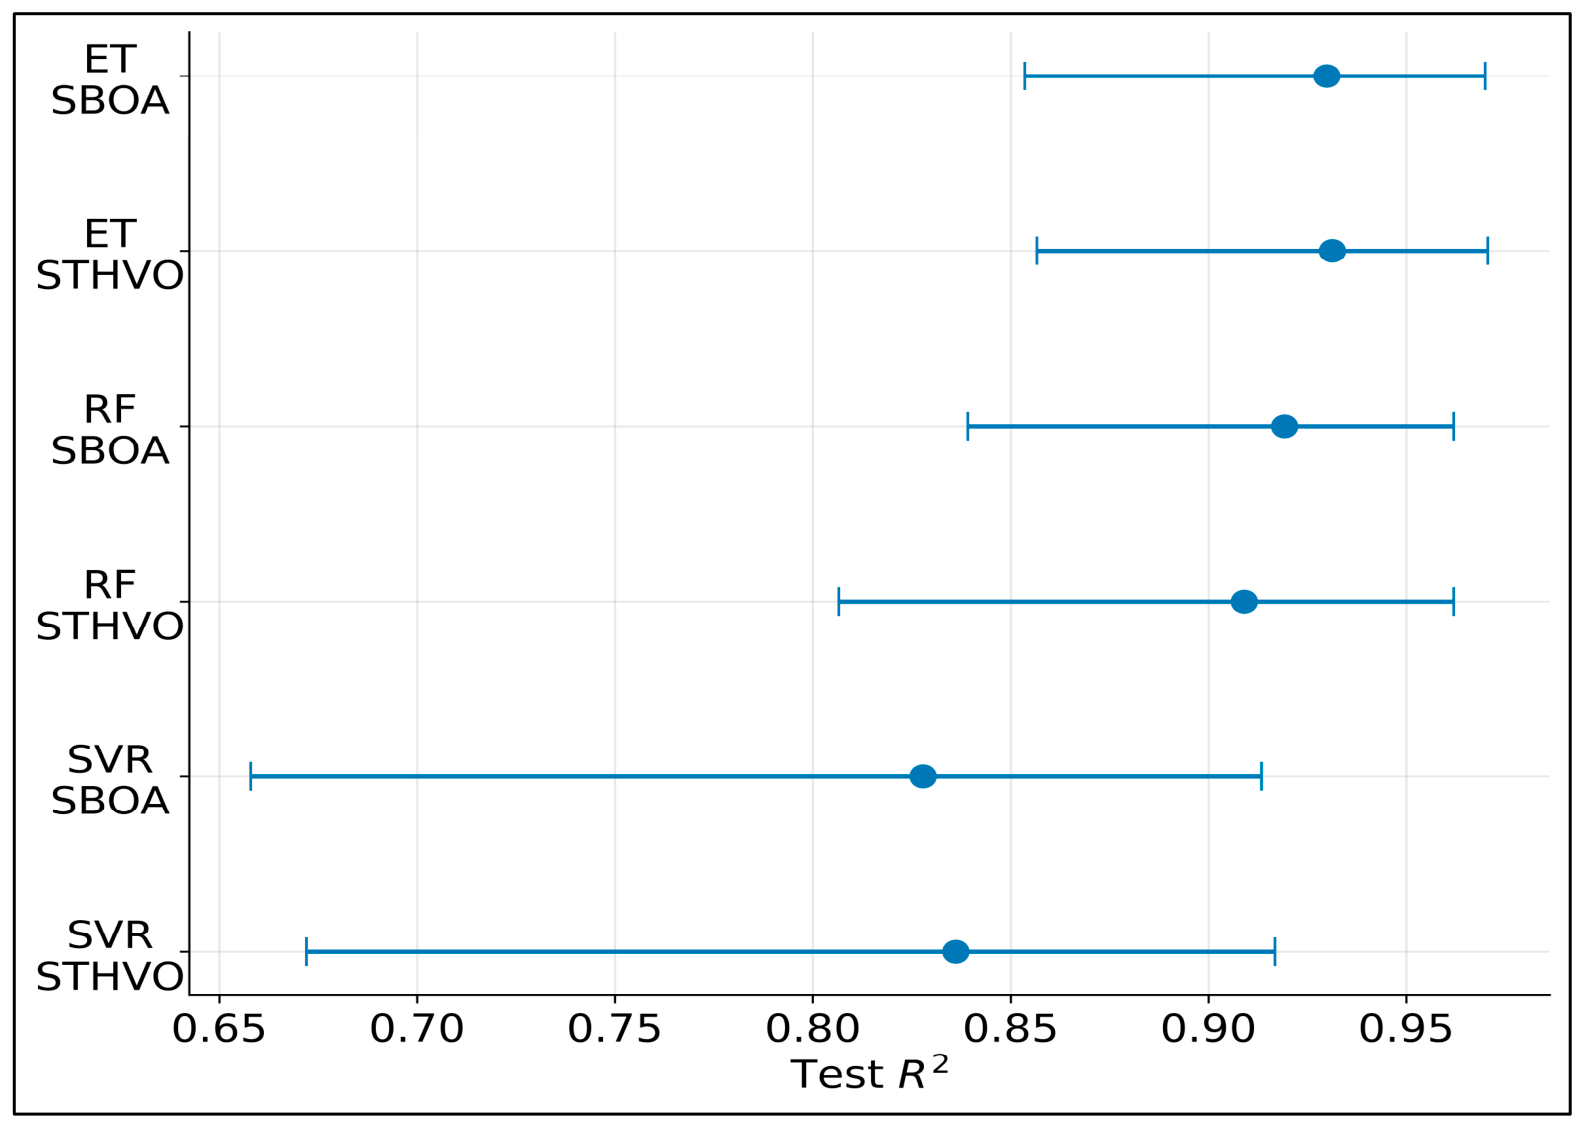
In addition to the point estimates of predictive performance, 95% confidence intervals were calculated for the test R2 values of all developed models. The resulting confidence intervals are presented in Figure 12.
Figure 12.
Test R2 values with 95% confidence intervals.
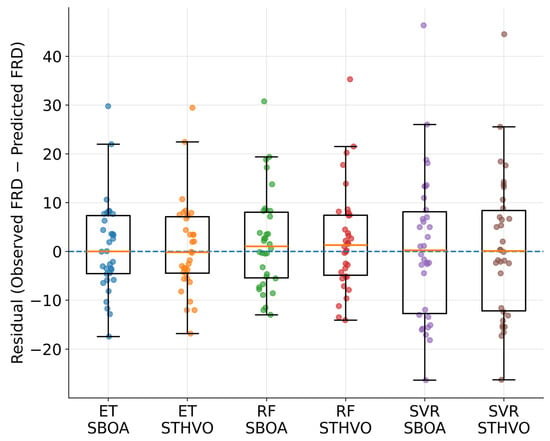
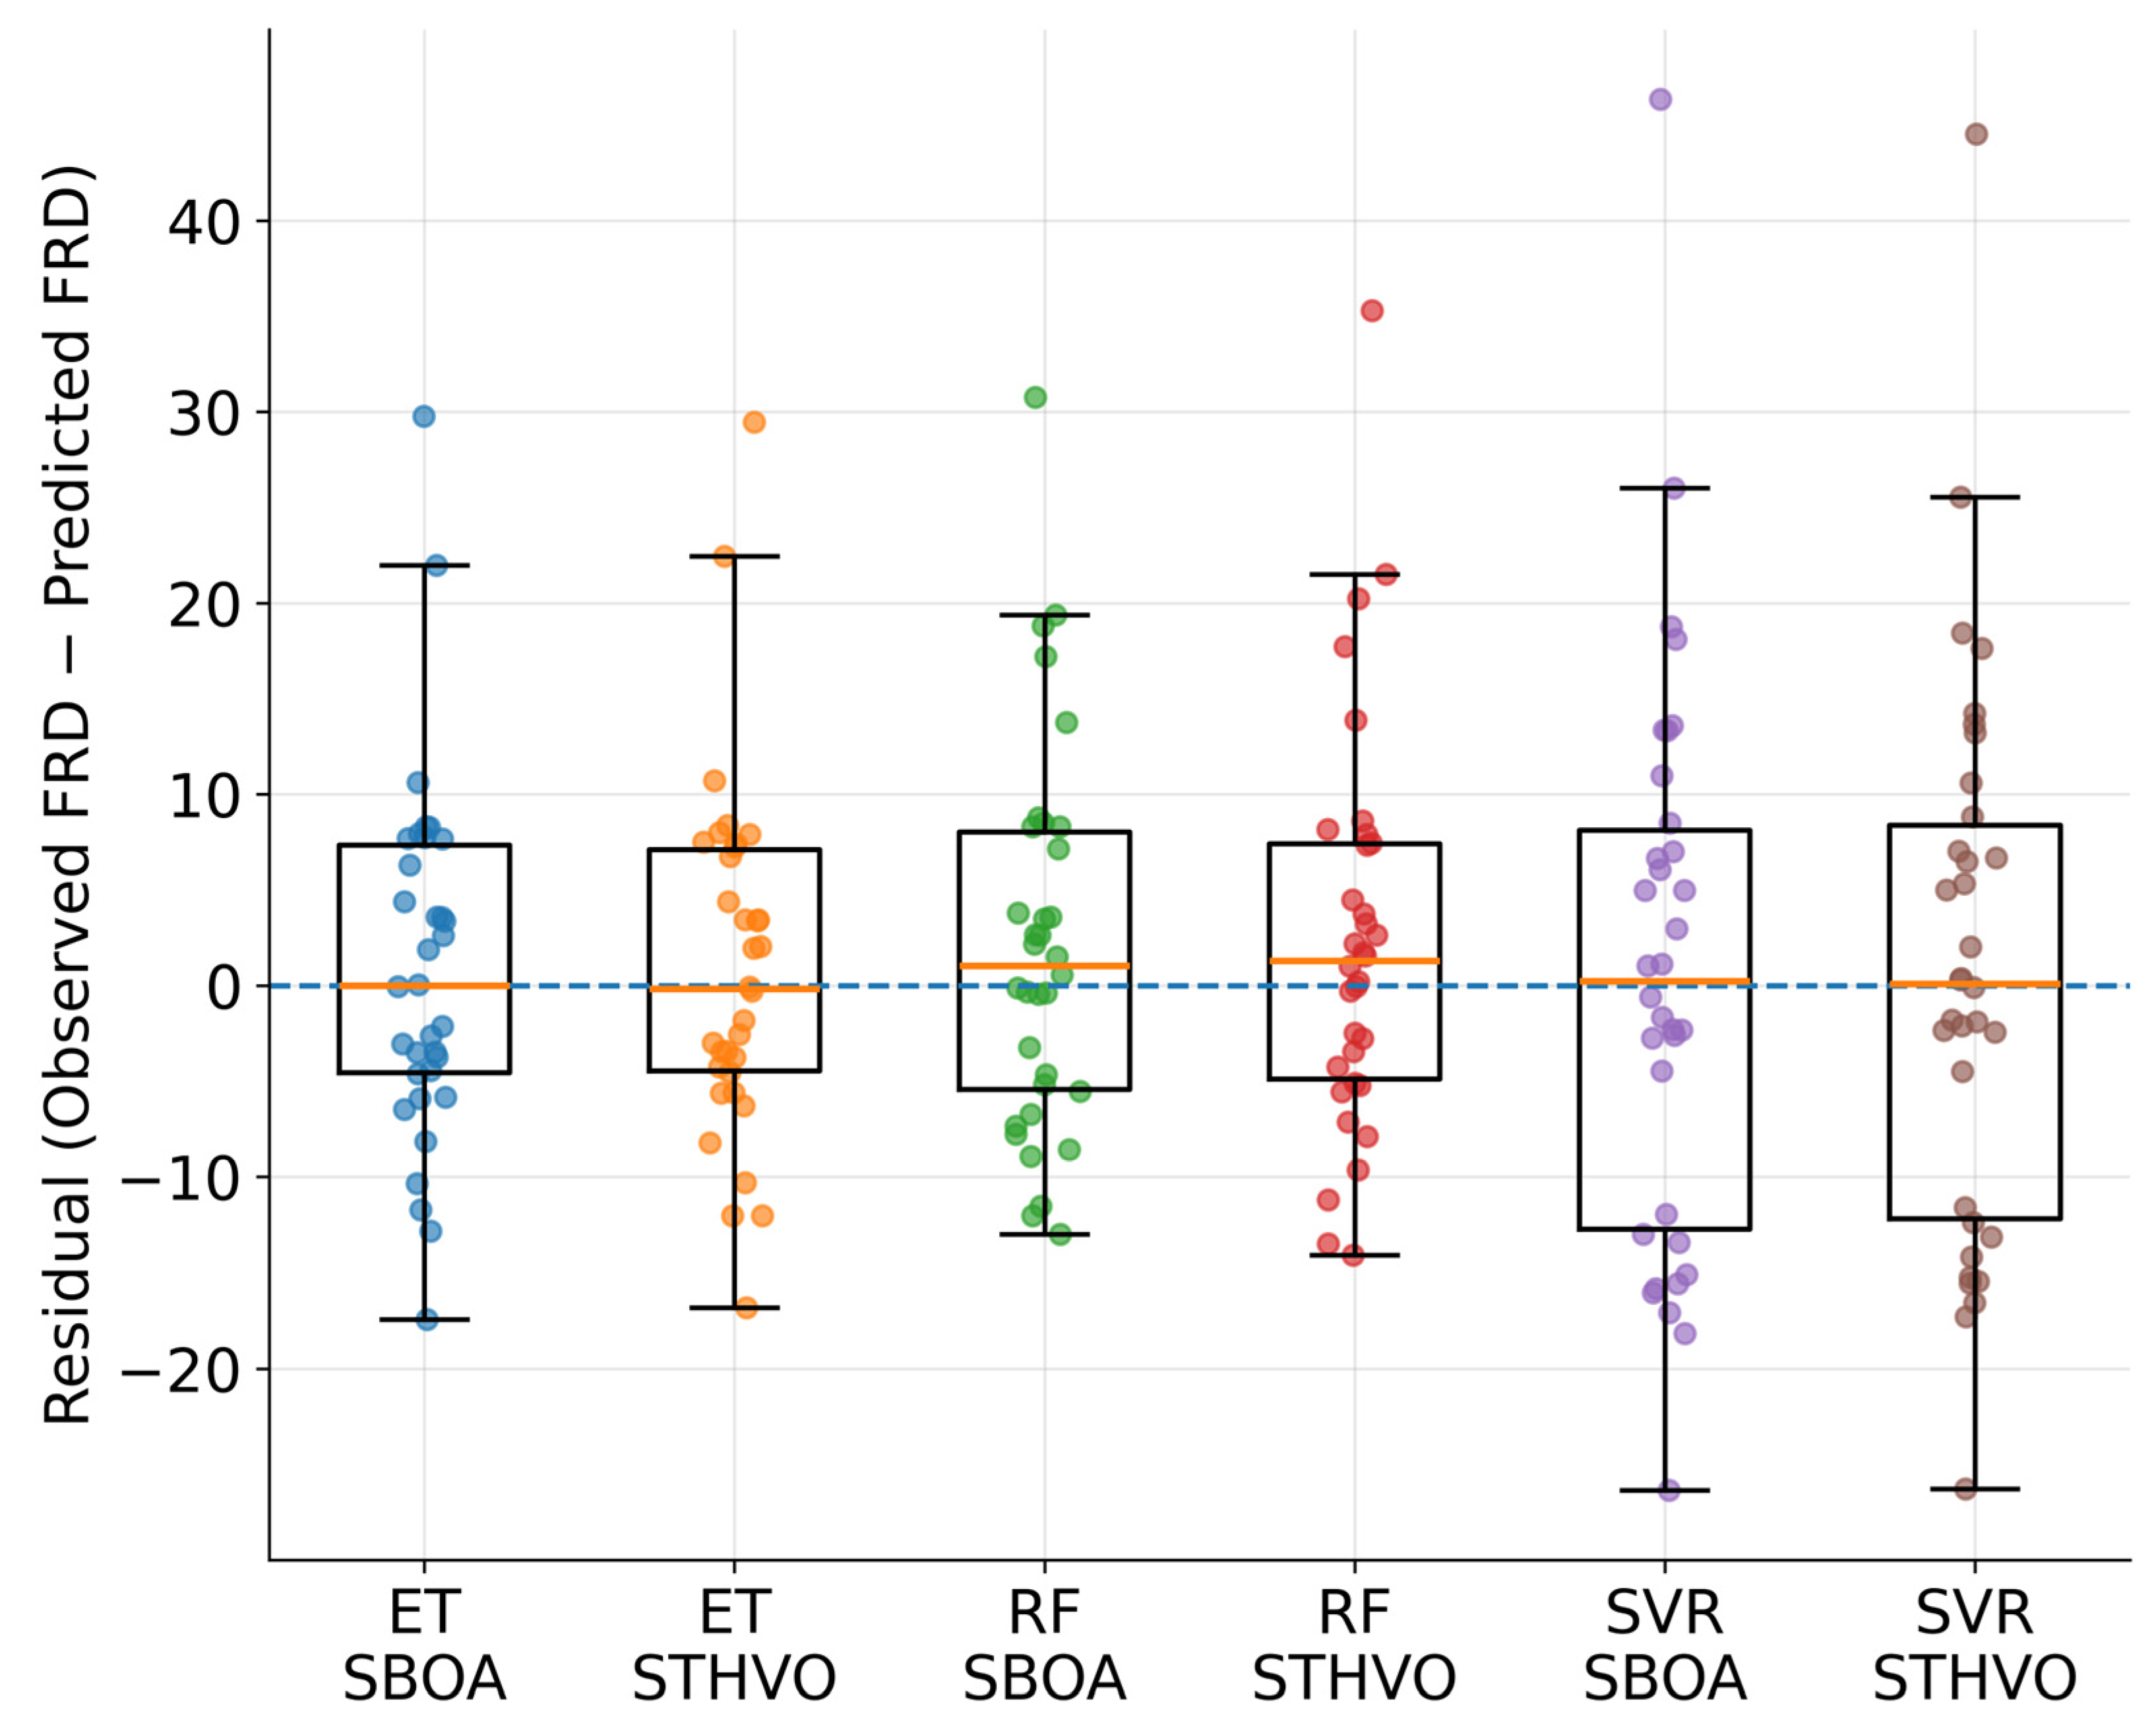
The distribution of prediction errors on the independent test dataset was further examined using residual analysis. Figure 13 presents the residual distributions of the six developed models, where residuals were calculated as the difference between the observed and predicted FRD values. The residuals of all models are generally distributed around zero, indicating no pronounced systematic over- or underprediction. The ET- and RF-based models exhibit relatively narrower error distributions, whereas the SVR-based models show greater residual dispersion.
Figure 13.
Residual distributions of the developed hybrid models.
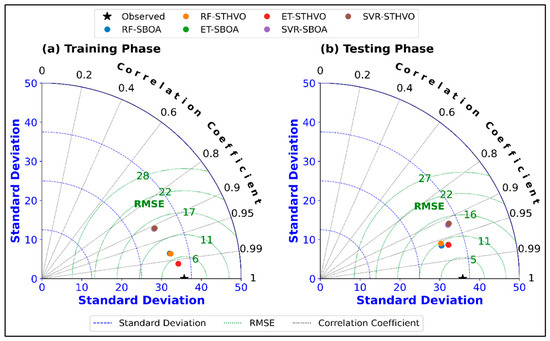
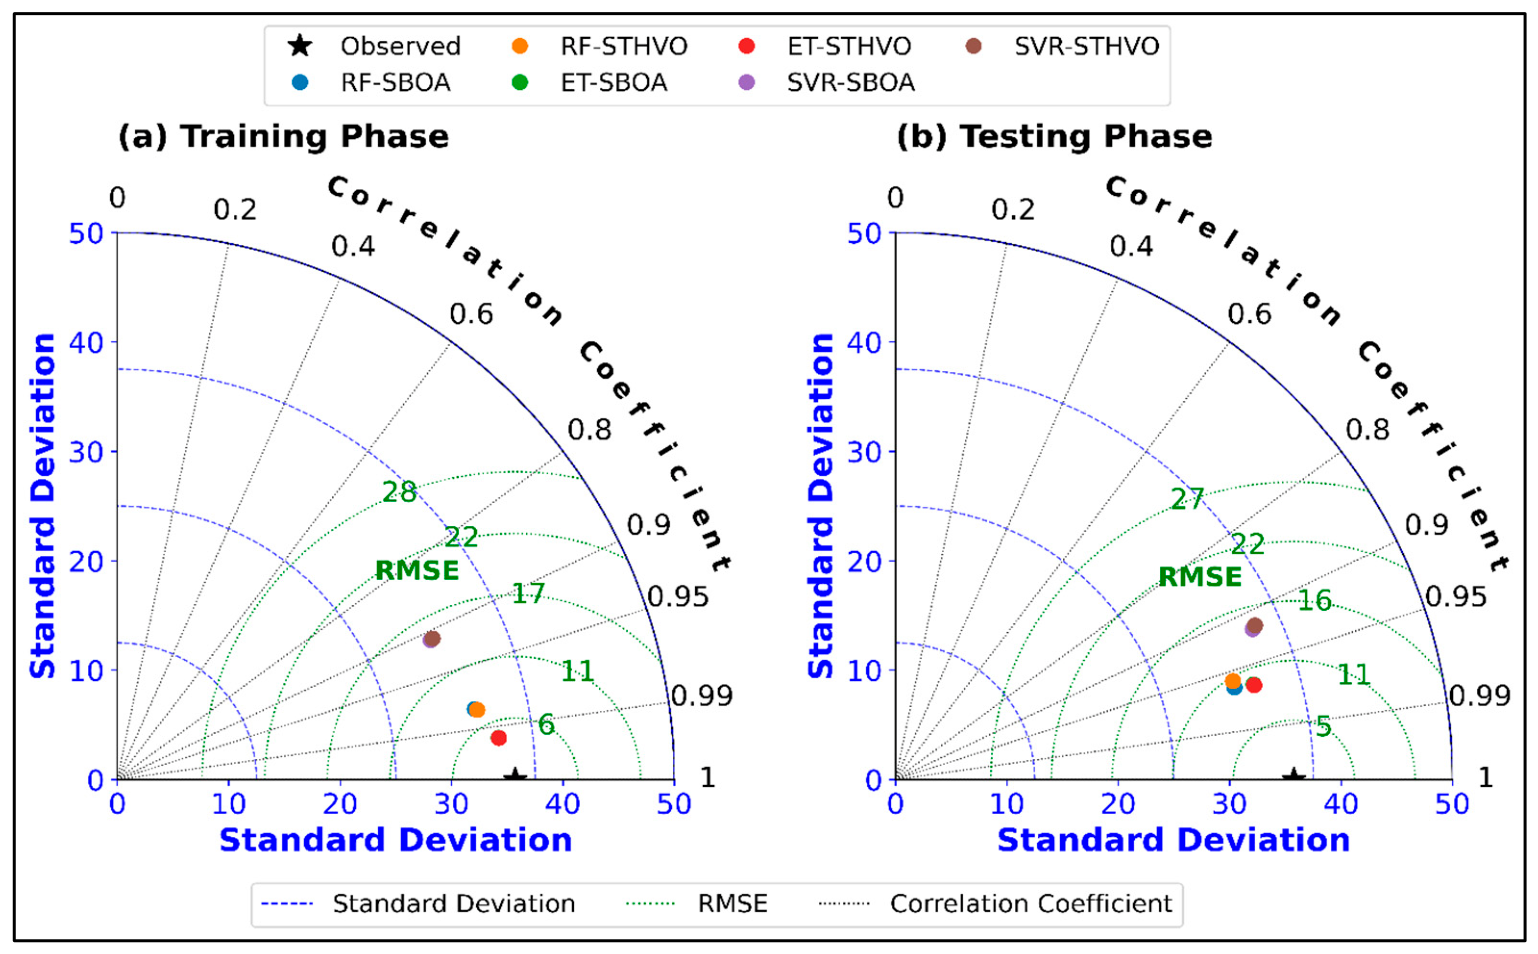
The overall predictive performance of the developed models is further summarized using the Taylor diagram shown in Figure 14. The ET-based hybrid models are positioned closest to the reference point, indicating superior agreement with the measured flyrock distances in terms of correlation, standard deviation, and root mean square difference. Overall, the Taylor diagram further supports the superior predictive capability of the ET-SBOA and ET-STHVO models compared with the other hybrid models considered in this study.
Figure 14.
Taylor diagram.
4.5. Model Interpretation Using SHAP
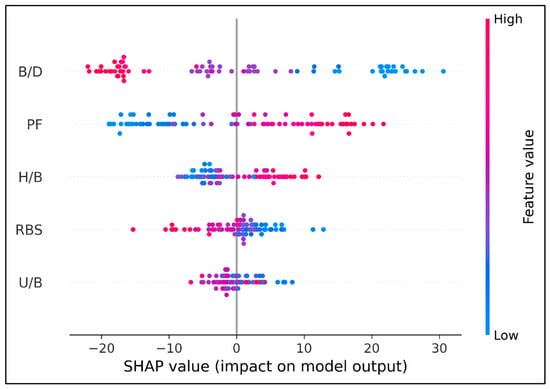
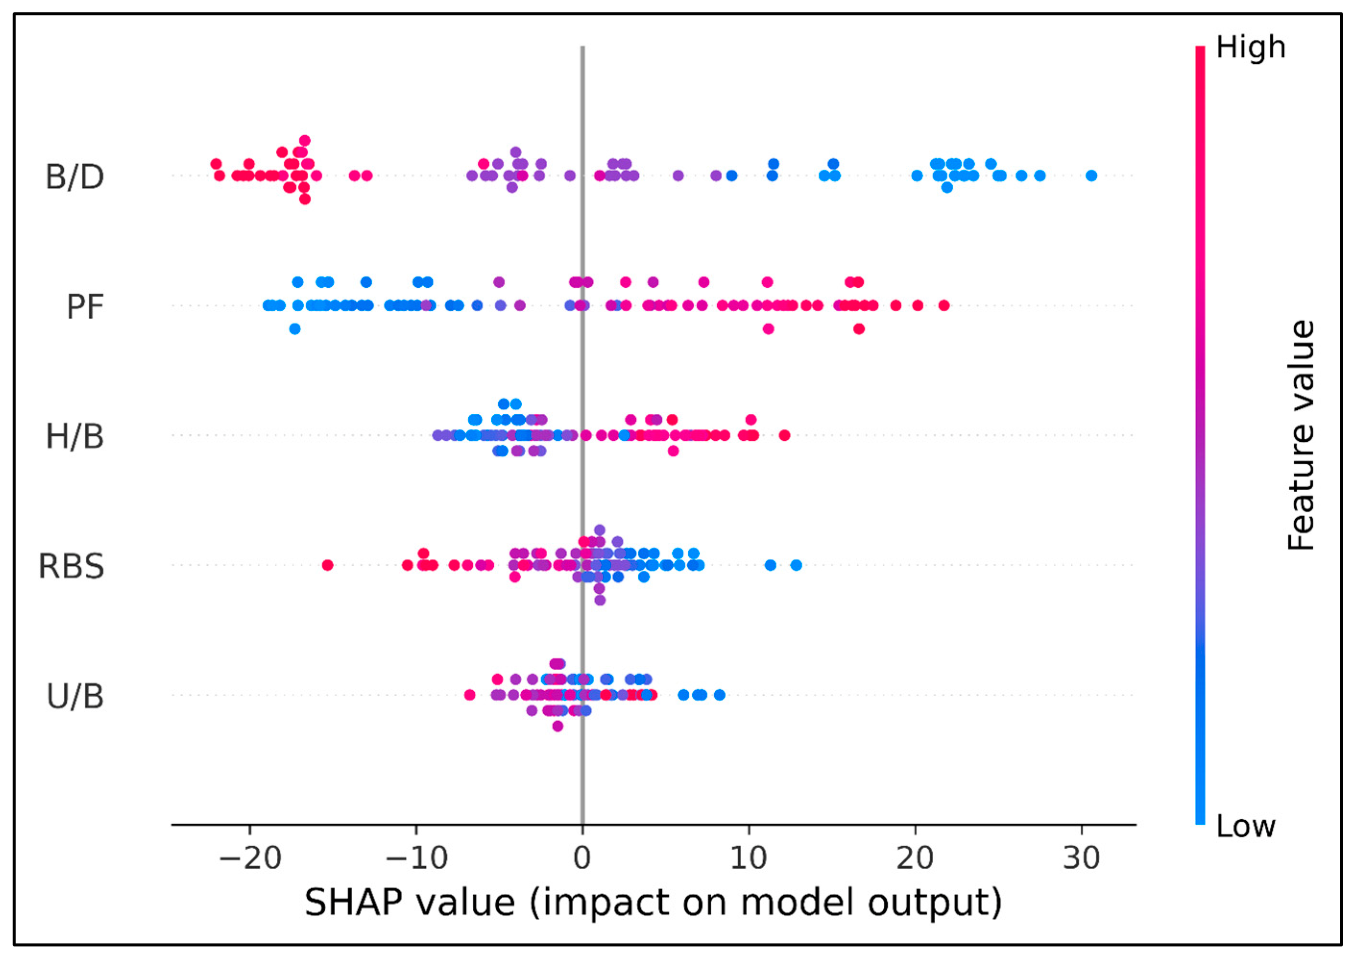
To improve the interpretability of the developed hybrid models and to quantify the contribution of each input variable to flyrock distance prediction, the game theory-based SHapley Additive exPlanations (SHAP) technique was employed [62,63]. Since the ET-STHVO model achieved the highest predictive performance, SHAP analysis was performed using the trained ET-STHVO model. Positive SHAP values indicate that a feature increases the predicted flyrock distance, whereas negative values indicate a decreasing effect. The absolute magnitude of the SHAP value reflects the strength of each feature’s contribution to the model prediction. The SHAP summary plot of the ET-STHVO model is presented in Figure 15.
Figure 15.
SHAP summary plot of the ET-STHVO model.
As shown in Figure 16, B/D was identified as the most influential variable, followed by PF, H/B, RBS, and U/B. Low B/D values (blue points) are generally associated with positive SHAP values, indicating an increase in the predicted flyrock distance, whereas high B/D values (red points) mainly produce negative SHAP values, indicating the opposite effect. In contrast, high PF values are predominantly associated with positive SHAP values, demonstrating that increasing the powder factor tends to increase the predicted flyrock distance. A similar positive relationship is observed for H/B, where higher values generally contribute to larger flyrock distances.
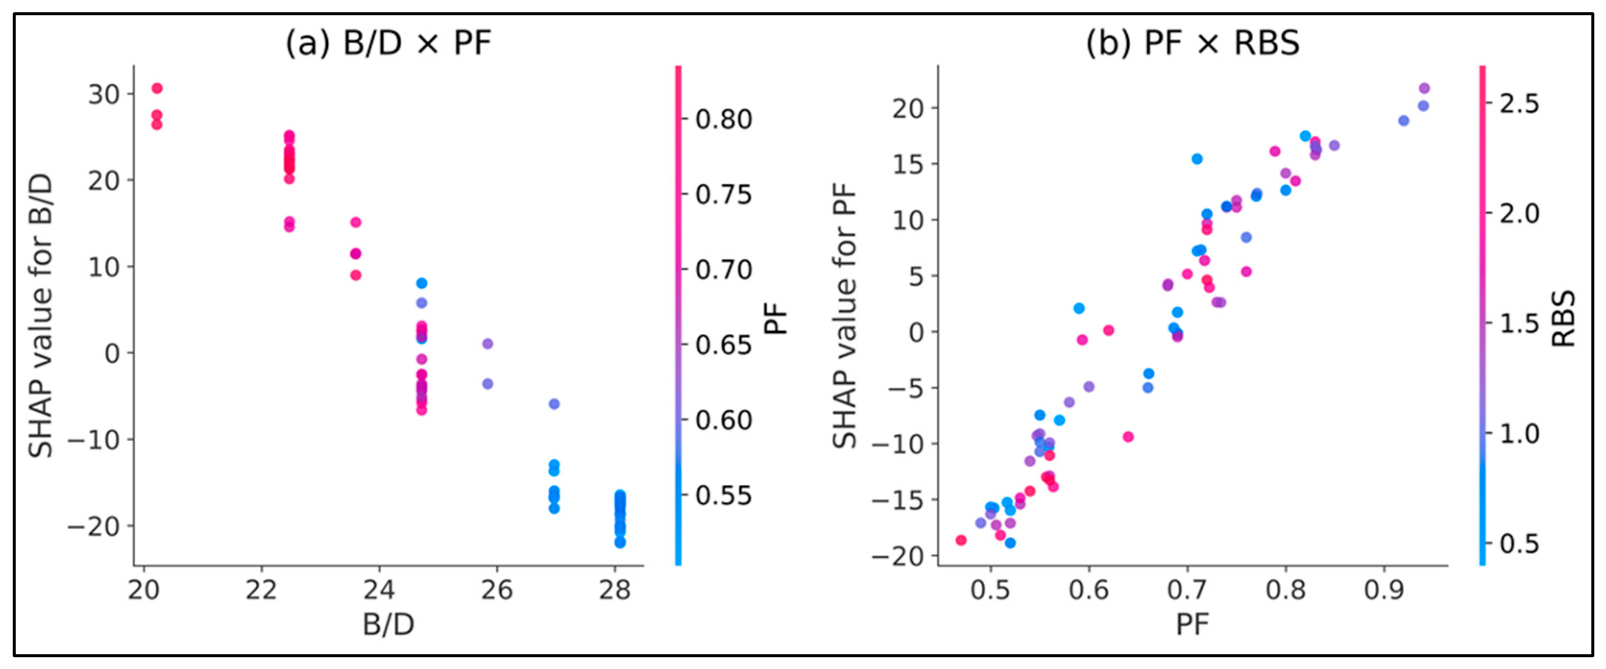
Figure 16.
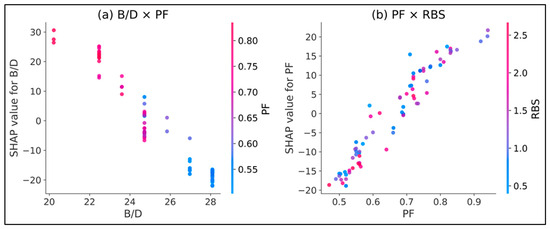
SHAP dependence and interaction plots for the ET-STHVO model: (a) B/D with PF as the interaction variable and (b) PF with RBS as the interaction variable.
In contrast, RBS exhibits an inverse relationship with flyrock distance. Higher RBS values are mainly associated with negative SHAP values, whereas lower values tend to increase the predicted flyrock distance. The relatively high importance of RBS highlights the contribution of incorporating rock mass structural characteristics into the predictive model, indicating that geological conditions play a measurable role in flyrock generation in addition to blasting design parameters. Among the five most influential variables, U/B has the smallest contribution, with SHAP values concentrated near zero, indicating a relatively limited influence on the model output. Overall, the SHAP analysis indicates that the ET-STHVO model successfully captures meaningful relationships between the blasting parameters and flyrock distance while providing an interpretable explanation of the model predictions.
To further examine the behavior of the best-performing ET-STHVO model beyond global feature importance, SHAP dependence plots were generated for B/D and PF. These variables were selected because they exhibited the highest global SHAP importance, while PF and RBS were considered as interaction variables to examine the combined effects of blast geometry, explosive energy, and rock-mass structure. The resulting dependence and interaction patterns are presented in Figure 16.
Figure 16a shows a clear decrease in the SHAP contribution of B/D as B/D increases. The color distribution indicates that higher PF values are generally associated with more negative B/D contributions. However, PF and B/D are strongly negatively correlated (r = −0.90), indicating that this interaction pattern may also partly reflect their underlying correlation and should therefore be interpreted cautiously. Figure 16b shows an approximately monotonic increase in the SHAP contribution of PF. Since RBS is only weakly correlated with PF (r = −0.15), the color distribution provides a clearer indication of their interaction. At similar PF levels, lower RBS values are generally associated with higher SHAP values, whereas higher RBS values tend to correspond to lower SHAP values. This suggests that the positive contribution of PF to predicted FRD may be stronger in rock masses characterized by lower RBS. Given the limited dataset, these interaction patterns should nevertheless be regarded as indicative rather than conclusive.
From a blasting-mechanics perspective, the relationships identified by SHAP are physically consistent with the mechanisms governing flyrock generation. The strong influence of B/D reflects the importance of burden relative to blasthole diameter in controlling confinement and the release of explosive energy toward the free face. Lower B/D values provide less resistance to rock displacement and may facilitate the projection of fragmented material, which is consistent with their positive contribution to predicted FRD. Similarly, the positive effect of PF indicates that increasing explosive energy per unit volume of rock can intensify fragmentation and rock displacement, thereby increasing the potential flyrock distance. RBS provides a field-scale representation of the rock-mass structure through the apparent in situ block size. Since in situ blocks are formed by intersecting discontinuities, their size reflects characteristics of the discontinuity network, particularly its spacing and configuration. Blasting can be regarded as a size-reduction process in which the initial in situ block structure is transformed into the fragmented rock mass [64]. From a rock-dynamics perspective, detonation generates transient stress waves that propagate through the rock mass, while discontinuities can alter their transmission and reflection and thereby influence the local fragmentation and displacement response [65]. In relatively massive rock, the explosive energy is primarily utilized to create new fractures and fragment the intact rock, whereas in a discontinuous rock mass, high-pressure detonation gases may penetrate existing joints and fractures, promoting the separation and displacement of pre-existing blocks and potentially increasing their ejection potential. Thus, RBS provides geological information that is not represented by conventional blast-design parameters alone. While conventional ballistic approaches focus on fragment motion after ejection, the present results indicate that flyrock behavior is also governed by non-linear relationships among explosive energy, blast geometry, and rock-mass structure. The SHAP results, particularly the varying contribution of PF with RBS, suggest that the effect of explosive energy on flyrock depends on the structural condition of the rock mass. These findings indicate that the predictive relationships identified by the model are consistent with the physical mechanisms of blasting and emphasize the coupled influence of blast geometry, explosive energy, and rock-mass structure on flyrock generation.
From an engineering perspective, the developed framework can support pre-blast decision-making by estimating flyrock distance from the planned blast parameters and RBS. Combined with SHAP analysis, the model can also identify influential controllable parameters, particularly B/D and PF, allowing engineers to evaluate potential design modifications before blast execution. Thus, the framework can serve as a supplementary decision-support tool for blast design and flyrock risk management.
4.6. Practical Application of the Developed Framework
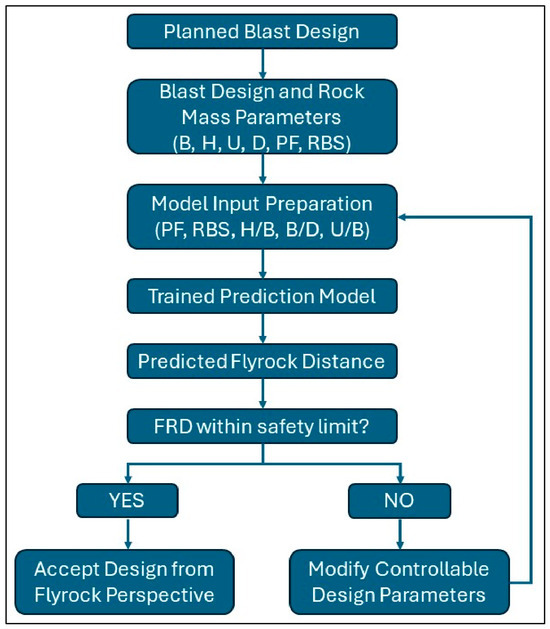
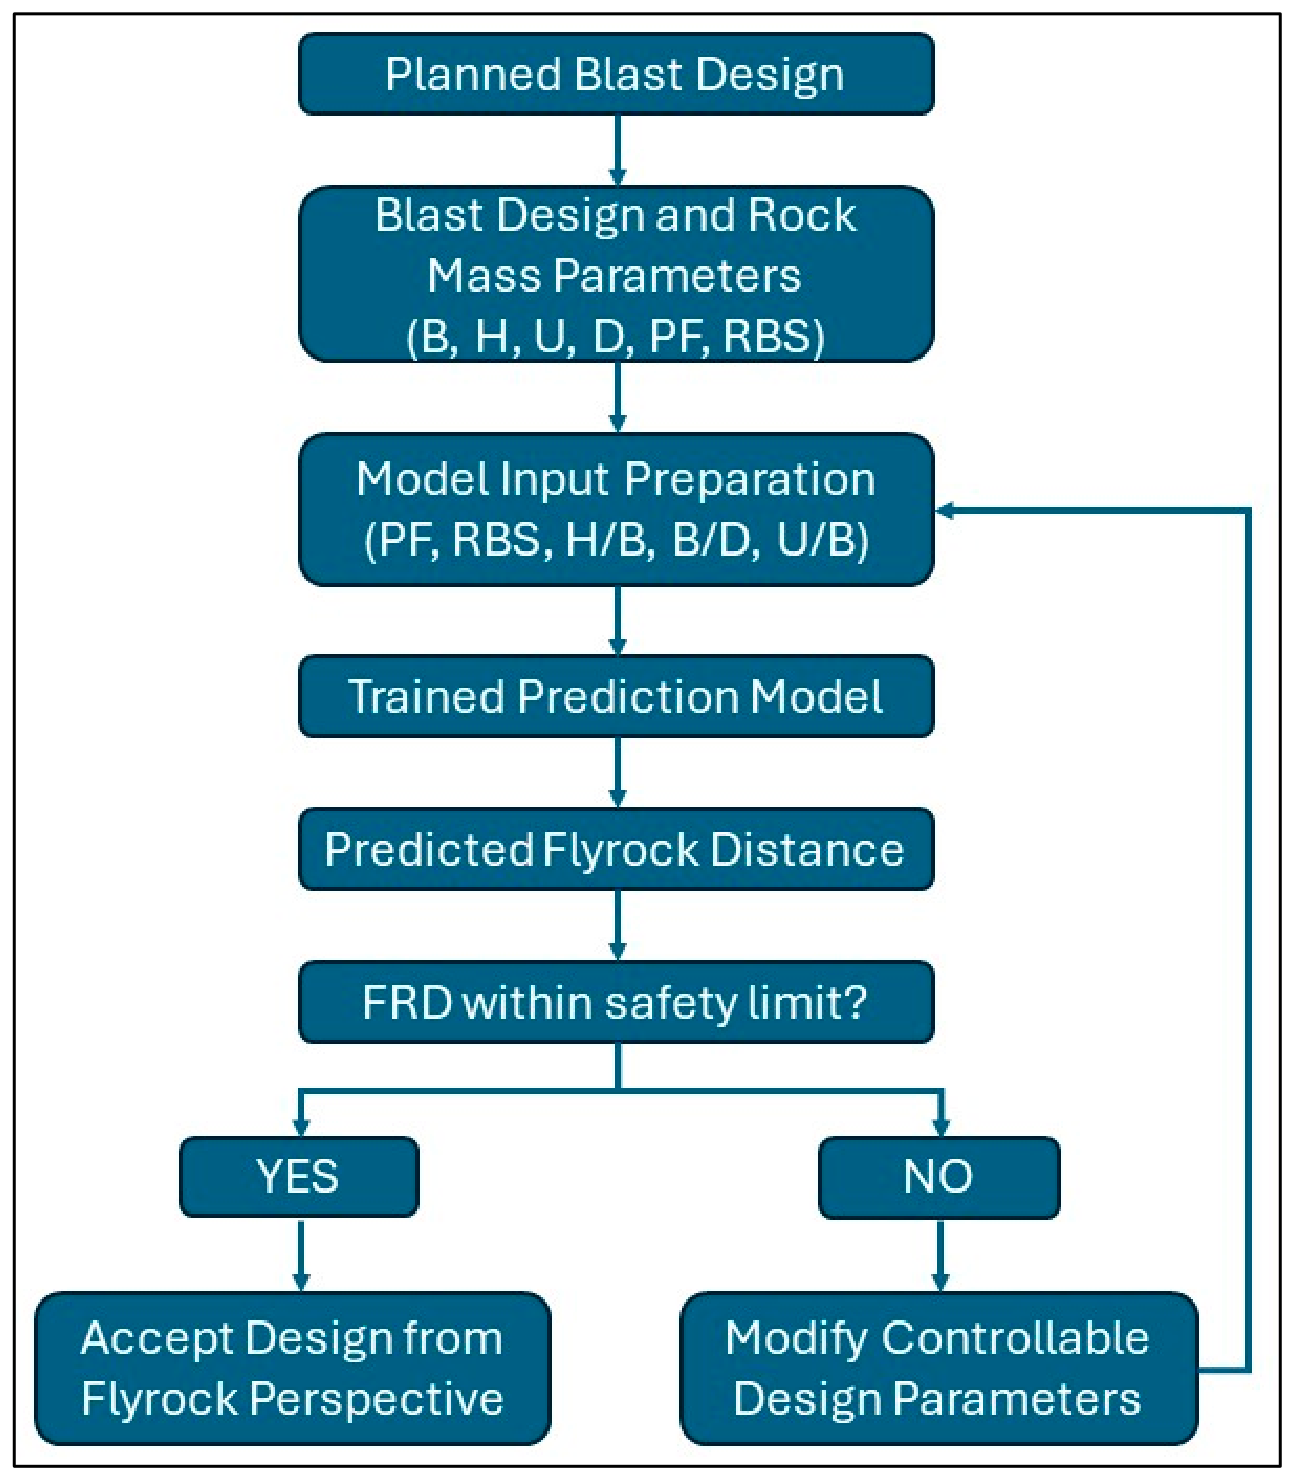
To demonstrate how the developed prediction approach can be integrated into practical blast design, a schematic engineering workflow is presented in Figure 17. For a planned blast, the required blast-design and rock-mass parameters are first determined and transformed into the corresponding model inputs. The trained model is then used to predict the flyrock distance and assess it against the specified safety limit. If the predicted FRD exceeds this limit, controllable design parameters can be modified and the prediction process repeated until an acceptable configuration is obtained.
Figure 17.
Engineering workflow for practical blast design.
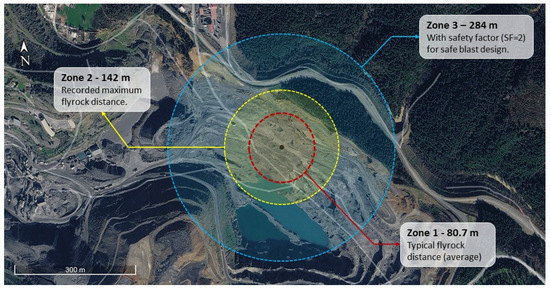
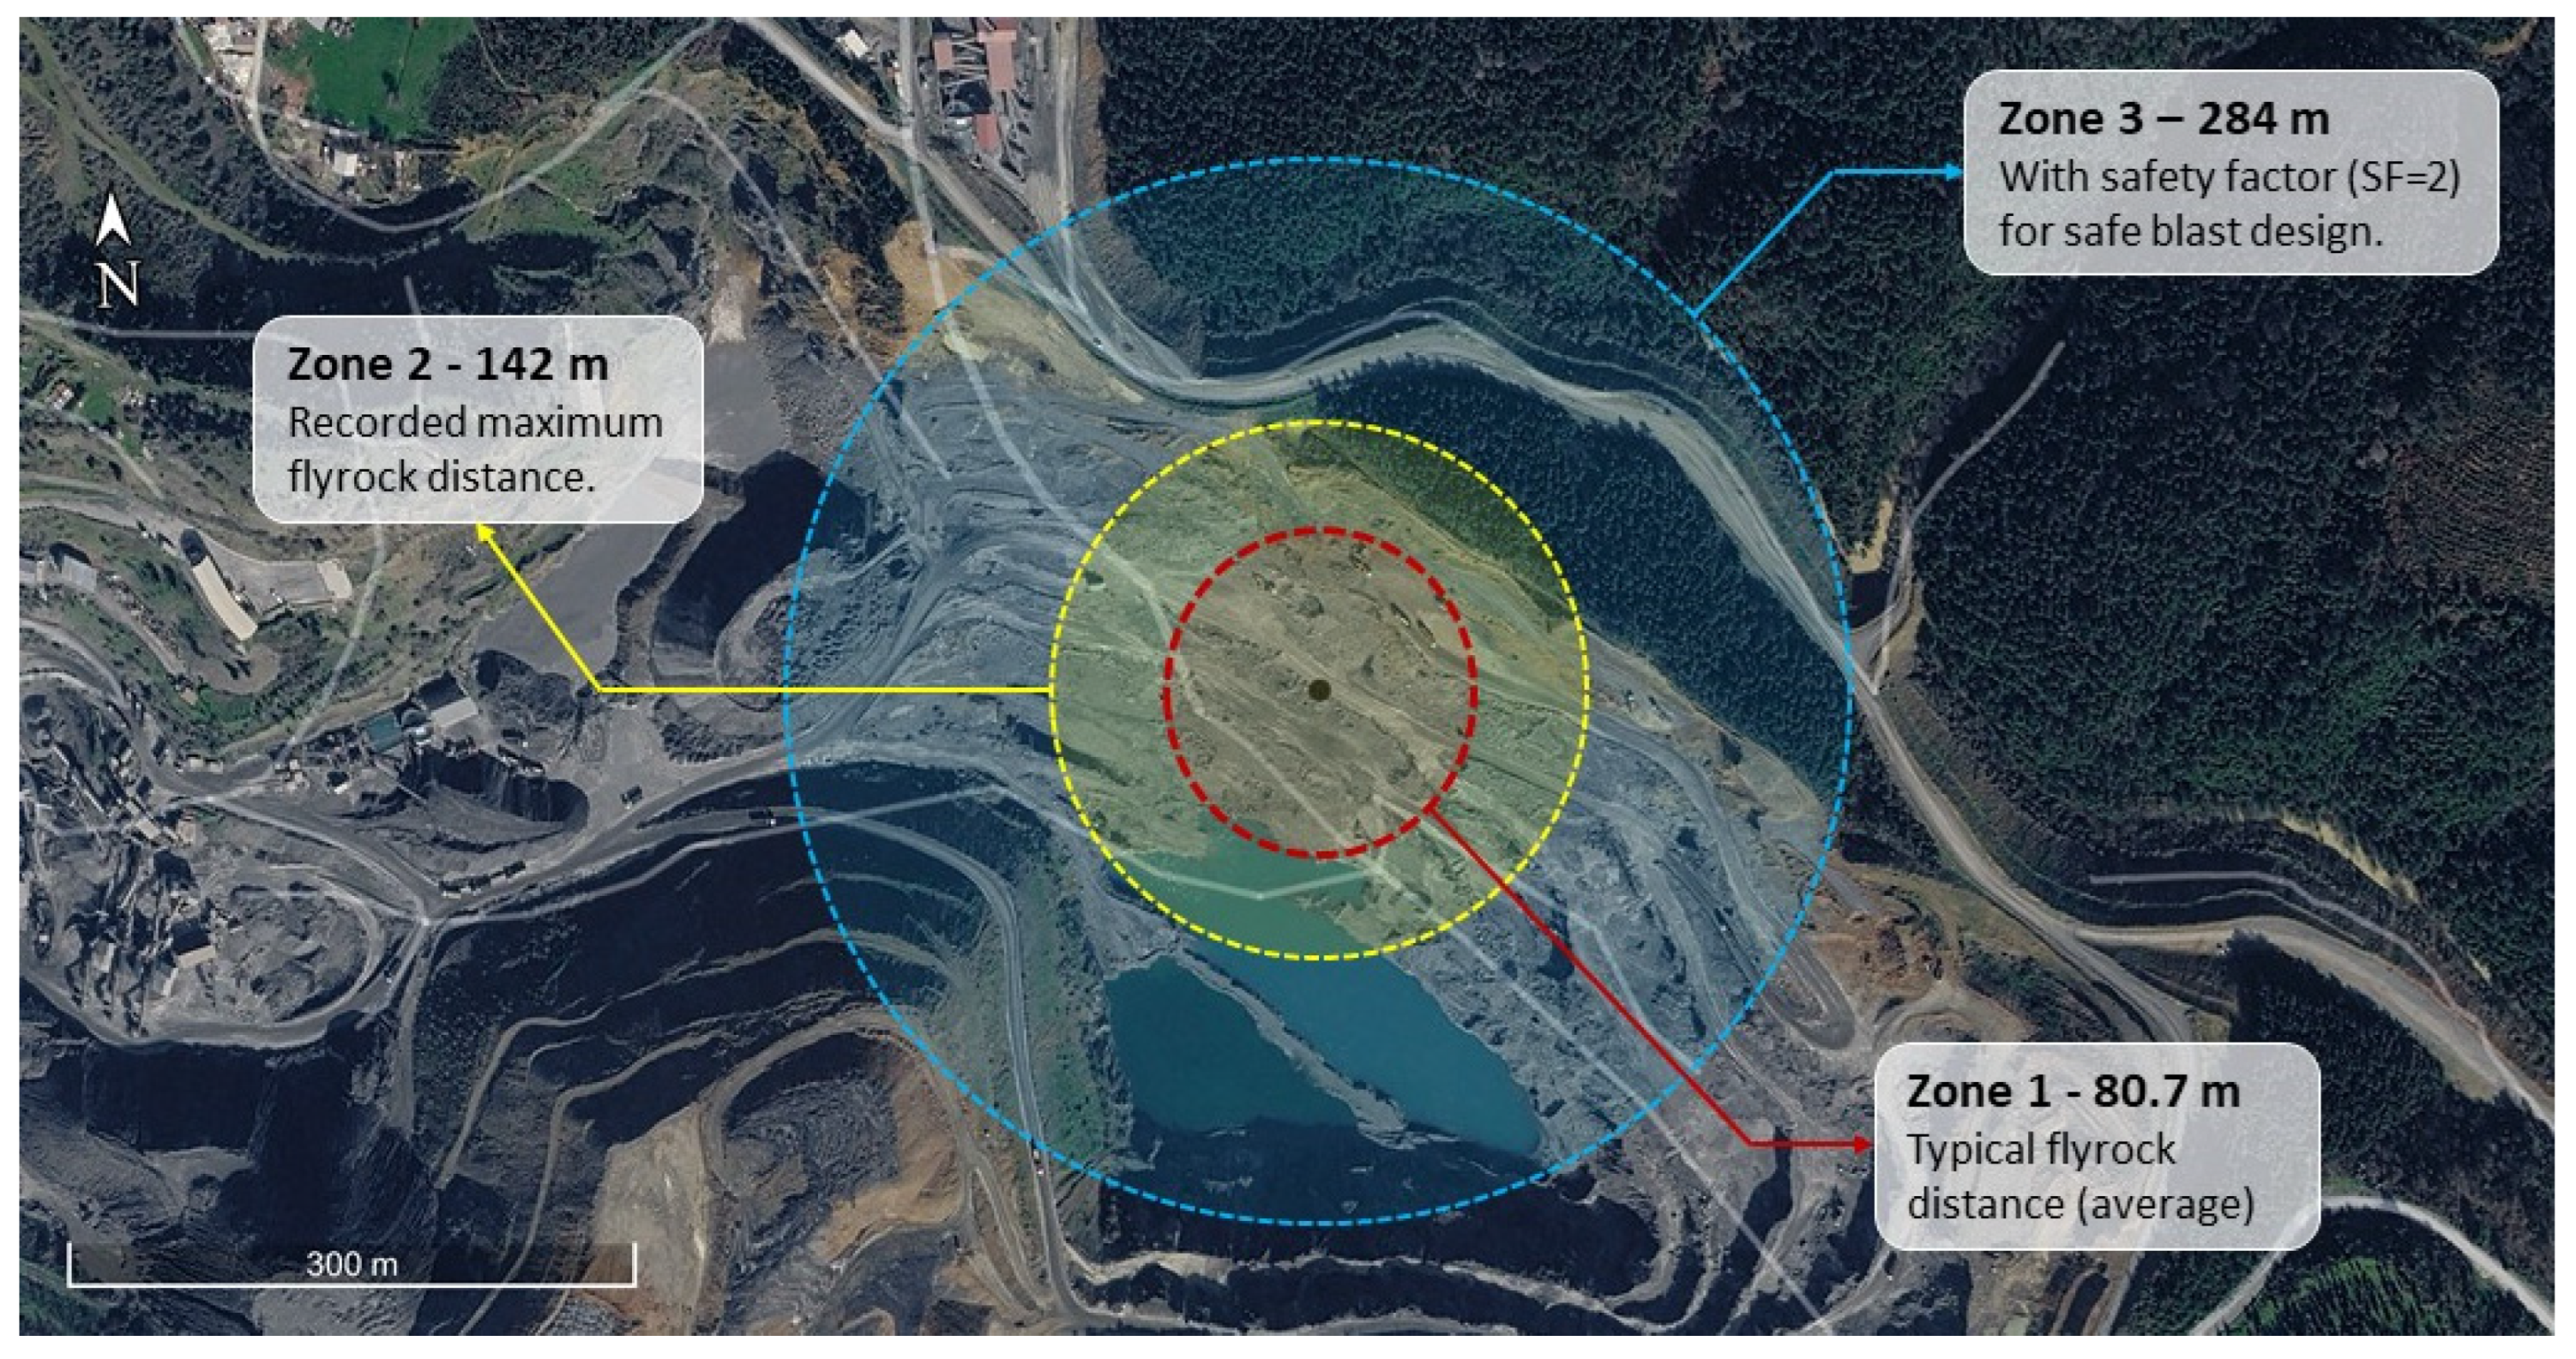
To illustrate this practical application, an example spatial flyrock risk-zone map was prepared for the study quarry (Figure 18). Zone 1 represents the average recorded flyrock distance (80.7 m), whereas Zone 2 represents the maximum recorded distance (142 m). For a more conservative representation, Zone 3 was defined by applying a safety factor of 2 to the maximum recorded distance, resulting in a radius of 284 m. It should be emphasized that open-pit mining is a dynamic operation in which bench geometries and blast locations continuously change as production advances. Therefore, the zones shown in Figure 18 should not be interpreted as fixed safety boundaries for the entire quarry, but rather as an illustrative spatial representation that can be updated according to the location and design parameters of each blast. In addition, such visualization can translate technical model outputs into an easily interpretable spatial format for field personnel. Clearly defined zones may facilitate the communication of flyrock risk to workers and support safer positioning of personnel during blasting operations without requiring detailed knowledge of the underlying predictive model.
Figure 18.
Spatial visualization of flyrock risk zones at the study quarry.
4.7. Limitations
The present study has two main limitations that should be considered when interpreting the results. First, the dataset comprises 111 blasting records, which represents a relatively limited sample size for data-driven modeling. A small dataset may increase the sensitivity of model performance to data partitioning and may increase the variability of performance estimates. To mitigate these effects, different cross-validation strategies were systematically evaluated using only the training data, and the final models were subsequently assessed on an independent holdout test set. Nevertheless, these procedures do not eliminate the limitation associated with the available sample size, and validation using larger datasets is required in future studies.
Second, all blasting records were collected from the Akdağlar sandstone quarry under specific geological and operational conditions. Consequently, the predictive performance obtained in this study should not be interpreted as evidence of universal applicability to other mines, rock types, or blasting conditions. External validation using an independent quarry dataset would provide a stronger assessment of the generalization capability of the proposed framework; however, such a dataset was not available in the present study. Future research should therefore evaluate the framework using larger multi-site datasets covering different geological conditions, rock types, blasthole diameters, and blast-design configurations.
5. Conclusions
This study proposed hybrid machine learning models based on Extra Trees (ET), Random Forest (RF), and Support Vector Regression (SVR), optimized using the recently developed Secretary Bird Optimization Algorithm (SBOA) and Spider-Tailed Horned Viper Optimizer (STHVO), for predicting blast-induced flyrock distance. Unlike conventional optimization frameworks, the proposed methodology systematically compared six cross-validation strategies prior to hyperparameter optimization to identify the most appropriate validation scheme for each machine learning model. This approach provided a more reliable optimization framework by ensuring that hyperparameter tuning was performed under the most appropriate validation strategy for each algorithm.
The results demonstrated that the optimal cross-validation strategy depends on the characteristics of the learning algorithm. The 3-fold cross-validation strategy yielded the most stable performance for the ET and RF models, whereas the 5-fold strategy was more suitable for the SVR model. Based on these validation strategies, both SBOA and STHVO effectively identified suitable hyperparameter configurations, resulting in strong predictive performance. Among all developed models, the ET-STHVO model achieved the best overall predictive performance on the independent test dataset.
Beyond predictive performance, this study makes four principal contributions to the flyrock prediction literature. First, it provides a systematic comparison of multiple cross-validation strategies, demonstrating that the choice of validation strategy influences model stability and predictive performance. Second, to the best of the authors’ knowledge, this is the first study to apply the recently developed SBOA and STHVO algorithms to blast-induced flyrock distance prediction. Third, unlike many previous studies that primarily relied on blasting design parameters, the proposed framework explicitly incorporates the RBS variable to represent the structural characteristics of the rock mass. The SHAP analysis confirmed that RBS makes a meaningful contribution to flyrock prediction, highlighting the importance of considering geological conditions together with blasting design parameters. Finally, the proposed ET-STHVO hybrid model demonstrated superior predictive performance among the investigated hybrid machine learning models, providing an accurate, robust, and interpretable framework for flyrock prediction.
The proposed methodology has the potential to support safer blast design, improve risk assessment, and assist mine engineers in minimizing flyrock hazards during blasting operations. Furthermore, the framework can be extended to other blasting-related engineering problems, including ground vibration, air overpressure, rock fragmentation, and backbreak prediction, using appropriate input variables and target outputs. However, the applicability of the developed models should primarily be considered within conditions similar to those represented in the present dataset, which was obtained from a single sandstone quarry using 89 mm diameter blastholes under specific geological and operational conditions. Further validation using independent datasets from different quarries, rock types, blasthole diameters, and blasting conditions is therefore required to assess the broader generalizability of the proposed framework. In addition, alternative metaheuristic optimization algorithms, ensemble learning strategies, and advanced deep learning techniques may be investigated in future studies.
Author Contributions
All authors contributed to the study conception and design. Material preparation, data collection, and analysis were performed by Y.A. and T.H. The first draft of the manuscript was written by Y.A., and all authors commented on the previous versions of the manuscript. All authors have read and agreed to the published version of the manuscript.
Funding
The research was partially supported by the Research Fund of the Istanbul Technical University (Grant No: 48648). The authors are grateful to the Istanbul Technical University for their financial support.
Data Availability Statement
The data that support the findings of this study are available from the corresponding author upon reasonable request.
Acknowledgments
This paper is based on the PhD thesis of Yaşar Ağan, conducted under the supervision of Türker Hüdaverdi.
Conflicts of Interest
The authors declare no conflicts of interest.
Abbreviations
The following abbreviations are used in this manuscript:
| ET | Extra Trees |
| RF | Random Forest |
| SVR | Support Vector Regression |
| SBOA | Secretary Bird Optimization Algorithm |
| STHVO | Spider-Tailed Horned Viper Optimizer |
References
- Davies, P.A. Risk-based approach to setting of flyrock “danger zones” for blast sites. Trans.—Inst. Min. Metall. Sect. A 1995, 104, 96–100. [Google Scholar] [CrossRef] [Scilit]
- Bajpayee, T.S.; Rehak, T.R.; Mowrey, G.L.; Ingram, D.K. Blasting injuries in surface mining with emphasis on flyrock and blast area security. J. Saf. Res. 2004, 35, 47–57. [Google Scholar] [CrossRef] [Scilit] [PubMed]
- Raina, A.K.; Murthy, V.M.S.R.; Soni, A.K. Flyrock in surface mine blasting: Understanding the basics to develop a predictive regime. Curr. Sci. 2015, 108, 660–665. [Google Scholar]
- Lundborg, N. The Hazards of Flyrock in Rock Blasting (SweDeFo Report No. DS 1974); Swedish Detonic Research Foundation: Stockholm, Sweden, 1974. [Google Scholar]
- Roth, J.A. A Model for the Determination of Flyrock Range as a Function of Shot Conditions (Report No. PB81222358); US Department of Commerce, NTIS: Alexandria, VA, USA, 1979; 61p.
- Chiappetta, R.F.; Bauer, A.; Dailey, P.J.; Burchell, S.L. Use of high-speed motion picture photography in blast evaluation and design. In Proceedings of the Annual Conference on Explosives and Blasting Technique; International Society of Explosive Engineers: Cleveland, OH, USA, 1983; pp. 258–309. [Google Scholar]
- Gupta, R.N. Surface blasting and its impact on environment. In Impact of Mining on Environment; Trivedy, R.K., Sinha, M.P., Eds.; Ashish Publishing House: New Delhi, Delhi, India, 1990; pp. 23–24. [Google Scholar]
- St George, J.D.; Gibson, M.F.L. Estimation of flyrock travel distances: A probabilistic approach. In EXPLO 2001 Conference; AusIMM: Carlton, VIC, Australia, 2001; pp. 409–415. [Google Scholar]
- Richards, A.; Moore, A. Flyrock control—by chance or design. In Proceedings of the 30th Annual Conference on Explosives and Blasting Technique; International Society of Explosive Engineers: New Orleans, LA, USA, 2004; pp. 335–348. [Google Scholar]
- Raina, A.K.; Chakraborty, A.K.; Ramulu, M.; Choudhury, P.B. Design of factor of safety-based criterion for control of flyrock/throw and optimum fragmentation. J. Inst. Eng. 2006, 87, 13–17. [Google Scholar]
- McKenzie, C. Flyrock range and fragment size prediction. In Proceedings of the 35th Annual Conference on Explosives and Blasting Technique; International Society of Explosives Engineers: Cleveland, OH, USA, 2009; Volume 2, p. 2. Available online: http://docs.isee.org/ISEE/Support/Proceed/General/09GENV2/09v206g.pdf (accessed on 10 July 2026).
- Aghajani-Bazzazi, A.; Osanloo, M.; Azimi, Y. Flyrock prediction by multiple regression analysis in Esfordi phosphate mine of Iran. In Rock Fragmentation by Blasting, Proceedings of the 9th International Symposium on Rock Fragmentation by Blasting, FRAGBLAST 9, Granada, Spain, 13–17 August 2009; CRC Press: Boca Raton, FL, USA, 2010; pp. 649–657. [Google Scholar]
- Monjezi, M.; Amini Khoshalan, H.; Yazdian Varjani, A. Prediction of flyrock and backbreak in open pit blasting operation: A neuro-genetic approach. Arab. J. Geosci. 2012, 5, 441–448. [Google Scholar] [CrossRef] [Scilit]
- Armaghani, D.J.; Mohamad, E.T.; Hajihassani, M.; Abad, S.A.N.K.; Marto, A.; Moghad-dam, M.R. Evaluation and prediction of flyrock resulting from blasting operations using empirical and computational methods. Eng. Comput. 2016, 32, 109–121. [Google Scholar] [CrossRef] [Scilit]
- Zhou, J.; Aghili, N.; Ghaleini, E.N.; Bui, D.T.; Tahir, M.M.; Koopialipoor, M. A Monte Carlo simulation approach for effective assessment of flyrock based on intelligent system of neural network. Eng. Comput. 2020, 36, 713–723. [Google Scholar] [CrossRef] [Scilit]
- Rezaei, M.; Monjezi, M.; Varjani, A.Y. Development of a fuzzy model to predict flyrock in surface mining. Saf. Sci. 2011, 49, 298–305. [Google Scholar] [CrossRef] [Scilit]
- Monjezi, M.; Bahrami, A.; Varjani, A.Y.; Sayadi, A.R. Prediction and controlling of flyrock in blasting operation using artificial neural network. Arab. J. Geosci. 2011, 4, 421–425. [Google Scholar] [CrossRef] [Scilit]
- Amini, H.; Gholami, R.; Monjezi, M.; Torabi, S.R.; Zadhesh, J. Evaluation of flyrock phenomenon due to blasting operation by support vector machine. Neural Comput. Appl. 2012, 21, 2077–2085. [Google Scholar] [CrossRef] [Scilit]
- Trivedi, R.; Singh, T.N.; Gupta, N. Prediction of blast-induced flyrock in opencast mines using ANN and ANFIS. Geotech. Geol. Eng. 2015, 33, 875–891. [Google Scholar] [CrossRef] [Scilit]
- Faradonbeh, R.S.; Jahed Armaghani, D.; Monjezi, M. Development of a new model for predicting flyrock distance in quarry blasting: A genetic programming technique. Bull. Eng. Geol. Environ. 2016, 75, 993–1006. [Google Scholar] [CrossRef] [Scilit]
- Hudaverdi, T. Prediction of flyrock throw distance in quarries by variable selection procedures and ANFIS modelling technique. Environ. Earth Sci. 2022, 81, 281. [Google Scholar] [CrossRef] [Scilit]
- Hasozdemir, K.; Erçelebi, S.G. Enhancing the performance of integer models for addressing the long-term production planning problem in open pit mines by decision variable fixation based on parametric analysis of the final pit limit. Min. Sci. Technol. 2024, 9, 74–84. [Google Scholar] [CrossRef] [Scilit]
- Dönmez, H.O.; Tunçdemir, H.; Acaroğlu, Ö. Fuzzy AHP-TOPSIS Framework for Rock Mass Classification Based on RMQR Criteria. Geotech. Geol. Eng. 2025, 43, 325. [Google Scholar] [CrossRef] [Scilit]
- Ding, X.; Jamei, M.; Hasanipanah, M.; Abdullah, R.A.; Le, B.N. Optimized data-driven models for prediction of flyrock due to blasting in surface mines. Sustainability 2023, 15, 8424. [Google Scholar] [CrossRef] [Scilit]
- Wang, X.; Hosseini, S.; Jahed Armaghani, D.; Tonnizam Mohamad, E. Data-driven optimized artificial neural network technique for prediction of flyrock induced by boulder blasting. Mathematics 2023, 11, 2358. [Google Scholar] [CrossRef] [Scilit]
- Ding, X.; Hasanipanah, M.; Monjezi, M.; Abdullah, R.A.; Nguyen, T.; Ulrikh, D.V. Enhancing Mine Blasting Safety: Developing Intelligent Systems for Accurate Flyrock Prediction through Optimized Group Method of Data Handling Methods: X. Ding et al. Nat. Resour. Res. 2025, 34, 1199–1218. [Google Scholar]
- Nguyen, H.; Bao, T.D.; Bui, X.N.; Pham, V.V.; Nguyen, D.A.; Do, N.H.; Hoa, L.T.T.; Le, Q.-T.; Le, T.-N. Measuring and Predicting Blast-Induced Flyrock Using Unmanned Aerial Vehicles and Lévy Flight Technique-Based Jaya Optimization Algorithm Integrated with Adaptive Neuro-Fuzzy Inference System. Nat. Resour. Res. 2025, 34, 1773–1806. [Google Scholar] [CrossRef] [Scilit]
- Mohammed, B.; Hamza, C. A robust estimation of blasting-induced flyrock using machine learning decision tree algorithms: Random Forest, gradient boosting machine, and XGBoost. Min. Metall. Explor. 2025, 42, 1609–1624. [Google Scholar] [CrossRef] [Scilit]
- Rouhani, M.M.; Hasanipanah, M.; Yin, X.; Ahmadianfar, I.; Dehghani, H. Intelligent Prediction of Flyrock Hazards in Surface Mining Using Optimized Gradient Boosting Models: MM Rouhani et al. Nat. Resour. Res. 2026, 35, 629–651. [Google Scholar]
- Barkhordari, M.S.; Armaghani, D.J.; Fakharian, P. Ensemble machine learning models for prediction of flyrock due to quarry blasting. Int. J. Environ. Sci. Technol. 2022, 19, 8661–8676. [Google Scholar] [CrossRef] [Scilit]
- Hosseini, S.; Poormirzaee, R.; Hajihassani, M.; Kalatehjari, R. An ANN-fuzzy cognitive map-based Z-number theory to predict flyrock induced by blasting in open-pit mines. Rock Mech. Rock Eng. 2022, 55, 4373–4390. [Google Scholar] [CrossRef] [Scilit]
- Blair, D.P. Probabilistic analysis of flyrock from blasting in surface mines and quarries. Int. J. Rock Mech. Min. Sci. 2022, 159, 105204. [Google Scholar] [CrossRef] [Scilit]
- Liu, Y.; Li, A.; Liu, Y.; Leng, Z.; Xie, Y. A theory-data-integrated intelligent framework for prediction of blasting-induced rock fragment size. Powder Technol. 2025, 453, 120638. [Google Scholar] [CrossRef] [Scilit]
- Li, H.; Xie, B.; Li, X. RSE-PINN: A physics-informed deep learning framework for peak particle velocity prediction in open-pit blasting. Expert Syst. Appl. 2026, 132149. [Google Scholar] [CrossRef] [Scilit]
- Kunkyin-Saadaari, F.; Asiedu, C.; Atta-Duncan, E.; Agadzie, V.K.; Adu-Gyamfi, M. Performance Evaluation of Soft Computing Techniques in Blast-Induced Predictions: The Case of Backbreak. Int. J. Geosci. 2025, 16, 738–761. [Google Scholar]
- Tugrul, A.; Undul, O. Engineering geological characteristics of Istanbul greywackes. In Proceedings of the 10th International Association for Engineering Geology and the Environment (IAEG) Congress, Nottingham, UK, 6–10 September 2006; Geological Society: London, UK, 2006; p. 395. [Google Scholar]
- Ozgul, N. Stratigraphy and some structural features of the İstanbul palaeozoic. Turk. J. Earth Sci. 2012, 21, 817–866. [Google Scholar] [CrossRef] [Scilit]
- Ash, R.L. The mechanics of rock breakage (part 2)–standards for blast design. Pit. Quarry 1963, 56, 118–122. [Google Scholar]
- Hudaverdi, T.; Akyildiz, O. A new classification approach for prediction of flyrock throw in surface mines. Bull. Eng. Geol. Environ. 2019, 78, 177–187. [Google Scholar] [CrossRef] [Scilit]
- Ghasemi, E.; Sari, M.; Ataei, M. Development of an empirical model for predicting the effects of controllable blasting parameters on flyrock distance in surface mines. Int. J. Rock Mech. Min. Sci. 2012, 52, 163–170. [Google Scholar] [CrossRef] [Scilit]
- Darabi, H.; Mohamadi, S.; Karimidastenaei, Z.; Kisi, O.; Ehteram, M.; ELShafie, A.; Torabi Haghighi, A. Prediction of daily suspended sediment load (SSL) using new optimization algorithms and soft computing models. Soft Comput. 2021, 25, 7609–7626. [Google Scholar] [CrossRef] [Scilit]
- Janse, R.J.; Hoekstra, T.; Jager, K.J.; Zoccali, C.; Tripepi, G.; Dekker, F.W.; Van Diepen, M. Conducting correlation analysis: Important limitations and pitfalls. Clin. Kidney J. 2021, 14, 2332–2337. [Google Scholar] [CrossRef] [Scilit] [PubMed]
- Breiman, L. Random forests. Mach. Learn. 2001, 45, 5–32. [Google Scholar] [CrossRef] [Scilit]
- Breiman, L. Bagging Predictors. Mach. Learn. 1996, 24, 123–140. [Google Scholar] [CrossRef] [Scilit]
- Han, H.; Armaghani, D.J.; Tarinejad, R.; Zhou, J.; Tahir, M.M. Random Forest and Bayesian network techniques for probabilistic prediction of flyrock induced by blasting in quarry sites. Nat. Resour. Res. 2020, 29, 655–667. [Google Scholar] [CrossRef] [Scilit]
- Dou, J.; Yunus, A.P.; Bui, D.T.; Merghadi, A.; Sahana, M.; Zhu, Z.; Chen, C.-W.; Khosravi, K.; Yang, Y.; Pham, B.T. Assessment of advanced random forest and decision tree algorithms for modeling rainfall-induced landslide susceptibility in the Izu Oshima Volcanic Island, Japan. Sci. Total Environ. 2019, 662, 332–346. [Google Scholar] [CrossRef] [Scilit] [PubMed]
- Nguyen, H.; Bui, X.-N. Predicting blast-induced air overpressure: A robust artificial intelligence system based on artificial neural networks and random forest. Nat. Resour. Res. 2018, 20, 107. [Google Scholar] [CrossRef] [Scilit]
- Geurts, P.; Ernst, D.; Wehenkel, L. Extremely randomized trees. Mach. Learn. 2006, 63, 3–42. [Google Scholar] [CrossRef] [Scilit]
- Géron, A. Hands-On Machine Learning with Scikit-Learn, Keras & TensorFlow, 3rd ed.; O’Reilly Media: Sebastopol, CA, USA, 2023. [Google Scholar]
- Alpaydin, E. Introduction to Machine Learning, 4th ed.; MIT Press: Cambridge, MA, USA, 2020. [Google Scholar]
- Vapnik, V.N. The Nature of Statistical Learning Theory; Springer: Berlin/Heidelberg, Germany, 1995. [Google Scholar]
- Smola, A.J.; Schölkopf, B. A tutorial on Support Vector Regression. Stat. Comput. 2004, 14, 199–222. [Google Scholar] [CrossRef] [Scilit]
- Drucker, H.; Burges, C.J.C.; Kaufman, L.; Smola, A.; Vapnik, V. Support Vector Regression Machines. Adv. Neural Inf. Process. Syst. (NIPS) 1997, 9, 155–161. [Google Scholar]
- Fu, Y.; Liu, D.; Chen, J.; He, L. Secretary bird optimization algorithm: A new metaheuristic for solving global optimization problems. Artif. Intell. Rev. 2024, 57, 123. [Google Scholar] [CrossRef] [Scilit]
- Hamadneh, T.; Batiha, B.; Al-Baik, O.; Montazeri, Z.; Malik, O.P.; Werner, F.; Dhiman, G.; Dehghani, M.; Eguchi, K. Spider-Tailed Horned Viper Optimization: An Effective Bio-Inspired Metaheuristic Algorithm for Solving Engineering Applications. Int. J. Intell. Eng. Syst. 2025, 18, 25–35. [Google Scholar] [CrossRef] [Scilit]
- Li, C.; Zhou, J.; Du, K.; Armaghani, D.J.; Huang, S. Prediction of flyrock distance in surface mining using a novel hybrid model of harris hawk’s optimization with multi-strategies-based support vector regression. Nat. Resour. Res. 2023, 32, 2995–3023. [Google Scholar] [CrossRef] [Scilit]
- Hudaverdi, T.; Agan, Y. Application of intelligent models for flyrock prediction considering design parameters and bench face characteristics. Min. Metall. Explor. 2023, 40, 2331–2347. [Google Scholar] [CrossRef] [Scilit]
- Agan, Y.; Hudaverdi, T. Application of machine learning algorithms for prediction of blast-induced ground vibration in view of stiffness ratio, energy coverage and scaled distance. J. Min. Environ. 2025, 16, 1607–1622. [Google Scholar]
- Bengio, Y.; Grandvalet, Y. No unbiased estimator of the variance of k-fold cross-validation. J. Mach. Learn. Res. 2004, 5, 1089–1105. [Google Scholar]
- Feng, S.; Wang, J. Threefold versus fivefold cross validation in one-hidden-layer and two-hidden-layer predictive neural network modeling. Expert Syst. Appl. 2008, 35, 893–903. [Google Scholar] [CrossRef] [Scilit]
- Varoquaux, G. Cross-validation failure: Small sample sizes lead to large error bars. NeuroImage 2018, 180, 68–77. [Google Scholar] [CrossRef] [Scilit] [PubMed]
- Shapley, L.S. A Value for n-Person Games. In Contributions to the Theory of Games II; Kuhn, H.W., Tucker, A.W., Eds.; Princeton University Press: Princeton, NJ, USA, 1953; Volume 28, pp. 307–317. [Google Scholar]
- Elshaarawy, M.K.; Alsaadawi, M.M.; Hamed, A.K. Machine learning and interactive GUI for concrete compressive strength prediction. Sci. Rep. 2024, 14, 16694. [Google Scholar] [CrossRef] [Scilit] [PubMed]
- Hudaverdi, T.; Kuzu, C.; Fisne, A. Investigation of the blast fragmentation using the mean fragment size and fragmentation index. Int. J. Rock Mech. Min. Sci. 2012, 56, 136–145. [Google Scholar] [CrossRef] [Scilit]
- Olofsson, S.O. Applied Explosives Technology for Construction and Mining, 2nd ed.; APPLEX: Arla, Sweden, 1990. [Google Scholar]

Disclaimer/Publisher’s Note: The statements, opinions and data contained in all publications are solely those of the individual author(s) and contributor(s) and not of MDPI and/or the editor(s). MDPI and/or the editor(s) disclaim responsibility for any injury to people or property resulting from any ideas, methods, instructions or products referred to in the content. |
© 2026 by the authors. Licensee MDPI, Basel, Switzerland. This article is an open access article distributed under the terms and conditions of the Creative Commons Attribution (CC BY) license.