


Abstract
Current geological site assessment models focus on examining stable natural features and neglect measuring surrounding industrial and environmental hazards. This methodological deficiency is clearly evident in the management of technological heritage in existing or abandoned mining areas. This research presents the modified GAMGES geo-environmental assessment model to address this practical gap in the regional planning of industrial geoparks. The proposed model integrates the geo-environmental safety (GES) block as a mathematical discount factor that measures the risks of surface deformation, seismic activity, gas emissions, and pollution from mining waste. The research applies the developed criteria to the Kirov Mine database in the Kuzbass Basin, renowned for its combined technological and geodynamic characteristics. The numerical results demonstrate a lower overall site value compared to the conventional model due to the detection of active ground fissures and continuous methane migration across tectonic faults. The model provides planners with a quantitative decision support framework for dividing industrial heritage sites into multiple safety zones that ensure visitor protection and the security of sustainable tourism facilities.
1. Introduction
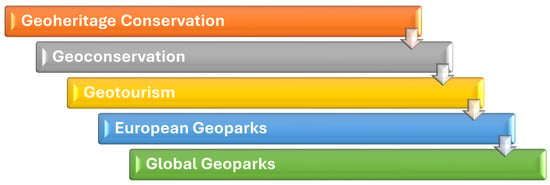
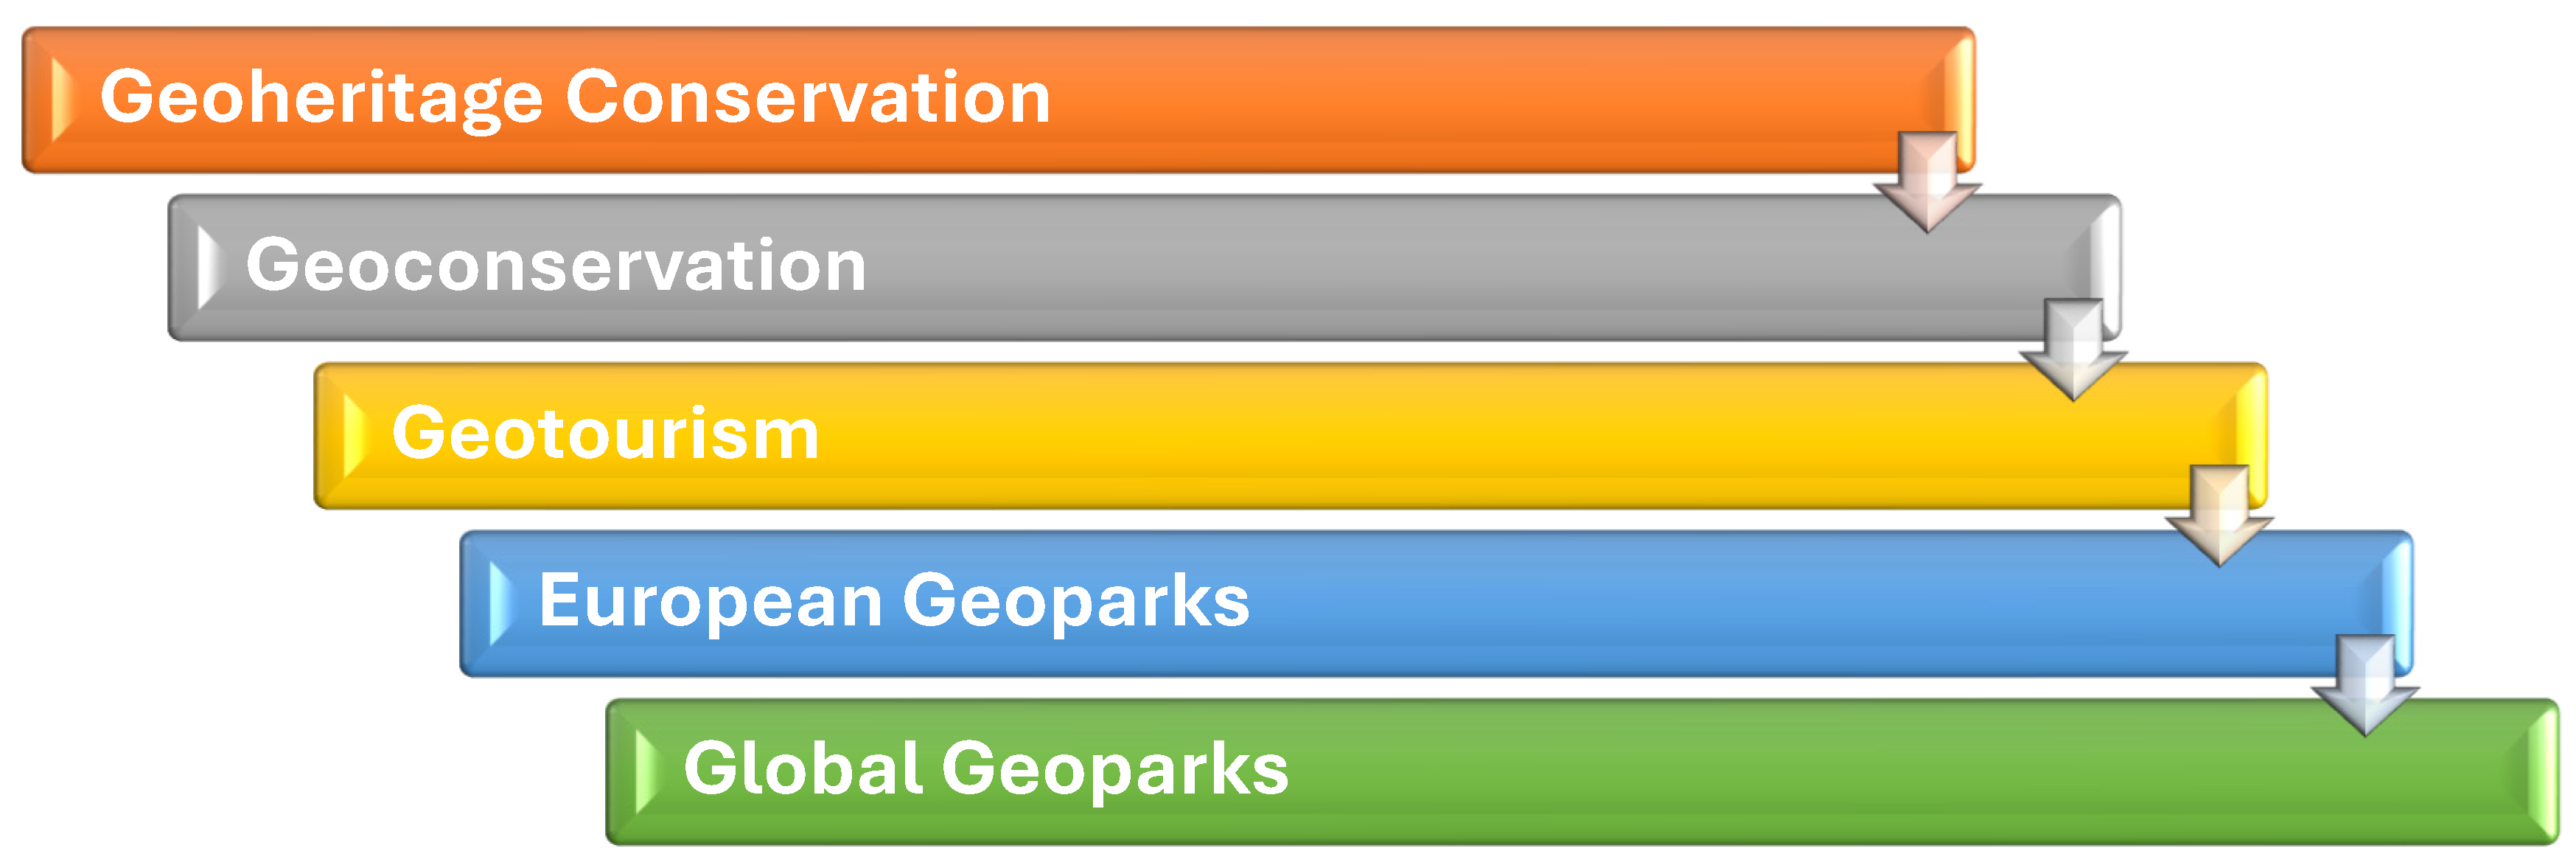
The second half of the twentieth century witnessed a significant increase in the international scientific community’s interest in the preservation of geological heritage as an integral part of humanity’s natural and cultural wealth [1]. Unique geological sites were no longer treated merely as landmarks for purely academic research, but were now classified as strategic resources for supporting environmental education, promoting geotourism, and achieving sustainable economic and social development in regions [1]. The principles of geotourism define the relationship between rock formations and local topography to support sustainable tourism [2]. As a result of this growing awareness, the concept of “geoparks” emerged as a modern management mechanism that reconciles nature conservation with the development of local communities [1,3]. Assessing geological diversity helps in identifying the natural components for creating proposed geoparks [4]. Figure 1 illustrates the sequential stages of the historical and methodological development that this concept underwent until it reached the stage of international institutionalisation [5].
Figure 1.
The historical development of the concept and system of geoparks.
The European Geoparks Network was established in 2000 [6], followed by the Global Geoparks Network in 2004, providing a comprehensive international institutional framework operating under the auspices of UNESCO, which formally established its role with the launch of the UNESCO Global Geoparks Programme in 2015 [7,8]. As this international movement has expanded, the scope of contemporary application has broadened beyond purely natural features, focusing on industrial heritage sites, open-pit mines, closed quarries, and regions affected by active technological and geodynamic changes [9,10]. Sound regional planning and the development of these overlapping areas require the adoption of quantitative and objective methods capable of accurately assessing geological features to determine their value and conservation priorities [1,3]. In this context, researchers developed the geological site assessment model (GAM) in 2011 as a standardised quantitative assessment tool based on dividing measurement criteria into main values and additional values [1]. This methodology was later updated in 2014 with the M-GAM, which integrates the opinions and preferences of actual visitors through relative importance coefficients of indicators [11]. Integrating quantitative assessment models helps in selecting suitable tourist destinations based on natural characteristics [12]. Contemporary studies are increasingly using Geographic Information Systems (GIS) and multi-criteria decision-making (MCDM) methods to spatially weight indicators and map potential regions [13,14]. A critical evaluation of these approaches reveals divergent functional possibilities and limitations. While the classical GAM provides a quantitative framework for the primary concept and secondary values of heritage, its fundamental methodological limitation lies in its static assumption of geological stability, completely neglecting operational and geomechanical hazards. Although the modified M-GAM incorporates public preference-based weightings (Im), it remains confined to visitor subjective perception without incorporating objective, on-site physical hazards. Conversely, GIS-based spatial coverage and MCDM algorithms (such as AHP, SWARA, and CRADIS) excel at spatially aggregating criteria and ranking expert preferences; however, they primarily function as decision support frameworks rather than dynamic risk discounting models. Consequently, when applying current MCDM and GIS applications to technological mining landscapes, they risk generating falsely positive suitability maps by overestimating aesthetic appeal while mathematically neglecting geodynamic instability and gaseous emissions [13,14]. Despite the continuous development of these quantitative tools, current assessment models face a critical methodological gap when applied to industrial and technological heritage environments and active mining regions [10]. This is because traditional models were originally designed to examine stable natural features [1,11], leaving their structural framework completely lacking independent criteria for measuring geoecological safety [10]. Current assessment methods also fail to monitor the risks of technological geodynamic activity, seismic activity resulting from mining drilling and blasting, and surface geomechanical deformations [10,15]. These models also fail to provide any independent representation of methane migration processes [16,17], hydrogeological hazards and water pollution [15], and the impact of mining waste and the accumulation of tailings from separation and concentration processes [18]. This methodological deficiency prevents planners from objectively assessing safety risks, jeopardising the safety of visitors and the proposed tourist and educational facilities [10].
This research addresses the current methodological gap by formulating a modified geo-environmental assessment model (GAMGES) that incorporates a “geo-environmental safety (GES) block” as a mathematical discount factor to subtract risk values from the overall site values to ensure overall safety. The current study includes five field- and laboratory-measurable environmental geological indicators within the GAMGES framework for assessing technological safety. The developed model is applied to the Kirov Mine Area database in the Kuzbass Basin for a technical case study, providing a quantitative decision support framework for dividing industrial heritage lands into multiple safety zones that protect visitors and support sustainable regional planning. To explicitly address any potential conceptual overlap, it is essential to clearly distinguish between the present work and the initial case investigation in reference [10]. While reference [10] conducted a qualitative survey of localised geological hazards in the Khannas region, it did not establish a transferable mathematical discount architecture or quantitative field boundaries. In contrast, the present study develops a general mathematical model GAMGES that incorporates a formal geosounding safety discount function (GES), rigorous operational indicators, continuous physical sampling protocols, and explicit numerical boundaries for the regionalisation of dynamic hazards in highly active underground mining environments such as the Kirov Mine.
2. Materials and Methods
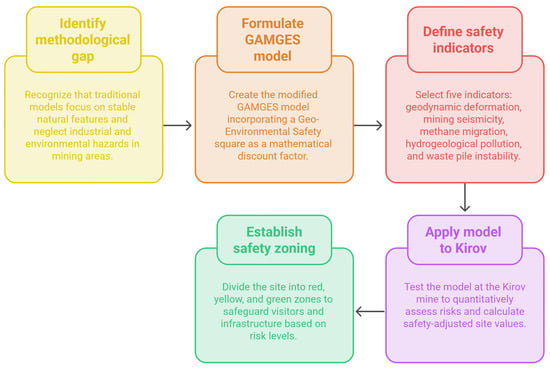
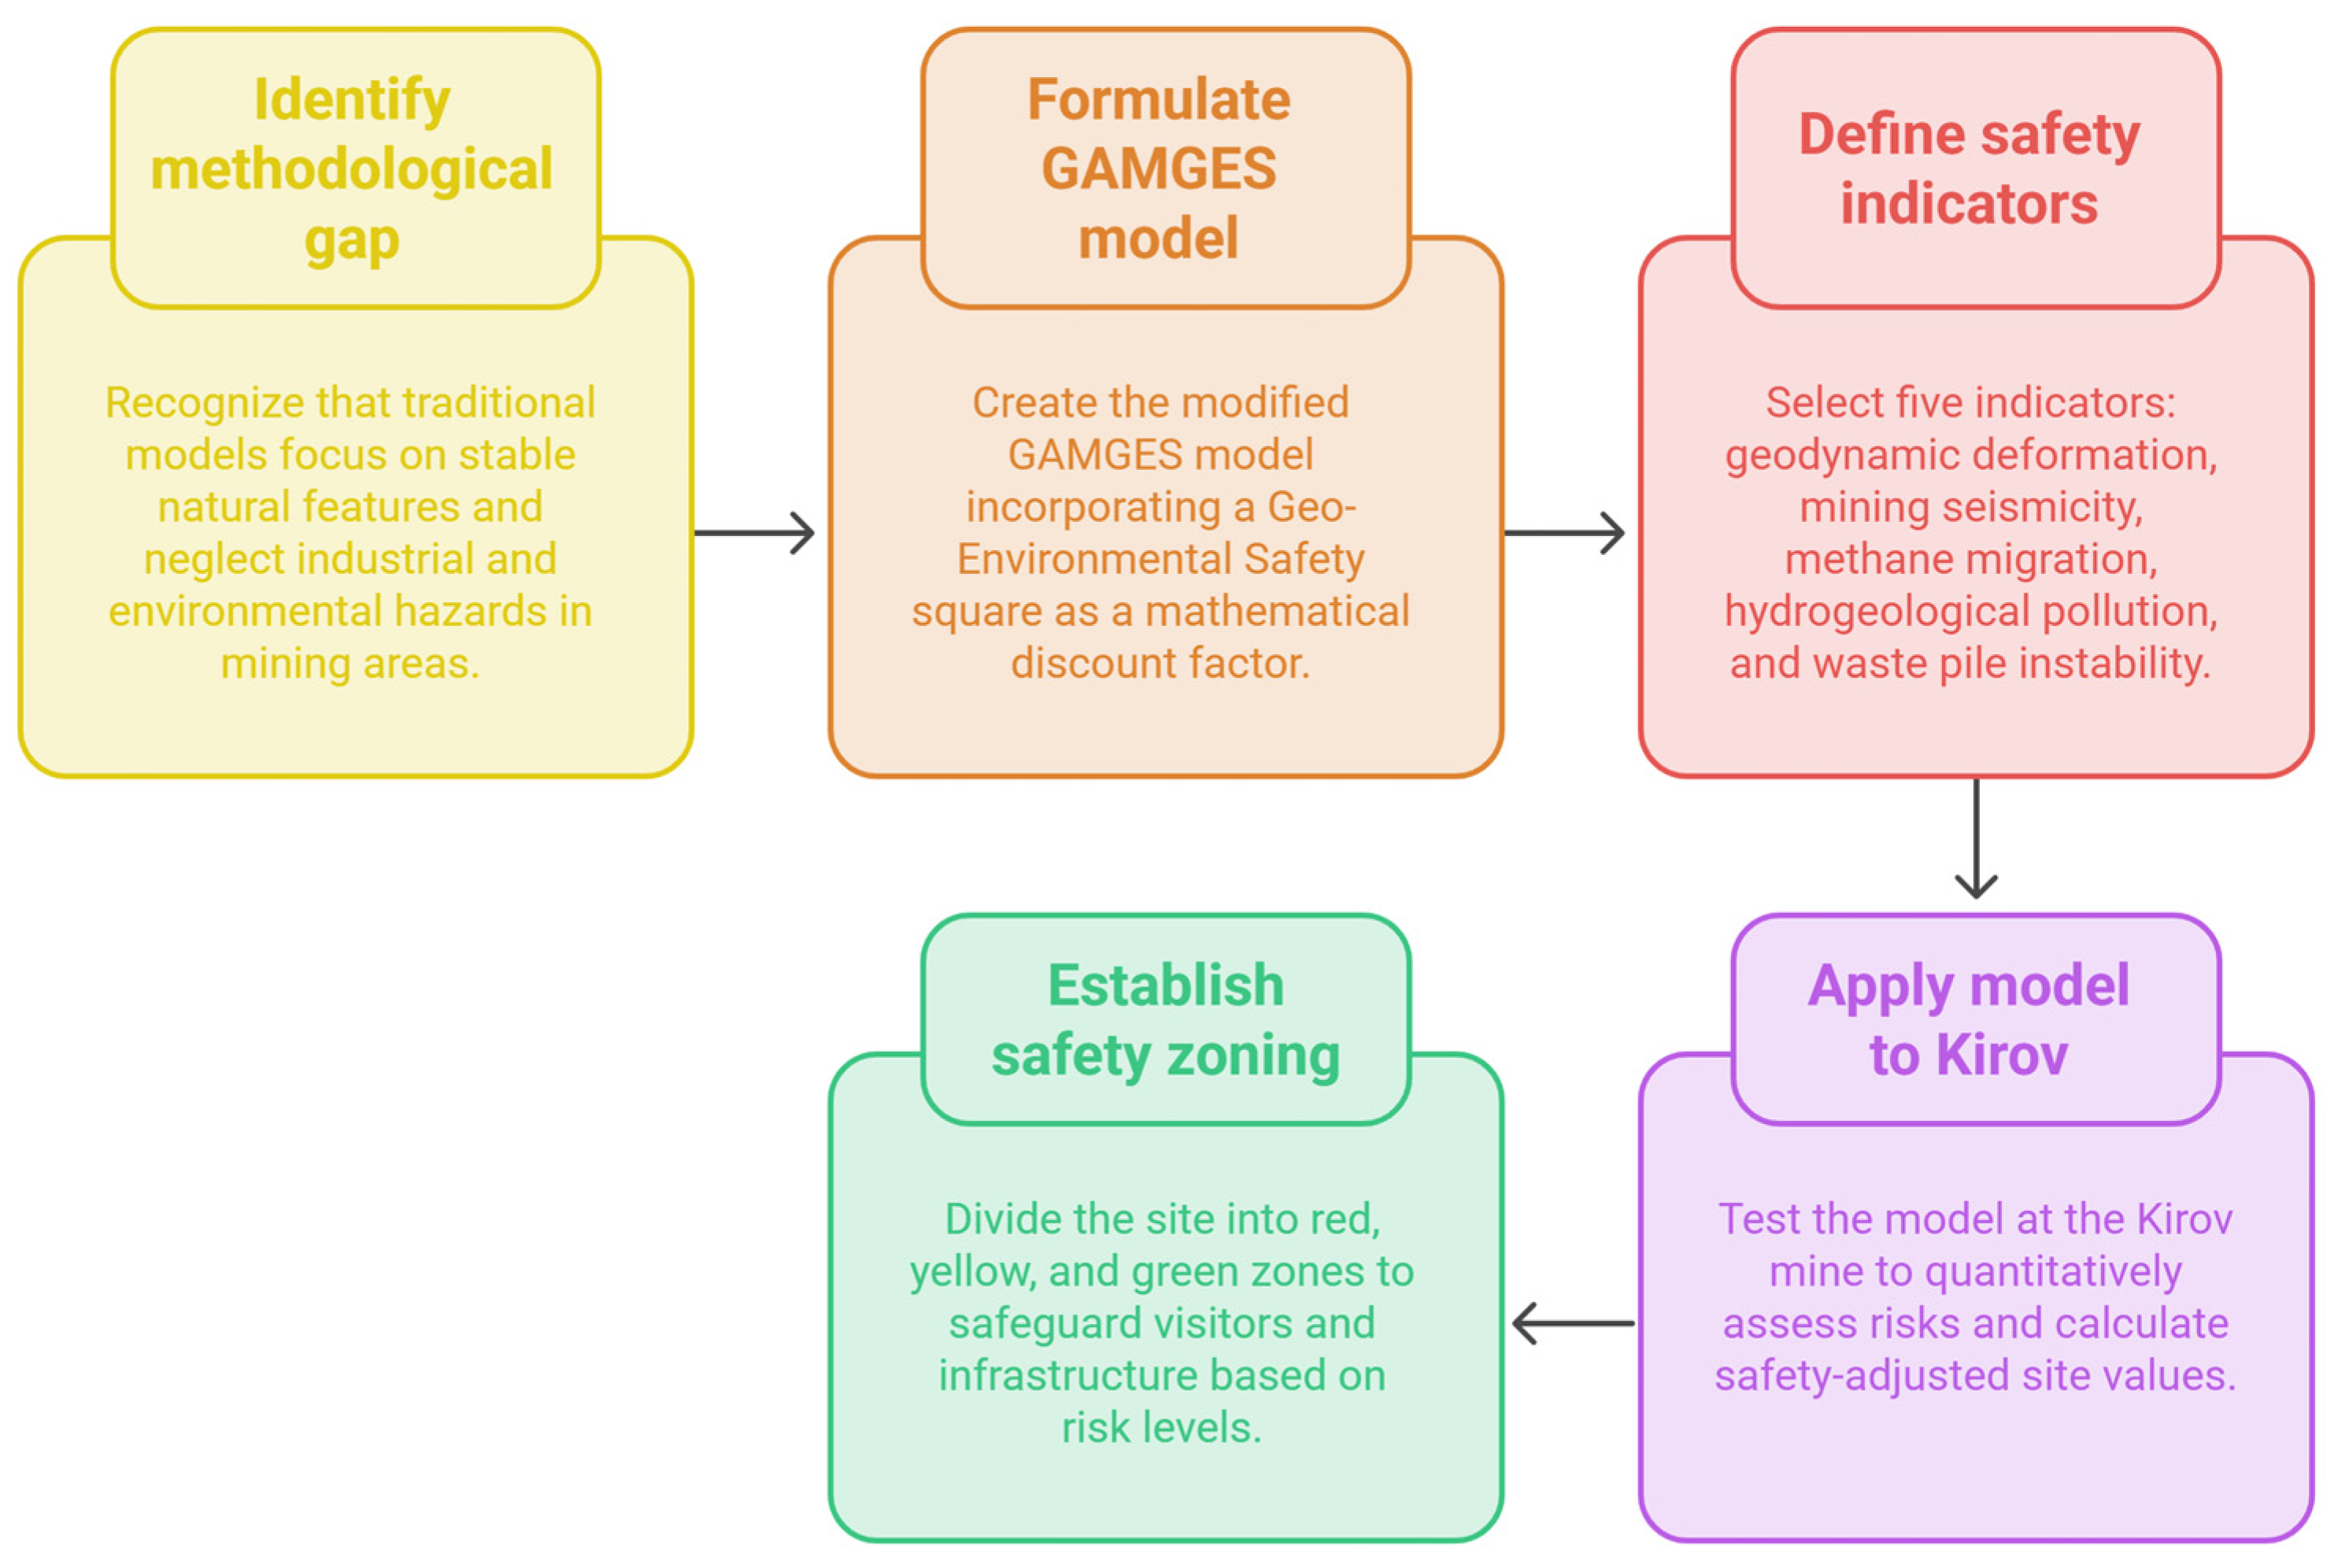
The methodology of this study is based on an integrated assessment framework that aims to measure the potential of geological heritage, taking into account geomechanical and environmental risks, and to study them thoroughly in technological geoparks of mining origin. The research implementation generally follows a sequential workflow of five stages, starting with identifying gaps and formulating the mathematical model, up to experimental field application and the division of spatial safety zones Figure 2.
Figure 2.
Methodological flowchart of the GAMGES framework.
2.1. Theoretical Background and Development of Geological Site Assessment Models
The overall methodology of this research is based on an extensive comparative analysis of scientific publications and quantitative methodologies concerned with the assessment of geological features and potential geopark lands [1,3]. Structural assessment frameworks provide quantitative tools for measuring the tourism potential of geomorphological sites [19]. The literature review represents a systematic comparative analysis of the frameworks, not a systematic literature review based on the PRISMA protocol.
The first step of the research takes the classical geopark assessment model (GAM) as the initial reference model, which integrates indicators into two sets: key values (MV) and additional values (AV) and assesses features using a standardised quantitative scale [1]. The studies apply a geological site assessment model to quantitatively classify terrain characteristics across different regions [20]. The second step of the analysis traces the evolutionary path of this approach by examining the Modified Model (M-GAM), which incorporates the relative importance coefficient of indicators based on actual visitor surveys [11]. Table 1 includes a comparative overview of the evolutionary stages of these methods and approaches over time. A systematic comparison between existing and proposed geoparks provides clear insights for developing evaluation criteria. The ‘very high’ fit assigned to the GAMGES in Table 1 was field and mathematically verified through comparative sensitivity tests using the Kirov Mine database. Fit here refers to the structural ability of the model to handle the associated geomechanical and environmental risk criteria, which field verifications have shown to correctly discount safety risks, risks which remain unrepresented in conventional models.
Table 1.
Comparative characteristics of the stages of development of methods for evaluating geological sites.
The third step involves establishing comparison criteria, examining the parameters of the Brilha methodology, which distinguishes between the scientific value and potential risks of geological site degradation, as well as the conditions for their educational and tourism use [3]. In theory and practice, GAMGES differs fundamentally from the degradation risk (RD) framework established by Brilha [3]. While Brilha’s RD focuses on protecting the geological site itself from external threats, natural erosion, or destruction caused by human activity (i.e., the risk to the geographic site) [3], the GES block in GAMGES measures the active geomechanical and geo-environmental hazards arising from the geo-technological site that directly impact and threaten human life, visitor safety, and park infrastructure [10]. Dynamic mining hazards—such as induced earthquakes (GES2), methane gas transport (GES3), and acid mine discharge (GES4)—not only reduce the integrity of the site’s heritage but also represent catastrophic physical hazards that require a separate safety assessment framework [10,15,16,17]. Quantitative assessment models help in comparing natural sites and setting conservation priorities [21,22]. The fourth step examines the integration of modern trends that consider the spatial variation in indicator weights [13] and employs multi-criteria decision-making methods (MCDM) to develop an objective quantitative ranking of geological sites [14].
2.2. Geomechanical and Environmental Safety (GES) Indicators
To address this methodological gap, the GAMGES incorporates the geomechanical and environmental safety (GES) block [10]. It explains the geotechnical aspects of (GES1 to GES5) in relation to geomechanical deformations, mining-induced seismicity, methane migration, hydrogeological pollution, and mine heap instability. The selection of five GES indicators is based on direct geological hazards in technological and natural environments. Geodynamic deformation (GES1) measures surface fault activity, fault activation, and ground subsidence rates resulting from the collapse of exhausted mining cavities [10]. Mining seismicity (GES2) monitors released seismic energy, rock collapse hazards, and dynamic stress redistribution resulting from blasting and extraction operations [15]. Methane migration (GES3) assesses the movement of mining gases through reactivated tectonic faults via the gas piston phenomenon, which may form explosive gas cavities at the surface [16,17]. Hydrogeological pollution (GES4) assesses groundwater contamination, acid mine discharge (AMD), and transfer of toxic elements into water systems [15]. Waste pile and waste rock instability (GES5) assesses slope instability, spread of toxic dust, and leaching of heavy metals from waste piles [18].
To reduce subjective assessments in the field and standardise risk measurement, a quantitative three-tiered rating system (0, 0.5, 1) was adopted in accordance with established geological heritage assessment frameworks [1,3]. A detailed explanation of the quantitative values 0, 0.5 and 1 and their relationship to the physical thresholds of risk is provided below:
- 0 (None/Neglected Risk): Geological hazard is non-existent, stable, or under continuous monitoring without any recorded activity.
- 0.5 (Moderate/Indirect Risk): Latent or localised hazard present, requiring secondary engineering containment and restriction of visitor movement.
- 1 (High/Immediate Risk): Active, uncontained physical or chemical hazard posing an immediate threat, requiring the imposition of complete no-entry zones.
For spatial safety zoning, the three GES categories were grouped using the maximum observed hazard category within each spatial assessment unit. A unit was designated red (high risk/prohibited) when at least one GES indicator was assigned a score of 1, yellow (temporary/moderate risk) when the maximum GES score was 0.5 and no indicator was assigned a score of 1, and green (low risk/safe use) when all GES indicators were assigned a score of 0 under the specified monitoring conditions. The resulting categories were spatially integrated into (QGIS version 3.34, QGIS Association, Zurich, Switzerland) to produce the final GAMGES zoning map. Table 2 clearly demonstrates the methodological shortcomings of previous models in monitoring environmental and geomechanical risks and the superiority of the proposed model in bridging this gap [10]. Furthermore, the GAMGES differs structurally from GIS-MCDM approaches [13,14]. While GIS-MCDM models typically treat environmental criteria as fixed layers of spatial suitability or land-use constraints [13,14], the GAMGES incorporates the GES term as an explicit mathematical discount factor. By assigning a dominant multiplier weight (WGES = 2), the model imposes a mathematical penalty mechanism: severe geomechanical instability leads to the downgrading or outright exclusion of an unsafe site, regardless of how high its scores are in intrinsic scientific (MV) or aesthetic (AV) values [1,3,10].
Table 2.
Comparative evaluation of the extent to which indicator sets are represented in different evaluation models.
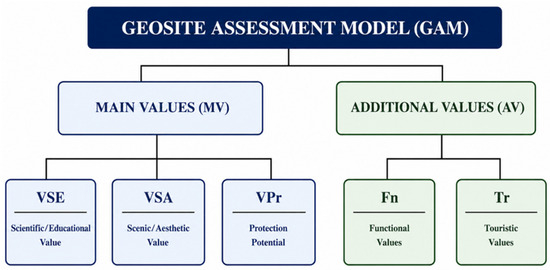
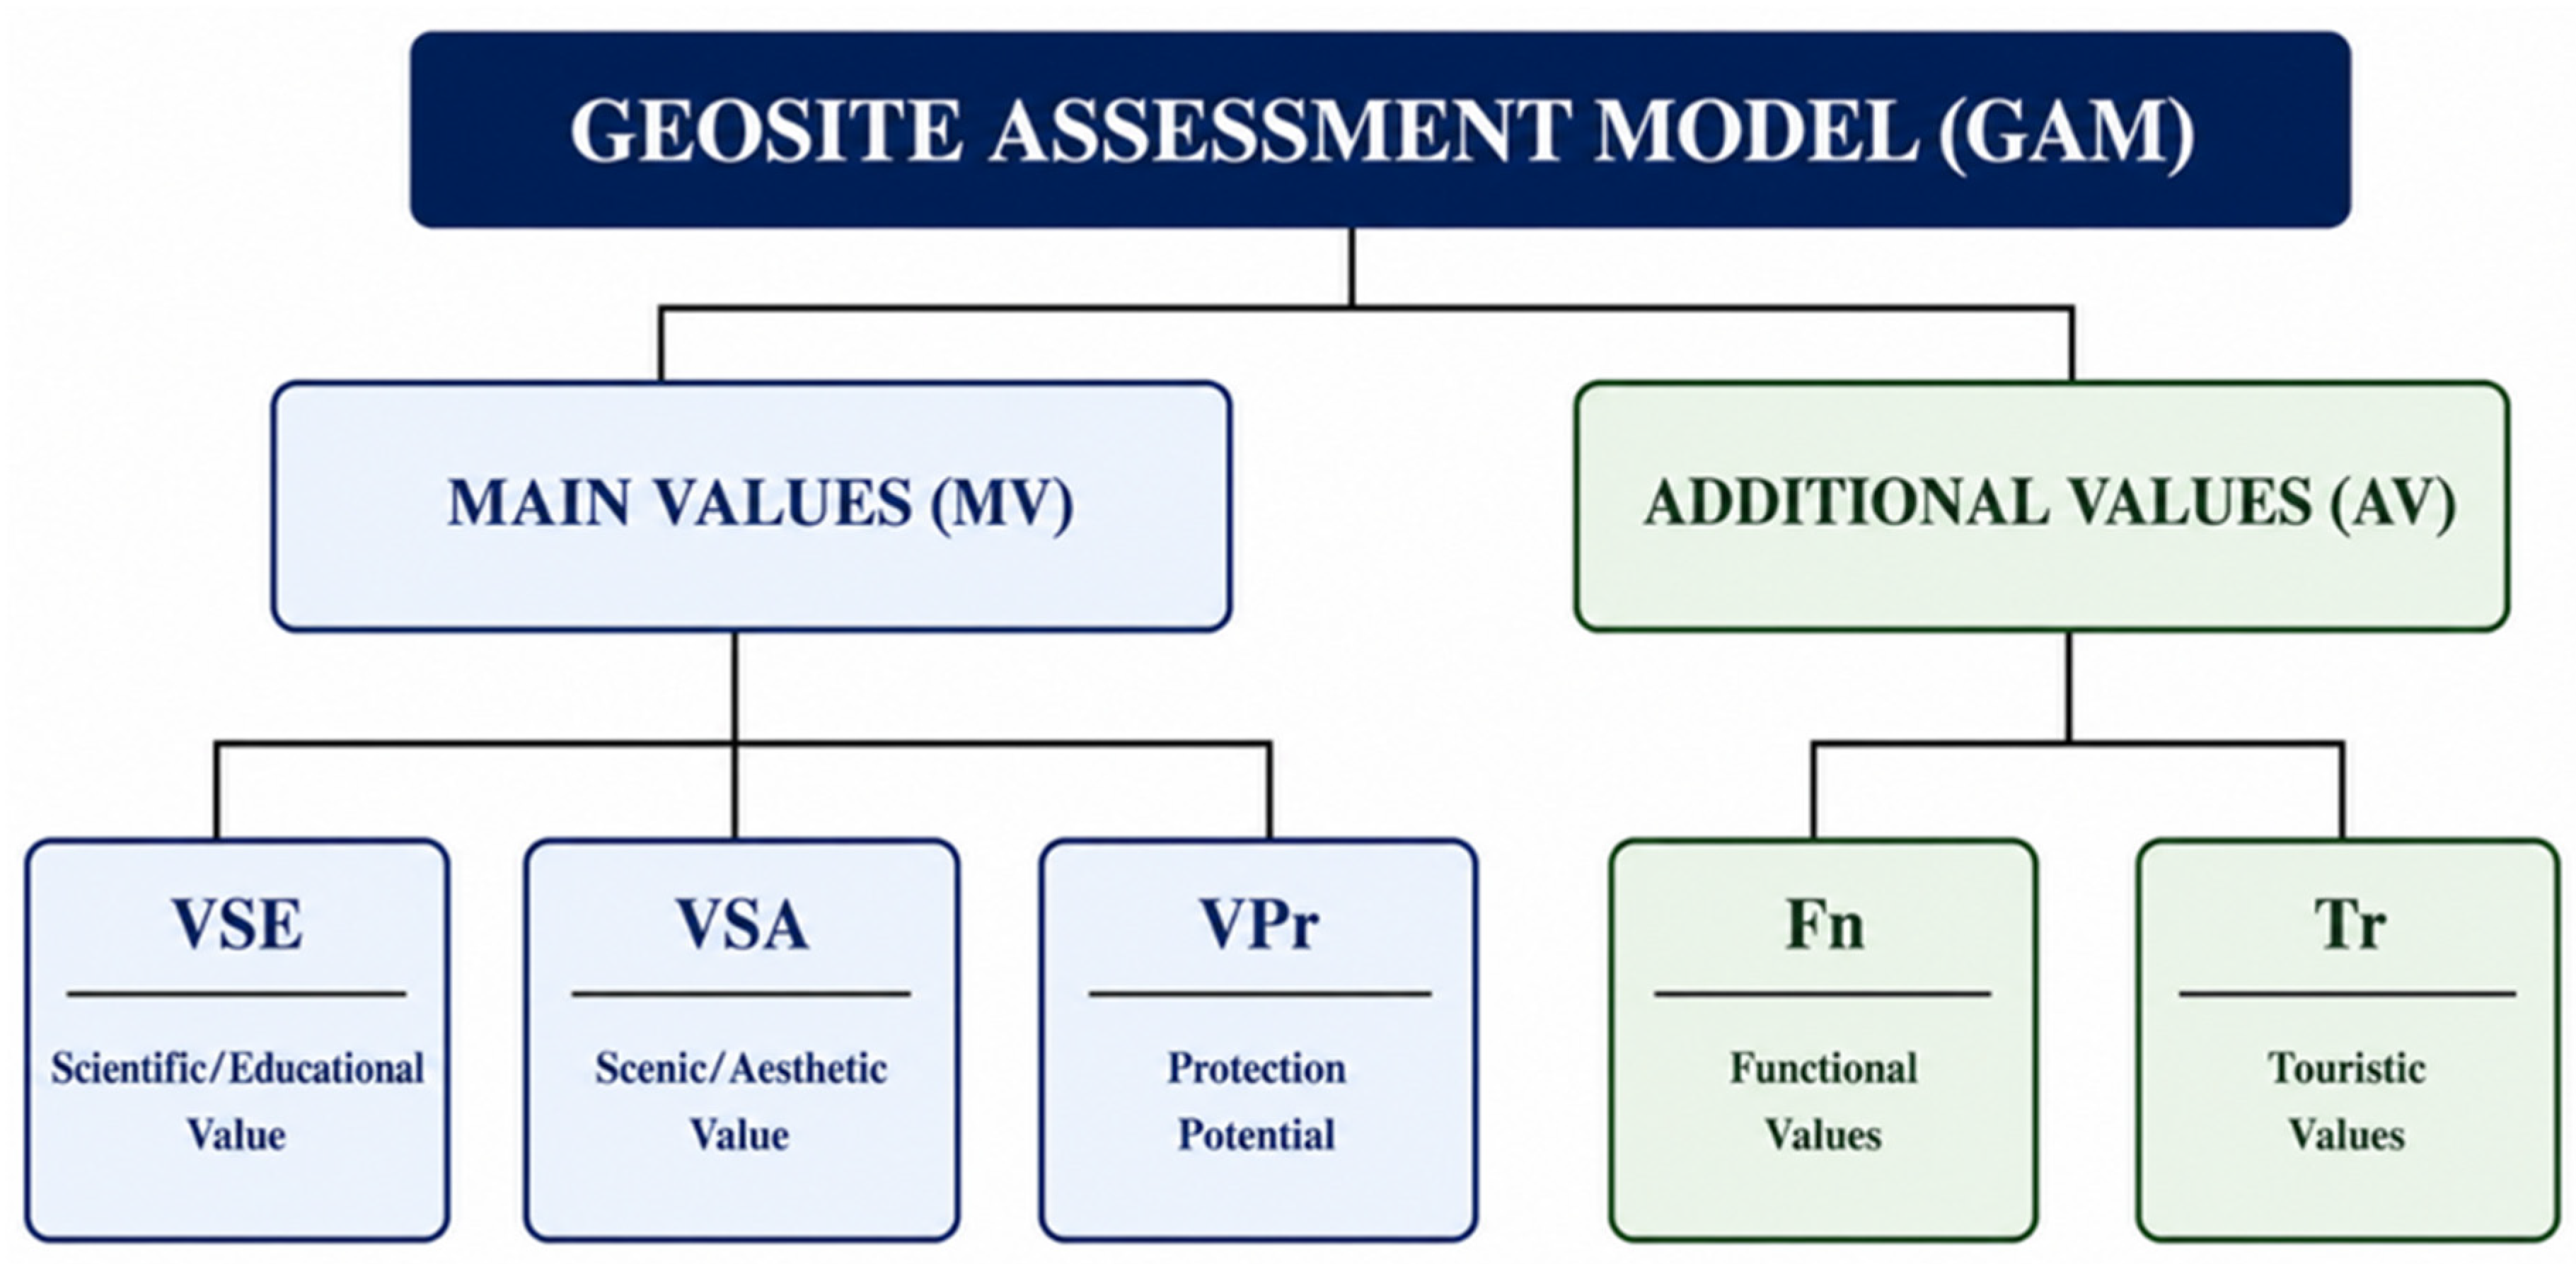
Based on the methodological limitations discovered in excluding environmental risks from the structure of traditional models, as visually illustrated in Figure 3 [1], a development path was identified towards creating a hybrid model that bridges this application gap to determine the suitability of current models for application in technological and industrial areas within mining regions [10].
Figure 3.
The structural and logical framework of the original classical GAM [1].
2.3. The Mathematical Structure of the GAMGES
To address this deficiency, the research presents the modified mathematical structure under the name of the geo-environmental assessment model (GAMGES) to integrate environmental and geodynamic safety determinants into the calculation of the actual total value of the site according to the following equation.
where GESi represents the field-assessed score of the ith geo-environmental safety indicator, Wi is the calibrated weighting factor of the GES index i (∑Wi = 1), and WGES is the global geo-environmental safety penalty multiplier, which was set to 2 in this study. Therefore, the GES discount applied in the final calculation is WGES × ∑(Wi × GESi). The symbol (GAMGES) represents the overall value of the modified geoecological site. The variable (MV) represents the sum of the principal value indices [1,3], and the variable (AV) represents the sum of the additional value indices [1,3]. To achieve rigorous scientific validation, reliability, and superiority over current geological heritage assessment frameworks, the GAMGES systematically overcomes a major structural flaw found in conventional models (such as GAM and M-GAM). Conventional models operate under an implicit assumption of absolute geomechanical stability, rendering them mathematically incapable of addressing the active or latent dynamic hazards inherent in technological mining environments. The scientific validation of the GAMGES follows a systematic protocol consisting of four steps:
- Theoretical formulation: Incorporating the geo-environmental safety factor (GES) not merely as an additional metric, but as an empirical discount factor that dynamically reduces the overall suitability score based on the intensity of active hazards.
- Empirical calibration: Directly calibrating the model outputs with field geotechnical measurement data, including surface deformation rates, stress diagrams, and mine subsidence parameters.
- Reproducibility: Standardising data collection protocols across disparate geological frameworks to eliminate subjective estimation bias.
- Comparative validation: Demonstrating, through validated parallel frameworks, that the GAMGES successfully prevents the classification of aesthetically pleasing but geotechnically unstable mining sites as safe areas for tourism development.
The aggregated GES term represents the weighted sum of the five geo-environmental safety indicators and is calculated as follows ∑(Wi × GESi). Mathematically, the value of GAMGES can take a negative value if the applied safety penalty (WGES · GES) exceeds the sum of the original heritage and functional points (MV + AV). A negative value for GAMGES has a profound spatial planning significance: it classifies the site as a ‘critical/prohibited hazard zone’ where acute operational hazards, such as active fault displacement and accumulation of untreated gases, prevail and make the site completely unsafe for general geotourism regardless of its scientific or aesthetic value, thus requiring a complete ban or prior engineering reclamation.
To rigorously address model uncertainty, evaluation variability, and expert self-deviation, a three-stage validation protocol was implemented:
- Expert evaluation and inter-rater consistency reliability: A multidisciplinary panel of 12 experts in mineral geodynamics, engineering geology, and geological heritage independently evaluated the indicators. Inter-rater agreement was statistically validated using the Kendall concordance coefficient (W = 0.86, p < 0.001), confirming high consistency among the evaluations.
- Univariate sensitivity analysis (OAT): Sensitivity testing was performed by varying the weights of individual inputs (Wi) within a range of 50% of their baseline values while holding other parameters constant. Particular emphasis was placed on changing the weight of WGES from 0.5 to 2.5.
- Uncertainty quantification and ranking stability: The analysis confirmed that the ranking of the sites remained highly stable (rank correlation coefficient Rs > 0.91), demonstrating low variability and elasticity. Statistical analysis of the paired model results. To assess whether incorporating the GES penalty systematically altered the evaluation outcomes, a paired expert evaluation design was implemented. The statistical unit was the individual expert, and twelve experts (N = 12) participated in the paired evaluation. Each expert independently evaluated the same evaluation framework using both the reference GAM formula and the proposed GAMGES formula, generating a single paired GAM–GAMGES observation. For expert i, the paired difference was calculated as follows:
The research adopts a three-tiered quantitative scale that assigns a score of (0) when there is no hazard, a score of (0.5) when there is a moderate or indirect hazard, and a score of (1) when a direct hazard is detected that threatens the safety of the site and visitors [10]. The selection, weighting, and scoring of the five geo-environmental safety indicators (GES1 to GES5) were developed step-by-step to reflect geological mining dynamics and engineering safety principles:
- Classification of Indicators: The five GES indices were selected from critical mining risk areas identified in the geotechnical literature Table 3.
- Rationale for Differential Weighting: Equal evaluation was deliberately rejected because human safety determinants structurally outweigh aesthetic features and secondary infrastructure at active or abandoned mining sites. Based on Multi-Criteria Decision Analysis (MCDA) and expert hierarchy, the weighting coefficients were determined as follows: scientific/educational value WVSE = 1, aesthetic value WVSA = 0.5, protection condition WProt = 1, additional values WAV = 0.25, and geo-environmental safety WGES = 2. The assigned multiplier weight (WGES = 2) creates a mathematical dominance that ensures severe geotechnical hazards significantly reduce the overall suitability score.
- Quantitative Scoring System: The indicators were assessed on the three-level safety scale (0, 0.5, 1) defined in Section 2.2. according to the following equation:
Table 3.
Overall operational standards, instrumentation, and quantitative category limits for GESs.
Table 4.
Relative weights and evaluation coefficients for the Geomechanical and Environmental Safety (GES) square.
3. Results and Discussion
Applying the GAMGES framework resulted in a systematic decrease in the scores of the evaluated sites compared to their corresponding reference GAM scores. Inferential statistical analysis was performed using 12 expert-level paired observations (N = 12), with each expert treated as a statistical unit. Each expert contributed one paired evaluation consisting of a reference GAM score and its corresponding GAMGES score. For each expert, the paired difference was defined as Di = GAMi − GAMGESi, where positive values indicate a decrease in the final score after applying the GES discount. Because the paired differences were not assumed to follow a normal distribution, the two-sided Wilcoxon signed-rank test was applied. The analysis yielded a Wilcoxon signed-rank statistic of W = 9, a standardised Z-value of Z = −2.31, and a two-sided p-value of p = 0.021, calculated using the normal approximation with continuity correction. Since the p-value was less than 0.05, the decrease in GAMGES scores was considered statistically significant at the predefined significance level α = 0.05. Table 5 presents descriptive results at the sector level, while the Wilcoxon signed-rank test was performed on the entire set of 12 paired expert assessments. Both analyses use the same final formula for the GAMGES, defined in Equation (1).
Table 5.
A quantitative and descriptive comparison of the results of the classical GAM, M-GAM and GAMGES appraisal models across the appraisal sectors of the Kirov Mine.
The inferential analysis was deliberately separated from the descriptive analysis results at the segment level. The four evaluation segments were used to illustrate the spatial and numerical distribution of the GAM and GAMGES values, while the Wilcoxon signed-rank test used the twelve paired expert-level evaluations as statistical units. This design preserves the paired nature of the expert evaluations and avoids treating individual segments as independent statistical samples.
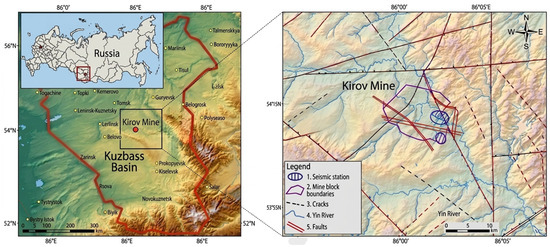
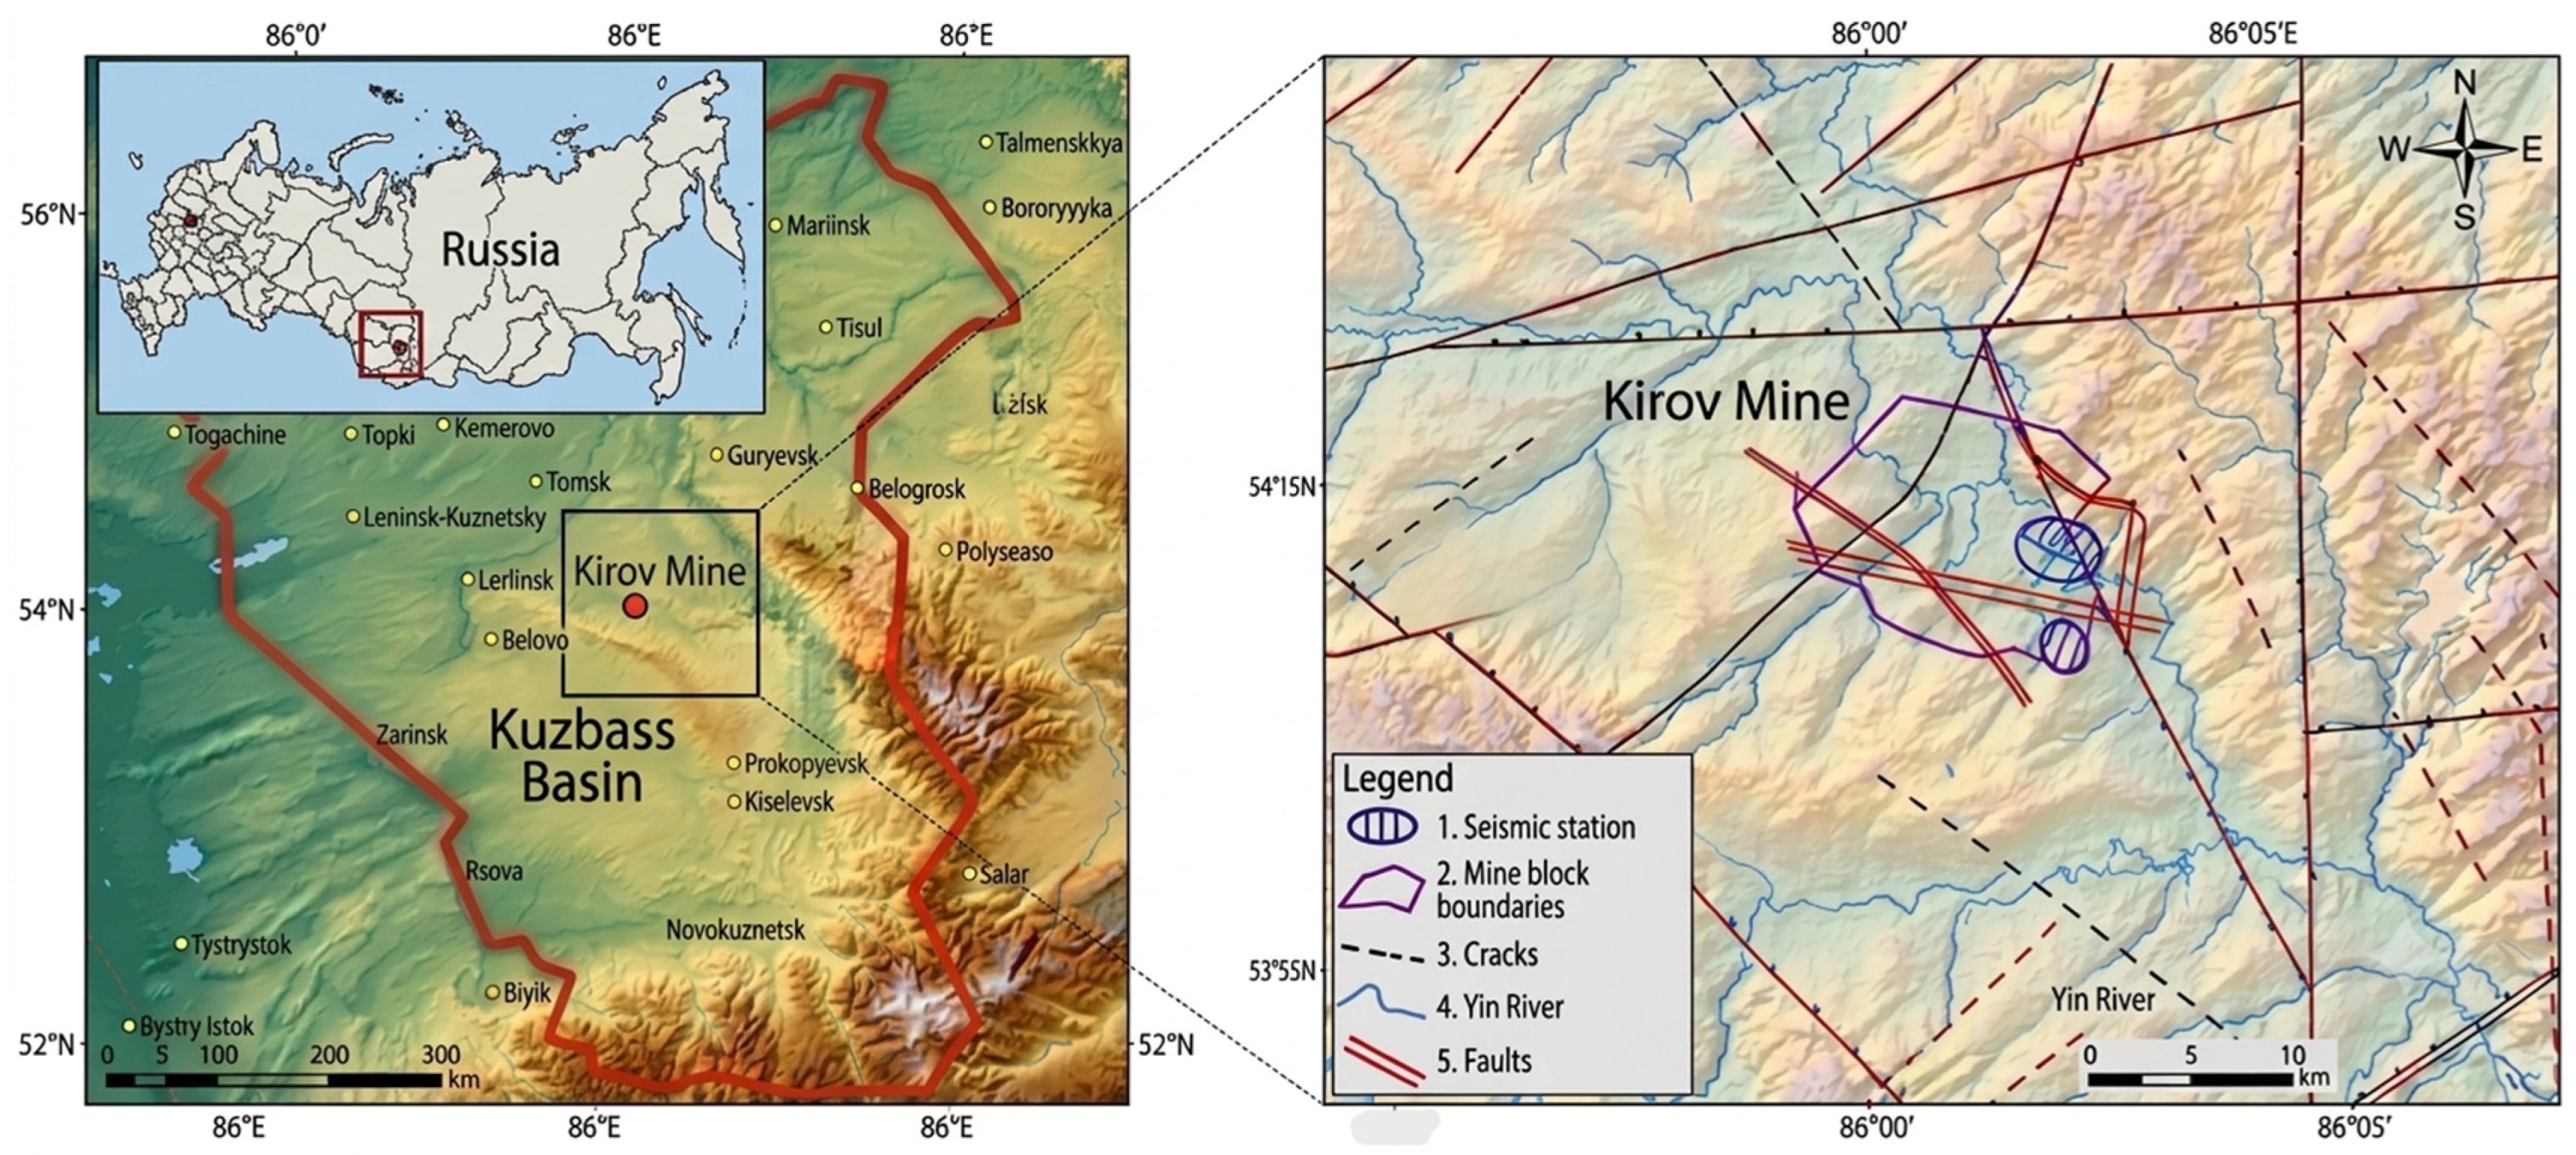
The spatial and cartographic data shown in Figure 4 reveal the complex tectonic and geodynamic characteristics of the Kirov Mine area in the Kuzbass Basin. Geologically and geographically located in the central part of the Kuzbass coal basin (Kemerovo Oblast, Western Siberia, Russia; coordinates: 54°40′ N, 86°00′ E), the Kirov Mine is one of the most tectonically active underground mining fields in Eurasia [16,17]. The site lies within a complex system of faults and blocks, surrounded by active regional thrust faults, and intersects the Yin River hydrogeological network [16]. Long-term intensive underground mining at depths exceeding 400 m has led to significant stress redistribution, resulting in fault reactivation, severe surface faulting, continuous migration of methane gas through disturbed strata, and frequent occurrence of induced microearthquakes (Mw = 1.5 to 2.8) [15,16,17]. Figure 4 shows the multiscale spatial location of the Kirov Mine within the Russian Federation, its regional location within the Kuzbass coal basin, and a detailed local structural geological map showing major faults, active fractures, and seismic monitoring matrices.
Figure 4.
Geodynamic zones and areas of seismic activity at the Kirov Mine in Kuzbass.
To demonstrate the generalizability and cross-regional applicability of the GAMGES across diverse geomechanical environments, a comparative multi-case study was conducted to evaluate two deep mining sites exhibiting intense geodynamic activity: the Kirov Mine (Kuzbass, Russia) and the Huafeng Mine (Shandong, China) [23]. This comparative application highlights the added practical value of the GAMGES compared to existing frameworks [1,3,11]. Under standard models, both Kirov and Huafeng receive very high suitability scores due to their sparse industrial heritage and rugged terrain [1,11]. However, the GAMGES successfully isolates critical hazard zones such as the active rock fissures in Huafeng and the methane gas leak from the fault in Kirov, which were combined through the weighted GES term and the global penalty multiplier, mathematically lowering their overall score to reflect the actual, safety-adjusted feasibility [10,16,23]. This quantitative penalty translates directly into actionable zoning maps for park planners, demonstrating the model’s outstanding operational utility in high-risk technological environments.
- Geomechanical Characterisation of Sites: At the Huafeng Mine, extraction at depths exceeding 700 m resulted in severe rock bursts, seismic energy emissions of 107 J, and major surface faults (greater than 5 m wide and exceeding 11 m deep). In contrast, the Kirov Mine showed reactivation of deep tectonic faults accompanied by continuous methane leakage and micro-seismicity.
- Comparative Benchmarking Evaluation: Both sites recorded high Geological Heritage and Scientific Value (VSE = 3.5 for the Huafeng mine; VSE = 3 for the Kirov Mine). However, severe surface fractures and rock blast hazards at Huafeng resulted in a decrease in the safety rating from 11.5 to 11.1, which is equivalent to a total penalty of 0.4 in the GAMGES. As for Kirov, the corresponding decrease from 8.50 to 7.32 represents a total safety penalty of 1.18, reflecting the combined weighted contributions of GES1 to GES5.
- Mathematical Model Outputs: Applying the GAMGES weighting algorithm resulted in a lower adjusted final suitability score for the Kirov Mine (7.32) compared to the Huafeng mine (11.1). For the Kirov Mine, the weighted GES contribution was 0.59, and the corresponding global safety penalty was 1.18. This penalty reflects the combined contributions of methane migration (GES3 = 1), active fault displacement (GES1 = 0.5), and mining seismic activity (GES2 = 0.5), in addition to the weighted contributions of GES4 and GES5.
This comparative application confirms that the GAMGES accurately characterises site suitability based on actual geomechanical risk factors, demonstrating its overall operational validity across diverse international mining geoparks. A critical evaluation of the GAMGES framework reveals clear methodological advantages and functional limitations compared to classical models (GAM, M-GAM, and Brilha) [1,3,11]. While traditional frameworks excel at confining intrinsic scientific attractiveness to undisturbed natural geological sites [1,11], they suffer from a methodological weakness when applied to industrial mining landscapes, where they fail to penalise mathematically active geomechanical hazards [10]. GAMGES overcomes this problem by incorporating the GES module as an empirical discount factor. However, the model suffers from specific operational limitations: it relies heavily on high-resolution geotechnical field data (such as continuous seismic monitoring, gas chromatography, and telemetry), which may not be readily available in resource-limited areas [15,16]. Furthermore, spatial uncertainty and potential bias in expert evaluation during parameter weighting have been identified [14]. These problems were mitigated precisely in this study using AHP consistency tests (CR = 0.042) and evaluator agreement measures (W = 0.86). Consequently, GAMGES is best suited to active, transitional, or abandoned deep mining sites undergoing technical geological transformation, whereas its application to highly stable and natural geological sites is unnecessary and may add unnecessary analytical complexity. The generalizability of the GAMGES becomes even more apparent when comparing the quantitative outputs of the Kirov Mine with those calculated for the Huafeng Mine [23], as shown in Table 6. For the Kirov Mine, the classic reference GAM value used in the final comparison is 8.50, which corresponds to the detailed calculation given in Table 7.
Table 6.
Comparative evaluation of the traditional GAM and the GAMGES developed across international test sites.
Table 7.
Detailed numerical evaluation and comparative scoring calculations for a case study of the Kirov Mine.
Figure 4 illustrates the distribution of geodynamic zones and areas of seismic activity surrounding the mine, clearly highlighting block boundaries, active tectonic fault networks, and cracks extending across the area. The spatial diagram also shows the positioning of seismic monitoring stations dedicated to monitoring the intense tremors resulting from mining activities, in addition to the hydrogeological path of the Yin River, which represents the main water artery threatened by the surrounding technological activities.
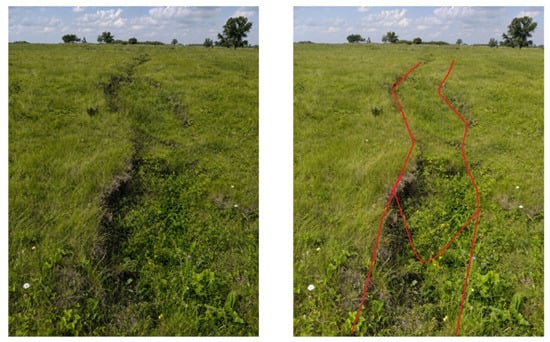
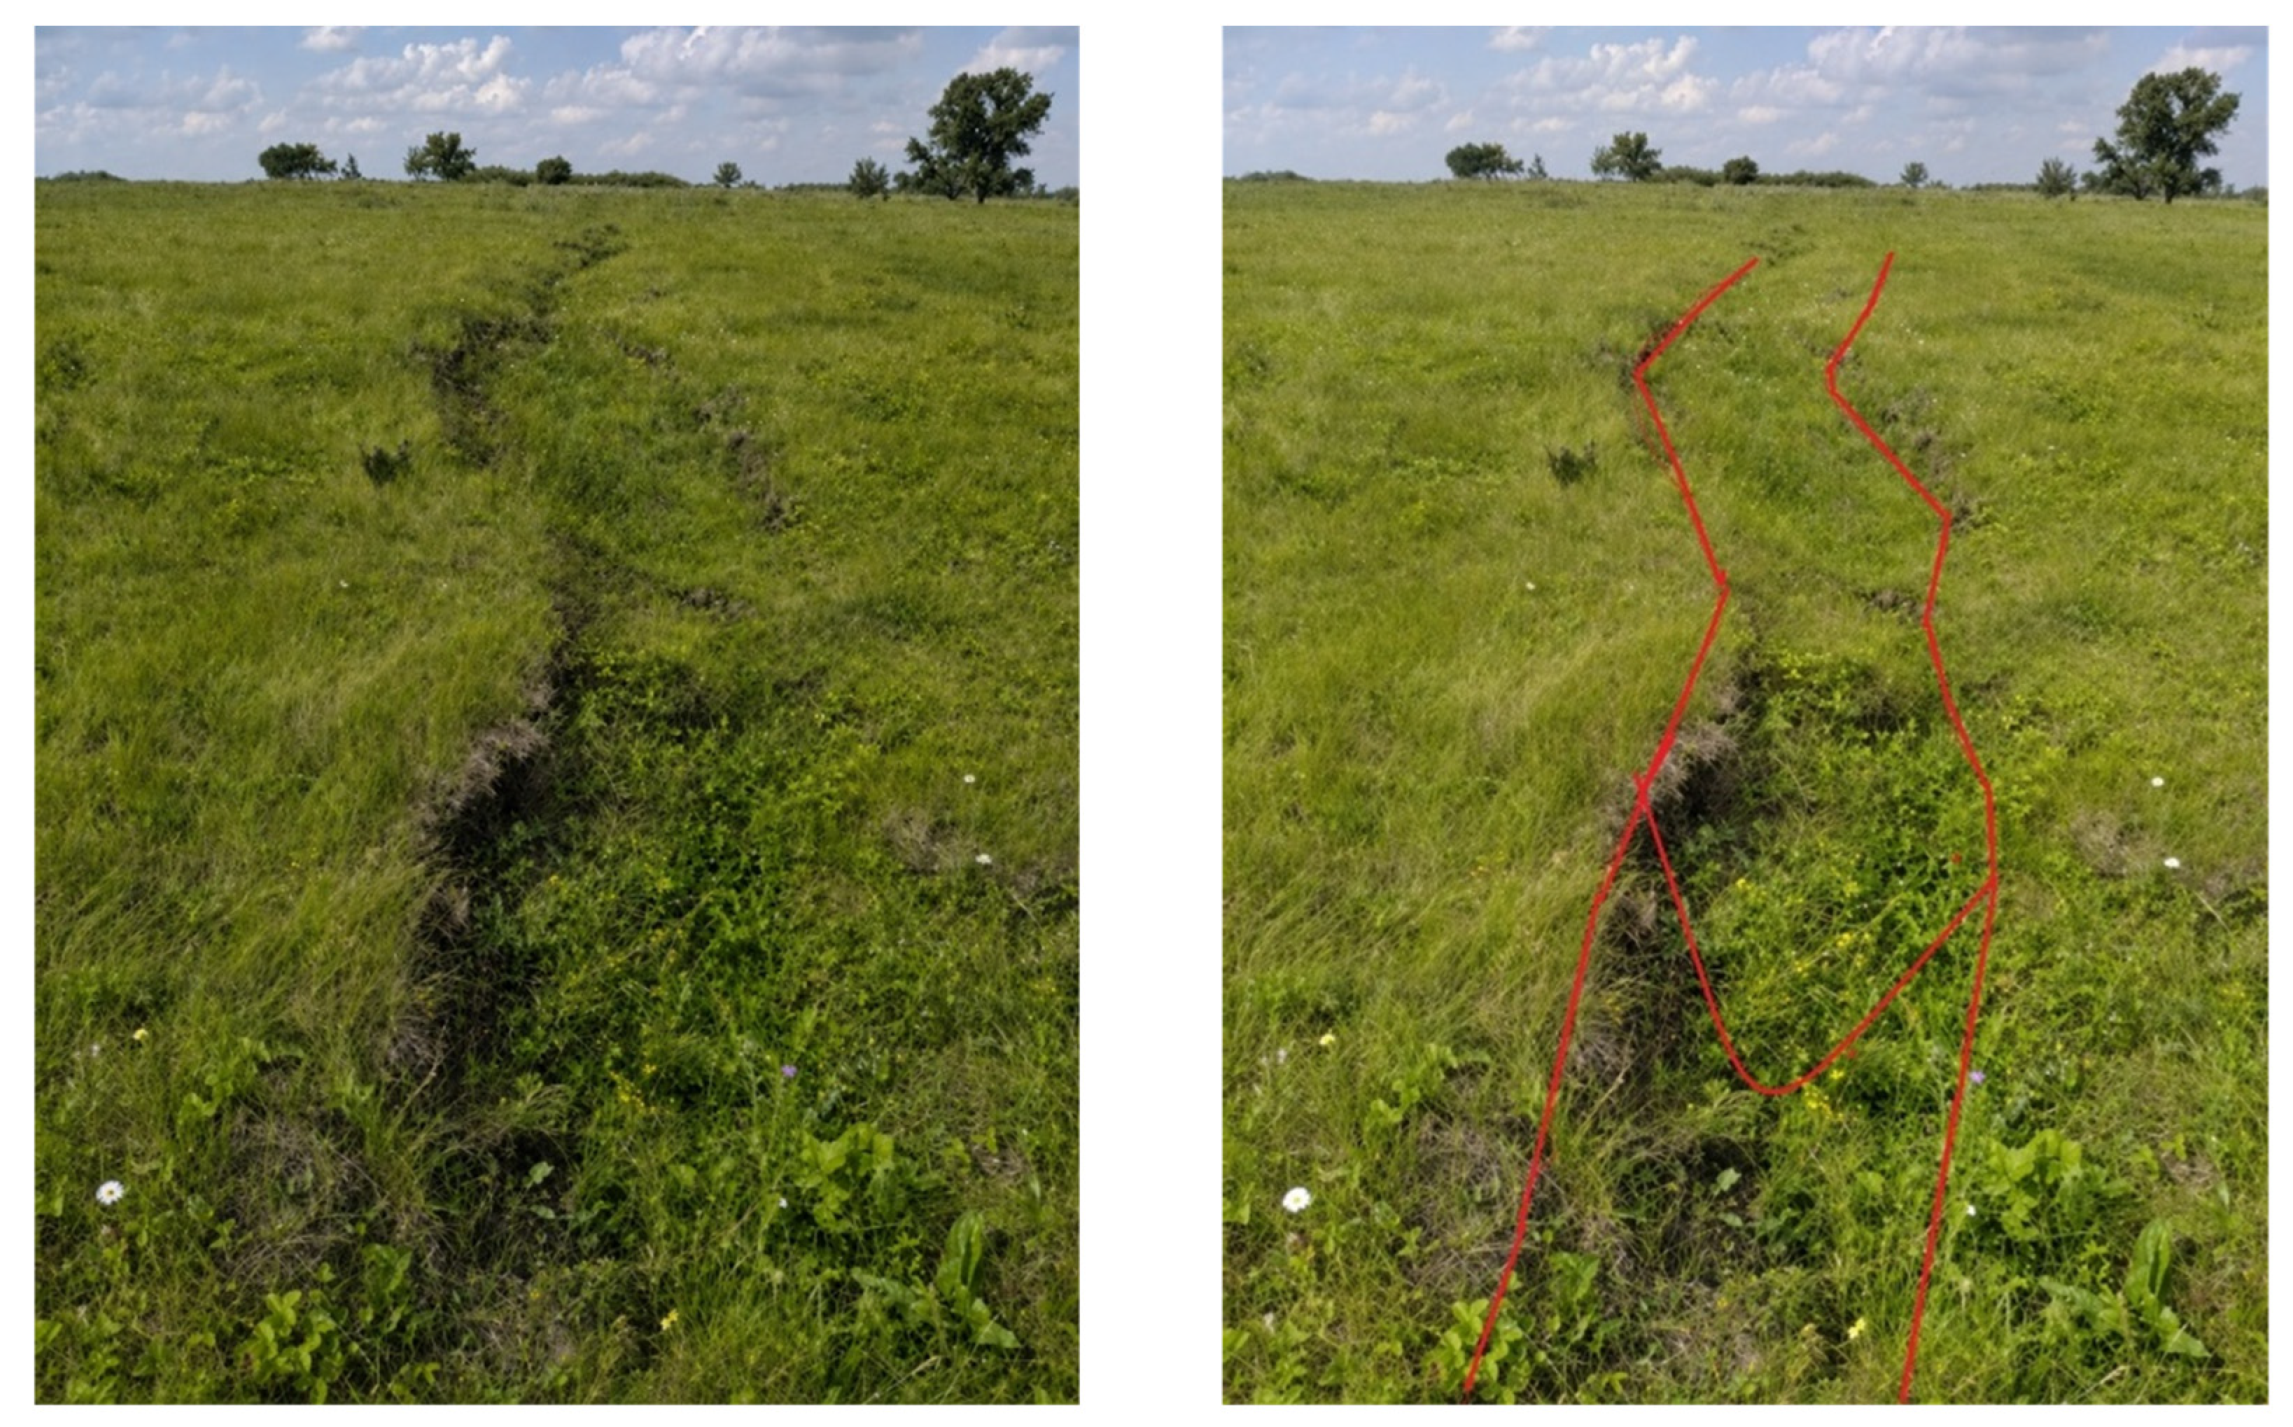
At the field geotechnical level, Figure 4 documents the direct physical impacts of mining activities on the site’s surface crust. The actual field images, outlined in red in Figure 5, show the prevalence of surface cracks and areas of subsidence extending across the vegetation above the excavation areas. The design of the slope monitoring system ensures the tracking of geomechanical hazards to protect mining facilities and workers [24]. These structural fractures result from the instability of the rock masses and the subsidence of the ceilings of the spent underground mining cavities, posing a direct threat to the safety of the proposed tourist facilities. This necessitates linking the assessment to continuous slope stability monitoring systems and integrating the elements of the “mining site, rock matrix, and technology” system to ensure the soundness of the engineering foundation. Site geotechnical records from the Kirov Mine Geotechnical Department (2024) confirm that the surface cracks documented in Figure 5 are directly related to underground extraction in the panels of the longwall [25,26]. The primary deformation mechanism involves roof collapse in the extracted gaps, causing upward propagation of stress-relieving fractures through the thin topsoil layers (180–220 m depth), intersecting with active block faults [25,26]. Continuous monitoring using automated swell gauges and slope monitoring systems recorded horizontal tensile stresses exceeding 8.5 mm/m, which is well above the critical limit for soil cracking (2 mm/m) [23].
Figure 5.
Surface cracks and subsidence from the surface in mine Kirov.
In addition to visible geomechanical deformations, physical investigations reveal invisible gaseous and chemical environmental hazards that affect the site’s overall value.
To ensure full transparency and mathematical reproducibility, Table 7 provides the distribution of detailed numerical scores for the Kirov Mine case study, with raw scores compared across the main values (MV), additional values (AV), and geomechanical and environmental safety indicators (GES), along with comparative output scores calculated across the classical GAM and M-GAM frameworks [1,11]. For the M-GAM comparison, visitor significance (Im) coefficients were applied according to the original M-GAM methodology [11]; the detailed coefficient values and their corresponding weighted contributions are not part of the GAMGES calculation and are therefore reported separately from the proposed GAMGES formulation.
As shown in Table 7, the Kirov Mine achieved a classical GAM score of 8.50 and an M-GAM score of 12.80. The classical GAM score was calculated using the equation MV + AV = 6.75 + 1.75 = 8.50. In contrast, the GAMGES applies a weighted GES discount: WGES × ∑(Wi × GESi) = 2 × 0.59 = 1.18, reducing the final suitability score to 7.32. This numerical reduction reflects the combined contribution of identified geomechanical and environmental hazards, including methane migration (GES3 = 1) and active faults (GES1 = 0.5).
Studies have demonstrated the continuous migration of methane gas from deep layers to the surface through active tectonic fractures and faults, as illustrated in the map. This migration leads to the “Migrating Mine Gas Piston Effect,” which increases the likelihood of the formation of hazardous, potentially explosive gas pockets, necessitating a rigorous systemic approach to gas risk mitigation. Evidence of gas accumulation in the proposed geotourism area is confirmed in the field through soil gas surveys and monitoring data collected in August 2025. Portable flame ionisation detectors (FIDs, TVA2020 Toxic Vapor Analyzer, Thermo Fisher Scientific Inc., Waltham, MA, USA) and flow chamber measurements along the surface trace of the F-3 fault recorded local methane emissions ranging from 1.8% to 3.2% v/v at near-surface levels (depth of 0.5–1.2 m) [27,28]. These concentrations exceed the standard safety limit (0.5%), confirming that fault reactivation creates local gas accumulation pockets directly beneath the planned tourist trails [29]. Furthermore, geochemical analyses of the rock dumps and mining waste at the site reveal high mobility of macro- and microelements, threatening the contamination of surrounding waterways and the Yin River through the leaching of pollutants via regional hydrogeological drainage networks. The geochemical assessment included ICP-MS analysis (Agilent 7900 ICP-MS, Agilent Technologies Inc., Santa Clara, CA, USA) of N = 15 samples of stacked tailings and N = 6 samples of surface water collected along the Yin River. Filtration tests (EPA Method 1311) showed high mobility of heavy metals: the average dissolved iron (Fe) was 4.2 mg/L (exceeding the permissible limit by 14 times), manganese (Mn) was 0.8 mg/L (8 times the limit), and sulfate (SO42−) was 850 mg/L, with a discharge acidity of pH = 4.8. These analytical results quantify the hydrogeological pollution hazards incorporated into the GES4 index.
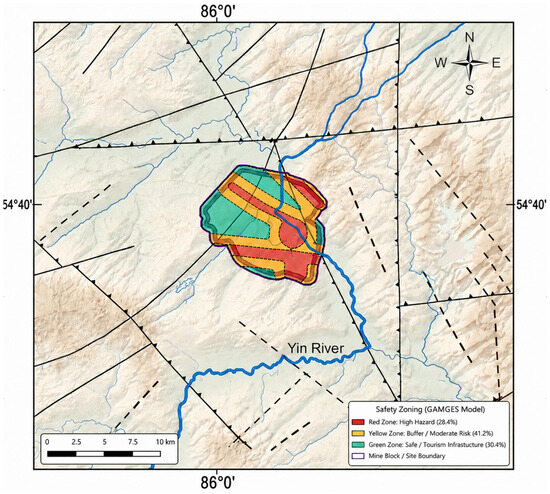
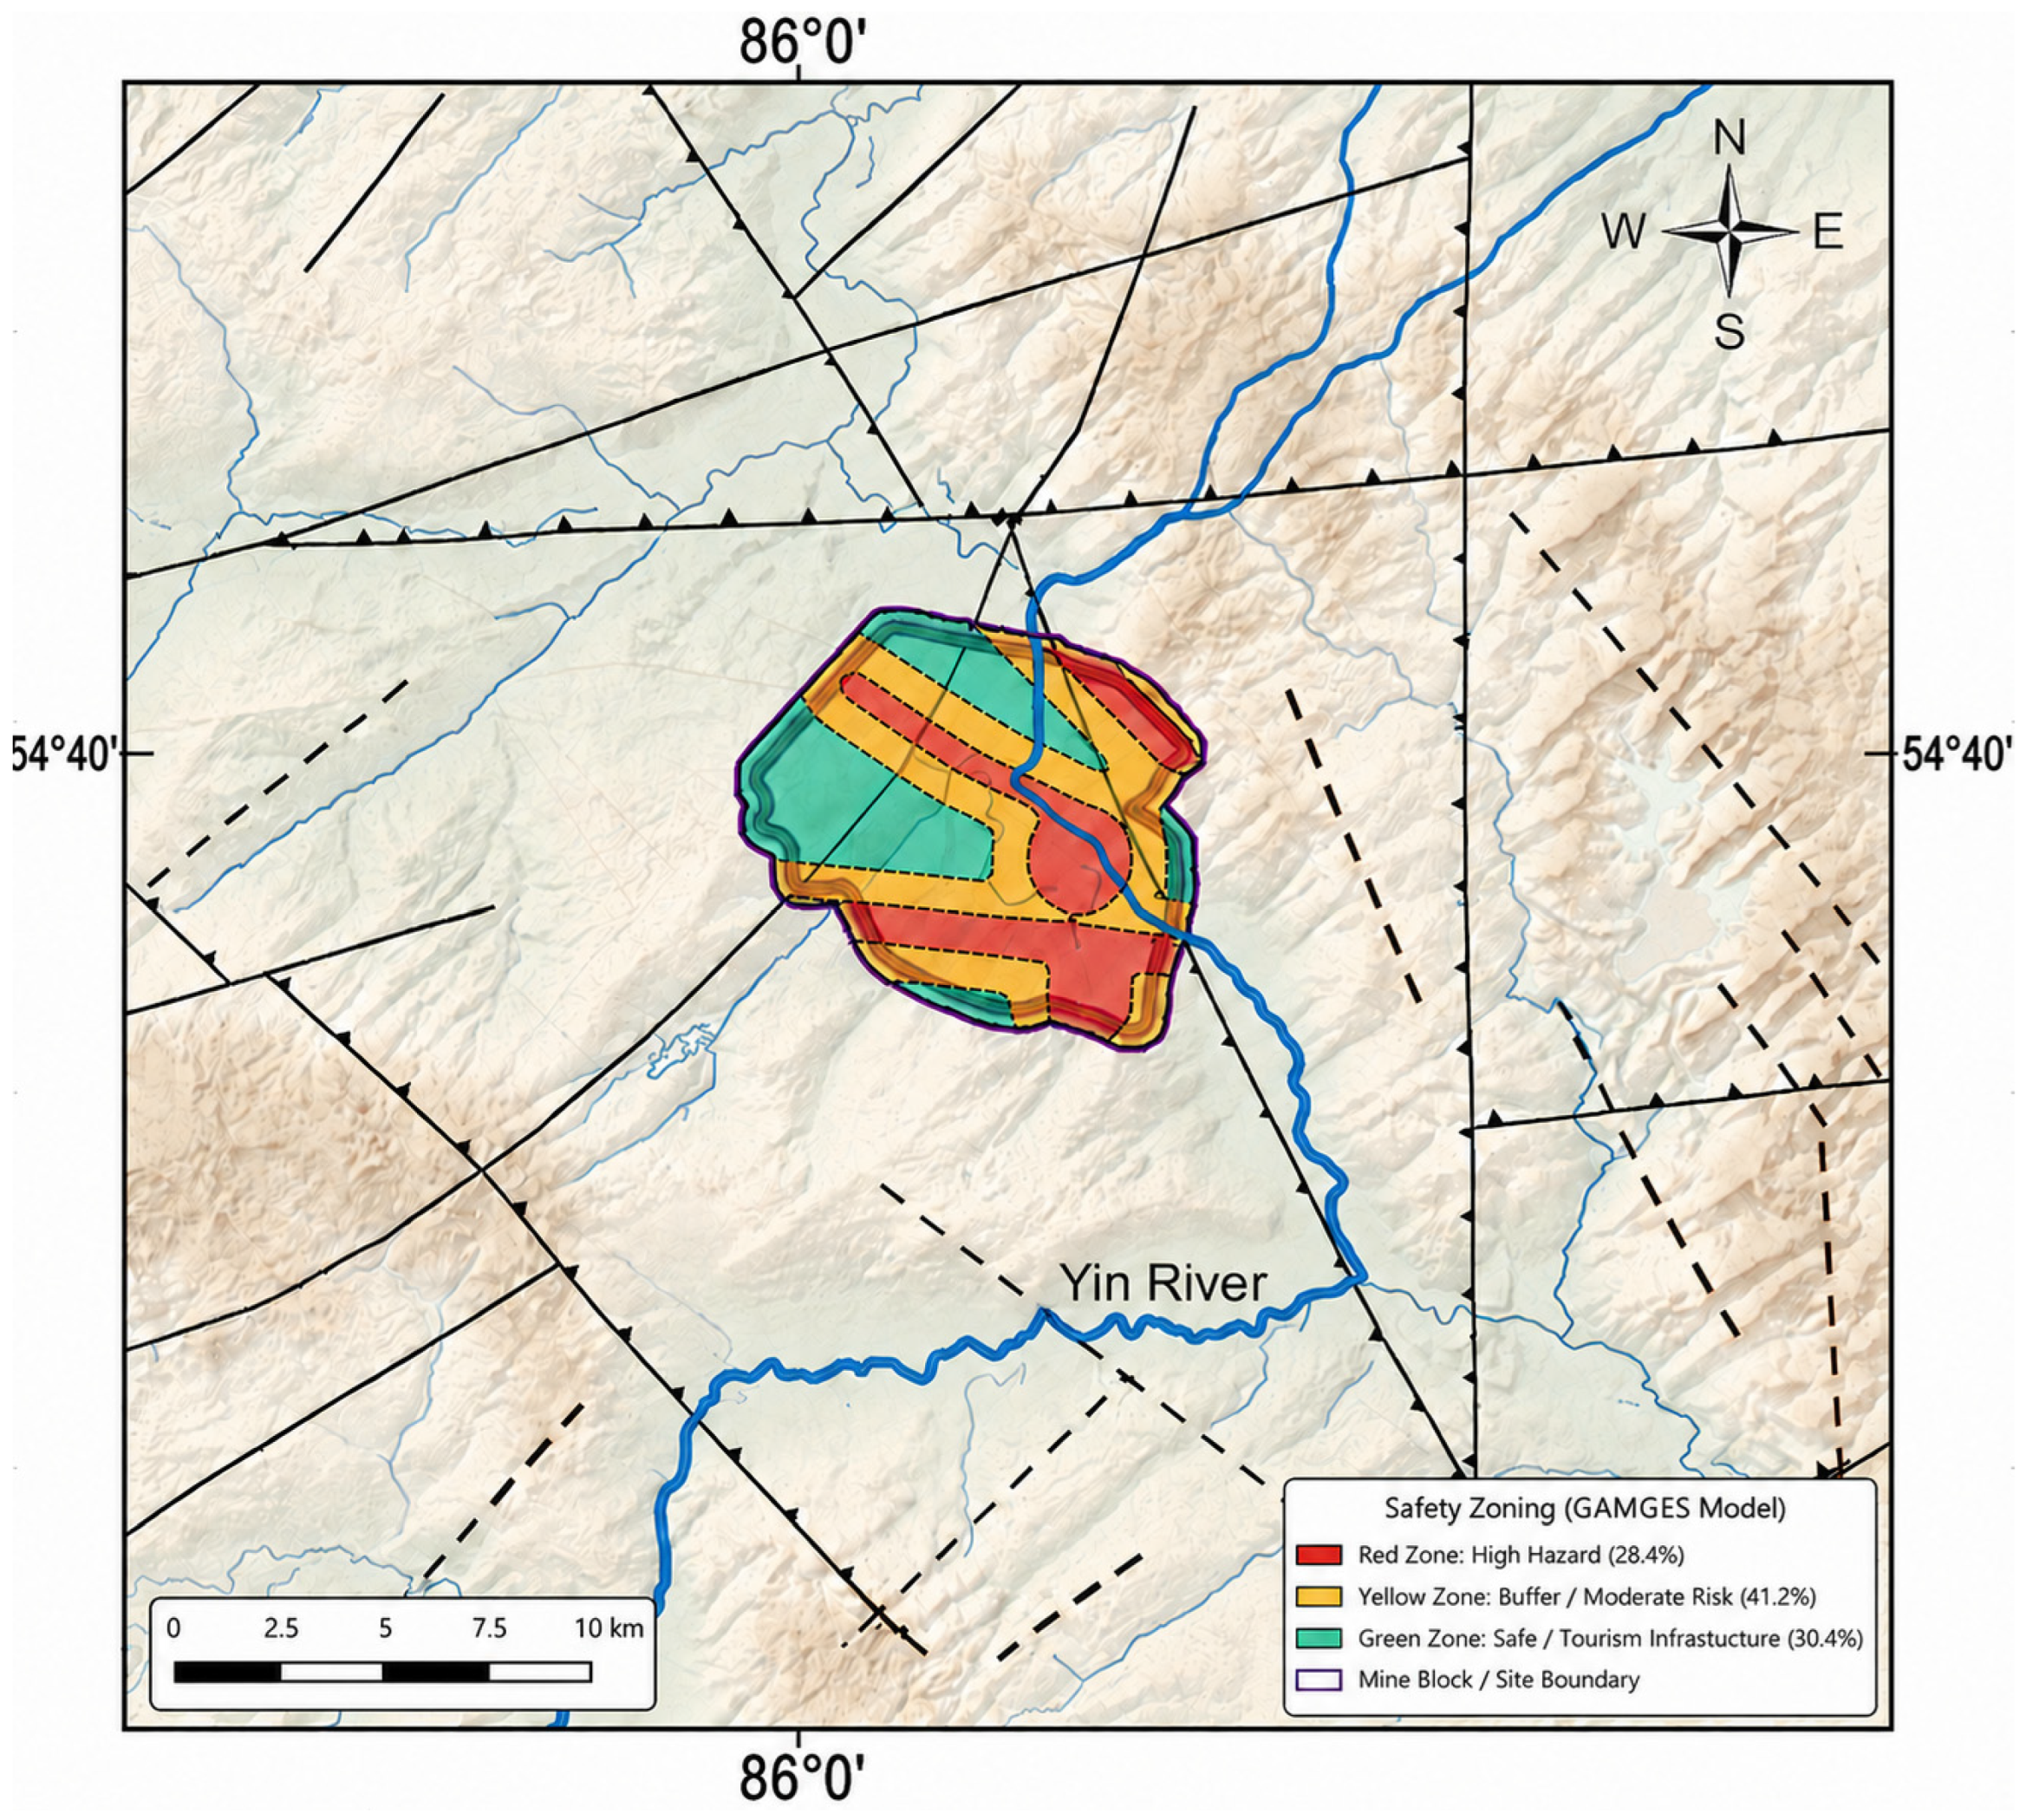
Based on this integrated numerical and cartographic data, the GAMGES provides an objective quantitative basis for dividing the proposed geotechnological park into multiple safety zones. This approach allows planners to identify and completely isolate high-risk geodynamic and gaseous zones to prevent access by non-specialist visitors, while directing tourist routes and educational facilities toward environmentally and tectonically stable areas. The results of the spatial application of the zoning at the Kirov Mine, based on the application of the safety criteria defined in the methodology to the Kirov Mine database, yielded the following actual spatial distribution of the total site area: The Red Zone (High-Risk Zone) occupied 28.4% of the total site area, concentrated directly around the active F-3 fault zone and the geomechanical subsidence areas above the underground extraction in the panels of the longwall, where field measurements showed the highest displacement rates and methane emissions. The Yellow Zone (Buffer Zone) constituted 41.2% of the area, encompassing the land adjacent to the rock dumps and acid drainage channels, and designated as a protection zone with periodic monitoring. The Green Zone (Low-Hazard/Safe-Use Zone) comprised 30.4% of the total area, and the areas classified as low risk under specific monitoring and assessment criteria are designated for tourist routes and geopark infrastructure, which is subject to continuous monitoring. This division fulfils the requirements of the Convergent Mining Technologies concept by carefully balancing the preservation of the mine’s industrial heritage with ensuring the absolute safety of people and the environment. Figure 6 shows the final spatial distribution of the three safety zones of the GAMGES project.
Figure 6.
Map of the final safe zone divisions for the Kirov Mine according to GAMGES.
4. Study Limitations
Despite its enhanced accuracy, the GAMGES is subject to several limitations:
- Subjectivity in scoring when hierarchically weighting expert opinions.
- Time-dynamic variability, as the progress of underground mining operations changes surface hazard levels over time, requiring continuous spatial reassessment.
- Spatial accuracy limitations of the available digital elevation model (10 m).
- High reliance on sharing real-time operational data from mine operators, which may not always be available in abandoned or unmonitored mines.
5. Recommendations
- Strict zoning of park lands (Safety Zoning): We recommend adopting the geodynamic hazard map resulting from the model as a legal basis for dividing the park into three basic zones. The red zone (prohibited) includes areas that have recorded high levels of risk as a result of active ground fissures and documented surface subsidence in the field, and visitors are completely prohibited from entering it. The yellow zone (buffer zone) allows restricted and monitored movement for specialists and researchers. The green zone (safe zone) is the area along which all tourist trails and educational facilities are directed to maintain the lowest possible levels of estimated risk and support controlled tourism use.
- Establishing a continuous monitoring network (Real-time Monitoring): The park’s tourist infrastructure must be linked to an integrated geotechnical monitoring system that includes sensors to measure the stability of slopes and rock dumps, and accurate seismic monitoring stations to assess the impact of the continuous tremors resulting from nearby mining blasts. It is also recommended to install automated early warning sensors against the emission and accumulation of methane gas migrating through tectonic faults to avoid the risk of rapid explosions in tourist areas.
- Hydrogeological rehabilitation and protection of water resources: The regional protection plan requires obligating operators to establish drainage channels and advanced chemical treatment plants to purify mine water and reduce the high mobility of toxic elements emitted from mining waste, in order to protect the aquatic ecosystem of the Yin River and surrounding waterways from severe pollution.
- Structural and institutional integration (Convergent Framework): We recommend adopting the principles of Convergent Mining Technologies that ensure joint coordination between active mine management and tourism planners. Convergent mining techniques secure mining lands by processing underground cavities [30]. Thus, engineering reinforcement operations, filling of depleted underground cavities, and securing old industrial facilities are carried out as a mandatory proactive step before opening any site to the general public.
6. Conclusions
This study demonstrates that evaluating industrial and technological heritage sites for geotourism requires moving beyond classical frameworks that focus solely on scientific and aesthetic appeal. By incorporating the Geomechanical and Environmental Integrity (GES) complex as a mathematical discount factor, the proposed GAMGES provides an initial decision support structure that reduces final scores based on active geomechanical and environmental hazards such as fault deformation, methane migration, and hydrogeological contamination hazards—hazards that conventional models disregard. To accurately address methodological limitations and clearly distinguish between empirically validated results and the framework’s future potential, the findings are structured into two main areas:
- In the initial application to the Kirov Mine case study, the incorporation of the discount factor (GES) successfully prevented aesthetically attractive but geotechnically unstable sections from receiving high, unadjusted suitability scores. This quantitative adjustment provided a methodological and spatial basis for dividing the site into specific risk management zones (red, yellow, and green).
- While the GAMGES offers a promising framework for identifying surface and subsurface hazards, its overall predictive accuracy, applicability, reliability across different sites, and long-term validity remain limited by its limited field experience. Broad generalisations regarding global standardisation or the development of general regulatory frameworks for the management of industrial geoparks are premature and unsupported by detailed analytical studies or multi-site benchmarking.
The proposed model serves as an adaptable initial screening tool, not as a final or universally standardised benchmark. Future research should focus on long-term monitoring, rigorous field verification across diverse geodynamic and mineral environments, and systematic reliability assessments to demonstrate the empirical rigour required for broader institutional adoption.
Author Contributions
Conceptualization, B.A.S. and T.S.H.; Methodology, A.-z.S.S.I., B.A.S. and T.S.H.; Software, A.-z.S.S.I. and T.S.H.; Validation, B.A.S. and T.S.H.; Formal analysis, A.-z.S.S.I.; Investigation, A.-z.S.S.I. and T.S.H.; Data curation, A.-z.S.S.I. and T.S.H.; Writing—original draft, A.-z.S.S.I. and T.S.H.; Writing—review & editing, B.A.S.; Supervision, B.A.S. and T.S.H. All authors have read and agreed to the published version of the manuscript.
Funding
This research did not receive any specific grant from funding agencies in the public, commercial, or not-for-profit sectors.
Data Availability Statement
The data presented in this study are available on request from the corresponding author.
Conflicts of Interest
The authors declare no conflicts of interest.
References
- Vujičić, M.D.; Vasiljević, D.A.; Marković, S.B.; Hose, T.A.; Lukić, T.; Hadžić, O.; Janićević, S. Preliminary geosite assessment model (GAM) and its application on Fruška Gora mountain, potential geotourism destination of Serbia. Acta Geogr. Slov. 2011, 51, 361–376. [Google Scholar] [CrossRef] [Scilit]
- Dowling, R.K.; Newsome, D. Geotourism: Tourism of Geology and Landscape; Goodfellow Publishers Ltd.: Oxford, UK, 2018; 520p. [Google Scholar] [CrossRef] [Scilit]
- Brilha, J. Inventory and quantitative assessment of geosites and geodiversity sites: A review. Geoheritage 2016, 8, 119–134. [Google Scholar] [CrossRef] [Scilit]
- Hussain, A.I. Geodiversity of Smaquli area as a potential geopark in Kurdistan Region, Iraq. Int. J. Geoheritage Parks 2022, 10, 477–490. [Google Scholar] [CrossRef] [Scilit]
- Reynard, E.; Brilha, J. (Eds.) Geoheritage: Assessment, Protection, and Management; Elsevier: Amsterdam, The Netherlands, 2018; 450p. [Google Scholar]
- Zouros, N.; Martini, G.; Frey, M.L. (Eds.) Proceedings of the 2nd European Geoparks Network Meeting, European Geoparks Network; Natural History Museum of the Lesvos Petrified Forest: Sigri, Greece, 2003; p. 184. [Google Scholar]
- McKeever, P.; Zouros, N.; Patzak, M. The UNESCO Global Network of National Geoparks. Georg. Wright Forum 2010, 27, 14–18. [Google Scholar]
- UNESCO Global Geoparks. Operational Guidelines for UNESCO Global Geoparks; UNESCO: Paris, France, 2015; 10p. [Google Scholar]
- Pérez-Romero, A.E.; Brilha, J.; Díaz, V.; Carcavilla, L.; Jordá-Bordehore, L. UNESCO Global Geoparks: 22 Years of Geoheritage and Sustainable Development. Land 2023, 12, 671. [Google Scholar] [CrossRef] [Scilit]
- Al-zamely, S.S.; Hussein, A.I.; Batugin, A.S. Assessment of the Khanas area in Iraq for the establishment of a natural–technogenic geopark. Min. Informat. Anal. Bull. 2025, 12, 33. [Google Scholar] [CrossRef]
- Tomić, N.; Božić, S. A Modified Geosite Assessment Model (M-GAM) and its Application on the Lazar Canyon Area (Serbia). Int. J. Environ. Res. 2014, 8, 1041–1052. [Google Scholar] [CrossRef] [Scilit]
- Derafshi, K.; Seyedhamzeh, M. Synthesis of quantitative geosite assessment models and its application on Sistan and Baluchestan Province natural heritages, potential geotourism destination of Iran. Geoheritage 2022, 14, 124. [Google Scholar] [CrossRef] [Scilit]
- Pál, M.; Albert, G. Examining the spatial variability of geosite assessment and its relevance in geosite management. Geoheritage 2021, 13, 8. [Google Scholar] [CrossRef] [Scilit]
- Mertol, H.; Zorlu, K.; Dede, V.; Öztürk, Y. Determining values of geoheritage elements using multi-criteria decision making (MCDM) methods: A case study of Tokat Province (Türkiye). Geoheritage 2026, 18, 102. [Google Scholar] [CrossRef] [Scilit]
- Kulikova, E.Y.; Balovtsev, S.V.; Skopintseva, O.V. Complex estimation of geotechnical risks in mine and underground construction. Sustain. Dev. Mt. Territ. 2023, 15, 7–16. [Google Scholar] [CrossRef] [Scilit]
- Batugin, A.; Kobylkin, A.; Kolikov, K.; Ivannikov, A.; Musina, V.; Khotchenkov, E.; Zunduijamts, B.; Ertuganova, E.; Krasnoshtanov, D. Study of the Migrating Mine Gas Piston Effect during Reactivation of Tectonic Faults. Appl. Sci. 2023, 13, 12041. [Google Scholar] [CrossRef] [Scilit]
- Puchkov, L.A.; Kaledina, N.O.; Kobylkin, S.S. Systemic Approach to Reducing Methane Explosion Hazard in Coal Mines. Eurasian Min. 2015, 2, 3–6. [Google Scholar] [CrossRef] [Scilit]
- Hao, J.; Kochetkova, E.M.; Epshtein, S.A. Mobility of Macro- and Microelements in Coal-Mining Waste. Solid Fuel Chem. 2023, 4, 64–72. [Google Scholar] [CrossRef] [Scilit]
- Pralong, J.-P. A method for assessing the tourist potential and use of geomorphological sites. Géomorphol. Relief Process. Environ. 2005, 11, 189–196. [Google Scholar] [CrossRef] [Scilit]
- Tamang, L.; Mandal, U.K.; Karmakar, M.; Banerjee, M.; Ghosh, D. Geomorphosite evaluation for geotourism development using geosite assessment model (GAM): A study from a Proterozoic terrain in eastern India. Int. J. Geoherit. Parks 2023, 11, 82–99. [Google Scholar] [CrossRef] [Scilit]
- Petrović, M.D.; Vasiljević, Đ.A.; Vujičić, M.D.; Hose, T.A.; Marković, S.B.; Lukić, T. Global Geopark and Candidate—Comparative Analysis of Papuk Mountain Geopark (Croatia) and Fruška Gora Mountain (Serbia) by Using GAM Model. In Proceedings of the XII European Geoparks Conference, Cilento and Vallo di Diano Geopark, Vallo della Lucania, Italy, 4–6 September 2013. [Google Scholar]
- Elkaichi, A.; Errami, E.; Patel, N. Canyons as potential geotourism attractions of Central High Atlas, Morocco: Comparative analysis of Aït Bouguemaz Valley and Zaouiat Ahansal-Taghia Valley by using GAM model. Int. J. Geoherit. Parks 2024, 12, 20–36. [Google Scholar] [CrossRef] [Scilit]
- Qiao, J.; Batugin, A.S.; Batugina, I.M.; Yu, L.; Zhao, J. The Conditions of Geodynamic Phenomena at Huafeng Mine in China; Sputnik: Moscow, Russia, 2016; 144p. [Google Scholar]
- Cheskidov, V.; Kurenkov, D.; Lipina, A.; Grobler, H. Slope Monitoring Systems Design for Mining Enterprises. E3S Web Conf. 2020, 174, 01025. [Google Scholar] [CrossRef] [Scilit]
- Ordin, A.A.; Timoshenko, A.M.; Botvenko, D.V.; Meshkov, A.A.; Volkov, M.A. Optimization of Longwall Parameters in Underground Mining of Thick Methane-Bearing Coal Seam in the Sokolovo Deposit in Kuzbass. J. Min. Sci. 2018, 54, 599–608. [Google Scholar] [CrossRef] [Scilit]
- Yakovlev, D.V.; Lazarevich, T.I.; Tsirel’, S.V. Natural and induced seismic activity in Kuzbass. J. Min. Sci. 2013, 49, 862–872. [Google Scholar] [CrossRef] [Scilit]
- Bannov, A.G.; Trubin, I.V.; Zakharov, I.K.; Maksimovskiy, E.A.; Kurmashov, P.B. A critical review on soil gas analysis: Modern technologies and problems. Agronomy 2024, 14, 2374. [Google Scholar] [CrossRef] [Scilit]
- D’Incecco, S.; Di Carlo, P.; Aruffo, E.; Chatzisavvas, N.; Petraki, E.; Priniotakis, G.; Nikolopoulos, D. Fractal dimension analysis applied to soil CO2 fluxes in Campotosto’s Seismic Area, Central Italy. Geosciences 2020, 10, 233. [Google Scholar] [CrossRef] [Scilit]
- Batugin, A.S.; Kobylkin, A.S.; Musina, V.R. Effect of geodynamic setting on spontaneous combustion of coal waste dumps. Eurasian Min. 2019, 2, 64–69. [Google Scholar] [CrossRef] [Scilit]
- Trubetskoy, K.N.; Myaskov, A.V.; Galchenko Yu, P.; Eremenko, V.A. Creation and justification of convergent technologies for underground mining of thick solid mineral deposits. Gorn. Zhurnal 2019, 5, 6–13. [Google Scholar] [CrossRef] [Scilit]

Disclaimer/Publisher’s Note: The statements, opinions and data contained in all publications are solely those of the individual author(s) and contributor(s) and not of MDPI and/or the editor(s). MDPI and/or the editor(s) disclaim responsibility for any injury to people or property resulting from any ideas, methods, instructions or products referred to in the content. |
© 2026 by the authors. Licensee MDPI, Basel, Switzerland. This article is an open access article distributed under the terms and conditions of the Creative Commons Attribution (CC BY) license.