


Abstract
Large Language Models (LLMs) have successfully performed calculation-based tasks, generated diverse data visualizations, and executed chemometric analyses. This study systematically evaluated the performance of Microsoft M365 Copilot (GPT-5) across 35 representative questions spanning five domains: (1) chemical equilibrium, pH, titration, and buffer calculations; (2) data visualization, including histograms, box plots, correlation plots, and heatmaps; (3) analysis of periodic table properties using principal component analysis (PCA); (4) image interpretation and generation in classroom contexts; and (5) machine learning applications using Partial Least Squares Discriminant Analysis (PLS-DA). All questions were assessed without the use of additional prompting. Across two independent user accounts, identical question sets were administered twice per month between October and December 2025. Copilot consistently produced accurate, step-by-step solutions for equilibrium and acid–base problems, generated high-quality visualizations directly from uploaded datasets, and correctly constructed PCA score and loading plots with appropriate data standardization. Collectively, these findings demonstrate that Copilot offers substantial value for both research-oriented tasks and chemistry education.
1. Introduction
The advent of Large Language Models (LLMs) has marked a transformative era in artificial intelligence, reshaping digital interactions across healthcare, education, and economic sectors [1]. In education, LLMs introduced new capabilities for personalized instruction, adaptive tutoring, and dynamic content creation. Contemporary LLM implementations achieved high linguistic fluency, enabling natural language interactions across common digital platforms. Their integration into learning environments provided clear pedagogical benefits by delivering immediate feedback, increasing student engagement, and supporting complex problem-solving in STEM and humanities courses—all through conversational interfaces that required no technical expertise [1,2].
Since late 2023, ChatGPT incorporated advanced multimodal capabilities. It generated text, analyzed and produced images, and processed uploaded spreadsheets for calculations and visualization [3,4]. These features appeared with the release of GPT-4 with Vision (GPT-4V), which enabled users to upload and interpret visual content such as diagrams, graphs, tables, and handwritten notes. In parallel, the integration of the DALL·E model allowed ChatGPT to generate images from text prompts and perform inpainting by editing selected regions of an image. These developments expanded the tool’s applicability in educational and research contexts, particularly for tasks requiring visual interpretation or the creation of illustrative content such as conceptual diagrams, experimental setups, and visual summaries of data [5,6].
In 2024, Nascimento Júnior et al. demonstrated that LLMs can interpret and generate certain types of images [7]. Alasadi & Baiz demonstrated that ChatGPT (GPT-4) can successfully analyze images, including interpreting infrared (IR) spectra and molecular orbital diagrams of nitrogen [8].
In healthcare, LLMs contributed to improving prostate cancer literacy [9]. LLMs supported ophthalmology studies, particularly in multiple-choice assessments. They addressed patient inquiries, delivered medical guidance, enhanced patient education, assisted in triage, and supported diagnostic, differential diagnostic, and surgical planning tasks [10]. In eye care, ChatGPT has enhanced access to critical information, improved patient engagement, and streamlined triage processes [11]. Additionally, Copilot, Gemini, and ChatGPT-4 have been utilized for the interpretation of Western blot results [12]. Claude, Copilot, Gemini, ChatGPT, and Perplexity also supported postgraduate students in preparing for and passing the Specialty Certificate Examination in Dermatology [13].
In chemistry education, LLMs offer a compelling yet underexplored opportunity. Chemistry is inherently multimodal: learning often depends on interpreting symbolic, visual, and spatial information. Students are expected to construct and decode molecular structures, Lewis diagrams, orbital representations, and reaction mechanisms—skills that require both conceptual understanding and visual literacy [14,15,16,17,18]. While LLMs excel in linguistic tasks and factual recall, their ability to process or generate chemical imagery accurately remains a significant limitation [7,8].
Recent studies showed that although LLMs described chemical principles correctly, they often struggled with visual conventions and structural accuracy. When asked to generate Lewis structures or stereoisomeric diagrams, the models frequently produced distorted or chemically invalid representations [19,20]. This discrepancy raised concerns about the pedagogical reliability of these tools, especially in introductory courses where students relied on accurate visual aids to build foundational understanding [21].
LLMs such as ChatGPT have been widely used in chemical education for tasks including scientific writing assignments [22], enhancing critical thinking skills [23], answering chemistry questions [24,25,26], and writing lab reports. Although LLMs could upload datasets and generate images, no studies had documented their ability to create visualizations such as box plots, histograms, PCA plots, or supervised classification models. This absence reflected the recent emergence of data-processing and graphical capabilities in these systems [4].
The integration of image input and interpretation capabilities in modern LLMs has opened new possibilities for chemistry education. Multimodal models can identify functional groups, recognize reaction types, and classify molecular properties from image-based prompts [27,28]. These capabilities support visual tasks such as distinguishing polar from nonpolar molecules, evaluating conjugation in natural dyes, and interpreting chemical transformations including reduction and hydrolysis. Collectively, these advances suggest a future in which LLMs function as a conceptual scaffold, enabling students to explore chemical concepts interactively, even when visual representations are not perfectly accurate [29,30].
This study evaluated the capabilities of Microsoft M365 Copilot (GPT-5) in chemistry education and research across multiple representational formats. We examined its performance across four areas: (1) chemical equilibrium, pH, and titration calculations; (2) data visualization, including histograms, box plots, and correlation plots; (3) analysis of physicochemical properties of periodic table elements through box plots, Pearson correlation heatmaps, principal component analysis (PCA), and correlation matrices; and (4) interpretation and generation of images in classroom contexts. We benchmarked Copilot using tasks typical of high school and undergraduate chemistry curricula.
The results provided a clear view of Copilot’s role in chemistry education and research supported its use as a supplementary tool for conceptual reasoning and data interpretation.
2. Materials and Methods
The questions listed in Table 1 were answered by directly entering them as prompts in Microsoft M365 Copilot (GPT-5). The study was carried out from October to December 2025. Q2–Q10 were reproduced from Clark et al. [31]. Q1, Q12, Q13 were reproduced from Shallcross et al. [32]. The questions were answered without additional prompting or prior fine-tuning.
Table 1.
Representative Chemistry and Data Analysis Tasks Used to Evaluate Copilot’s Performance.
Table S1, adapted from Dong et al., contains urine specimens from 69 nonaggressive (NON; Gleason score = 6) and 73 aggressive (AG; Gleason ≥ 8) prostate cancer cases [33]. Table S2, from Borges et al., includes the physicochemical properties of the elements of the periodic table [34].
The JAMOVI version used was 2.6.44. R version used was 4.5.0.
All 35 prompts were fixed verbatim, with no paraphrasing, follow-up prompting, or contextual refinement.
Identical datasets, file names, and file formats were used across all runs.
Evaluations were conducted using two independent Microsoft M365 Copilot accounts.
In Section 7, ChatGPT (GPT-5.1), Gemini (3), and DeepSeek (V3.2) were evaluated. Each large language model was queried once on 30 December 2025, with no iterative prompting or post hoc refinement.
Each task was repeated twice per month over a three-month period (October–December 2025).
Outputs were archived and compared for:
Numerical stability (e.g., PCA variance explained, model coefficients),
Structural stability (e.g., clustering patterns, class separation),
Visual consistency (e.g., plot topology, axis scaling).
3. Chemical Equilibrium
3.1. Chemical Equilibrium, Where K > 1
Q1 presented an equilibrium problem involving an esterification reaction (Equation (1)), where the equilibrium constant was larger than 1. To address this, Copilot constructed an ICE (Initial, Change, Equilibrium) table (Table 2), substituted the equilibrium concentrations into the equilibrium expression, and applied Bashara’s method to solve for . It then resolved the quadratic equation, identified the two mathematical solutions, and determined the only physically meaningful value. The detailed procedure is provided in the Supporting Information. Previous studies reported that, as of 2023, LLMs struggled with calculation-based questions [35,36]. However, Copilot (GPT-5) can answer this type of question accurately and without errors, highlighting the rapid evolution of LLM capabilities.
CH3COOH (ethanoic acid) + C2H5OH (ethanol) ⇌ CH3COOC2H5 + H2O
Table 2.
ICE table built by Copilot.
3.2. Strong Acid and Strong Base pH Calculation
In 2023, Clark et al. [31] reported that ChatGPT struggled with answering questions related to acid–base equilibrium (Table 1; Q2–Q11). Those questions were answered using Copilot (GPT-5). In Question 2, Copilot correctly identified HI as a strong acid, noted that its concentration equals the [H+] concentration, and calculated the pH using Equation (2).
In Q3, it recognized Sr(OH)2 as a strong dibasic base, correctly applying [OH−]= 2[Sr(OH)2], and then determined the pOH using Equation (3), followed by pH calculation using pH = 14 − pOH.
3.3. Weak Acid and Weak Base pH Calculation
In Q4 and Q5, it identified HF as a weak acid and CH3NH2 as a weak base, respectively. For the acid version, it constructed ICE tables and, given the small Ka value, applied the approximation shown in Equation (4), where Ka is equilibrium constant and F was the weak acid concentration. Then, Copilot calculated the pH using the relation pH = −log10[F]
For Q5, a similar approach was used: it set up ICE table, approximated the [OH−] concentration as shown in Equation (5), calculated the pOH, and converted pOH to pH. In both cases, Copilot calculated the degree of ionization afterward to confirm that the simplification F − x ≈ F was valid, where x was the amount of weak acid or weak base ionization.
3.4. Salts pH Calculation
In Q6 and Q7, Copilot classified NH4Cl as a weakly acidic salt and NaF as a weakly basic salt, respectively. Both problems were solved using the same ICE table approach. The pH of the NH4Cl was calculated as the pH of a weak acid, and the pH of NaF was calculated as the pH of weak base.
3.5. Acid-Base Titrations
In Q8, Copilot recognized the stoichiometry of the neutralization reaction, noting that 1 mole of H2SO4 reacts with 2 moles of KOH, and applied a direct stoichiometric calculation to determine the required volume of base. In Q9, Copilot identified that 2 moles of HCl react with 1 mole of Ca(OH)2, performing the appropriate calculations to determine the amount of acid needed. In Q10–Q11, Copilot recognized that both titrations were conducted beyond the equivalence point and the pH was determined based on the excess strong acid (Q10) or strong base added (Q11).
3.6. Titration
Q12–Q14 describe titration problems that require calculations and some concepts such as differentiation between direct titrations and back titration.
Q12 was acidbase titration involving the direct titration of ammonia in a household cleaner using sulfuric acid [37]. The cleaner was first diluted in a volumetric flask, and a measured portion of this solution was titrated. It successfully identified the stoichiometric relationship between ammonia and sulfuric acid, recognized that only a portion of the cleaner was used in the titration, and accurately calculated the percentage of ammonia in the cleaner.
Q13 was a direct redox titration involving the analysis of Mohr’s salt using KMnO4 [38,39]. Copilot calculated the number of moles of Mohr’s salt based on the initial mass used in the titration. Using this information, they determined the number of water molecules in the salt’s hydration sphere.
Q14 concerns the back titration of aspirin [40,41,42]. A back-titration was employed because aspirin exhibits poor solubility in water. An excess of NaOH was added to neutralize the carboxylic acid group and promote hydrolysis of the ester functionality. After heating to ensure reaction completion, the remaining NaOH was titrated with a standardized sulfuric acid solution. The mass of aspirin in the tablet was then calculated based on the stoichiometric relationships among aspirin, NaOH, and H2SO4.
3.7. Buffer Calculation
Q15 addresses a buffer system [43,44], composed of a weak acid and its conjugate base. Copilot employed the Henderson–Hasselbalch equation to determine the amount of conjugate base needed to reach the target pH. This example illustrates that the model is capable of accurately performing buffer-related calculations.
3.8. Calculation [H+] Ratio
Q16 required calculating the pH of a strong acid (HCl) and a weak acid (acetic acid) and then comparing their H+ concentrations. Copilot correctly reported the pH of HCl as 1 using pH = −log10[HCl], reflecting its complete dissociation. They calculated the pH of acetic acid using the approximation in Equation (4) due to its small Ka value. Copilot determined that the HCl solution contained about 75 times more H+ ions than the acetic acid solution, demonstrating its ability to handle chemical calculations and distinguish between strong and weak acids.
3.9. Building Titration Plots
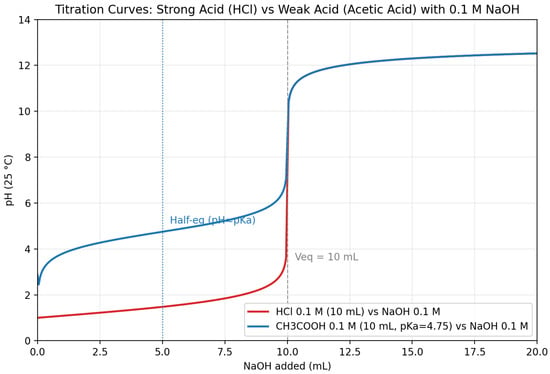
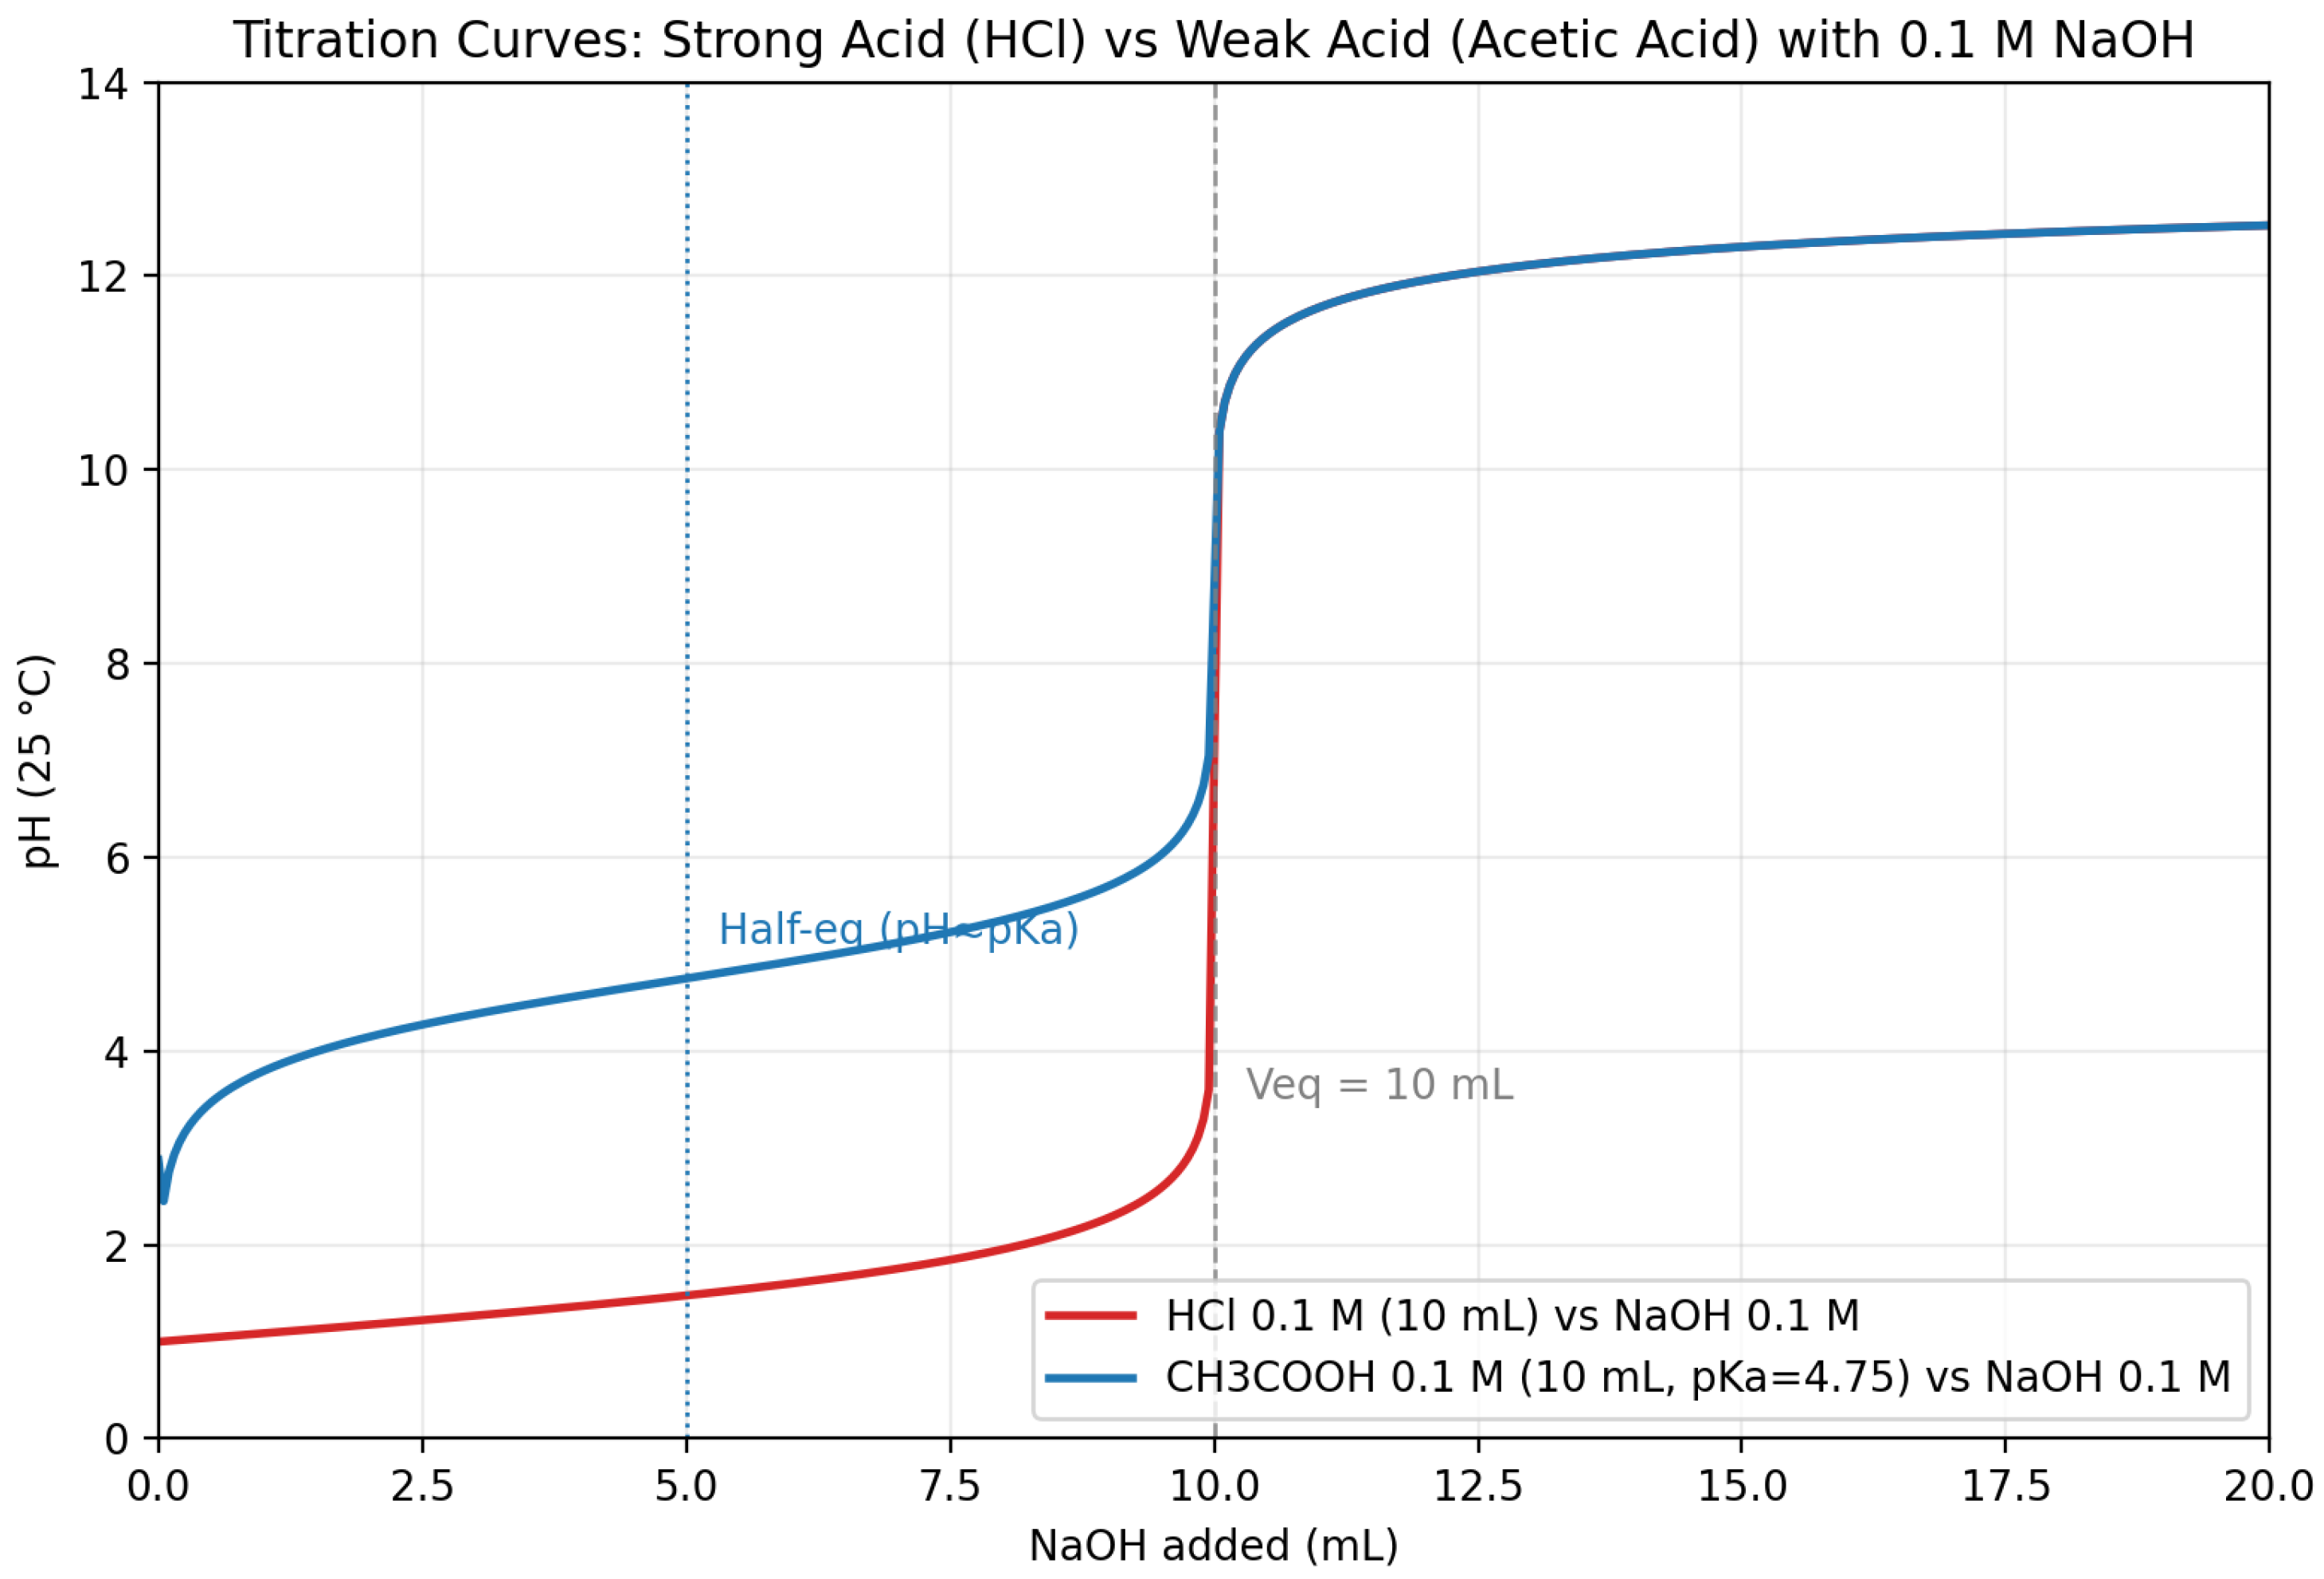
During an acid–base titration, the pH of the solution varies progressively with the addition of titrant, showing a particularly sharp change near the equivalence point. Strong acids display a steeper and more pronounced pH transition at the equivalence point than weak acids, which exhibit a smoother curve due to buffering effects [45,46]. In Q17, Copilot accurately described the pH behavior of both strong and weak acids during titration, clearly illustrating that strong acids undergo a sharper pH change near the equivalence point, whereas for weak acids, the pH at the half-equivalence point corresponds to the pKa (Figure 1).
Figure 1.
Titration plot of HCl and acetic acid (10 mL; 0.1 mol/L) against a 0.1 mol/L NaOH solution.
4. Uploading Datasets and Building Images
This section was carried out using the dataset reported by Dong et al. [33]. The dataset was provided in the Supporting Information (Table S1). The study developed Parallel Reaction Monitoring (PRM) assays to quantify two urinary glycopeptides—FLN*ESYK from prostatic acid phosphatase (ACPP) and EDALN*ETR from clustering (CLU)—as biomarkers for aggressive prostate cancer. Urine samples from 142 patients were analyzed, including 69 non-aggressive cases (Gleason score = 6) and 73 aggressive cases (Gleason score ≥ 8). The assays measured Light/Heavy ratios of these glycopeptides, normalized to heavy isotope-labeled standards, alongside clinical variables such as serum PSA and age.
4.1. Histograms
Histograms provided an essential first step for examining distributional characteristics in quantitative datasets. By binning observations, they revealed skewness, dispersion, and potential outliers, supporting initial comparisons between clinical groups [47,48]. Kernel Density Estimation (KDE) offered a complementary, continuous view of the underlying distribution.
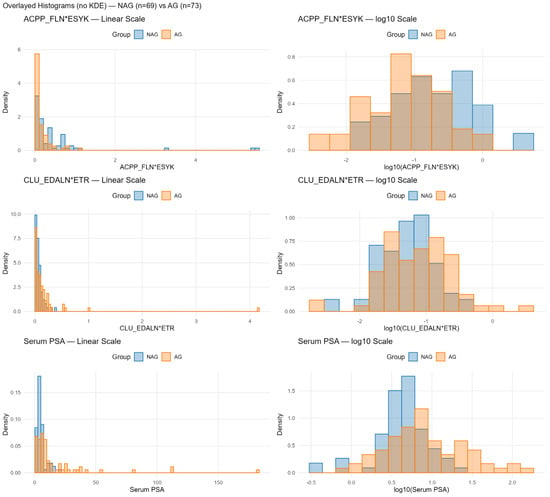
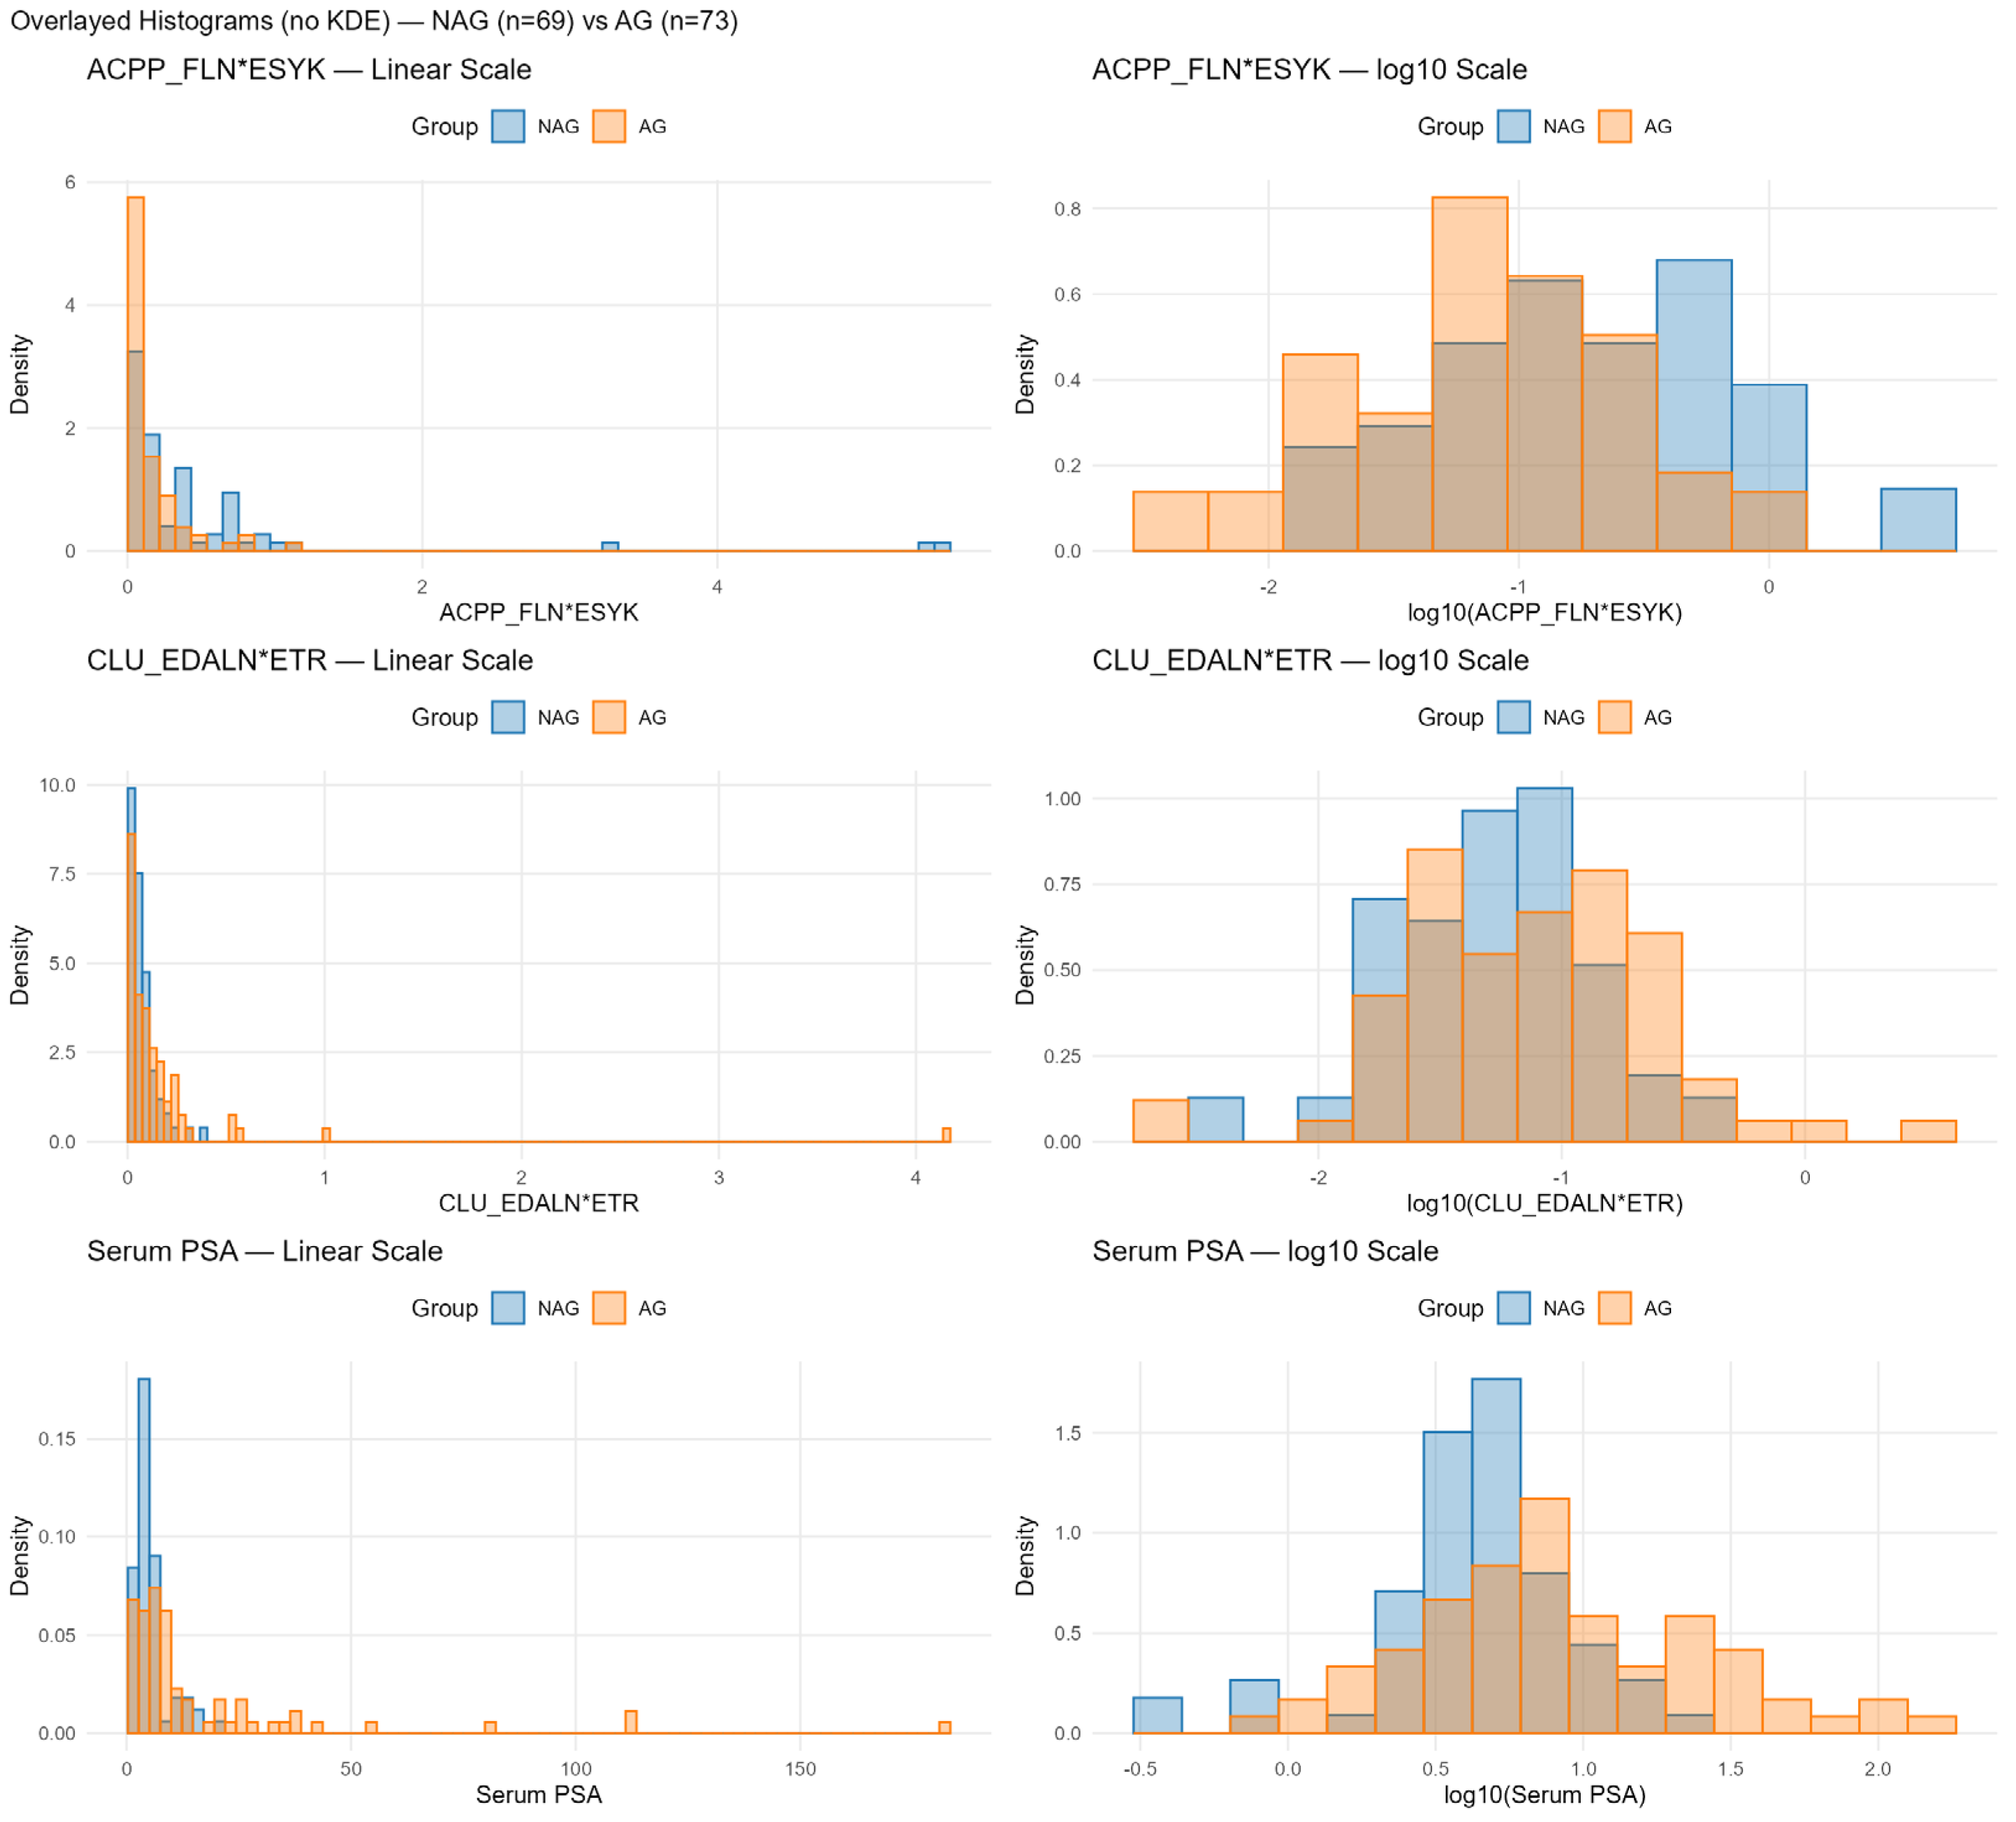
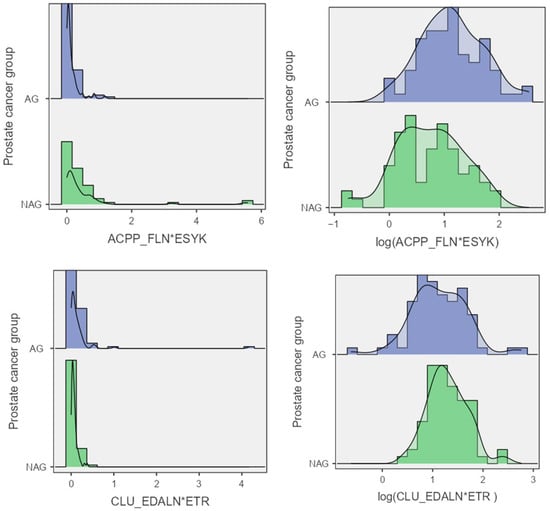
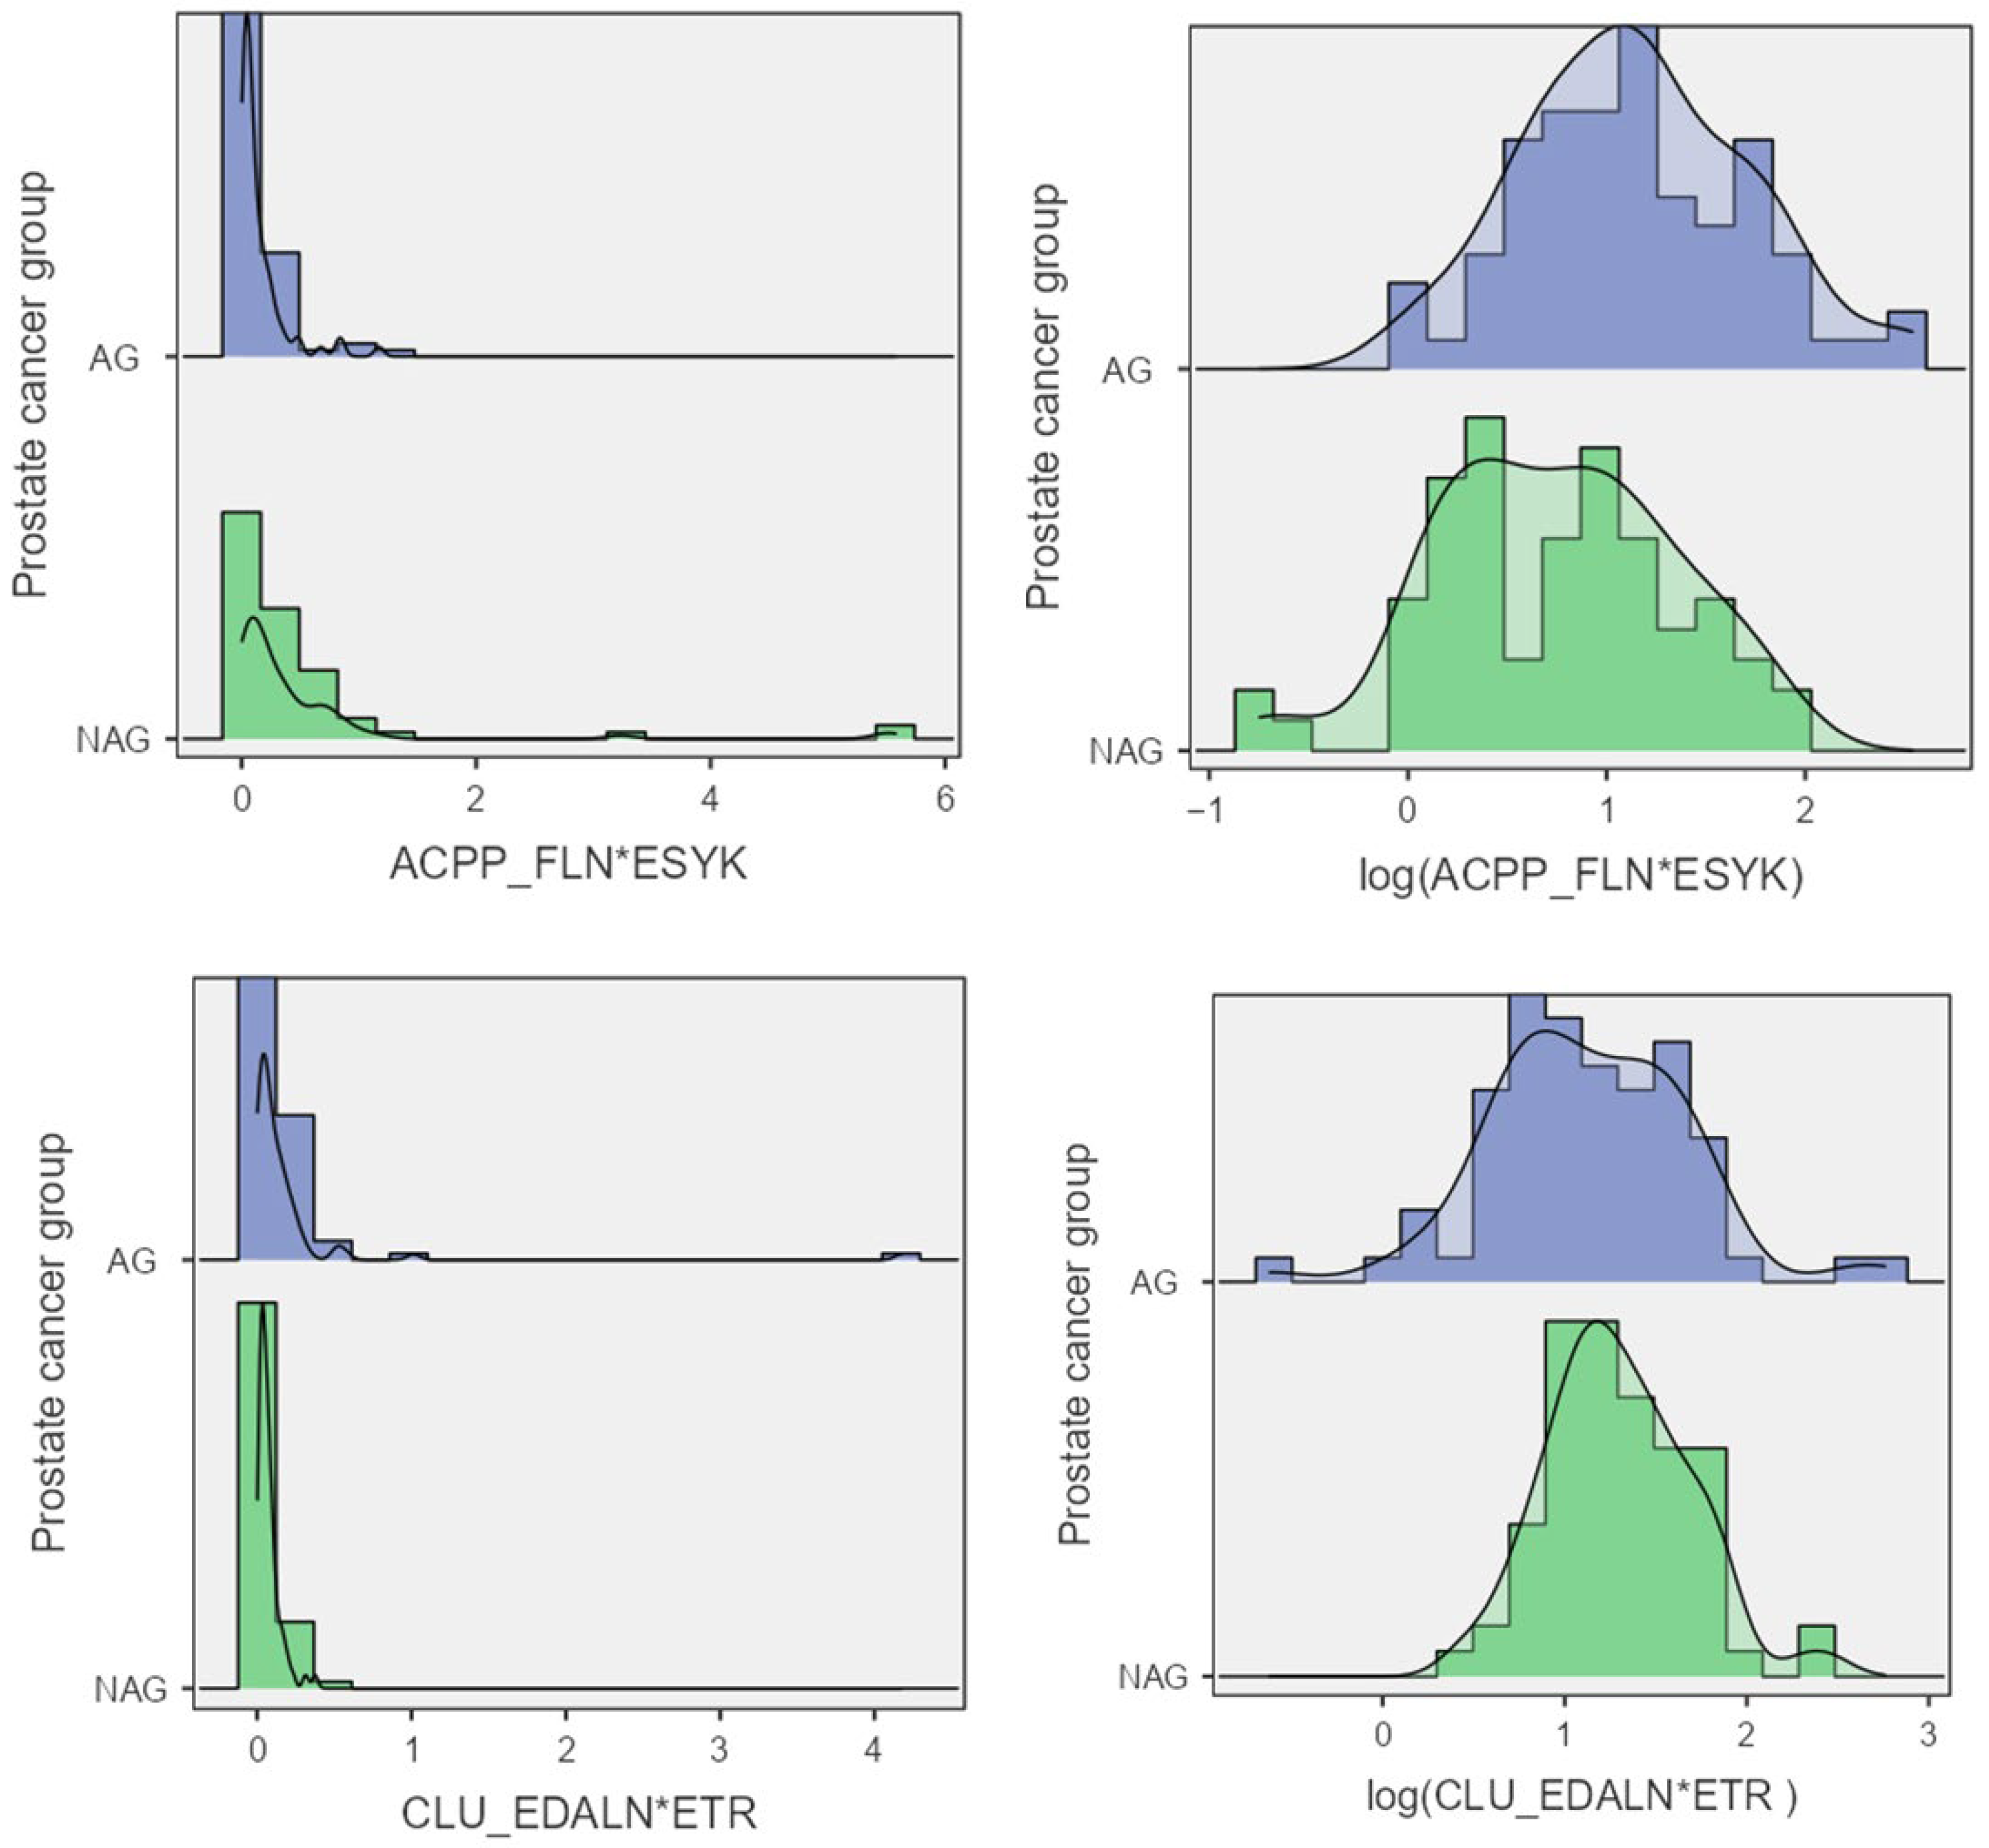
Using Table S1 and the Q18 prompt, Copilot generated histograms for ACPP_FLN*ESYK in the NAG and AG groups (Figure 2). The Light/Heavy ratios exhibited pronounced skewness, which became more interpretable after log10 transformation. (Figure 2), allowing direct comparison across groups and revealing partial overlap despite differences in central tendency.
Figure 2.
Distribution comparison of NAG (blue) and AG (orange) prostate cancer groups across four metrics: ACPP_ FLN*ESYK (Light/Heavy), CLU_EDALN*ETR (Light/Heavy), and Serum PSA. Each row represents one variable with two panels: left = linear scale (absolute values), right = log10 scale (reduces skew).
In Q19 and Q20, the histograms generated by Copilot (Figure 2) showed that variables following a logarithmic distribution were not well represented on the original numerical scale, whereas log10 transformation improved their visualization and interpretability. Overall, results from Q18–Q20 demonstrated that Copilot generated histograms suitable for both research applications and chemical education.
4.2. Box Plots
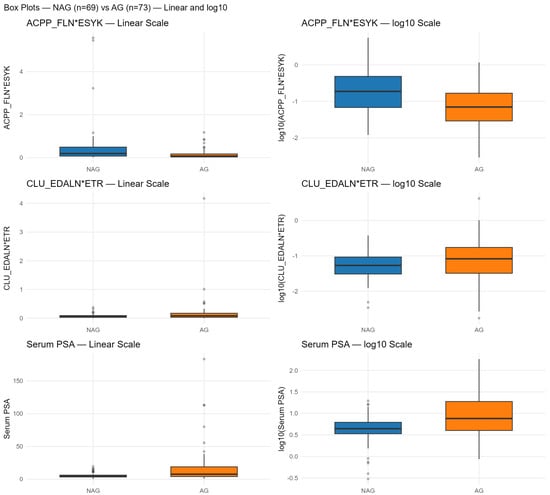
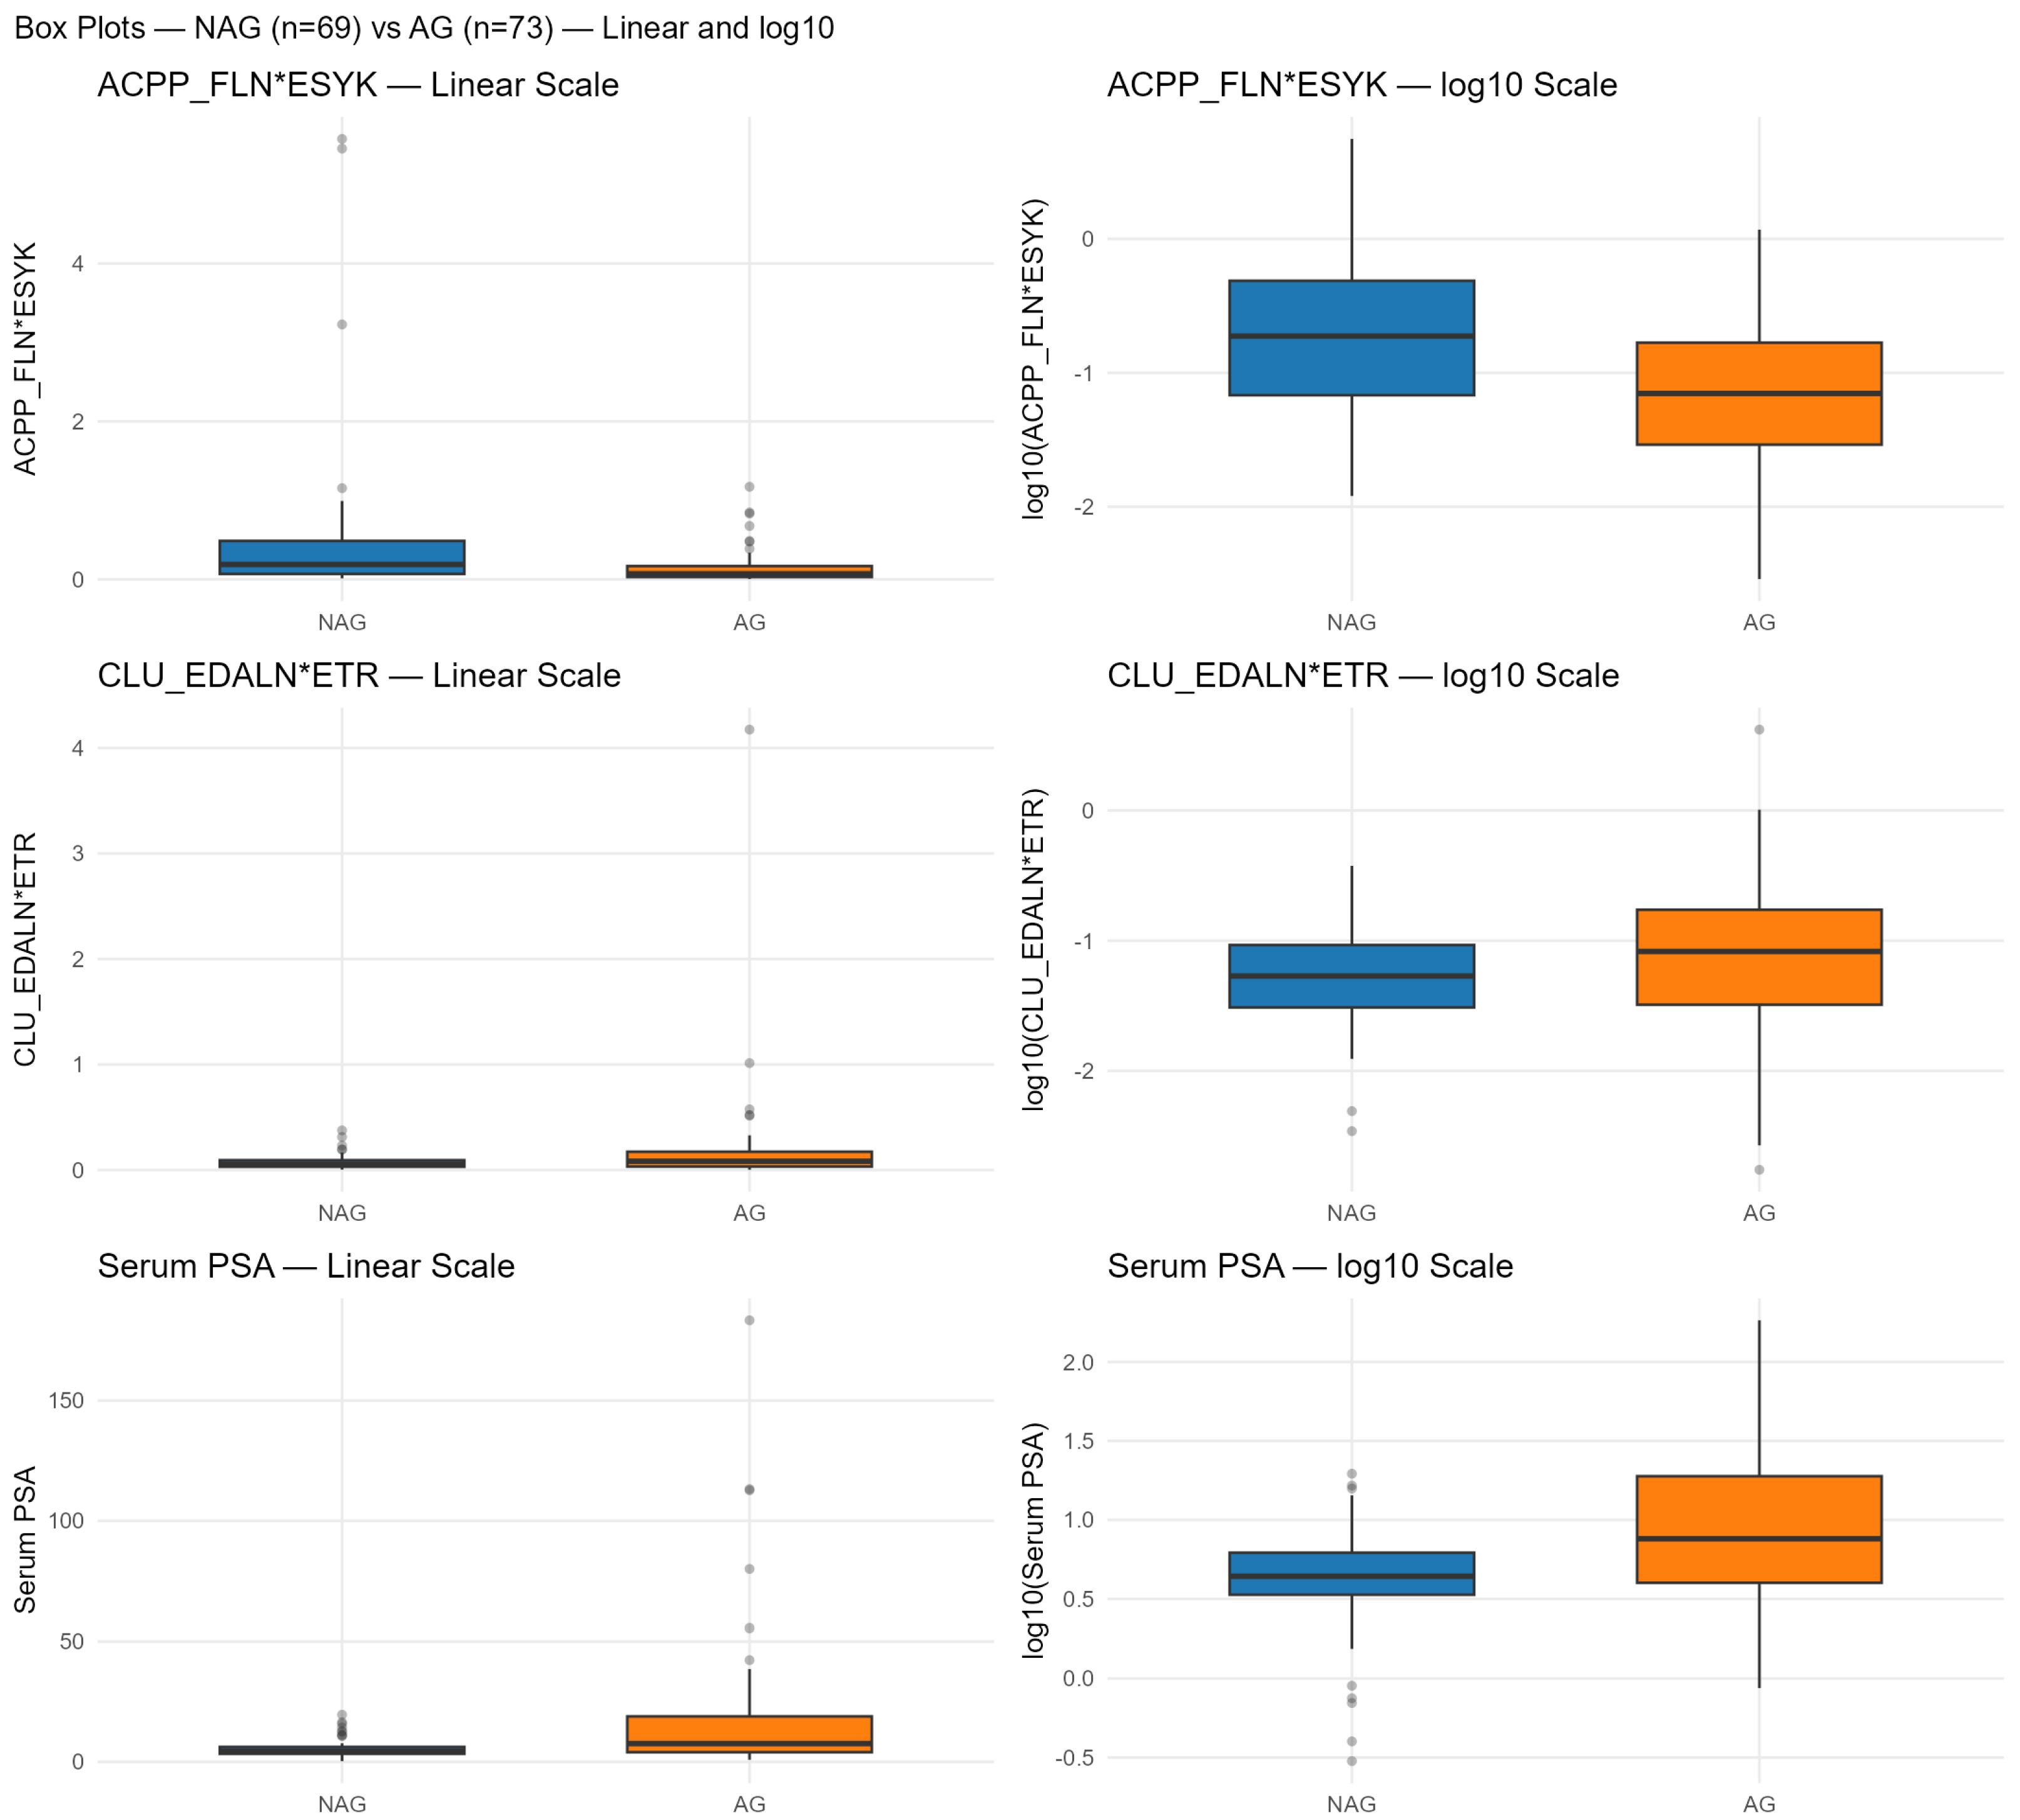
Box plots are an important tool for data visualization, particularly for comparing distributions and identifying outliers. They are among the first statistical graphics introduced to students, as they provide a clear and straightforward way to compare distributions across different groups [49,50]. Q21–Q23 demonstrated how Copilot can generate box plots and use them to support exploratory data analysis (Figure 3). However, Figure 3 also highlights an important limitation: data with a log10 distribution produced numerous apparent outliers, which reduces the interpretability of the plot. Applying a log10 transformation substantially mitigates this issue by compressing the scale, reducing the number of extreme values, and making group-wise comparisons clearer and more meaningful.
Figure 3.
Box-plot comparison of NAG (blue) vs. AG (orange) for ACPP_ FLN*ESYK (Light/Heavy), CLU_Box plot comparison of NAG (blue) and AG (orange) groups for ACPP_FLNESYK (Light/Heavy), CLU_EDALN*ETR (Light/Heavy), and serum PSA. Left panels display values on the linear (absolute) scale, while right panels show log10-transformed values.
4.3. Correlation Plots
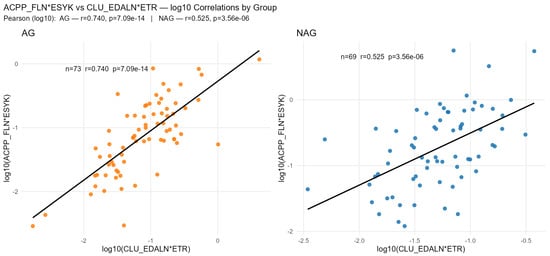
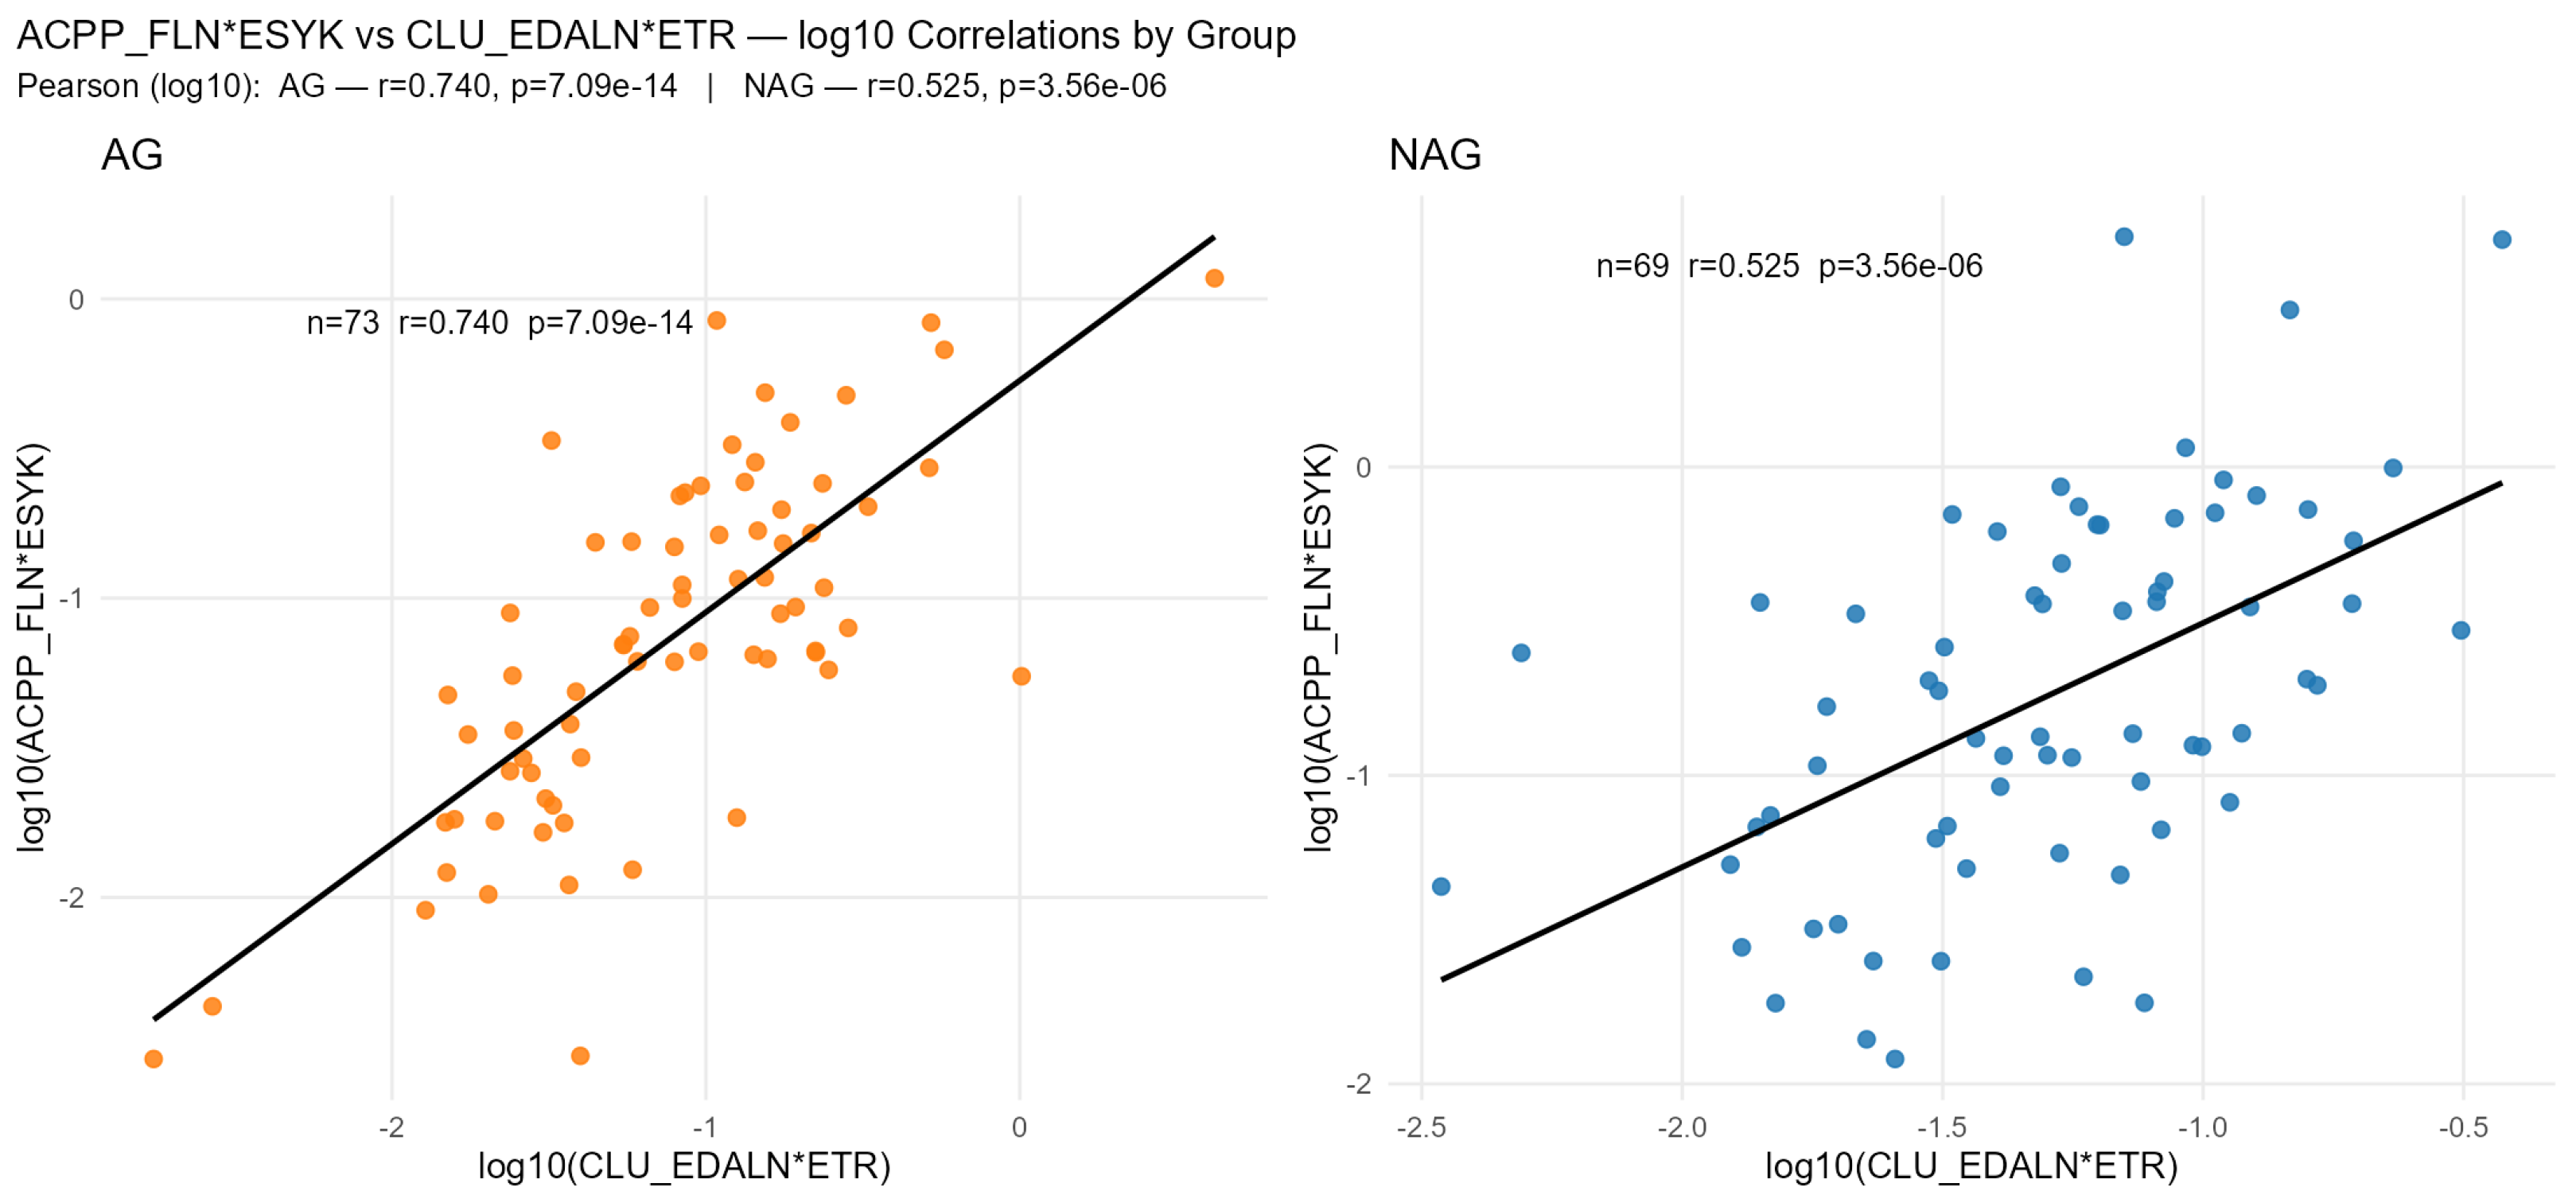
Correlation plots provided an effective means to assess relationships among variables. Q22 and Q23 focused specifically on examining these correlations. In Q22, the relationship between ACPP_FLN*ESYK and CLU_EDALN*ETR was investigated. Because both variables exhibited log-distributed behavior, linear correlation plots based on the raw data were not informative. After applying a log transformation, however, the underlying associations became visible: the two variables showed a notably stronger correlation in the AG group than in the NAG group (Figure 4).
Figure 4.
Log10-transformed correlation between CLU_EDALN*ETR and ACPP_FLN*ESYK by group. Scatter plots show AG (left) and NAG (right) cohorts using log10(CLU_EDALN*ETR) on the x-axis and log10(ACPP_FLN*ESYK) on the y-axis. Solid black lines indicate least-squares regressions; annotations report Pearson’s r and p-value computed within each group.
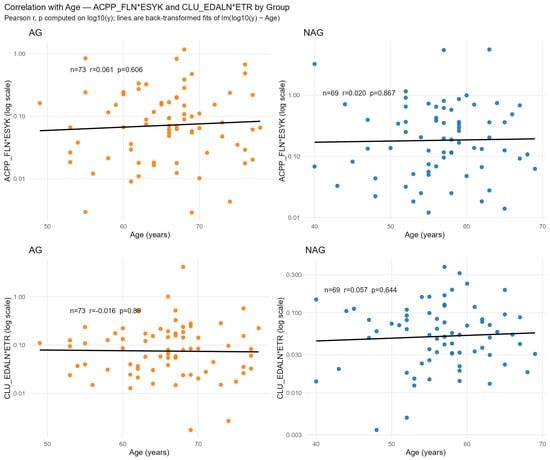
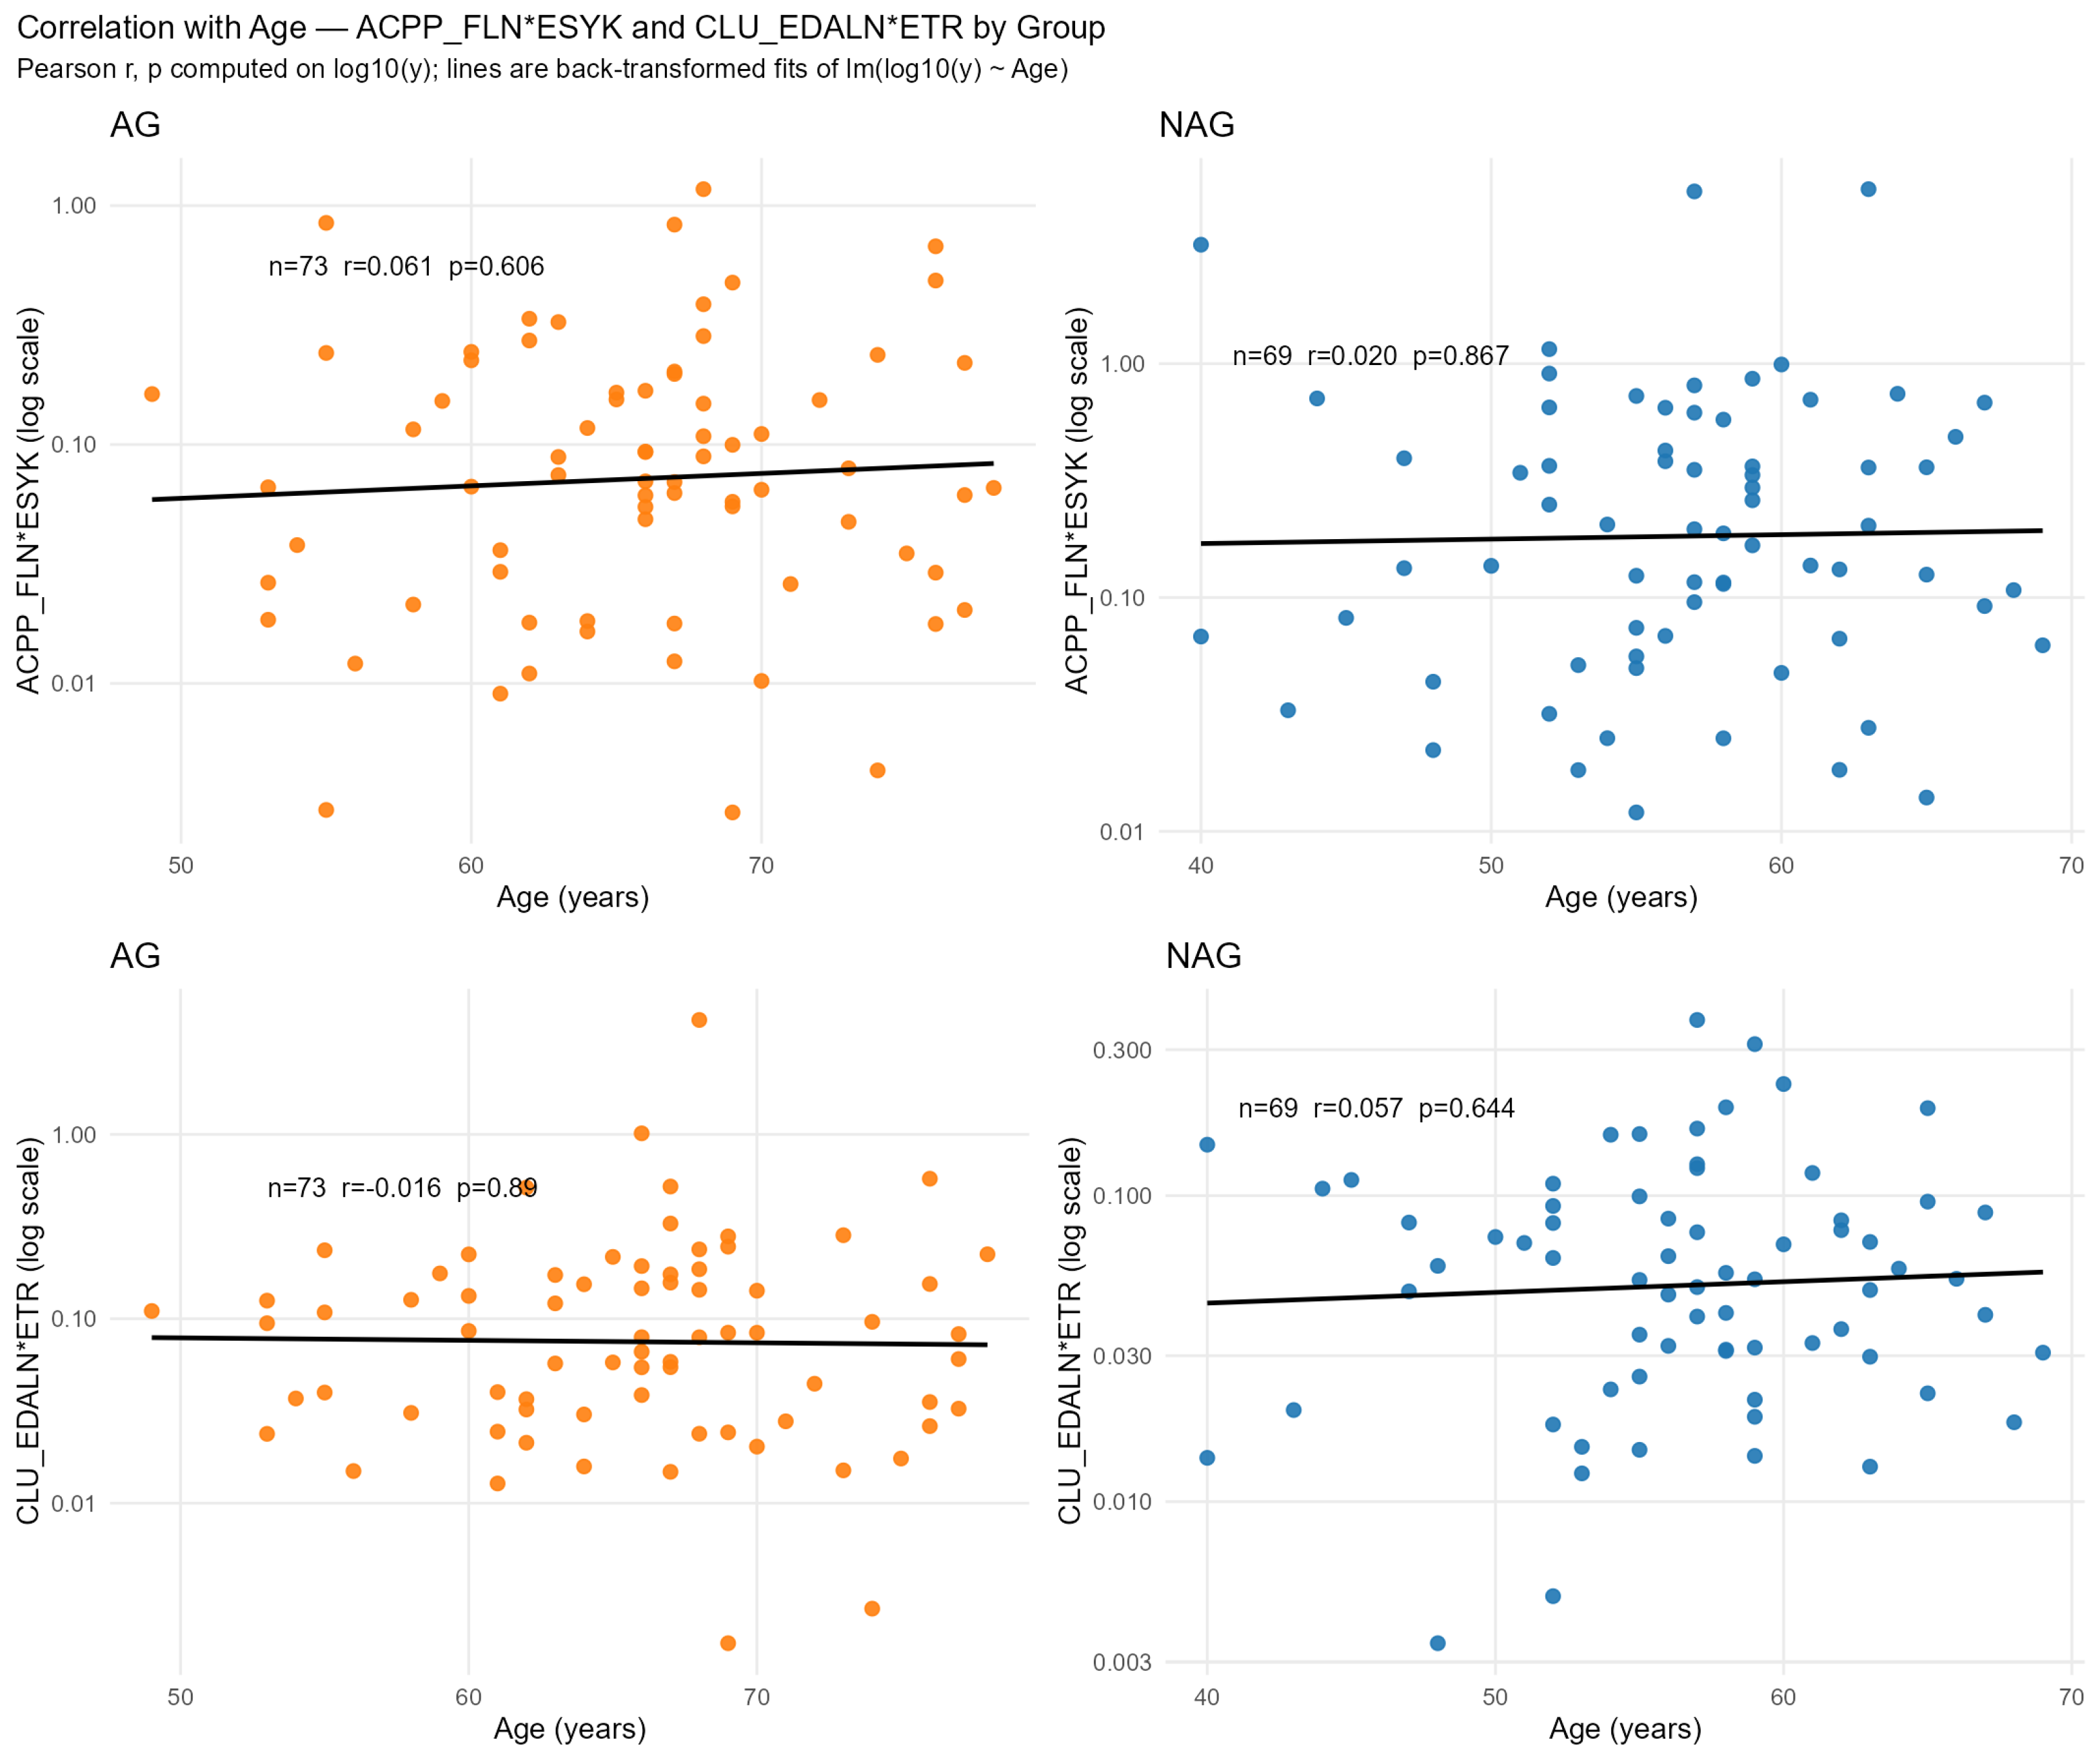
Q23 extended this analysis by examining the relationship between age and the two variables studied in Q22. The results indicated that neither variable was correlated with age, a finding consistent across both groups (Figure 5).
Figure 5.
Age vs. CLU_EDALN*ETR and Age vs. ACPP_FLN*ESYK, stratified by prostate cancer group (AG, NAG). Top row: AG; bottom row: NAG. Left column: Age vs. CLU_EDALN*ETR. Right column: Age vs. ACPP_FLN*ESYK. Each panel shows a least-squares trendline and annotates Pearson r and p-value for the within-group association.
5. Exploring the Physicochemical Properties of Elements in the Periodic Table
Q24–Q32 used the dataset provided in Table S2 (Supporting Information), which contains the physicochemical properties of periodic table elements [34]. These questions focused on analyzing and comparing these properties among different groups of elements.
5.1. Principal Component Analysis (PCA)
Copilot’s ability to perform unsupervised analysis adds value for both research and chemistry education [51], particularly because PCA is widely used yet often inaccessible to students who lack experience with Python- or R-based tools [52,53,54].
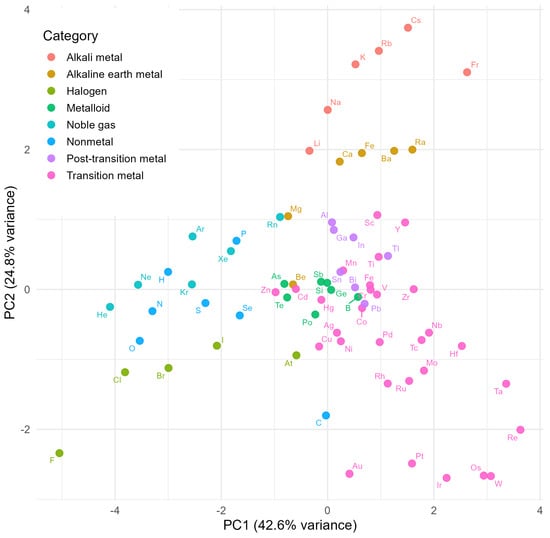
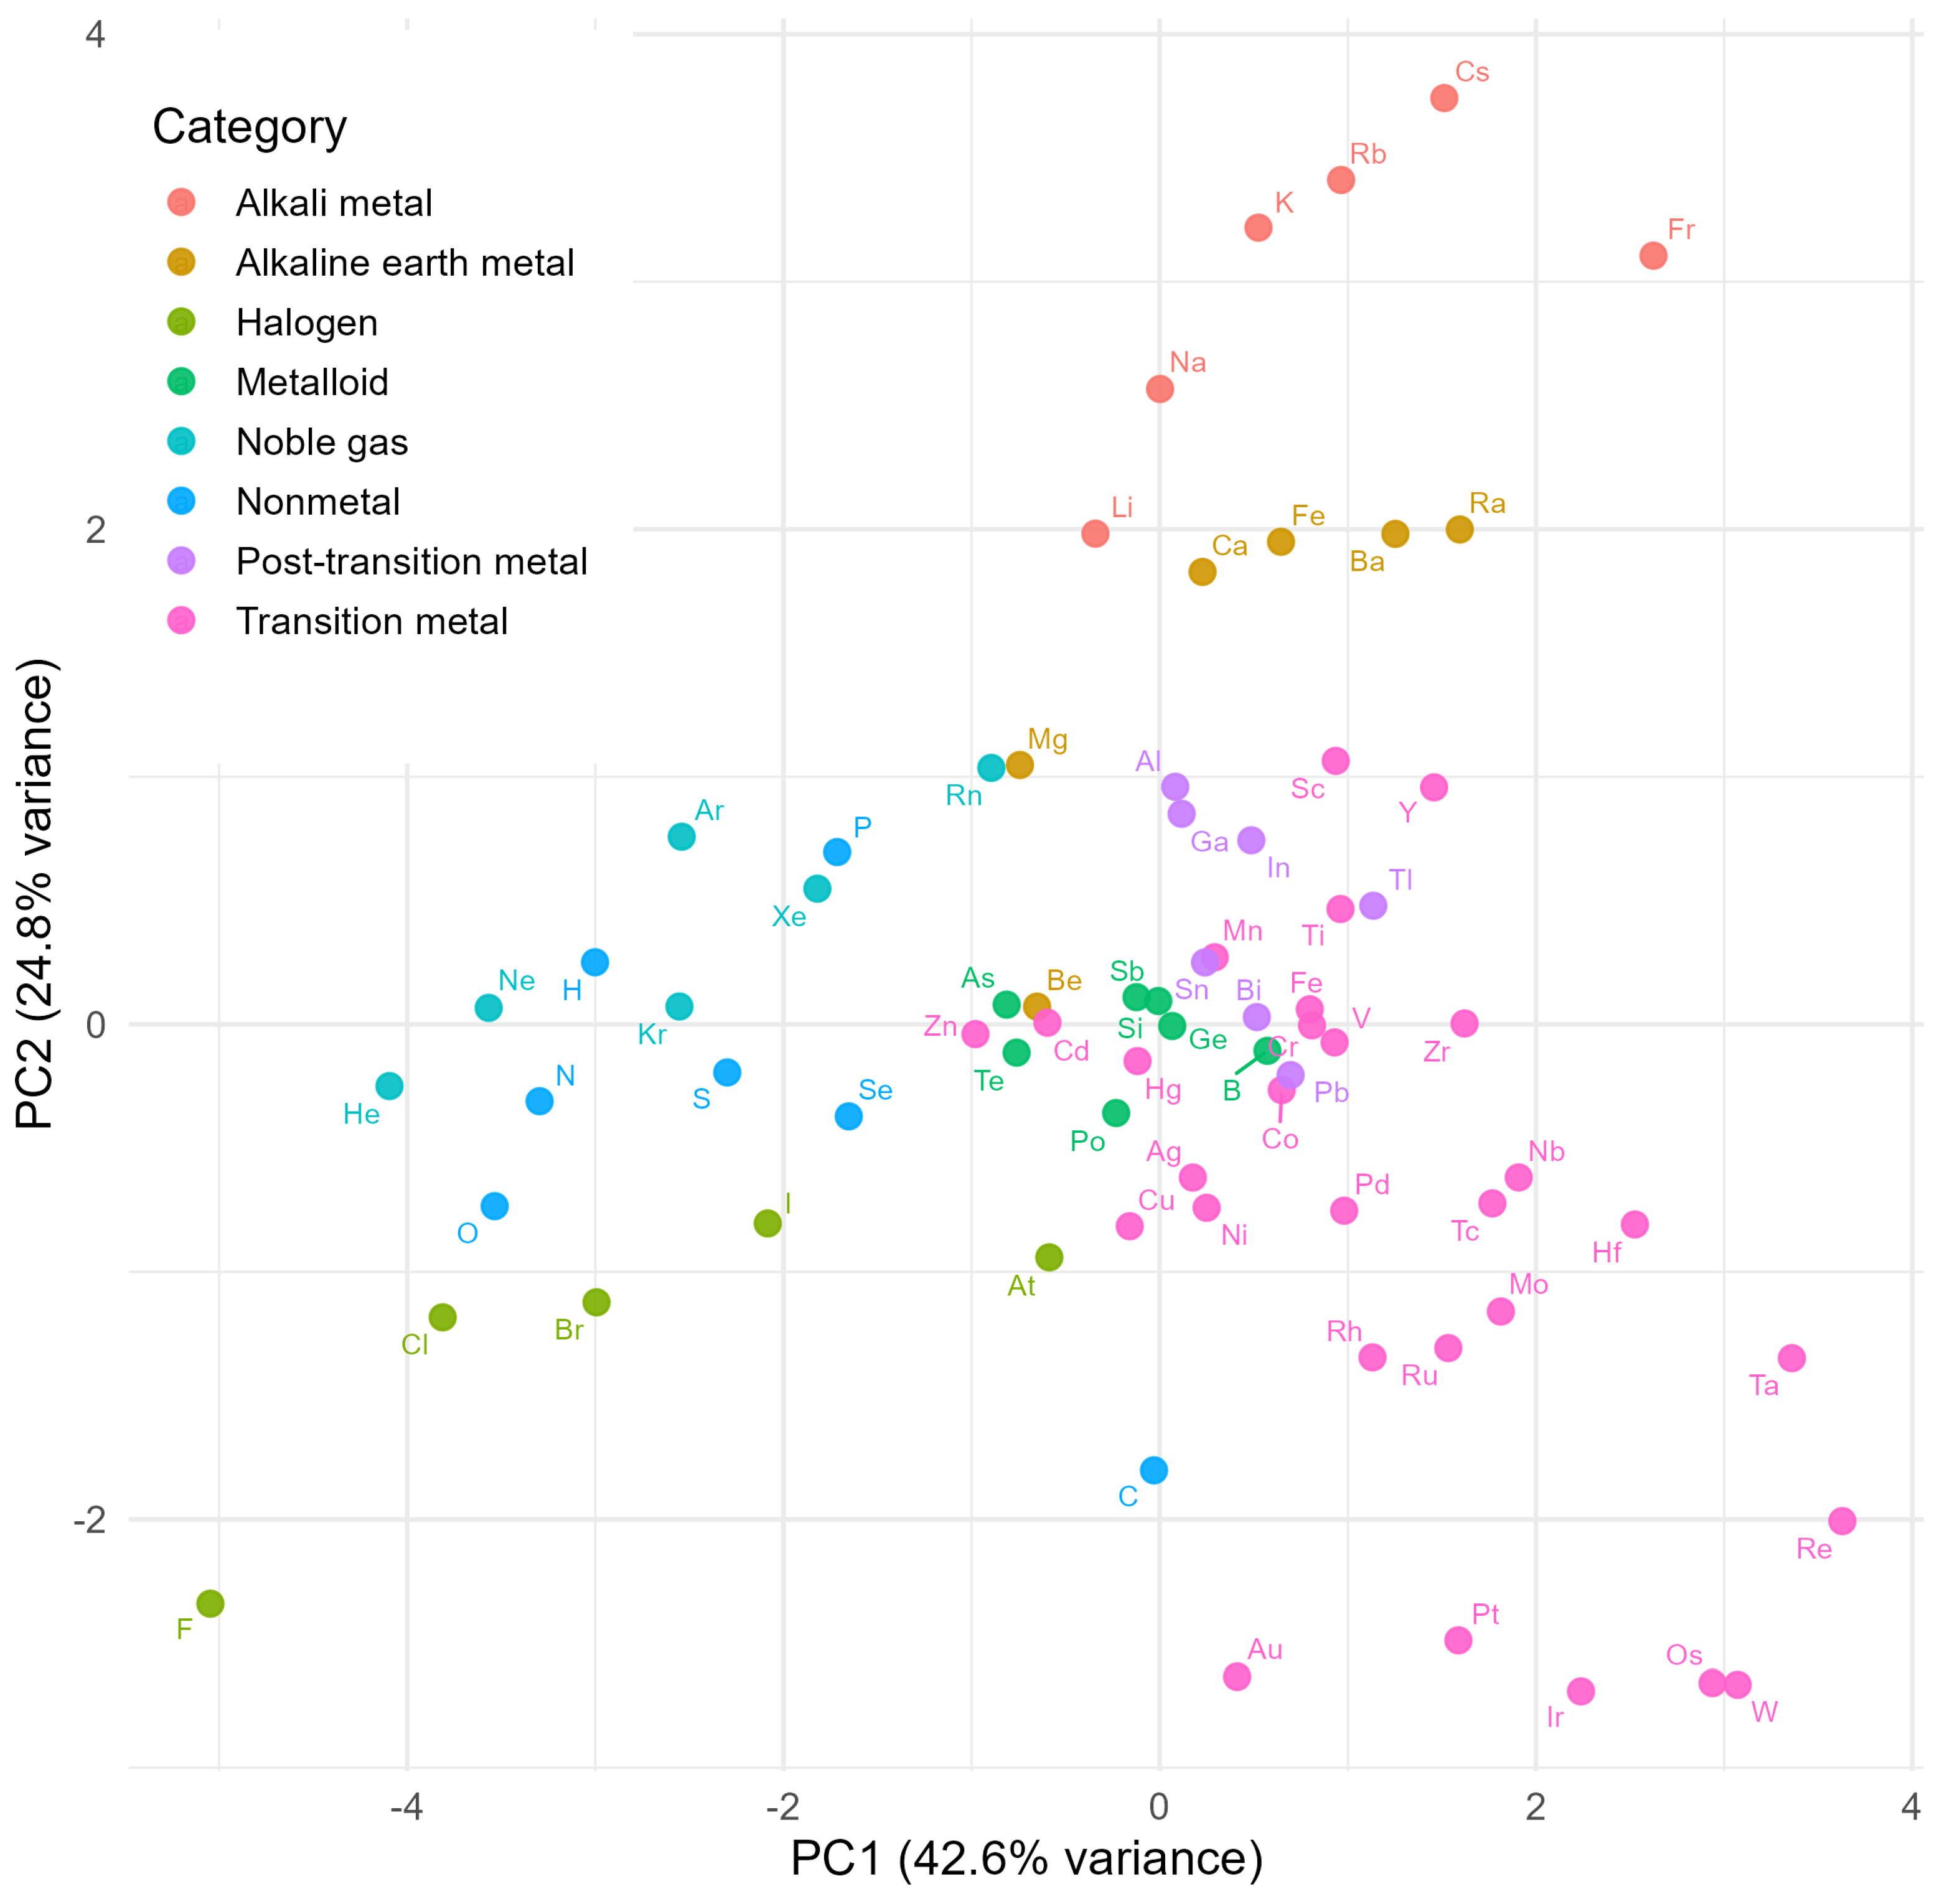
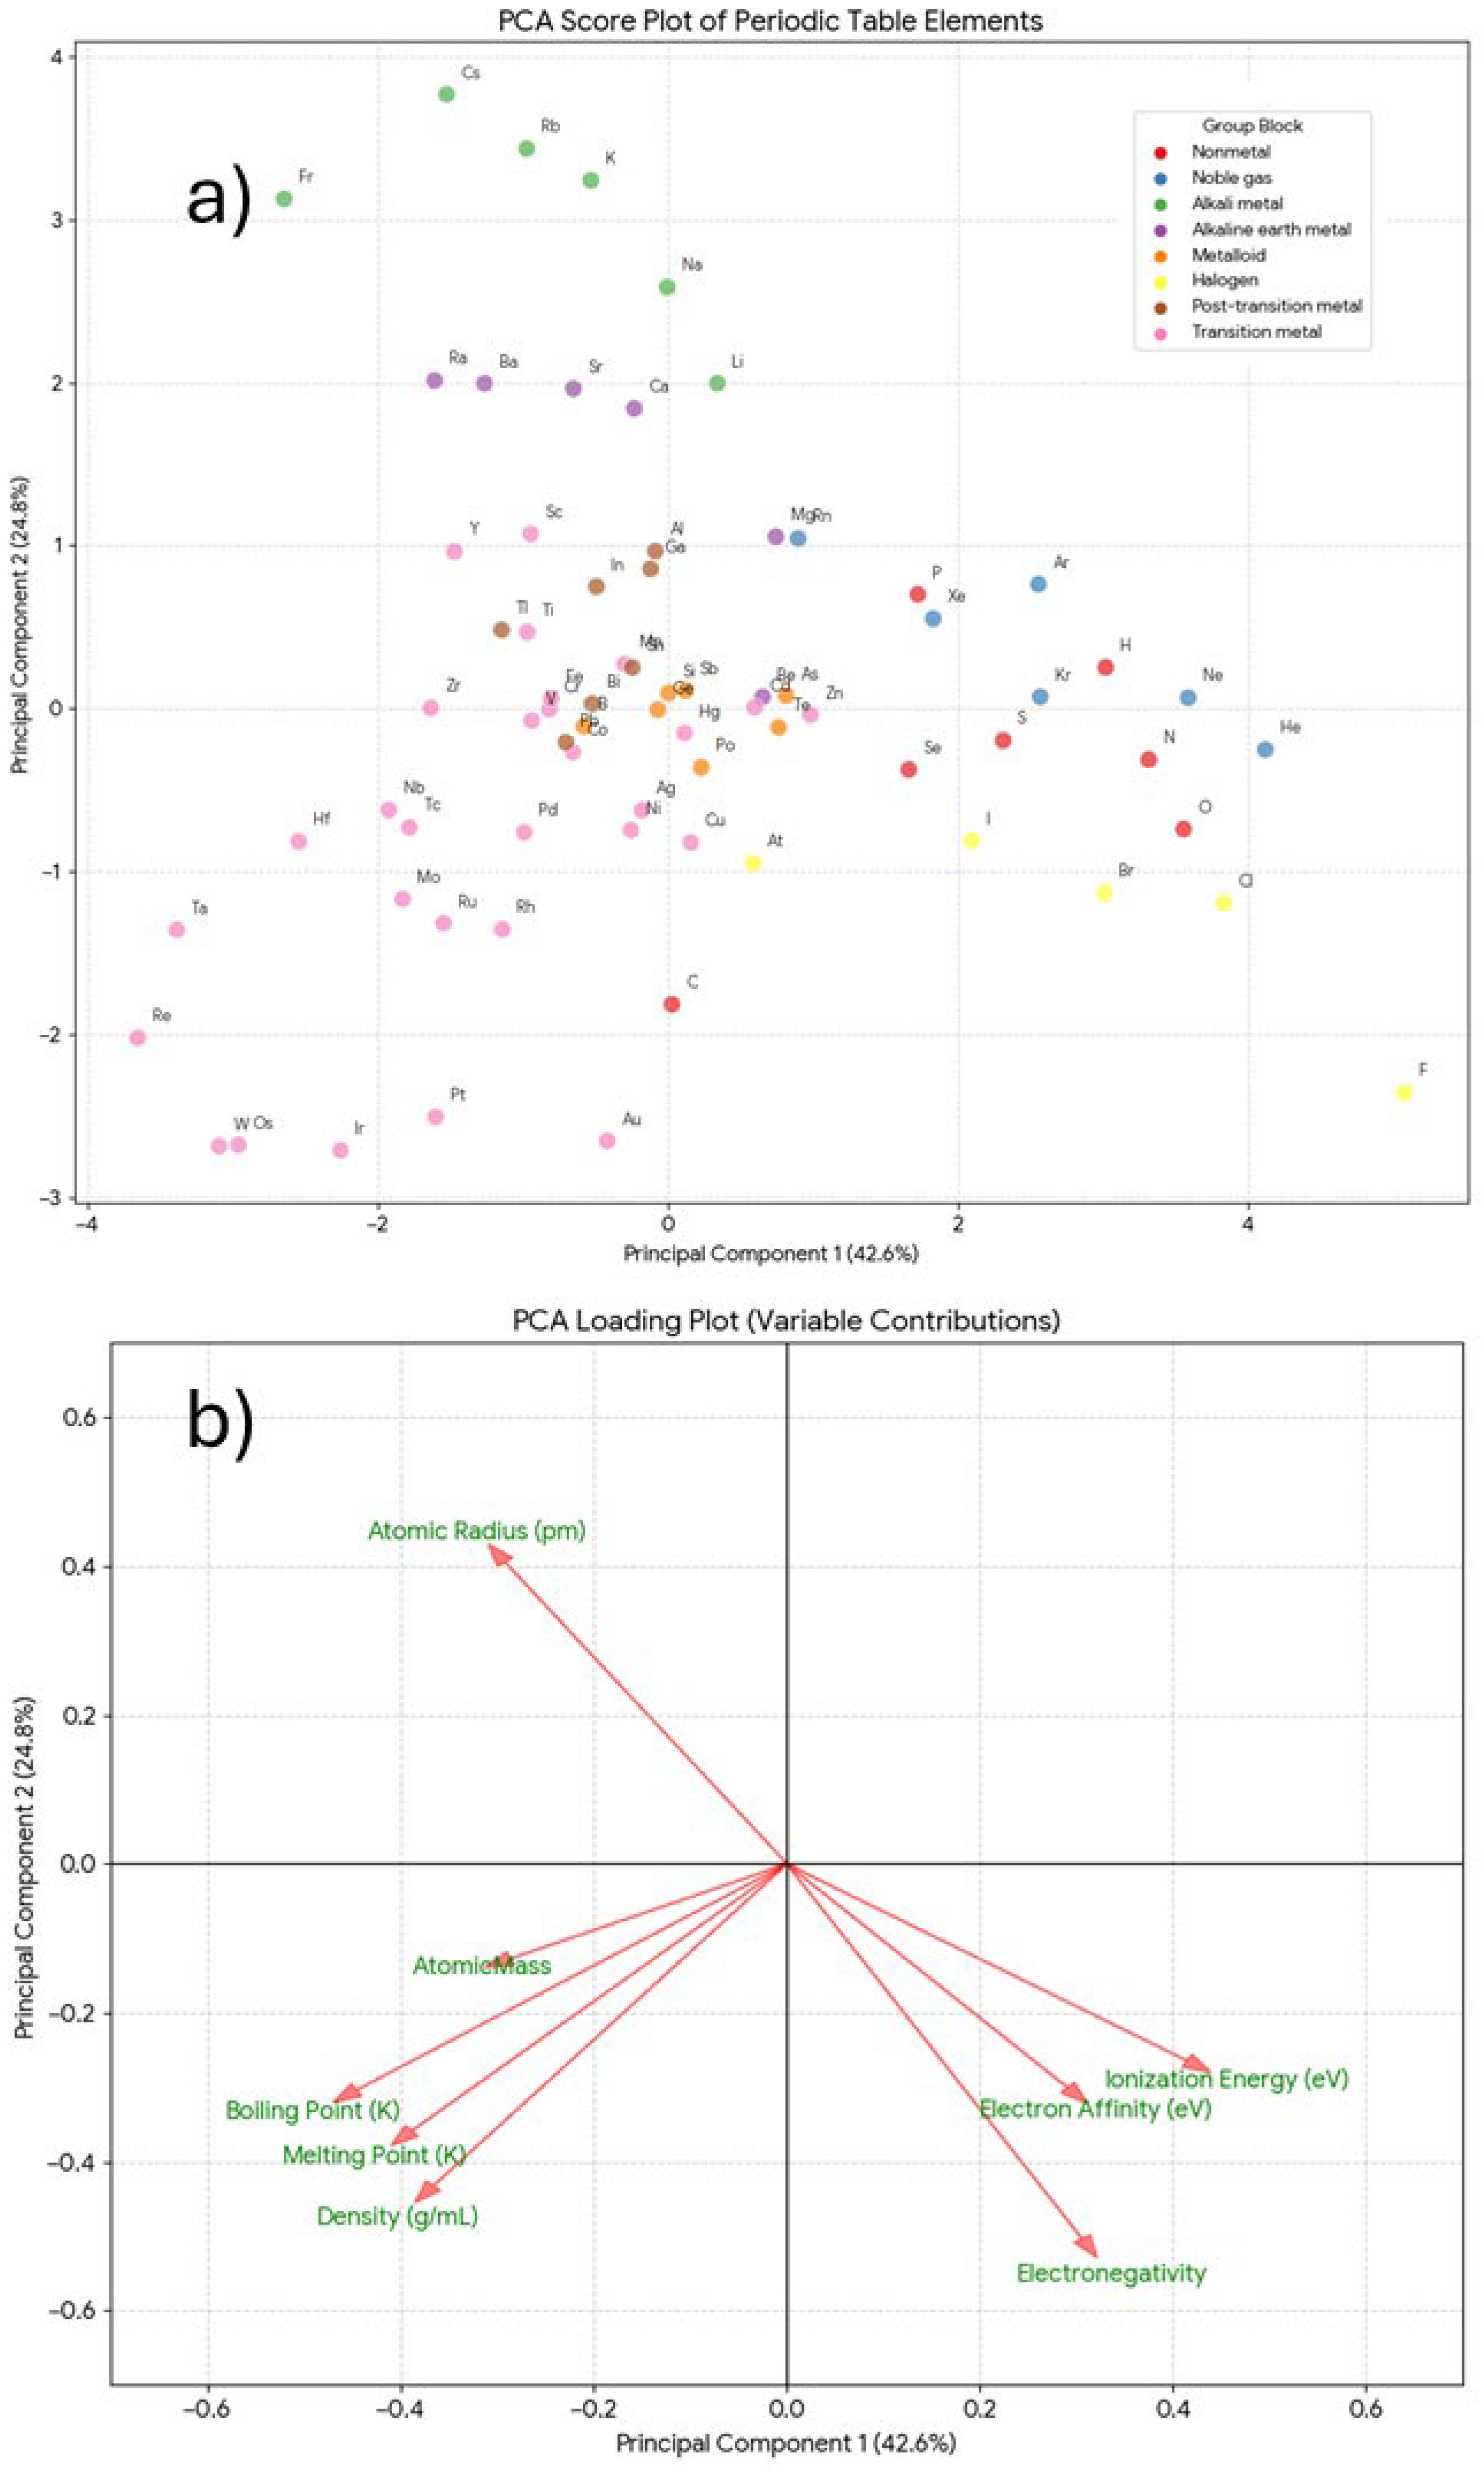
In Q25, Copilot generated a PCA score plot that correctly grouped the elements (Figure 6). PC1 and PC2 accounted for 42% and 25.2% of the variance, respectively, effectively capturing the major structure of the dataset. The plot showed distinct chemical families, with transition metals near the center, halogens on the right, alkali metals at the bottom, and sixth-period transition metals in the upper-left region.
Figure 6.
PCA Score Plot (PC1 vs. PC2) for the Physicochemical Properties of Chemical Elements.
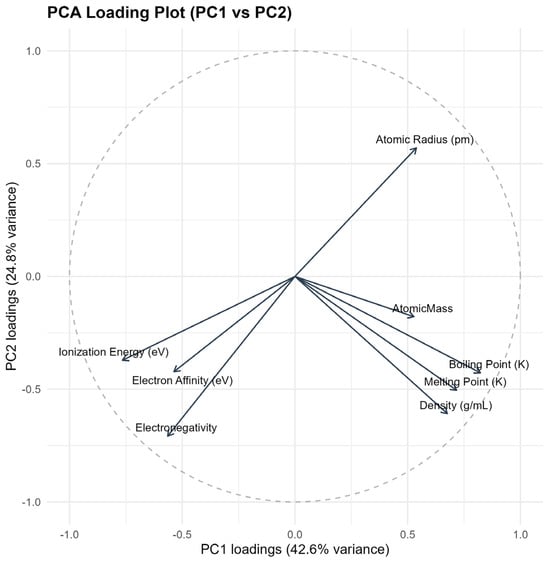
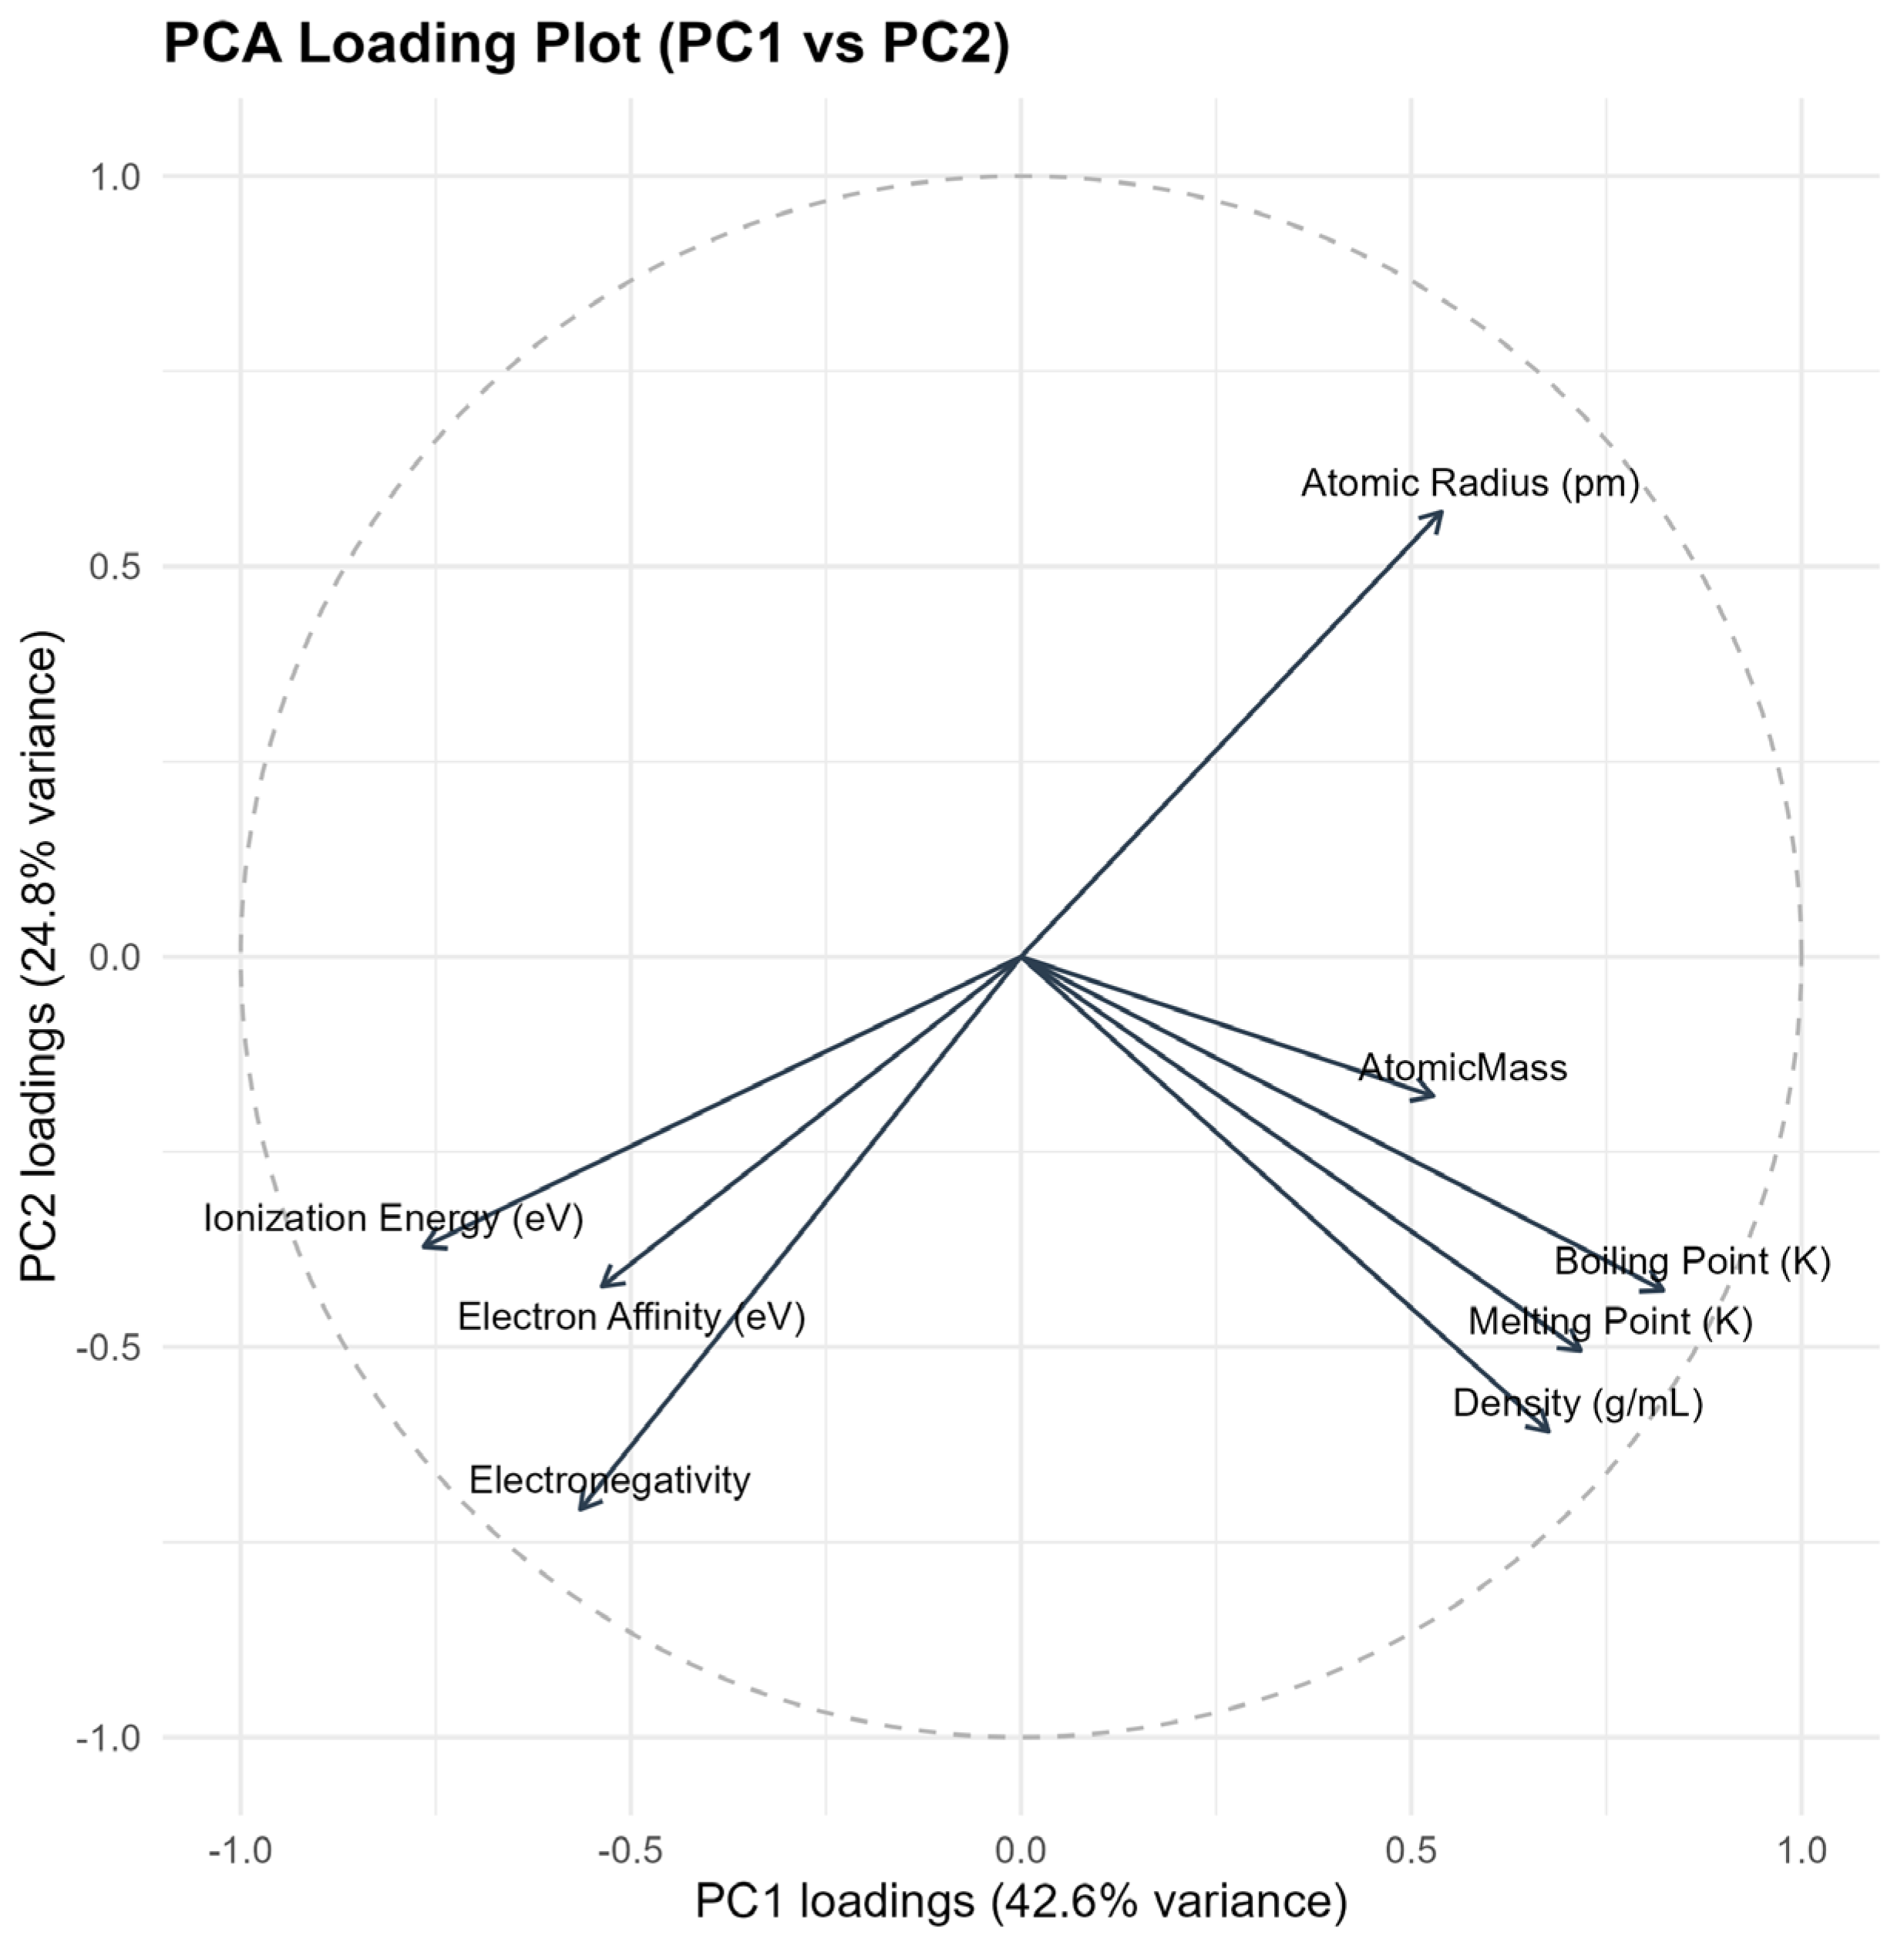
Q26 provided the corresponding loading plot (Figure 7). Ionization energy, electron affinity, and electronegativity were strongly correlated and inversely related to atomic radius, whereas boiling point, melting point, atomic mass, and density formed a separate correlated group. Comparison of the score and loading plots confirms that elements with high mass and thermal properties cluster in the upper-left, while elements with high electronegativity and ionization energy appear on the right.
Figure 7.
Loading plot (correlation circle) from the Principal Component Analysis (PCA) of physicochemical properties of periodic table elements.
5.2. Correlation Plots of the Physicochemical Properties of Elements in the Periodic Table
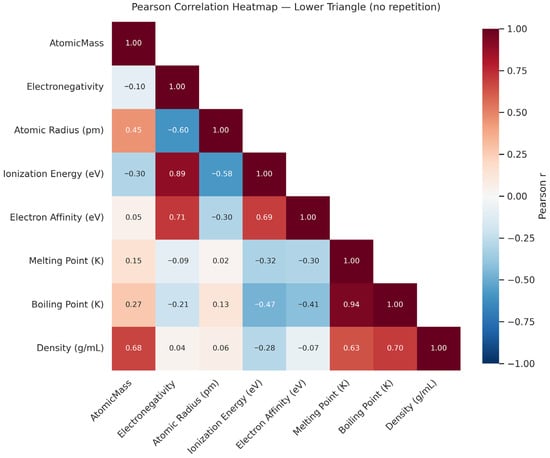
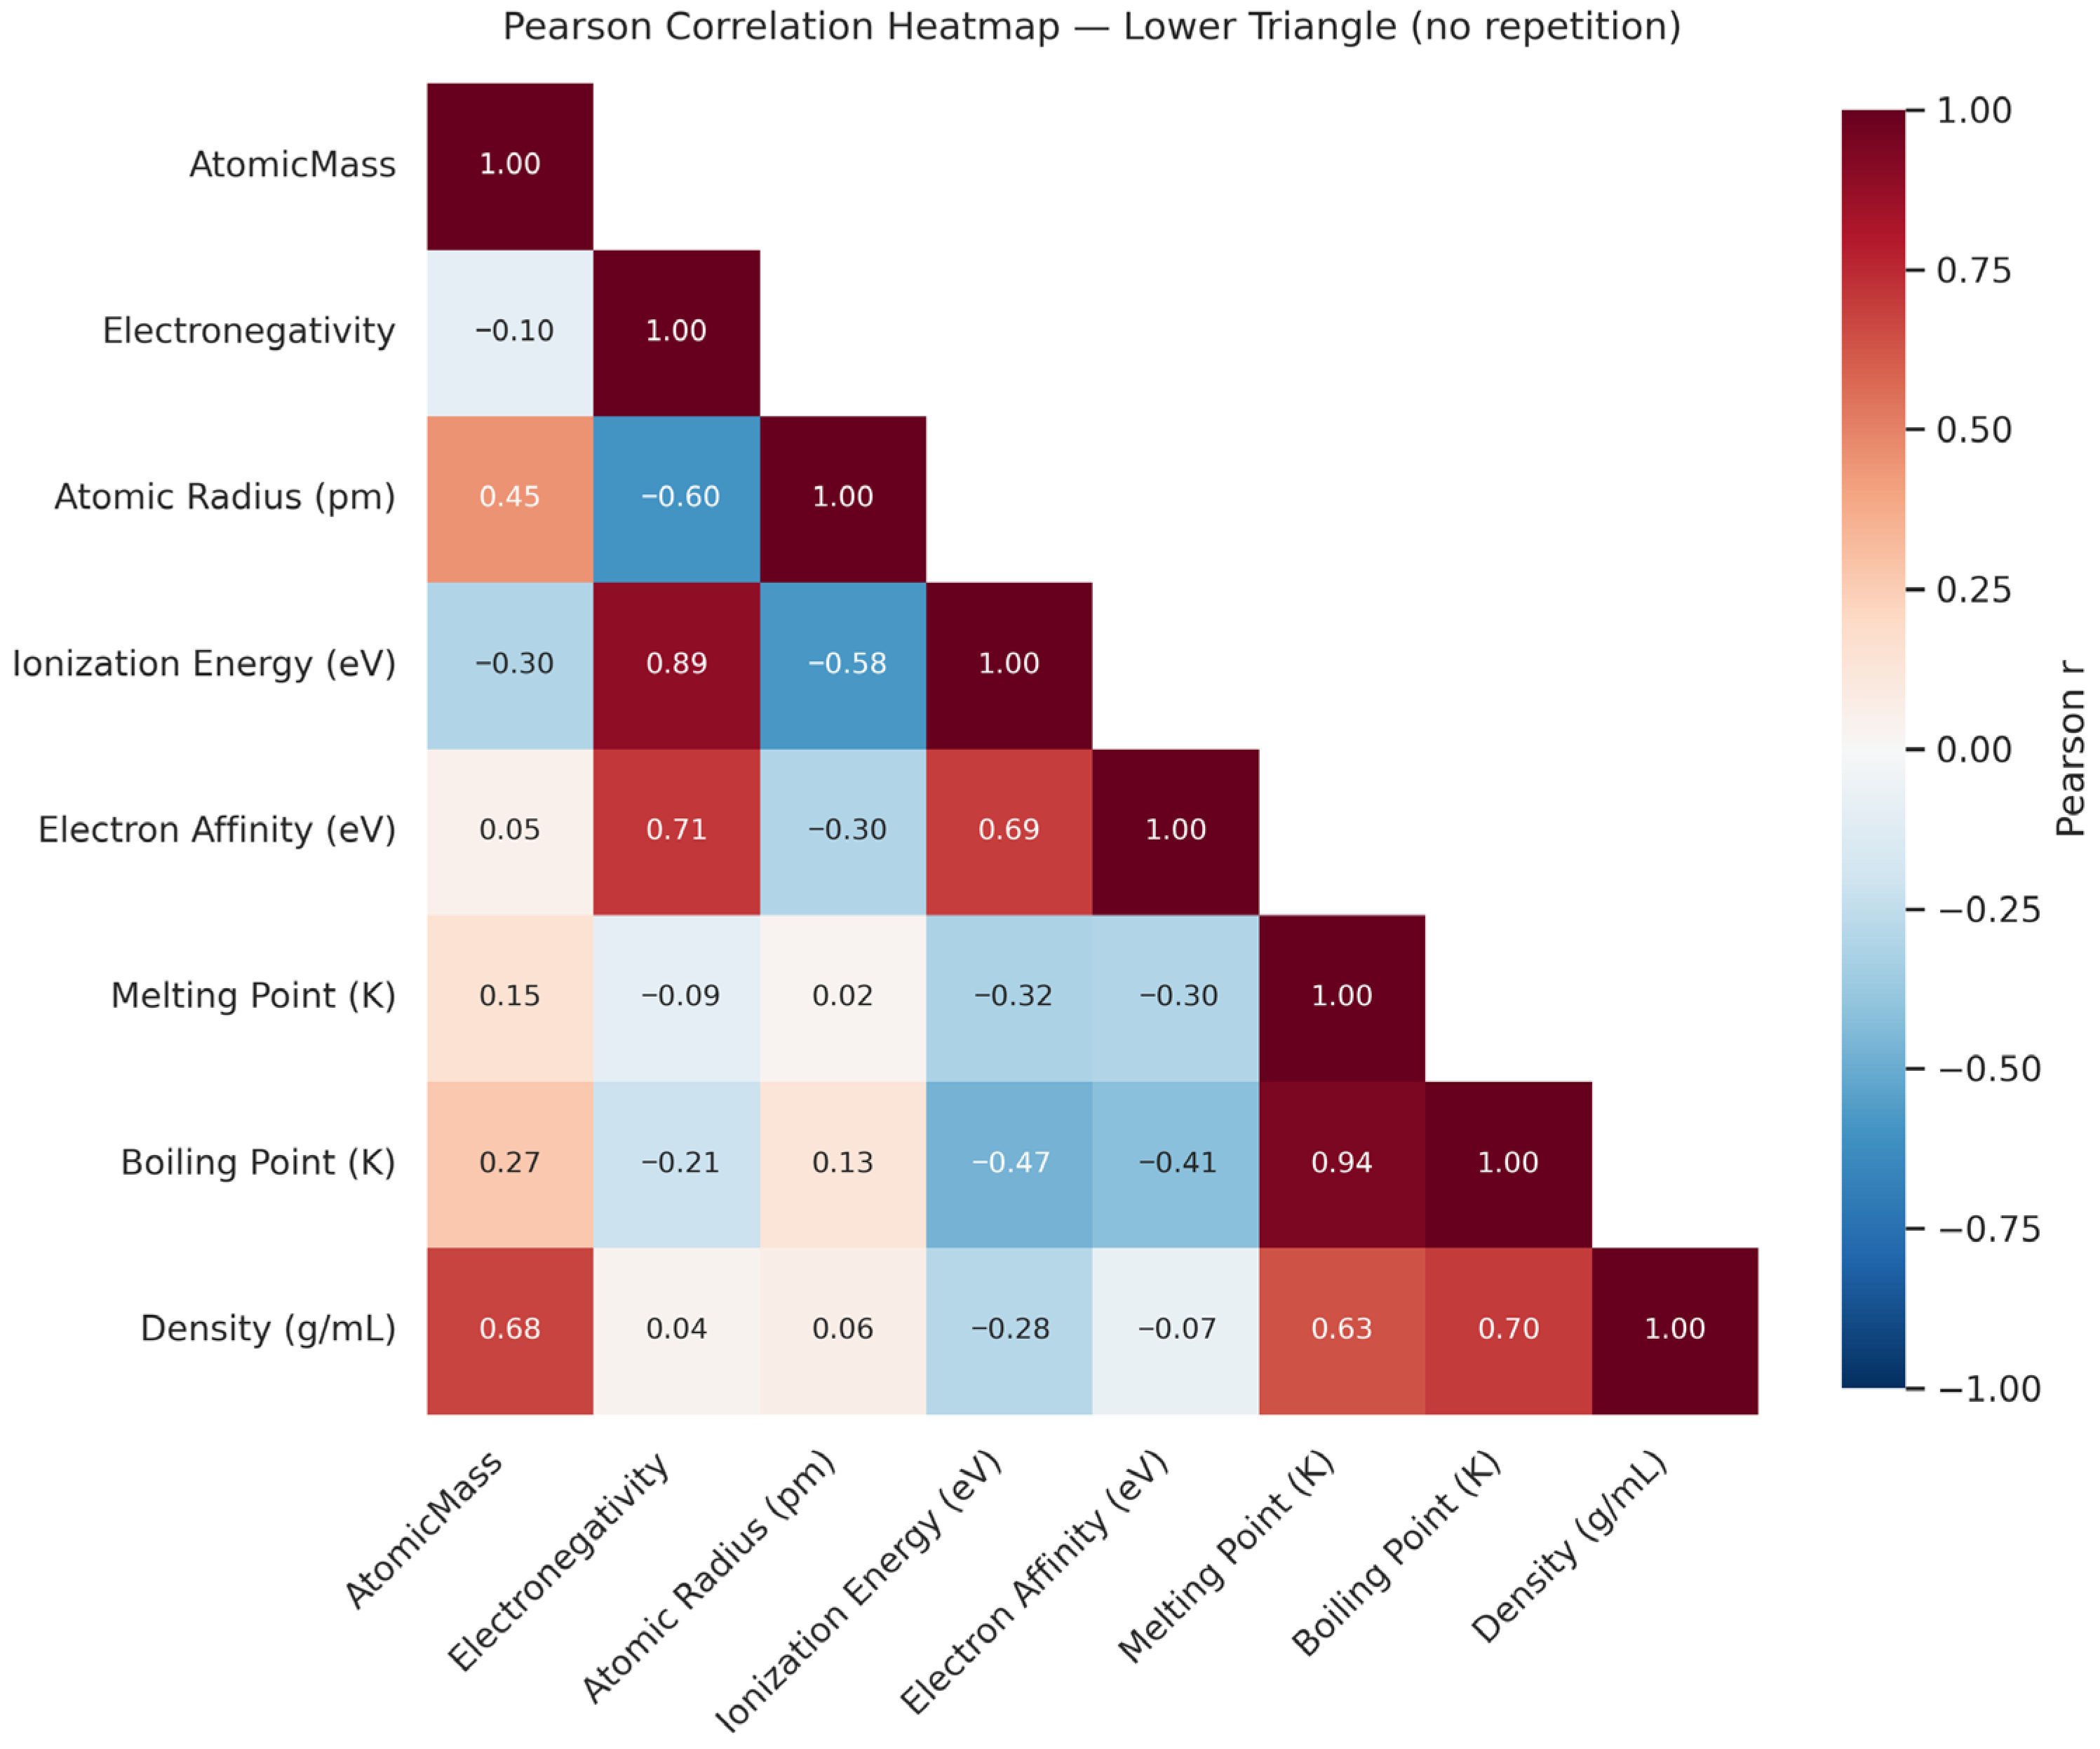
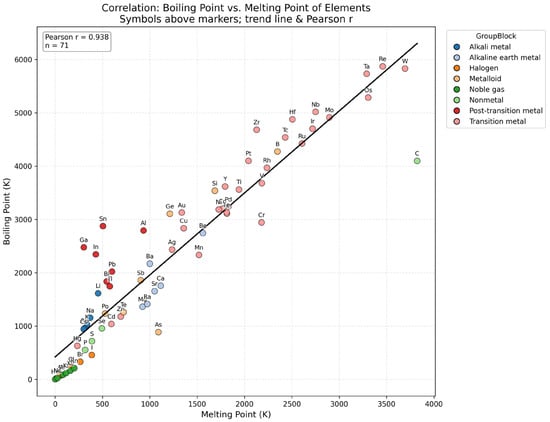
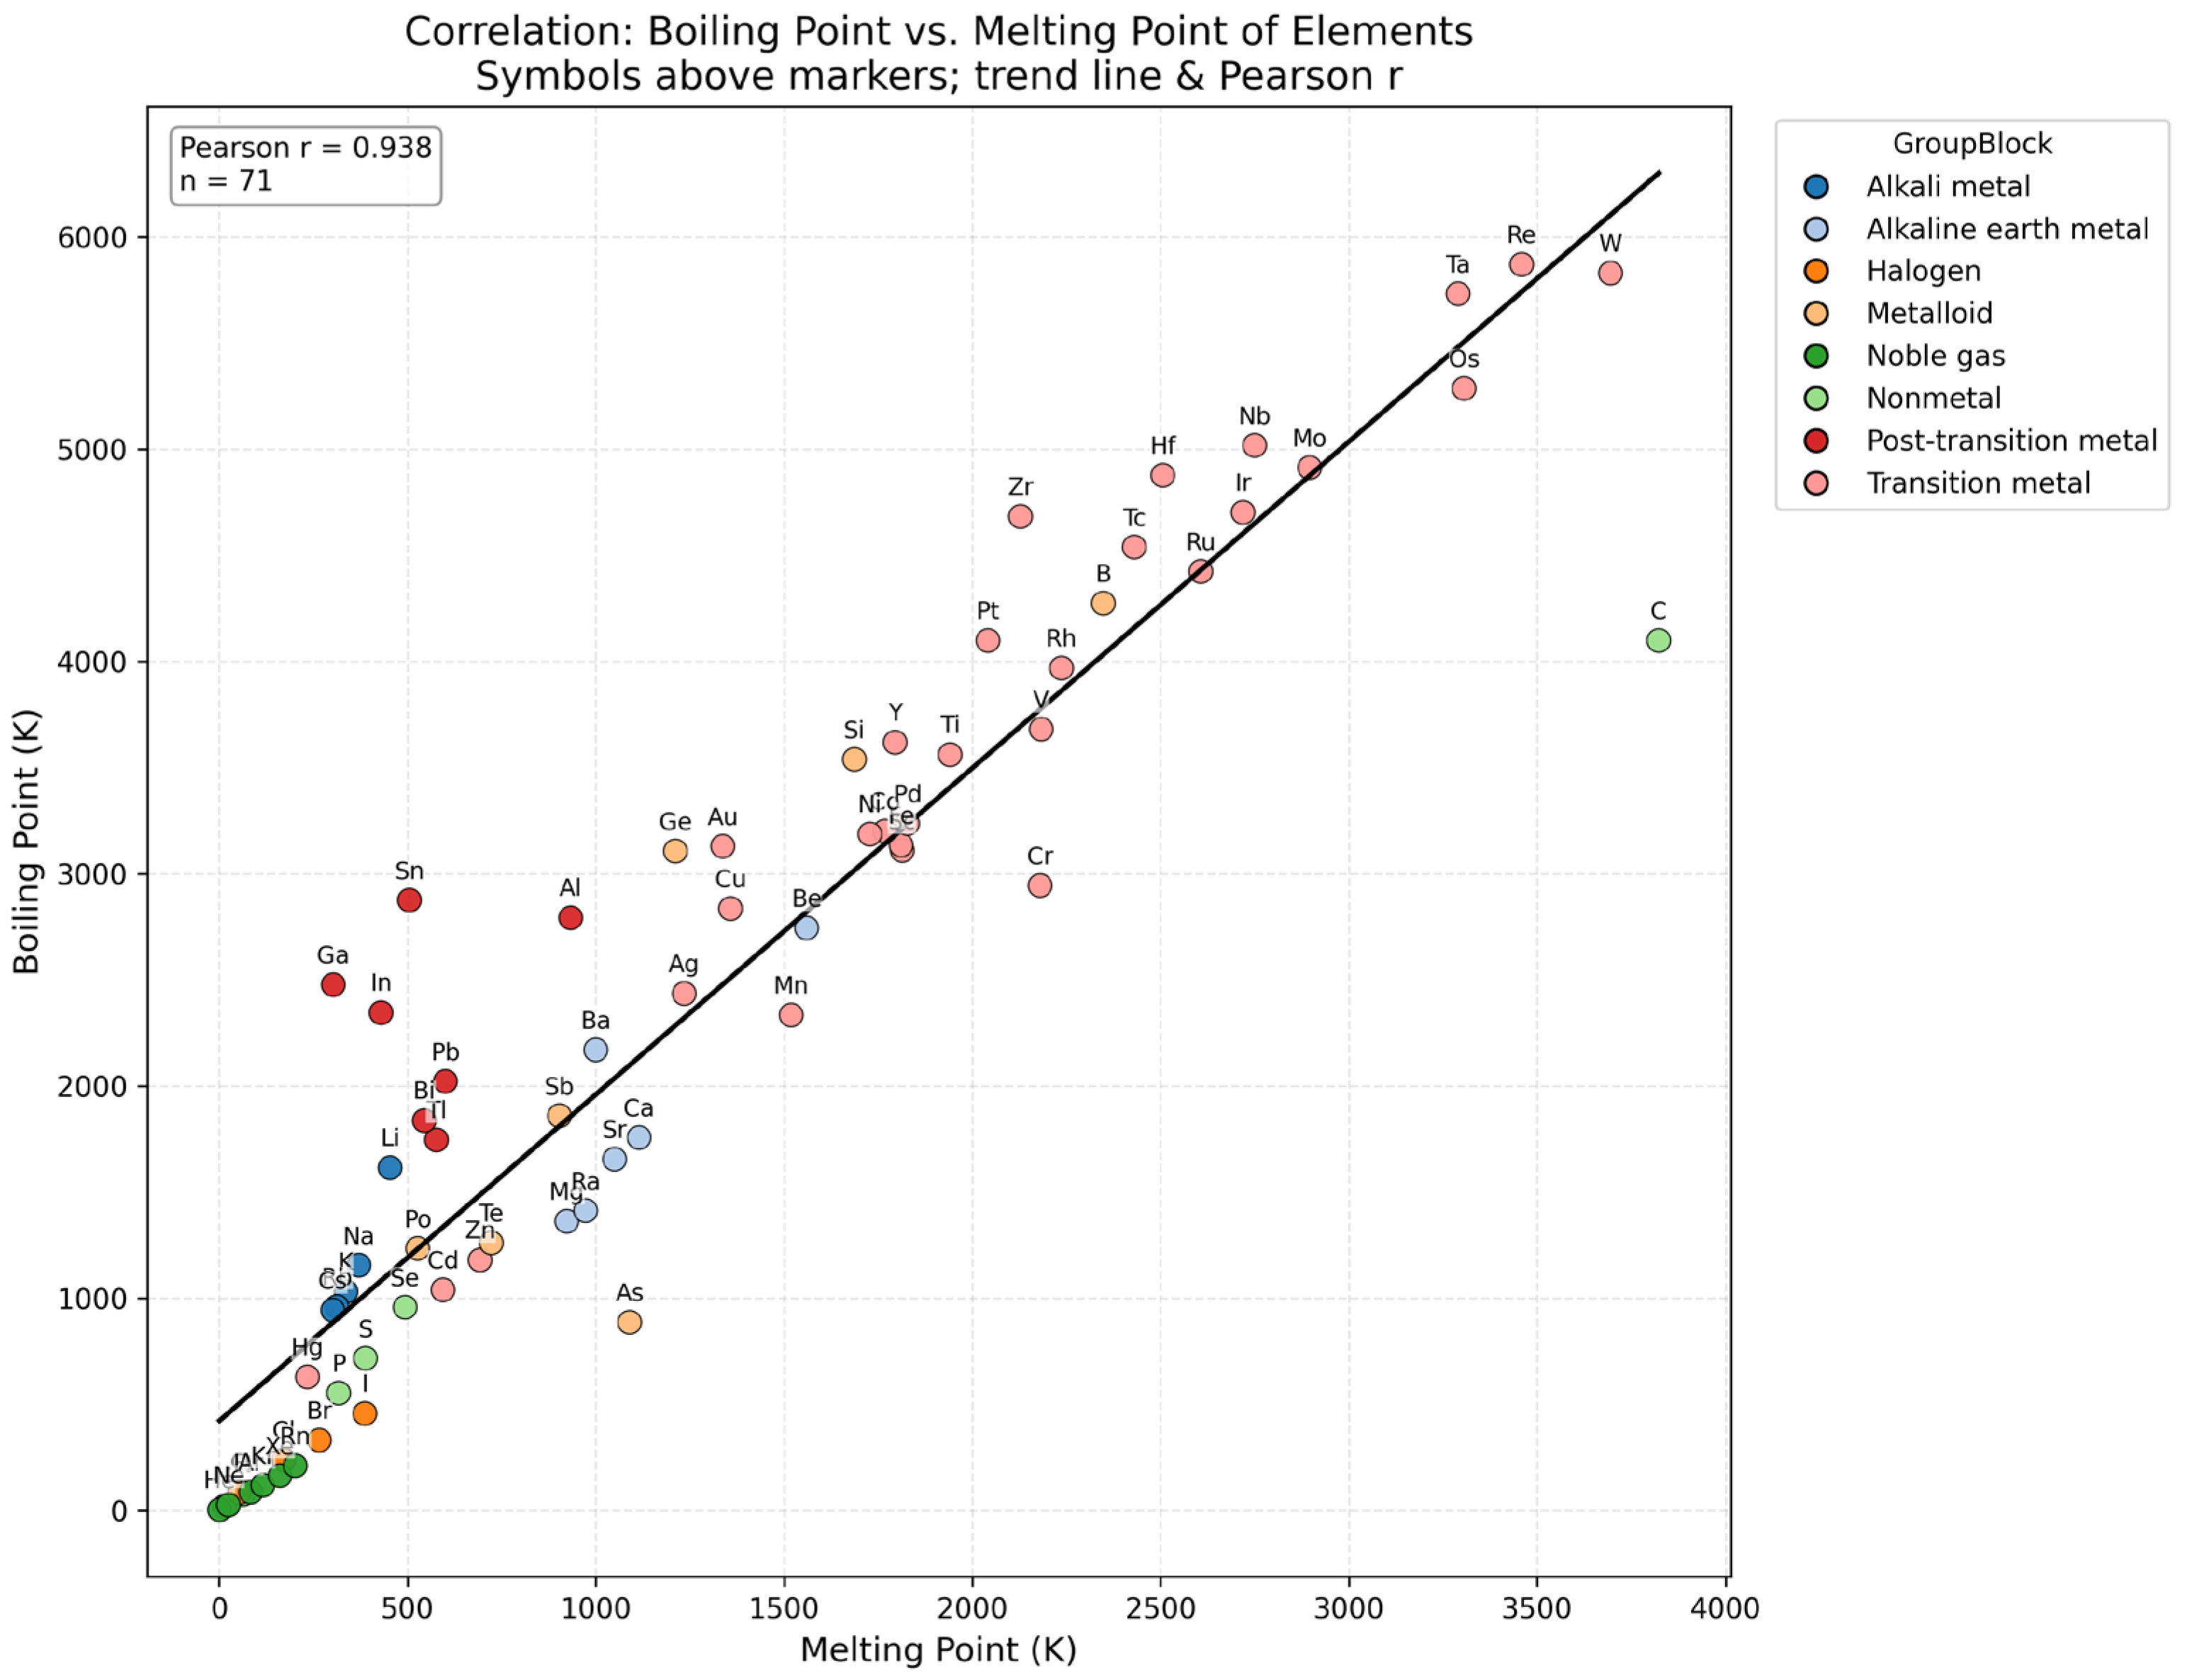
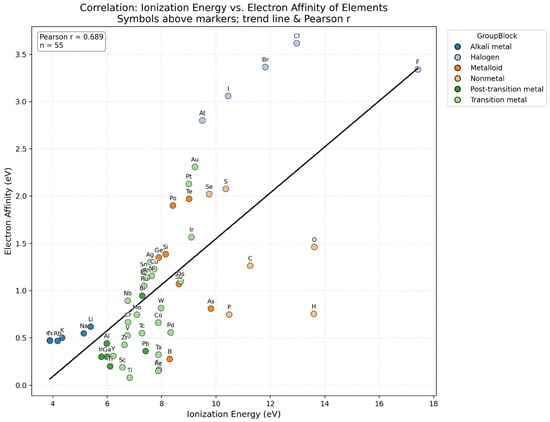
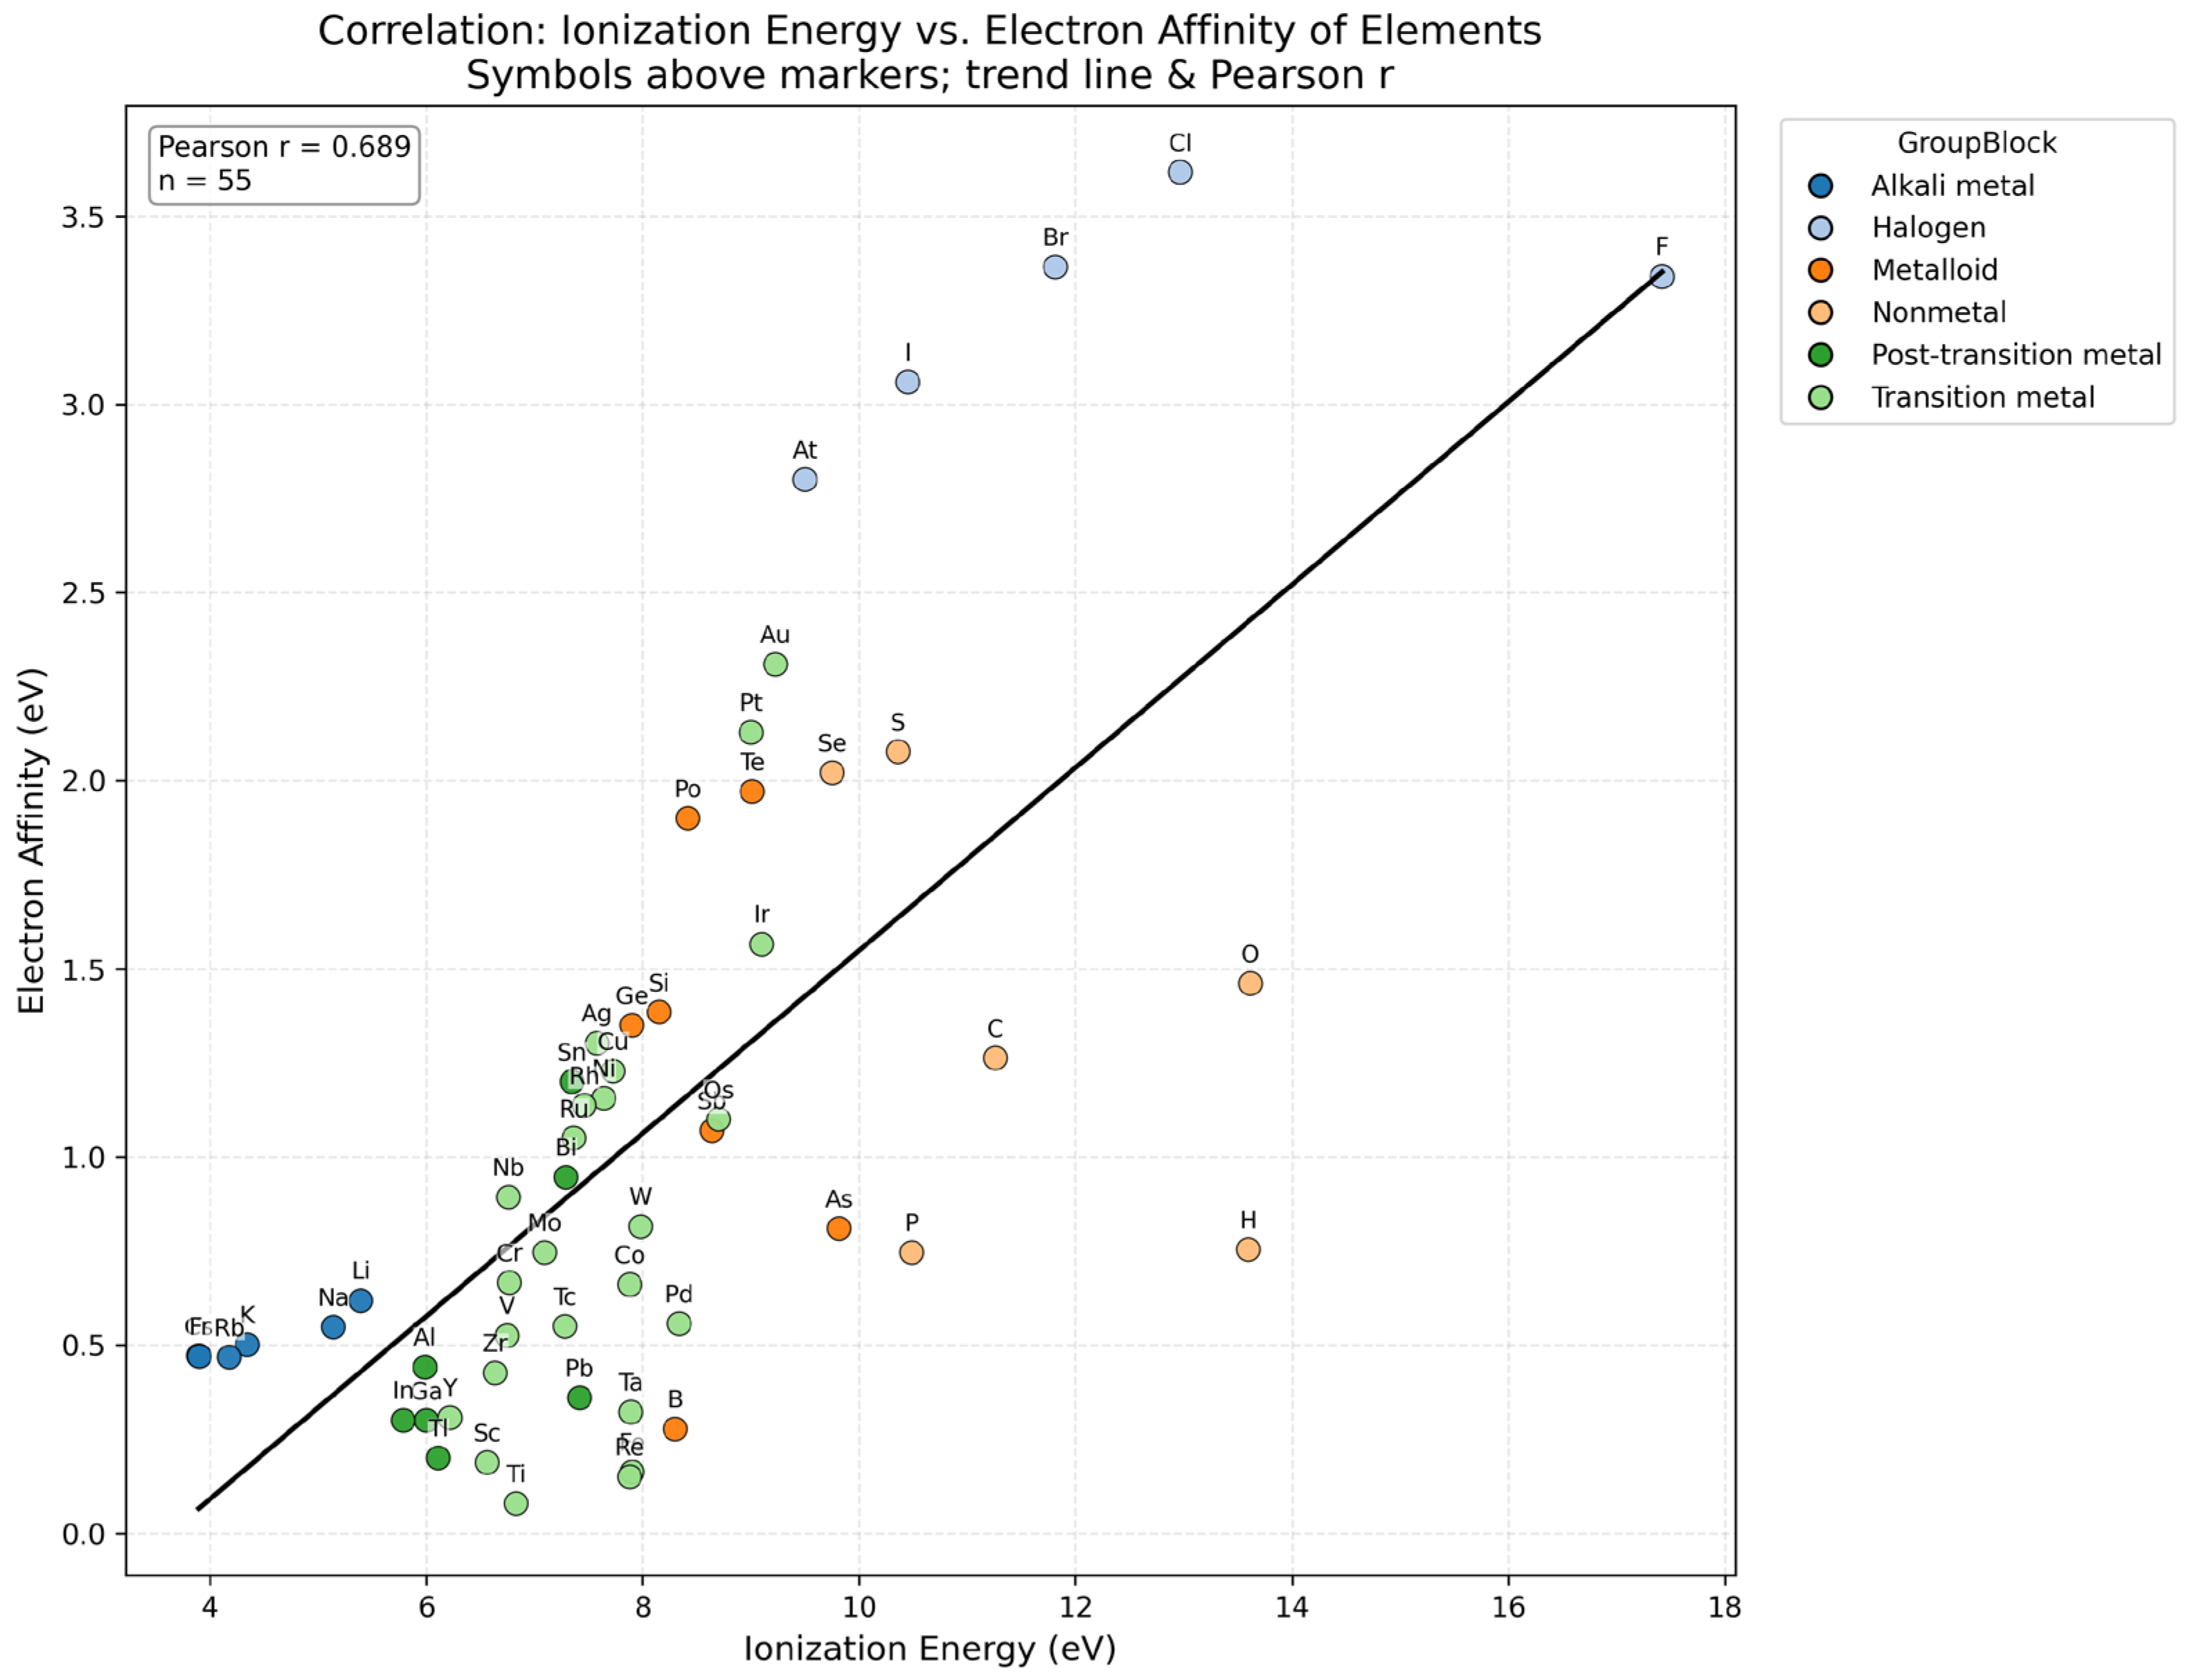
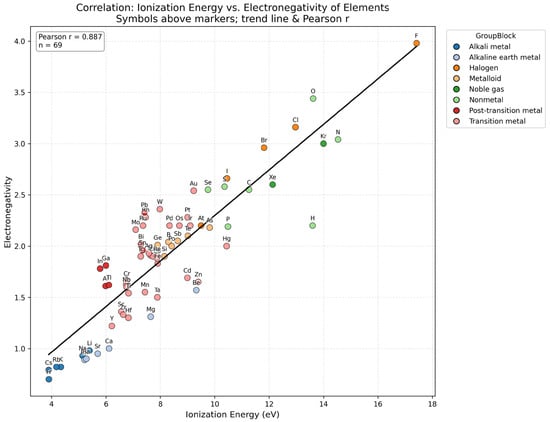
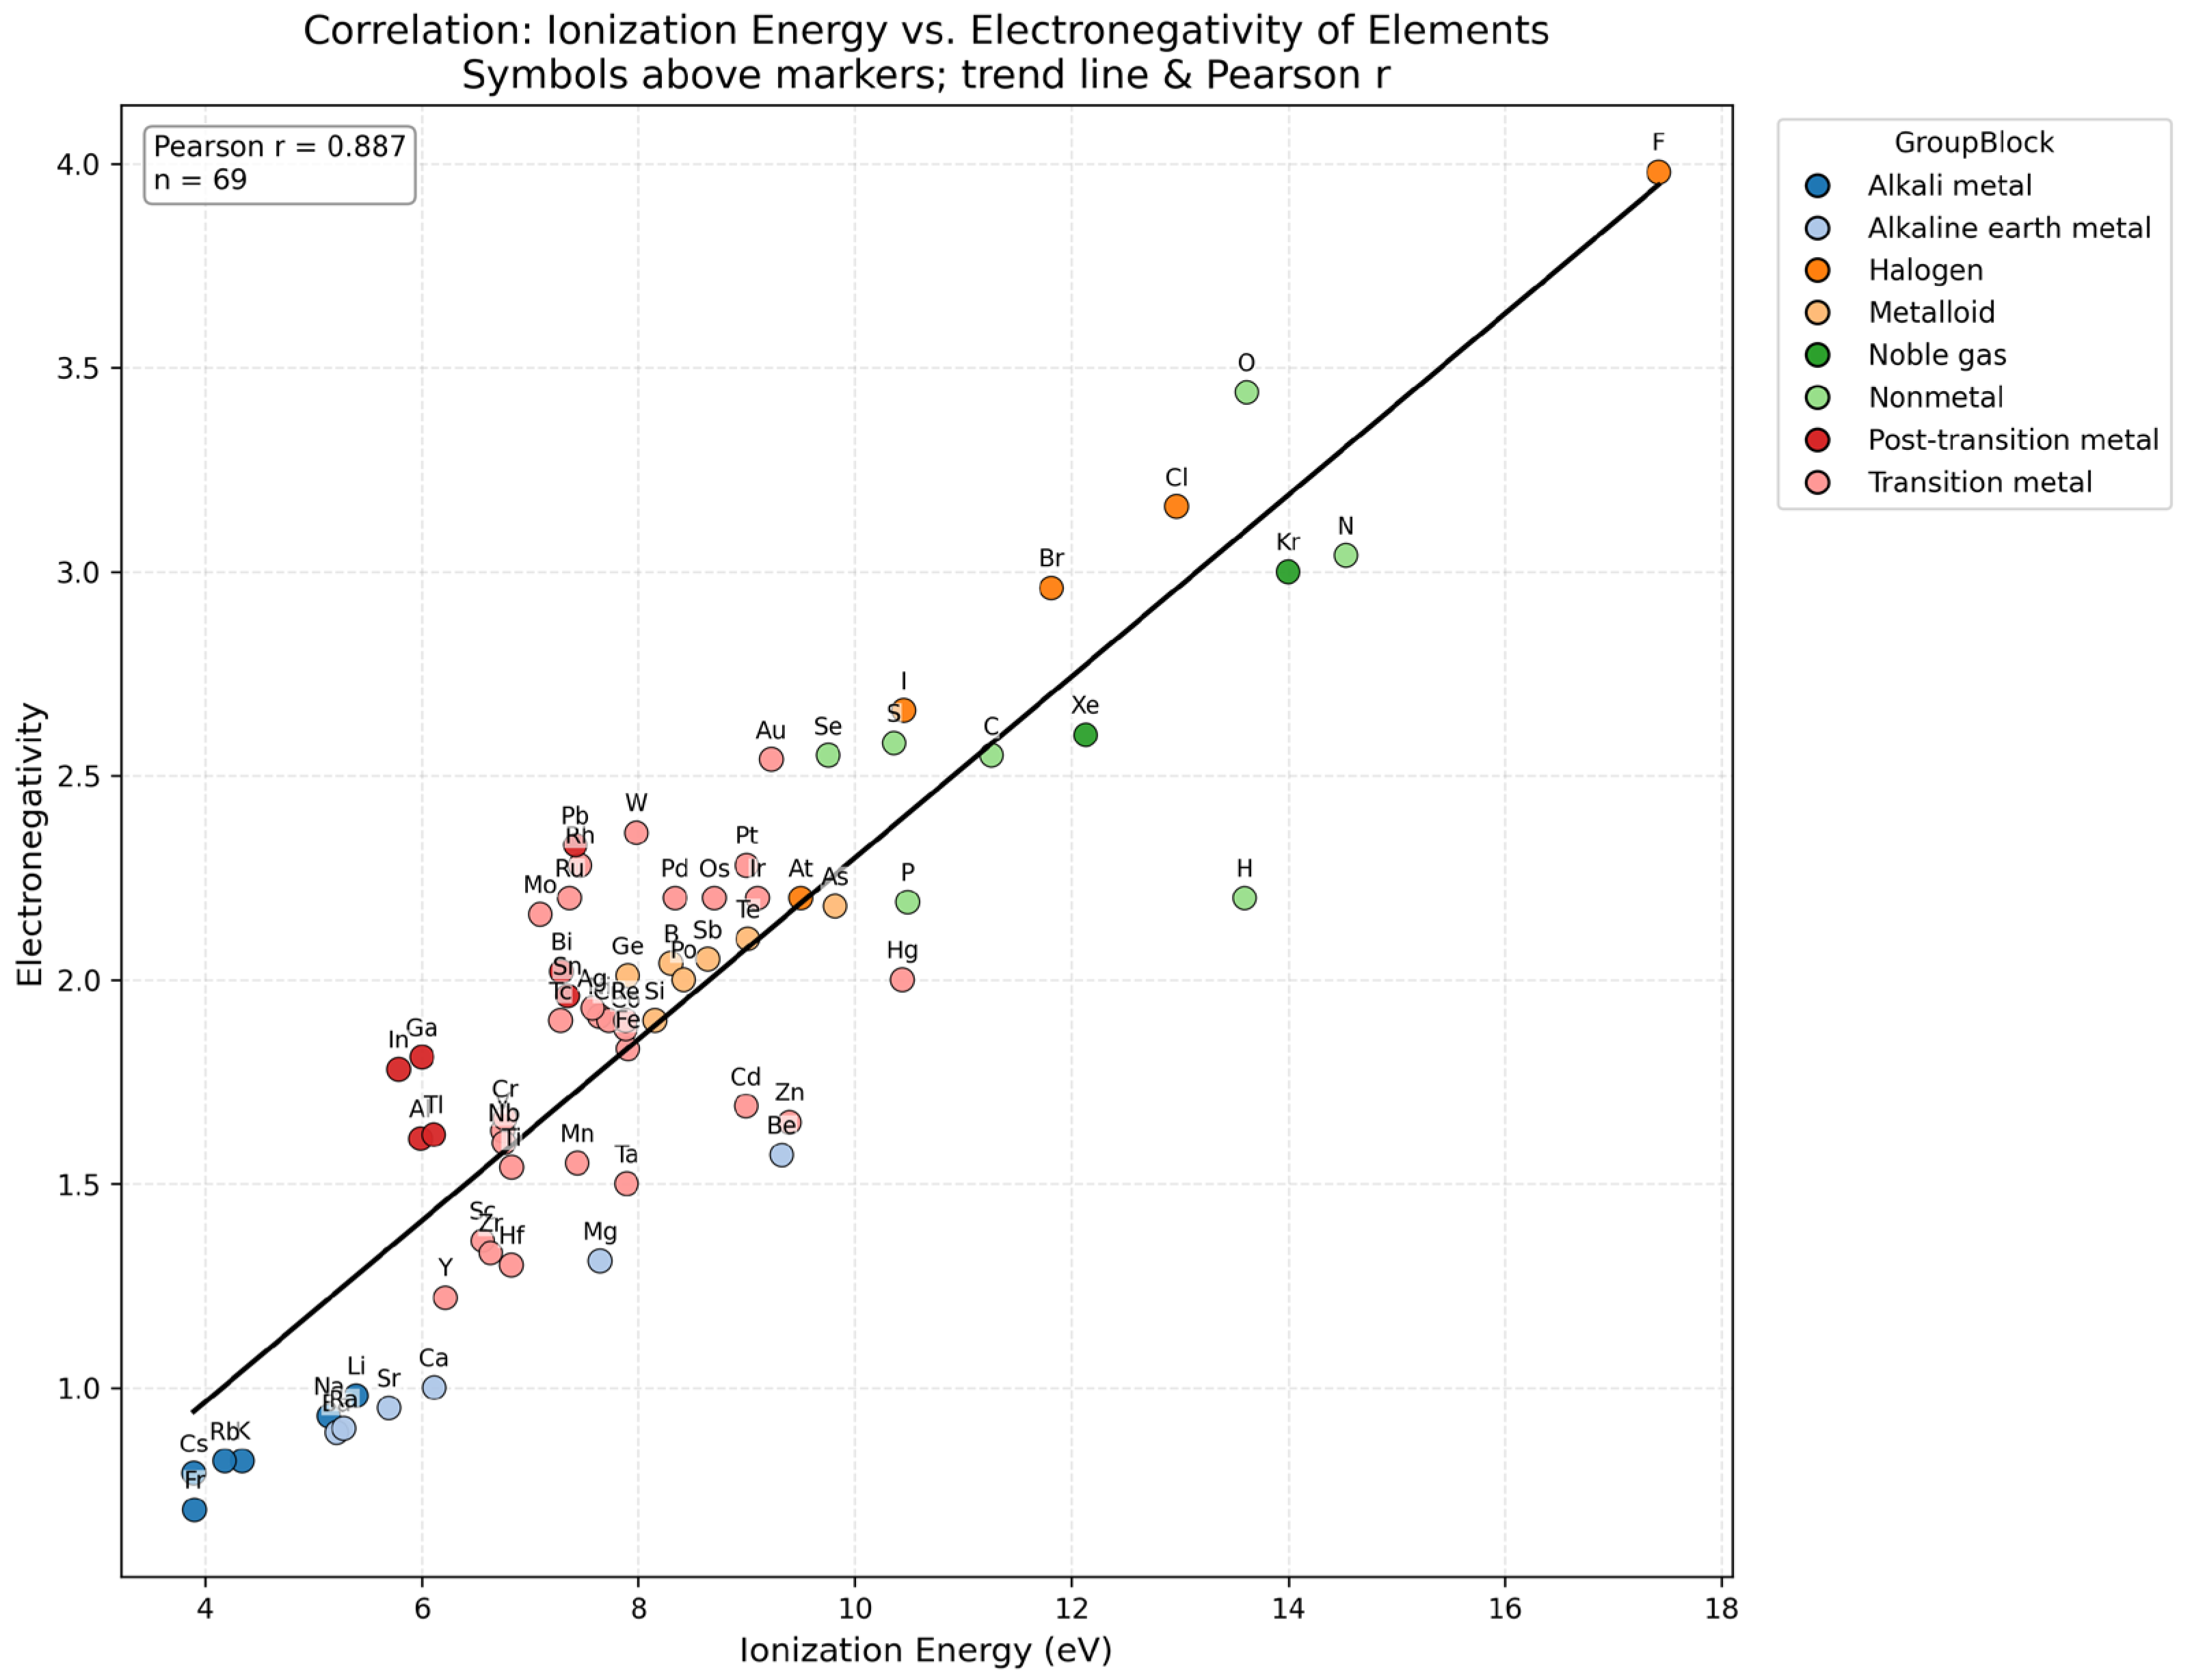
In Q28, the Pearson correlation heatmap (Figure 8) confirmed the correlations observed in the PCA loading plot (Figure 7), highlighting the strength and direction of relationships among physicochemical properties. Q29–Q31 further explored specific correlations. A strong linear relationship between boiling point and melting point was seen (Figure 9), with carbon as an exception, falling outside the trend line. Ionization energy showed a positive correlation with electron affinity (Figure 10), though hydrogen, carbon, oxygen and alkali metals deviated from the other elements trend line. Ionization energy also correlated with electronegativity (Figure 11). These findings demonstrate how correlation plots effectively explore and interpret relationships among periodic table properties.
Figure 8.
Generate a heatmap of the physicochemical properties of periodic table elements using a diverging color scale centered at zero (blue indicating negative correlations, white indicating values near zero, and red indicating positive correlations), with each cell annotated by the corresponding Pearson correlation coefficient (r).
Figure 9.
Boiling Point vs. Melting Point.
Figure 10.
Ionization Energy vs. Electron Affinity.
Figure 11.
Ionization Energy vs. Electronegativity.
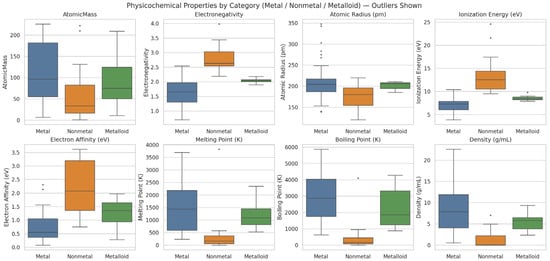
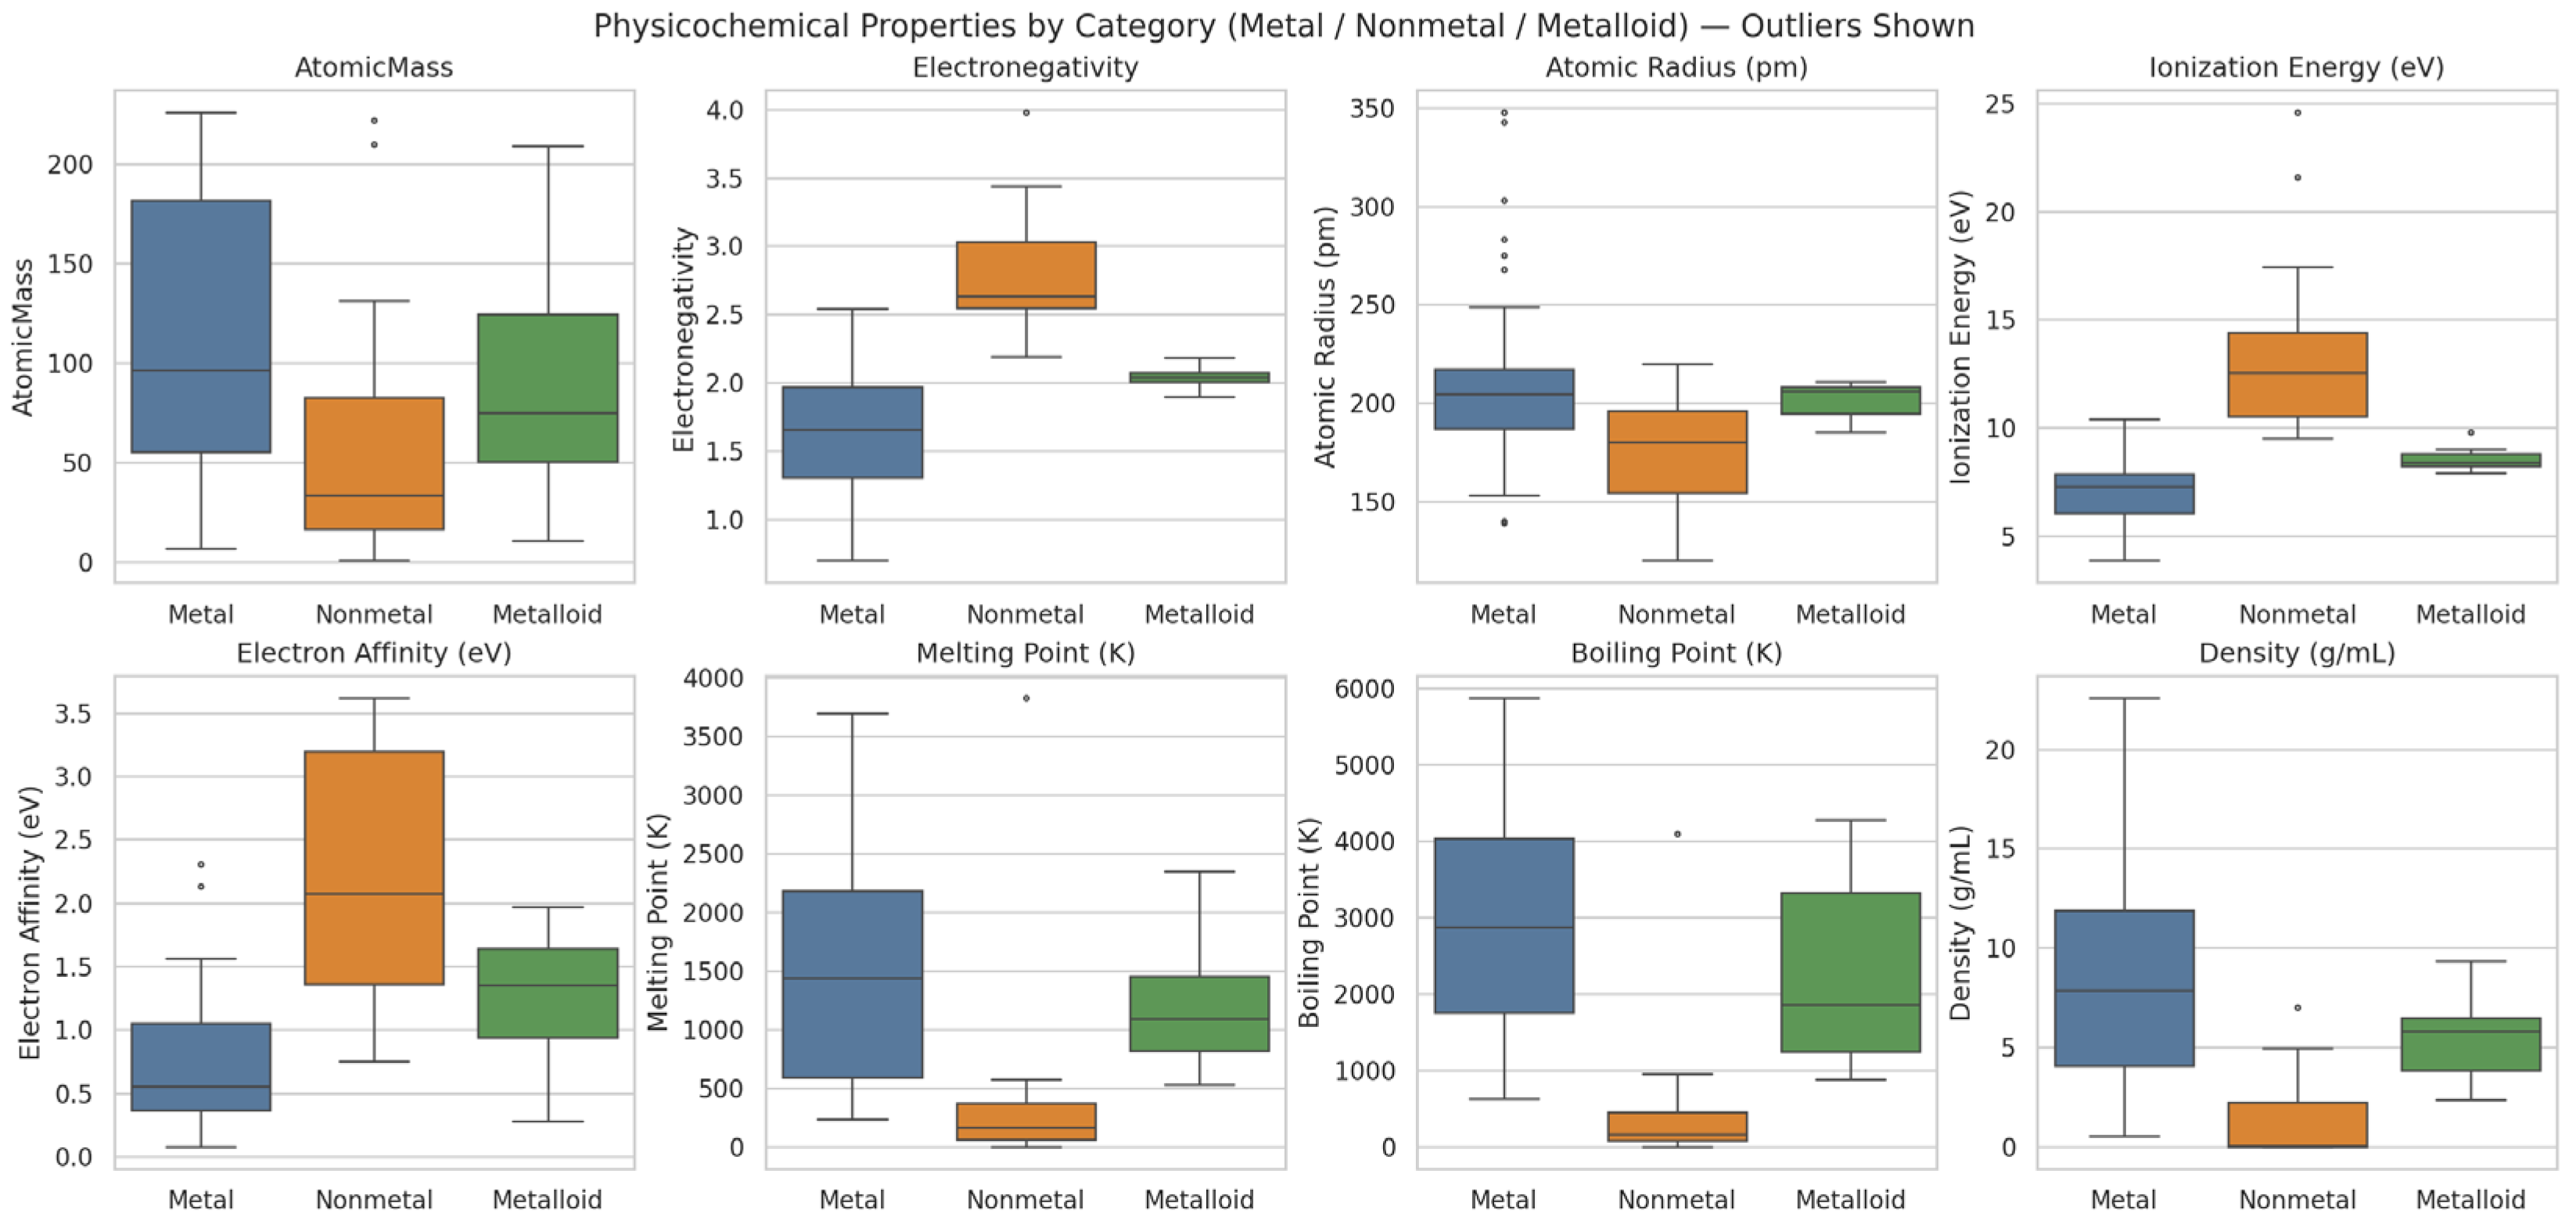
In Q32, the box plots (Figure 12) illustrated the distribution and variability of physicochemical properties within each group, highlighting trends such as higher electronegativity and ionization energy in nonmetals, larger atomic radii and densities in metals, and intermediate values for metalloids. This question focuses on comparing physicochemical properties across different groups.
Figure 12.
Pairwise comparison of eight key properties—Atomic Mass, Electronegativity, Atomic Radius, Ionization Energy, Electron Affinity, Melting Point, Boiling Point, and Density—across three chemical groups (Nonmetal, Metal, Metalloid).
6. Machine Learning
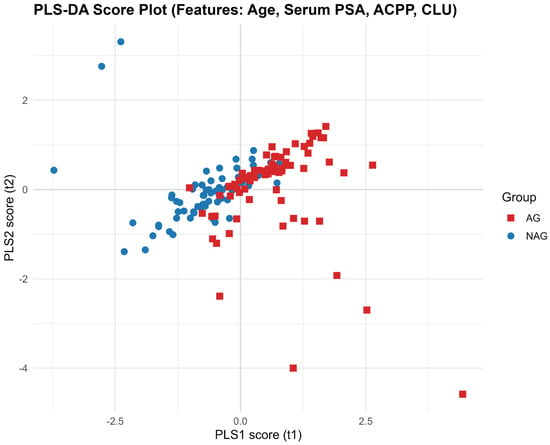
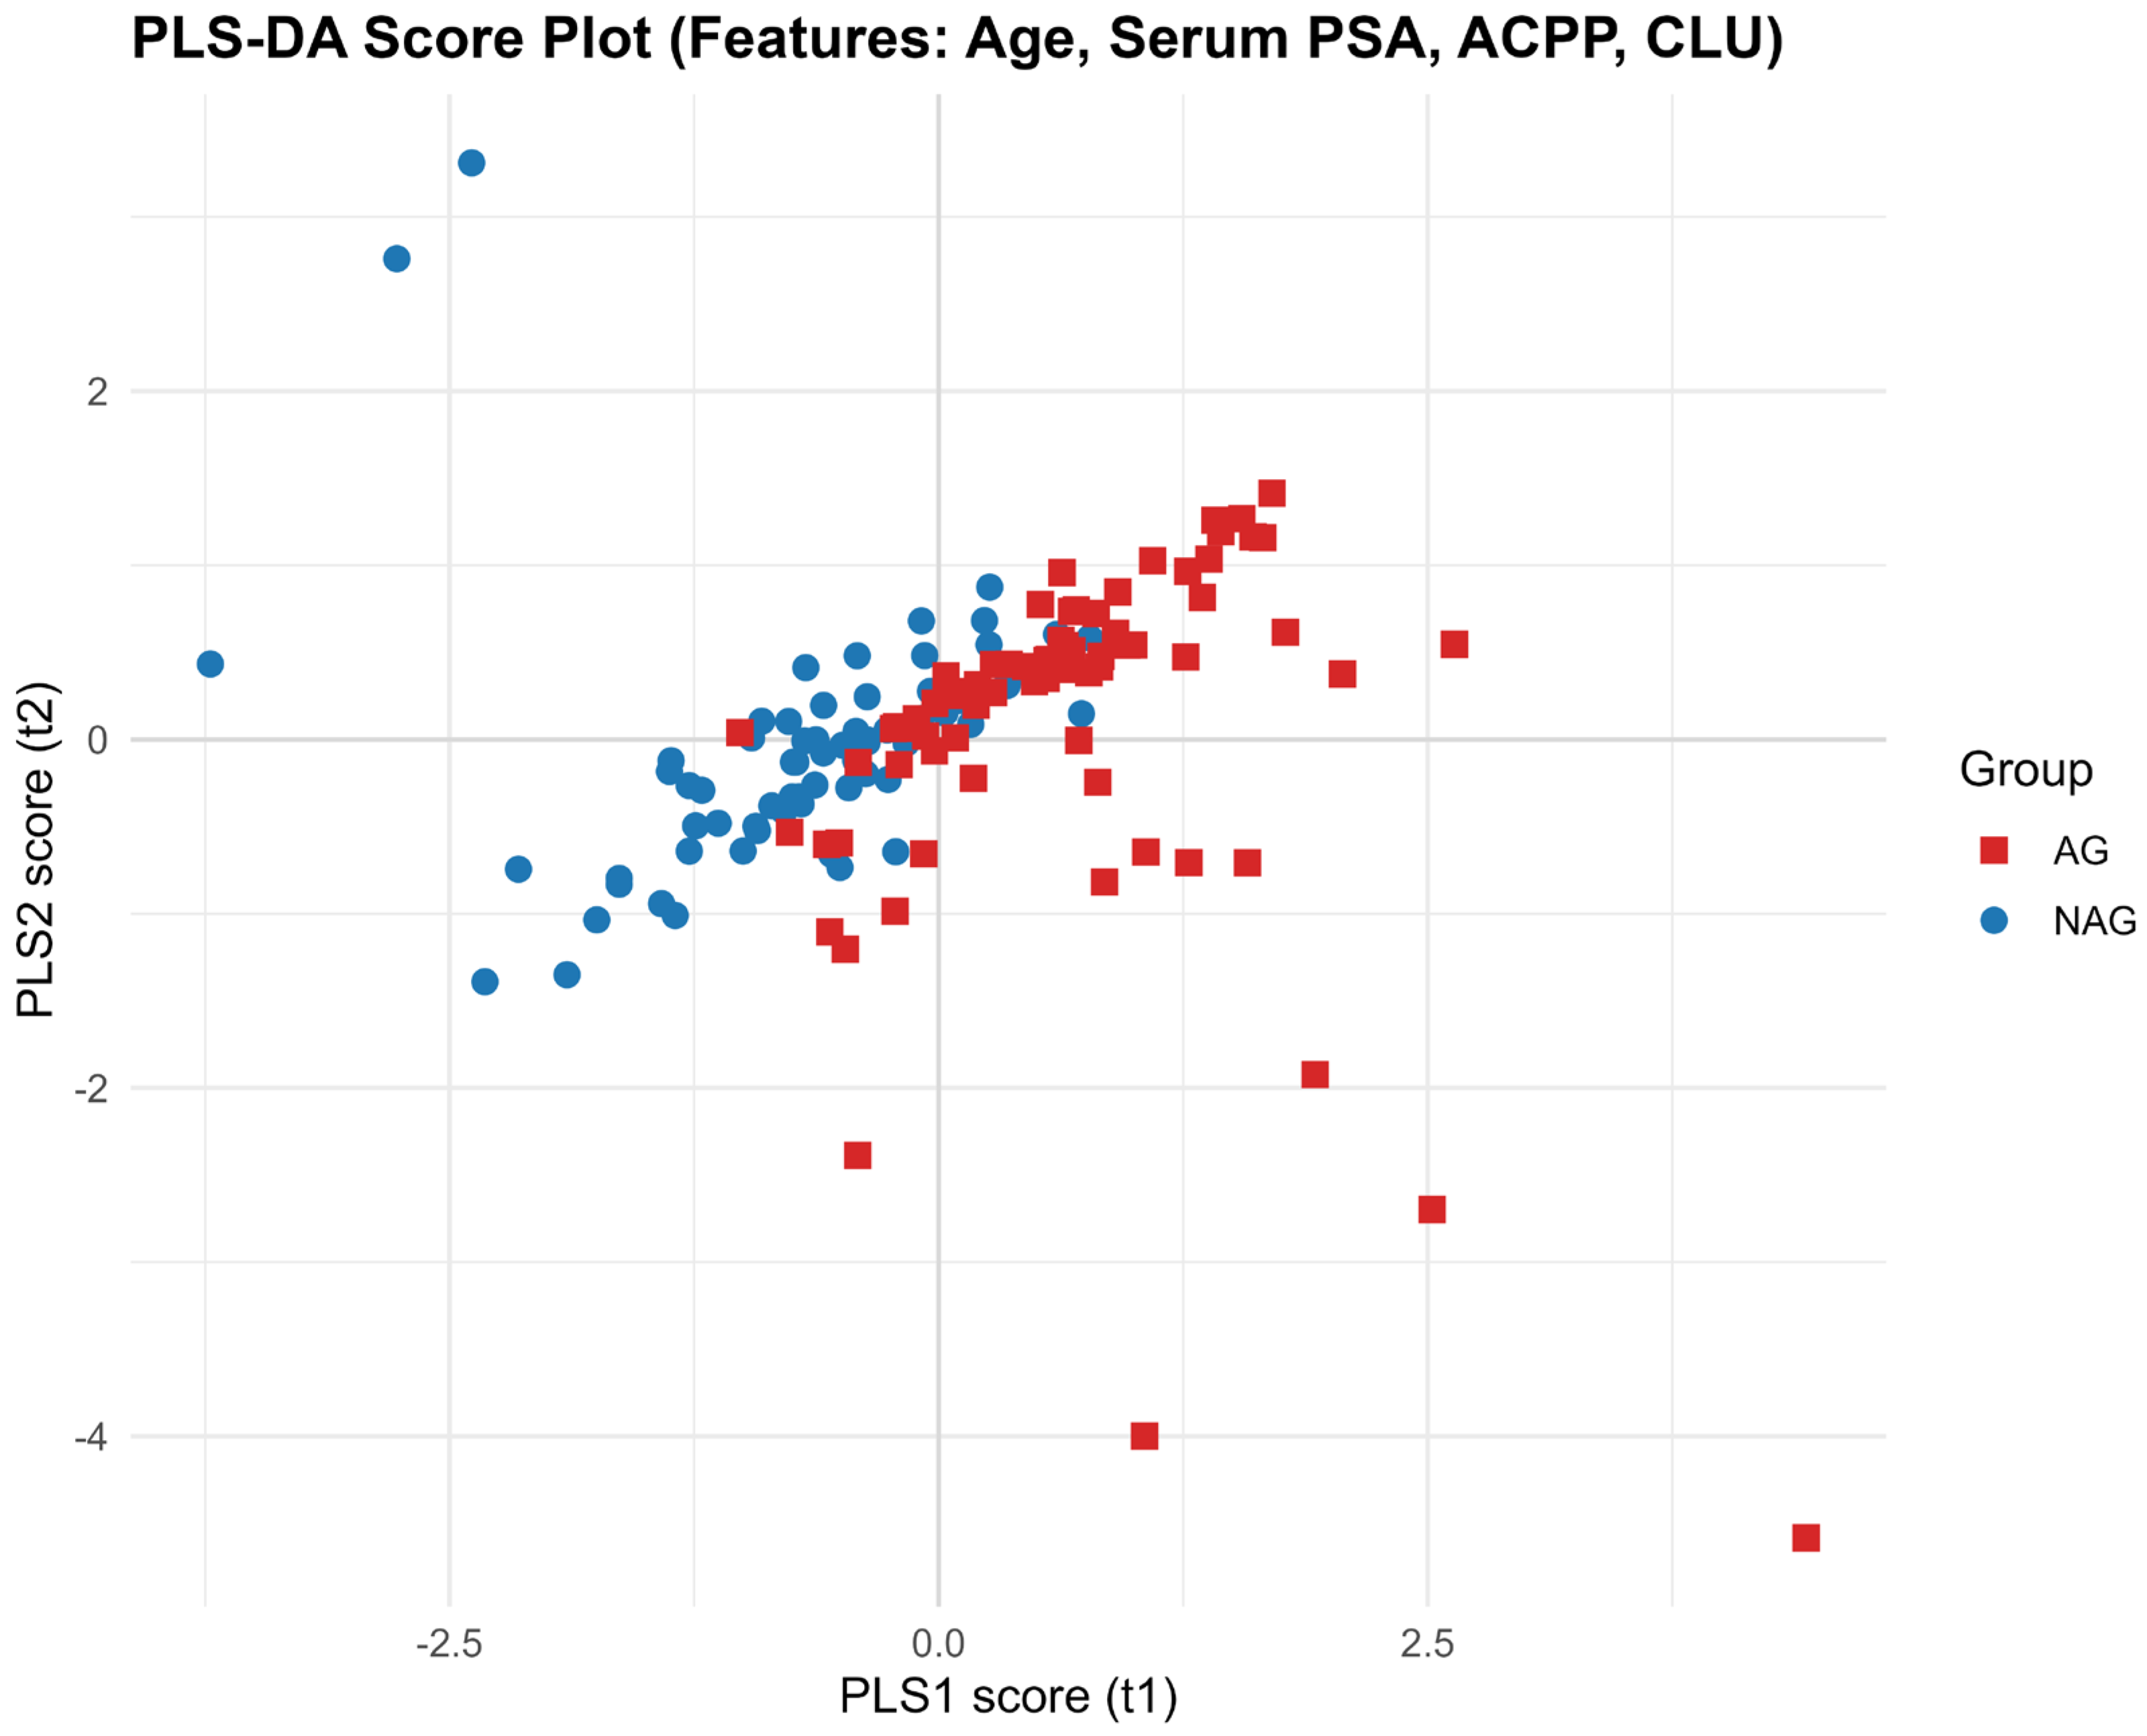
In this section, machine learning was applied to the dataset in Table S1. PLS-DA, a widely used classification method in chemometrics [55,56,57], was used to evaluate the separation between AG and NAG samples. In Q33, Copilot generated a PLS-DA score plot that clearly visualized group separation (Figure 13). It also used autoscaling as data preprocessing in all attempts.
Figure 13.
PLS-DA finds latent variables (LV1, LV2) that are linear combinations of your predictors (Age, PSA, ACPP_FLNE*SYK, CLU_EDALN*ETR) and are maximally associated with the group label (AG vs. NAG).
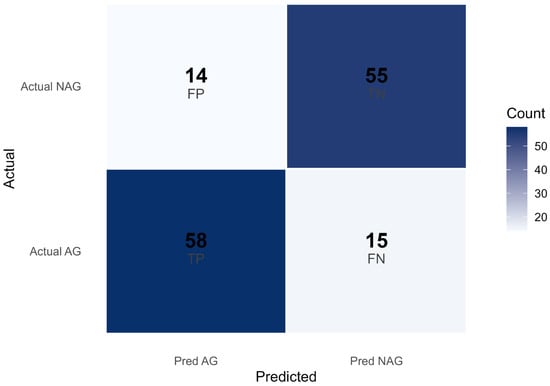
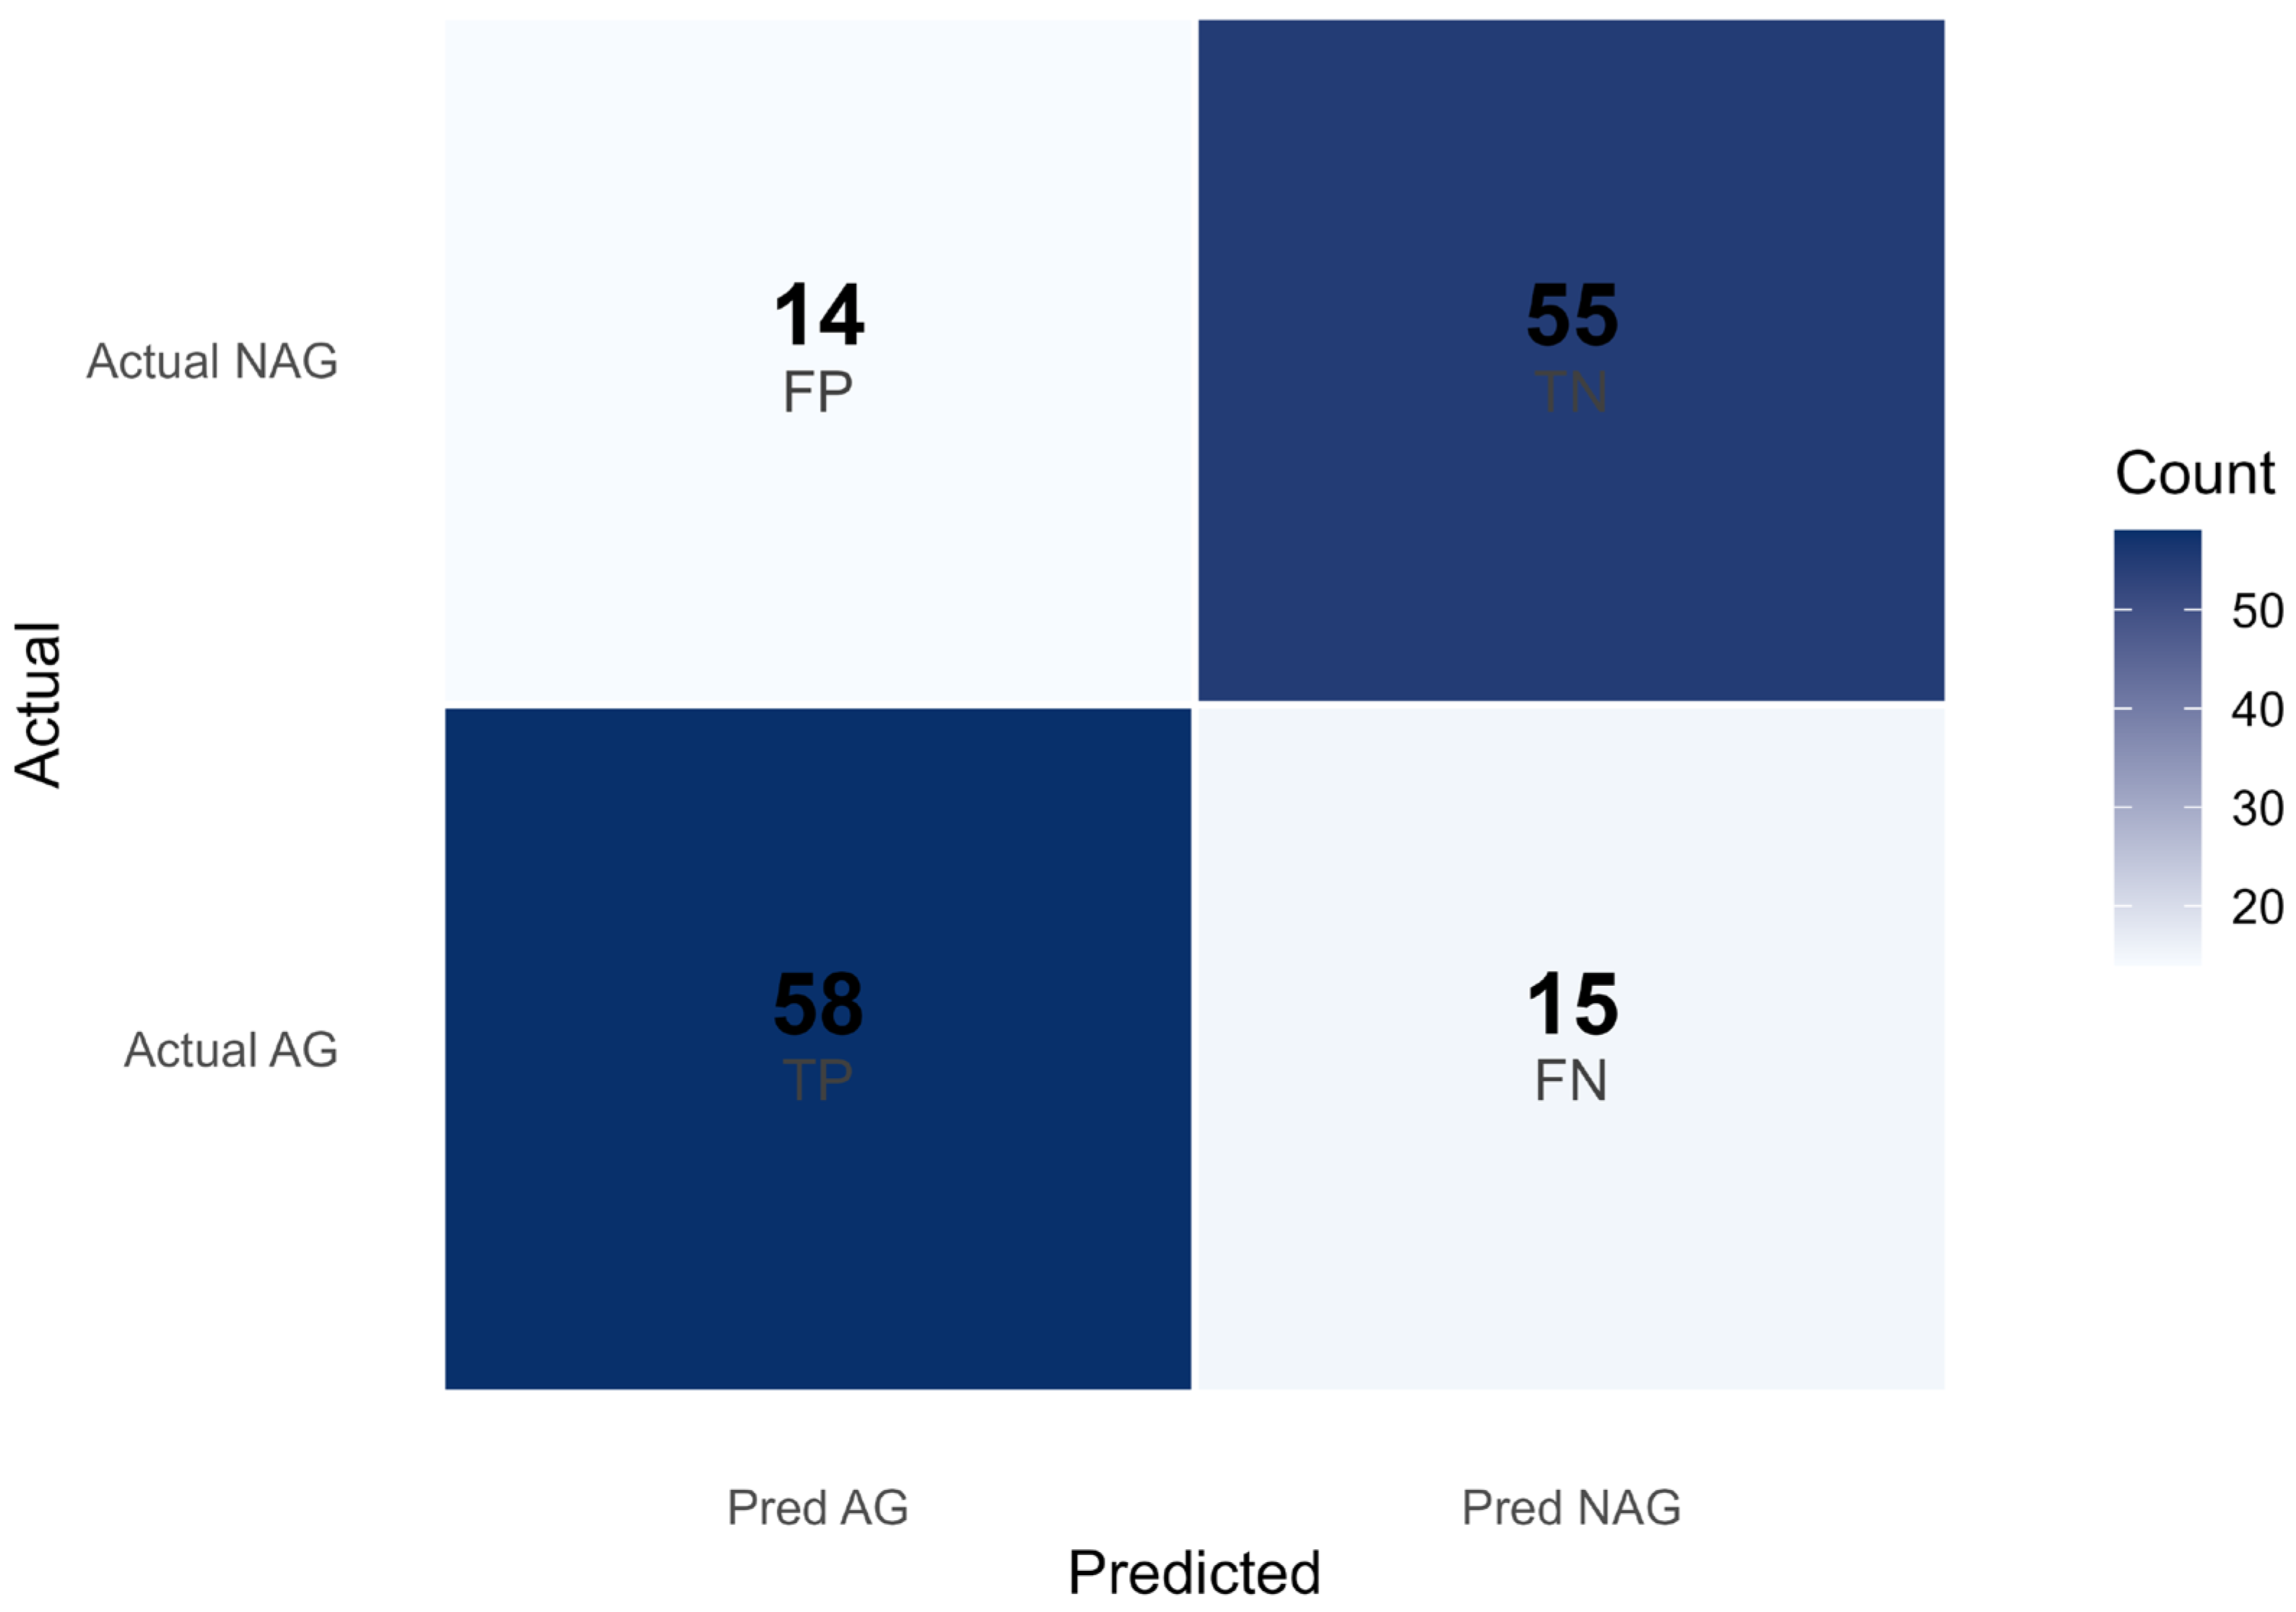
In Q34, model performance was assessed using a 5-fold cross-validation confusion matrix (Figure 14). These results demonstrate that Copilot can also perform machine-learning tasks, a capability of substantial value for researchers and for teaching chemometrics.
Figure 14.
5-fold stratified cross validation confusion matrix for a two-component PLS-DA classifier built from columns D–G (Age, Serum PSA, ACPP_FLNE*SYK, CLU_EDALN*ETR), treating AG as the positive class and NAG as the negative class.
7. Image Interpretation and Generation in Classroom
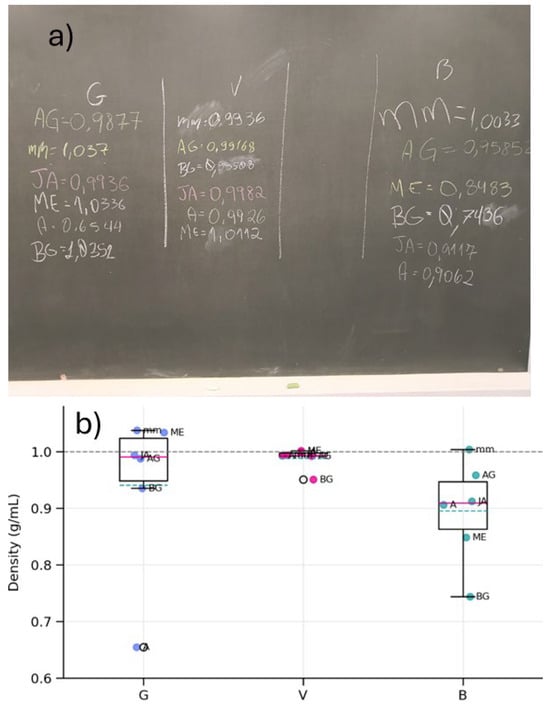
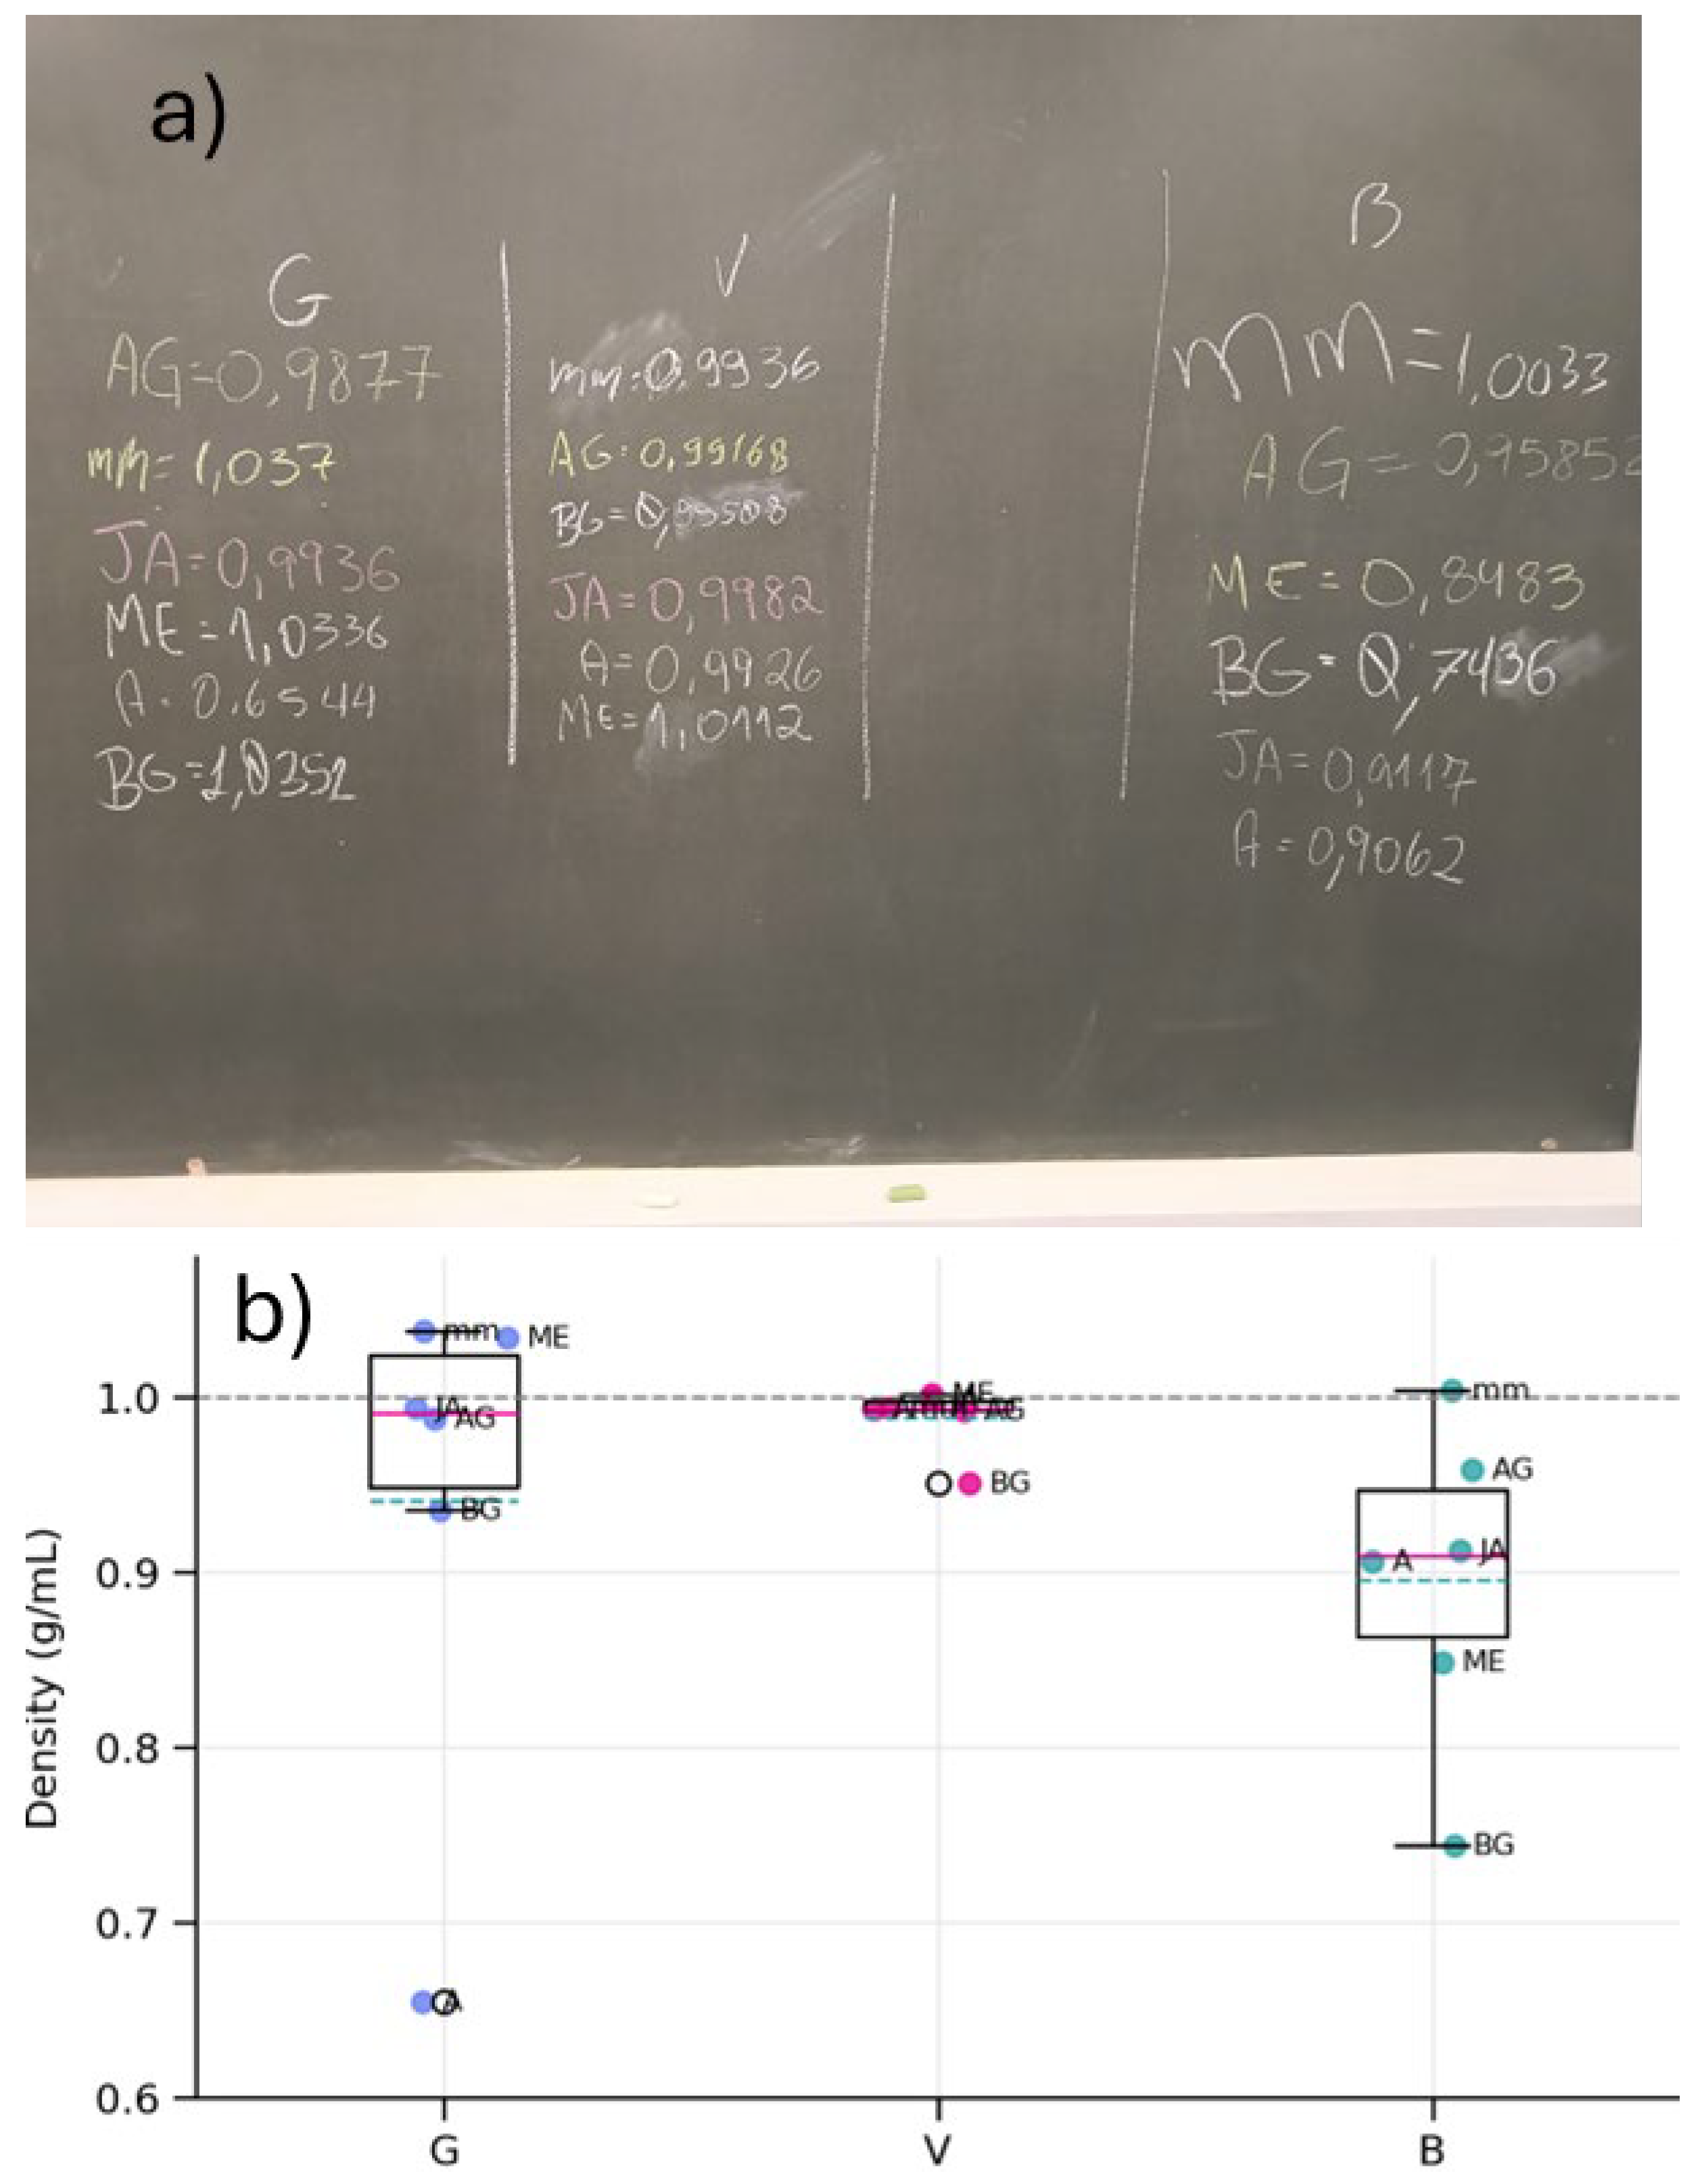
LLMs can also upload and analyze images [7,8], where their ability to process data and generate visual representations—can be effectively integrated into laboratory instruction. In one activity, students measured the density of water using three types of glassware: a beaker (B), a volumetric pipette (V), and a graduated pipette (G). The goal was to demonstrate the limited precision of beakers compared with the greater accuracy and reliability of pipettes. This hands-on exercise, enhanced by LLMs data visualization, reinforced concepts in measurement precision [58].
At the end of the class, students wrote their results on the chalkboard, and an image of the data was captured and uploaded to Copilot application using a student’s smartphone (Figure 15a). When Q35 was prompted, Copilot generated the box plots (Figure 15b) and provided a data-driven discussion. The box plots clearly showed that the beaker yielded less precise results (larger IQR) compared to the pipettes, and that the pipettes were more accurate, as their median values were closer to the reference density (1.00 g/mL).
Figure 15.
(a) Water density determined by students during a general chemistry laboratory class, (b) box plots generated using Copilot. G: Graduated pipette. V: Volumetric pipette. B: Beacker.
Copilot enabled real-time data interpretation and visualization, supporting conceptual understanding. Each student was able to generate and analyze box plots directly on their own smartphone, promoting engagement and deeper understanding of the concepts discussed.
8. Hallucinations in Large Language Models: Confident Outputs Without Factual Grounding
LLM hallucinations refer to instances in which a model generates fluent, coherent, and seemingly authoritative responses that are factually incorrect, unsupported by the input data, or inconsistent with established knowledge, often without explicitly signaling uncertainty [59,60,61].
8.1. Q1–Q16
On 30 December 2025, Questions 1–16 were independently prompted, in a single attempt, to four large language models: ChatGPT (GPT-5.2), DeepSeek (v3.2), Gemini 3, and Copilot. All chatbots produced identical numerical answers for all questions on their first response (Table 3). This complete agreement demonstrates that contemporary LLMs are capable of accurately solving routine chemistry calculation problems and, at this level of maturity, can do so without observable hallucinations under well-defined and constrained problem settings.
Table 3.
Merged comparison of final answers for Questions 1–17 as generated by LLMs (Gemini 3, ChatGPT-5.2, Copilot, and DeepSeek). The table aligns results question-by-question to enable direct comparison of numerical agreement, rounding differences, and substantive discrepancies, thereby highlighting areas of high consistency (e.g., pH calculations) and questions where model outputs diverge significantly.
8.2. Histograms Generated by JAMOVI and Gemini
To evaluate the consistency and reliability of Microsoft M365 Copilot (GPT-5), its outputs were compared with results generated independently using JAMOVI, a widely adopted open-source statistical platform. In Figure 16, histograms generated with JAMOVI closely matched those produced by Copilot (Figure 2), confirming the absence of spurious patterns or hallucinated distributions. JAMOVI does not support overlapping histograms by default, and log10 transformations must be applied manually, whereas Copilot performs these steps automatically when prompted.
Figure 16.
Histograms of ACPP and CLU expression levels displayed on a linear (original) scale in the left panel and on a log10-transformed scale in the right panel. Images generated by JAMOVI.
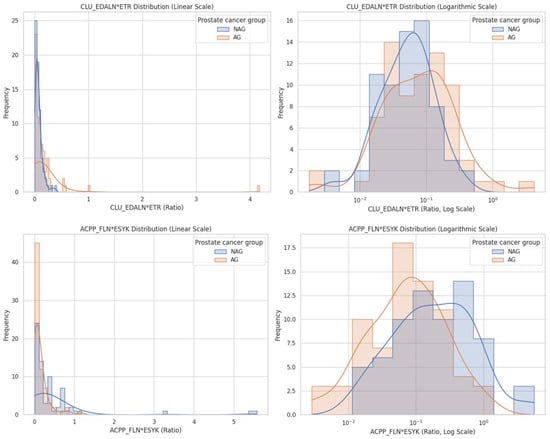
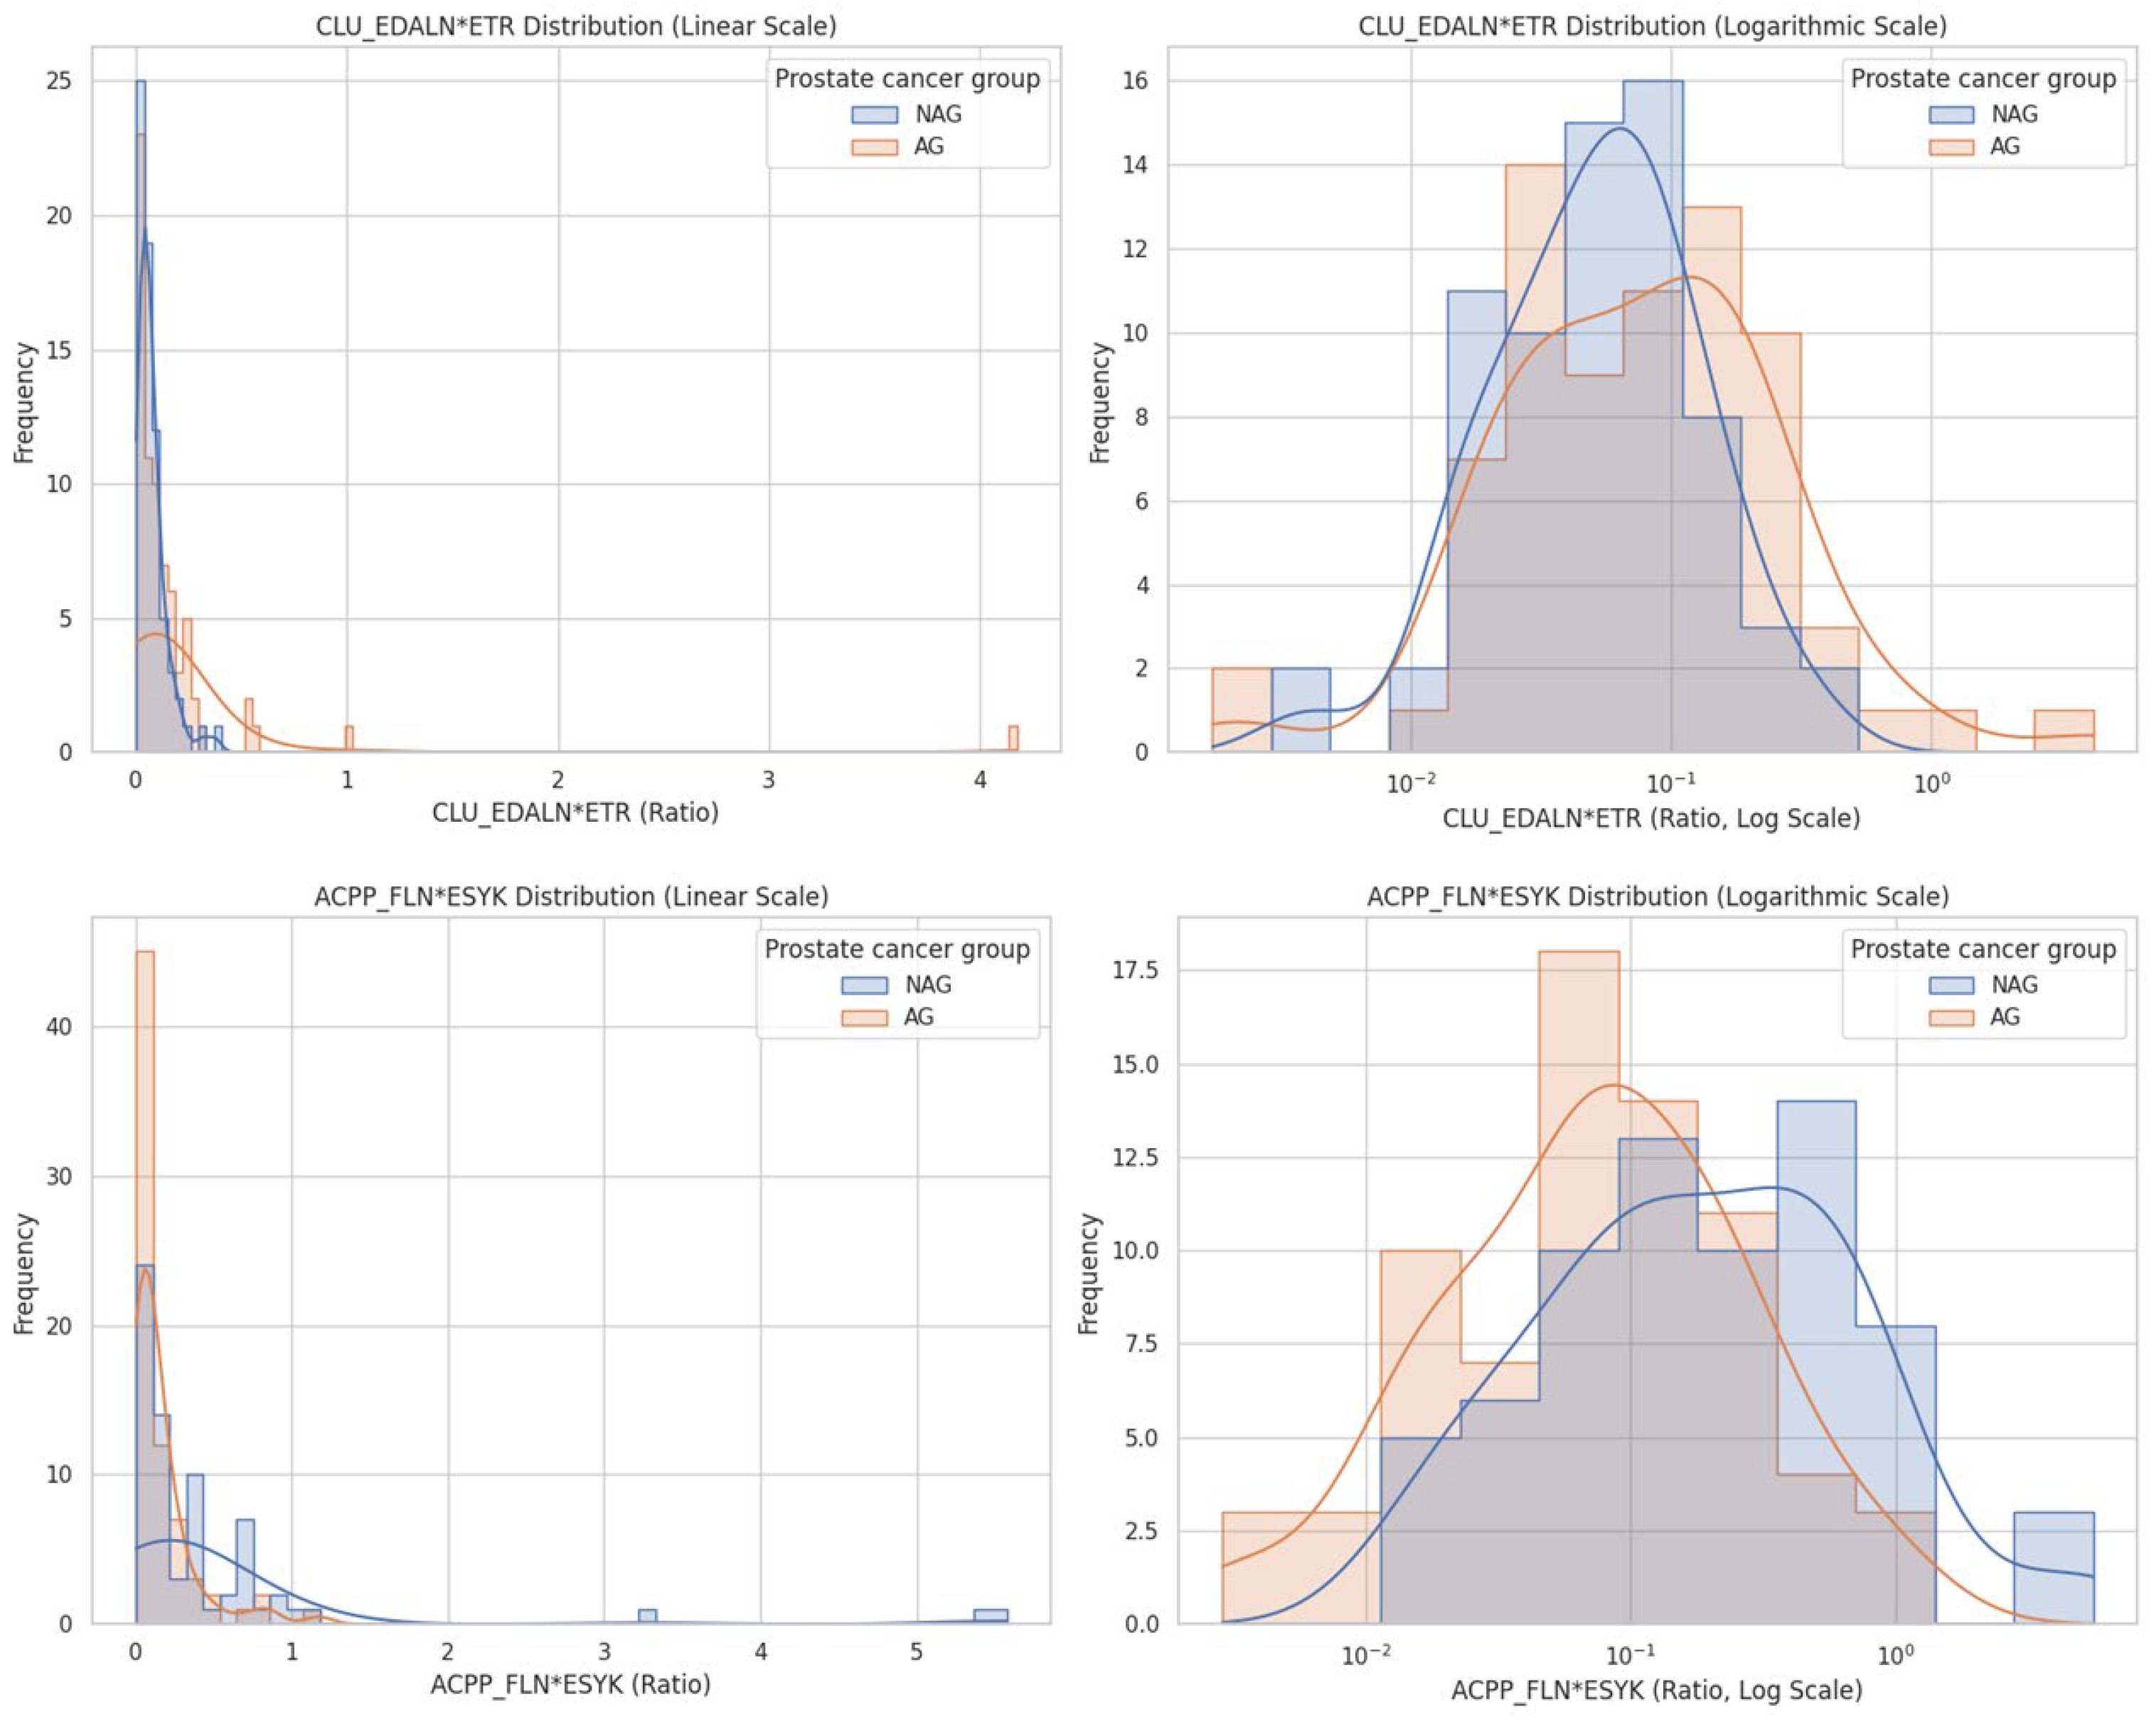
Figure 17 presents the histograms generated by Gemini 3. The left panel displays the data on the original (linear) scale, while the right panel shows the log10-transformed distributions. The visual patterns are highly consistent with those observed in Figure 2.
Figure 17.
Histograms and Kernel Density Estimation (KDE) curves for CLU_EDALN*ETR (Light/Heavy ratio) and ACPP_FLN*ESYK (Light/Heavy ratio) comparing Aggressive (AG) and Non-Aggressive (NAG) prostate cancer groups. The left panel utilizes a linear scale to show raw frequency, while the right panel employs a logarithmic scale to better resolve the distribution of protein expression ratios. Images generated by Gemini 3.
8.3. Box Plots Generated by JAMOVI and Gemini
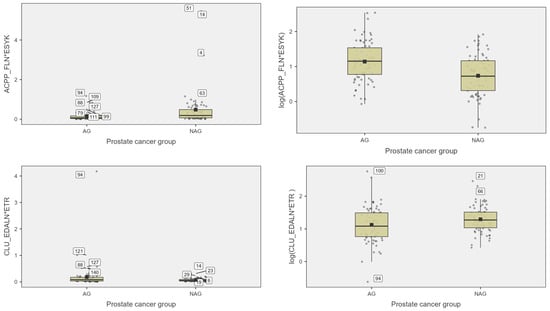
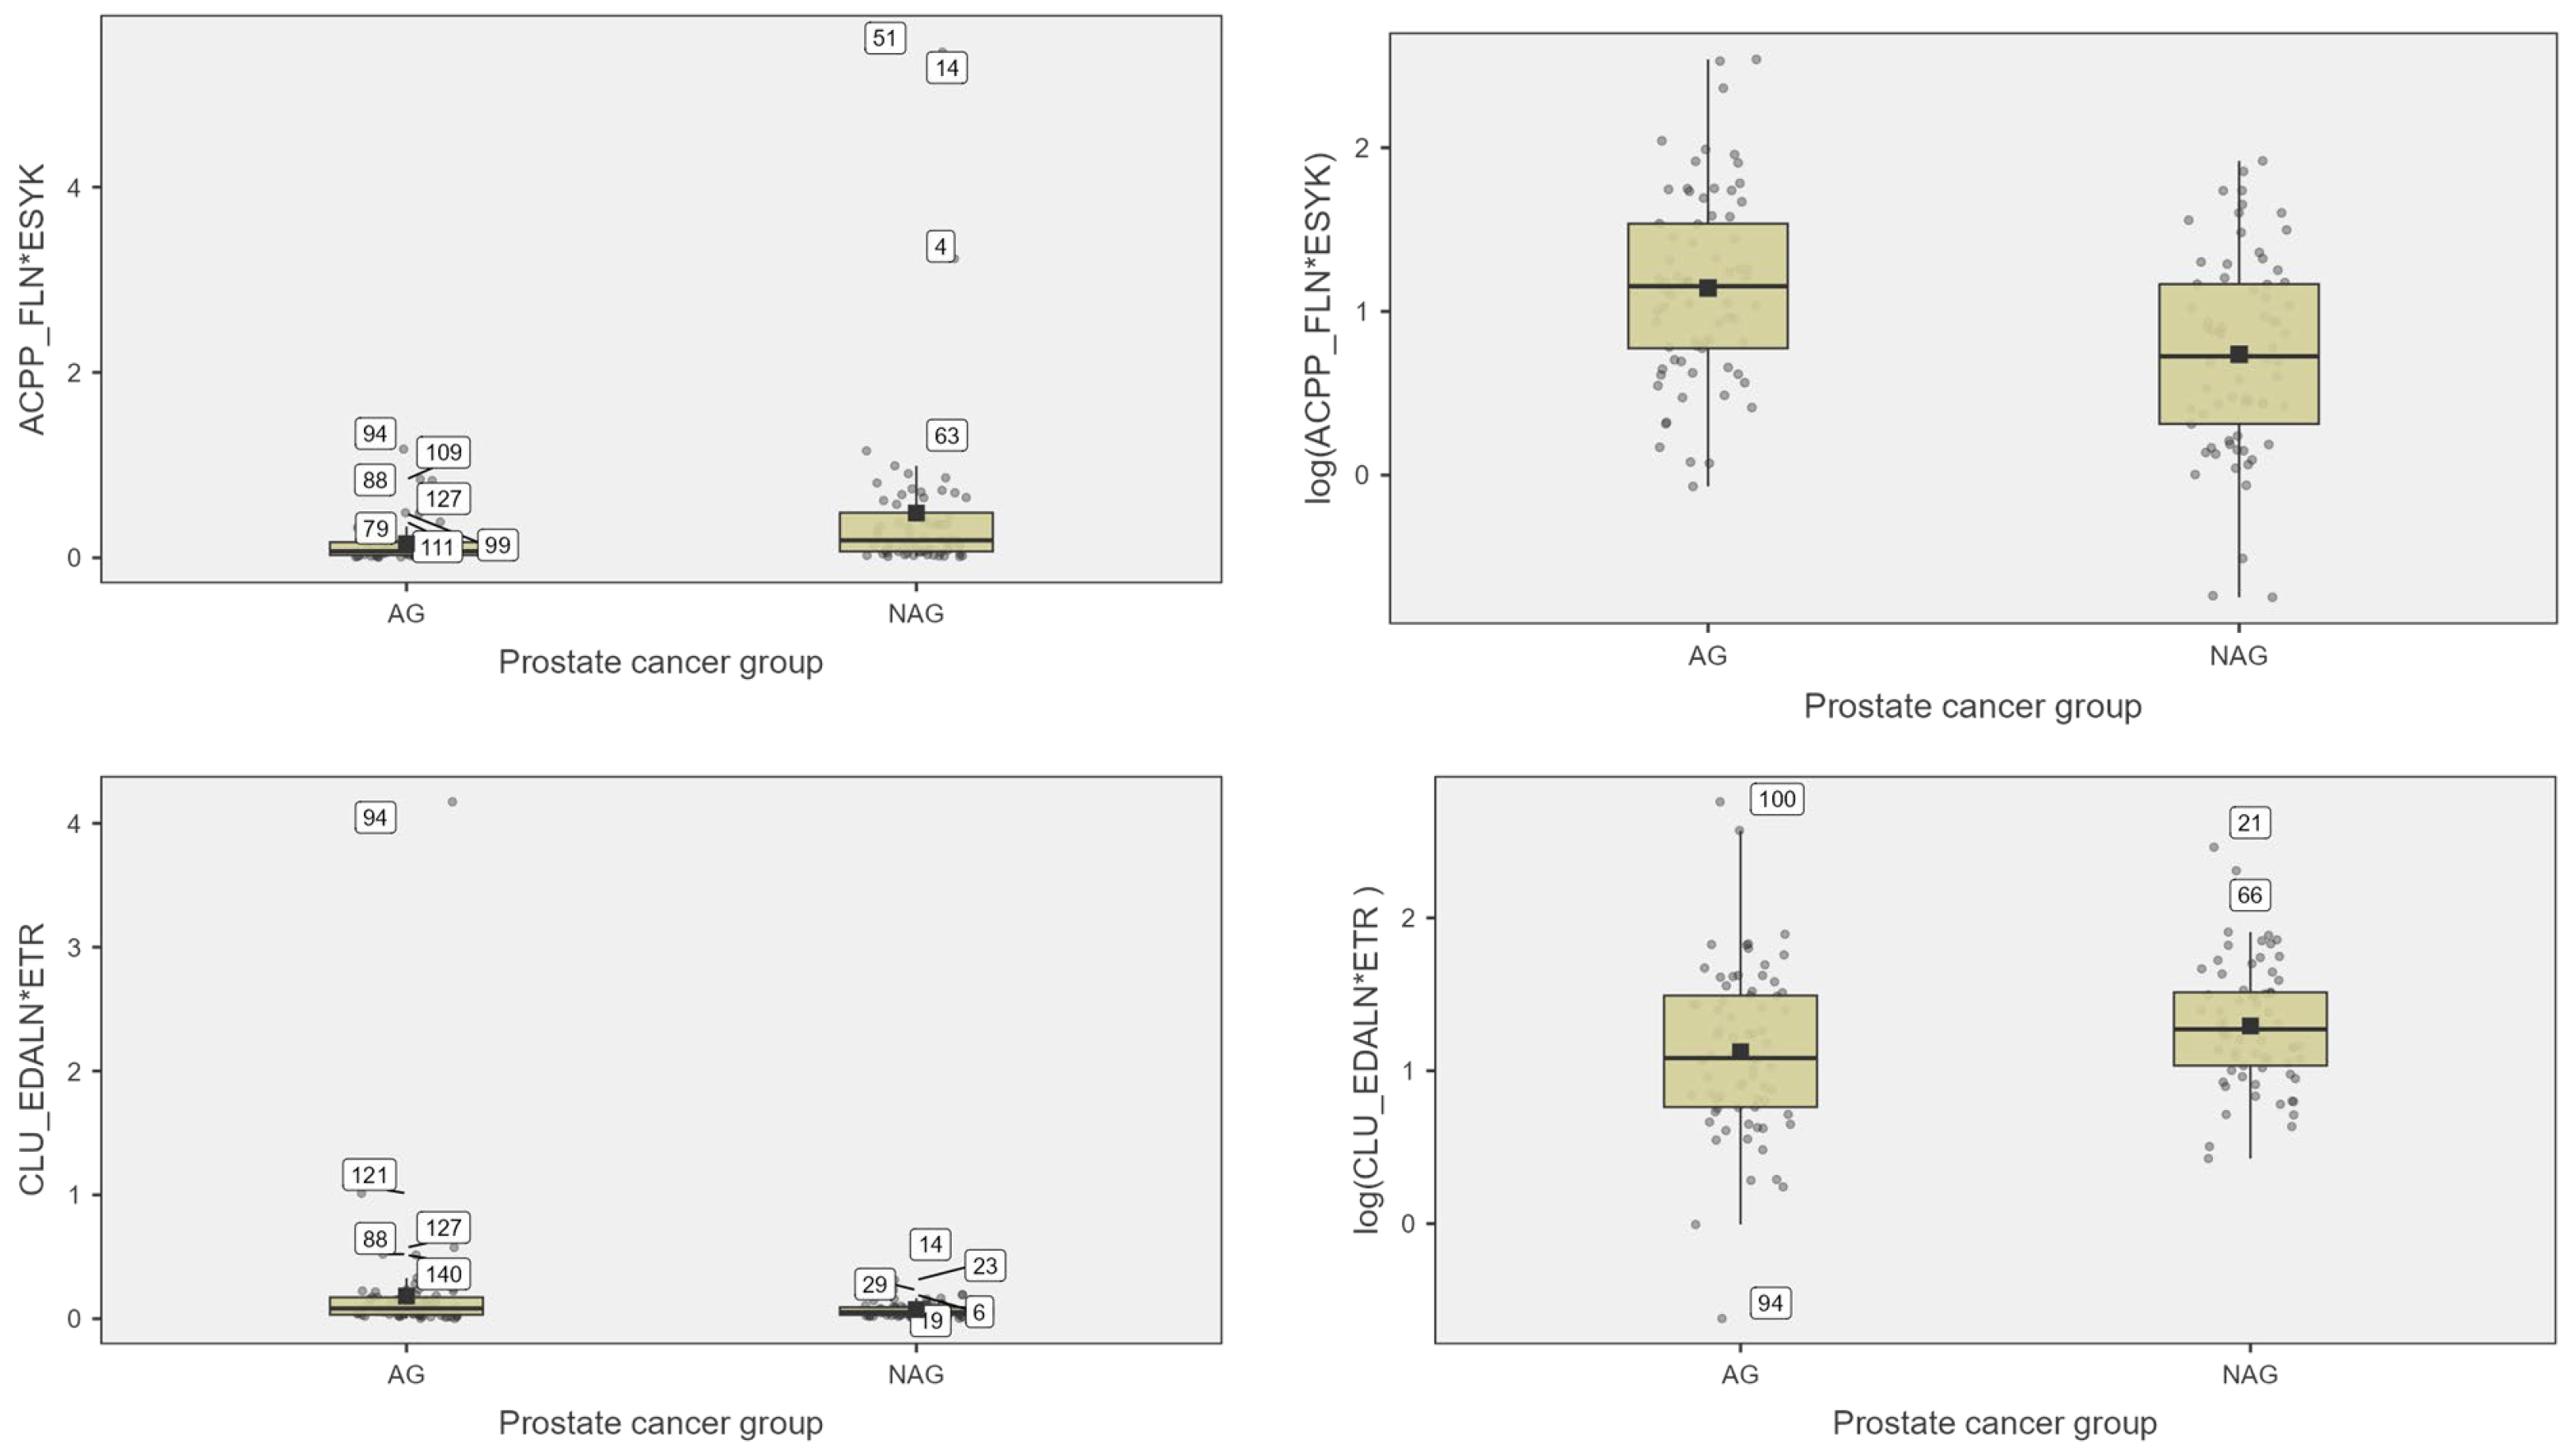
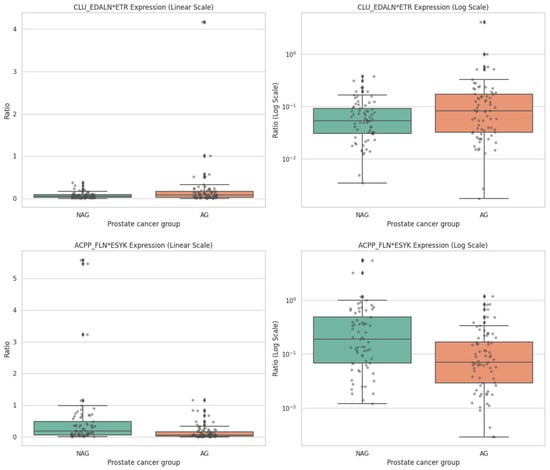
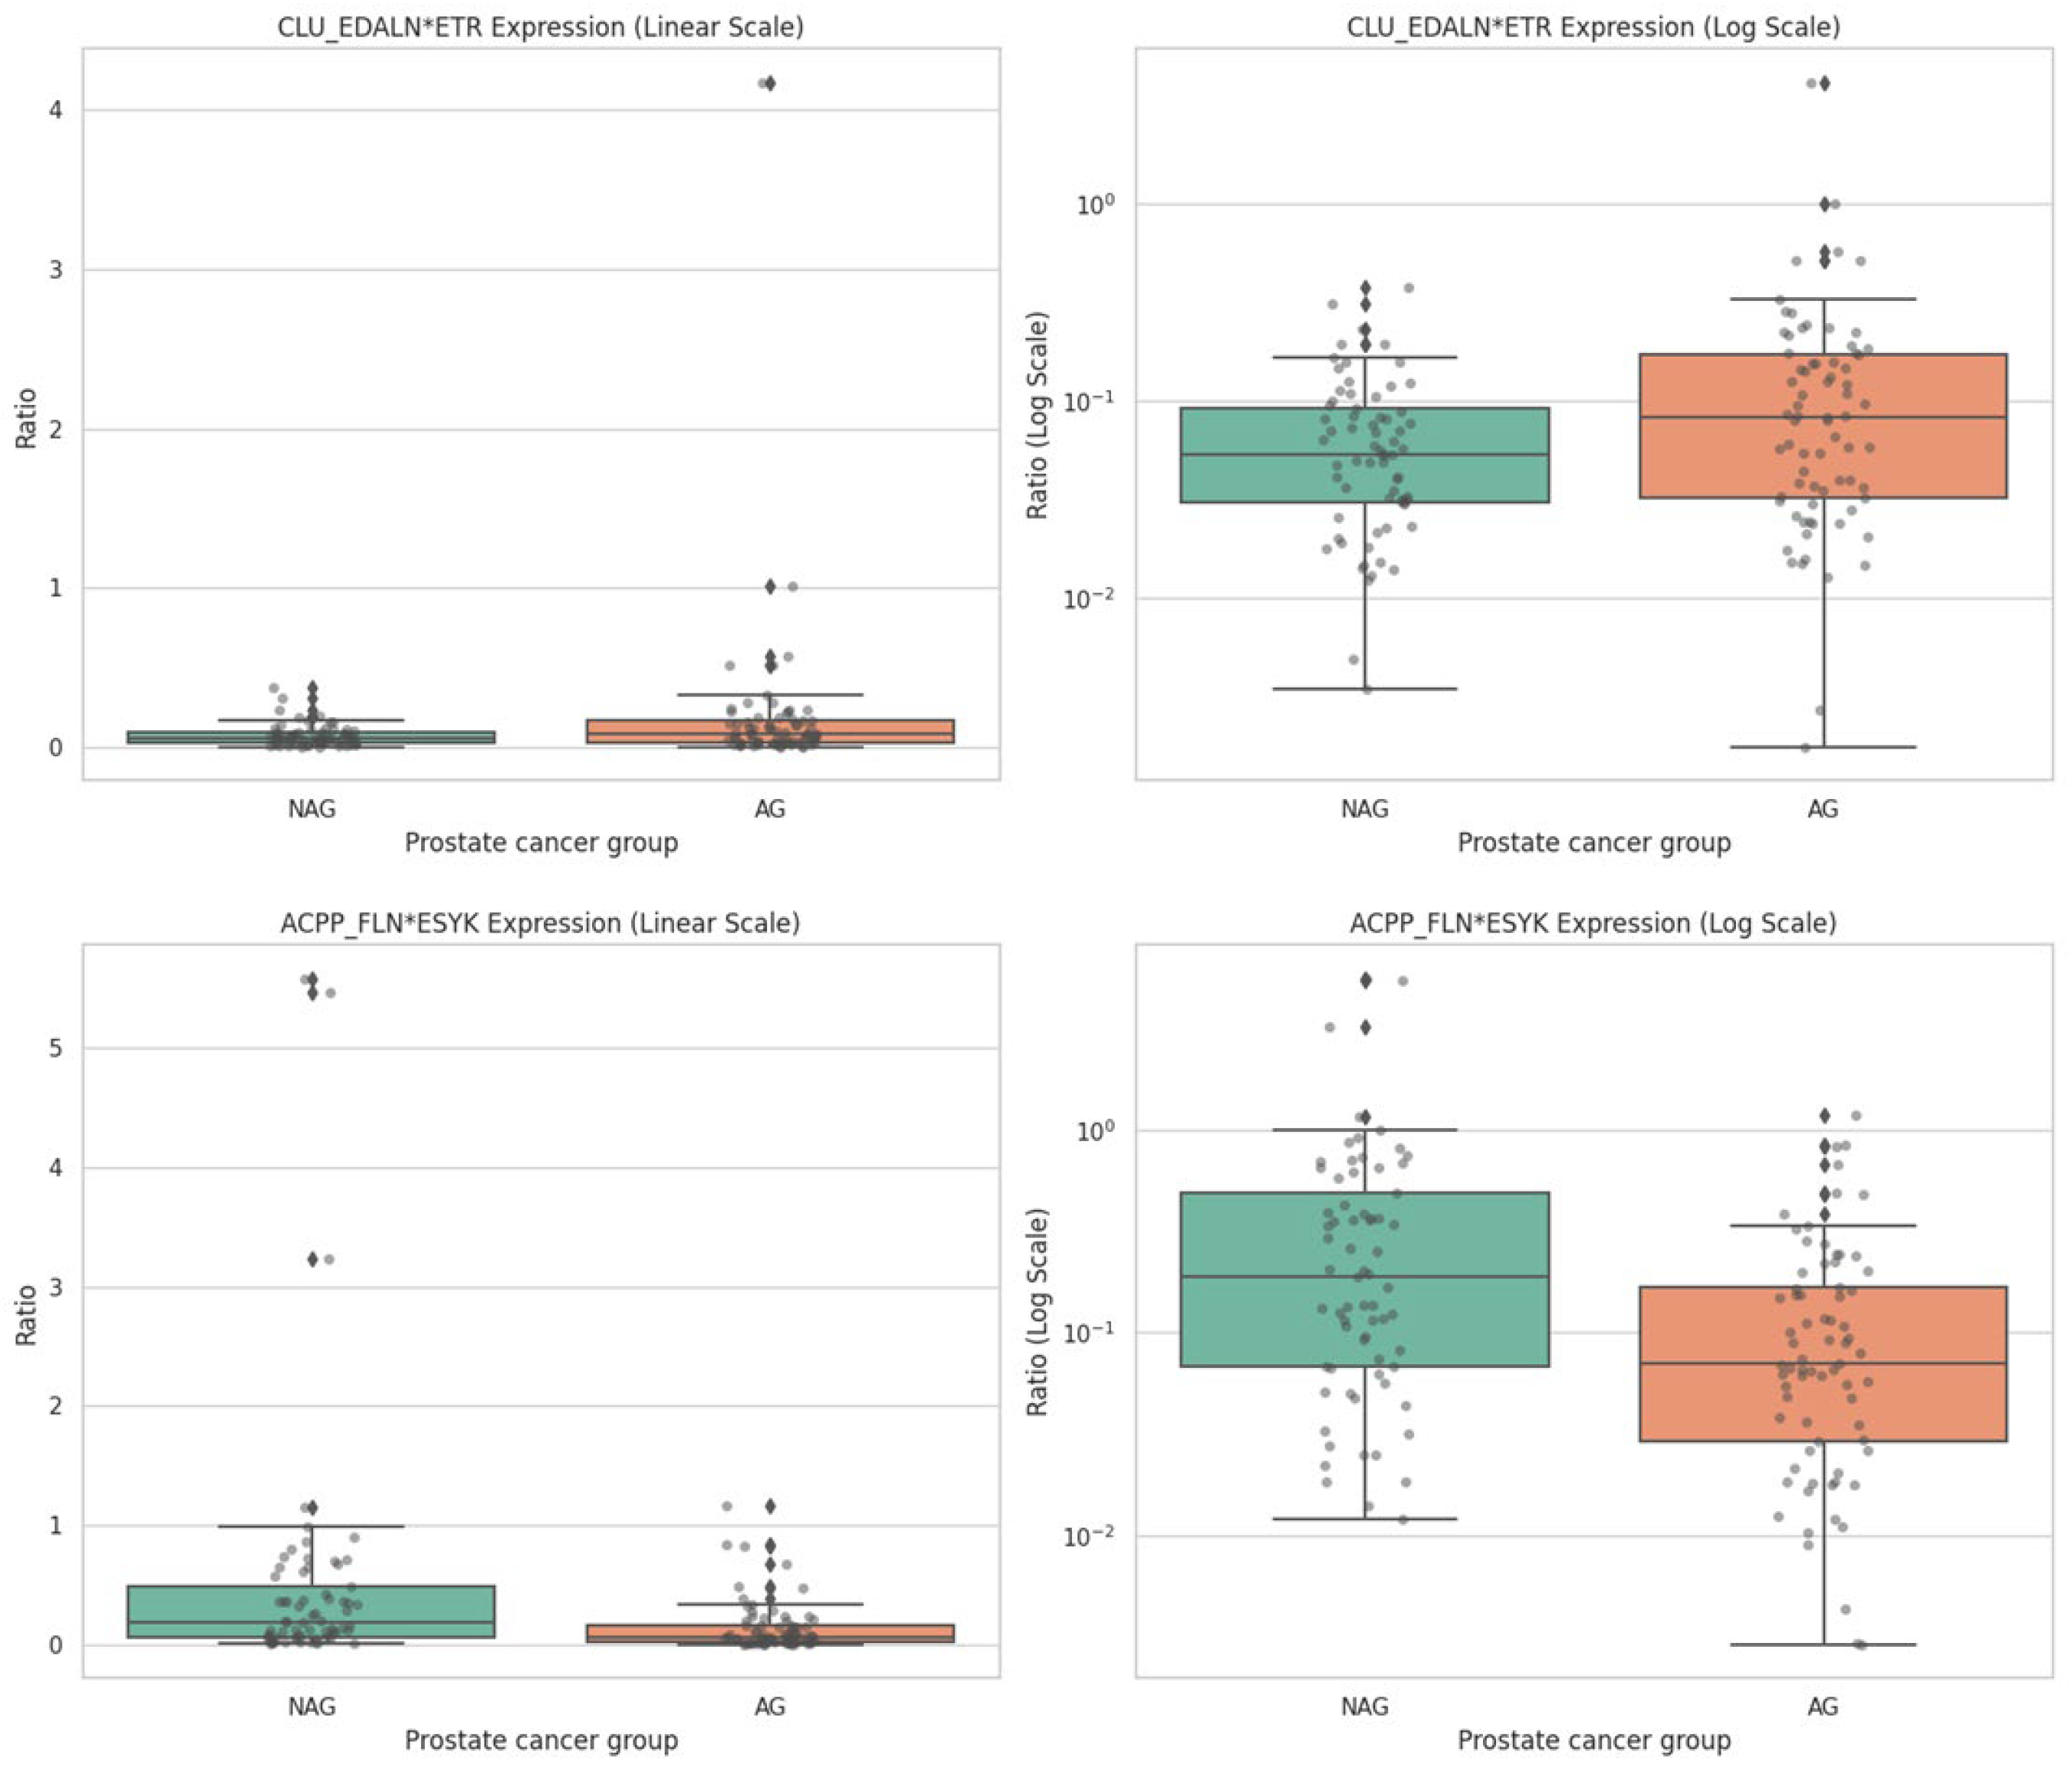
Figure 18 shows the box plot generated using JAMOVI, while Figure 19 presents the box plots produced with Gemini Pro. The distributions and summary statistics in these plots are highly consistent and closely resemble those obtained using Copilot (Figure 3), indicating strong agreement among the analytical outputs of the three platforms.
Figure 18.
Box plot for CLU_EDALN*ETR (Light/Heavy ratio) and ACPP_FLN*ESYK (Light/Heavy ratio) comparing Aggressive (AG) and Non-Aggressive (NAG) prostate cancer groups. The left panel utilizes a linear scale to show raw frequency, while the right panel employs a logarithmic scale to better resolve the distribution of protein expression ratios. Images generated by JAMOVI. The numbers shown were patients id as shown in Box plots.omv (Supporting Information).
Figure 19.
Box plot for CLU_EDALN*ETR (Light/Heavy ratio) and ACPP_FLN*ESYK (Light/Heavy ratio) comparing Aggressive (AG) and Non-Aggressive (NAG) prostate cancer groups. The left panel utilizes a linear scale to show raw frequency, while the right panel employs a logarithmic scale to better resolve the distribution of protein expression ratios. Images generated by Gemini 3.
8.4. Quantitative Comparison of Copilot, and Gemini 3 with JAMOVI
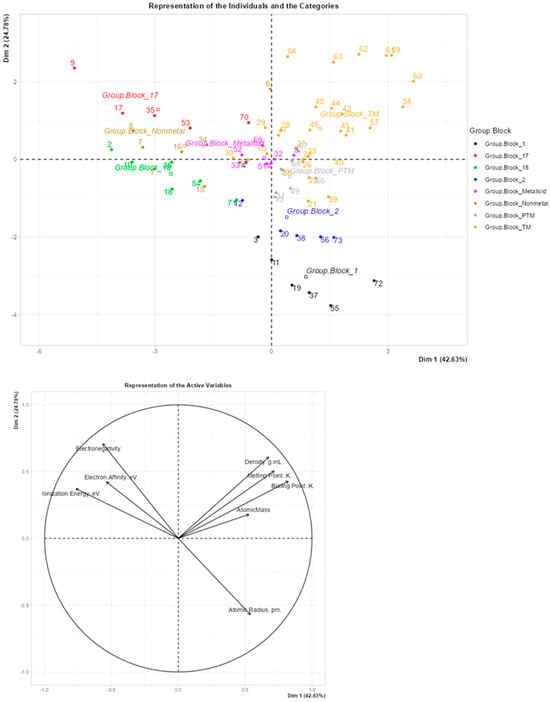
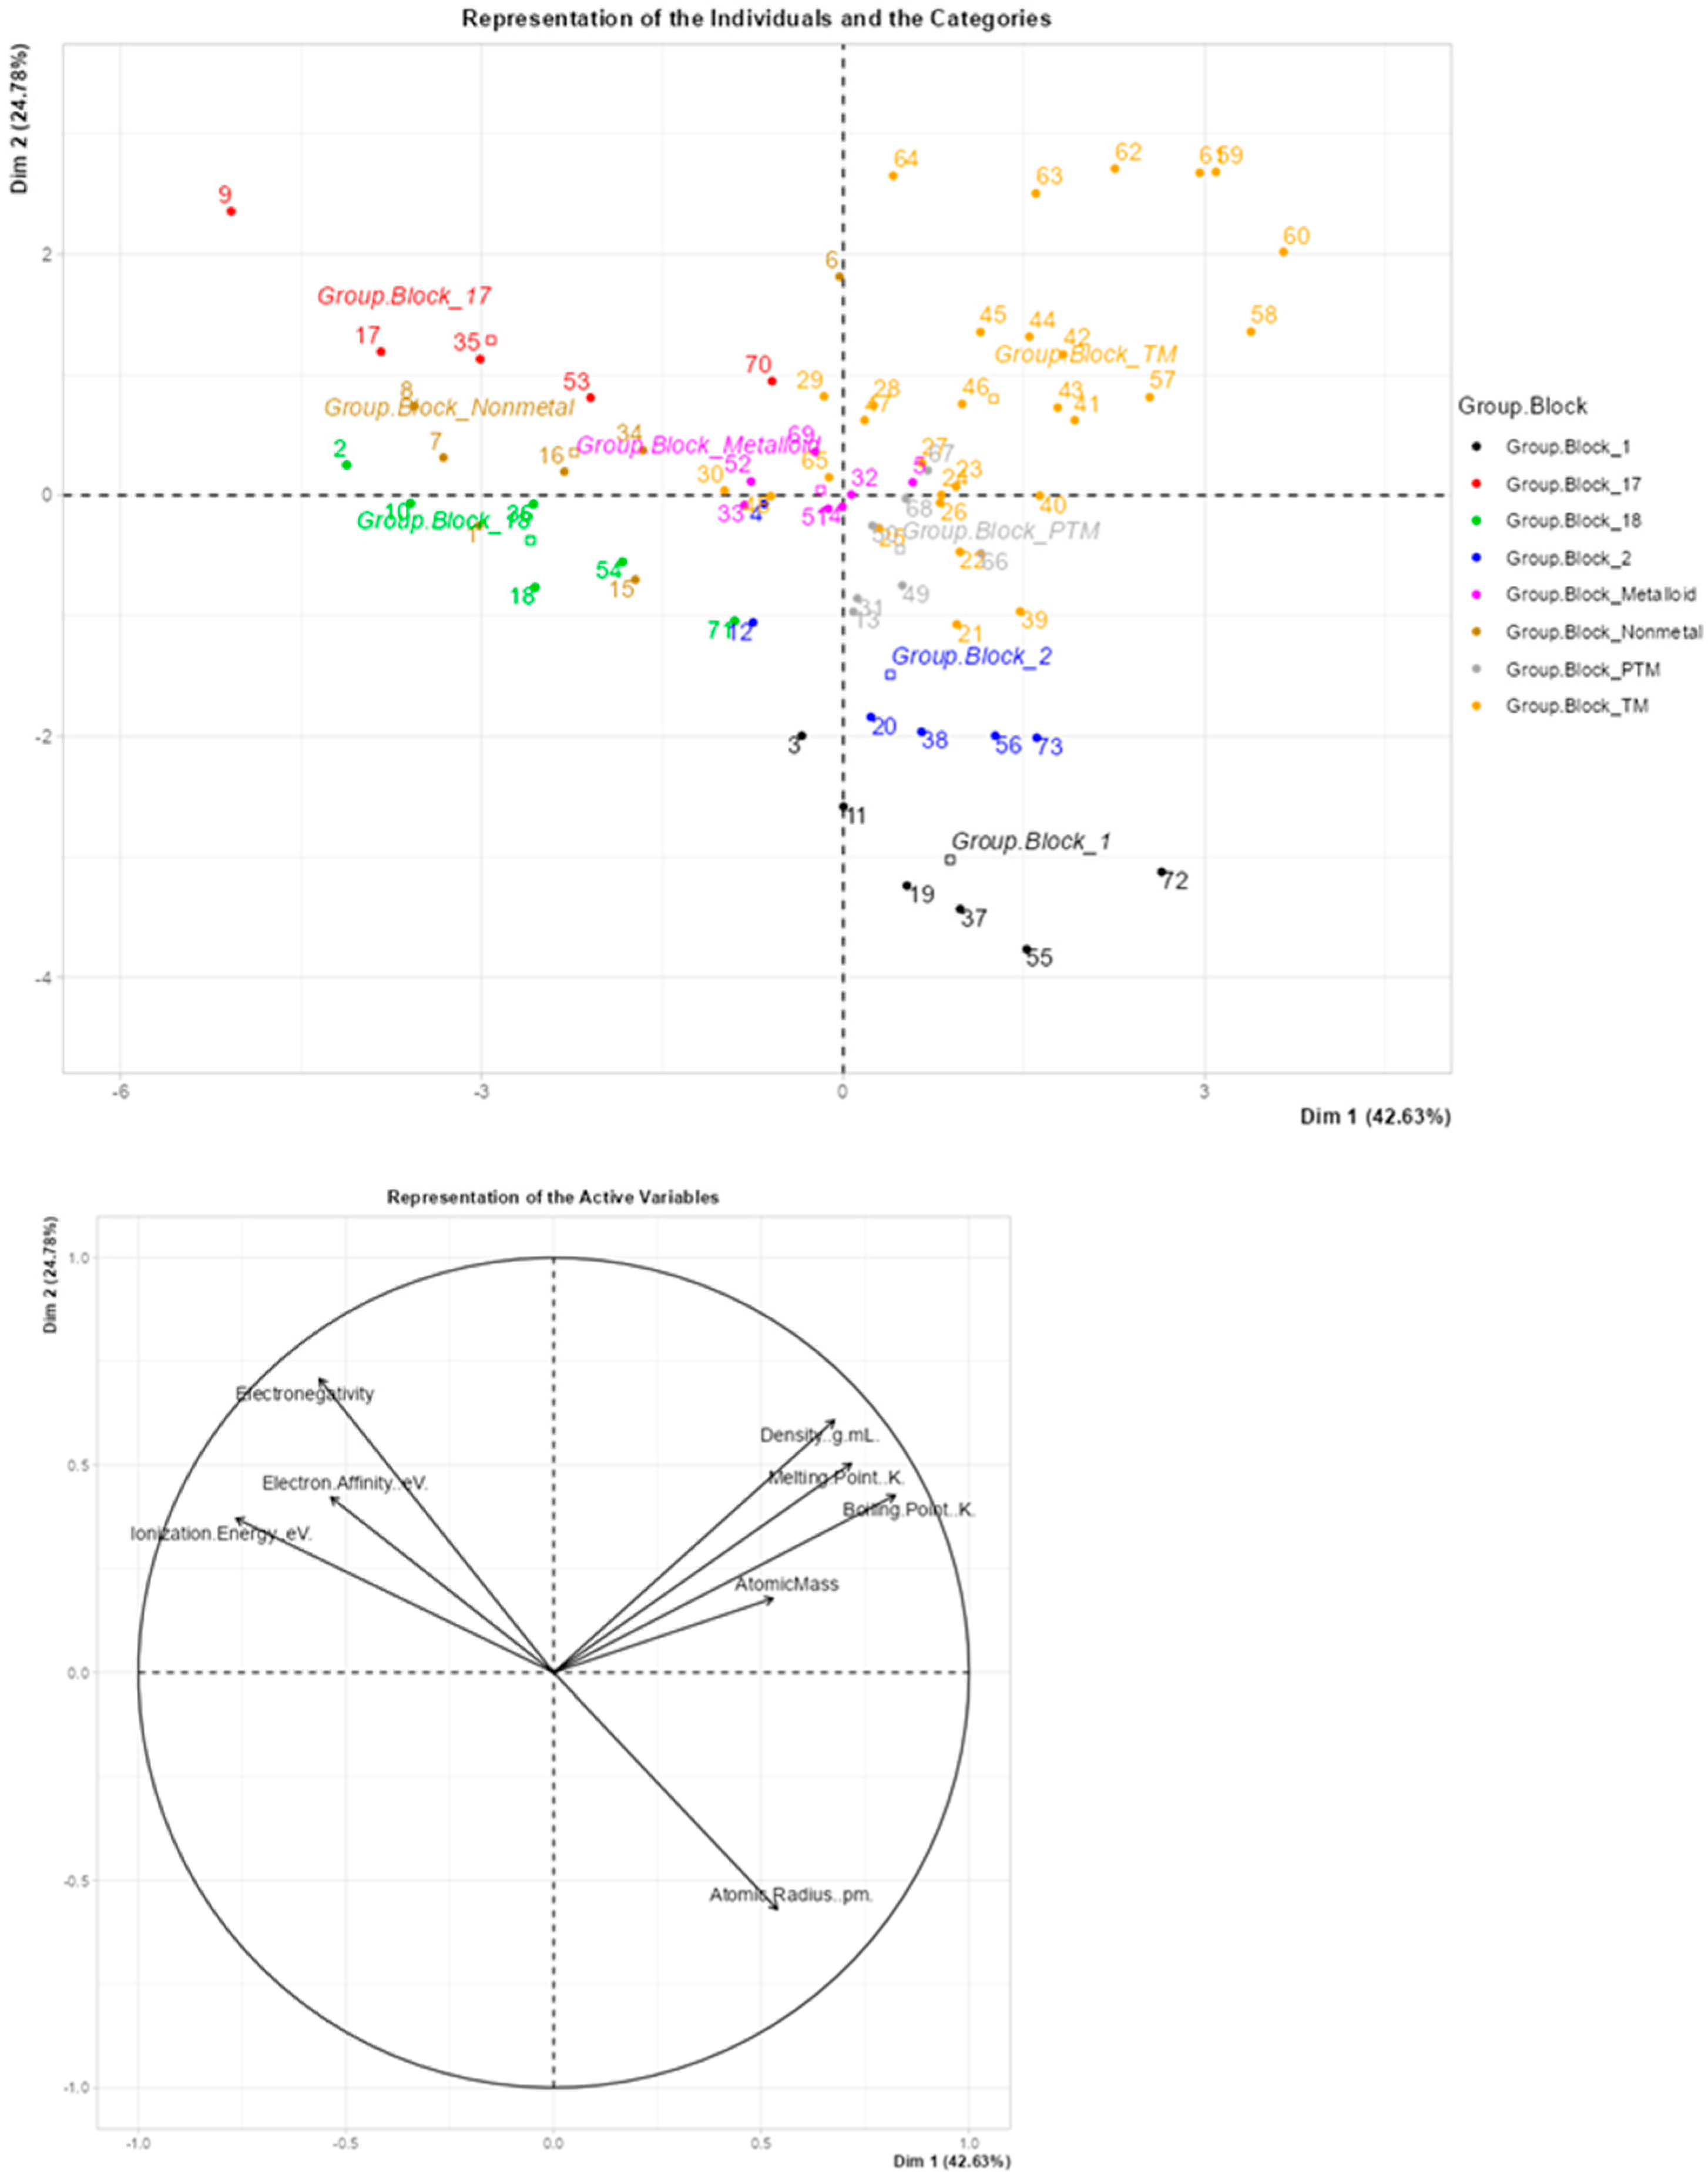
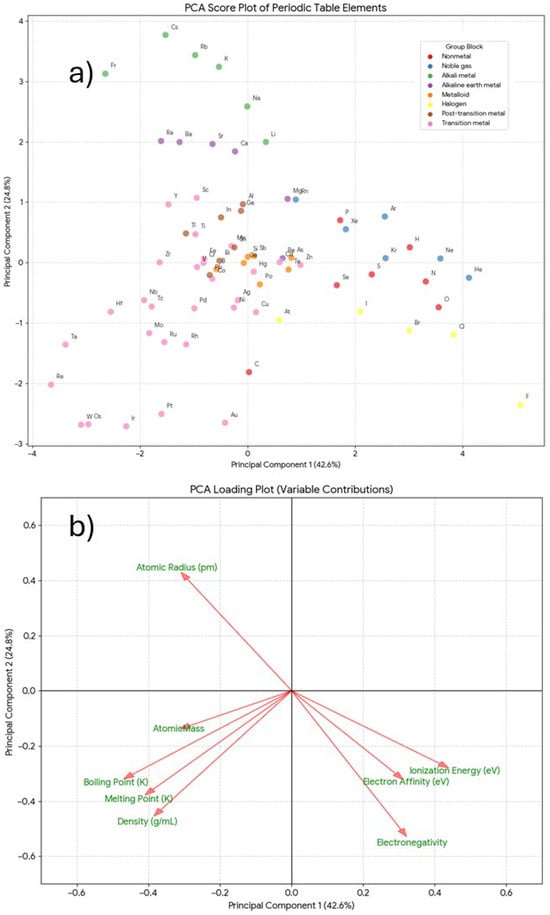
Figure 20 and Figure 21 presents the PCA score plot and loading plot generated using JAMOVI and Gemini 3. These results were in strong agreement with the corresponding Copilot-generated visualizations shown in Figure 6 and Figure 7.
Figure 20.
PCA score plot (top panel) and corresponding loading plot (bottom panel) illustrating the physicochemical properties of periodic table elements. Image generated by JAMOVI. The numbers were elements as shown in PCA.omv (Supporting Information).
Figure 21.
PCA score plot (top panel) and corresponding loading plot (bottom panel) illustrating the physicochemical properties of periodic table elements. Image generated by Gemini.
For both principal components (PC1 and PC2), the PCA loadings produced by Copilot and Gemini 3 exhibited very strong correlations with JAMOVI loadings (r > 0.99), indicating near-identical variable weighting and component structure. The relative deviation in explained variance between LLMs generated outputs and JAMOVI remained below 1% for both components. In addition, score-space consistency analysis showed complete concordance, with all samples retaining the same relative positions and quadrant assignments as those obtained from JAMOVI.
These results demonstrate that, under standardized and controlled conditions, both Copilot and Gemini 3 reproduce JAMOVI PCA outcomes with high numerical fidelity, supporting the reliability and reproducibility of the LLMs generated analyses.
8.5. LLM-Generated PLS-DA Visualizations
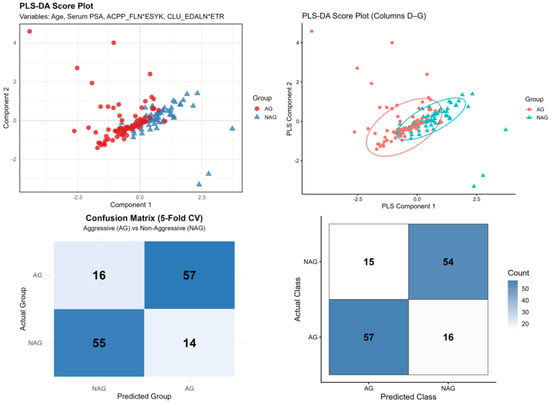
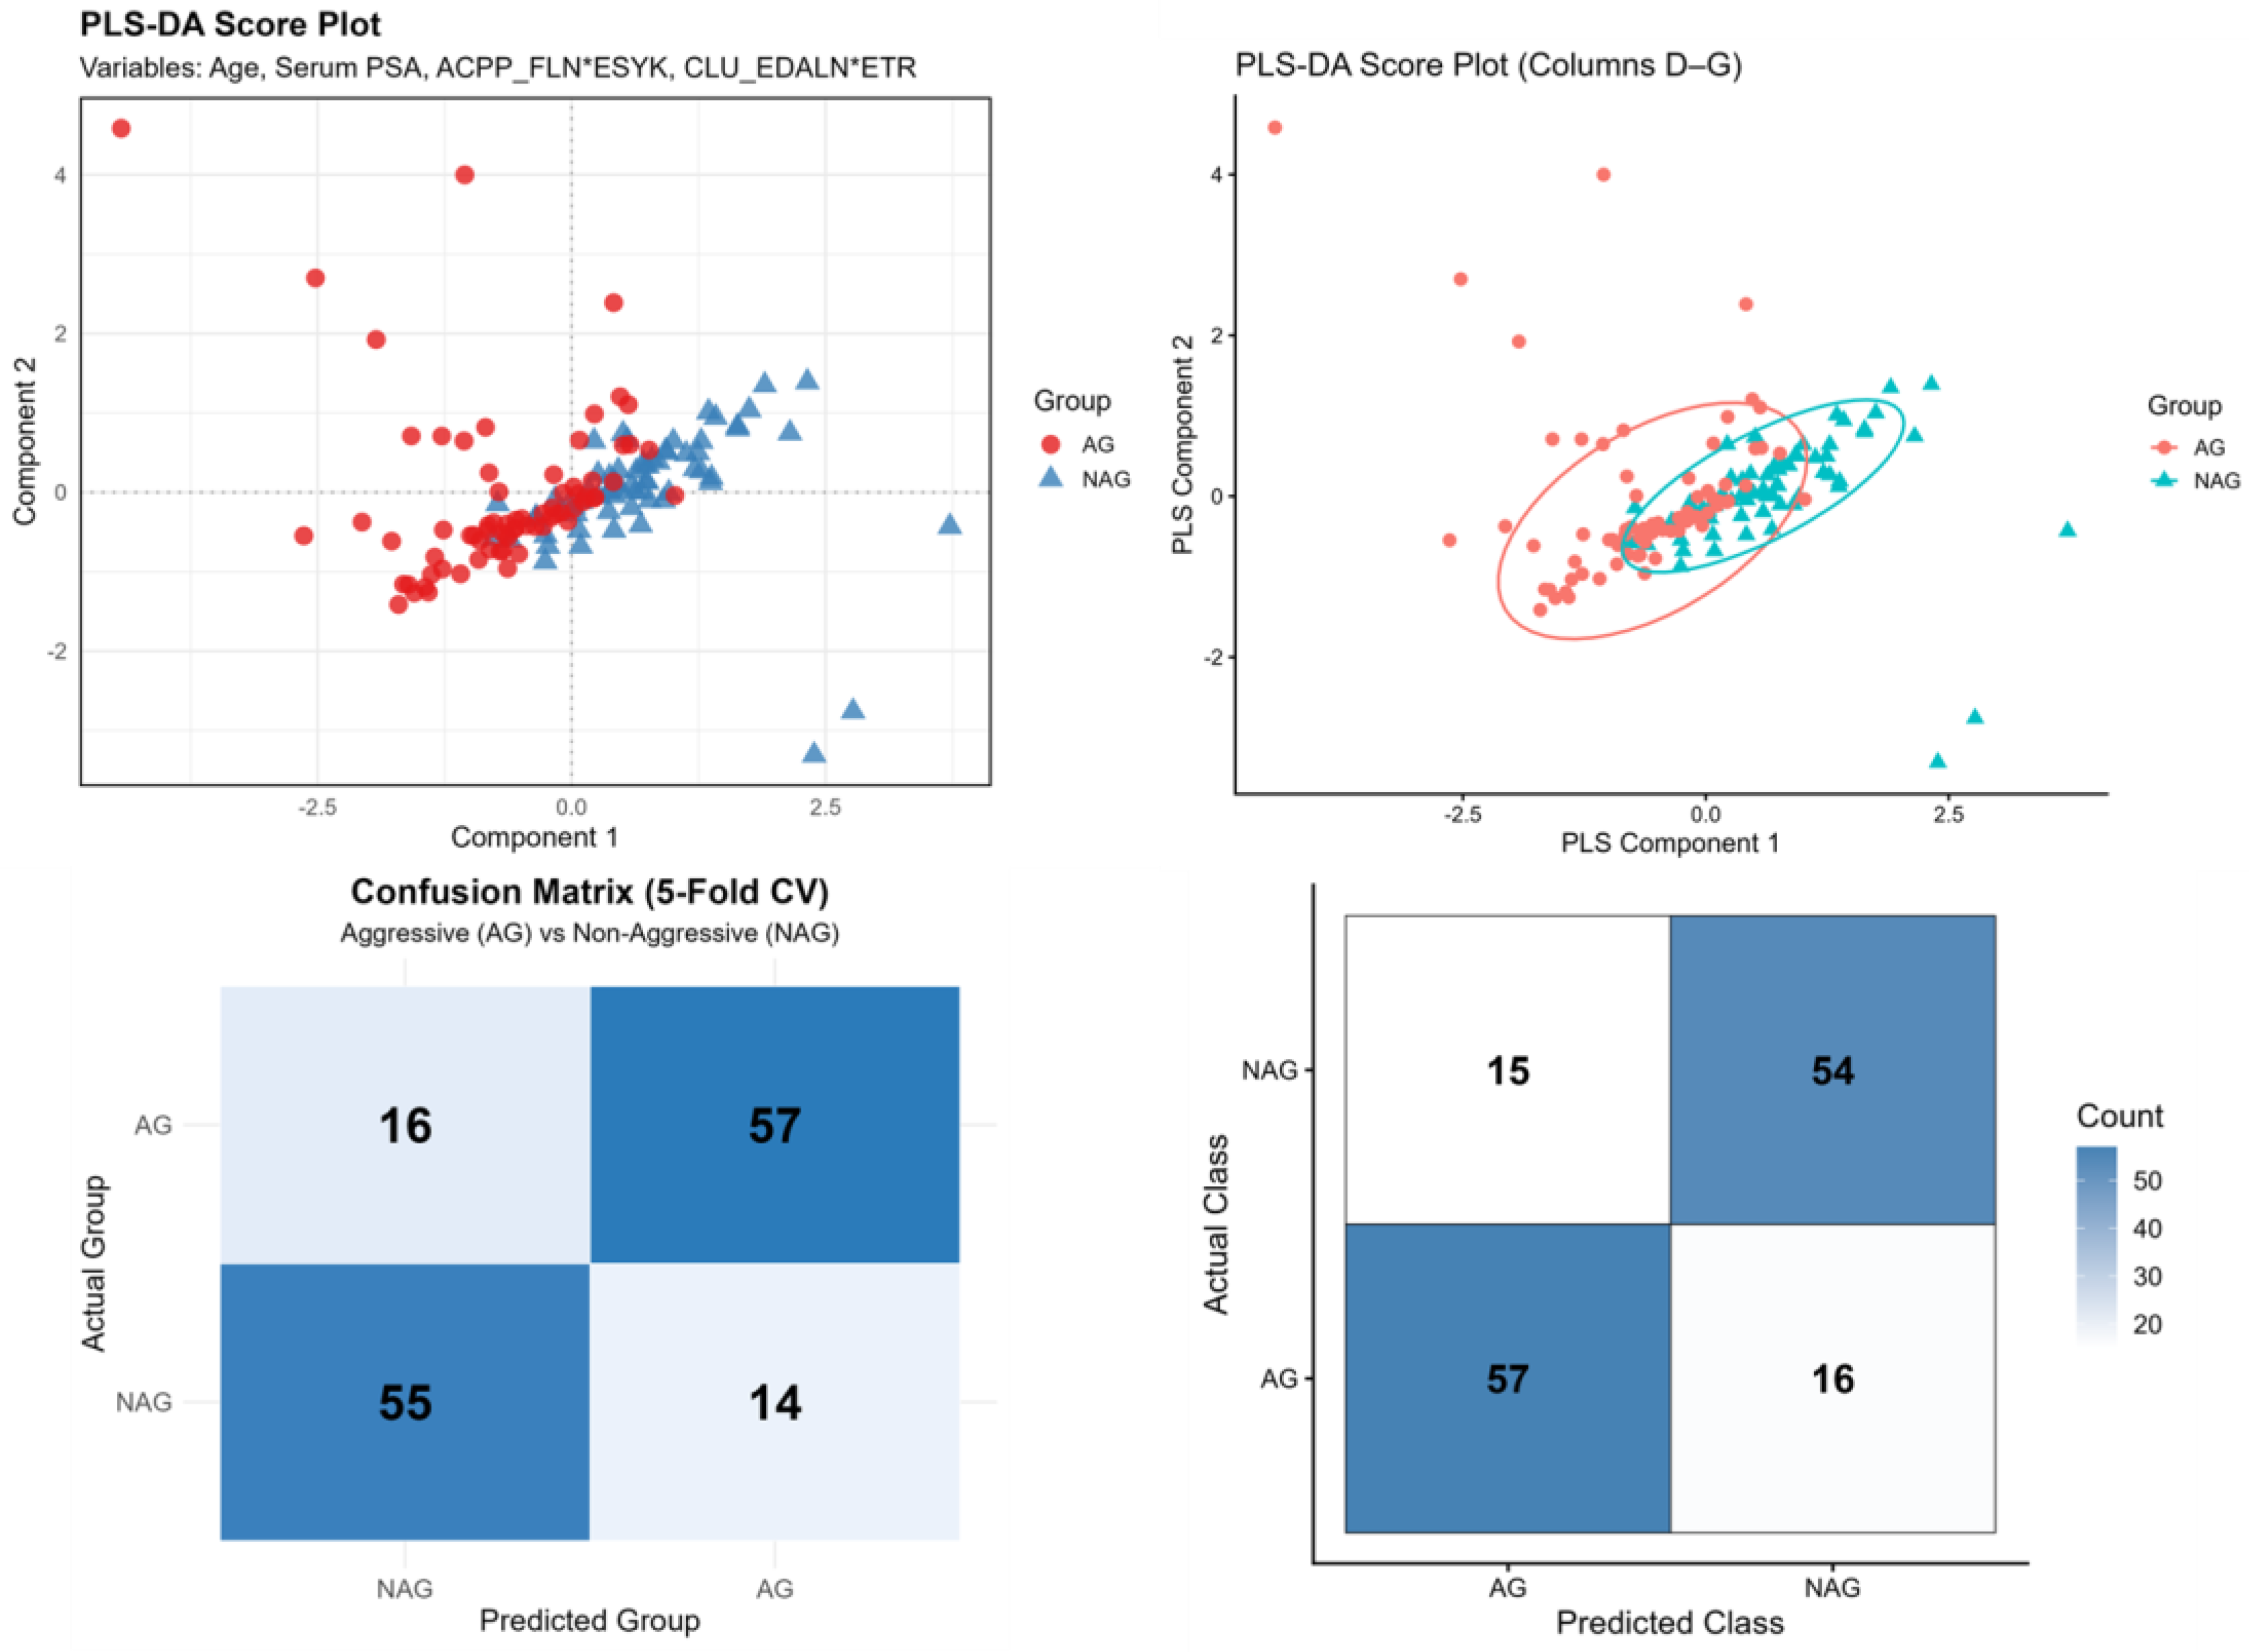
Figure 22 compares PLS-DA results generated by ChatGPT and Gemini in response to prompts Q33 and Q34, using identical data and modeling parameters. All outputs correspond to the first attempt of each LLM. The analysis was performed with columns D–G as predictors, two latent variables, a classification threshold of 0.5, and 5-fold cross-validation. The score plots (top) show similar class separation patterns for AG and NAG in both models, indicating consistent latent space construction. The confusion matrices (bottom) reveal modest differences in classification performance, with ChatGPT exhibiting fewer misclassifications than Gemini. Copilot was compared exclusively with Gemini and ChatGPT because JAMOVI does not support the generation of PLS-DA score plots and confusion matrices under these conditions.
Figure 22.
Side-by-side comparison of PLS-DA results generated by two large language models using the same predictor variables (columns D–G), two latent variables, a classification threshold of 0.5, and 5-fold cross-validation. Top row: PLS-DA score plots (LV1 vs. LV2) illustrating the separation between AG and NAG samples. Bottom row: corresponding confusion matrices summarizing classification outcomes. Left column: results generated by ChatGPT. Right column: results generated by Gemini.
9. Conclusions
This study provides a systematic and application-focused evaluation of Microsoft M365 Copilot (GPT-5) in chemistry education and research contexts. Across 35 representative tasks spanning five domains—chemical equilibrium and acid–base calculations, data visualization, periodic table analysis via PCA, image interpretation in classroom settings, and machine learning using PLS-DA—Copilot consistently demonstrated the ability to generate correct calculations, reproducible visualizations, and interpretable chemometric outputs without the use of additional prompting.
For calculation-based tasks involving equilibrium, pH, titrations, and buffer systems, Copilot produced accurate, step-by-step solutions in all evaluated cases, including problems that earlier-generation LLMs were reported to handle unreliably. In data visualization tasks, Copilot successfully generated histograms, box plots, correlation plots, and heatmaps directly from uploaded datasets, preserving distributional features and group-level trends. Visual outputs were consistent across repeated executions and aligned closely with results generated independently using JAMOVI.
In the analysis of periodic table properties, Copilot correctly implemented principal component analysis with appropriate data standardization, producing score and loading plots that were chemically interpretable. The first two principal components accounted for a substantial proportion of the total variance, and the relationships among physicochemical variables observed in the loading plots were corroborated by Pearson correlation heatmaps. Minor numerical differences between Copilot and JAMOVI outputs were attributable to differences in missing-data handling rather than conceptual or methodological errors.
For supervised classification, Copilot successfully applied PLS-DA with autoscaling and cross-validation, generating stable score plots and confusion matrices across repeated runs. While small aesthetic variations were observed, class separation patterns and classification outcomes remained consistent, indicating reproducible model behavior rather than stochastic or hallucinated results.
Importantly, all evaluations were conducted using two independent user accounts and repeated twice per month between October and December 2025, allowing assessment of temporal stability and reproducibility. No conceptual errors or spurious analytical artifacts were observed within the evaluated task set, supporting the reliability of Copilot’s outputs for the scenarios examined.
At the same time, this work highlights important limitations. As a proprietary, black-box system, Copilot does not allow direct access to model parameters or training data, constraining deeper algorithmic validation. The study also does not claim universal correctness across all possible chemistry tasks, nor does it replace expert judgment or dedicated statistical software. Instead, it provides a controlled, task-based performance assessment reflective of real-world educational and research use.
Collectively, these findings demonstrate that Microsoft M365 Copilot (GPT-5) offers substantial practical value as a supplementary tool for chemistry education and data-driven research. When used critically and in conjunction with established analytical methods, Copilot can support calculation workflows, exploratory data analysis, and chemometric reasoning, lowering technical barriers while maintaining scientifically meaningful outputs.
Supplementary Materials
The following supporting information can be downloaded at: https://www.mdpi.com/article/10.3390/digital6010016/s1, Table S1.xlsx, it was adapted from Dong et al., contains urine specimens from 69 nonaggressive (NON; Gleason score = 6) and 73 aggressive (AG; Gleason ≥ 8) prostate cancer cases [33]. Table S2.xlsx, it was from Borges et al., includes the physicochemical properties of the elements of the periodic table [34]. PCA.omv, it was the JAMOVI file containing Figure 20. Box plot.omv, it was the JAMOVI file containing Figure 18. Supplementary Material.docx, it contains answers for the questions in Table 1, and it also contains the R scripts provided by LLMs to generate the Figures S1–S20.
Author Contributions
Conceptualization, N.C.P.P. and E.M.B.; methodology, N.C.P.P. and E.M.B.; software, N.C.P.P.; validation, N.C.P.P., E.M.B. and M.B.B.; formal analysis, M.B.B.; investigation, M.B.B.; data curation, M.B.B.; writing—original draft preparation, M.B.B.; supervision, E.M.B.; project administration, E.M.B.; funding acquisition, E.M.B. All authors have read and agreed to the published version of the manuscript.
Funding
The authors acknowledge financial support and fellowships from the Brazilian agencies FAPESC (Fundação de Amparo a Pesquisa do Estado de Santa Catarina), CNPq (Conselho Nacional de Desenvolvimento Científico e Tecnológico), and CAPES (Coordenação de Aperfeiçoamento de Pessoal de Nível Superior).
Data Availability Statement
The data presented in this study are openly available in 10.5281/zenodo.18751036.
Conflicts of Interest
The author declared no conflicts of interest.
References
- Exintaris, B.; Karunaratne, N.; Yuriev, E. Metacognition and Critical Thinking: Using ChatGPT-Generated Responses as Prompts for Critique in a Problem-Solving Workshop (SMARTCHEMPer). J. Chem. Educ. 2023, 100, 2972–2980. [Google Scholar] [CrossRef] [Scilit]
- Wang, S.; Chen, F.; Ge, C.; Shi, H.; You, Y.; Guo, J.; Zheng, S.; Zhu, X. Using Local LLM Tools to Optimize Chinese High School Chemistry Education: Practice, Challenges, and Future Directions. J. Chem. Educ. 2025, 102, 4368–4375. [Google Scholar] [CrossRef] [Scilit]
- Lear, B.J. Using ChatGPT-4 to Teach the Design of Data Visualizations. J. Chem. Educ. 2024, 101, 2749–2756. [Google Scholar] [CrossRef] [Scilit]
- Subasinghe, S.M.S.; Gersib, S.G.; Mankad, N.P. Large Language Models (LLMs) as Graphing Tools for Advanced Chemistry Education and Research. J. Chem. Educ. 2025, 102, 1563–1571. [Google Scholar] [CrossRef] [Scilit]
- Sigot, M.; Tassoti, S. An Investigation of Change in Prompting Strategies in a Semester-Long Course on the Use of GenAI. J. Chem. Educ. 2025, 102, 2507–2513. [Google Scholar] [CrossRef] [Scilit]
- Sigot, M.; Tassoti, S. A Missed Opportunity for No-Code Chatbots? Current Challenges in Publicly Available Chemistry GPTs. J. Chem. Educ. 2025, 102, 2151–2159. [Google Scholar] [CrossRef] [Scilit]
- Nascimento Júnior, W.J.D.; Morais, C.; Girotto Júnior, G. Enhancing AI Responses in Chemistry: Integrating Text Generation, Image Creation, and Image Interpretation through Different Levels of Prompts. J. Chem. Educ. 2024, 101, 3767–3779. [Google Scholar] [CrossRef] [Scilit]
- Alasadi, E.A.; Baiz, C.R. Multimodal Generative Artificial Intelligence Tackles Visual Problems in Chemistry. J. Chem. Educ. 2024, 101, 2716–2729. [Google Scholar] [CrossRef] [Scilit]
- Geantă, M.; Bădescu, D.; Chirca, N.; Nechita, O.C.; Radu, C.G.; Rascu, Ș.; Rădăvoi, D.; Sima, C.; Toma, C.; Jinga, V. The Emerging Role of Large Language Models in Improving Prostate Cancer Literacy. Bioengineering 2024, 11, 654. [Google Scholar] [CrossRef] [Scilit] [PubMed]
- Sabaner, M.C.; Anguita, R.; Antaki, F.; Balas, M.; Boberg-Ans, L.C.; Ferro Desideri, L.; Grauslund, J.; Hansen, M.S.; Klefter, O.N.; Potapenko, I.; et al. Opportunities and Challenges of Chatbots in Ophthalmology: A Narrative Review. J. Pers. Med. 2024, 14, 1165. [Google Scholar] [CrossRef] [Scilit] [PubMed]
- Ittarat, M.; Cheungpasitporn, W.; Chansangpetch, S. Personalized Care in Eye Health: Exploring Opportunities, Challenges, and the Road Ahead for Chatbots. J. Pers. Med. 2023, 13, 1679. [Google Scholar] [CrossRef] [Scilit] [PubMed]
- Fabijan, A.; Chojnacki, M.; Zawadzka-Fabijan, A.; Fabijan, R.; Piątek, M.; Zakrzewski, K.; Nowosławska, E.; Polis, B. AI-Powered Western Blot Interpretation: A Novel Approach to Studying the Frameshift Mutant of Ubiquitin B (UBB+1) in Schizophrenia. Appl. Sci. 2024, 14, 4149. [Google Scholar] [CrossRef] [Scilit]
- Fan, K.S.; Fan, K.H. Dermatological Knowledge and Image Analysis Performance of Large Language Models Based on Specialty Certificate Examination in Dermatology. Dermato 2024, 4, 124–135. [Google Scholar] [CrossRef] [Scilit]
- Schuessler, K.; Rodemer, M.; Giese, M.; Walpuski, M. Organic Chemistry and the Challenge of Representations: Student Difficulties with Different Representation Forms When Switching from Paper–Pencil to Digital Format. J. Chem. Educ. 2024, 101, 4566–4579. [Google Scholar] [CrossRef] [Scilit]
- Murillo, D.; Enderle, B.; Pham, J. Teaching Formal Charges of Lewis Electron Dot Structures by Counting Attachments. J. Chem. Educ. 2025, 102, 112–118. [Google Scholar] [CrossRef] [Scilit]
- Buzzolani, S.P.; Mistretta, M.J.; Bugajczyk, A.E.; Sam, A.J.; Elezi, S.R.; Silverio, D.L. Effective Visualization of Implicit Hydrogens with Prime Formulae. J. Chem. Educ. 2025, 102, 508–515. [Google Scholar] [CrossRef] [Scilit]
- Nayyar, P.; Young, J.D.; Dawood, L.; Lewis, S.E. Evaluating an Intervention to Improve General Chemistry Students’ Perceptions of the Utility of Chemistry. J. Chem. Educ. 2025, 102, 1389–1397. [Google Scholar] [CrossRef] [Scilit]
- Cooper, M.M.; Grove, N.; Underwood, S.M.; Klymkowsky, M.W. Lost in Lewis Structures: An Investigation of Student Difficulties in Developing Representational Competence. J. Chem. Educ. 2010, 87, 869–874. [Google Scholar] [CrossRef] [Scilit]
- Yik, B.J.; Dood, A.J. ChatGPT Convincingly Explains Organic Chemistry Reaction Mechanisms Slightly Inaccurately with High Levels of Explanation Sophistication. J. Chem. Educ. 2024, 101, 1836–1846. [Google Scholar] [CrossRef] [Scilit]
- West, J.K.; Franz, J.L.; Hein, S.M.; Leverentz-Culp, H.R.; Mauser, J.F.; Ruff, E.F.; Zemke, J.M. An Analysis of AI-Generated Laboratory Reports across the Chemistry Curriculum and Student Perceptions of ChatGPT. J. Chem. Educ. 2023, 100, 4351–4359. [Google Scholar] [CrossRef] [Scilit]
- Pradhan, T.; Gupta, O.; Chawla, G. The Future of ChatGPT in Medicinal Chemistry: Harnessing AI for Accelerated Drug Discovery. ChemistrySelect 2024, 9, e202304359. [Google Scholar] [CrossRef] [Scilit]
- Rojas, A.J. An Investigation into ChatGPT’s Application for a Scientific Writing Assignment. J. Chem. Educ. 2024, 101, 1959–1965. [Google Scholar] [CrossRef] [Scilit]
- Guo, Y.; Lee, D. Leveraging ChatGPT for Enhancing Critical Thinking Skills. J. Chem. Educ. 2023, 100, 4876–4883. [Google Scholar] [CrossRef] [Scilit]
- Fergus, S.; Botha, M.; Ostovar, M. Evaluating Academic Answers Generated Using ChatGPT. J. Chem. Educ. 2023, 100, 1672–1675. [Google Scholar] [CrossRef] [Scilit]
- Leon, A.J.; Vidhani, D. ChatGPT Needs a Chemistry Tutor Too. J. Chem. Educ. 2023, 100, 3859–3865. [Google Scholar] [CrossRef] [Scilit]
- Fernández, A.A.; López-Torres, M.; Fernández, J.J.; Vázquez-García, D. ChatGPT as an Instructor’s Assistant for Generating and Scoring Exams. J. Chem. Educ. 2024, 101, 3780–3788. [Google Scholar] [CrossRef] [Scilit]
- Berber, S.; Brückner, M.; Maurer, N.; Huwer, J. Artificial Intelligence in Chemistry Research—Implications for Teaching and Learning. J. Chem. Educ. 2025, 102, 1445–1456. [Google Scholar] [CrossRef] [Scilit]
- Nayyar, P.; Teran, O.A.; Lewis, S.E. Artificial Intelligence as a Catalyst for Promoting Utility Value Perceptions of Chemistry. J. Chem. Educ. 2025, 102, 2685–2694. [Google Scholar] [CrossRef] [Scilit]
- Hrubeš, J.; Jaroš, A.; Nemirovich, T.; Teplá, M.; Petrželová, S. Integrating Computational Chemistry into Secondary School Lessons. J. Chem. Educ. 2024, 101, 2343–2353. [Google Scholar] [CrossRef] [Scilit]
- Clark, T.M.; Tafini, N. Exploring the AI–Human Interface for Personalized Learning in a Chemical Context. J. Chem. Educ. 2024, 101, 4916–4923. [Google Scholar] [CrossRef] [Scilit]
- Clark, T.M.; Anderson, E.; Dickson-Karn, N.M.; Soltanirad, C.; Tafini, N. Comparing the Performance of College Chemistry Students with ChatGPT for Calculations Involving Acids and Bases. J. Chem. Educ. 2023, 100, 3934–3944. [Google Scholar] [CrossRef] [Scilit]
- Shallcross, D.E.; Davies-Coleman, M.T.; Lloyd, C.; Dennis, F.; McCarthy-Torrens, A.; Heslop, B.; Eastman, J.; Baldwin, T.; Thistlethwaite, I. Smart Worksheets and Their Positive Impact on a First-Year Quantitative Chemistry Course. J. Chem. Educ. 2025, 102, 1062–1070. [Google Scholar] [CrossRef] [Scilit]
- Dong, M.; Lih, T.S.M.; Höti, N.; Chen, S.Y.; Ponce, S.; Partin, A.; Zhang, H. Development of Parallel Reaction Monitoring Assays for the Detection of Aggressive Prostate Cancer Using Urinary Glycoproteins. J. Proteome Res. 2021, 20, 3590–3599. [Google Scholar] [CrossRef] [Scilit] [PubMed]
- Borges, E.M. Data Visualization Using Boxplots: Comparison of Metalloid, Metal, and Nonmetal Chemical and Physical Properties. J. Chem. Educ. 2023, 100, 2809–2817. [Google Scholar] [CrossRef] [Scilit]
- Schrier, J. Comment on “Comparing the Performance of College Chemistry Students with ChatGPT for Calculations Involving Acids and Bases”. J. Chem. Educ. 2024, 101, 1782–1784. [Google Scholar] [CrossRef] [Scilit]
- Clark, T.M. Investigating the Use of an Artificial Intelligence Chatbot with General Chemistry Exam Questions. J. Chem. Educ. 2023, 100, 1905–1916. [Google Scholar] [CrossRef] [Scilit]
- Margoum, S.; Berrada, K.; Burgos, D.; El Hasri, S. Microcomputer-Based Laboratory Role in Developing Students’ Conceptual Understanding in Chemistry: Case of Acid–Base Titration. J. Chem. Educ. 2022, 99, 2548–2555. [Google Scholar] [CrossRef] [Scilit]
- Ortiz Nieves, E.L.; Barreto, R.; Medina, Z. JCE Classroom Activity #111: Redox Reactions in Three Representations. J. Chem. Educ. 2012, 89, 643–645. [Google Scholar] [CrossRef] [Scilit]
- Liu, L.; Fu, S.; Wang, G.; Yu, J.; Fu, Q. Inquiry-Based Investigation of the Influencing Factors on the Redox Titration Curves by Simulation. J. Chem. Educ. 2024, 101, 3301–3310. [Google Scholar] [CrossRef] [Scilit]
- Marrs, P.S. Class Projects in Physical Organic Chemistry: The Hydrolysis of Aspirin. J. Chem. Educ. 2004, 81, 870. [Google Scholar] [CrossRef] [Scilit]
- Mandel, N.L.; Le, B.; Ward, R.; Hansen, S.J.R.; Ulichny, J.C. Titrating Consumer Acids to Uncover Student Understanding: A Laboratory Investigation Leading to Data-Driven Instructional Interventions. J. Chem. Educ. 2022, 99, 2378–2384. [Google Scholar] [CrossRef] [Scilit]
- Hamer, M.; Hamer, M.; Vago, M.J.; Leal Denis, M.F. Real-World Sample-Based Teaching in Analytical Chemistry: Afterthoughts on a Hands-On Experience. J. Chem. Educ. 2024, 101, 205–214. [Google Scholar] [CrossRef] [Scilit]
- Lucy, C.A. Is Your Henderson–Hasselbalch Calculation of Buffer PH Correct? J. Chem. Educ. 2023, 100, 2418–2422. [Google Scholar] [CrossRef] [Scilit]
- Pergantis, S.A.; Saridakis, I.; Lyratzakis, A.; Mavroudakis, L.; Montagnon, T. Buffer Squares: A Graphical Approach for the Determination of Buffer PH Using Logarithmic Concentration Diagrams. J. Chem. Educ. 2019, 96, 936–943. [Google Scholar] [CrossRef] [Scilit]
- González-Gómez, D.; Airado Rodríguez, D.; Cañada-Cañada, F.; Jeong, J.S. A Comprehensive Application To Assist in Acid–Base Titration Self-Learning: An Approach for High School and Undergraduate Students. J. Chem. Educ. 2015, 92, 855–863. [Google Scholar] [CrossRef] [Scilit]
- Fu, Q.; Fu, S.; Yang, H.; Yu, J.; Liu, L. Prelaboratory Practice with a Titration Simulation Program for Carbonate Mixtures. J. Chem. Educ. 2024, 101, 993–1001. [Google Scholar] [CrossRef] [Scilit]
- Borges, E.M. Hypothesis Tests and Exploratory Analysis Using R Commander and Factoshiny. J. Chem. Educ. 2023, 100, 267–278. [Google Scholar] [CrossRef] [Scilit]
- de Souza, R.S.; Sequeira, C.A.; Borges, E.M. Enhancing Statistical Education in Chemistry and STEAM Using JAMOVI. Part 1: Descriptive Statistics and Comparing Independent Groups. J. Chem. Educ. 2024, 101, 5027–5039. [Google Scholar] [CrossRef] [Scilit]
- Edwards, T.G.; Özgün-Koca, A.; Barr, J. Interpretations of Boxplots: Helping Middle School Students to Think Outside the Box. J. Stat. Educ. 2017, 25, 21–28. [Google Scholar] [CrossRef] [Scilit]
- Ferreira, J.E.V.; Miranda, R.M.; Figueiredo, A.F.; Barbosa, J.P.; Brasil, E.M. Box-and-Whisker Plots Applied to Food Chemistry. J. Chem. Educ. 2016, 93, 2026–2032. [Google Scholar] [CrossRef] [Scilit]
- Sidou, L.F.; Borges, E.M. Teaching Principal Component Analysis Using a Free and Open Source Software Program and Exercises Applying PCA to Real-World Examples. J. Chem. Educ. 2020, 97, 1666–1676. [Google Scholar] [CrossRef] [Scilit]
- Menke, E.J. Series of Jupyter Notebooks Using Python for an Analytical Chemistry Course. J. Chem. Educ. 2020, 97, 3899–3903. [Google Scholar] [CrossRef] [Scilit]
- Lafuente, D.; Cohen, B.; Fiorini, G.; García, A.A.; Bringas, M.; Morzan, E.; Onna, D. A Gentle Introduction to Machine Learning for Chemists: An Undergraduate Workshop Using Python Notebooks for Visualization, Data Processing, Analysis, and Modeling. J. Chem. Educ. 2021, 98, 2892–2898. [Google Scholar] [CrossRef] [Scilit]
- Kim, S.-Y.; Jeon, I.; Kang, S.-J. Integrating Data Science and Machine Learning to Chemistry Education: Predicting Classification and Boiling Point of Compounds. J. Chem. Educ. 2024, 101, 1771–1776. [Google Scholar] [CrossRef] [Scilit]
- Sahli, C.; Pham, T.T.; Kenry. Machine-Learning-Assisted Analysis of Patient Clinical Biomarkers to Improve Ovarian Cancer Diagnosis. Precis. Chem. 2025, 3, 554–566. [Google Scholar] [CrossRef] [Scilit]
- Duponchel, L.; de Oliveira, R.R.; Motto-Ros, V. Large Language Models (Such as ChatGPT) as Tools for Machine Learning-Based Data Insights in Analytical Chemistry. Anal. Chem. 2025, 97, 6956–6961. [Google Scholar] [CrossRef] [Scilit]
- Hupp, A.M. Incorporating Chemometric Methods in the Undergraduate Curriculum: A Problem Set Activity for an Upper-Level Analytical Elective Course. J. Chem. Educ. 2023, 100, 1377–1381. [Google Scholar] [CrossRef] [Scilit]
- Silva de Souza, R.; Borges, E.M. Teaching Descriptive Statistics and Hypothesis Tests Measuring Water Density. J. Chem. Educ. 2023, 100, 4438–4448. [Google Scholar] [CrossRef] [Scilit]
- Reed, S.M. Augmented and Programmatically Optimized LLM Prompts Reduce Chemical Hallucinations. J. Chem. Inf. Model. 2025, 65, 4274–4280. [Google Scholar] [CrossRef] [Scilit]
- Yuriev, E.; Orgill, M.; Holme, T. Generative AI in Chemistry Education: Current Progress, Pedagogical Values, and the Challenge of Rapid Evolution. J. Chem. Educ. 2025, 102, 3773–3776. [Google Scholar] [CrossRef] [Scilit]
- Maughan, A.E.; Toberer, E.S.; Zevalkink, A. Integrating Large Language Models into the Chemistry and Materials Science Laboratory Curricula. Chem. Mater. 2025, 37, 2389–2394. [Google Scholar] [CrossRef] [Scilit]

Disclaimer/Publisher’s Note: The statements, opinions and data contained in all publications are solely those of the individual author(s) and contributor(s) and not of MDPI and/or the editor(s). MDPI and/or the editor(s) disclaim responsibility for any injury to people or property resulting from any ideas, methods, instructions or products referred to in the content. |
© 2026 by the authors. Licensee MDPI, Basel, Switzerland. This article is an open access article distributed under the terms and conditions of the Creative Commons Attribution (CC BY) license.