


Abstract
The crystallization of linear–bottlebrush–linear (LBL) block copolymers comprising a central bottlebrush block bearing poly(ethylene glycol) (PEG) side chains and poly(N-isopropylacrylamide) (PNIPAM) end blocks was investigated using time-resolved synchrotron small- and wide-angle X-ray scattering. During crystallization, the characteristic bottlebrush peak, arising from backbone-to-backbone correlations, progressively decreases in intensity and disappears when the PEG crystallinity exceeds 40%. This decay reflects the transformation of the initial amorphous bottlebrush matrix as growing crystals confine the backbones to interlamellar amorphous regions and disrupt their initial arrangement. The bottlebrush peak thus provides a structural marker of the untransformed amorphous matrix, allowing its evolution to be tracked separately from the development of crystalline order. A coupled two-stage kinetic analysis reveals that the initial stage of spherulitic growth and the secondary crystallization stage within the developing semicrystalline framework contribute comparably to the final crystallinity. Confinement of bottlebrush segments at the interface with PNIPAM domains restricts local PEG crystallization. In the melt, longer PNIPAM end blocks are associated with larger interdomain spacings, reduced elongation at break, and a higher strain-stiffening parameter β. These findings establish relationships between macromolecular architecture, crystallization kinetics, and mechanical response in bottlebrush physical networks.
1. Introduction
Polymer crystallization is a multistage process whose kinetics and morphological evolution are strongly influenced by macromolecular architecture and the associated constraints on chain rearrangement [1,2,3]. Side-chain crystallization in bottlebrush (BB) polymers requires the common noncrystallizable backbone to be accommodated within the amorphous regions of the developing semicrystalline structure [4,5]. This rearrangement can be monitored through changes in the characteristic BB correlation peak observed in small-angle X-ray scattering (SAXS). In systems where this peak directly reflects the backbone-to-backbone correlations, changes in its position and intensity reflect the evolution of local backbone packing [6]. Monitoring this signal together with crystalline reflections and lamellar scattering provides complementary information on how crystal formation reorganizes the surrounding amorphous material. Of particular interest is the relationship between the loss of the initial bulk melt-like backbone-to-backbone correlations and the continuing development of crystallinity.
Previous studies have demonstrated different responses of the BB peak to side-chain crystallization. In BB elastomers bearing poly(ε-caprolactone) side chains, changes in the correlation distance were associated with the confinement of backbones within interlamellar amorphous regions [4]. In analogous elastomers with poly(ethylene glycol) (PEG) side chains, the peak intensity decreased with increasing crystallinity and eventually vanished before crystallization was complete [5]. Its disappearance indicates the loss of the initial backbone-to-backbone correlations in the amorphous phase, which is a part of the newly formed semicrystalline structure, altering physical properties. These observations establish the sensitivity of the BB peak to amorphous rearrangement and motivate its use alongside conventional crystalline scattering to distinguish different contributions to the crystallization process.
The extent and character of these rearrangements depend on the constraints imposed by the macromolecular architecture. In linear- and star-brush PEGs, increasing the degree of branching reduces the spherulitic growth rate at a given undercooling [7]. Studies of PEG-based brushes have demonstrated that the backbone conformation, side-chain length, and grafting density determine molecular packing and the conformational freedom of the grafted chains [8,9]. The studies have also addressed the effects of configurational constraints on crystallization kinetics and lamellar organization [10]. In PEG bottlebrushes, the nucleation density reaches a maximum at intermediate grafting densities, whereas increasing the grafting density extends the temperature range over which crystalline memory persists in the melt [11].
In statistical bottlebrush copolymers, glassy polystyrene (PS) side chains can restrict PEG mobility and lead to cold crystallization [12]. In brushes with poly(ε-caprolactone)-block-poly(n-butyl acrylate) side chains, bulk crystallization is accompanied by a transition from a molecularly segregated core–shell morphology to a lamellar organization [13]. In microphase-separated statistical bottlebrush copolymers with PEG and poly(dimethylsiloxane) (PDMS) side chains, PEG crystallization has been associated with a reduction in side-chain orientational order [14]. In related PEG-PDMS bottlebrush block copolymers, confinement of PEG within spherical domains can suppress its crystallization at room temperature [15]. Side-chain overcrowding can also induce lamellar bending and the formation of hollow crystals during crystallization from solution [16]. In PEG-b-PS single-crystal templates, confinement between vitrified PS layers affects PEG nucleation and leads to a recrystallization-temperature-dependent crystal orientation [17].
These structural effects have consequences for the properties of BB materials. Architectural control of backbone conformation and network organization has enabled strain-adaptive mechanical and optical responses [18]. Crystallizable end blocks can form supersoft, reversibly moldable physical networks [19], while side-chain crystallization introduces temperature-dependent reinforcement and tissue-adaptive mechanical behavior [20]. BB architecture has also been used to regulate the degradation of crystallizable polymers [21]. Understanding such behavior requires relating the formation of crystalline domains to changes in the packing and connectivity of the amorphous material.
The simultaneous observation of crystalline ordering and amorphous rearrangement is also relevant to the interpretation of crystallization kinetics. Growth into the initial melt and further crystallization within an established semicrystalline morphology can overlap in time, limiting the physical interpretation of a measurement sensitive only to the total crystalline fraction [1,2]. Independent monitoring of the bulk amorphous response has previously allowed these contributions to be distinguished during isothermal cold crystallization of poly(ether ether ketone) [22]. Our recent study of poly(1,4-butylene adipate) using fast scanning chip calorimetry further distinguished the characteristic timescales of physical aging, homogeneous nucleation, and crystal growth, illustrating the coupling between amorphous relaxation and crystallization [23]. When the first transformation locally initiates a subsequent process, a correlated kinetic description can account for their temporal dependence [24]. The BB peak in SAXS provides a potential structural constraint for applying this approach to crystallization, because its evolution follows changes in the initial backbone organization alongside the increase in crystallinity.
Linear–bottlebrush–linear (LBL) triblock copolymers introduce an additional level of structural constraint through the self-assembly of their linear end blocks into physical junctions [25,26]. Interfacial packing restricts conformations of the BB strands and couples their organization to the morphology of the junctions [27]. Crystallization of the central BB block must therefore accommodate both the connectivity of the grafted chains and the interfaces of the microphase-separated domains. Following BB correlations, crystalline lamellae, and junction-domain scattering within the same experiment offers a way to examine these constraints at different structural levels.
The PNIPAM–bbPEG–PNIPAM architecture considered here comprises a PEG-bearing BB middle block and poly(N-isopropylacrylamide) (PNIPAM) end blocks. It was developed for injectable, thermoresponsive hydrogels with tissue-mimetic mechanical properties [28]. Subsequent studies addressed control of hydrogel softness and stability [29] and the organization of the physical network in water [30]. In the dry state, this architecture allows PEG crystallization to be examined in a matrix containing PNIPAM-rich domains, with distinct scattering contributions from backbone correlations, crystalline lamellae, and the dispersed domains.
Relating these scattering features to molecular packing also requires consideration of the PEG crystal structure. Its helical chain conformation provides a reference for comparing side-chain length with the dimensions of crystalline stems [31]. The incorporation of well-defined chain defects into PEG crystals illustrates the capacity of the lattice to accommodate local structural irregularities [32], while precisely defined half-stemmed lamellar crystals show that chain ends can be located within the crystalline core [33]. The competition between crystal growth and intracrystalline chain diffusion has also been shown to influence lamellar thickness [34]. These considerations are relevant when interpreting lamellar dimensions in brushes with short PEG side chains and assessing how crystalline packing is reconciled with the segregation of noncrystallizable backbones.
In this work, we investigate the isothermal crystallization of PNIPAM–bbPEG–PNIPAM triblock copolymers using time-resolved synchrotron small- and wide-angle X-ray scattering (SAXS and WAXS). We monitor evolution of the BB correlation peak together with PEG crystallinity, lamellar periodicity, and scattering from the PNIPAM-rich domains. The decay of the BB peak is used to constrain a correlated two-stage kinetic model that distinguishes the transformation of the initial melt-like matrix from continued crystallization within the developing semicrystalline structure. We also examine the role of the PNIPAM-rich network domains in the structural evolution and relate network organization to the mechanical response.
2. Experimental Section
2.1. Scanning Electron Microscopy
The phase-separated morphology of the sample surface was observed using a scanning electron microscope Crossbeam 550 (Carl Zeiss, Jena, Germany) with acceleration voltage 1–5 kV. Samples were coated with a 3 nm layer of Au/Pd (80/20) using a sample preparation system Quorum Q150T ES (Quorum Technologies Ltd., Lewes, UK).
2.2. Synchrotron Small- and Wide-Angle X-Ray Scattering
Small- and wide-angle X-ray scattering (SAXS-WAXS) experiments were carried out at the BM26 beamline of the European Synchrotron Radiation Facility (ESRF) in Grenoble (France). The measurements were conducted in transmission geometry using photon energy of 12 keV. The available q-values, with |q| = 4π sin(θ)/λ, where θ is the Bragg angle and λ is the wavelength, cover a range from 4.0 × 10⁻² nm−1 to 3.0 nm−1 and from 6 nm−1 to 45 nm−1. A Pilatus 1M detector (169 mm × 179 mm active area) was employed for recording scattering intensity at a sample-to-detector distance of 3.9 m, while a Pilatus 300k detector was employed to record the WAXS profiles. The data correction, calibration, and integration were performed using the fast azimuthal integration Python library (pyFAI version 2025.12.1) [35].
For spherical micelles, the SAXS intensity was analyzed using
where S(q) is the structure factor of PNIPAM micelles, P(q) is the form-factor, and A and B are constants. The spherical micelles were described by the form-factor of homogeneous solid spheres:
where R is the sphere radius. To account for size polydispersity, the analytical expression was convoluted with a Gaussian distribution of sphere radii. The micellar structure factor S(q) was modeled using the Percus–Yevick hard-sphere structure factor, which accounts for interparticle correlations arising from a three-dimensional hard-core potential [36]. In the limited q-range containing only the form-factor oscillations, the scattering intensity can, in certain cases, be approximated as
A similar approach was previously employed for the structural analysis of bottlebrush triblock copolymers [27]. For cylindrical micelles, the form factor was described by
where
where r and H are the cylinder radius and length, respectively, J1 is the first-order Bessel function, and Δρ = ρcyl – ρmatrix is the scattering length density contrast between the cylinder and the surrounding matrix.
2.3. Mechanical Tests
The samples were prepared by casting from toluene solutions followed by slow evaporation of toluene under high vapor pressure to allow time for microphase separation and network deformation. Dog-bone-shaped specimens with gauge-section dimensions of 12 × 2 × 1 mm (length × width × thickness) were tested in uniaxial tension in the melt state at 60 °C using an RSA-G2 dynamic mechanical analyzer (TA Instruments, New Castle, DE, USA) at a constant strain rate of 0.005 s−1. To minimize the grip jaw effect on strain distribution and premature sample failure, we used a dog-bone shape with a wide base of 10 mm and adjusted the grip force to a minimal value sufficient to prevent slippage. The specimens were stretched until failure to obtain the complete stress–strain response. All measurements were performed in triplicate.
The stress–elongation curves were analyzed using the equation of state (Equation (8)) [18], which describes the dependence of the true stress on the elongation ratio (λ) for incompressible uniaxial deformation as follows:
where G is the structural shear modulus and β is the strain-stiffening parameter defined as a ratio of the mean square end-to-end distance, , of undeformed strands to square of their contour length, Rmax [9]. Both parameters were obtained by fitting Equation (8) to the experimental stress–elongation curves.
3. Results and Discussion
3.1. Phase-Separated Morphology
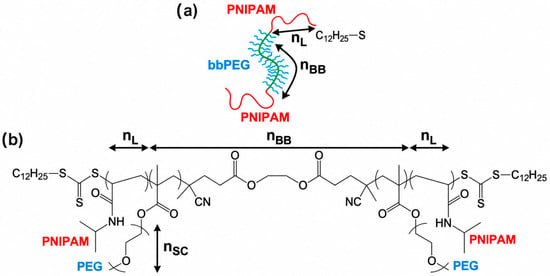
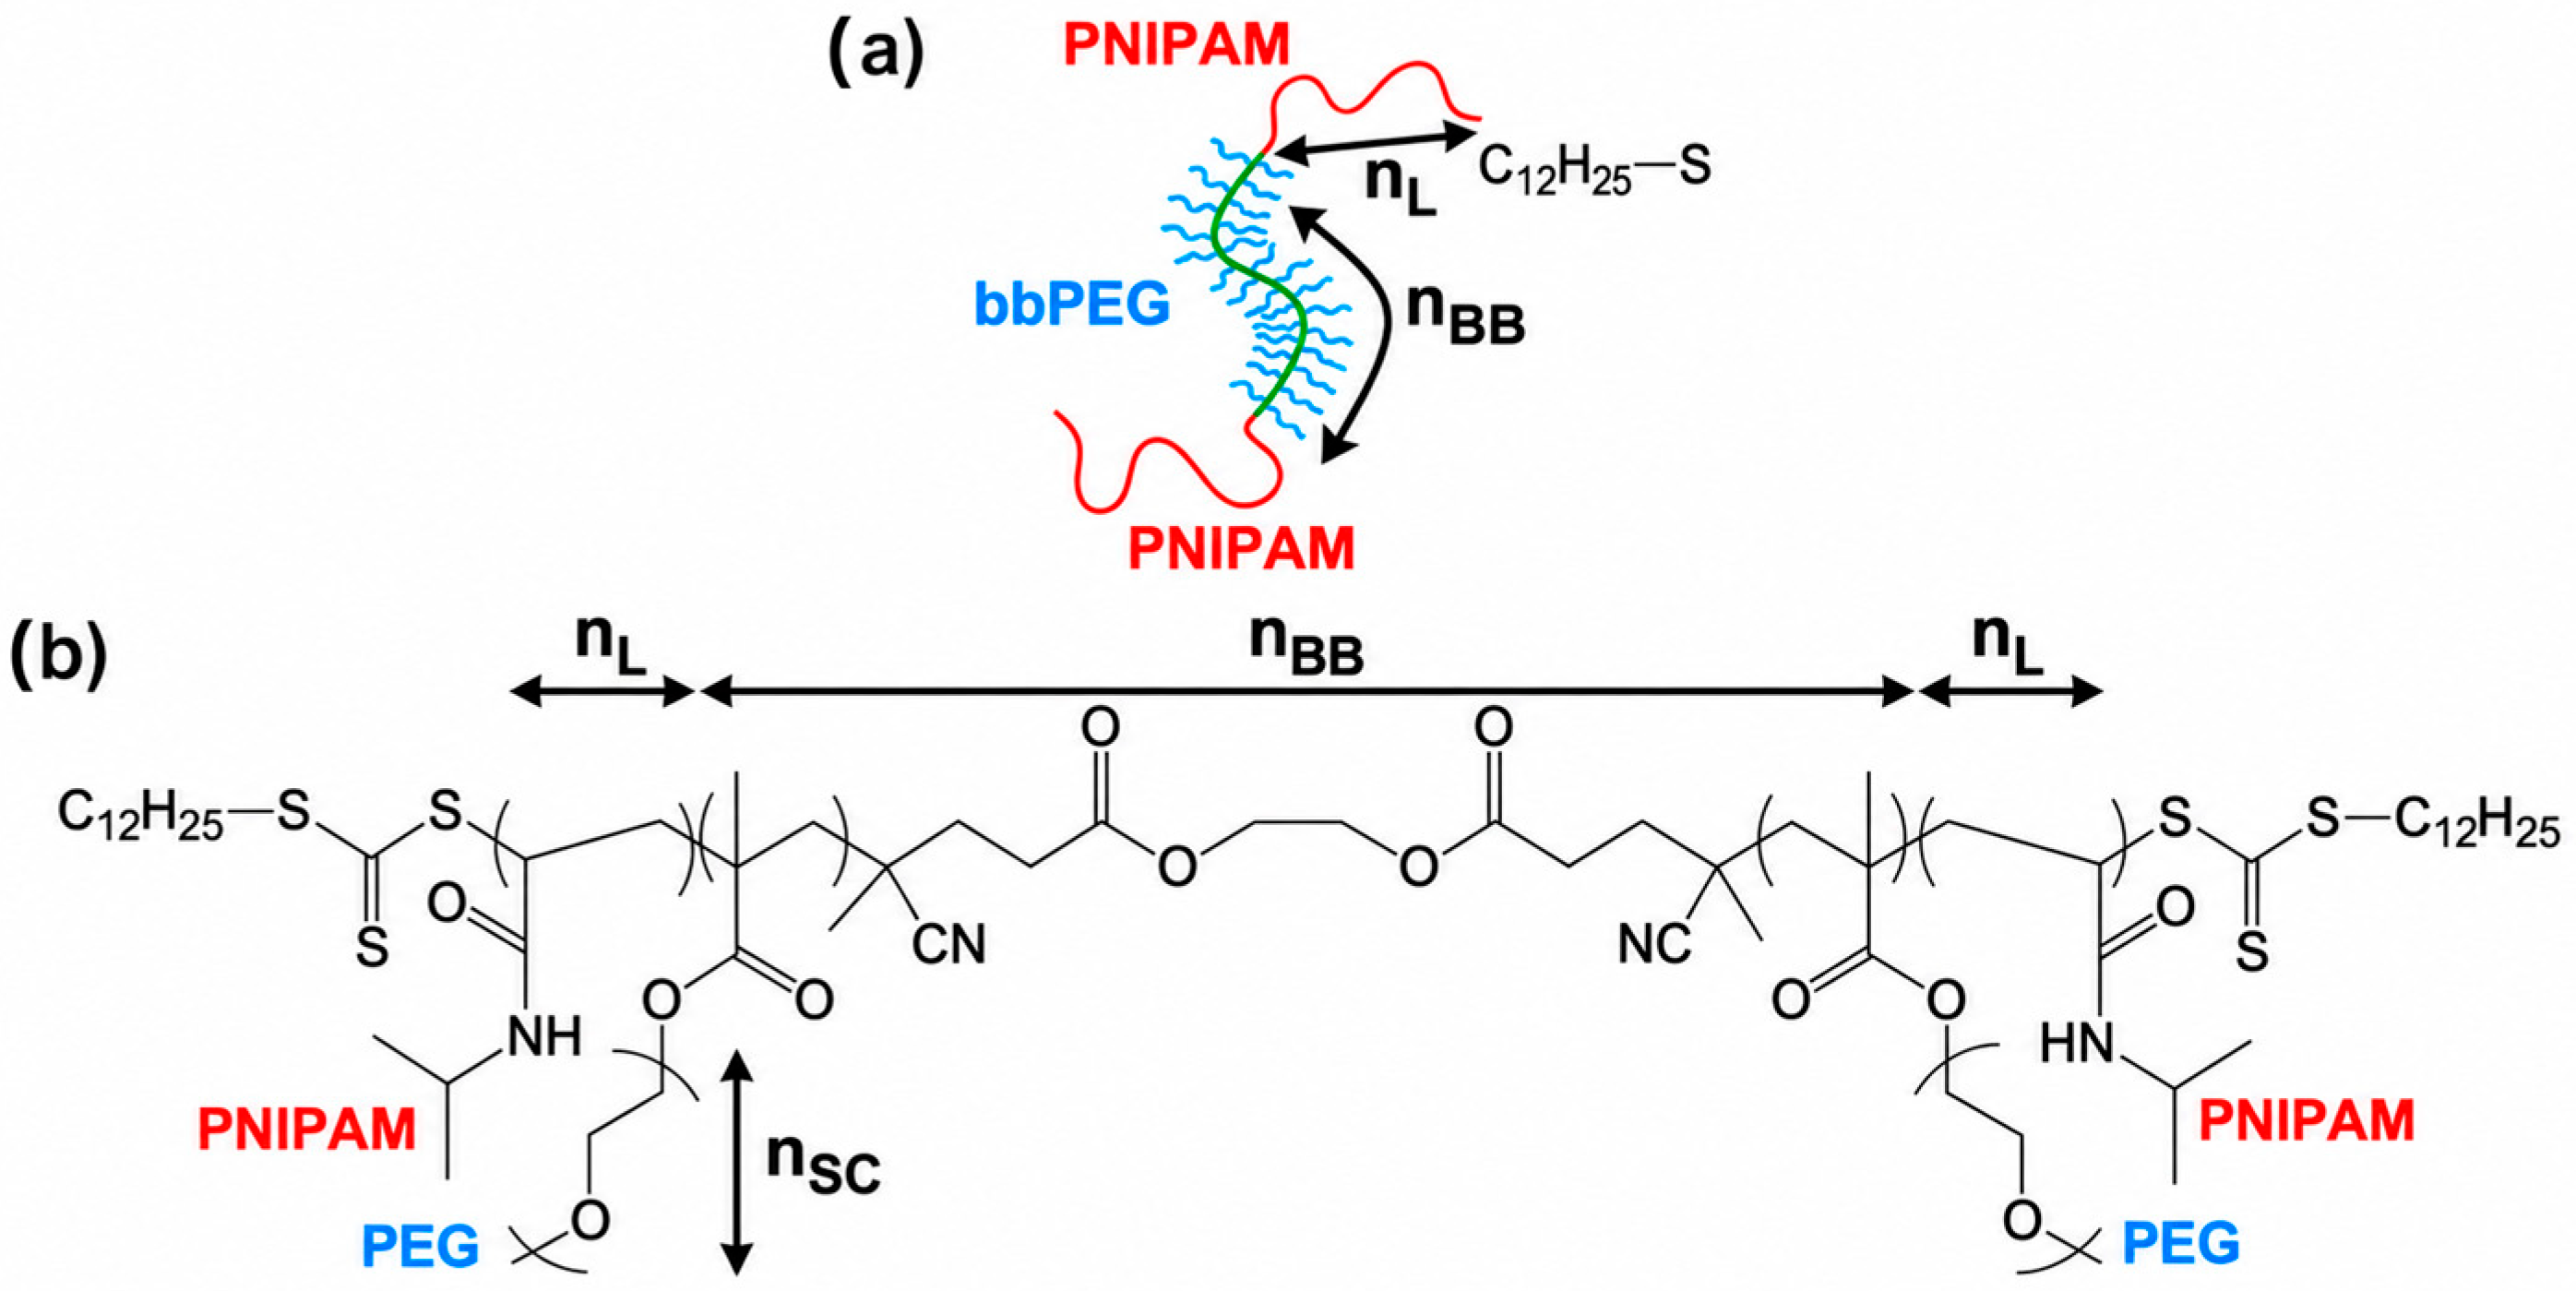
The chemical structure of the studied LBL triblock copolymers is shown in Scheme 1. The central bottlebrush block, with a degree of polymerization (DP) of nBB, consists of a poly(methacrylate) backbone densely grafted with poly(ethylene glycol) (PEG) side chains having a DP of nSC. The terminal blocks are composed of thermoresponsive poly(N-isopropylacrylamide) (PNIPAM) segments with a DP of nL. Due to incompatibility between the chemically distinct bottlebrush and linear blocks, these triblock copolymers undergo microphase separation, forming a physical network in which PEG bottlebrush strands are interconnected through PNIPAM-rich domains [28].
Scheme 1.
(a) Schematic representation of a linear–bottlebrush–linear triblock copolymer. Linear blocks are shown in red, the backbone of the brush block in green, and the side chains in blue. nL: degree of polymerization (DP) of the linear block; nBB: backbone DP of the brush block; ng: grafting density of the side chains; nSC: DP of the side chains. (b) Schematic of the chemical structure of the PNIPAM-bbPEG-PNIPAM triblock copolymer.
The structural parameters of the studied LBL block-copolymer samples are shown in Table 1. The studied copolymers are characterized by the nBB values ranging from 290 to 890. The volume fraction of the terminal PNIPAM blocks, φL, varies from 6% to 24%, while the side chains of the bottlebrush block have a constant nSC of 19. The synthesis of the block copolymers is described in detail in our previous publication [28].
Table 1.
Architectural and microstructural parameters for the synthesized LBL triblock-copolymers.
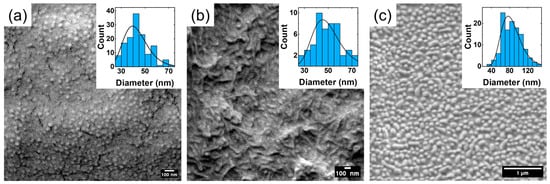
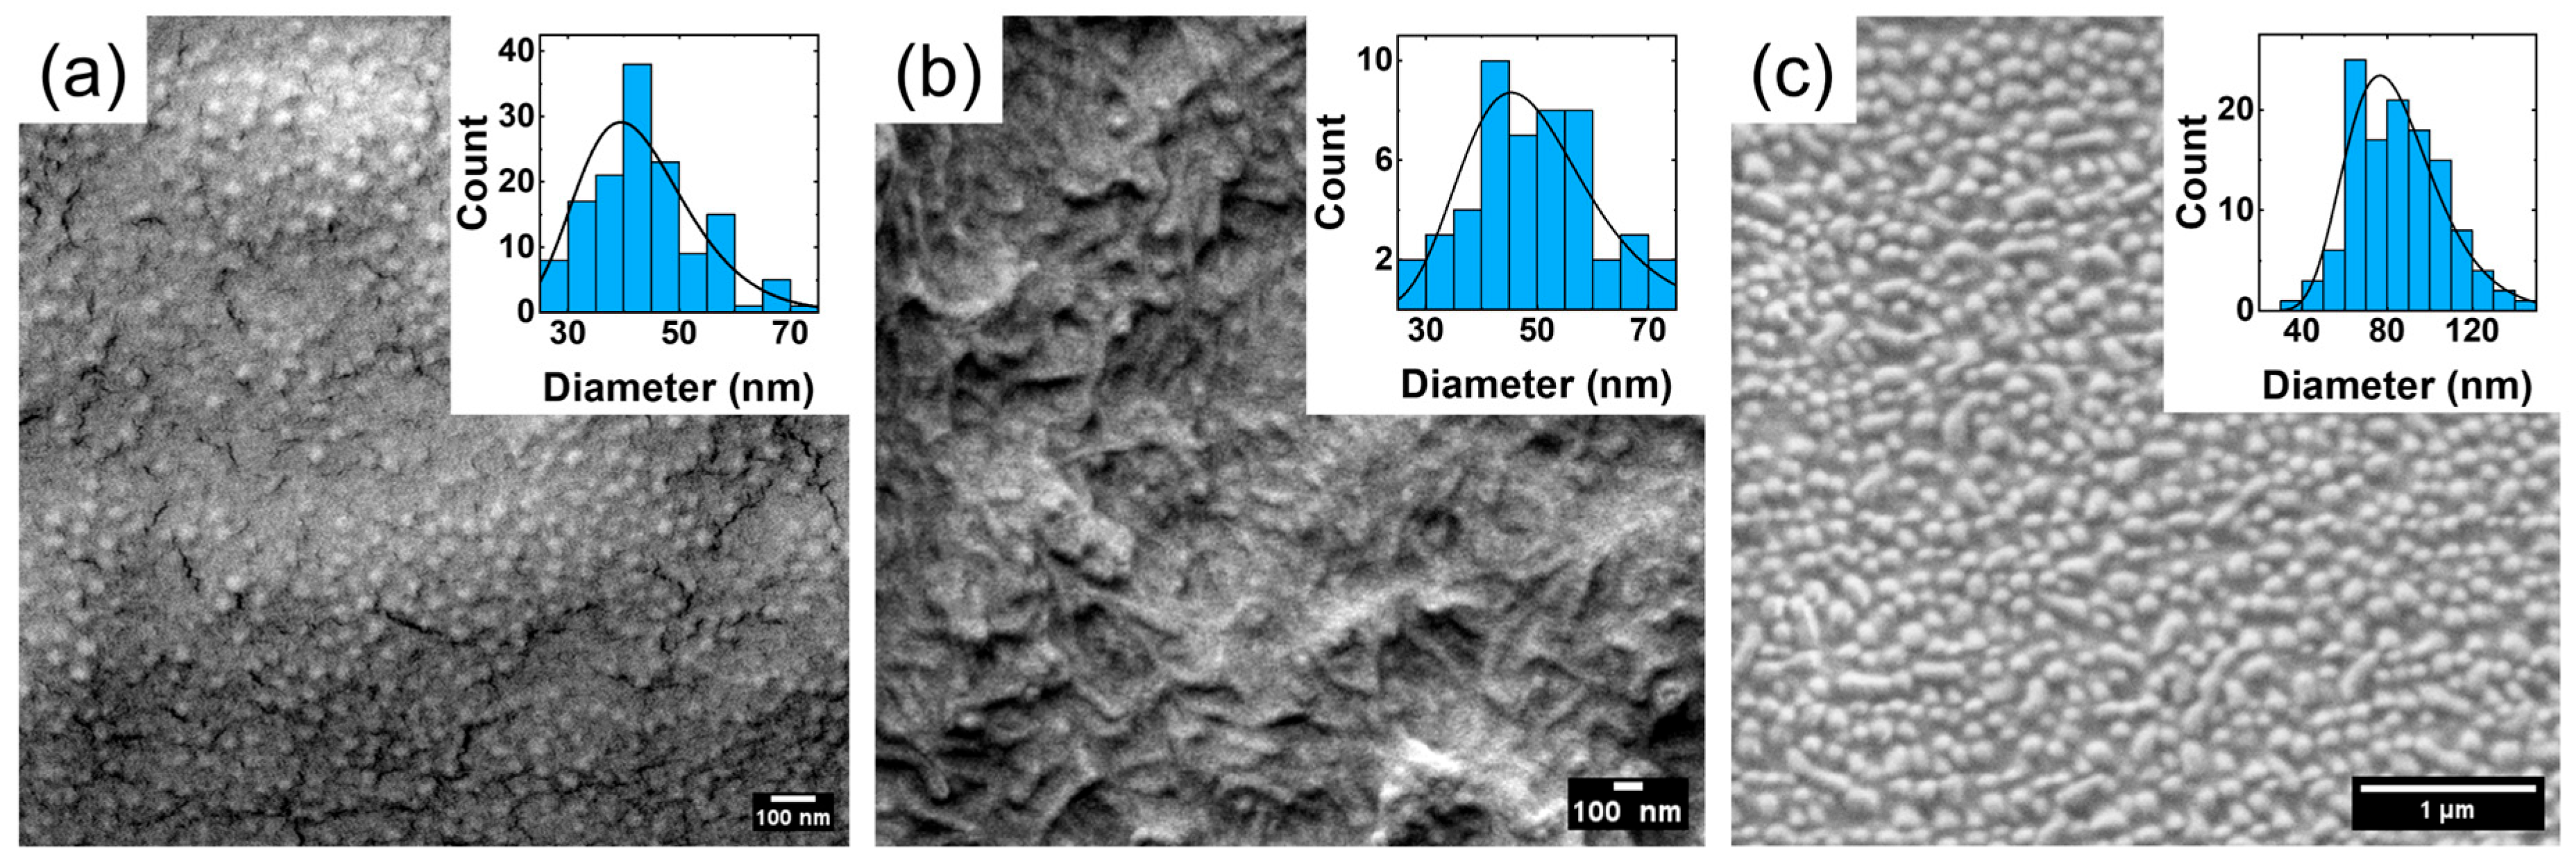
The SEM micrographs shown in Figure 1 illustrate the melt-crystallized morphology of samples 290-12, 290-22, and 580-20 at room temperature. The images reveal a grainy surface texture, indicative of a microphase-separated morphology characteristic of these copolymers. In the sample containing the shortest PNIPAM blocks (Figure 1a), the dispersed domains appear predominantly spherical. In contrast, the domains observed for samples with longer PNIPAM blocks (Figure 1b,c) exhibit a more elongated shape, which may indicate the onset of a transition from spherical to cylindrical morphology.
Figure 1.
SEM micrographs of samples (a) 290-12, (b) 290-22, and (c) 580-20. The images reveal a microphase-separated morphology, with the linear PNIPAM segments forming dispersed PNIPAM-rich domains within the bottlebrush copolymer matrix. Insets show the corresponding Feret diameter distributions obtained from image analysis.
The size distribution of the PNIPAM-rich domains on the SEM micrographs was quantified using Feret diameter analysis, and the resulting values are summarized in Table 1. It is noteworthy that samples 290-12 and 290-22 exhibit comparable domain sizes, whereas sample 580-20 displays significantly larger domains. This observation is consistent with the X-ray scattering results discussed below.
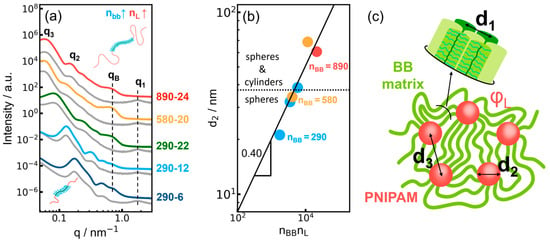
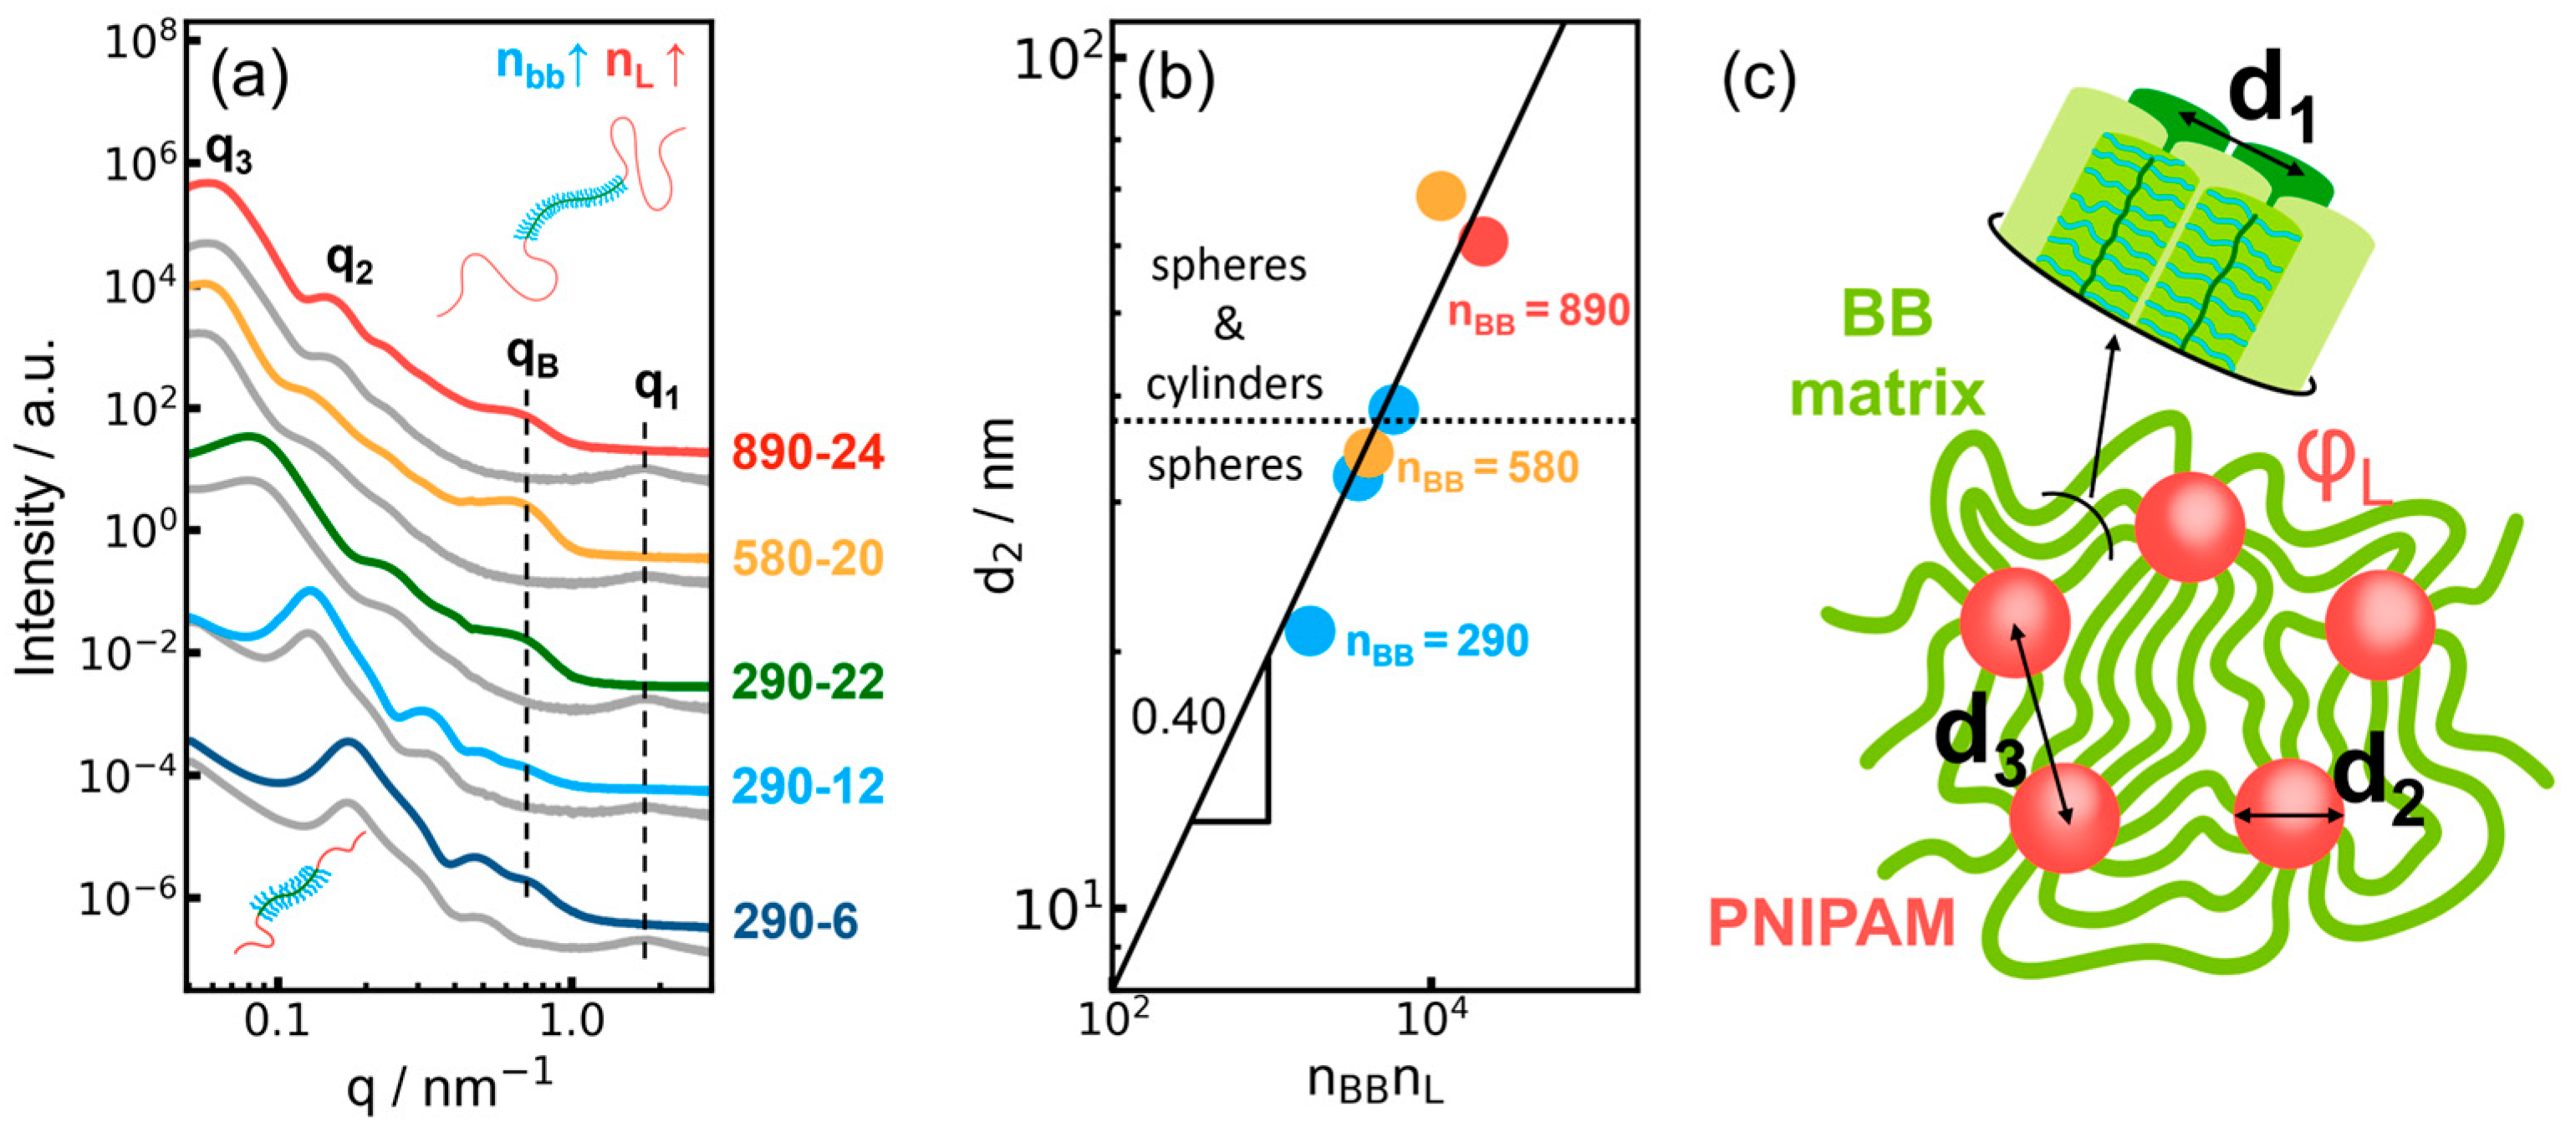
Figure 2a presents the SAXS profiles of the studied samples measured in both the crystalline state at 15 °C and the melt state. All curves exhibit a pronounced interference peak at low scattering vectors (q3), corresponding to the average spacing between the PNIPAM-rich domains. This peak is followed by a series of oscillations (q2) arising from the form-factor of the domains. In the crystalline state, an additional peak (qB) associated with the periodicity of the PEG crystalline lamellae is observed. Upon melting, this peak disappears and the bottlebrush peak (q1) becomes apparent, the d-spacing of which corresponds to the molecular diameter of the bottlebrush block [6]. The position of this peak is identical for all samples studied, indicating that the bottlebrush diameter is unaffected by variations in the length of the bottlebrush and terminal PNIPAM blocks. It is noteworthy that in the crystalline state the bottlebrush peak is fully suppressed, a fact that was observed previously for crystallization of bottlebrush elastomers with PEG side chains [5].
Figure 2.
(a) SAXS profiles for the indicated samples in the crystalline state at 15 °C (colored curves) and in the melt state (gray curves). All profiles exhibit the structure-factor peak (q3), the domain form-factor peak (q2), the bottlebrush peak (q1, visible in the melt state), and the long period associated with PEG lamellar crystals (visible in the semicrystalline state). The upward arrow indicates an increase in the bottlebrush backbone length (nBB) at an approximately constant volume fraction of the linear blocks, whereas the downward arrow indicates a decrease in the linear block length (nL) at constant nBB. Both changes are shown relative to sample 290-22. (b) Scaling relationship between the diameters of spherical and cylindrical domains and the product nBB × nL. The solid line represents a power-law fit with a slope of 0.4. (c) Schematic illustration of the characteristic distances: bottlebrush correlation distance (d1), PNIPAM-domain diameter (d2), and interdomain spacing (d3).
The characteristic size of the PNIPAM domains can be rationalized in terms of the molecular architecture of the triblock copolymers. In the framework of the scaling approach based on the balance of the block’s interfacial and stretching free energies, the diameter of PNIPAM spheres is related to the block’s degrees of polymerization as:
This dependence is shown in Figure 2b. The observed scaling exponent (α = β) exceeds the value of 0.33 expected for spherical microdomains in block copolymers [27]. This discrepancy may arise from the presence of morphologies intermediate between spherical and cylindrical domains in some of the samples marked in the figure. Such a transition is consistent with the elongated domain shapes observed by SEM and may lead to a steeper scaling of the characteristic domain size with increasing PNIPAM block length.
3.2. Correlation Between Crystallinity and the Bottlebrush Peak Intensity
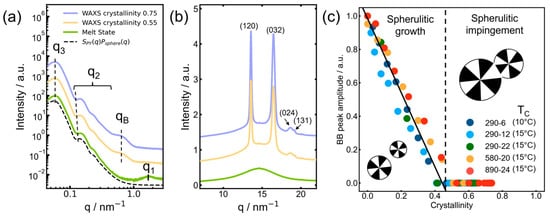
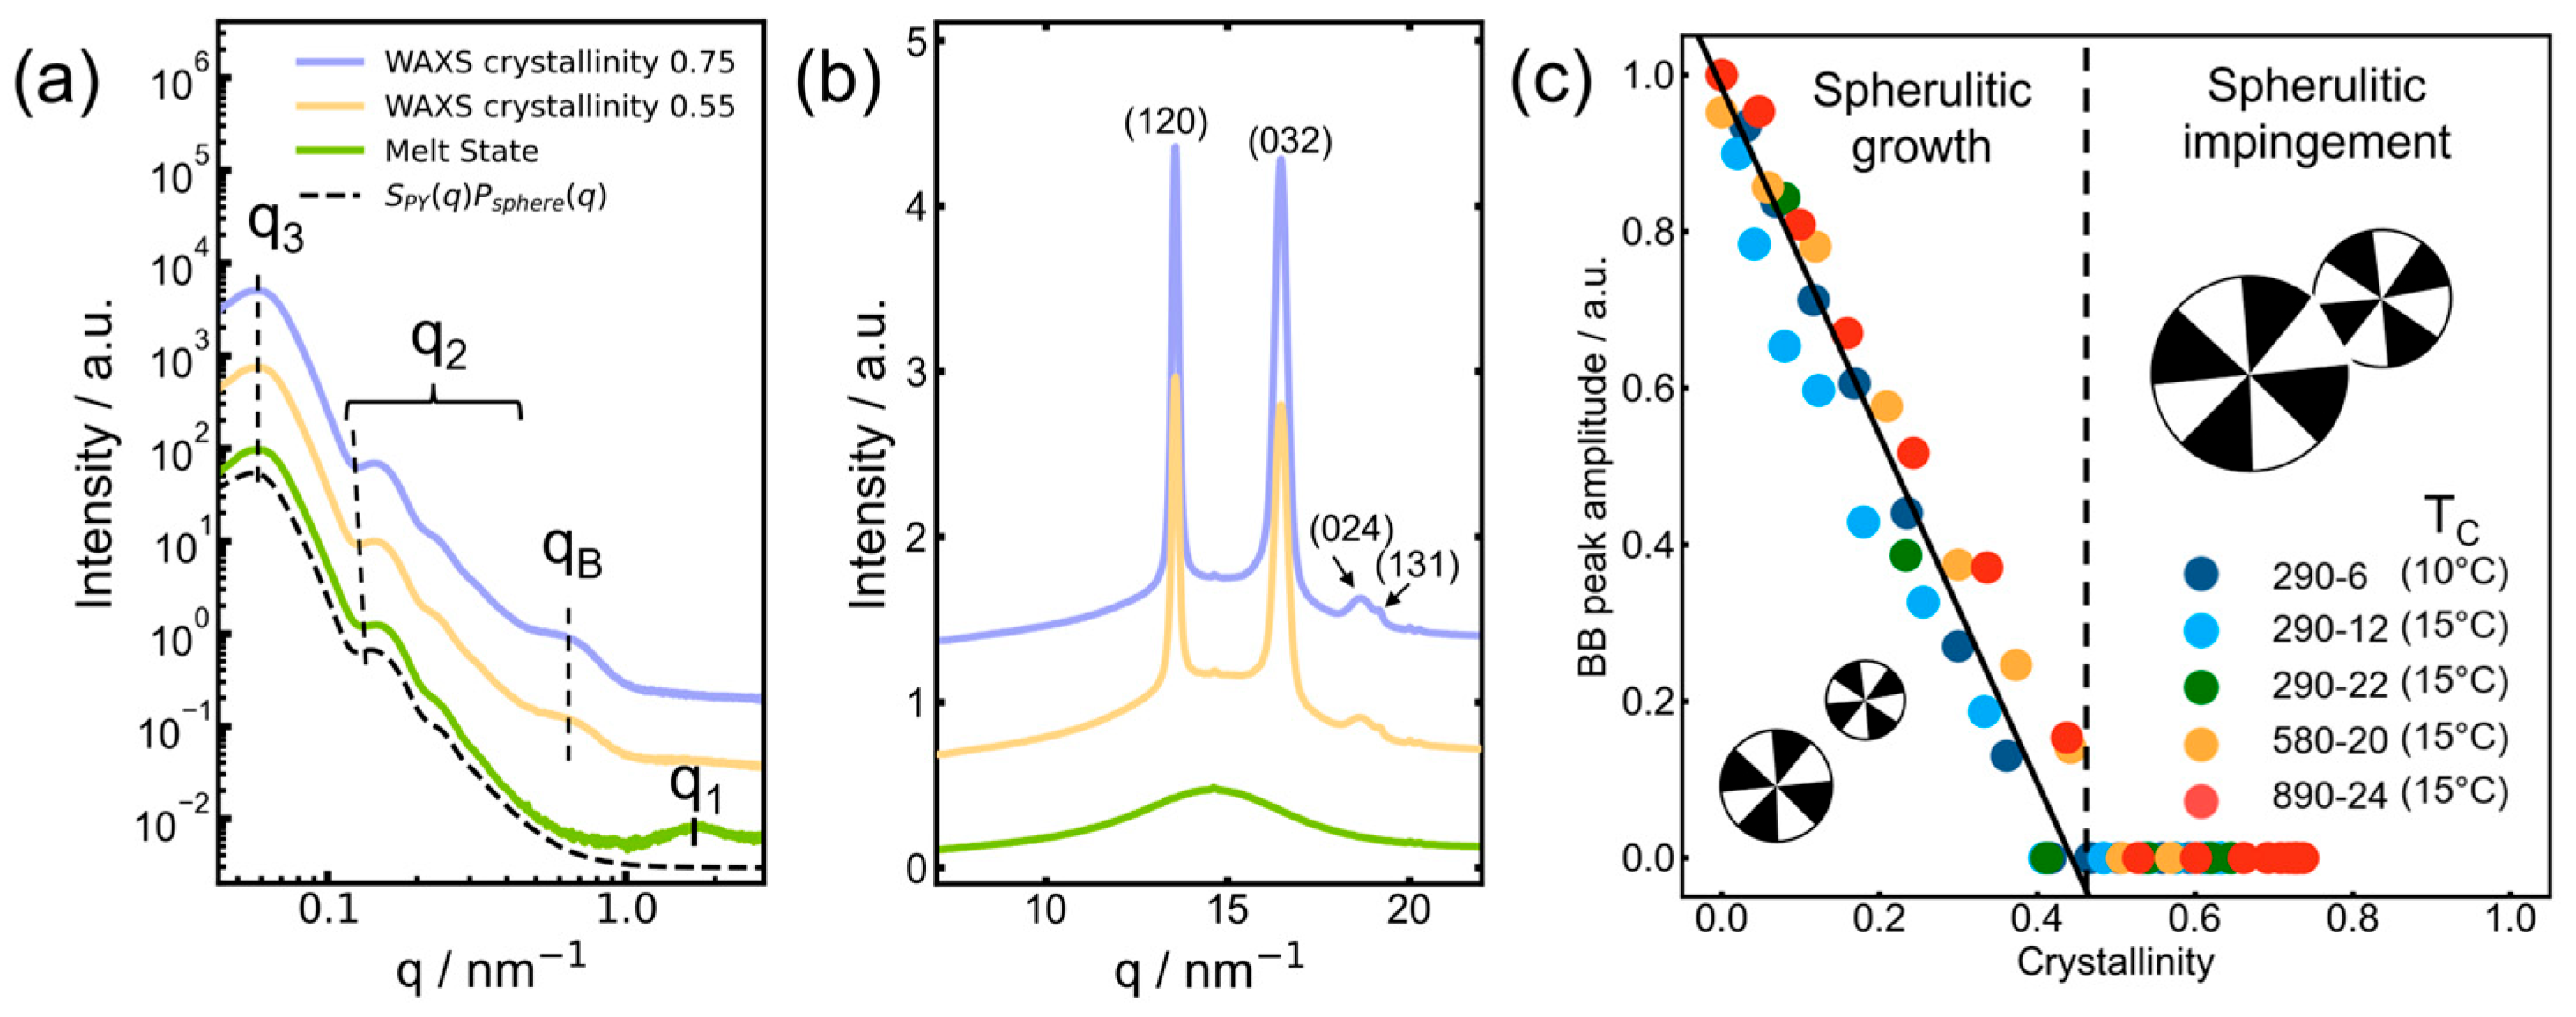
Crystallization of the PNIPAM–bbPEG–PNIPAM triblock copolymers is accompanied by the progressive disappearance of the bottlebrush correlation peak. Figure 3a,b show representative SAXS and WAXS profiles recorded at different stages of crystallization of sample 890-24. In the melt state, the SAXS profile exhibits the characteristic scattering pattern of the microphase-separated morphology, together with the bottlebrush correlation peak (green curve in Figure 3a). As crystallization proceeds, the amplitude of this peak gradually decreases. At a crystallinity of 0.55 (gold-colored curve in Figure 3a), the bottlebrush peak is no longer detectable. This stage is associated with spherulite impingement, at which point the bulk amorphous matrix has been largely consumed by the growing spherulites. The subsequent increase in crystallinity from 0.55 to 0.75 (blue curve in Figure 3a) is therefore attributed to crystallization and structural perfection occurring within the already formed spherulitic morphology.
Figure 3.
Representative SAXS (a) and WAXS (b) profiles recorded at different stages of isothermal melt crystallization of sample 890-24 at 15 °C. For simplicity, the (032) peak indicates a superposition of overlapping and (004) reflections. (c) Correlation between the bottlebrush peak amplitude and the crystallinity determined from WAXS for the indicated in-situ crystallization experiments. The crystallinity values were normalized to the PEG-containing bottlebrush block fraction of the copolymers, excluding the noncrystallizable PNIPAM end blocks.
Figure 3c shows the relationship between the bottlebrush peak amplitude and PEG crystallinity, as determined by WAXS, during in-situ crystallization of all the copolymers studied. Despite differences in crystallization kinetics, all datasets follow approximately the same linear dependence. The bottlebrush peak amplitude decreases steadily with increasing crystallinity and vanishes at a crystallinity slightly above 0.4. Further crystallization proceeds in the absence of any detectable bottlebrush correlation peak, indicating that the short-range positional correlations between bottlebrush molecules are disrupted well before crystallization is complete.
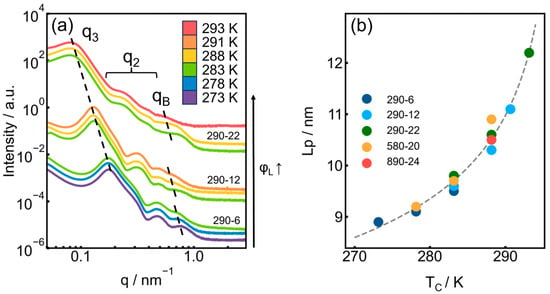
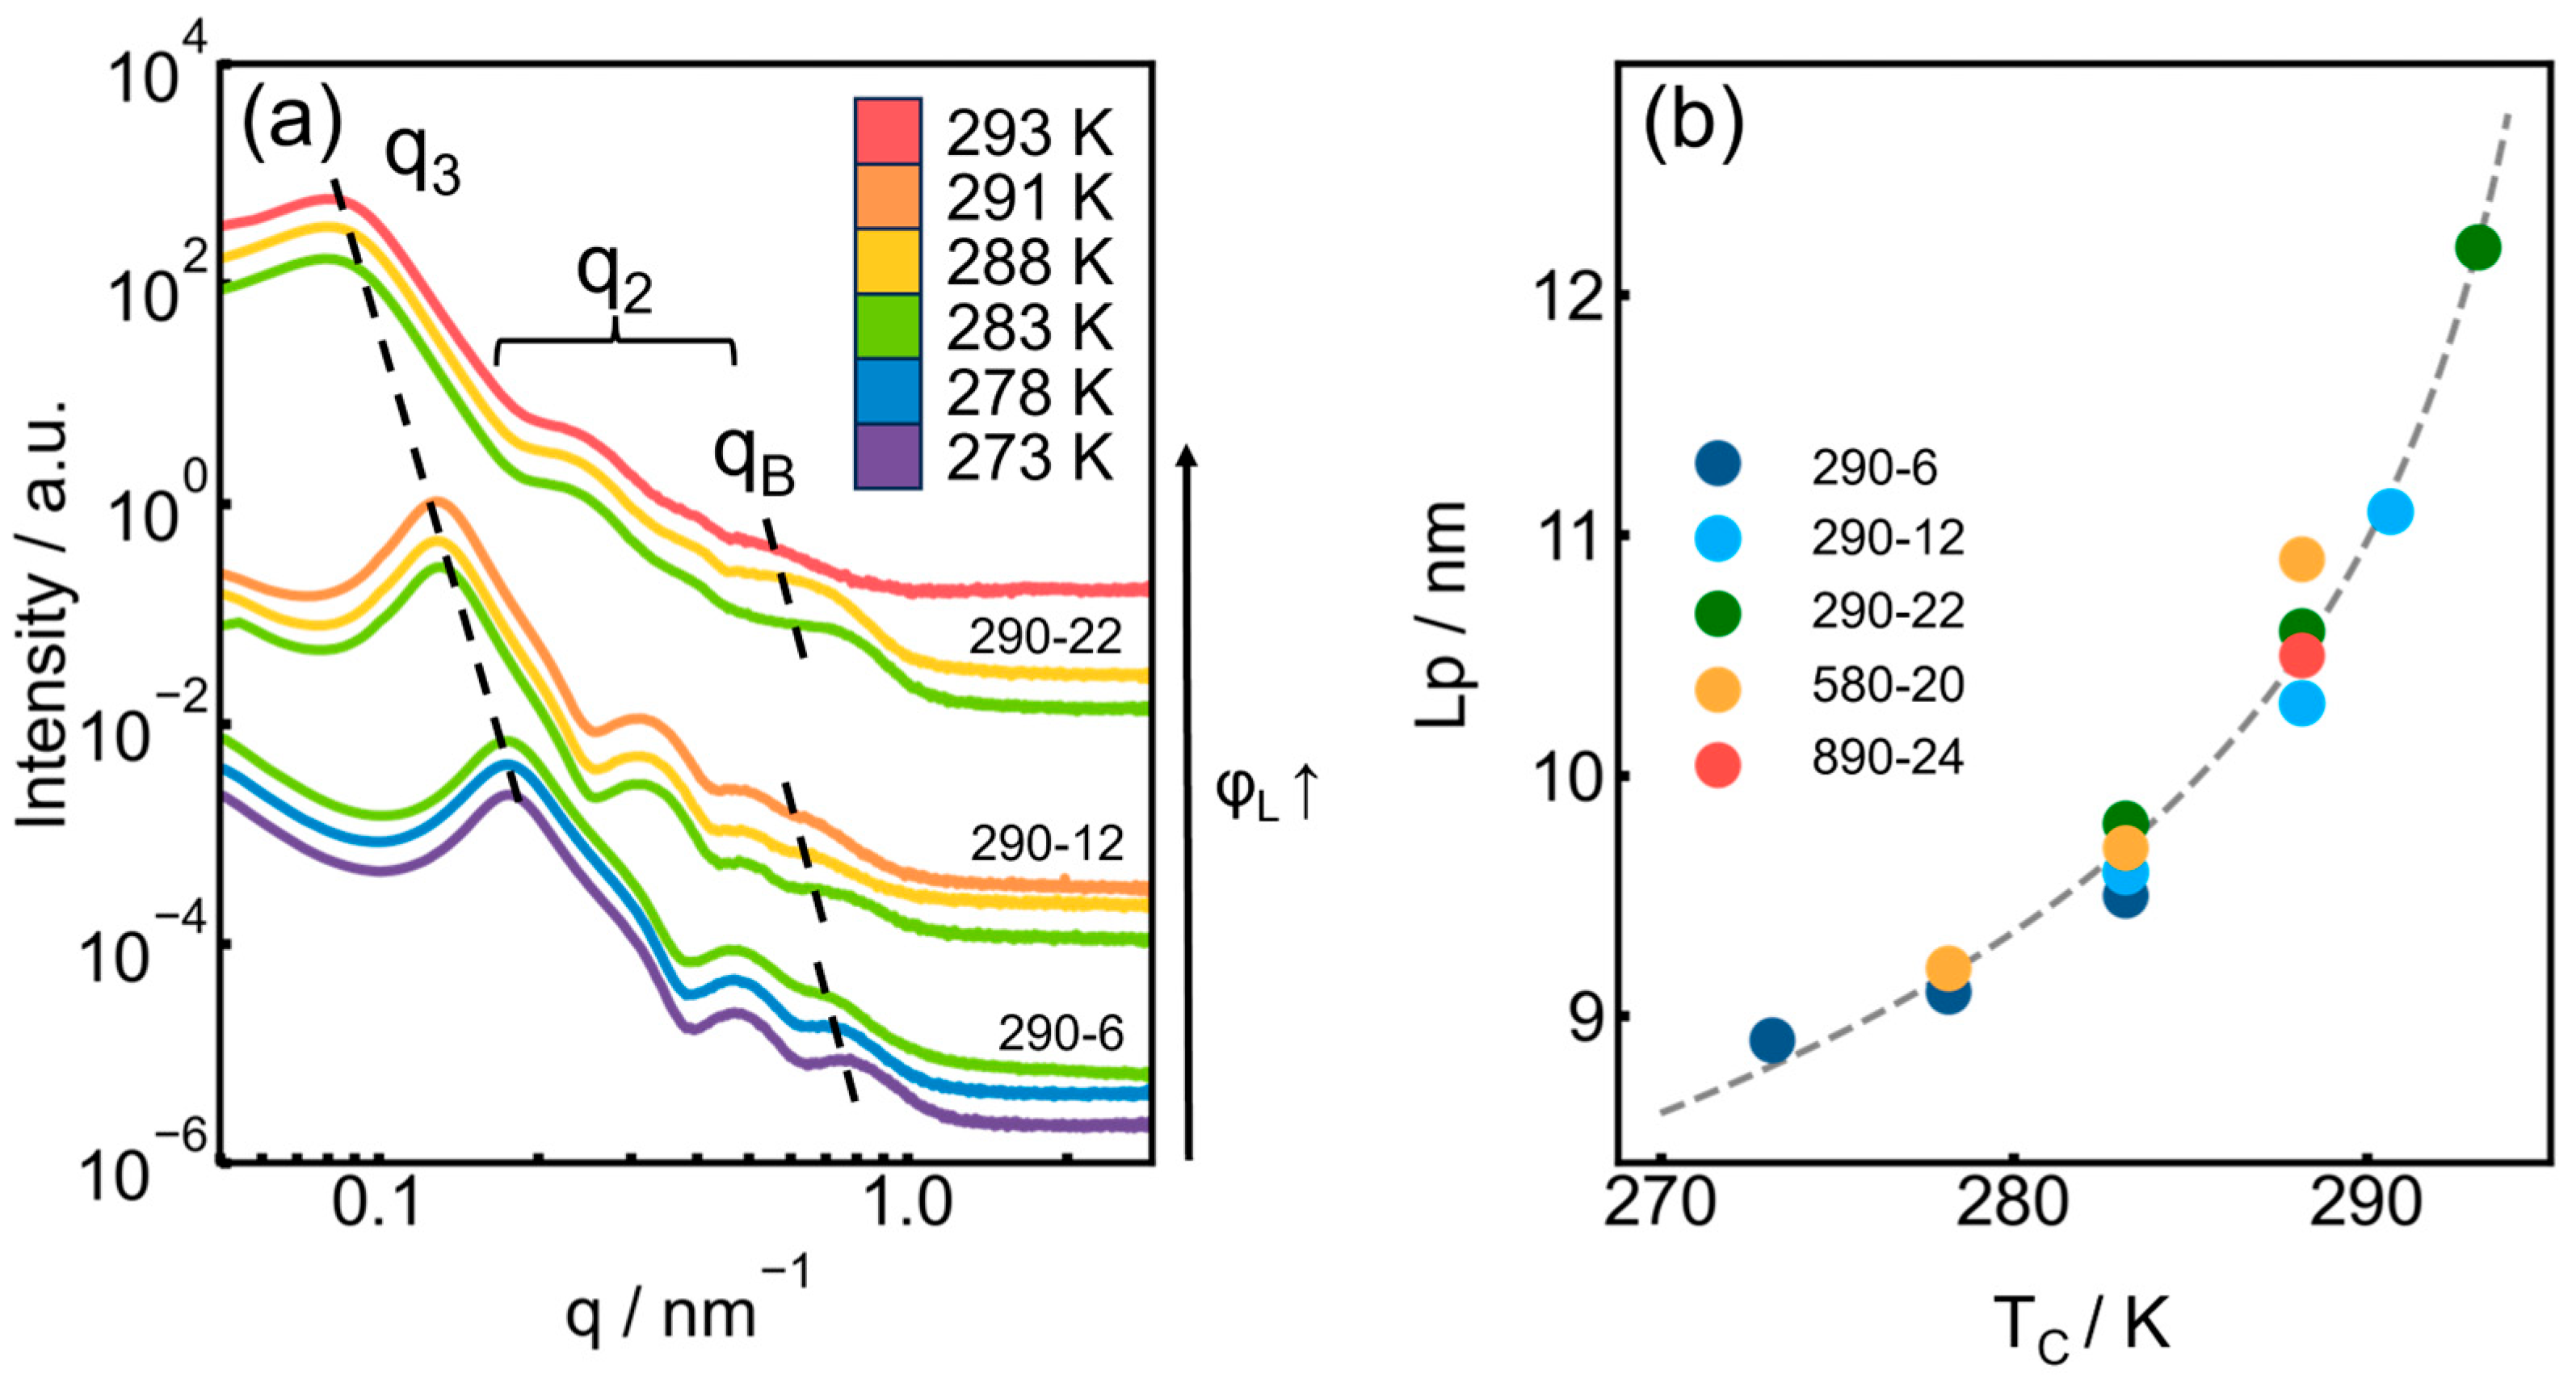
It is instructive to evaluate the effect of the block-copolymer morphology on the microstructure of the resulting semicrystalline material. Figure 4a shows the SAXS profiles recorded at the end of the in-situ isothermal crystallization experiments, while Figure 4b summarizes the dependence of the long period (Lp) on the crystallization temperature (Tc). As expected for semicrystalline polymers, Lp generally increases with increasing Tc. In contrast, neither the length of the bottlebrush block nor that of the PNIPAM blocks has any detectable effect on Lp.
Figure 4.
(a) Evolution of the SAXS profiles with crystallization temperature for samples with a bottlebrush-block length of nBB = 290. (b) Dependence of the PEG long period, Lp, on the crystallization temperature.
3.3. Monitoring Crystallization Through the Bottlebrush Peak as a Marker of the Bulk Amorphous Phase
The microstructure of the as-synthesized material was characterized by SAXS (cf. Figure S1) using sample 290-6 as a representative example. The 2D SAXS pattern shown in Figure S1a exhibits an oriented Bragg peak at qB, indicating the presence of large oriented crystalline domains (i.e., spherulites) whose size exceeds the X-ray beam diameter (~300 μm). In contrast, the interference peak at q3 displays an isotropic intensity distribution, demonstrating that the phase-separated structure with dispersed PNIPAM phase does not form detectable macroscopic monodomains. Upon heating to the melt (Figure S1b), the Bragg peak vanishes, whereas the isotropic scattering associated with the q3 peak persists. After subsequent cooling to 0 °C (Figure S1c), the crystalline Bragg peak reappears but becomes isotropically distributed, indicating that the initial configuration of the crystalline domains is not recovered. To gain further insight into the crystallization mechanism, a more detailed analysis of the in-situ crystallization experiments was performed.
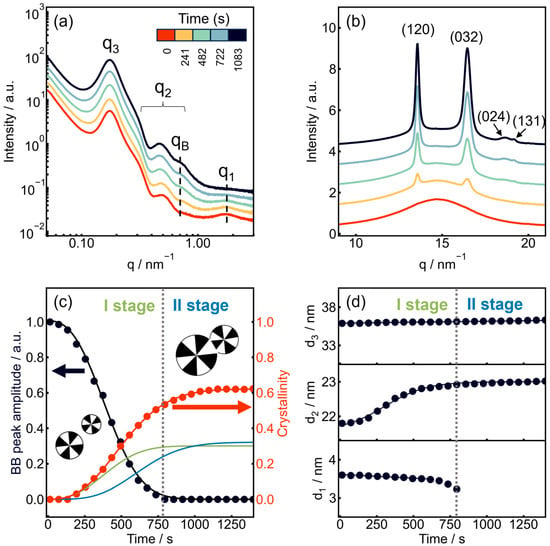
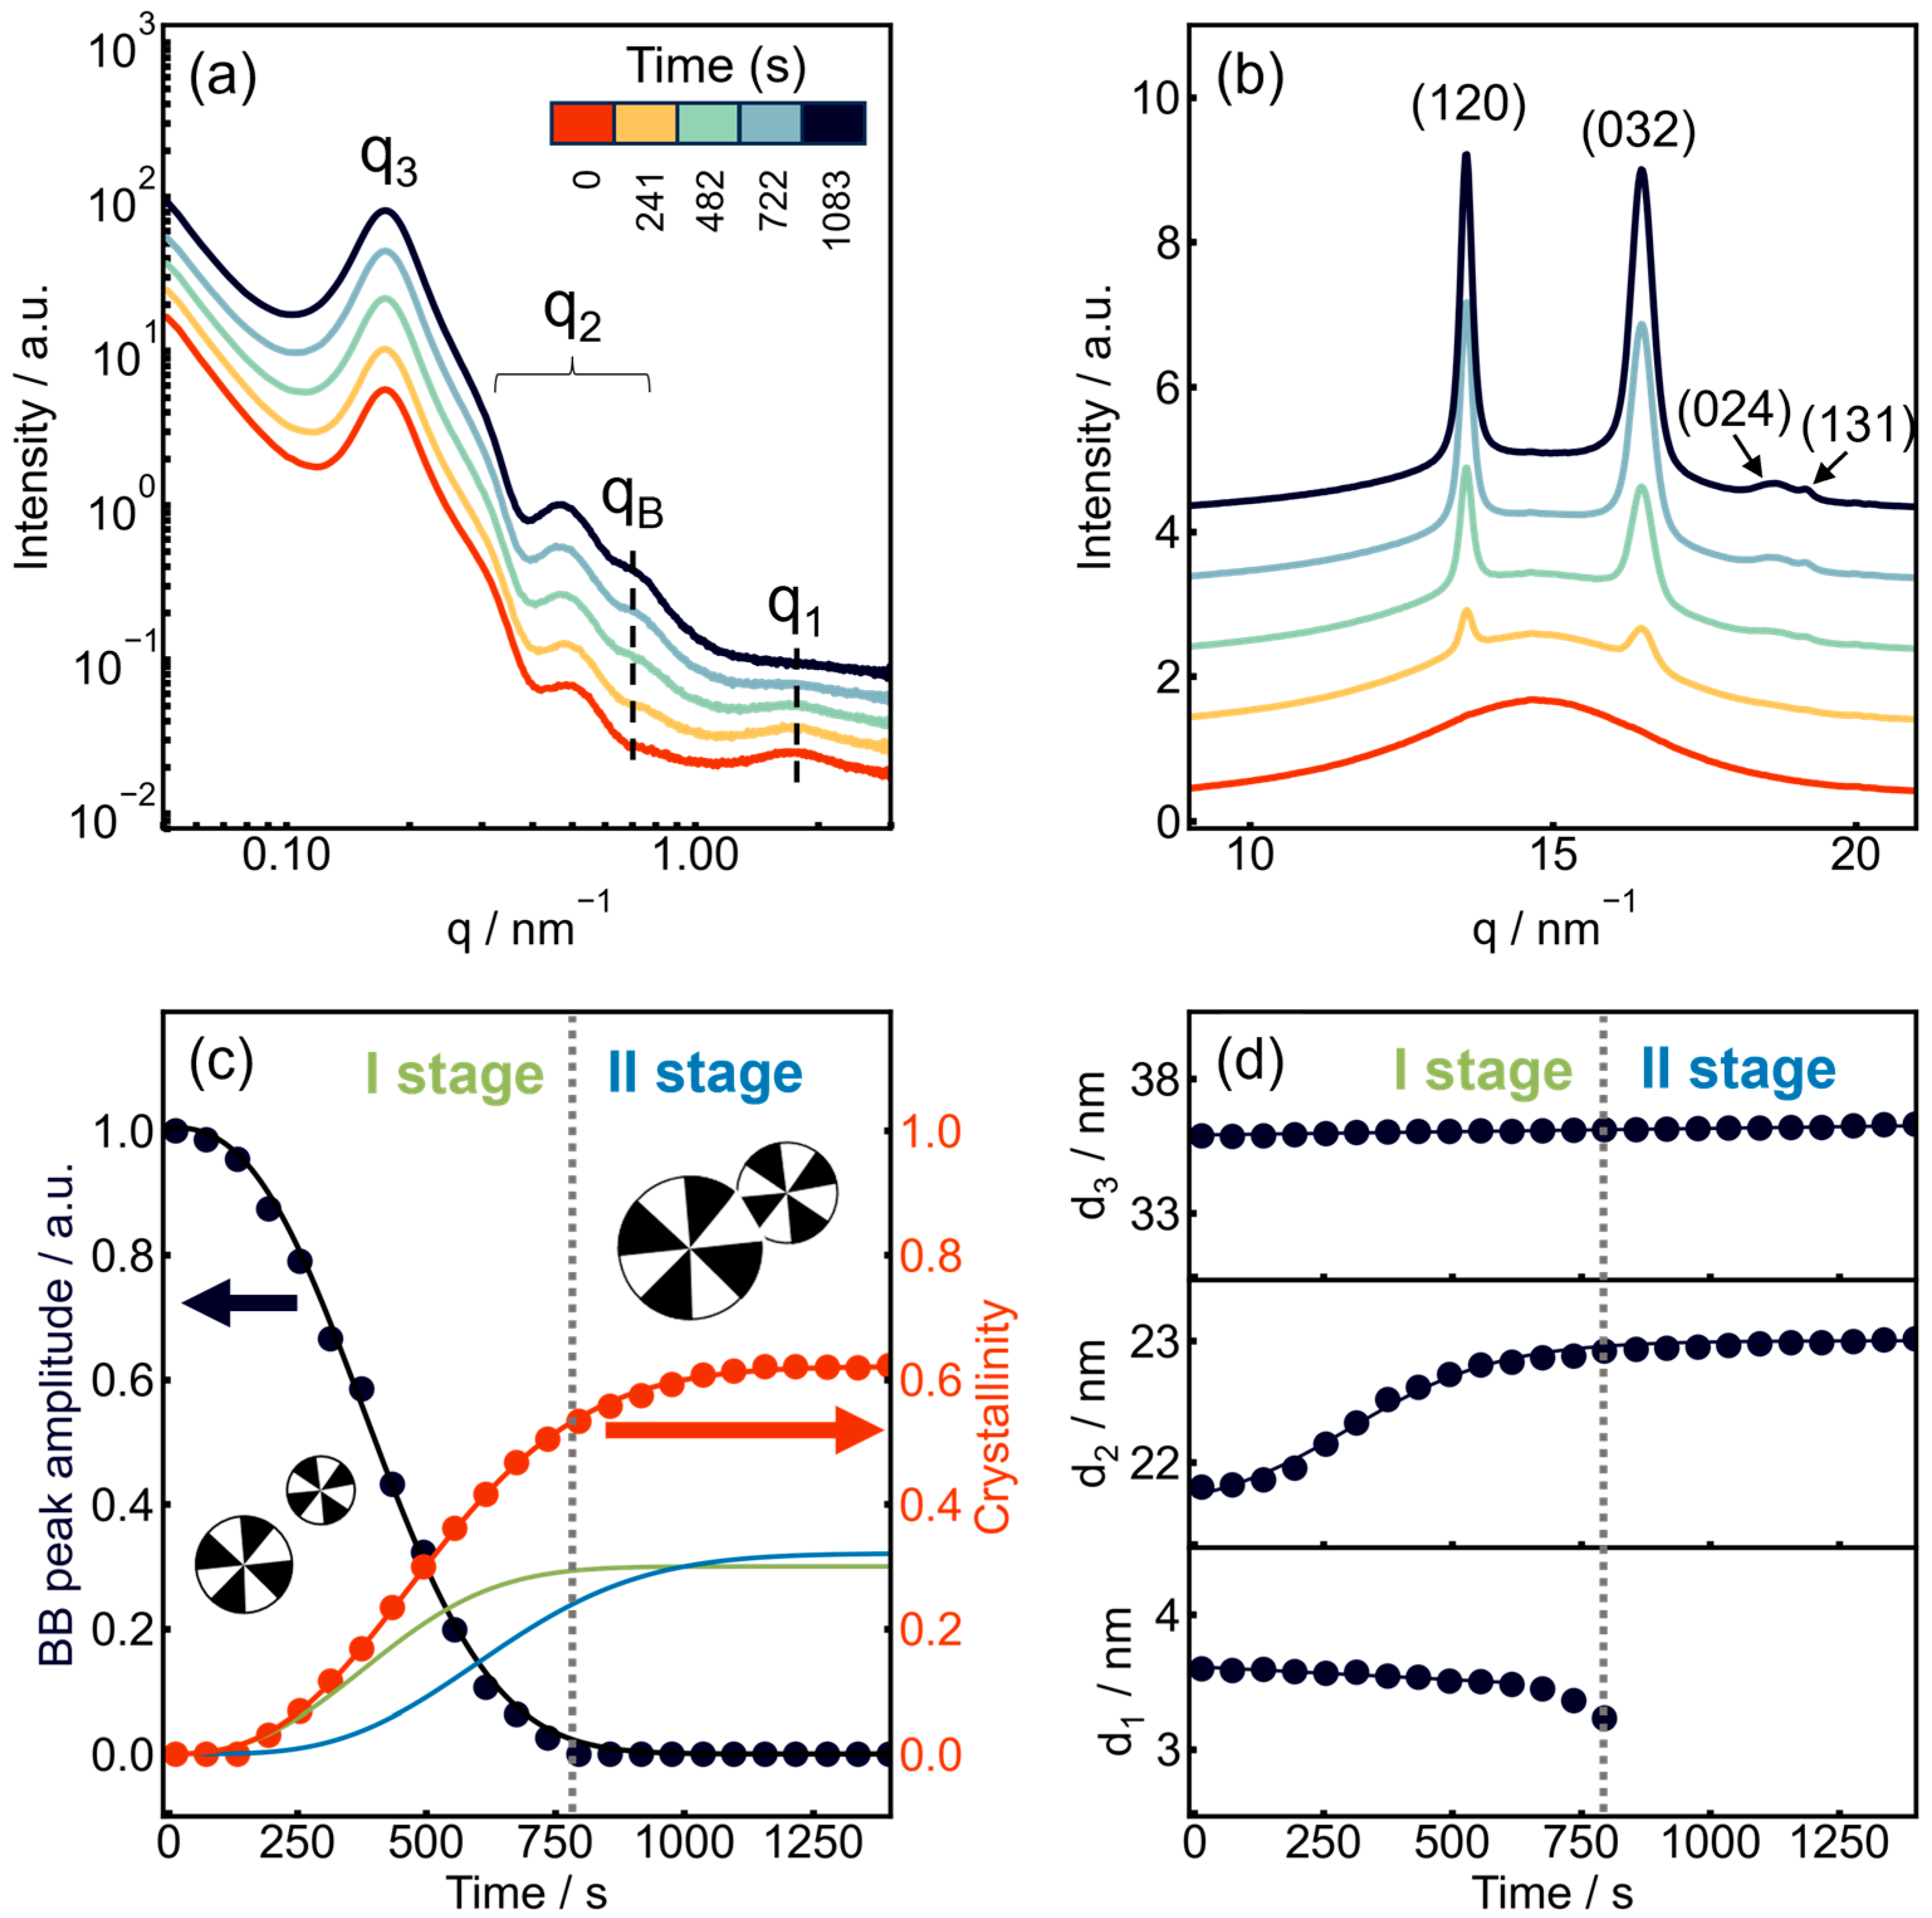
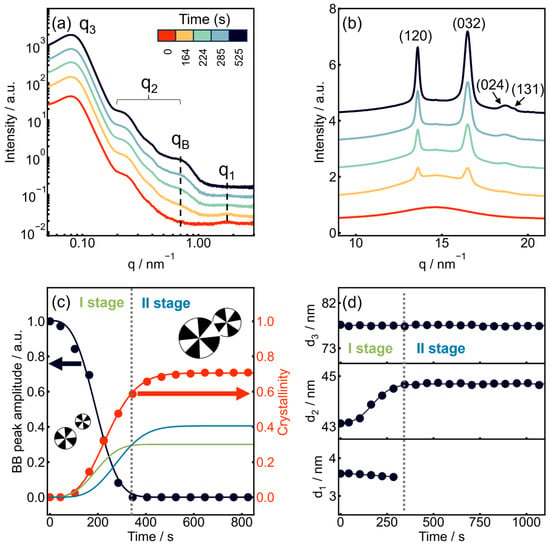
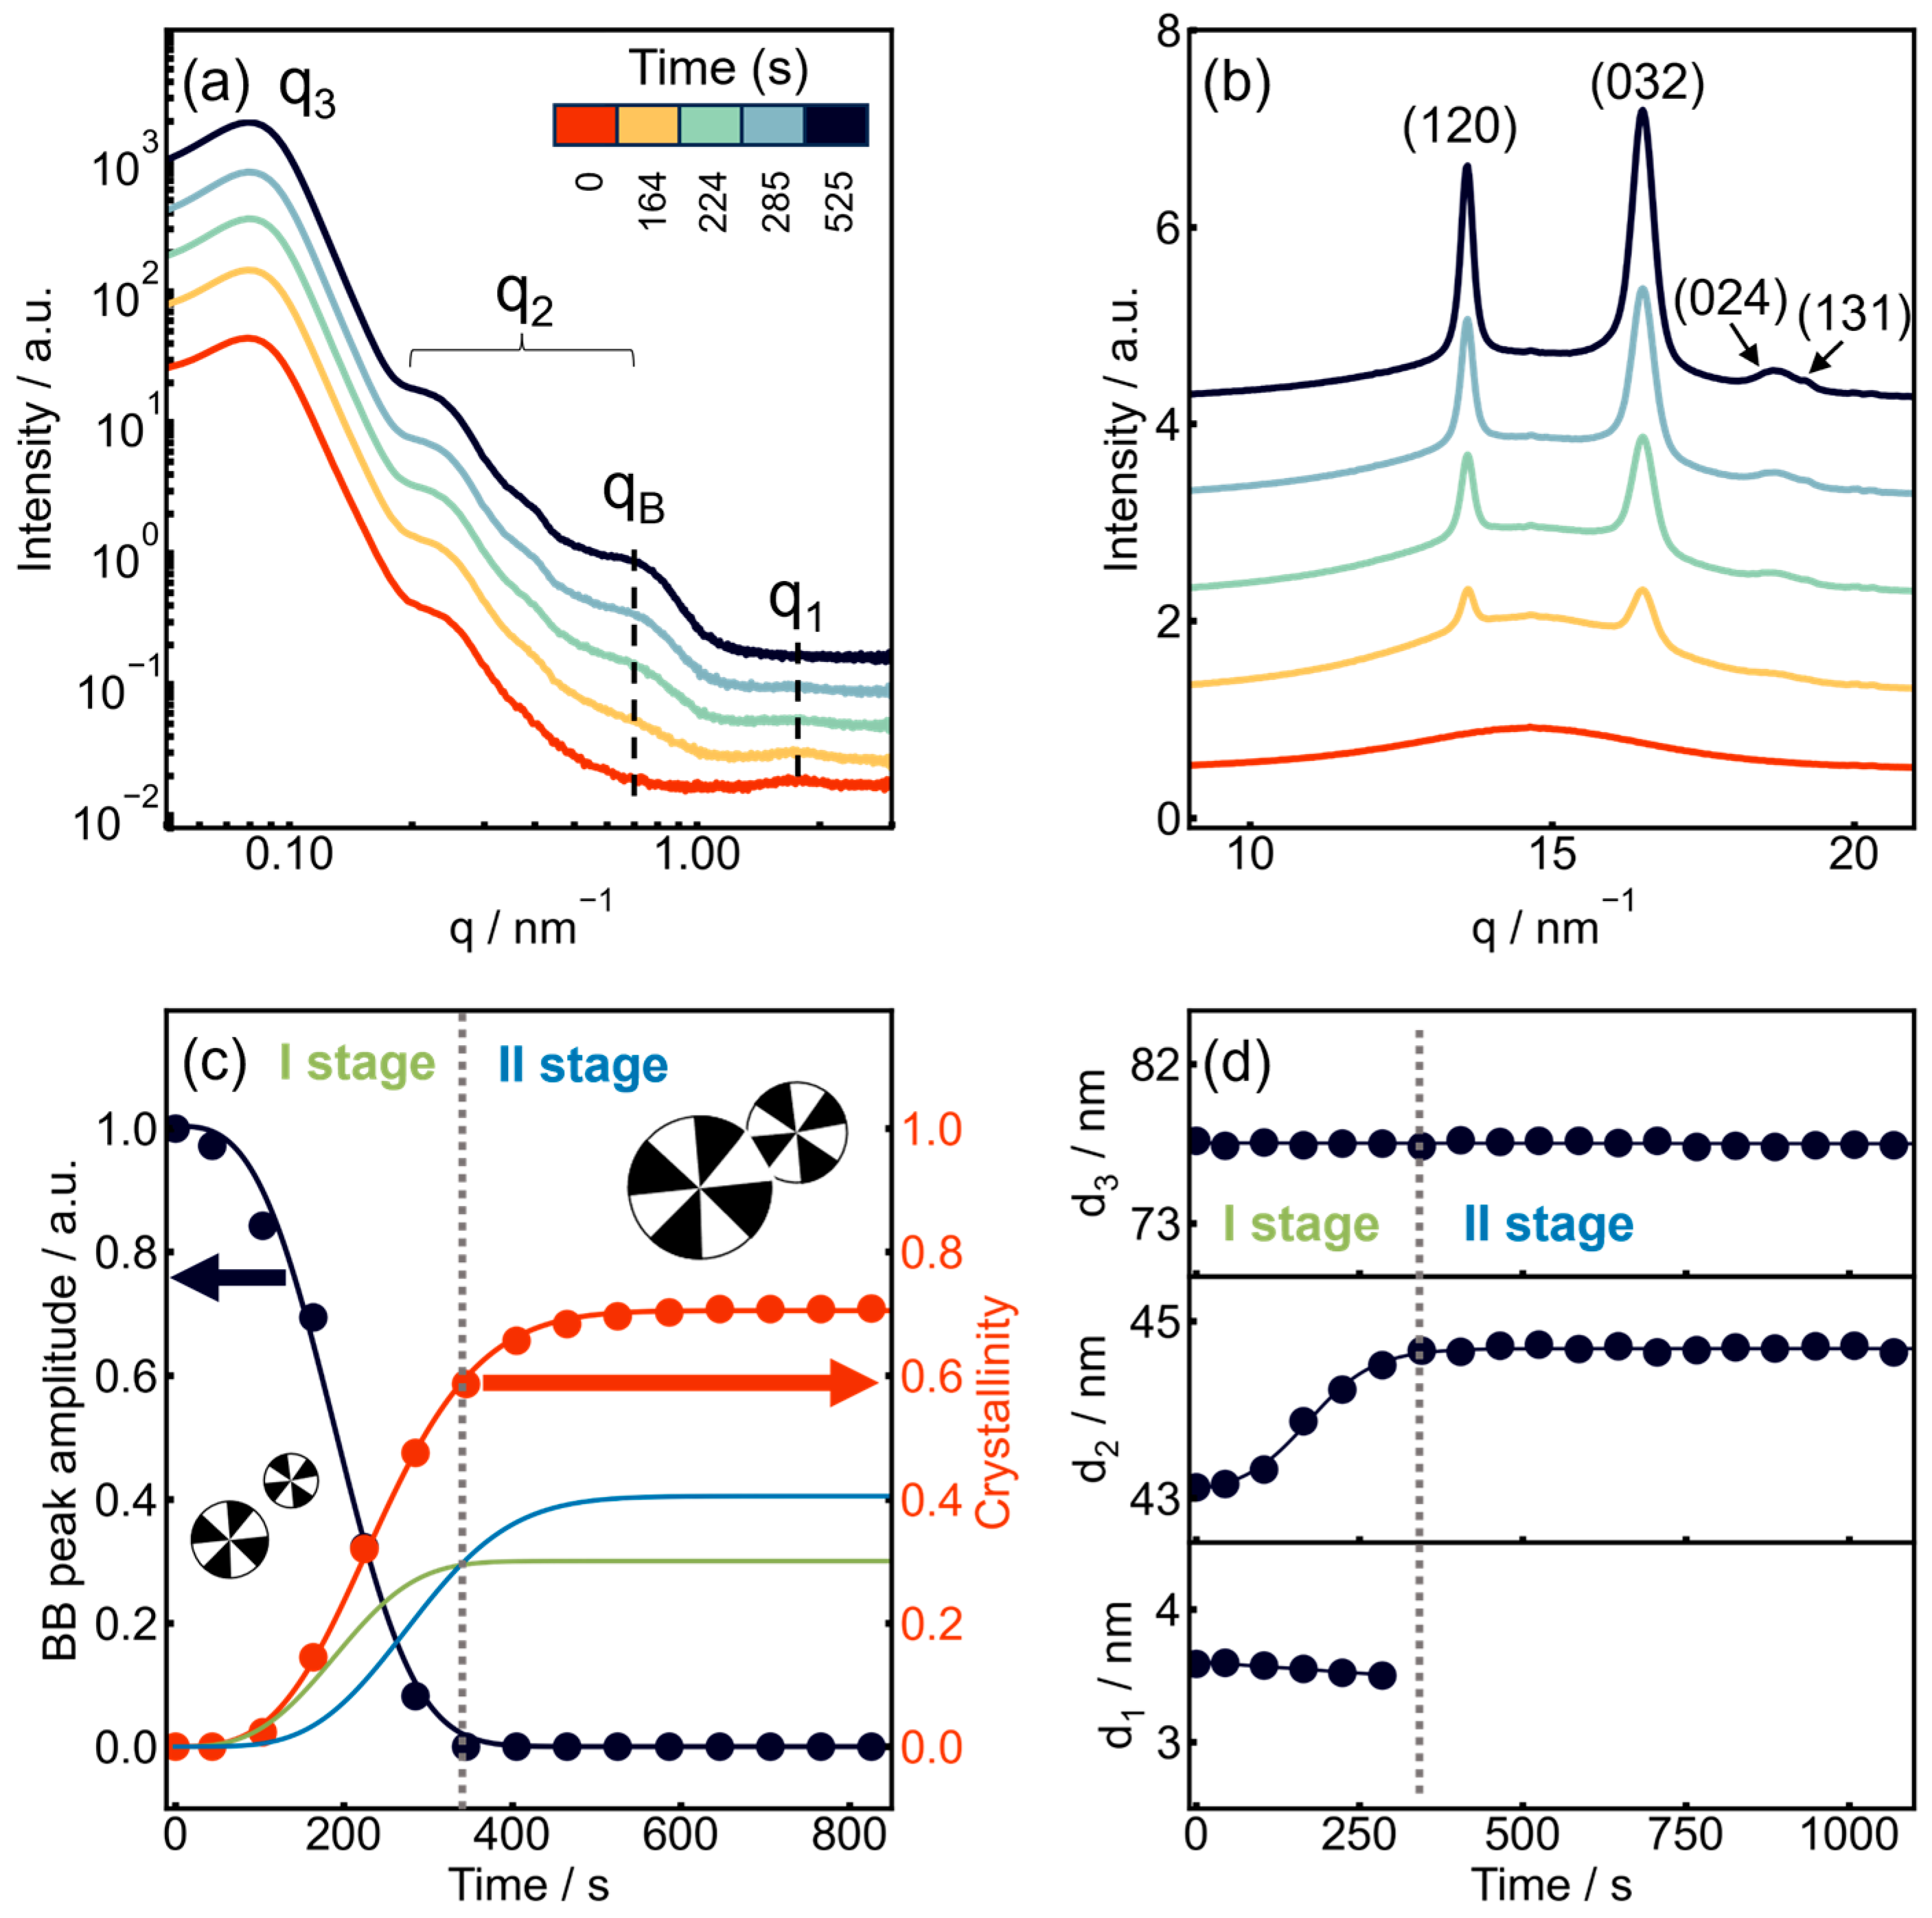
Figure 5 presents the time-resolved isothermal crystallization of sample 290-6 at 10 °C. The progression of crystallization is evidenced by the gradual development of the lamellar Bragg peak in the SAXS profiles (Figure 5a), accompanied by the appearance and growth of the characteristic reflections of PEG crystals in the WAXS region (Figure 5b).
Figure 5.
Time-resolved crystallization experiment on sample 290-6 at 10 °C. (a) One-dimensional SAXS profiles recorded during crystallization, with the characteristic scattering features indicated. (b) Corresponding one-dimensional WAXS profiles. (c) Evolution of the bottlebrush peak intensity (black circles) and the degree of crystallinity determined from WAXS (red circles). The contributions associated with the first and second crystallization stages are shown by the green and blue curves, respectively. (d) Evolution of the bottlebrush correlation distance (d1), the characteristic size of PNIPAM domains (d2) determined by fitting using the form-factor oscillations with a model of polydisperse spheres, and the interdomain spacing (d3).
The crystallization kinetics can be analyzed not only conventionally, by following the development of the crystalline phase, but also by monitoring the evolution of the amorphous phase. The bottlebrush correlation peak serves as a unique structural marker of the amount of bulk amorphous material remaining during crystallization, which can be quantified from the peak amplitude as discussed above. No analogous marker is available in conventional linear polymers, making it more difficult to distinguish and analyze the successive stages of crystallization.
The evolution of WAXS-derived crystallinity was analyzed together with the decay of the BB correlation peak. The latter was used as a marker of the loss of the initial melt-like backbone organization and to constrain the first-stage contribution to crystallinity.
The time dependence of the BB peak amplitude can be described by an Avrami-type expression:
where ABB(t) is the BB peak amplitude at time t, ABB(t0) is its amplitude at the reference time t0, and K1 and n1 are the kinetic constant and Avrami exponent, respectively. The parameter t0 represents the effective onset time of the first-stage transformation in the model.
Assuming that the relative loss of BB peak amplitude follows the transformation of the initial matrix, the contribution of the first stage to the overall crystallinity can be expressed as:
where αcryst,I(t) is the first-stage contribution at time t, and αcryst,I(∞) is its limiting value. The normalized fraction of the initial matrix transformed during the first stage is thus:
When the crystallization front reaches a given volume element at time θ, the second crystallization stage is assumed to begin locally. At the observation time t, t − θ is the time elapsed since the front reached this volume element. Let gII(t − θ) denote the normalized local response of the second stage.
Assuming that all transformed volume elements exhibit the same normalized local response and limiting crystallinity increment, the contribution of the second stage to the overall crystallinity is obtained by integrating the local responses over the elements transformed between t0 and t:
where αcryst,II(∞) is the limiting contribution of the second stage to the overall crystallinity, and is the fraction of the initial matrix transformed between θ and θ + dθ.
The normalized local response is taken to follow Avrami-type kinetics:
where K2 and n2 are the local kinetic constant and Avrami exponent, respectively. Substituting Equation (13) and the definition of FI into Equation (12) gives:
The overall crystallinity is then given by the sum of the two contributions:
With this normalization, the two contributions approach αcryst,I(∞) and αcryst,II(∞), respectively, as t approaches infinity.
The results of fitting the bottlebrush peak amplitude using Equation (10) are shown by the black curve in Figure 5c. The kinetic parameters obtained from this fit were subsequently used to fit the crystallinity evolution according to Equation (15), and the resulting fit is shown by the red curve. The contributions of the first and second crystallization stages, described by Equations (11) and (14), are represented by the green and blue curves, respectively. Although the two crystallization stages overlap in time, the transition between stage I and stage II can be identified at a dwelling time of approximately 750 s.
The Avrami exponents and the contributions to crystallinity obtained for the first and second stages are n1 = 2.5 (αcryst_I(∞) = 0.30) and n2 = 1.5 (αcryst_II(∞) = 0.32), respectively. The exponent for the first stage is consistent with predominantly three-dimensional spherulitic growth, although it is somewhat lower than the ideal value of 3 expected for instantaneous (athermal) nucleation and three-dimensional growth. In practice, however, Avrami exponents are frequently noninteger, typically ranging between 2 and 3 [37]. Such deviations have been attributed to several factors, including departures of immature spherulites from a perfectly spherical growth geometry. The lower Avrami exponent observed for the second stage is consistent with a different effective kinetic response during crystallization within the developing semicrystalline morphology, where growth may be spatially constrained. Notably, the two stages contribute approximately equally to the final crystallinity, demonstrating that the second stage accounts for a substantial fraction of the overall crystallization process and therefore cannot be neglected.
The possibility of simultaneously monitoring the evolution of both the crystalline and amorphous phases during crystallization enables a more precise discrimination between the successive stages of the crystallization process than is possible from the crystalline phase alone. This complementary structural information is specific to molecular architectures that exhibit a characteristic bottlebrush correlation peak in the SAXS pattern, whose intensity directly reflects the amount of the bulk amorphous phase. It is worth noting that a similar distinction between successive stages of crystallization was previously achieved for semirigid polymers, such as poly(ether ether ketone) and poly(ethylene terephthalate), by monitoring the evolution of the α-relaxation associated with the bulk amorphous phase using dynamic mechanical analysis. In that case, the approach was enabled by the pronounced difference between the glass-transition temperatures of the initial bulk amorphous phase and the interlamellar amorphous regions formed during crystallization, which allowed their respective contributions to be clearly distinguished [22,38]. In the present system, an analogous distinction is instead achieved directly by SAXS by monitoring the evolution of the bottlebrush correlation peak.
The evolution of the microstructural parameters d1, d2, and d3 was analyzed by modeling the SAXS data using Equations (1) and (2) together with the Percus–Yevick hard-sphere structure factor. An example of the corresponding model fit is shown in Figure S2. The average distance between the PNIPAM domains, d3, remains essentially constant throughout the crystallization process (Figure 5d). The characteristic size of the PNIPAM domains, d2, increases by approximately 5% during the first stage of crystallization and remains essentially constant thereafter. Since a significant increase in the volume of the phase-separated PNIPAM domains appears unlikely, this apparent change is more plausibly attributed to structural rearrangements occurring in the surrounding bottlebrush matrix. In particular, the apparent increase in d2 may result from the formation of thin amorphous interfacial layers adjacent to the PNIPAM domains that are excluded from crystallization. In contrast, the bottlebrush correlation distance, d1, decreases slightly before disappearing completely. This behavior is reminiscent of that previously observed during the crystallization of bottlebrush polymers bearing poly(ε-caprolactone) side chains, where the decrease in d1 was attributed to the progressive incorporation of the side chains into the crystalline phase [4].
The kinetics of isothermal crystallization of sample 290-22, containing longer PNIPAM blocks than sample 290-6, are shown in Figure 6. As a result of the longer PNIPAM blocks, the size of the PNIPAM-rich domains increases by approximately a factor of two. Accordingly, the SAXS profiles (Figure 6a) exhibit the same characteristic features as those described above, but the form-factor oscillations are shifted toward lower q-values. The interference peak, q3, is likewise shifted to lower q-values, reflecting the increased average spacing between the PNIPAM-rich domains. Consequently, the PEG lamellar Bragg peak, whose position remains essentially unchanged during crystallization, is now well separated from the form-factor oscillations.
Figure 6.
Crystallization experiment of sample 290-22 at 10 °C. (a) Time-resolved 1D SAXS profiles collected during crystallization; (b) corresponding time-resolved 1D WAXS profiles; (c) evolution of the bottlebrush peak amplitude and the degree of crystallinity determined from the WAXS data. (d) Evolution of the structural parameters extracted from SAXS data: the bottlebrush correlation distance d1, the PNIPAM domain diameter d2 (determined using the cylinder form factor), and the mean interdomain distance d3.
The crystallization stages were analyzed using the same methodology as described above. The first stage, identified from the disappearance kinetics of the bottlebrush correlation peak, is completed after approximately 400 s. Its kinetics is well described by an Avrami exponent of n1 = 3.0, whereas the second stage is characterized by a substantially lower exponent of n2 = 1.6. The respective contributions to the final crystallinity, αcryst_I(∞) = 0.30 and αcryst_II(∞) = 0.41, further demonstrate the importance of crystallization occurring within the spherulite interiors after passage of the crystallization front. The microstructural parameters evolve in the same manner as in the previous case. In particular, d2, which, in this case, is extracted from fits to the cylindrical form factor (cf. Figure S4) increases by approximately 2 nm during the first crystallization stage, corresponding to about 5%.
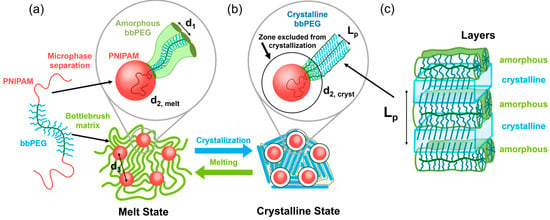
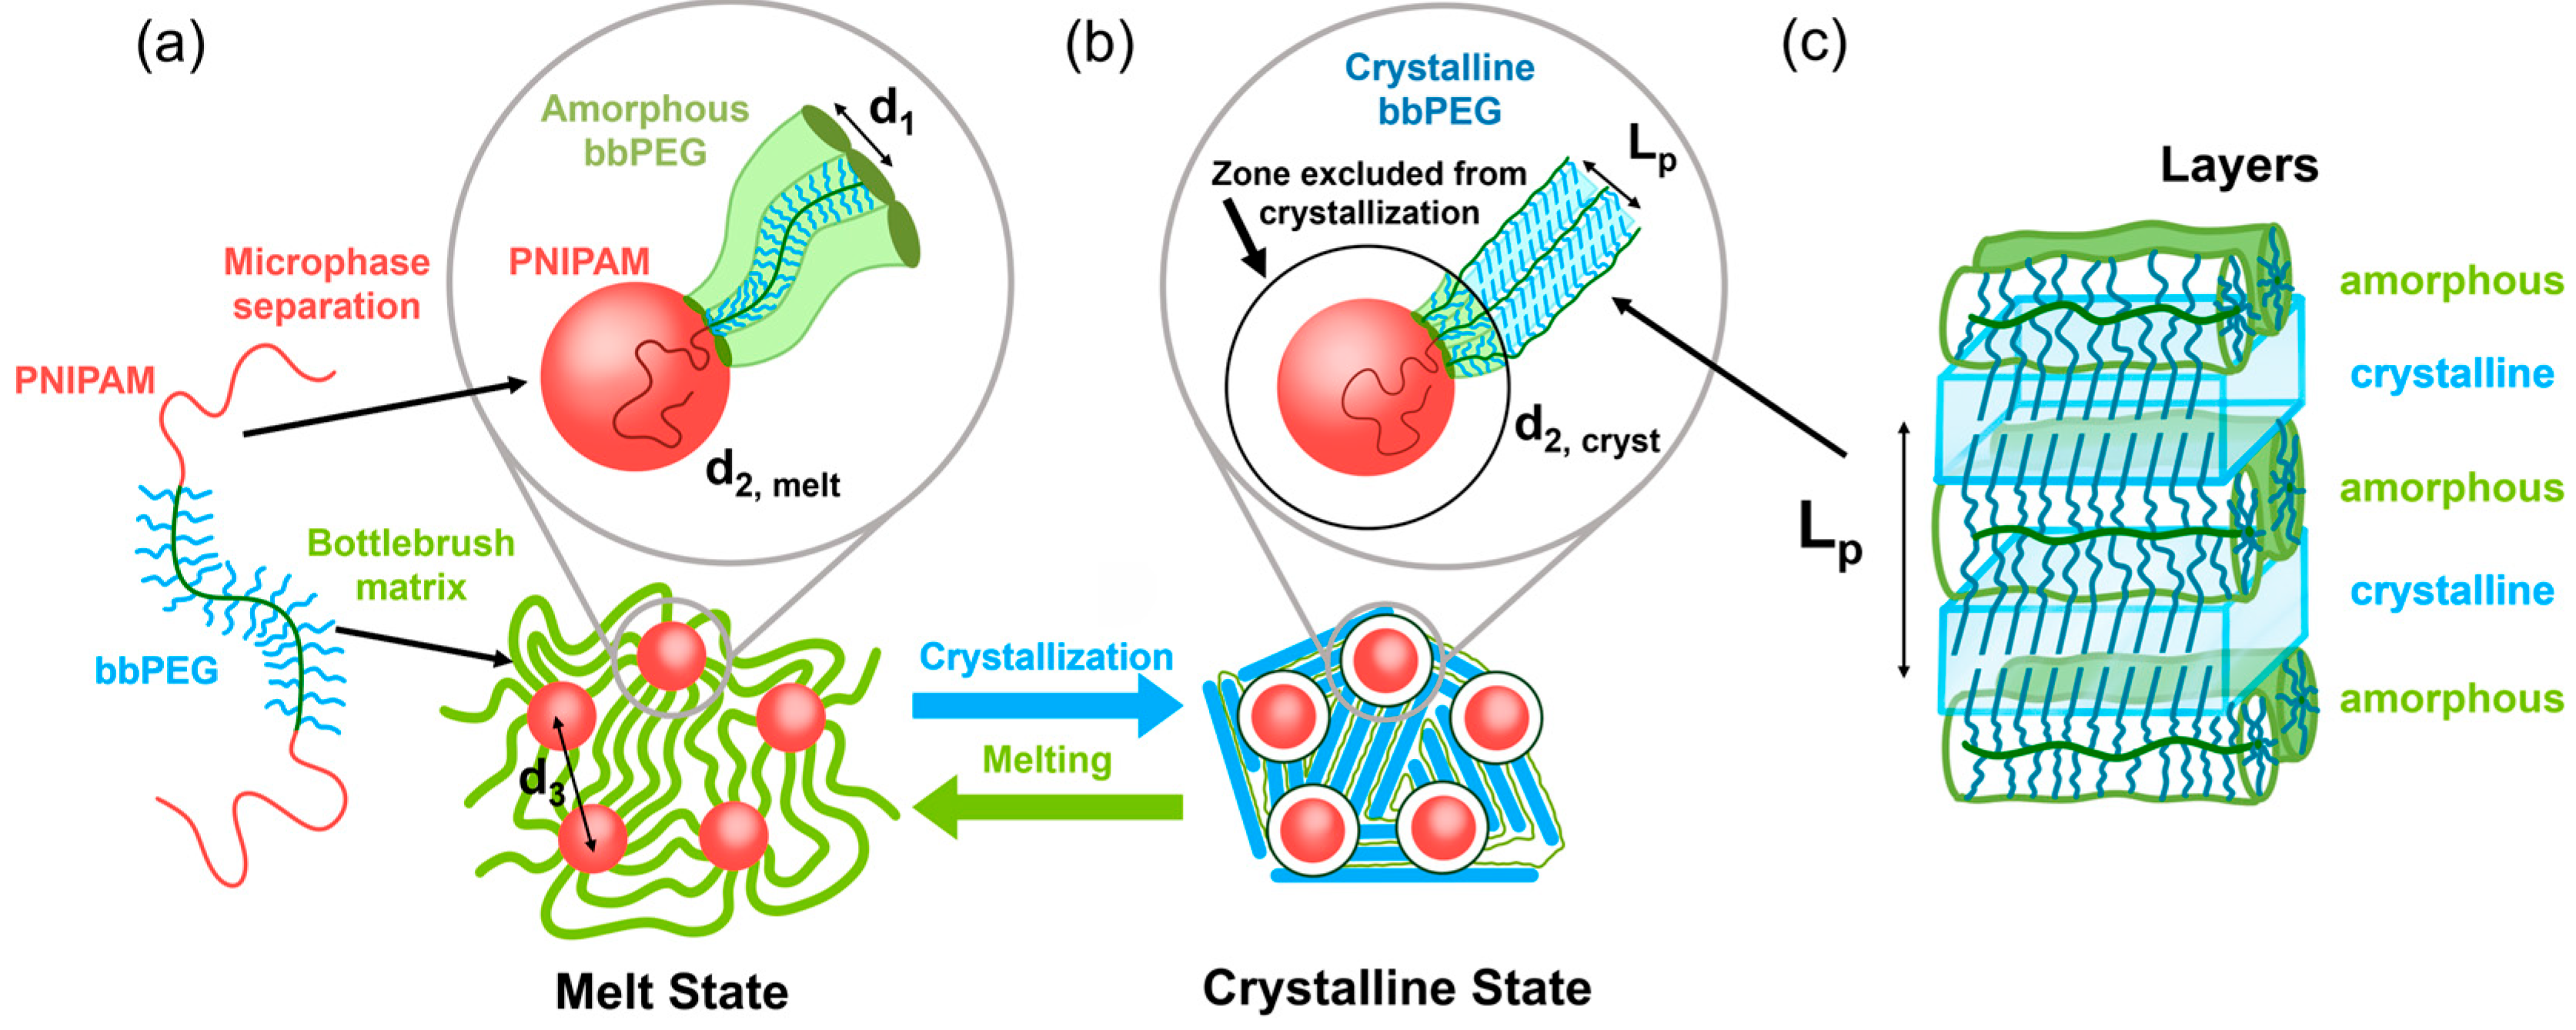
The local-scale morphological changes occurring during crystallization are schematically depicted in Figure 7. Crystallization proceeds through the growth of stacks of PEG crystalline lamellae formed by the bottlebrush side chains. As crystallization progresses, the bottlebrush backbones become confined between the crystalline lamellae, similarly to the morphology previously reported for PEG-based bottlebrush elastomers [5].
Figure 7.
Schematic illustration of the crystallization process. The diagram shows the transition from (a) the melt state, comprising amorphous bottlebrush blocks (green) and domains formed by the linear blocks (red), to (b) the semicrystalline state, in which the bottlebrush side chains form crystalline lamellae (blue). The black outlines surrounding the domains indicate interfacial regions in which crystallization is suppressed. (c) Schematic illustration of alternating crystalline lamellae and amorphous regions, with bottlebrush backbones confined between the lamellae.
To better understand the resulting semicrystalline morphology, it is important to consider the crystal structure of PEG. PEG chains crystallize in a 7/2 helical conformation with a fiber repeat of 1.948 nm [31]. Consequently, even a fully crystalline PEG side chain can produce a crystal no thicker than approximately 5.3 nm. In contrast, the crystalline lamellar thickness estimated from the SAXS data, Lc ~ Lpαcryst can be substantially larger. Here, the contribution of the bottlebrush backbone to the total volume is neglected because its volume fraction is only on the order of . The estimated crystal thickness therefore exceeds that expected even for fully extended side chains. Therefore, one plausible alternative would be the formation of the so-called “half-stemmed” crystal [33], in which the stem length corresponds to approximately one half of the bilayer crystal thickness and the chain ends are incorporated into the crystalline phase [5]. Further support for this hypothesis comes from previously reported crystal structures in which PEO chains containing a central 1,2,3-triazole defect (PEO11-TR-PEO11) are incorporated into bilayer crystals [32]. This example demonstrates that defects located within a PEO chain do not necessarily prevent crystallization but may instead be accommodated within a bilayer crystal structure.
The defective nature of the formed crystals is further supported by the absence of a group of relatively weak reflections around q = 10 nm−1, assigned to the overlapping reflections. Notably, these reflections were clearly visible for crystals formed by PEG bottlebrushes with longer side chains (nSC = 40), for which a single-layer crystal structure, rather than the half-stemmed bilayer structure proposed here, was previously inferred [5]. The recurring difference is consistent with an influence of side-chain length on crystalline packing and may reflect a higher degree of structural disorder in crystals formed from shorter side chains. However, the visibility of these weak reflections may also be affected by peak broadening, preferred orientation preferred orientation or the limited signal-to-noise ratio.
The schematic in Figure 7 also highlights the structural arrangement of the bottlebrush blocks at the PNIPAM interface. The bottlebrush segments are more strongly confined at the interface than in the bulk phase. This conclusion is supported by the geometric analysis summarized in Table 1, which shows that the interfacial area per bottlebrush is consistently smaller than that in the bulk melt for both spherical and cylindrical PNIPAM domains, with Sinterf, sphere = 3.9–8.6 nm2 and Sinterf, cylinder = 5.4–11.3 nm2, compared with Sbulk = 15 nm2. The only exception is sample 890-24 when analyzed assuming spherical geometry. This deviation may reflect the limited applicability of the spherical approximation to a sample whose morphology is expected to lie near the sphere-to-cylinder transition.
The strong interfacial confinement is likely to hinder crystallization in the vicinity of the PNIPAM interface. All the studied samples exhibit corresponding changes in the apparent size and polydispersity of the PNIPAM domains. Figure S3 illustrates this behavior for sample 290-12 crystallized at 10 °C. As crystallization progresses, the form-factor oscillations shift slightly toward lower q and become more pronounced, resulting in a lower fitted domain-size polydispersity.
3.4. Correlation Between Microstructure and Mechanical Properties
The PNIPAM domain diameter, d2, and mean interdomain distance, d3, depend on both the bottlebrush backbone length and the length of the terminal PNIPAM blocks (Figure 2b and Table 1). For the two samples with the same bottlebrush backbone length of 580 repeat units, the characteristic surface-to-surface separation, d3 − d2, increases from 22.8 nm for 580-7 to 61.0 nm for 580-20. This increase suggests greater initial extension of the bottlebrush strands bridging neighboring domains.
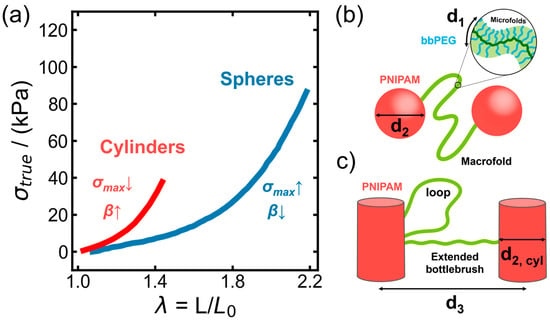
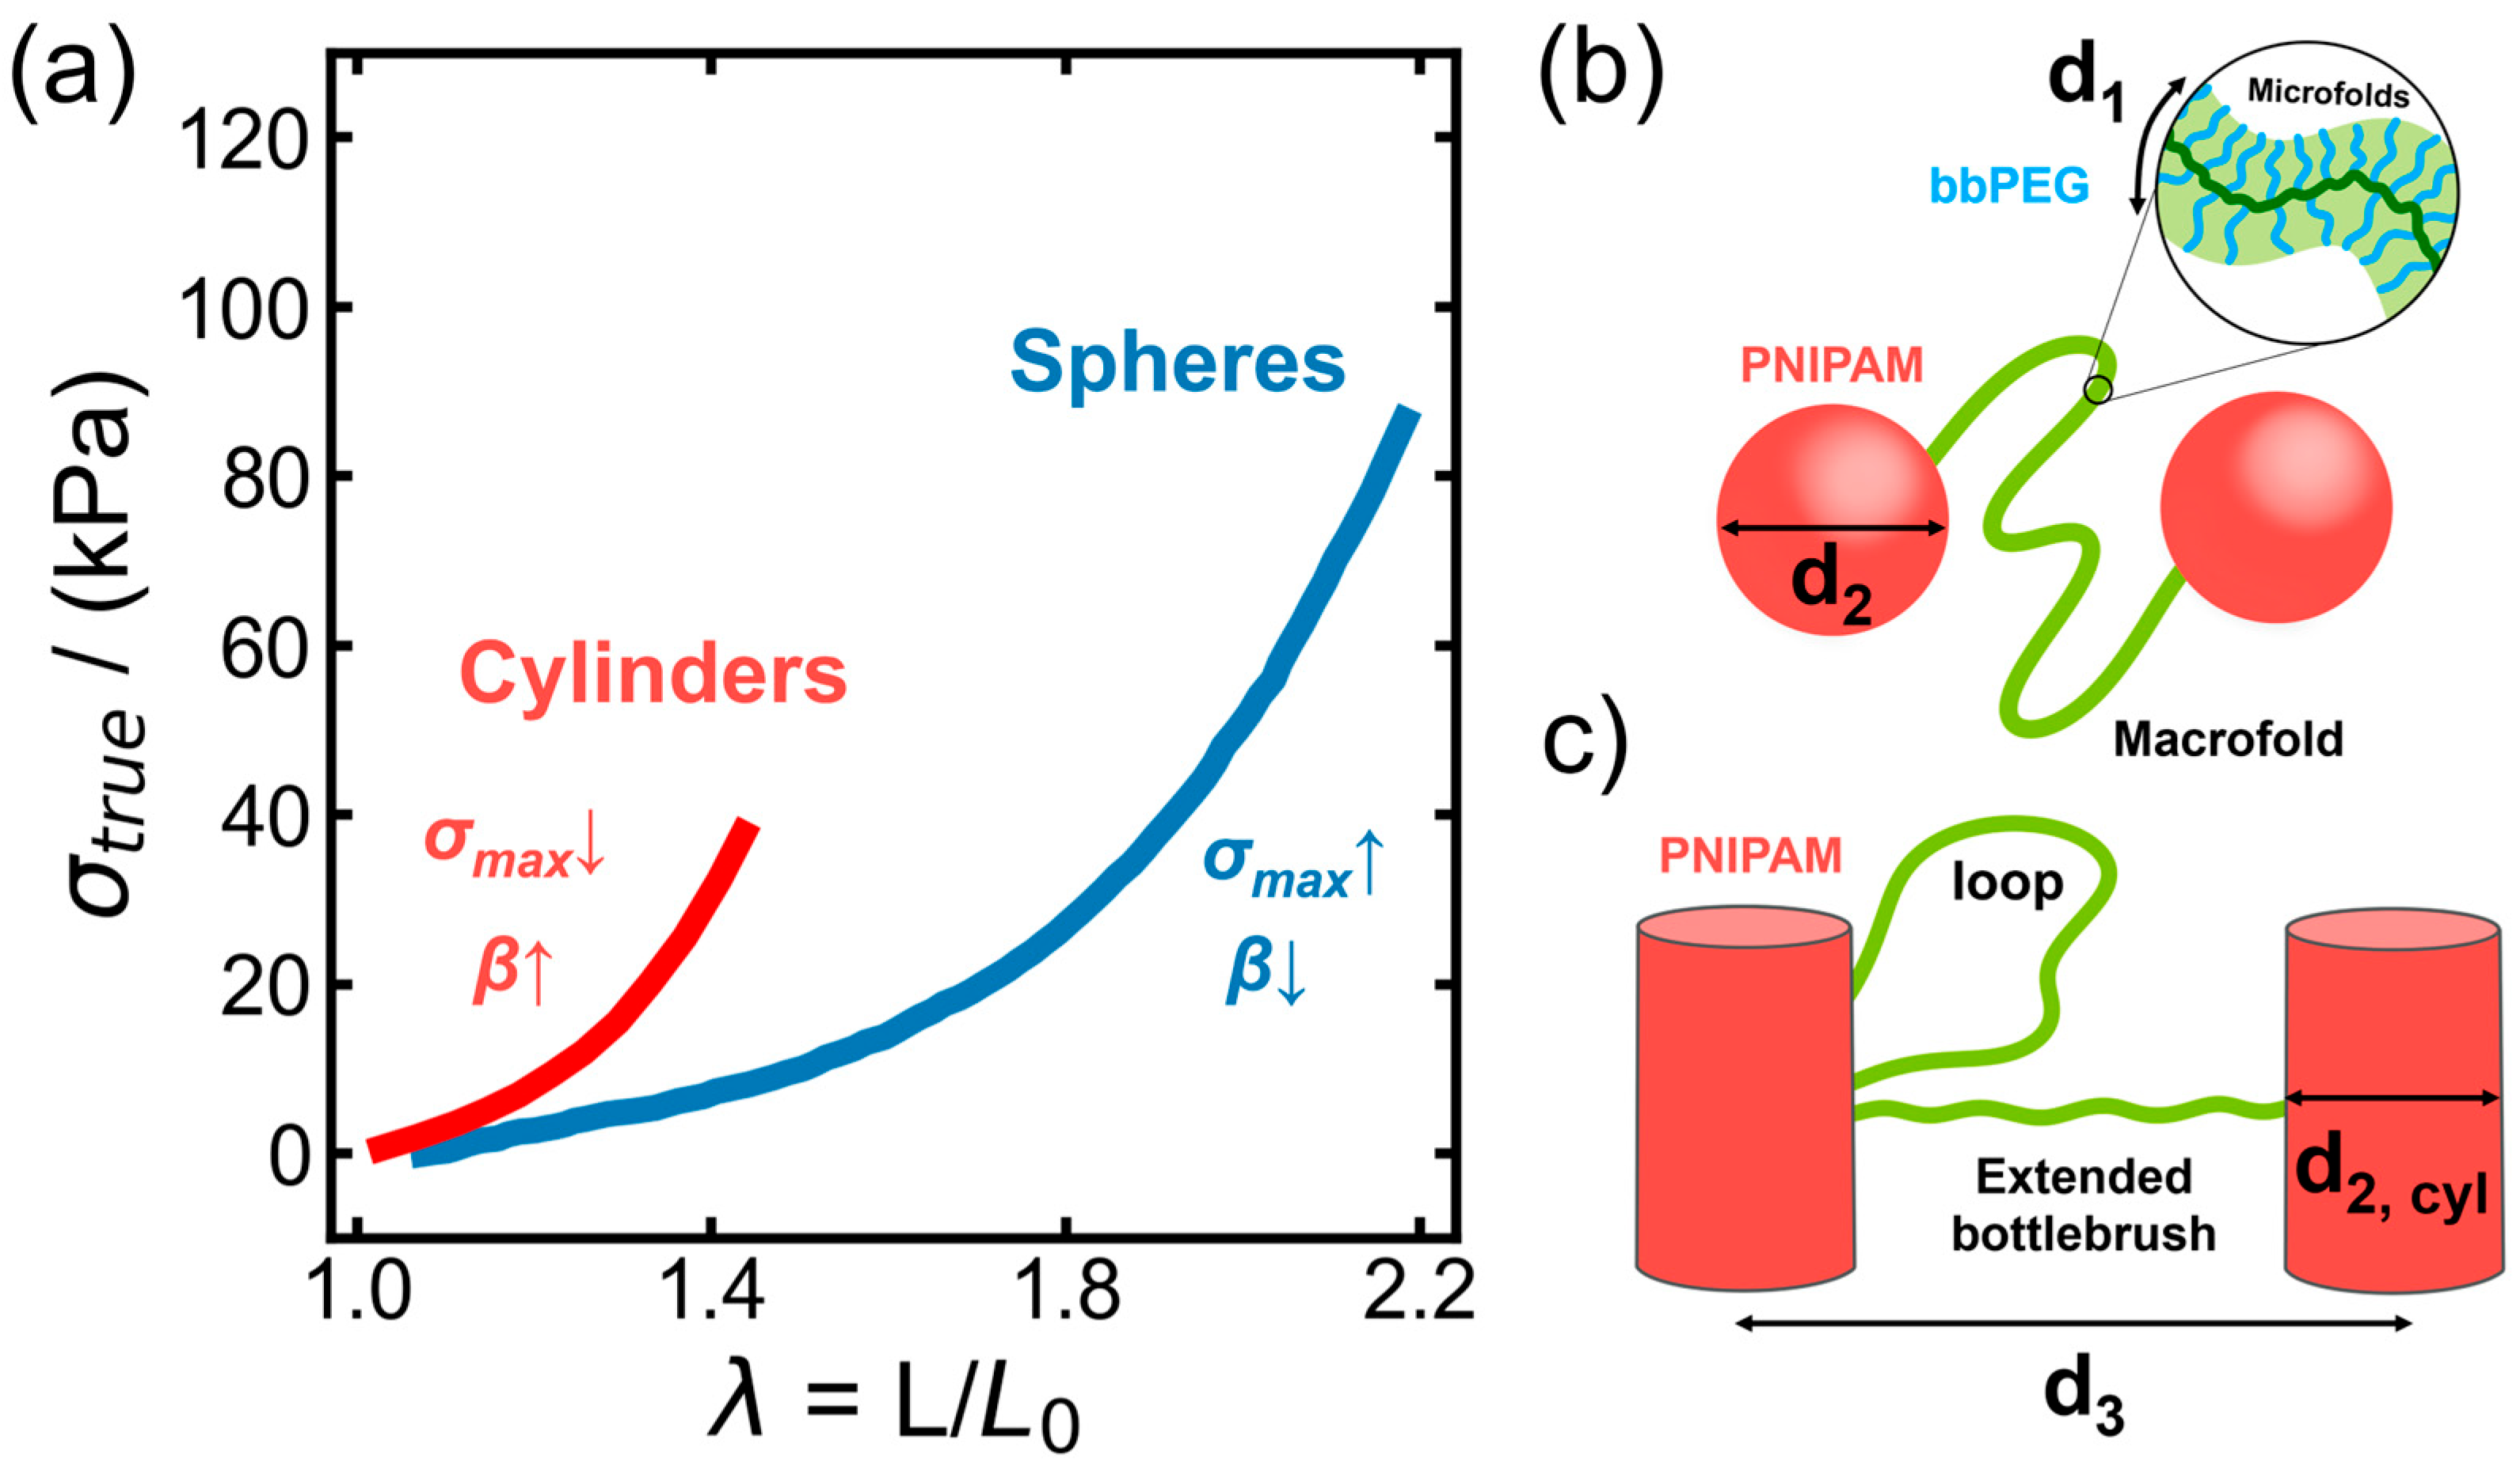
The mechanical analysis supports this interpretation (Figure 8a). The fitted strain-stiffening parameter β increases from 0.40 for 580-7 to 0.72 for 580-20. Within the adopted network model, these values correspond to root-mean-square end-to-end distances of approximately 63% and 85% of the strand contour length, respectively. The strands in 580-7 therefore retain a larger conformational reserve, allowing greater extension before finite extensibility produces pronounced strain stiffening. In 580-20, the higher initial strand extension brings the network closer to its finite-extensibility limit, consistent with earlier strain stiffening and reduced macroscopic extensibility.
Figure 8.
(a) Stress–stretch curves of samples 580-7 (blue) and 580-20 (red) measured in the melt state at 60 °C. The model described by Equation (8) was fitted to the experimental curves, yielding strain-stiffening parameters β = 0.40 and 0.72, respectively. The arrows indicate the observed trends for the cylindrical network relative to the spherical network: higher β associated with greater initial strand extension and lower stress at break (σmax) potentially related to a larger loop fraction. (b,c) Schematic illustrations of the bottlebrush triblock copolymer network with spherical ((b), 580-7) and cylindrical ((c), 580-20) PNIPAM domains.
The larger interdomain separations may also influence the balance between bridging strands and loops, in which both PNIPAM end blocks reside in the same domain. An increased loop fraction would reduce the density of elastically active bridges and could contribute to the lower maximum stress. This remains a possible additional mechanism, since the fitted β values characterize strand extension and do not independently determine the loop population.
4. Discussion
During crystallization, the PEG side chains form crystalline lamellae, whereas the noncrystallizable backbone of the bottlebrush block is accommodated in the amorphous regions of the developing semicrystalline structure and remains anchored to PNIPAM-rich domains through the terminal blocks. The SAXS/WAXS data show how these constraints operate on different length scales. The BB correlation peak weakens as the PEG reflections develop, whereas the domain interference peak persists with little shift. Thus, the restructuring of local backbone correlations proceeds within an already organized physical network [4,5,28].
In the melt, the BB correlation distance d1 is approximately 3.6 nm for all samples, despite variations in bottlebrush backbone length and PNIPAM block length. Since the PEG side chains and grafting density are the same across the series, this common distance is consistent with local packing being governed primarily by the cross-sectional dimensions of the bottlebrush strands [6]. In contrast, the characteristic sizes and separations of the PNIPAM-rich domains change markedly with molecular architecture (Table 1). The invariance of d1 therefore coexists with substantial changes in network geometry and does not imply that the conformations of the strands connecting the domains are identical [27].
Across the samples, the BB peak amplitude decreases approximately linearly as the WAXS crystallinity increases (Figure 3). A similar correlation was reported for PEG bottlebrush elastomers [5], whereas the BB peak of poly(ε-caprolactone) brushes shifted and broadened during crystallization [4]. The different responses are consistent with stronger interlamellar confinement of backbones in the highly crystalline PEG systems [5]. In the present LBL materials, side-chain crystallization and the accompanying backbone rearrangement also occur under constraints imposed by the PNIPAM-rich domains.
The BB peak becomes undetectable before the WAXS crystallinity reaches its final value (Figure 3, Figure 5 and Figure 6). Its disappearance marks the loss of the initial melt-like backbone correlations, while the amorphous phase remains part of the newly formed semicrystalline structure and acquires a different local environment. The peak amplitude depends on the strength and range of these correlations and on scattering contrast, so its decay is a structural marker of the initial packing rather than a direct measure of the entire amorphous fraction [5,6]. The amplitudes of BB peaks cannot be directly compared to quantify the bulk amorphous fractions of bottlebrush polymers with different backbone or side-chain chemistries or grafting densities, because these molecular characteristics also affect backbone packing and scattering contrast [6]. The physical interpretation of the kinetic parameters depends on the assumed relationship between the peak amplitude and the untransformed matrix fraction, while their fitted values may be affected by background subtraction and overlap with scattering from the developing semicrystalline structure. In the coupled kinetic analysis, uncertainties in the first-stage response may also propagate to the fitted parameters and contribution of the second stage. Despite these limitations, the BB peak provides information on the reorganization of the bottlebrush matrix that complements the WAXS measurements of crystallinity.
These observations are consistent with an advancing crystallization front that locally establishes a semicrystalline framework. Further crystallization or structural reorganization can then proceed within the transformed regions while the front advances into the remaining material.
A related distinction was observed during isothermal cold crystallization of PEEK, where separate amorphous relaxations evolved alongside crystalline ordering [22]. Recent fast-scanning calorimetry of poly(1,4-butylene adipate) likewise distinguished the timescales of physical aging, nucleation, and growth [23]. The present BB peak probes spatial correlations rather than relaxation times, but provides complementary information on the transformation of the initial matrix.
The correlated kinetic model expresses this picture by allowing the second stage to begin locally when a volume element is reached by the first transformation. The response of each element depends on the time elapsed since that event, and its contribution to the measured crystallinity is integrated over all transformation times. Consequently, the two stages can overlap throughout the sample even though they are sequential at the level of an individual element. The disappearance of the BB peak provides a practical marker for the loss of detectable initial correlations; it does not imply that the second stage starts everywhere at that instant [1,2].
For the two experiments at 10 °C shown in Figure 5 and Figure 6, the fitted limiting contributions of the first stage are approximately 0.30, whereas those of the second stage are approximately 0.32 and 0.41, respectively. In this model, the latter account for approximately 52% and 58% of the final crystallinity predicted for the two experiments. The WAXS crystallinity at which the BB peak becomes undetectable is not equal to the limiting first-stage contribution: WAXS measures the sum of both contributions, and the second process has already begun in regions reached earlier by the front. These values depend on the assumed relationship between BB peak amplitude and the fraction transformed, as well as on the chosen local response function.
The exponents obtained from the decay of the BB peak (n1 = 2.5 and 3.0) are compatible with spherulitic growth into the initial amorphous matrix. In the coupled model, n2 = 1.5 and 1.6 characterize the local increase in crystallinity after passage of the growth front. The lower n2 values may reflect, at least in part, a reduction in effective growth dimensionality as existing lamellae limit the space available for further crystallization. The nucleation history and the time dependence of the growth rate can also give rise to noninteger Avrami exponents at fixed growth geometry [1,2,37].
The lamellar long period Lp increases from roughly 9 to 12 nm as the crystallization temperature increases across the investigated range (Figure 4). Data for different architectures lie relatively close to one another at comparable temperatures, suggesting that the formation of the local PEG lamellar morphology is governed predominantly by crystallization conditions for this series of samples with the same side-chain length. This does not exclude an effect of the network on crystallization kinetics. Moreover, Lp contains both crystalline and interlamellar amorphous contributions, so its temperature dependence cannot be assigned to a change in crystal thickness alone [34].
The short PEG side chains place a constraint on possible lamellar packing. For the PEG 72 helix, the 1.948 nm fiber repeat contains seven monomer units [31]; a fully extended 19-unit side chain therefore has a crystalline contour length of approximately 5.3 nm. As an illustration, the values Lp ≈ 10.5 nm and WAXS crystallinity ≈ 0.75 shown for sample 890-24 at 15 °C would yield an apparent crystalline thickness of approximately 7.9 nm if the WAXS crystallinity were used as the local linear crystalline fraction. This estimate exceeds the length of one fully extended side chain, making arrangements involving PEG stems attached to opposite sides of a lamella worth considering. A half-stemmed configuration, in which chain ends can be located within the crystal, is one possible arrangement [5,32,33].
The thickness comparison, however, is conditional on the relationship between the WAXS crystallinity and the crystalline volume fraction within the lamellar stacks. The sample also contains PNIPAM-rich domains and noncrystalline bottlebrush components, and the WAXS-derived fraction need not equal the local one-dimensional crystalline fraction. The absence of weak reflections around q ≈ 10 nm−1 is compatible with differences in crystal perfection relative to brushes with longer PEG side chains [5], but neither this observation nor the estimated thickness uniquely locates the chain ends.
The PNIPAM-related scattering provides a complementary view of the network during crystallization. The nearly constant d3 in Figure 5d and Figure 6d indicates that the average interdomain spacing is largely retained, even as the PEG matrix develops its semicrystalline morphology. In contrast, the fitted domain size d2 increases by about 5% during the initial transformation. For the experiment in Figure 6, a change of approximately 2 nm in fitted diameter would correspond to about 1 nm on each side if it arose from a uniform interfacial shell. The fit, however, also responds to changes in electron-density contrast and interfacial organization, so the apparent size increase does not establish an actual increase in the PNIPAM core diameter.
An interfacial region with restricted crystallization is physically plausible because the packing of bottlebrush strands at a junction differs from that in the bulk [27]. The area estimates in Table 1 support such constraints for most of the spherical models and for the reported cylindrical models. The inferred degree of crowding therefore depends on architecture and on the assumed domain geometry. Confinement is known to alter the crystallization of PEG in other microphase-separated systems [15,17]; in the present samples, an interfacial amorphous layer remains a structural interpretation of the SAXS changes rather than a separately resolved phase.
The organization of the PNIPAM-rich domains also provides a structural basis for the mechanical response in the melt. For the two samples with a bottlebrush backbone length of 580 repeat units, the estimated surface-to-surface domain separation increases from 22.8 nm for 580-7 to 61.0 nm for 580-20 (Table 1), accompanied by an increase in the fitted strain-stiffening parameter β from 0.40 to 0.72 (Figure 8a). Within the network model, this increase in β indicates greater initial extension of the load-bearing strands relative to their contour length. The strands in 580-20 therefore retain less conformational reserve and approach their finite-extensibility limit at smaller macroscopic deformations, consistent with earlier strain stiffening and reduced extensibility [9,18,27].
The results thus connect two consequences of the LBL architecture: PNIPAM domains constrain the organization of the crystallizing bottlebrush matrix, while side-chain crystallization changes the material between those domains. Simultaneous monitoring of BB correlations and PEG reflections provides a basis for separating the loss of the initial matrix organization from further crystallization, and for relating both to the larger-scale network structure.
5. Conclusions
Time-resolved SAXS and WAXS show that the scattering signature of backbone-to-backbone correlations in PNIPAM–bbPEG–PNIPAM networks disappears before PEG crystallization is complete. Tracking the loss of these correlations separately from the development of crystalline order enables a coupled two-stage kinetic analysis. This analysis reveals that the secondary crystallization stage, which proceeds within the already formed semicrystalline framework, contributes substantially to the final crystallinity.
The PNIPAM interdomain spacing remains nearly constant during crystallization, whereas changes in the scattering profiles suggest restricted PEG crystallization near the interface between the PNIPAM domains and the bottlebrush matrix. The present study was conducted on copolymers with a fixed PEG side-chain length (nsc = 19). The effects of side-chain length and grafting density on crystallization behavior, semicrystalline morphology, and the kinetics of the two crystallization stages remain to be investigated.
Network morphology also correlates with mechanical response: larger interdomain separations are associated with greater strand extension, more pronounced strain stiffening, and reduced extensibility. These findings link crystallization kinetics and mechanical behavior to the architectural constraints of bottlebrush physical networks.
Supplementary Materials
The following supporting information can be downloaded at https://www.mdpi.com/article/10.3390/macromol6040115/s1, Figure S1: Two-dimensional SAXS patterns of sample 290-6 in q-space; Figure S2: Analysis of the one-dimensional SAXS profile; Figure S3: SAXS profiles of PNIPAM-bb-PEG-PNIPAM (sample 290-12) in the melt and semicrystalline states, with crystallization performed at 10 °C; Figure S4: Representative SAXS profiles of sample 290-22 recorded during in-situ crystallization at 10 °C.
Author Contributions
Conceptualization, D.A.I.; methodology, R.A.S., M.R., A.Y.K., E.N.S., J.G. and F.V.; software, R.A.S. and A.Z.U.; validation, M.R., A.Z.U. and E.N.S.; formal analysis, R.A.S. and A.Z.U.; investigation, D.A.I., J.G. and F.V.; resources, D.A.I.; data curation, D.A.I.; writing—original draft preparation, D.A.I.; writing—review and editing, D.A.I., A.Z.U. and S.S.S.; visualization, A.Y.K. and E.N.S.; supervision, D.A.I.; project administration, D.A.I.; funding acquisition, D.A.I., S.S.S. All authors have read and agreed to the published version of the manuscript.
Funding
A.Z.U., R.A.S. and D.A.I. are grateful to the Russian Science Foundation (project no. 23-73-30005). The LBL synthesis was supported by the National Institutes of Health (1-R01-EB038288-01).
Institutional Review Board Statement
Not applicable.
Data Availability Statement
The data supporting the findings of this study are presented in the article and its Supplementary Materials. The synchrotron X-ray scattering data were collected under ESRF experiment SC5544 (https://doi.org/10.15151/ESRF-ES-1720466614). Raw experimental data and processed datasets are available from the corresponding author upon request.
Acknowledgments
The authors acknowledge the European Synchrotron Radiation Facility (ESRF) for the provision of synchrotron radiation facilities under experiments SC5544 (DOI: 10.15151/ESRF-ES-1720466614) and SC5624.
Conflicts of Interest
The authors declare no conflicts of interest.
Abbreviations
The following abbreviations are used in this manuscript:
| LBL | Linear–bottlebrush–linear triblocks |
| PEG | poly(ethylene glycol) |
| PNIPAM | poly(N-isopropylacrylamide) |
| SAXS | Small-Angle X-Ray Scattering |
| WAXS | Wide-Angle X-Ray Scattering |
References
- Kelly, C.A.; Jenkins, M.J. Modeling the Crystallization Kinetics of Polymers Displaying High Levels of Secondary Crystallization. Polym. J. 2022, 54, 249–257. [Google Scholar] [CrossRef] [Scilit]
- Kelly, C.A.; Hay, J.N.; Turner, R.P.; Jenkins, M.J. The Effect of a Secondary Process on the Analysis of Isothermal Crystallisation Kinetics by Differential Scanning Calorimetry. Polymers 2019, 12, 19. [Google Scholar] [CrossRef] [Scilit] [PubMed]
- Schäler, K.; Ostas, E.; Schröter, K.; Thurn-Albrecht, T.; Binder, W.H.; Saalwächter, K. Influence of Chain Topology on Polymer Dynamics and Crystallization. Investigation of Linear and Cyclic Poly(ε-Caprolactone)s by 1H Solid-State NMR Methods. Macromolecules 2011, 44, 2743–2754. [Google Scholar] [CrossRef] [Scilit]
- Bersenev, E.A.; Nikitina, E.A.; Dashtimoghadam, E.; Sheiko, S.S.; Ivanov, D.A. Bottlebrush Elastomers with Crystallizable Side Chains: Monitoring Configuration of Polymer Backbones in the Amorphous Regions during Crystallization. ACS Macro Lett. 2022, 11, 1085–1090. [Google Scholar] [CrossRef] [Scilit] [PubMed]
- Nikitina, E.A.; Dashtimoghadam, E.; Sheiko, S.S.; Ivanov, D.A. Bottlebrush Elastomers with Crystallizable Side Chains: Monolayer-like Structure of Backbones Segregated in Intercrystalline Regions. Polymers 2024, 16, 296. [Google Scholar] [CrossRef] [Scilit] [PubMed]
- Moses, E.A.; Wang, Z.; Umarov, A.Z.; Bersenev, E.A.; Konyakhina, A.Y.; Moutsios, I.; Ivanov, D.A.; Dobrynin, A.V.; Sheiko, S.S. Origins of the Bottlebrush Scattering Peak: Packing and Microphase Separation in Brush-like Polymers. Macromolecules 2026, 59, 6189–6196. [Google Scholar] [CrossRef] [Scilit]
- Wu, T.; Leng, X.; Wang, Y.; Wei, Z.; Li, Y. Linear- and Star-Brush Poly(Ethylene Glycol)s: Synthesis and Architecture-Dependent Crystallization Behavior. Polymer 2020, 202, 122661. [Google Scholar] [CrossRef] [Scilit]
- Verduzco, R.; Li, X.; Pesek, S.L.; Stein, G.E. Structure, Function, Self-Assembly, and Applications of Bottlebrush Copolymers. Chem. Soc. Rev. 2015, 44, 2405–2420, Correction in Chem. Soc. Rev. 2015, 44, 7916. https://doi.org/10.1039/c5cs90099a. [Google Scholar] [CrossRef] [Scilit] [PubMed]
- Maw, M.; Morgan, B.J.; Dashtimoghadam, E.; Tian, Y.; Bersenev, E.A.; Maryasevskaya, A.V.; Ivanov, D.A.; Matyjaszewski, K.; Dobrynin, A.V.; Sheiko, S.S. Brush Architecture and Network Elasticity: Path to the Design of Mechanically Diverse Elastomers. Macromolecules 2022, 55, 2940–2951. [Google Scholar] [CrossRef] [Scilit]
- Sun, H.; Yu, D.M.; Shi, S.; Yuan, Q.; Fujinami, S.; Sun, X.; Wang, D.; Russell, T.P. Configurationally Constrained Crystallization of Brush Polymers with Poly(Ethylene Oxide) Side Chains. Macromolecules 2019, 52, 592–600. [Google Scholar] [CrossRef] [Scilit]
- Wilk, J.T.; Furner, C.T.; Kent, E.W.; Kelly, M.T.; Zhao, B.; Li, C.Y. Effect of Grafting Density on the Crystallization Behavior of Molecular Bottlebrushes. Macromolecules 2024, 57, 8487–8497. [Google Scholar] [CrossRef] [Scilit] [PubMed]
- Gan, X.; Seong, H.-G.; Hu, M.; Chen, Z.; Emrick, T.; Russell, T.P. Crystallization of Bottlebrush Statistical Copolymers of Polystyrene and Poly(Ethylene Oxide). Macromolecules 2024, 57, 7306–7314. [Google Scholar] [CrossRef] [Scilit]
- Yu-Su, S.Y.; Sheiko, S.S.; Lee, H.; Jakubowski, W.; Nese, A.; Matyjaszewski, K.; Anokhin, D.; Ivanov, D.A. Crystallization of Molecular Brushes with Block Copolymer Side Chains. Macromolecules 2009, 42, 9008–9017. [Google Scholar] [CrossRef] [Scilit]
- Hu, M.; Seong, H.-G.; Dimitriyev, M.S.; Hu, W.; Chen, Z.; Gan, X.; Grason, G.M.; Emrick, T.; Russell, T.P. Backbone Stitching in Bottlebrush Copolymer Mesodomains and the Impact of Side Chain Crystallization. Macromolecules 2025, 58, 1547–1561. [Google Scholar] [CrossRef] [Scilit]
- Witt, C.L.; Tew, G.N.; Watkins, J.J. Bottlebrush Side Chain Isomers: Spherical Self-Assembly Eliminates PEG Crystallinity at Room Temperature. ACS Macro Lett. 2026, 15, 508–514. [Google Scholar] [CrossRef] [Scilit] [PubMed]
- Qi, H.; Liu, X.; Henn, D.M.; Mei, S.; Staub, M.C.; Zhao, B.; Li, C.Y. Breaking Translational Symmetry via Polymer Chain Overcrowding in Molecular Bottlebrush Crystallization. Nat. Commun. 2020, 11, 2152. [Google Scholar] [CrossRef] [Scilit] [PubMed]
- Hsiao, M.-S.; Chen, W.Y.; Zheng, J.X.; Van Horn, R.M.; Quirk, R.P.; Ivanov, D.A.; Thomas, E.L.; Lotz, B.; Cheng, S.Z.D. Poly(Ethylene Oxide) Crystallization within a One-Dimensional Defect-Free Confinement on the Nanoscale. Macromolecules 2008, 41, 4794–4801. [Google Scholar] [CrossRef] [Scilit]
- Vatankhah-Varnosfaderani, M.; Keith, A.N.; Cong, Y.; Liang, H.; Rosenthal, M.; Sztucki, M.; Clair, C.; Magonov, S.; Ivanov, D.A.; Dobrynin, A.V.; et al. Chameleon-like Elastomers with Molecularly Encoded Strain-Adaptive Stiffening and Coloration. Science 2018, 359, 1509–1513. [Google Scholar] [CrossRef] [Scilit] [PubMed]
- Daniel, W.F.M.; Xie, G.; Vatankhah Varnoosfaderani, M.; Burdyńska, J.; Li, Q.; Nykypanchuk, D.; Gang, O.; Matyjaszewski, K.; Sheiko, S.S. Bottlebrush-Guided Polymer Crystallization Resulting in Supersoft and Reversibly Moldable Physical Networks. Macromolecules 2017, 50, 2103–2111. [Google Scholar] [CrossRef] [Scilit]
- Zhang, D.; Dashtimoghadam, E.; Fahimipour, F.; Hu, X.; Li, Q.; Bersenev, E.A.; Ivanov, D.A.; Vatankhah-Varnoosfaderani, M.; Sheiko, S.S. Tissue-Adaptive Materials with Independently Regulated Modulus and Transition Temperature. Adv. Mater. 2020, 32, 2005314. [Google Scholar] [CrossRef] [Scilit] [PubMed]
- Garcia, J.; Anikin, M.M.; Maryasevskaya, A.V.; Piryazev, A.A.; Umarov, A.Z.; Wang, Z.; Dobrynin, A.V.; Ivanov, D.A.; Sheiko, S.S. Accelerating Polycaprolactone Degradation through Bottlebrush Architecture. Polym. Chem. 2026, 17, 4199–4206. [Google Scholar] [CrossRef] [Scilit] [PubMed]
- Ivanov, D.A.; Legras, R.; Jonas, A.M. Interdependencies between the Evolution of Amorphous and Crystalline Regions during Isothermal Cold Crystallization of Poly(Ether−ether−ketone). Macromolecules 1999, 32, 1582–1592. [Google Scholar] [CrossRef] [Scilit]
- Anokhin, D.V.; Siaglova, E.D.; Akhkiamova, A.F.; Gaikovich, M.V.; Rulev, I.I.; Ivanov, D.A. The Effect of Physical Aging on Nucleation and Crystal Growth in Poly(1,4-Butylene Adipate): Study by Fast Scanning Chip Calorimetry. Polym. Bull. 2026, 83, 691. [Google Scholar] [CrossRef] [Scilit]
- Komov, E.V.; Melnikov, A.P.; Piryazev, A.A.; Maryasevskaya, A.V.; Petrov, A.O.; Malkov, G.V.; Shastin, A.V.; Anokhin, D.V.; Ivanov, D.A. Topochemical Polymerization in Microparticles of Crystalline Triazine-Based Monomers: Study by Conventional and Ultra-Fast Chip Calorimetry. Thermochim. Acta 2023, 728, 179577. [Google Scholar] [CrossRef] [Scilit]
- Nian, S.; Lian, H.; Gong, Z.; Zhernenkov, M.; Qin, J.; Cai, L.-H. Molecular Architecture Directs Linear–Bottlebrush–Linear Triblock Copolymers to Self-Assemble to Soft Reprocessable Elastomers. ACS Macro Lett. 2019, 8, 1528–1534. [Google Scholar] [CrossRef] [Scilit] [PubMed]
- Asadi, V.; Li, X.; Ruggeri, F.S.; Zuilhof, H.; Van Der Gucht, J.; Kodger, T.E. Synthesis of Well-Defined Linear–Bottlebrush–Linear Triblock Copolymer towards Architecturally-Tunable Soft Materials. Polym. Chem. 2022, 13, 4666–4674. [Google Scholar] [CrossRef] [Scilit] [PubMed]
- Clair, C.; Lallam, A.; Rosenthal, M.; Sztucki, M.; Vatankhah-Varnosfaderani, M.; Keith, A.N.; Cong, Y.; Liang, H.; Dobrynin, A.V.; Sheiko, S.S.; et al. Strained Bottlebrushes in Super-Soft Physical Networks. ACS Macro Lett. 2019, 8, 530–534. [Google Scholar] [CrossRef] [Scilit] [PubMed]
- Vashahi, F.; Martinez, M.R.; Dashtimoghadam, E.; Fahimipour, F.; Keith, A.N.; Bersenev, E.A.; Ivanov, D.A.; Zhulina, E.B.; Popryadukhin, P.; Matyjaszewski, K.; et al. Injectable Bottlebrush Hydrogels with Tissue-Mimetic Mechanical Properties. Sci. Adv. 2022, 8, eabm2469. [Google Scholar] [CrossRef] [Scilit] [PubMed]
- Garcia, J.; Vashahi, F.; Umarov, A.Z.; Dubrovin, E.V.; Konyakhina, A.Y.; Subcheva, E.N.; Ivanov, D.A.; Dobrynin, A.V.; Sheiko, S.S. Injectable Hydrogels with Tissue-Adaptive Gelation and Mechanical Properties: Enhancing Softness and Stability. Gels 2025, 11, 996. [Google Scholar] [CrossRef] [Scilit] [PubMed]
- Konyakhina, A.Y.; Umarov, A.Z.; Garcia, J.; Vashahi, F.; Dubrovin, E.V.; Subcheva, E.N.; Buglakov, A.I.; Sheiko, S.S.; Ivanov, D.A. Structure and Gelation Properties of Thermoresponsive Bottlebrush Hydrogels. Eur. Polym. J. 2026, 242, 114446. [Google Scholar] [CrossRef] [Scilit]
- Takahashi, Y.; Tadokoro, H. Structural Studies of Polyethers, (-(CH2)m-O-)n. X. Crystal Structure of Poly(Ethylene Oxide). Macromolecules 1973, 6, 672–675. [Google Scholar] [CrossRef] [Scilit]
- Pulst, M.; Samiullah, M.H.; Baumeister, U.; Prehm, M.; Balko, J.; Thurn-Albrecht, T.; Busse, K.; Golitsyn, Y.; Reichert, D.; Kressler, J. Crystallization of Poly(Ethylene Oxide) with a Well-Defined Point Defect in the Middle of the Polymer Chain. Macromolecules 2016, 49, 6609–6620. [Google Scholar] [CrossRef] [Scilit]
- Dong, X.-H.; Van Horn, R.; Chen, Z.; Ni, B.; Yu, X.; Wurm, A.; Schick, C.; Lotz, B.; Zhang, W.-B.; Cheng, S.Z.D. Exactly Defined Half-Stemmed Polymer Lamellar Crystals with Precisely Controlled Defects’ Locations. J. Phys. Chem. Lett. 2013, 4, 2356–2360. [Google Scholar] [CrossRef] [Scilit]
- Schulz, M.; Schäfer, M.; Saalwächter, K.; Thurn-Albrecht, T. Competition between Crystal Growth and Intracrystalline Chain Diffusion Determines the Lamellar Thickness in Semicrystalline Polymers. Nat. Commun. 2022, 13, 119. [Google Scholar] [CrossRef] [Scilit] [PubMed]
- Ashiotis, G.; Deschildre, A.; Nawaz, Z.; Wright, J.P.; Karkoulis, D.; Picca, F.E.; Kieffer, J. The Fast Azimuthal Integration Python Library: pyFAI. J. Appl. Crystallogr. 2015, 48, 510–519. [Google Scholar] [CrossRef] [Scilit] [PubMed]
- Percus, J.K.; Yevick, G.J. Analysis of Classical Statistical Mechanics by Means of Collective Coordinates. Phys. Rev. 1958, 110, 1. [Google Scholar] [CrossRef] [Scilit]
- Hong, P.-D.; Chung, W.-T.; Hsu, C.-F. Crystallization Kinetics and Morphology of Poly(Trimethylene Terephthalate). Polymer 2002, 43, 3335–3343. [Google Scholar] [CrossRef] [Scilit]
- Vigier, G.; Tatibouet, J.; Benatmane, A.; Vassoille, R. Amorphous Phase Evolution during Crystallization of Poly(Ethylene-Terephthalate). Colloid Polym. Sci. 1992, 270, 1182–1187. [Google Scholar] [CrossRef] [Scilit]

Disclaimer/Publisher’s Note: The statements, opinions and data contained in all publications are solely those of the individual author(s) and contributor(s) and not of MDPI and/or the editor(s). MDPI and/or the editor(s) disclaim responsibility for any injury to people or property resulting from any ideas, methods, instructions or products referred to in the content. |
© 2026 by the authors. Licensee MDPI, Basel, Switzerland. This article is an open access article distributed under the terms and conditions of the Creative Commons Attribution (CC BY) license.