


Abstract
This study investigated the impact of a sequential ethanol precipitation gradient on the molecular weight distribution, chemical composition, and macromolecular architecture of Ganoderma lucidum polysaccharides. Fractions obtained via serial precipitation (30%, 60%, and 90% ethanol: GLP30, GLP60, and GLP90, respectively) and a traditional single-step precipitation (75%: GLP75) were characterized using mainly HPSEC-MALLS-RI, GC-MS, NMR spectroscopy (HSQC-DEPT), and rheological analyses. The results demonstrated that sequential precipitation effectively fractionated the polymers based on structural profiles and molecular masses. GLP30 and GLP90 primarily comprised α- and β-D-glucans (70–74% Glc), and heteropolysaccharides with mannose and arabinose, whereas GLP60 exhibited the highest structural heterogeneity, encompassing complex heteropolysaccharides and uronic acids (5.8%). The single-step GLP75 fraction yielded a heterogeneous mixture of these distinct populations. NMR spectra showed signals that corroborated the monosaccharide compositions. High-molecular-weight fractions (GLP30 and GLP75) retained rigid triple-helical conformations, displaying non-Newtonian shear-thinning behavior, a weak-gel viscoelastic profile, and remarkably high intrinsic viscosities ([η] 39.45 and 610.73 dL/g, respectively). Conversely, the low-molecular-weight fractions (GLP60 and GLP90), although retained rigid triple-helical conformations, exhibited negligible hydrodynamic volumes ([η] < 1.6 dL/g). Overall, this research provides a highly feasible strategy to successfully separate macrofungal polysaccharides according to both their molecular weight and monosaccharide distribution, minimizing some purification steps.
1. Introduction
Ganoderma lucidum is a basidiomycete fungus widely recognized for its diverse medicinal properties in Asian cultures, where it is traditionally referred to as “Reishi” or “Lingzhi”. Valued for centuries to promote longevity and overall well-being, modern pharmacological research has validated its potent antioxidant, anti-inflammatory, and immunomodulatory effects [1,2,3]. While this fungus acts as a complex therapeutic biofactory containing a wide array of mycochemicals, such as triterpenoids, meroterpenoids, proteins, phenolics, and sterols [4,5,6], its high-molecular-weight polysaccharides, particularly β-D-glucans, are considered the primary drivers of its biological and technological potential. In fungal cell walls, these β-D-glucans are predominantly composed of a β-(1→3)-linked glucose backbone with short β-(1→6)-linked glycosidic branches [7,8], configurations that dictate not only their bioactive profiles but also their unique macromolecular behavior in aqueous systems.
Conventionally, water extraction followed by ethanol precipitation is the standard approach to isolate these bioactive macromolecules [9]. Although a standardized single-step precipitation using 70–80% ethanol is widely implemented in academic and industrial protocols, the individual precipitation behavior is strictly governed by the chemical diversity, structural branching, and molar mass distribution of the polysaccharides in solution [9]. Generally, larger, less branched polymers precipitate at lower alcohol concentrations, whereas low-molecular-weight populations require higher ethanolic strengths for complete recovery [9]. A notable illustration of this structural dependence is a specific β-(1,3)-D-glucan isolated from G. lucidum, named GLP20, and obtained at a low ethanol threshold (20%), which exhibits a stiff chain conformation and a pronounced shear-thinning behavior capable of forming weak gels at concentrations above 0.6% [10].
However, despite the known dependence of polymer solubility on non-solvent addition, traditional single-step recovery strategies often overlook how systematic fractional precipitation can effectively partition distinct polysaccharide populations. Relying strictly on high-concentration single-step precipitation yields a highly heterogeneous mixture, masking the unique physical, structural, and functional traits of individual macromolecular classes. In contrast, sequential or gradient ethanol precipitation provides a robust, non-destructive, and eco-friendly tool to fractionate these complex mixtures based on molecular weight, branching density, and structural complexity. By selectively partitioning fractions with tailored macromolecular profiles, ranging from high-molecular-weight structural polymers to lower-molecular-weight heteropolysaccharides, gradient fractionation enables the targeted recovery of extracts with predictable rheological or functional properties for specific food, cosmetic, and pharmaceutical applications. Nevertheless, a comprehensive comparative framework directly linking sequentially isolated fractions to their specific structural configurations, dilute-solution hydrodynamic behavior, and bulk viscoelastic traits remains missing.
To address this knowledge gap, this study systematically evaluated the impact of ethanol-gradient precipitation on the macromolecular architecture and physical performance of G. lucidum polysaccharides. Rather than focusing on a single operational condition, we established a rigorous comparative framework between sequential, step-wise precipitation and a traditional single-step recovery. All recovered populations were comprehensively characterized regarding their chemical composition, molecular weight distribution, monosaccharide profile, and structural conformation. Furthermore, dilute-solution viscometry and bulk dynamic rheometry were integrated to elucidate how gradient-driven structural variations dictate the hydrodynamic and technological performance of G. lucidum extracts.
2. Material and Methods
2.1. Serial Extraction of Polysaccharides from G. lucidum
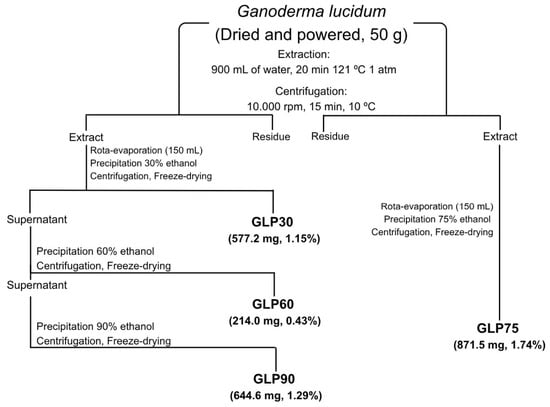
A total of 50 g of dried and powdered G. lucidum was weighed and autoclaved with 900 mL of ultrapure water at 121 °C, 1 atm, for 20 min, followed by centrifugation at 10,000 rpm for 15 min at 10 °C (Figure 1). The resulting supernatant was concentrated to 150 mL in a rotary evaporator. For the first polysaccharide recovery, 64.3 mL of cold absolute ethanol was added, and the mixture was left for 24 h at 5 °C. The following day, the extract was centrifuged at 10,000 rpm for 15 min at 5 °C, and the resulting precipitate was resuspended with ultrapure water and heated on a magnetic stirrer at 60 °C until the ethanol had completely evaporated, forming the polysaccharide fraction extracted with 30% ethanol, named GLP30. Next, 160.7 mL of absolute ethanol was added to the collected supernatant and left for 24 h at 5 °C. The polysaccharide was recovered under the same conditions as the previous step, forming the GLP60 fraction. Then, 1125 mL of absolute ethanol was added to the remaining supernatant and left for 24 h at 5 °C. The polysaccharide was obtained under the same conditions as the previous step, forming the GLP90 fraction. All fractions were frozen and freeze-dried.
Figure 1.
Schematic representation of extraction followed by serial and single polysaccharide recovery (with different gradients of ethanol) from G. lucidum. Each fraction (GLP30; GLP60; GLP90 and GLP75) is named according to the concentration of ethanol used.
2.2. Single Extraction of Polysaccharides from G. lucidum
In total, 50 g of G. lucidum was autoclaved with 900 mL of ultrapure water at 121 °C, 1 atm, for 20 min, followed by centrifugation at 10,000 rpm for 15 min at 10 °C. The resulting supernatant was passed through a rotary evaporator until its volume was reduced to 150 mL. Three volumes of absolute ethanol were added, and the mixture was left for 24 h at 5 °C. Subsequently, the extract was centrifuged at 10,000 rpm for 15 min at 5 °C. The resulting precipitate, named GLP75, was resuspended with ultrapure water and heated on a magnetic stirrer at 60 °C, until the ethanol had completely evaporated. Finally, the sample was frozen and freeze-dried. The percentage yields were calculated on a dry weight basis relative to the initial dry mass of raw G. lucidum fruiting body powder used for extraction, as follows:
2.3. Monosaccharide Composition Determination
A total of 250 μL of 2 M TFA solution was added to 2 mg of polysaccharide extract and incubated at 100 °C for 8 h to hydrolyze the glycosidic bonds. After hydrolysis, the material was air-dried, and 1 mL of acetone was added, followed by further evaporation. The same process was repeated with the addition and evaporation of 1 mL of ethanol. Next, 1 mL of distilled water was added, and sodium borohydride (5 mg) was added (pH reached 8–9), and the sample was left to stand overnight at room temperature. After this period, acetic acid was added until the pH reached 5–6, followed by another airflow drying. Then, 5 cycles of solubilization and drying were performed with 1 mL of methanol until complete removal of the sodium borohydride residue. Immediately after, 200 μL of pyridine and acetic anhydride were added, and the mixture was incubated at 80 °C for 30 min. Next, a second washing step was performed: 1 mL of chloroform was added and vortexed, followed by 5 cycles of washing with 1 mL of distilled water, solubilization, and removal of the upper phase formed. Then, the chloroform was evaporated by airflow, 1 mL of methanol was added and evaporated again, and finally, 1 mL of acetone was added previous the injection into the gas chromatography–mass spectrometer (GC-MS) using a single-quadrupole apparatus, model QP2020 (Shimadzu, Tokyo, Japan), equipped with an AOC-6000 autosampler (Pal Systems, Tokyo, Japan), operating in liquid injection mode. The analyses were developed in a capillary column, RTX-5-MS (30 m × 0.25 mm × 0.25 µm film thickness). Helium (5.0 analytical grade) was used as a carrier gas with a linear velocity of 45 cm/s, at a flow rate of 1.54 mL/min. The oven was programmed with a nonlinear heating ramp, that started at 50 °C and was held for 1 min, then increased to 150 °C at a rate of 20 °C/min, and finally reached 200 °C at a rate of 5 °C/min, and was held for 3 min. The final temperature was set at 250 °C, heated at 20 °C/min, and held for 3.5 min, with a total run time of 25 min. The compounds were detected by electron ionization using a mass spectrometer operating at 70 eV.
2.4. Uronic Acid Determination
The uronic acid determination was performed by sulfamate/m-hydroxybiphenyl modified method from Filisetti-Cozzi and Carpita., 1991 [11], adding the acid pre-hydrolysis step [12,13]. Galacturonic acid at concentrations ranging from 2 to 30 μg/mL was utilized as standard.
2.5. Chemical Composition Analysis
The chemical composition of the G. lucidum fractions was determined in independent triplicates. Total carbohydrate content was quantified by the phenol–sulfuric acid method described by DuBois et al., 1956 [14]. Total protein content was measured according to the Bradford method, 1976 [15], using bovine serum albumin (BSA) to establish the standard calibration curve; samples were incubated with the Bradford reagent for 5 min at room temperature, and the absorbance was read at 595 nm. Total phenolic content was determined via the colorimetric Folin–Ciocalteu assay, according to the methodology described by Ainsworth & Gillespie, 2007 [16]. Total triterpenes were quantified by a colorimetric method adapted from Pedrosa et al., 2020 [17]. Briefly, solvent-free dried samples and standard solutions of ursolic acid (used to construct the calibration curve) were reacted with 250 µL of vanillin in acetic acid (50 mg/mL) and 500 µL of concentrated sulfuric acid. The mixture was incubated at 60 °C for 30 min, followed by quenching in an ice bath. After the addition of 2.5 mL of acetic acid, the solutions were kept on ice for 20 min and then allowed to equilibrate at room temperature for an additional 20 min before measuring the absorbance at 548 nm. The absorbance was measured in a Multiskan SkyHigh Microplate Spectrophotometer (Thermo Fisher Scientific, Waltham, MA, USA). The final contents of all biochemical parameters were calculated as a weight percentage (w/w, %) relative to the total dry mass of each isolated fraction.
2.6. Nuclear Magnetic Resonance (NMR) Analysis
Two-dimensional NMR analysis (Heteronuclear Single Quantum Coherence with DEPT-style multiplicity editing—HSQC-DEPT) was performed in the Nuclear Magnetic Resonance Center of Federal University of Paraná, using a BRUKER Avance-III HD 600 MHz spectrometer (Bruker Corporation, Billerica, MA, USA) with a 5 mm probe. Analyses were conducted at 70 °C, and the extracts (50 mg) were solubilized in deuterated dimethyl sulfoxide (Me2SO-d6). The chemical shifts in the samples were expressed in ppm (δ) relative to the solvent resonance (δ 39.7 for 13C and δ 2.4 for 1H).
2.7. High-Performance Size Exclusion Chromatography (HPSEC)
The analyses were performed using a high-performance size exclusion chromatograph (HPSEC) (Waters, Milford, MA, USA) equipped with a differential refractive index detector (Waters 2410) and a multi-angle light scattering detector (WYATT TECHNOLOGY, DAWN DSP-F model). Four WATERS gel permeation columns (2000, 500, 250, and 120), with exclusion limits of 7 × 10⁶, 4 × 10⁵, 8 × 10⁴, and 5 × 10³ Da, respectively, were connected in series. The eluent consisted of 0.1 mol/L sodium nitrite (NaNO2) containing 0.2 g/L sodium azide (NaN3), with a flow rate of 0.6 mL/min, delivered by a WATERS 515 peristaltic pump. The samples were dissolved in the same solution used as the eluent (1 mg/mL), filtered through 0.22 μm and the refractive index, light scattering, and ultraviolet (UV) absorption at 280 nm were recorded. The relative molecular weight of peaks in each sample was estimated by comparison with a curve of dextran patterns (2000, 266, 124, 72.2, 40.2, 9.4, and 5 kDa) (Figure S1). Data was analyzed using Astra software version 4.70.
2.8. Conformational Structure of the Polysaccharides with Congo Red
Congo red was dissolved in NaOH 0.05 M at 4 mM. Samples of all fractions were dissolved in the same solvent at 1 mg/mL, and 20 µL of Congo red solution was added, reaching a concentration of 80 µM, according to Palacios et al. [18]. Then, the samples were pipetted in quadruplicate into a 96-well plate. Congo red (80 µM) was used as a negative control, and dextran (Sigma-Aldrich, São Paulo, Brazil, Mw 40,200 g/mol) was used as a random coil control. Spectra were recorded in a Multiskan SkyHigh Microplate Spectrophotometer (Thermo Fisher Scientific, Waltham, MA, USA) in intervals of 10 nm from 420 to 640 nm.
2.9. Rheological Properties of the Extracts
GLP30 and GLP75 extracts were solubilized in distilled water at 1% (w/w). Rheological analyses were performed using a HAAKE MARS II rheometer (Thermo Fisher Scientific, Karlsruhe, Germany) equipped with a C60/2° TiL cone-and-plate geometry (60 mm diameter, 2° cone angle) at a measurement gap of 1.0 mm. Prior to testing, samples were equilibrated on the plate for 300 s. Flow curves were determined at 3 °C and 25 °C under a controlled shear rate from 0.005 to 1000 s−1 over 600 s. Frequency sweeps were conducted at the same temperatures from 0.01 to 10 Hz at a fixed strain of 1%.
2.10. Intrinsic Viscosity
The intrinsic viscosity ([η]) was determined from dilute solutions of the polysaccharide fractions using an Ubbelohde capillary viscometer maintained at 21 °C. To ensure linear Huggins extrapolation to zero concentration within the dilute regime, specific concentration ranges were prepared for each fraction based on their hydrodynamic responses: GLP30 (0.02–0.10 g/dL), GLP60 (0.20–0.75 g/dL), GLP90 (0.60–1.50 g/dL), and GLP75 (0.01–0.09 g/dL). Flow times were recorded in quintuplicate for each dilution, and the average values were used for viscometric calculations.
From the flow times, the relative viscosity (ηrel = t/t0), specific viscosity (ηsp = ηrel − 1), and reduced viscosity (ηred = ηsp/c) were determined, where t is the flow time of the solution, t0 is the flow time of the pure solvent, and c is the concentration of the sample. The reduced viscosity values were plotted as a function of concentration (ηred × c), and the intrinsic viscosity was obtained by linear extrapolation of the fitted line to zero concentration. The analysis was performed based on the Huggins equation:
where ηred is the reduced viscosity, kH is the Huggins coefficient, [η] is the intrinsic viscosity, and c is the sample concentration. This relationship yields a linear plot of ηred versus c, in which the intercept at c = 0 corresponds to the intrinsic viscosity.
ηred = [η] + kH[η]2c
2.11. Statistical Analysis
Quantitative colorimetric assays (e.g., total carbohydrates, total phenolics, proteins, and triterpenes) and extraction yields were performed in triplicate across three independent experiments (n = 3). Results are expressed as mean ± standard deviation (SD). Statistical significance among fractions was evaluated by one-way analysis of variance (ANOVA) followed by Tukey’s post hoc test, with p < 0.05 considered statistically significant (GraphPad Prism, version 8.0). For bulk rheological measurements (steady flow curves and dynamic frequency sweeps), at least two independent preparations were performed for each sample, with technical duplicates for each preparation to confirm physical reproducibility. Representative curves were selected and shown in the figures for visual clarity.
2.12. GenAI Usage
We hereby declare the use of Generative Artificial Intelligence (GAI) tools during the preparation of this manuscript. Gemini (free web version) and ChatGPT (free web version) were employed for English language editing, improving textual clarity and correctness, and to assist in drafting the abstract. All content generated with the assistance of these tools was critically reviewed, verified, and edited by the authors. The authors accept full responsibility for the final version of the manuscript, including the originality of the ideas, the accuracy of the data and analyses, and the correctness of all citations.
3. Results and Discussion
3.1. Extraction of G. lucidum and Chemical Composition of the Fractions
The total combined yield obtained from the serial ethanol precipitation protocol averaged 1434.8 mg per batch (2.87% relative to the starting dried mushroom material, 50 g). To evaluate the mass distribution among the sequentially precipitated fractions, relative contributions were calculated based on the total recovered extract mass: GLP30 and GLP90 represented the main fractions, accounting for 40.2% (577.2 mg; 1.15% of mushroom biomass) and 44.9% (644.6 mg; 1.29% of mushroom biomass) of the serial yield, respectively, whereas GLP60 constituted a minor fraction at 14.9% (214.0 mg; 0.43% of mushroom biomass) (Table 1). In comparison, the traditional single-step extraction (GLP75) yielded 871.5 mg per batch (1.74% relative to starting material). Although GLP75 produced the highest yield among individual fractions when compared to any single sequential cut, the overall recovery of the serial precipitation process (2.87%) was substantially higher than that of the single-step procedure.
Table 1.
Yield and chemical composition of G. lucidum fractions.
The efficiency and selectivity of ethanol-gradient precipitation are governed by the interplay between solvent polarity and system thermodynamics. The application of a strictly controlled low temperature (5 °C) during both sequential and single-step ethanol precipitations plays a crucial role in driving this fractionation mechanism. Lowering the system temperature reduces polymer chain mobility and thermal kinetic energy while simultaneously decreasing the dielectric constant of the water–ethanol mixture. This thermodynamically favors intermolecular hydrogen bonding and hydrophobic interactions among dehydrated polysaccharide chains, ensuring sharp, reproducible phase separation based on differential molecular weight thresholds and branching density.
Each obtained fraction was characterized regarding its total carbohydrate, protein, total phenolic, and total triterpenoid content (Table 1). The carbohydrate content exhibited a wide variation, ranging from 87.3% to 27.5%, with GLP75 and GLP90 displaying the highest and lowest concentrations, respectively. In contrast, protein levels remained remarkably consistent across all fractions, maintaining an average of 10–11%. Meanwhile, phenolic compounds accounted for less than 2.5% of the total composition, and triterpene contents hovered between 3.9% and 5.6%.
A comparative analysis with the previous literature highlights the efficiency of the current methodology. For instance, Milhorini et al. (2024) [8] reported that an alkaline extraction of the same species yielded 76.9% carbohydrates and 9.7% proteins. This demonstrates that the aqueous extraction protocol employed in the present study achieves an outstanding carbohydrate yield despite operating under significantly milder conditions. Furthermore, the comparable protein recovery across both studies underscores the potential of this mushroom as a robust nutritional source. G. lucidum also outperformed other basidiomycetes; for context, an aqueous extract from Pleurotus ostreatus yielded only 37% carbohydrates and 3.4% proteins [19].
Intriguingly, although G. lucidum is widely renowned for its bioactive secondary metabolites, the phenolic content in this study was minimal. This deviates from prior findings, such as those by Milhorini et al. (2024) [8], who observed a substantially higher phenolic concentration of 7.8%. Crucially, while triterpenes and phenolics are conventionally recovered using organic solvents like ethanol [5], our completely aqueous extract retained noteworthy quantities of both compound classes (triterpenes: 3.9–5.6%; phenolics: 0.5–2.5%). To the best of our knowledge, this represents the first quantification of triterpenoids in a strictly aqueous extract of this species, highlighting the multi-target therapeutic potential of these water-soluble fractions.
Regarding the monosaccharide composition (Table 2), glucose was identified as the predominant sugar across all fractions, whereas the distribution of minor monosaccharides varied distinctly among them. Specifically, GLP30 was composed mainly of glucose, mannose, and arabinose, with traces of galactose and inositol. In contrast, the GLP75 and GLP90 fractions contained the three same main sugars along with higher contents of galactose. Trace levels of fucose were present in the GLP75 fraction. Notably, the GLP60 fraction exhibited the highest structural heterogeneity, displaying the lowest glucose content (50.9%) coupled with the highest galactose concentration (25.8%), followed by mannose, arabinose, inositol, and fucose (Table 2). The uronic acids, determined spectrophotometrically, accounted 5.8% in GLP60, whereas for the fractions GLP75 and GLP30 were 2.4% and 0.2%, respectively. Uronic acids were not detected in GLP90 fraction.
Table 2.
Monosaccharide composition of G. lucidum fractions.
Ganoderma lucidum is widely recognized for its high abundance of glucans, which aligns with the elevated glucose concentrations observed herein [8,20]. Furthermore, heteropolysaccharides encompassing mannose, galactose, and fucose backbones or side chains are commonly documented in macrofungi [18,21]. Different from other mushroom species, arabinose—a monosaccharide classically associated with plant cell wall arabinogalactans [22]—was reported in G. lucidum extracts in remarkable amounts, and it was mostly associated with its sporoderm [23,24]. The results observed in the present study most likely was due to the presence of spores in the initial fraction of G. lucidum fruiting bodies.
3.2. Spectroscopy Analysis
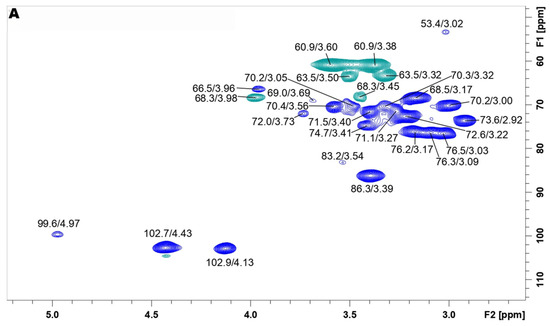
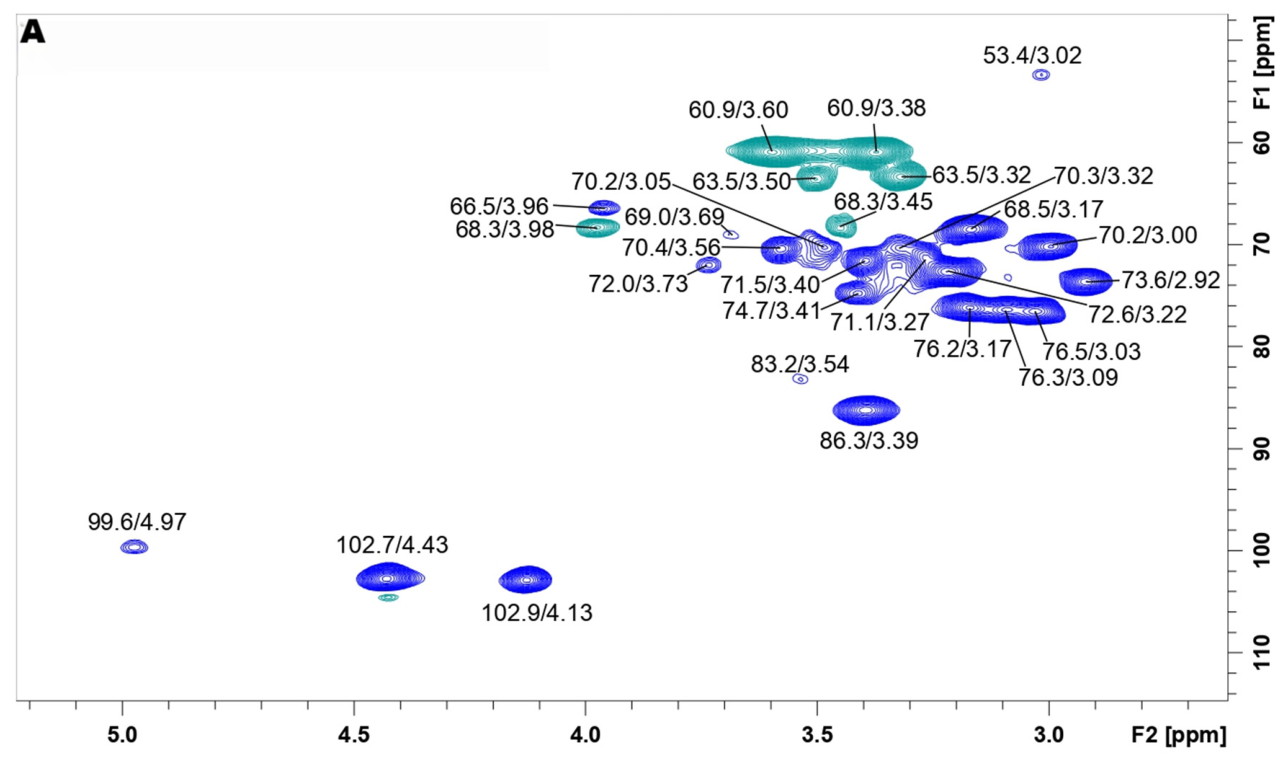
The HSQC-DEPT spectrum of the GLP30 fraction (Figure 2A) shows two signals at the anomeric region δ 102.7/4.43 and δ 102.9/4.13 related to the anomeric carbon (C-1) of the β-D-glucose units, while the signal at δ 99.6/4.97 suggests the presence of C-1 of the α-D-glucose unit [24,25,26]. The presence of the O-substituted C-3 was confirmed by signals at δ 86.3/3.39 and δ 83.2/3.54, corresponding to β-D-glucose and α-D-glucose units, respectively. The inverted signals at δ 68.3/3.98 and 68.3/3.45 were assigned to the O-substituted C-6 positions of the β-D-glucose units, whereas the inverted signals at δ 60.9/3.60 and 60.9/3.38 correspond to the non-substituted C-6 of the β-D-glucose units [8,26,27,28,29]. Inverted signals at δ 63.5/3.50 and 63.5/3.32 were assigned to the C5/H5 correlations of arabinose units. Although the corresponding anomeric signal was detectable upon substantial spectral amplification (Table 3), it was omitted from the current figure to maintain baseline clarity and avoid excessive signal-to-noise ratio. The signals indicate that GLP30 fraction is mainly composed of linear glucans with β-(1→3) and β-(1→6)-main chains and α-(1→3)-main chain. The other signals were attributed to the respective carbons/hydrogens and are described in Table 3.
Figure 2.
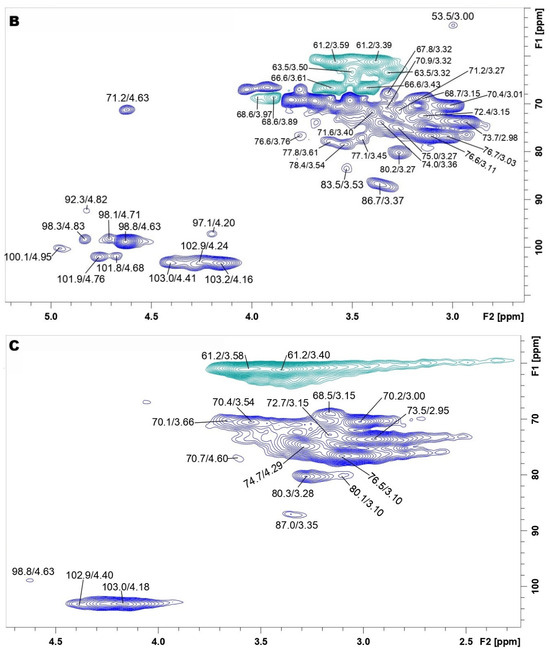
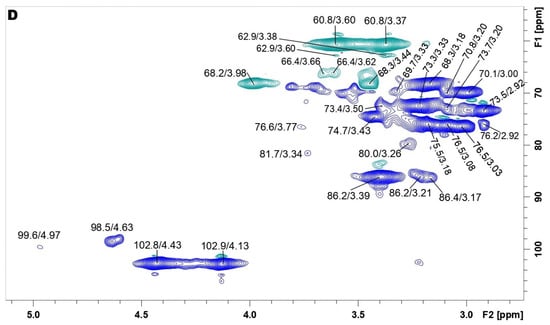
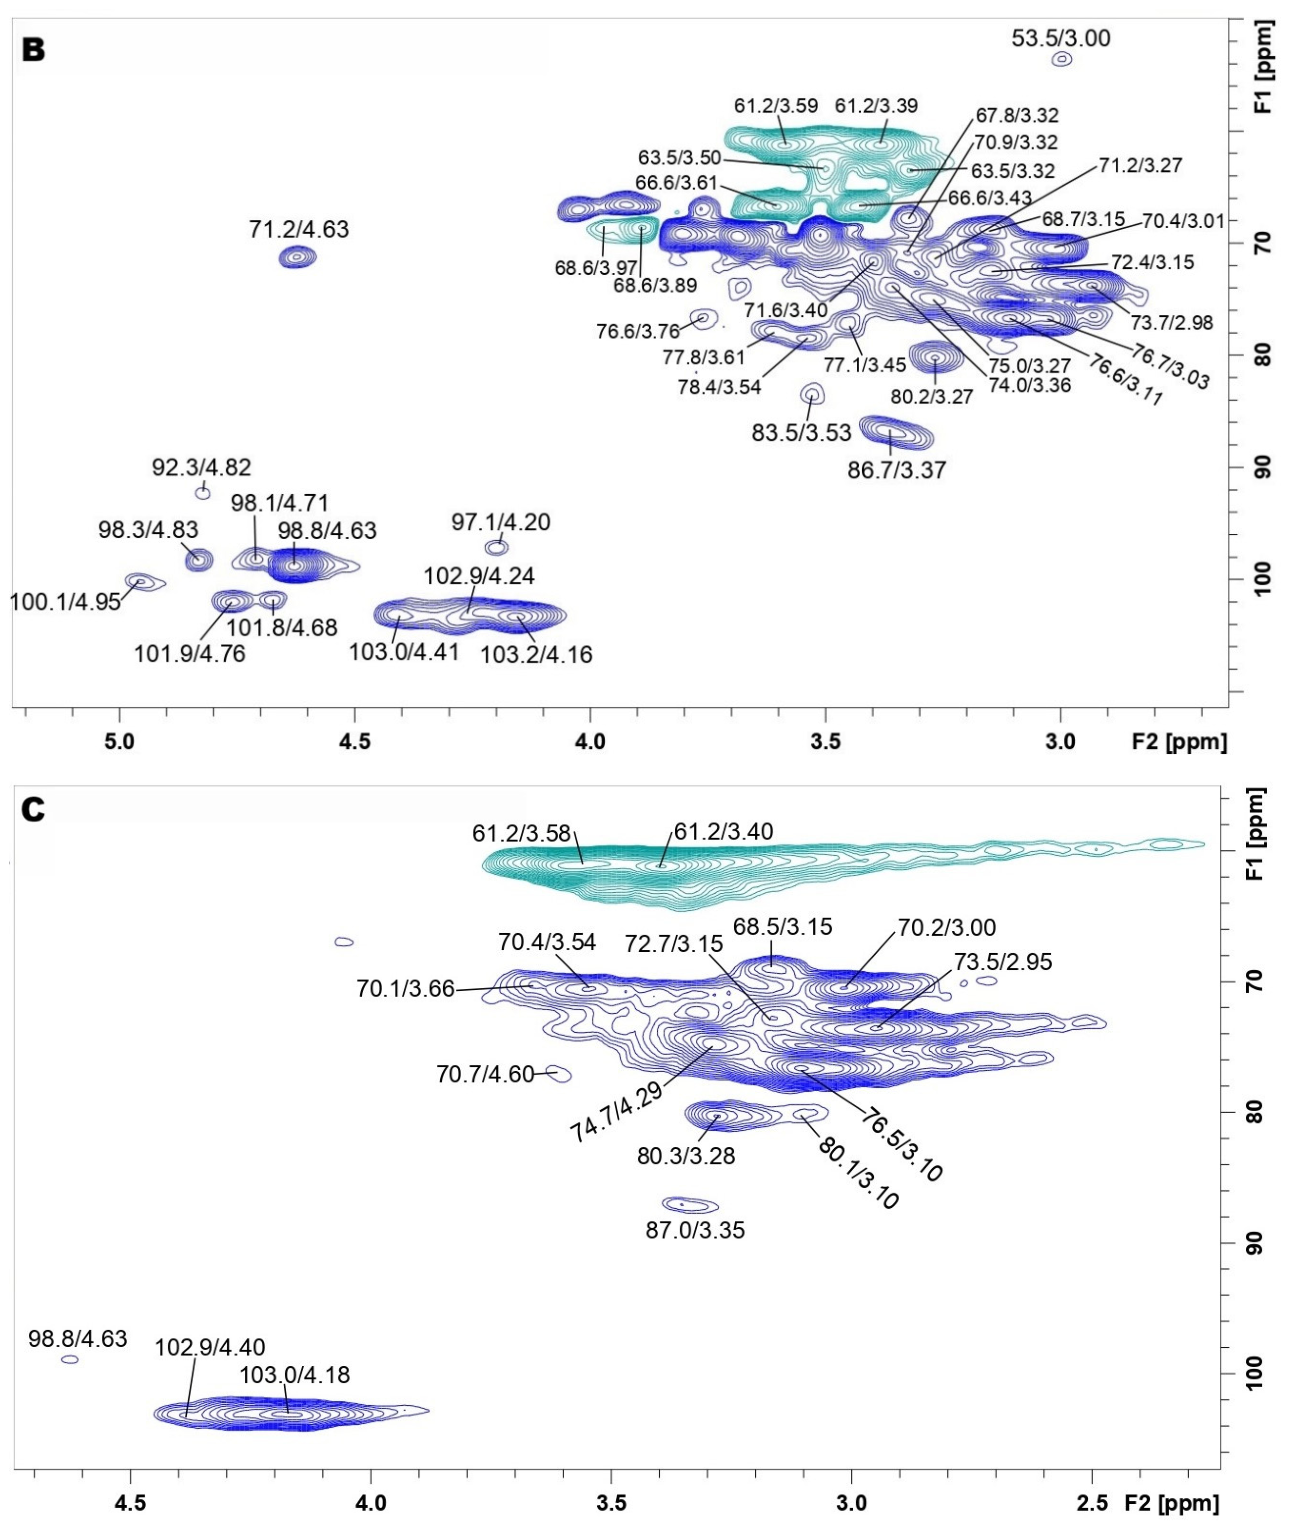
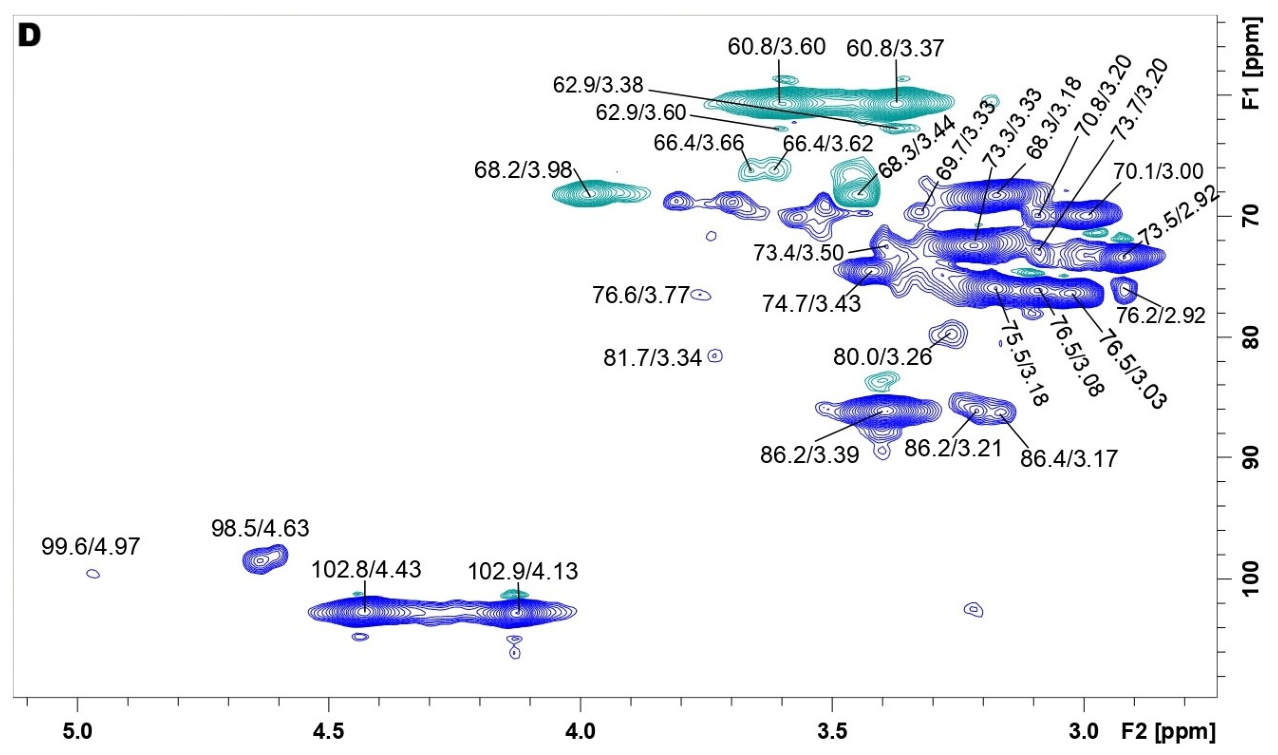
HSQC-DEPT spectra of G. lucidum extracts. Analyses were performed at 70 °C; samples were solubilized in Me2SO-d6. Spectra of GLP30 (A), GLP60 (B), GLP90 (C) and GLP75 (D). Blue signals represent positive phase correlations (CH and CH3 groups), while green signals correspond to negative phase correlations CH2 groups.
The GLP60 fraction spectrum (Figure 2B) showed more signals in the anomeric region, reflecting a broad compositional heterogeneity marked by the coexistence of distinct polysaccharide classes (β-D-glucans, α-D-glucans, and heteropolysaccharides containing galactose, mannose, arabinose, and uronic acids), in agreement with the monosaccharide profile (Table 2). This result is in accordance with the monosaccharide composition. Intense signals of C-1 of β-D-glucose units were observed at δ 103.0/4.41 and δ 103.2/4.16. Furthermore, signals of C-1 of α-D-galactose, β-D-mannose, and α-D-glucose were observed at δ 98.8/4.63; δ 101.9/4.76; and δ 100.1/4.95, respectively [8,25,26,30,31,32]. The signals at δ 86.7/3.37 indicate the O-substituted C-3 of β-D-glucose units, while the signals at δ 83.5/3.53 indicate the O-substituted C-3 of α-D-glucose units [27,28]. The inverted signals at δ 68.6/3.97 and 68.6/3.89 represent the O-substitution of C-6 of the β-D-glucose units, while the signals at δ 66.6/3.61 and 66.6/3.43 correspond to the O-substitution of C-6 of the α-D-galactose units [26,28,29]. Confirming the result observed by uronic acid determination (Table 2), anomeric signals, corresponding to methyl unesterified and esterified uronic acid (HexA) units, were observed at δ 98.3/4.83 and δ 98.1/4.71, respectively, while the C5/H5 signals appeared at δ 71.2/4.63 to unesterified HexA unit. The fraction GLP60 presents the signals of methyl group linked to methyl unesterified HexA units, at 53.5/3.00 [33,34,35,36]. Inverted signals at δ 63.5/3.50 and 63.5/3.32 were assigned to the C5/H5 correlations of arabinose units, as well in GLP30 [33,36,37,38,39,40]. Although the corresponding anomeric signals were detectable upon substantial spectral amplification, they were omitted from the current figure to maintain baseline clarity and avoid excessive signal-to-noise ratio. The other signals were attributed to the respective carbons/hydrogens and are described in Table 3. This fraction is mainly composed of β-D-glucans, α-D-glucans and heteropolysaccharides containing galactose, mannose, arabinose and uronic acid.
The GLP90 fraction spectrum (Figure 2C) showed signals indicating the presence of a linear β-D-glucan (1,3)-linked, which was confirmed by the signals at δ 103.0/4.18 and 87.0/3.35, corresponding to the β-D-(1→3)-linkage [26,31]. Lower intensity signals were observed at δ 98.8/4.63 at the anomeric region, indicating the presence of small amounts of α-D-galactose units, which was confirmed by the monosaccharide composition analysis [31,41,42,43,44]. The absence of C-6 substituted indicates that the main polysaccharide of this fraction is linear, being observed only non-substituted C-6 signals at δ 61.2/3.58 and 61.2/3.40 [19,29].
The GLP75 fraction (Figure 2D) exhibits two signals in the anomeric region at δ 102.8/4.43 and 102.9/4.13, which are attributed to the C-1 of β-D-glucose units. In addition, the signals at δ 99.6/4.97 and 98.6/4.64 indicate the presence of α-D-glucose and α-D-galactose units, respectively. The high intense signals at the region of C-3 O-substituted (δ 86.0/3.52; 86.3/3.40; 86.3/3.22; 86.4/3.17) indicates higher diversity of chemical environments for the β-(1→3)-linkages, such as backbone residues adjacent to O-6 branch points versus unbranched linear segments, in comparison to the other fractions. The inverted signals at δ 68.3/3.99 and 68.3/3.45 were assigned to the O-substituted C-6 positions of the β-D-glucose units, while the signals at δ 66.4/3.62 and 66.4/3.66 correspond to the O-substituted C-6 of the α-D-galactose units [8,31]. The other signals were attributed to the respective carbons/hydrogens and are described in Table 3.
Representative and hypothetical chemical structures for the predominant polysaccharide populations of each fraction, proposed based on monosaccharide composition and HSQC-DEPT NMR spectroscopic features, are provided in Figure S3 (Supplementary Materials).
Table 3.
1H and 13C NMR chemical shifts in the G. lucidum fractions.
3.3. Molecular Mass Distribution and Conformational Structure
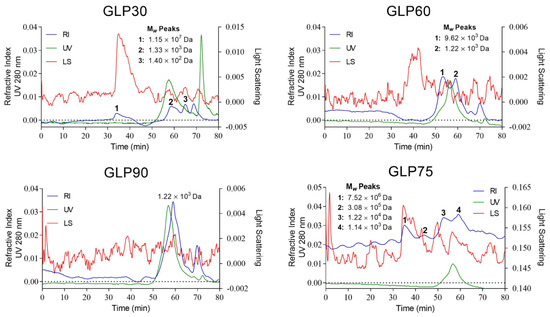
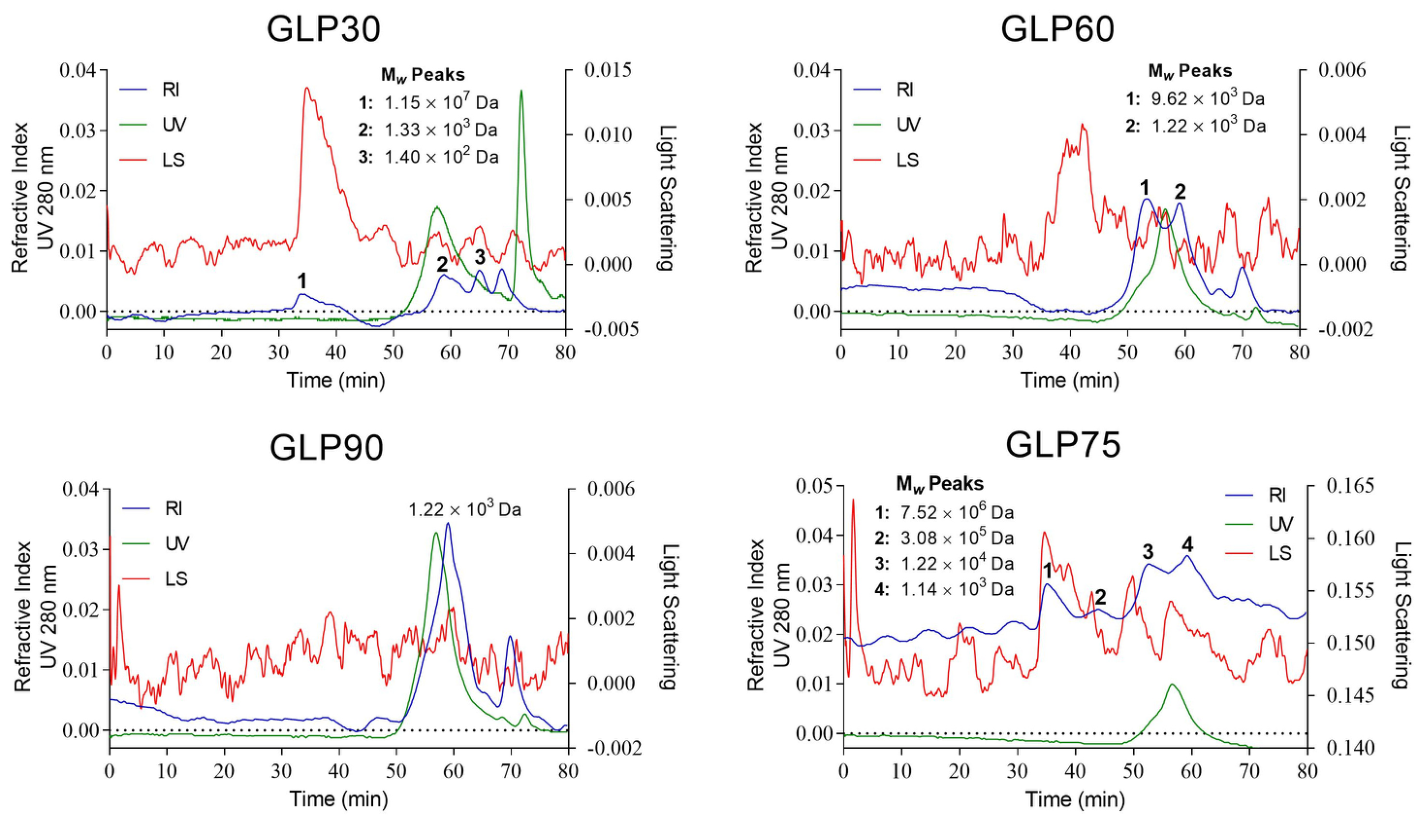
The molecular weight (Mw) distribution of the fractions was evaluated by High-Performance Size-Exclusion Chromatography (HPSEC). The resulting profiles (Figure 3) revealed considerable heterogeneity across all samples, with the refractive index (RI) detector highlighting complex mixtures of distinct molecular mass populations. The multi-angle laser light scattering (MALLS) detector confirmed the presence of high-Mw polysaccharides in fractions GLP30 and GLP75, with chromatographic populations ranging Mw values in the order of 105–107 Da (Figure 3). This finding aligns theoretically with their extraction protocols, as lower ethanol concentrations (e.g., 30%) and direct single-step precipitation (75%) preferentially precipitate larger, less soluble polymeric structures.
Figure 3.
Elution profiles of fractions GLP30, GLP60, GLP90, and GLP75 solubilized in 0.1 M NaNO3 as eluent, determined by HPSEC using refractive index detector (RI), light scattering (LS) and UV (280 nm) detector. The relative molecular weight of peaks in each sample was estimated by comparison with a curve of dextran patterns (2000, 266, 124, 72.2, 40.2, 9.4, and 5 kDa).
The sequential removal of these high-Mw polymers, followed by precipitation with 60% ethanol (GLP60), yielded a more soluble fraction characterized by prominent RI peaks at retention times of 50 and 60 min, with Mw values in the order of 103 Da (Figure 3). Subsequently, the fraction obtained at 90% ethanol (GLP90) exhibited a major RI peak at 60 min, corresponding to the same Mw molecules observed in GLP60, that remained soluble at lower alcohol concentrations. When compared to the single-step precipitation profile (GLP75), these chromatographic patterns clearly demonstrate that sequential ethanol precipitation successfully accomplished the partial fractionation and separation of polysaccharides based on their molecular weights.
G. lucidum polysaccharides were extracted and solubilized via autoclaving (1 atm, 121 °C, 20 min), a hydrothermal treatment known for its potential to alter macromolecular chains from an ordered triple-helix conformation to a flexible random coil. To investigate whether this thermal processing affected the structural integrity of the polymers, the macromolecular conformation of the four fractions was evaluated using the Congo red assay.
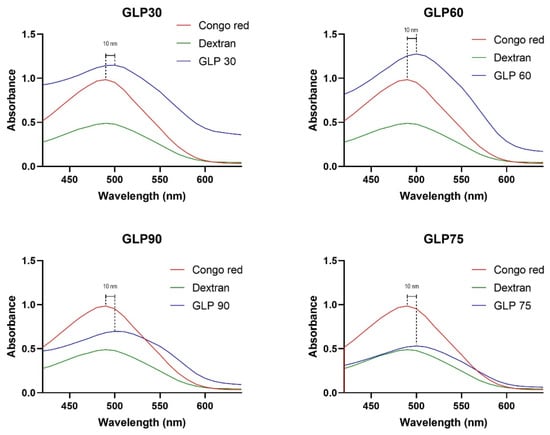
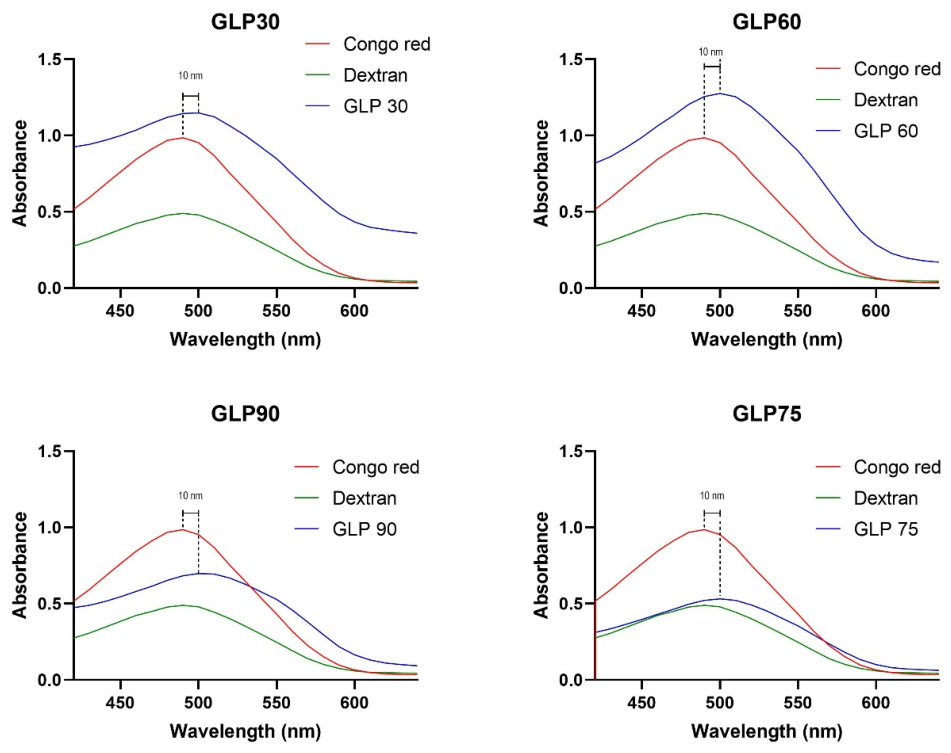
According to the mechanism described by Ogawa et al. (1972) [47], polysaccharides maintaining an ordered three-dimensional structure, specifically a triple-helix conformation, interact strongly with Congo red dye in dilute alkaline solutions (NaOH ≤ 0.15 M) through hydrophobic interactions and hydrogen bonding. The formation of this stable polymer–dye complex induces a characteristic bathochromic shift in the visible absorption maximum (λmax) of the dye.
Interestingly, all four fractions exhibited a distinct bathochromic shift of approximately 10 nm (Figure 4) at a dilute NaOH solution (0.05 M). This phenomenon is consistent with an ordered/triple-helical conformation, despite the samples having been subjected to high-temperature and high-pressure extraction.
Figure 4.
Absorption spectra of Congo red (control), dextran (random coil control) and fractions GLP30, GLP60, GLP90, and GLP75.
3.4. Rheological Behavior
Steady and dynamic rheological measurements were focused on GLP30 and GLP75 as these high-molecular-weight fractions exhibited measurable and reliable rheological responses under the experimental conditions currently used. In contrast, dispersions of lower-molecular-weight fractions (GLP60 and GLP90) displayed low-viscosity, near-Newtonian behavior that yielded torque signals near or below the instrument sensitivity threshold for dynamic oscillatory testing.
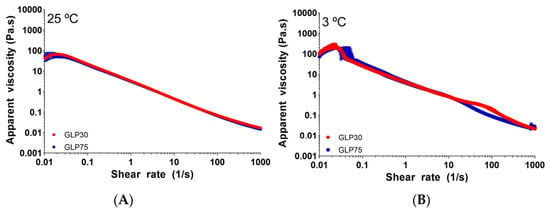
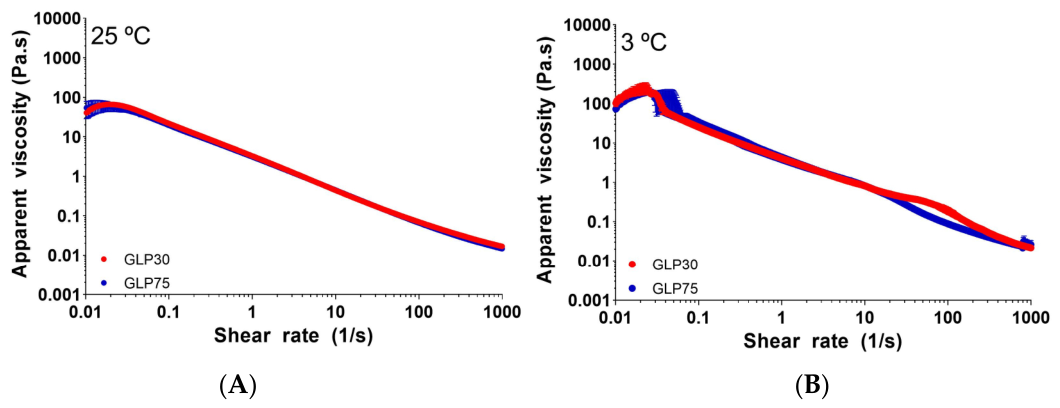
The dispersions of fractions GLP30 and GLP75 were evaluated at 25 °C and 3 °C at a concentration of 1% (w/w). Both samples exhibited non-Newtonian shear-thinning behavior, where apparent viscosity decreased as the shear rate increased (Figure 5). Temperature markedly influenced the flow curves of both fractions in a comparable manner, with apparent viscosity increasing as temperature decreased.
Figure 5.
Viscosity curve of the GLP30 and GLP75 fractions, at 1% (w/w). Samples were evaluated at 25 °C (A) and 3 °C (B).
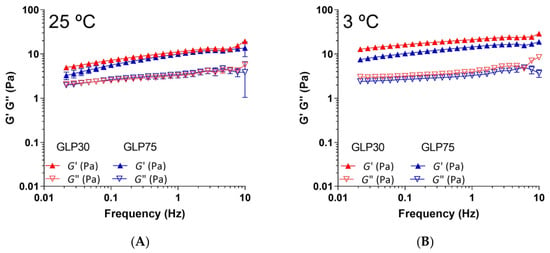
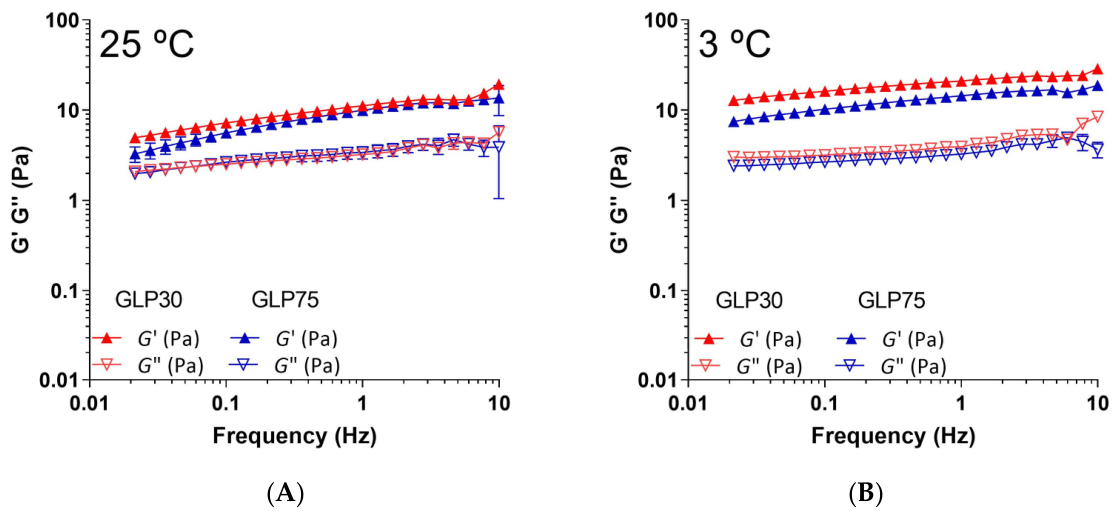
The frequency sweep allows us to analyze the viscoelastic behavior of the polysaccharide extracts. The GLP30 and GLP75 samples (at 1% w/w) showed similar gel-like behavior at both evaluated temperatures (Figure 6) with storage modulus (G′) higher than loss modulus (G″) throughout all the analyzed frequency range. As observed for viscosity, gel strength was higher at 3 °C than at 25 °C for both fractions, indicating a similar temperature-dependent behavior. Overall, the two fractions exhibited similar rheological behavior in the frequency sweep, consistent with the similar responses observed in the flow curves.
Figure 6.
Frequency sweep of the GLP30 and GLP75 fractions, at 1% (w/w). Samples were evaluated at 25 °C (A) and 3 °C (B).
Regarding the rheological parameters, no direct relationship was observed between the magnitude of the temperature dependence and the differences in molecular weight distribution, suggesting that these differences were not sufficient to produce distinct rheological responses, possibly because they did not substantially affect intermolecular interactions, chain overlap, and chain entanglement under the conditions evaluated.
3.5. Intrinsic Viscosity and Hydrodynamic Parameters
Intrinsic viscosity ([η]) provides critical insights into the hydrodynamic volume occupied by macromolecular chains in dilute solutions, a parameter fundamentally governed by the molecular weight (Mw) and spatial conformation of the polymer [10]. As summarized in Table 4, the [η] of the GLP30 fraction reached 39.45 dL/g. This value is notably higher than those previously documented for Ganoderma lucidum polysaccharides obtained at similar ethanol concentrations, such as 11.55 dL/g [47] and 12.79 dL/g [10]. While the extraction conditions across these studies were comparable, such discrepancies in macromolecular behavior are frequently driven by biotic and abiotic factors, including fungal strain variations, maturation stage, cultivation substrate, and environmental growth conditions.
Table 4.
Intrinsic viscosity measurements of fractions GLP30, GLP60, GLP90, and GLP75.
In contrast, the GLP60 and GLP90 fractions exhibited sharply reduced intrinsic viscosities of 1.51 and 1.38 dL/g, respectively. This marked decrease in [η] is consistent with the shift toward lower-molecular-weight populations observed in HPSEC profiles (Figure 3) which demonstrated that sequential precipitation effectively separated distinct molecular weight fractions. According to the Mark–Houwink–Sakurada relationship (), a reduction in chain length generally contributes to lower intrinsic viscosity [48]. However, this dramatic decrease cannot be attributed solely to molecular weight, as variations in chain conformation, hydration state, and supramolecular organization also play significant roles in governing the hydrodynamic resistance of these lower-molecular-weight fractions in solution.
An interesting observation was that rheological behavior and intrinsic viscosity of the glucan fractions were not directly related. Although both GLP30 and GLP75 exhibited similar apparent viscosity and viscoelastic profiles their intrinsic viscosities differed substantially, with values of 39.45 and 610.73 dL/g, respectively. Intrinsic viscosity reflects the hydrodynamic volume occupied by polymer chains in dilute solution, whereas rheological measurements reflect the behavior of macromolecules under concentrated conditions, where intermolecular interactions and chain entanglements become increasingly important. Consequently, substantial differences in dilute-solution properties may not necessarily be reflected in bulk rheological behavior [49]. Thus, the markedly higher intrinsic viscosity observed for GLP75 sample seems to be consistent with a larger effective hydrodynamic volume in solution. This behavior could be attributed to the presence of different populations of high-Mw polysaccharides in GLP75, which includes β-D- and α-D-glucans, and polysaccharides containing mannose and galactose.
Notably, the GLP75 that showed the highest intrinsic viscosity also exhibited a low Huggins coefficient (kH = 0.014) (Figure S2). In contrast, the GLP60 fraction exhibited an exceptionally high Huggins coefficient (kH = 1.84). In macromolecular physical chemistry, kH values above the typical range of 0.3–0.5 are generally associated with stronger polymer–polymer interactions and/or less favorable polymer–solvent interactions [50]. This elevated kH value for GLP60 is consistent with its distinct chemical composition, as GLP60 displays the greatest structural heterogeneity (including arabinose and inositol) and the highest content of uronic acids (5.8%). Since GLP60 contains ionizable carboxyl groups, its solution behavior may be influenced by the ionic environment, as electrostatic interactions can affect polymer chain conformation and intermolecular interactions. In addition, its heterogeneous composition and branched structure may contribute to distinct polymer–solvent and polymer–polymer interactions in aqueous solution, potentially favoring intermolecular association. Such interactions may increase the concentration dependence of the reduced viscosity and thus contribute to the elevated kH observed for GLP60.
Studies on fungal β-glucans have demonstrated that molecular conformation, supramolecular organization, and aggregation state can strongly influence intrinsic viscosity, hydrodynamic behavior and rheological properties, even when the polysaccharides possess similar chemical compositions [51,52]. Therefore, variations in chain architecture, molecular heterogeneity, hydration state, or supramolecular organization may contribute to the markedly distinct dilute-solution behavior observed between the samples.
Taken together, the physicochemical results obtained in the present study suggest that dilute-solution properties and bulk rheological behavior were partially decoupled. While intrinsic viscosity revealed pronounced differences in hydrodynamic behavior, the similar viscoelastic responses indicate that, at the concentrations employed for rheological measurements, network formation and intermolecular interactions likely dominate the macroscopic response, masking structural differences that become evident under dilute-solution conditions. It is noteworthy that phenolic components were detected as minor constituents in both GLP30 and GLP75 fractions. Although their specific contribution was not directly evaluated in the present study, previous reports have shown that phenolic compounds may participate in non-covalent interactions with fungal β-glucans, potentially affecting chain conformation, hydration, intermolecular association, and supramolecular organization. Consequently, the pronounced differences in intrinsic viscosity may not be exclusively related to the glucan backbone itself. The presence of associated phenolic and possibly proteinaceous moieties may represent an additional factor contributing to the effective hydrodynamic volume and supramolecular organization of these macromolecular assemblies in solution [23,53].
4. Conclusions
Serial ethanol precipitation effectively separated Ganoderma lucidum polysaccharides into distinct populations with tailored chemical, structural, and hydrodynamic profiles. While early stages (GLP30) and single-step precipitation (GLP75) yielded high-molecular-weight fractions enriched in α- and β-D-glucans, higher ethanol concentrations (GLP60 and GLP90) successfully isolated lower-molecular-weight heteropolysaccharides containing mannogalactans and uronic acids.
A key finding of this study is the partial decoupling between dilute-solution hydrodynamic behavior and bulk rheology. Although GLP30 and GLP75 displayed intrinsic viscosities differing by more than an order of magnitude, reflecting distinct single-chain hydrodynamic volumes and supramolecular associations, they exhibited strikingly similar macroscopic shear-thinning and weak-gel viscoelastic properties (G′ > G″).
These insights establish ethanol-gradient precipitation as a simple, controllable strategy to tailor the macromolecular architecture and physical functionality of G. lucidum polysaccharides without requiring harsh chemical modifications. By selectively tuning the precipitation threshold, specific fractions can be targeted for distinct applications: high-molecular-weight fractions (GLP30 and GLP75) are ideal as natural thickening, gelling, and stabilizing agents in food and pharmaceutical formulations, whereas lower-molecular-weight fractions (GLP60 and GLP90) offer low-viscosity profiles suitable for bioactivity-driven applications where high flowability is required.
Supplementary Materials
The following supporting information can be downloaded at https://www.mdpi.com/article/10.3390/macromol6040100/s1, Figure S1: HPSEC calibration curve of standard dextrans (5, 9.4, 40.2, 72.2, 124, 266, and 2000 kDa) used for the estimation of the relative weight-average molecular weight (Mw) of the Ganoderma lucidum polysaccharide fractions. Figure S2: Huggins plots of reduced viscosity (ηred) versus concentration for Ganoderma lucidum polysaccharide fractions (GLP30, GLP60, GLP75, and GLP90) in aqueous solution at 21 °C. Intrinsic viscosity ([η]) values were obtained by linear extrapolation to zero concentration (c → 0). Figure S3: Proposed representative structural units and structural features of the predominant polysaccharides in GLP fractions, based on monosaccharide composition and NMR spectral assignments (HSQC-DEPT experiments). GLP30 (A), GLP60 (B), GLP90 (C) and GLP75 (D).
Author Contributions
Conceptualization, M.K.I.F., L.M.C.C., F.F.S. and F.R.S.; Methodology, L.M.C.C., F.F.S. and F.R.S.; Validation, H.A., L.M.C.C. and F.F.S.; Formal Analysis, H.A., M.K.I.F., L.M.C.C. and F.F.S.; Investigation, M.K.I.F., A.C.V.d.A., A.L.d.S.d.S., D.M.D.G. and F.F.S.; Writing—Original Draft Preparation, H.A., M.K.I.F. and F.R.S.; Writing—Review & Editing, L.M.C.C., F.F.S. and F.R.S.; Supervision, F.R.S. and F.F.S.; Project Administration, F.R.S. and F.F.S.; Funding Acquisition, F.R.S. All authors have read and agreed to the published version of the manuscript.
Funding
This work was supported by Coordenação de Aperfeiçoamento de Pessoal de Nível Superior—Brasil (CAPES), Finance Code 001; the Instituto de Pesquisa Pelé Pequeno Príncipe (Brazil); the Fundação Araucária de Apoio ao Desenvolvimento Científico e Tecnológico do Paraná (FA); and the Conselho Nacional de Desenvolvimento Científico e Tecnológico (CNPq; Brazil; grant number: 306161/2024-9 to F.R.S). This research received partial financial support from a project approved by Conselho Estadual dos Direitos da Criança e do Adolescente (CEDCA), funded through tax incentive programs, via Fundo Estadual para Infância e Adolescência (FIA-PR), from Paraná, Brazil.
Institutional Review Board Statement
Not applicable.
Data Availability Statement
The original contributions presented in this study are included in the article/Supplementary Material. Further inquiries can be directed to the corresponding author.
Acknowledgments
The authors are grateful to Associação Hospitalar de Proteção à Infância Raul Carneiro—Hospital Pequeno Príncipe, for their support, and to the Center of Nuclear Magnetic Resonance of Federal University of Parana, Coordenação de Aperfeiçoamento de Pessoal de Nível Superior—Brasil (CAPES), Conselho Nacional de Desenvolvimento Científico e Tecnológico (CNPq), and Financiadora de Estudos e Projetos—Brasil (FINEP). During the preparation of this manuscript, the author(s) used ChatGPT (GPT-5.6 Luna, free web version) and Gemini (Gemini 3.5 Flash-Lite) for the purposes of text polishing, structural optimization, abstract drafting, and improvement in overall readability. The authors have reviewed and edited the output and take full responsibility for the content of this publication.
Conflicts of Interest
All the authors declare no conflicts of interest.
References
- Bishop, K.S.; Kao, C.H.J.; Xu, Y.; Glucina, M.P.; Paterson, R.R.M.; Ferguson, L.R. From 2000 Years of Ganoderma lucidum to Recent Developments in Nutraceuticals. Phytochemistry 2015, 114, 56–65. [Google Scholar] [CrossRef] [Scilit]
- He, J.; Han, X.; Luo, Z.L.; Li, E.X.; Tang, S.M.; Luo, H.M.; Niu, K.Y.; Su, X.J.; Li, S.H. Species Diversity of Ganoderma (Ganodermataceae, Polyporales) with Three New Species and a Key to Ganoderma in Yunnan Province, China. Front. Microbiol. 2022, 13, 1035434. [Google Scholar] [CrossRef] [Scilit]
- Seo, G.; Hyun, C.; Choi, S.; Kim, Y.M.; Cho, M. The Wound Healing Effect of Four Types of Beta-Glucan. Appl. Biol. Chem. 2019, 62, 20. [Google Scholar] [CrossRef] [Scilit]
- Galappaththi, M.C.A.; Patabendige, N.M.; Premarathne, B.M.; Hapuarachchi, K.K.; Tibpromma, S.; Dai, D.Q.; Suwannarach, N.; Rapior, S.; Karunarathna, S.C. A Review of Ganoderma Triterpenoids and Their Bioactivities. Biomolecules 2023, 13, 24. [Google Scholar] [CrossRef] [Scilit]
- Oludemi, T.; Barros, L.; Prieto, M.A.; Heleno, S.A.; Barreiro, M.F.; Ferreira, I.C.F.R. Extraction of Triterpenoids and Phenolic Compounds from: Ganoderma lucidum: Optimization Study Using the Response Surface Methodology. Food Funct. 2018, 9, 209–226. [Google Scholar] [CrossRef] [Scilit]
- Wang, C.; Liu, X.; Lian, C.; Ke, J.; Liu, J. Triterpenes and Aromatic Meroterpenoids with Antioxidant Activity and Neuroprotective Effects from Ganoderma lucidum. Molecules 2019, 24, 4353. [Google Scholar] [CrossRef] [Scilit]
- Cortina-Escribano, M.; Pihlava, J.M.; Miina, J.; Veteli, P.; Linnakoski, R.; Vanhanen, H. Effect of Strain, Wood Substrate and Cold Treatment on the Yield and β-Glucan Content of Ganoderma lucidum Fruiting Bodies. Molecules 2020, 25, 4732. [Google Scholar] [CrossRef] [Scilit]
- Milhorini, S.d.S.; Zavadinack, M.; dos Santos, J.F.; de Lara, E.L.; Smiderle, F.R.; Iacomini, M. Structural Variety of Glucans from Ganoderma lucidum Fruiting Bodies. Carbohydr. Res. 2024, 538, 109099. [Google Scholar] [CrossRef] [Scilit]
- Xu, J.; Yue, R.Q.; Liu, J.; Ho, H.M.; Yi, T.; Chen, H.B.; Han, Q. Bin Structural Diversity Requires Individual Optimization of Ethanol Concentration in Polysaccharide Precipitation. Int. J. Biol. Macromol. 2014, 67, 205–209. [Google Scholar] [CrossRef] [Scilit]
- Liu, Y.; Zhang, J.; Tang, Q.; Yang, Y.; Xia, Y.; Zhou, S.; Wu, D.; Zhang, Z.; Dong, L.; Cui, S.W. Rheological Properties of β-d-Glucan from the Fruiting Bodies of Ganoderma lucidum. Food Hydrocoll. 2016, 58, 120–125. [Google Scholar] [CrossRef] [Scilit]
- Filisetti-Cozzi, T.M.; Carpita, N.C. Measurement of Uranic Acids without Interference from Neutral Sugars. Anal. Biochem. 1991, 197, 157–162. [Google Scholar] [CrossRef] [Scilit]
- Melton, L.D.; Smith, B.G. Determination of the Uronic Acid Content of Plant Cell Walls Using a Colorimetric Assay. In Current Protocols in Food Analytical Chemistry; Wrolstad, R.E., Ed.; John Wiley & Sons, Inc.: New York, NY, USA, 2001; pp. E3.3.1–E3.3.4. [Google Scholar]
- El, A.; Ahmed, R.; Labavitch, J.M. A Simplified Method for Accurate Determination of Cell Wall Uronide Content. J. Food Biochem. 1977, 1, 361–365. [Google Scholar] [CrossRef] [Scilit]
- Dubois, M.; Gilles, K.A.; Hamilton, J.K.; Rebers, P.A.; Smith, F. Colorimetric Method for Determination of Sugars and Related Substances. Anal. Chem. 1956, 28, 350–356. [Google Scholar] [CrossRef] [Scilit]
- Bradford, M.M. A Rapid and Sensitive Method for the Quantitation of Microgram Quantities of Protein Utilizing the Principle of Protein-Dye Binding. Anal. Biochem. 1976, 72, 248–254. [Google Scholar] [CrossRef]
- Ainsworth, E.A.; Gillespie, K.M. Estimation of Total Phenolic Content and Other Oxidation Substrates in Plant Tissues Using Folin-Ciocalteu Reagent. Nat. Protoc. 2007, 2, 875–877. [Google Scholar] [CrossRef] [Scilit]
- Pedrosa, A.M.; de Castro, W.V.; Castro, A.H.F.; Duarte-Almeida, J.M. Validated Spectrophotometric Method for Quantification of Total Triterpenes in Plant Matrices. DARU J. Pharm. Sci. 2020, 28, 281–286. [Google Scholar] [CrossRef] [Scilit]
- Palacios, I.; García-Lafuente, A.; Guillamón, E.; Villares, A. Novel isolation of water-soluble polysaccharides from the fruiting bodies of Pleurotus ostreatus mushrooms. Carbohydr. Res. 2012, 358, 72–77. [Google Scholar] [CrossRef] [Scilit]
- dos Santos, J.F.; de Oliveira, N.M.T.; da Silva Milhorini, S.; Rutckeviski, R.; Iacomini, M.; de Souza, L.M.; Simas, F.F.; Maria-Ferreira, D.; Smiderle, F.R. The Use of Pleurotus ostreatus By-Products for the Preparation of a Gel-like Polysaccharide with Bioactive Properties. Int. J. Biol. Macromol. 2025, 301, 140236. [Google Scholar] [CrossRef] [Scilit]
- Zhang, H.; Zhang, J.; Liu, Y.; Tang, C. Recent Advances in the Preparation, Structure, and Biological Activities of β-Glucan from Ganoderma Species: A Review. Foods 2023, 12, 2975. [Google Scholar] [CrossRef] [Scilit]
- Nie, S.; Zhang, H.; Li, W.; Xie, M. Current Development of Polysaccharides from Ganoderma: Isolation, Structure and Bioactivities. Bioact. Carbohydr. Diet. Fibre 2013, 1, 10–20. [Google Scholar] [CrossRef] [Scilit]
- Ghosh, K.; Takahashi, D.; Kotake, T. Plant Type II Arabinogalactan: Structural Features and Modification to Increase Functionality. Carbohydr. Res. 2023, 529, 108828. [Google Scholar] [CrossRef] [Scilit]
- Fang, X.H.; Zou, M.Y.; Chen, F.Q.; Ni, H.; Nie, S.P.; Yin, J.Y. An Overview on Interactions between Natural Product-Derived β-Glucan and Small-Molecule Compounds. Carbohydr. Polym. 2021, 261, 117850. [Google Scholar] [CrossRef] [Scilit]
- Long, Z.; Zhang, J.; Li, L.; Chai, X.; Gong, Z.; Lu, Y.; Lyu, H.N.; Shen, S. Sporoderm Disruption Reshapes the Chemical Characteristics and Enhances the Mitochondrial Protective Activity of Ganoderma lucidum Spore Polysaccharides via SIRT1/AMPK Signaling. Int. J. Mol. Sci. 2026, 27, 4741. [Google Scholar] [CrossRef] [Scilit]
- de Jesus, L.I.; Smiderle, F.R.; Cordeiro, L.M.C.; de Freitas, R.A.; Van Griensven, L.J.L.D.; Iacomini, M. Simple and Effective Purification Approach to Dissociate Mixed Water-Insoluble α- and β-D-Glucans and Its Application on the Medicinal Mushroom Fomitopsis betulina. Carbohydr. Polym. 2018, 200, 353–360. [Google Scholar] [CrossRef] [Scilit]
- Morales, D.; Rutckeviski, R.; Villalva, M.; Abreu, H.; Soler-Rivas, C.; Santoyo, S.; Iacomini, M.; Smiderle, F.R. Isolation and Comparison of α- and β-D-Glucans from Shiitake Mushrooms (Lentinula edodes) with Different Biological Activities. Carbohydr. Polym. 2020, 229, 115521. [Google Scholar] [CrossRef] [Scilit]
- Zavadinack, M.; Cantu-Jungles, T.M.; Abreu, H.; Ozturk, O.K.; Cordeiro, L.M.C.; de Freitas, R.A.; Hamaker, B.R.; Iacomini, M. (1 → 3),(1 → 6) and (1 → 3)-β-D-Glucan Physico-Chemical Features Drive Their Fermentation Profile by the Human Gut Microbiota. Carbohydr. Polym. 2024, 327, 121678. [Google Scholar] [CrossRef] [Scilit]
- Abreu, H.; Simas, F.F.; Smiderle, F.R.; Sovrani, V.; Dallazen, J.L.; Maria-Ferreira, D.; Werner, M.F.; Cordeiro, L.M.C.; Iacomini, M. Gelling Functional Property, Anti-Inflammatory and Antinociceptive Bioactivities of β-D-Glucan from the Edible Mushroom Pholiota nameko. Int. J. Biol. Macromol. 2019, 122, 1128–1135. [Google Scholar] [CrossRef] [Scilit]
- Smiderle, F.R.; Alquini, G.; Tadra-Sfeir, M.Z.; Iacomini, M.; Wichers, H.J.; Van Griensven, L.J.L.D. Agaricus bisporus and Agaricus brasiliensis (1 → 6)-β-d-Glucans Show Immunostimulatory Activity on Human THP-1 Derived Macrophages. Carbohydr. Polym. 2013, 94, 91–99. [Google Scholar] [CrossRef] [Scilit]
- Zavadinack, M.; de Lima Bellan, D.; da Rocha Bertage, J.L.; da Silva Milhorini, S.; da Silva Trindade, E.; Simas, F.F.; Sassaki, G.L.; Cordeiro, L.M.C.; Iacomini, M. An α-D-Galactan and a β-D-Glucan from the Mushroom Amanita muscaria: Structural Characterization and Antitumor Activity against Melanoma. Carbohydr. Polym. 2021, 274, 118647. [Google Scholar] [CrossRef] [Scilit]
- Abreu, H.; Zavadinack, M.; Smiderle, F.R.; Cipriani, T.R.; Cordeiro, L.M.C.; Iacomini, M. Polysaccharides from Pleurotus eryngii: Selective Extraction Methodologies and Their Modulatory Effects on THP-1 Macrophages. Carbohydr. Polym. 2021, 252, 117177. [Google Scholar] [CrossRef] [Scilit]
- Do Nascimento, G.E.; Corso, C.R.; De Paula Werner, M.F.; Baggio, C.H.; Iacomini, M.; Cordeiro, L.M.C. Structure of an Arabinogalactan from the Edible Tropical Fruit Tamarillo (Solanum betaceum) and Its Antinociceptive Activity. Carbohydr. Polym. 2015, 116, 300–306. [Google Scholar] [CrossRef] [Scilit]
- Lopes Leivas, C.; Moro Cantu-Jungles, T.; Barbosa da Luz, B.; Fernanda de Paula Werner, M.; Iacomini, M.; Cordeiro, L.M.C. Investigation of the Chemical Structure and Analgesic and Anti-Inflammatory Properties of Polysaccharides That Constitute the Dietary Fibers of Soursop (Annona muricata) Fruit. Food Res. Int. 2023, 166, 112588. [Google Scholar] [CrossRef] [Scilit]
- Baal, S.C.S.; Bialli, A.P.; Angeli, R.F.; Fernandes, L.C.; Naliwaiko, K.; Cordeiro, L.M.C.; Appel, M.H.; Iagher, F. Pectic Polysaccharides from Açaí (Euterpe oleracea) Show Antitumoral Effects on Melanoma Cell Line. Bioact. Carbohydr. Diet. Fibre 2026, 35, 100520. [Google Scholar] [CrossRef] [Scilit]
- da Silva, A.P.; Iacomini, M.; Cordeiro, L.M.C. Structural Diversity of Polysaccharides from Soluble Dietary Fibers and Seed Mucilage of Juá (Ziziphus joazeiro) Fruit Pulp. Food Res. Int. 2025, 222, 117707. [Google Scholar] [CrossRef] [Scilit]
- Shakhmatov, E.G.; Toukach, P.V.; Michailowa, E.A.; Makarova, E.N. Structural Studies of Arabinan-Rich Pectic Polysaccharides from Abies sibirica L. Biological Activity of Pectins of A. sibirica. Carbohydr. Polym. 2014, 113, 515–524. [Google Scholar] [CrossRef] [Scilit]
- Klaus Bock, B.; Pedersen, C. Carbon-13 nuclear magnetic resonance spectroscopy of monosaccharides. In Advances in Carbohydrate Chemistry and Biochemistry; Tipson, R.S., Horton, D., Eds.; Academic Press: Cambridge, MA, USA, 1983; Volume 41, pp. 27–66. [Google Scholar]
- Kang, J.; Cui, S.W.; Phillips, G.O.; Chen, J.; Guo, Q.; Wang, Q. New Studies on Gum Ghatti (Anogeissus latifolia) Part III: Structure Characterization of a Globular Polysaccharide Fraction by 1D, 2D NMR Spectroscopy and Methylation Analysis. Food Hydrocoll. 2011, 25, 1999–2007. [Google Scholar] [CrossRef] [Scilit]
- Ji, X.; Zhang, F.; Zhang, R.; Liu, F.; Peng, Q.; Wang, M. An Acidic Polysaccharide from Ziziphus jujuba cv. Muzao: Purification and Structural Characterization. Food Chem. 2019, 274, 494–499. [Google Scholar] [CrossRef] [Scilit]
- Gorin, P.A.J.; Mazurek, M. Further Studies on the Assignment of Signals in 13C Magnetic Resonance of Aldoses and Derived Methyl Glycosides. Can. J. Chem. 1975, 53, 1212–1223. [Google Scholar] [CrossRef] [Scilit]
- dos Santos, J.F.; Sauruk da Silva, K.; Iacomini, M.; Smiderle, F.R.; Maria-Ferreira, D. Optimized Extraction of Medicinal Mushroom Polysaccharides and Their Protective Effects Against 5-Fluorouracil-Induced Gastrointestinal Mucositis. Pharmaceuticals 2026, 19, 946. [Google Scholar] [CrossRef] [Scilit]
- Abreu, H.; Smiderle, F.R.; Sassaki, G.L.; Sovrani, V.; Cordeiro, L.M.C.; Iacomini, M. Naturally Methylated Mannogalactans from the Edible Mushrooms Pholiota nameko and Pleurotus eryngii. J. Food Compos. Anal. 2021, 102, 103985. [Google Scholar] [CrossRef] [Scilit]
- Carbonero, E.R.; Cordeiro, L.M.C.; Mellinger, C.G.; Sassaki, G.L.; Stocker-Wörgötter, E.; Gorin, P.A.J.; Iacomini, M. Galactomannans with Novel Structures from the Lichen Roccella decipiens Darb. Carbohydr. Res. 2005, 340, 1699–1705. [Google Scholar] [CrossRef] [Scilit]
- Zavadinack, M.; de Lima Bellan, D.; Fernandes Bonaldi, M.P.; da Silva Milhorini, S.; Cordeiro, L.M.C.; Fogagnoli Simas, F.; Iacomini, M. Polysaccharide Fractions Extracted from Lactarius quieticolor Mushroom Exhibit Immune Stimulatory Activities on Macrophages. Food Res. Int. 2024, 197, 115205. [Google Scholar] [CrossRef] [Scilit]
- Nascimento, A.M.; Maria-Ferreira, D.; de Souza, E.F.J.; de Souza, L.M.; Sassaki, G.L.; Iacomini, M.; Maria, M.F.; Cipriani, T.R. Gastroprotective Effect and Chemical Characterization of a Polysaccharide Fraction from Leaves of Croton Cajucara. Int. J. Biol. Macromol. 2017, 95, 153–159. [Google Scholar] [CrossRef] [Scilit]
- Synytsya, A.; Novak, M. Structural Analysis of Glucans. Ann. Transl. Med. 2014, 2, 17. [Google Scholar] [CrossRef] [Scilit]
- Ogawa, K.; Tsurugi, J.; Watanabe, T. Complex of gel-forming β-1,3- d -glucan with Congored in alkaline solution. Chem. Lett. 1972, 1, 689–692. [Google Scholar] [CrossRef] [Scilit]
- Kasaai, M.R.; Arul, J.; Charlet, G. Intrinsic Viscosity-Molecular Weight Relationship for Chitosan. J. Polym. Sci. B Polym. Phys. 2000, 38, 2591–2598. [Google Scholar] [CrossRef] [Scilit]
- Morris, E.R.; Cutler, A.N.; Ross-Murphy, S.B.; Rees, D.A.; Price, J. Concentration and Shear Rate Dependence of Viscosity in Random Coil Polysaccharide Solutions. Carbohydr. Polym. 1981, 1, 5–21. [Google Scholar] [CrossRef] [Scilit]
- Muthukumar, M.; Freed, K.F. Huggins Coefficient for Polymer Solutions with Excluded Volume. Macromolecules 1977, 10, 899–906. [Google Scholar] [CrossRef] [Scilit]
- Fariña, J.I.; Siñeriz, F.; Molina, O.E.; Perotti, N.I. Isolation and Physicochemical Characterization of Soluble Scleroglucan from Sclerotium rolfsii. Rheological Properties, Molecular Weight and Conformational Characteristics. Carbohydr. Polym. 2001, 44, 41–50. [Google Scholar] [CrossRef] [Scilit]
- Zhang, L.; Li, X.; Zhou, Q.; Zhang, X.; Chen, R. Transition from Triple Helix to Coil of Lentinan in Solution Measured by Sec, Viscometry, and 13c Nmr. Polym. J. 2002, 34, 443–449. [Google Scholar] [CrossRef] [Scilit]
- Wang, Y.; Liu, J.; Chen, F.; Zhao, G. Effects of Molecular Structure of Polyphenols on Their Noncovalent Interactions with Oat β-Glucan. J. Agric. Food Chem. 2013, 61, 4533–4538. [Google Scholar] [CrossRef] [Scilit]

Disclaimer/Publisher’s Note: The statements, opinions and data contained in all publications are solely those of the individual author(s) and contributor(s) and not of MDPI and/or the editor(s). MDPI and/or the editor(s) disclaim responsibility for any injury to people or property resulting from any ideas, methods, instructions or products referred to in the content. |
© 2026 by the authors. Licensee MDPI, Basel, Switzerland. This article is an open access article distributed under the terms and conditions of the Creative Commons Attribution (CC BY) license.