


Simple Summary
The White Stork is one of the most recognizable migratory birds in Europe and Asia, yet the genetics of populations breeding in the South Caucasus—including Armenia—have never been studied. Understanding how genetically connected these populations are to storks elsewhere in Eurasia helps reveal whether they form an isolated group or are part of a larger, shared population. In this study, we collected blood feather samples from White Storks breeding across three regions of Armenia and analyzed their DNA using mitochondrial and nuclear genetic markers. We found that Armenian White Storks are genetically diverse and show no significant genetic separation from European populations, despite using different migratory routes and wintering in different areas—Armenian storks winter mainly in the Mesopotamian region, while most European storks winter in Africa. This suggests that gene flow between distant breeding populations is extensive enough to prevent genetic isolation. At the same time, patterns in the genetic data hint at a complex demographic history, possibly reflecting ancient processes of population separation and mixing during the ice ages. Our findings provide the first genetic baseline for White Storks in this region and highlight the South Caucasus as an important area for future research.
Abstract
Understanding how historical climatic oscillations and contemporary dispersal interact to shape genetic diversity is central to interpreting population structure in long-distance migratory birds. The White Stork (Ciconia ciconia) has a broad trans-Eurasian distribution, yet populations from the Caucasus region remain underrepresented in population genetic studies. Here, we investigate mitochondrial and nuclear genetic variation in breeding populations from Armenia, a region located at the junction of Europe and Southwest Asia. We analyzed sequence variation in the mitochondrial control region and COI gene together with a nuclear intron (SPIN) from 102 individuals sampled across northern, central, and southern Armenia and integrated these data with publicly available Eurasian sequences. Genetic diversity indices, haplotype networks, mismatch distributions, and hierarchical analyses of molecular variance were used to evaluate spatial genetic structure and demographic history. Armenian populations exhibited high mitochondrial haplotype diversity but heterogeneous nucleotide diversity, consistent with complex demographic histories. AMOVA revealed no significant genetic differentiation among Armenian populations (FST = 0.019, p = 0.226) or between Armenia and Europe (FCT = −0.021, p = 0.754), indicating that Armenian breeding populations form part of a single, well-connected Western Palearctic mitochondrial gene pool. Mismatch distributions revealed a consistent secondary peak across all three populations, suggesting demographic complexity that may reflect the retention of older mitochondrial lineage diversity, though this interpretation remains tentative given the limited discriminatory power of mismatch analyses alone and requires confirmation through expanded sampling and complete mitogenome sequencing. These results indicate that Armenian White Stork populations are genetically diverse and well-connected to the broader Western Palearctic population, while also carrying signatures of a complex demographic history potentially shaped by Pleistocene lineage divergence and post-glacial admixture. Our findings provide a regional genetic baseline for an understudied part of the species’ range and highlight the South Caucasus as a candidate area for future genomic studies integrating complete mitogenomes and genome-wide nuclear markers.
1. Introduction
Reconstructing the relative contributions of historical climatic cycles and contemporary gene flow to genetic diversity and population structure is a central goal of avian phylogeography, particularly in wide-ranging migratory species whose high dispersal capacity complicates straightforward interpretation of geographic genetic patterns [1,2]. Pleistocene glacial oscillations have left lasting imprints on the genetic architecture of many bird species, yet in highly mobile taxa, ongoing dispersal can simultaneously homogenize regional populations while preserving signatures of older divergence at broader biogeographic scales [1,3,4,5,6].
The White Stork (Ciconia ciconia) is an emblematic long-distance migrant with a broad trans-Eurasian distribution and an excellent model for examining the interplay between historical and contemporary processes shaping population genetic structure (Figure 1) [7,8,9,10]. The species breeds across a vast area extending from Western and Central Europe through Eastern Europe, the Caucasus region and the Armenian Highland, to Central Asia and western China [11,12,13,14]. Two subspecies are generally recognized: C. c. ciconia, distributed across Europe and the Caucasus region, and C. c. asiatica, occurring in Central Asia and western China [13,15]. In winter, White Storks occupy a broad area encompassing sub-Saharan Africa, the Middle East, Mesopotamia, and parts of South Asia, and increasingly individuals remain closer to or within their traditional breeding range during winter in Europe [10,11,12,16,17,18,19,20]. Migration occurs along several major flyways, including a western route via the Iberian Peninsula and Gibraltar, an eastern route via the Balkans and the Levant to eastern Africa and Arabia, and Central Asian routes linking breeding areas in Kazakhstan and western China with wintering grounds in South Asia and the Middle East [7,8,11,21].
Figure 1.
White storks (Ciconia ciconia) on the nest. Armenia, 2023. © Lusine Aghajanyan/NABU Armenia.
White Storks are characterized by high mobility, long natal and breeding dispersal distances, and only moderate philopatry, traits expected to promote genetic connectivity across large spatial scales [8,21,22,23]. At the same time, the existence of distinct migratory flyways, subspecies ranges, and potential historical refugia raises the possibility that deep phylogeographic structure and lineage divergence have been retained despite contemporary genetic connectivity [1,2,4,5,21]. Previous genetic studies, focused mainly on European populations, have generally reported high genetic diversity and weak differentiation among breeding areas, even across different flyways, consistent with extensive connectivity [6,21]. At broader spatial scales, evidence for continental-scale differentiation has been inconsistent, but the persistence of divergent mitochondrial lineages within otherwise weakly structured populations has been more widely reported, suggesting that historical processes associated with Pleistocene climatic cycles can leave detectable signatures even where contemporary gene flow maintains overall connectivity [1,4,5,6]. In contrast, the eastern part of the species’ range, including the South Caucasus and adjacent regions of Southwest and Central Asia, has remained poorly represented in population-genetic datasets [6].
Armenia occupies a central position within the Armenian Highland and the South Caucasus, and lies close to the putative transition zone between the ranges of C. c. ciconia and C. c. asiatica [11,13,15]. It is traversed by major migratory routes connecting Europe, the Middle East, and Central Asia and encompasses pronounced environmental heterogeneity within a relatively small geographic area [24,25]. From a phylogeographic perspective, Armenian breeding populations occupy a key position within a region shaped by complex Pleistocene climatic history and intersecting migratory flyways, making it an informative system for examining how historical isolation, post-glacial range dynamics, and contemporary dispersal interact to shape genetic diversity and population structure [1,4,6].
In this study, we investigate mitochondrial and nuclear genetic variation in White Storks breeding in Armenia to address three main objectives. First, we assess levels and spatial distribution of genetic diversity to determine whether populations across northern, central, and southern Armenia share a common demographic history or show evidence of regional heterogeneity, as expected under scenarios of range expansion, secondary contact, or long-term population persistence [1,3,4]. Second, we evaluate population structure at multiple spatial scales, testing for fine-scale subdivision within Armenia and for broader differentiation relative to other parts of the species’ Western Palearctic range, following approaches widely applied in phylogeographic studies of migratory birds [6,21,26,27]. Third, we reconstruct demographic history using mismatch distribution analyses to test whether Armenian populations carry signatures of Pleistocene refugial divergence and secondary contact, specifically examining whether the coexistence of deeply divergent mitochondrial lineages reflects historical isolation followed by post-glacial admixture [1,2,4,5].
2. Materials and Methods
2.1. Blood Sampling
Samples were collected throughout the breeding range of the White Stork in Armenia and were grouped into three regional breeding populations based on geographic location and the spatial distribution of nesting pairs recorded in the national electronic monitoring database, which is updated annually [28]. In total, 102 individuals were analyzed, including a central breeding population from the Ararat and Armavir regions (n = 75), a northwestern population from the Lori and Shirak regions (n = 18), and a southern population from the Vayots Dzor region (n = 9) (Figure 2). Sampling effort was approximately proportional to regional population size, representing roughly 2.9% of the central (2553 nesting pairs), 3.5% of the northwestern (514 nesting pairs), and 15.8% of the southern breeding population (57 nesting pairs), based on annual nest monitoring data from the electronic database [28]. The relatively small absolute sample size from the southern region therefore reflects the small size of that breeding population rather than limited sampling effort. All sampled birds were fledglings between 4 and 7 weeks of age.
Figure 2.
Sampling sites and geographic locations of three populations of White Stork in Armenia.
Sampling was conducted in June 2024, and all sampled birds were ringed. A mobile elevating work platform was used to access the nests, and no electricity shut-offs were required during fieldwork. Variation in sampling numbers among regions reflected both differences in local population size and nest accessibility, which depended on whether nests were situated on power line structures (with the specific power line structure type also being a determining factor) or trees. No sampling was conducted from nests situated on house roofs, sculptures, high-voltage power lines, or other inaccessible infrastructures.
The following information was recorded at each sampling location: sample ID, date, region, village, number of fledglings in the nest, health condition, approximate age (±7 days), contamination status, ring number, and geographic coordinates. Details of the sampled individuals are provided in Table S1. All procedures were conducted under the permits issued by the Ministry of Environment of the Republic of Armenia (permit number 3/29.7/1684 given to the Scientific Center of Zoology and Hydroecology on 15 February 2024). Blood feathers (pin feathers) were collected from each bird as DNA material. To minimize disturbance and avoid any risk of impairing flight, we did not remove blood feathers from the wings or tail and collected only developing feathers from the chest area. Sampling was deliberately restricted to fledglings, with one individual sampled per nest, in order to minimize the inclusion of close relatives and to avoid pseudoreplication arising from sampling siblings. This strategy increases the independence of samples and helps improve the reliability of population-level genetic inferences. Samples were immediately preserved in 96% ethanol in 2 mL tubes and stored at ambient temperature until transfer to the laboratory, where they were kept at −20 °C until DNA extraction [29].
2.2. DNA Extraction, PCR and Sequencing
Genomic DNA was extracted from growing feather samples using the BioFACT DNA Extraction Kit (BioFACT Co., Ltd., Daejeon, Republic of Korea; cat. no. GD141-100) according to the manufacturer’s protocol.
Of the 102 sampled individuals, sequences of sufficient quality were obtained for 90 individuals (northwestern n = 15, central n = 66, southern n = 9) across all three markers (D-loop, COI, and SPIN intron); the remaining 12 samples were excluded due to PCR amplification failure or low sequencing quality for at least one marker.
To study the Armenian populations of the White Stork, we used two mitochondrial markers (373 bp fragment of the mitochondrial control region and 658 bp mitochondrial cytochrome c oxidase subunit I gene) and one nuclear marker, SPIN1 Z-linked intron (990 bp) [21,30,31]. SPIN intron represents a sex-linked locus with a reduced effective population size and male-biased transmission in a female-heterogametic bird.
For the control region, we used a set of primers: CR57F (5′ GGG AAA TGT ACT AGC TGA CTG 3′) and CR465R (5′ CCT GTA CAG ACC CAA ACC ATA G 3′). The PCR cycles were as follows: denaturation for 1 min 30 s at 95 °C, followed by 50 cycles of 94 °C for 45 s, 55 °C to 60 °C for 45 s, 72 °C for 45 s, with a final extension of 72 °C for 10 min [21].
Partial sequences of the cytochrome c oxidase subunit I (COI) were amplified via polymerase chain reaction (PCR), employing the primer pairs LCOI490-JJ 5′-GGTCAACAAATCATAAAGATATTGG and HCO2198-JJ 5′-TAAACTTCAGGGTGACCAAAAAATCA [30]. The thermal conditions comprised initial denaturation at 95 °C for 1 min, followed by the first cycle set (15 cycles) of 94 °C for 30 s, annealing at 55 °C for 1 min (decreasing by 1 °C per cycle) and extension at 72 °C for 1 min and 30 s. The second cycle set (25 cycles) involved steps of 94 °C for 35 s, 45 °C for 1 min, and 72 °C for 1 min and 30 s, followed by a single cycle at 72 °C for 3 min and a final extension step at 72 °C for 5 min, followed by indefinite hold at 4 °C.
Intron 2 of the SPIN1 gene was amplified with the primers SPIN319F (5′ TAT GGA CTA GAA CTG CAC AAA G 3′) and SPIN472R (5′ AGA CCA TCC CCC TCC ATT CAT C 3′), using the following PCR conditions: 95 °C for 5 min, followed by 30 cycles of 95 °C for 30 s, 60 °C for 40 s, and 72 °C for 1 min, and a final extension step for 7 min at 72 °C [31].
PCR amplicons were observed on 1.5% agarose gels with 2 μL of PCR product. Sequencing of the unpurified PCR products in both directions was carried out at the Beijing Genomics Institute (BGI, Hong Kong, China) using the amplification primers.
2.3. Data Analysis
Reference sequences of the mitochondrial control region (D-loop) and cytochrome c oxidase subunit I (COI) gene, together with available nuclear SPIN intron sequences, were downloaded from the NCBI GenBank database to provide a broader phylogeographic context for the analyses. Sequences were selected based on taxonomic identity and sequence quality and were aligned with newly generated Armenian samples prior to downstream analyses. All GenBank accession numbers of reference sequences included in this study are provided in Table S2.
Sequences were aligned and checked using Geneious Prime 2025.1 (https://www.geneious.com, accessed on 14 September 2025) against a reference sequence (for the control region: GenBank accession number: JN411049; for the barcoding gene: GenBank accession number: MZ050103; and for SPIN1 gene: GenBank accession number: KY763852).
After alignment and trimming, final sequence lengths used in downstream analyses were 371 bp for the D-loop, 644 bp for COI, and 990 bp for the SPIN intron. Heterozygous sites in the SPIN intron were resolved through computational phasing prior to haplotype network construction [32]. The slight difference between amplified fragment lengths (373 bp for the control region, 658 bp for COI) and final alignment lengths (371 bp and 644 bp, respectively) reflects standard trimming of primer sequences and low-quality terminal bases prior to analysis.
Because highly divergent mitochondrial haplotypes may reflect technical artifacts such as nuclear mitochondrial pseudogenes (numts), misalignment, or low-level contamination, additional quality-control checks were performed before interpreting the divergence of mitochondrial markers biologically [33,34,35]. COI and D-loop sequences were translated into amino acids using the vertebrate mitochondrial genetic code to check for stop codons, frameshifts, or indels. In addition, chromatograms of representative divergent D-loop haplotypes were manually inspected for double peaks, ambiguous base calls, and mixed sequence signals. Forward and reverse reads were compared to confirm sequence concordance across overlapping regions.
Summary statistics were calculated for the three Armenian regional populations, defined according to geographic origin as northwestern, central, and southern Armenia. For the mitochondrial control-region fragment (D-loop), the number of haplotypes, haplotype diversity, nucleotide diversity (Pi), Theta from Eta, the average number of pairwise nucleotide differences, and the number of segregating sites were calculated using DnaSP v6.120.03 [36]. Tajima’s D was calculated under the infinite-sites model with complete deletion of sites containing gaps or missing data, and statistical significance was assessed for each population separately.
To provide complementary tests of neutrality and demographic expansion, Fu’s Fs and the Ramos–Onsins and Rozas R2 statistic were also calculated for each regional population. Fu’s Fs was included because of its sensitivity to recent demographic expansion [37], whereas R2 was included because it has good statistical performance under small sample sizes [38]. These analyses were used together with Tajima’s D to evaluate whether demographic signals were consistent across multiple neutrality and expansion statistics.
Mismatch distributions were constructed from the mitochondrial control-region alignment using pairwise nucleotide differences among sequences, following the approach of Rogers and Harpending (1992) [39]. Analyses were performed separately for each Armenian regional population. Both sudden demographic expansion and spatial expansion models were tested using pairwise differences as the molecular distance measure in Arlequin v3.5.2.2 [40]. For each population and model, the expansion parameter tau, the sum of squared deviations (SSD) between observed and expected mismatch distributions, and Harpending’s raggedness index were estimated. Statistical significance was assessed by parametric bootstrap tests (10,000 replicates), and associated p-values were reported for both SSD and raggedness index. The observed mismatch distributions were also visually inspected to evaluate unimodal or multimodal patterns and the presence of secondary peaks.
Two AMOVA analyses were conducted in Arlequin v. 3.5.2.2 [40]. First, a two-level AMOVA was performed using only the three Armenian breeding populations to partition D-loop variation into among-population and within-population components. Second, a hierarchical AMOVA was performed using four populations grouped into two geographic groups: Armenia, comprising the central, northwestern, and southern Armenian populations, and Europe, represented by 105 unique D-loop haplotypes derived from Shephard (2013) [21], representing 458 individual sequences sampled from breeding populations across 17 countries: Algeria, Austria, Belgium, Czech Republic, Estonia, France, Germany, Israel, Latvia, Macedonia, Netherlands, Poland, Portugal, Slovakia, South Africa, Spain, and Sweden. Armenian sequences (n = 90) and European haplotypes (n = 105) were assigned to two groups to partition genetic variance among groups (ΦCT), among populations within groups (ΦSC), and within populations (ΦST). Molecular distances were calculated using pairwise nucleotide differences, and significance of fixation indices was assessed using 10,000 permutations.
The genealogical relationships among complete SPIN intron sequences, as well as partial COI and D-loop sequences, were visualized through a median-joining haplotype network constructed using PopART [41]. The median-joining approach follows Bandelt et al. (1999) [42] and is suitable for intraspecific sequence data because it allows the visualization of closely related haplotypes, missing intermediate haplotypes, and mutational steps among haplotypes. Sampling populations were included as traits, allowing haplotype frequencies and geographic composition to be displayed within the network. The number of mutational steps separating the main haplotype clusters was counted directly from the network.
3. Results
3.1. Population Genetic Summary (D-Loop)
Mitochondrial genetic diversity was assessed in three Armenian populations: northwestern, central and southern (Table 1). The northwestern population exhibited high haplotype diversity (Hd = 0.914) but low nucleotide diversity (Pi = 0.02868). The southern population showed similarly high haplotype diversity (Hd = 0.92) and the highest nucleotide diversity (Pi = 0.089). The central population had the highest haplotype diversity (Hd = 0.97) and moderate nucleotide diversity (Pi = 0.061).
Table 1.
Descriptive genetic diversity and neutrality statistics of Armenian White Stork populations based on D-loop sequences (n = 90).
Neutrality and demographic-expansion statistics provided mixed evidence for demographic change. Tajima’s D was significantly negative only in the northwestern population (D = −2.16762, p < 0.01), whereas the central and southern populations showed positive but non-significant values (central: D = 0.58875, p > 0.10; southern: D = 1.62983, p > 0.10). However, Fu’s Fs was not significant in any population, with values of −1.250 in central Armenia (p = 0.071), 1.012 in northwestern Armenia (p = 0.212), and 2.798 in southern Armenia (p = 0.189). The Ramos–Onsins and Rozas R2 test did not provide evidence for demographic expansion in any Armenian population. Observed R2 values were 0.12685 in central Armenia, 0.21951 in northwestern Armenia, and 0.24282 in southern Armenia, with non-significant p-values in all cases (central: p = 0.834; northwestern: p = 0.994; southern: p = 0.993). Thus, although Tajima’s D was significantly negative in the northwestern population, this signal was not corroborated by either Fu’s Fs or R2.
Overall, these results suggest that evidence for recent demographic expansion is limited and not consistent across tests. Therefore, the significantly negative Tajima’s D in the northwestern population should be interpreted cautiously, particularly given the small sample sizes in the northwestern and southern populations.
3.2. Mismatch Distribution (D-Loop)
Mismatch distributions revealed variation in demographic signatures across populations. The northwestern population displayed a predominantly unimodal distribution with a minor secondary peak at approximately 60 substitutions, suggesting recent demographic expansion alongside a possible minor divergent lineage. The southern and central populations both showed bimodal distributions, with peaks at 0–2 and approximately 60 substitutions, a pattern that may be consistent with the co-occurrence of two divergent mitochondrial lineages. The consistent secondary peak near 60 substitutions across all three populations is unlikely to reflect a purely local or recent event, and may instead point to a regionally shared older mitochondrial split (Figure 3). However, mismatch goodness-of-fit statistics showed variable support for expansion models among populations. SSD values were generally non-significant under the demographic expansion model, with the exception of central Armenia which showed a borderline value (SSD p = 0.050), although the southern Armenian population showed a significant raggedness index (Table 2). Under the spatial expansion model, central Armenia showed a good fit, whereas southern Armenia showed a significant SSD value (p = 0.010). These results suggest that mismatch distributions should be interpreted cautiously and do not by themselves provide definitive evidence for historical secondary contact or distinct ancient mitochondrial lineages.
Figure 3.
Mismatch distribution of studied populations: (a) central population, (b) northwestern population, (c) southern population.
Table 2.
Results of mismatch distribution analyses for D-loop sequences, including demographic and spatial expansion model parameters and goodness-of-fit statistics. Tau = expansion parameter; SSD = sum of squared deviations between observed and expected mismatch distributions; r = Harpending’s raggedness index. p-values indicate the probability of obtaining simulated values equal to or greater than the observed values under the corresponding expansion model.
3.3. Two-Level AMOVA (D-Loop)
AMOVA among Armenian breeding clusters revealed that most genetic variation was distributed within populations (98.08%), whereas only 1.92% occurred among populations (Table 3). The differentiation among Armenian clusters was low and not statistically significant (FST = 0.01922, p = 0.226), indicating weak or absent fine-scale population structure within Armenia.
Table 3.
Two-level AMOVA partitioning D-loop genetic variation among and within Armenian breeding populations. d.f. = degrees of freedom; SS = sum of squares. The variance component represents the estimated genetic variance at each level, and the percentage of variation indicates the proportion of total genetic variation attributed to each source. Va = variance among populations, Vb = variance within populations.
3.4. Hierarchical AMOVA (D-Loop)
Hierarchical AMOVA comparing Armenian (90 sequences) and European samples (105 unique haplotypes representing 458 sequences) revealed no significant differentiation between groups (Table 4). The among-group component explained −2.11% of the total variation and was not significant (FCT = −0.02115, p = 0.754), whereas most variation was found within populations (100.00%). Differentiation among populations within groups was also low and not significant (FSC = 0.02067, p = 0.225).
Table 4.
Hierarchical AMOVA partitioning D-loop genetic variation. Results showing the partitioning of D-loop genetic variation among groups, among populations within groups, and within populations. Groups were defined as Armenia and Europe; Armenian populations included central, northwestern, and southern Armenia, while Europe was treated as a single undifferentiated group. d.f. = degrees of freedom; SS = sum of squares. The variance component represents the estimated genetic variance at each hierarchical level, and percentage of variation indicates the proportion of total genetic variation attributed to each source. Va = variance among groups; Vb = variance among populations within groups; Vc = variance within populations.
3.5. Haplotype Networks—D-Loop, SPIN and COI Genes
The median-joining haplotype network of the D-loop (Figure 4) identified two significantly divergent haplotype clusters, separated by 56 mutational steps over a 371 bp fragment, indicating approximately 15.1% uncorrected pairwise divergence (56/371 bp). Given the atypically high divergence for an intraspecific mitochondrial control-region dataset, we approached this finding with caution and conducted additional quality-control measures to eliminate common mitochondrial sequencing artifacts, such as numts, misalignment, and low-level contamination [33,34,35]. The COI sequences exhibited no stop codons, frameshifts, or indels upon translation, and the D-loop chromatograms demonstrated high sequence quality, with no ambiguous base calls or consistent evidence of mixed signals or double peaks. Concordance was observed between forward and reverse D-loop reads across overlapping regions for all samples with available reads. These quality checks justify the inclusion of the divergent D-loop haplotypes, although the unusually high divergence necessitates careful interpretation.
Figure 4.
Median-joining haplotype network of D-loop sequences of White Stork. Circle size is proportional to haplotype frequency, and colors indicate sampling populations. Hatch marks on branch lengths represent mutational steps between haplotypes. Small black nodes represent unsampled intermediate haplotypes inferred by the network.
The SPIN intron network (Figure 5) revealed a dominant, centrally positioned haplotype shared among individuals from all sampled regions. Several low-frequency haplotypes radiated from this central haplotype and were separated by one or a few mutational steps, producing a star-like network topology. Most haplotypes contained individuals from multiple geographic regions, indicating extensive haplotype sharing and little geographic structuring. Overall, the network pattern is consistent with low genetic differentiation among populations and suggests recent common ancestry and/or ongoing gene flow across the study area.
Figure 5.
Median-joining haplotype network of SPIN sequences of White Stork. Circles represent unique haplotypes. Circle size is proportional to haplotype frequency, defined as the number of individuals sharing each haplotype. Hatch marks on branches between circles indicate mutational steps, with each hatch mark representing one mutation. Colors within circles indicate the geographic origin of individuals carrying each haplotype.
The COI mitochondrial barcode network (Figure 6) revealed a dominant, centrally located haplotype that was widely shared among individuals from the Armenian populations, with samples from the central population predominating. Several closely related, low-frequency haplotypes radiated from this central haplotype and differed by one or a few mutational steps, resulting in a star-like topology indicative of shallow genetic divergence. This pattern indicates low genetic structuring within the Armenian populations, consistent with recent common ancestry and/or ongoing gene flow. The separation of the small number of available European (n = 3) and East Asian (n = 3) reference sequences from the main Armenian cluster by several mutational steps is noteworthy, as COI is specifically used as a barcode marker to detect broad-scale divergence. However, with only three sequences per region, it is not possible to determine whether this pattern reflects genuine large-scale geographic differentiation or a sampling artifact; both interpretations remain plausible with the available data. Expanding the COI reference dataset to include a greater number of European and East Asian sequences would be necessary to evaluate this pattern conclusively.
Figure 6.
Median-joining haplotype network of the COI barcode. Circles (nodes) represent unique haplotypes. Circle size is proportional to haplotype frequency, defined as the number of individuals sharing each haplotype. Hatch marks on branches between circles indicate mutational steps, with each hatch mark representing one mutation. Colors within circles indicate the geographic origin of individuals carrying each haplotype.
4. Discussion
4.1. Genetic Diversity Within Armenian White Stork Populations
Patterns of genetic diversity in long-distance migratory birds are shaped by the combined influence of Pleistocene climatic oscillations and contemporary dispersal, often resulting in high genetic diversity and weak regional population structure across the Western Palearctic [2,6]. The Caucasus region, located at the junction of Europe, Asia, and the Middle East, is widely regarded as a region of lineage persistence and secondary contact, making it a suitable system for exploring how historical range dynamics and ongoing gene flow interact in highly mobile species such as the White Stork [1,4,6].
Within Armenia, White Storks exhibited consistently high mitochondrial haplotype diversity across northwestern, central, and southern regions, indicating the presence of multiple maternal lineages throughout the country. In contrast, nucleotide diversity varied among regions, suggesting that genetic diversity is not evenly distributed spatially. Similar decoupling of haplotype and nucleotide diversity has been reported in other avian phylogeographic studies and is often interpreted as reflecting differences in the timing or intensity of historical demographic processes, as well as variation in the relative frequencies of divergent mitochondrial lineages [3,4,43,44,45]. In this context, the observed heterogeneity among Armenian regions may reflect complex demographic histories rather than a single uniform national trajectory.
Demographic signals were not spatially consistent across Armenian White Stork populations and were not uniformly supported by different neutrality and expansion statistics. A significantly negative Tajima’s D was detected only in the northwestern population, suggesting a possible signal of recent demographic expansion or an excess of low-frequency variants in this region. However, this pattern was not corroborated by Fu’s Fs or the Ramos–Onsins and Rozas R2 test, both of which were non-significant across all three Armenian populations. Central and southern Armenia showed non-significant positive Tajima’s D values and therefore did not provide evidence for recent expansion based on this statistic. Thus, the demographic signal should be interpreted cautiously and considered suggestive rather than conclusive.
This heterogeneity may indicate that demographic processes have not affected all breeding areas equally, despite overall high mitochondrial haplotype diversity. However, given the small sample sizes in the northwestern and southern populations, as well as the presence of highly divergent D-loop haplotype clusters, we avoid drawing strong conclusions about regional demographic history. Comparable region-specific demographic signatures have been described in other migratory birds inhabiting topographically complex landscapes [6], but additional sampling and multilocus analyses would be required to determine whether similar processes shaped White Stork populations in the South Caucasus.
Weak fine-scale population structure has also been reported in European White Stork populations, where most mitochondrial variation is shared among breeding areas and little differentiation is detected at national or regional scales despite the existence of distinct migratory flyways [21]. A similar pattern was observed in Armenia, with most mitochondrial variation shared among regions and limited evidence of internal differentiation (Figure 7).
Figure 7.
Geographic distribution of mitochondrial and nuclear haplotypes and populations of the White Stork (Ciconia ciconia) in Armenia. (a) Spatial distribution of COI mitochondrial haplotypes across the three populations (northwestern, central, and southern Armenia). (b) Distribution of nuclear SPIN intron haplotypes across the same populations. (c) Distribution of mitochondrial control-region (D-loop) haplotypes, illustrating extensive haplotype sharing and shallow geographic structuring among regions. (d) Location of the study area within the South Caucasus region, showing Armenia in its broader biogeographic context. Colors indicate different populations (northwestern, central, southern), and circles represent individual sampling localities, inset maps show enlarged views of the densely sampled central region.
Haplotype network analyses were consistent with this interpretation. Star-like network topologies and widespread haplotype sharing, indicative of shallow divergence and substantial connectivity, have been described in several highly mobile Western Palearctic bird species [6]. In a synthesis of 145 Western Palearctic bird species, 58.6% exhibited low genetic differentiation and 31.7% showed panmixia, whereas only 9.7% displayed strong geographic structuring, indicating that the pattern observed here is characteristic of many migratory birds in the region [6].
However, the identification of two markedly divergent D-loop haplotype clusters offers genealogical evidence supporting the secondary peak observed in the mismatch distribution. Nevertheless, the degree of divergence between these clusters, approximately 15.1% over the 371 bp fragment, is exceptionally high for an intraspecific mitochondrial control-region dataset. Such patterns necessitate cautious interpretation due to potential influences from nuclear mitochondrial pseudogenes, coamplification artifacts, misalignment, or contamination, especially when dealing with degraded or low-template DNA sources [33,34,35]. Although our examination of chromatograms, comparisons of forward and reverse reads, and COI translation checks did not indicate sequencing artifacts, we refrain from interpreting the pattern as conclusive evidence of ancient mitochondrial lineages or secondary contact. Instead, we characterize this as a highly divergent D-loop haplotype structure consistent with historical mitochondrial divergence. Confirmation will require additional independent loci and more extensive comparative sampling across the species’ range.
4.2. Demographic History Inferred from Mismatch Distributions
Mismatch distribution analyses suggested departures from long-term demographic equilibrium across Armenian White Stork populations. The following interpretation is conditional on the quality-control checks described in Section 3.5, which did not reveal evidence of numts, misalignment, or contamination in the divergent D-loop haplotypes; should future analyses with additional independent loci reveal that the high divergence reflects technical artifacts rather than genuine biological signal, the demographic conclusions of this section would require revision. In all three populations, the distributions shared a secondary peak at approximately 60 pairwise substitutions, consistent with the presence of two divergent mitochondrial lineages. The recurrence of this secondary peak across geographically separated populations suggests that it is unlikely to represent a purely localized or recent event, so the interpretation of this pattern as evidence of a historical mitochondrial split should be treated as tentative.
In a broader regional context, this pattern may be compatible with demographic processes operating at the scale of the South Caucasus and Southwest Asia, rather than processes restricted to Armenia alone. The Caucasus region is widely recognized as a major biogeographic crossroads and an area of lineage persistence for diverse taxa, including birds, mammals, reptiles, amphibians, and invertebrates. Owing to complex topography and climatic history, these regions have been proposed as refugial areas during Pleistocene glacial cycles and as zones of secondary contact where divergent genetic lineages persisted through climatic oscillations and subsequently came into contact during interglacial periods [1,2,4,46]. More directly relevant to the present study, genomic analyses of Western Palearctic bird species have identified secondary contact zones in Anatolia and the South Caucasus region specifically. Cumer et al. (2022) demonstrated that two divergent Barn Owl (Tyto alba) lineages—one of European origin and one of Levantine origin—meet meet in a secondary contact zone in Anatolia, shaped by Pleistocene climatic history [47]. Similarly, the Common Chiffchaff complex (Phylloscopus collybita) exhibits multiple secondary contact zones across the Caucasus and adjacent regions, with distinct lineages meeting where Pleistocene refugia expanded post-glacially [48]. These avian examples provide direct support for the plausibility that the tentative two-lineage signal detected in the mismatch distributions of Armenian White Stork populations may reflect a similar pattern of lineage divergence and contact in this biogeographically complex region, though we emphasize that this interpretation remains conditional on further validation with additional markers. Within this framework, Armenian White Stork populations may represent part of a broader regional population system in which mitochondrial lineages have persisted and mixed across the Caucasus and surrounding regions, such that demographic signals observed within Armenia could reflect wider historical processes [4,6].
Bimodality in mismatch distributions is frequently interpreted as consistent with historical lineage divergence followed by secondary contact, though this method has limited discriminatory power and bimodal patterns can also arise from population structure or uneven sampling [49]. In highly dispersive birds, divergent mitochondrial lineages can persist through multiple glacial cycles and later co-occur following post-glacial range expansion and admixture, producing secondary peaks in mismatch distributions despite ongoing gene flow [1,4,50]. Comparable patterns have been described in several Western Palearctic bird species with wide breeding ranges and high dispersal capacity, including the Barn Swallow (Hirundo rustica), Great Tit (Parus major), Eurasian Blackcap (Sylvia atricapilla), and European Green Woodpecker (Picus viridis), as well as other passerines showing deep mitochondrial lineage divergence combined with weak regional structure and evidence of post-glacial mixing [6,48,51].
At a finer regional scale, mismatch distributions differed among Armenian populations. The northwestern population displayed a predominantly unimodal distribution, which may be consistent with more recent demographic expansion, whereas central and southern populations showed clearer bimodal patterns [1,44]. Such variation could reflect differences in the relative frequencies of the two mitochondrial lineages rather than entirely independent demographic histories, particularly given the limited population structure and extensive haplotype sharing observed among regions [3,4,6]. Notably, the southern population consists of only 57 breeding pairs [28], making it the smallest of the three regional populations examined; the elevated nucleotide diversity and bimodal mismatch distribution in the southern population may reflect a higher relative frequency of divergent mitochondrial haplotypes, but given the small sample size, this pattern should be interpreted cautiously and requires confirmation with expanded sampling.
Importantly, the highly divergent D-loop haplotype clusters were not accompanied by comparable differentiation at the SPIN locus. The SPIN intron haplotype network showed a dominant haplotype shared across regions, together with only a few low-frequency variants and no clear geographic segregation. However, this result should be interpreted cautiously because SPIN represents a single Z-linked intron rather than an autosomal multilocus nuclear dataset. In birds, Z-linked loci have a sex-biased inheritance pattern and reduced effective population size relative to autosomal loci in female-heterogametic species, which may affect lineage sorting and the detection of population structure. Therefore, the SPIN results provide only limited nuclear context and should not be treated as strong independent confirmation of the mitochondrial pattern. The apparent contrast between deep mitochondrial divergence and shallow SPIN structure may reflect differences in effective population size, inheritance mode, and coalescence times among marker types [4,48,52,53], but additional unlinked autosomal nuclear markers or genome-wide data would be required to robustly test this pattern.
Overall, and provided that the divergent D-loop haplotype clusters reflect genuine biological variation rather than technical artifacts—as suggested by the quality-control checks performed—mismatch distribution analyses are consistent with a complex demographic history that may involve ancient mitochondrial divergence followed by secondary contact and population expansion. This interpretation remains tentative given the limited discriminatory power of mismatch analyses and the absence of independent multilocus nuclear confirmation. Similar demographic scenarios, characterized by lineage persistence in refugia and post-glacial admixture, have been described in Western Palearctic birds and interpreted as the legacy of repeated glacial–interglacial range dynamics [5,6]. While mismatch distributions can also be influenced by population structure or selective processes, the recurrence of secondary peaks together with extensive haplotype sharing is compatible with a scenario of historical lineage divergence followed by mixing, rather than the recent, region-specific isolation [6,54].
4.3. Population Structure and Gene Flow
AMOVA indicated limited mitochondrial differentiation within Armenia, with the vast majority of variation (98.08%) distributed within rather than among the three regional populations (FST = 0.019, p = 0.226). This limited fine-scale structure is consistent with patterns reported for White Storks across much of Europe, where extensive dispersal and migratory connectivity are associated with widespread sharing of mitochondrial variation despite differences in flyways and breeding regions [21]. Notably, the lack of genetic differentiation observed in the present study, both among Armenian populations and between Armenia and Europe, suggests that connectivity is maintained across populations using different migratory flyways—Armenian White Storks migrate primarily along the eastern flyway and winter mainly in the Mesopotamian region [28], while most European populations use the western route via Gibraltar or the Balkan route—indicating that flyway differences do not constitute barriers to gene flow at the mitochondrial level in this species [8,21]. Similar weak or absent regional structuring has been documented in other long-distance migratory birds across Western and Central Europe, reflecting high mobility and post-glacial expansion that may constrain genetic differentiation at national or regional scales [6,55].
The absence of pronounced internal population structure suggests that geographic distance and ecological heterogeneity within Armenia do not constitute strong barriers to gene flow for this species. High natal dispersal and breeding movements likely reduce the effects of local genetic drift, contributing to genetic homogeneity across breeding areas, as observed in many highly mobile Palearctic birds [4,52].
In this study, “weak or absent differentiation” refers to the magnitude and statistical significance of population-genetic variance components, rather than to complete mitochondrial sequence identity. Unlike microbial taxonomic frameworks, where fixed sequence-similarity thresholds such as 97% or 98.65% for 16S rRNA are sometimes used as conventional species-level cut-offs, there is no universally accepted percentage identity threshold for defining population or subspecies boundaries in animals [56]. Animal population differentiation is therefore interpreted using fixation indices, such as FST, as continuous measures of among-population variance rather than as fixed identity thresholds [57,58].
As a general heuristic, FST values below approximately 0.05 are usually interpreted as indicating very weak or negligible population structure, whereas values above approximately 0.15 are often considered to reflect marked differentiation. Comparable examples of very low differentiation have been reported in mobile avian species, including Finnish house sparrows, which showed very low global differentiation (FST = 0.004), golden-winged and blue-winged warblers, which showed extremely low genome-wide differentiation (weighted mean FST = 0.0045), and Black-whiskered Vireos in the Lesser Antilles, which showed a global FST of 0.005 [59,60,61]. Similarly, whole-genome comparisons of stonechats showed that some geographically proximate taxa can be nearly identical at the genomic level despite broader differentiation within the species complex [62].
In the present White Stork dataset, differentiation among Armenian populations was low and non-significant (FST = 0.01922, p = 0.226), and hierarchical differentiation between Armenia and Europe was also effectively absent and non-significant (FCT = −0.02115, p = 0.754). These results indicate a lack of strong and statistically supported between-population variance at the D-loop marker, rather than complete identity of mitochondrial sequences. Thus, our conclusion of weak or absent differentiation should be understood in a population-genetic sense, as low fixation-index values with non-significant AMOVA results.
Hierarchical AMOVA comparing Armenian and European samples likewise revealed no significant differentiation between groups (FCT = −0.021, p = 0.754), with effectively all variation distributed within rather than between groups. This indicates that Armenian breeding populations are not genetically isolated from the broader European population system at the markers examined, and that the South Caucasus forms part of a single, broadly connected mitochondrial gene pool spanning the Western Palearctic breeding range examined. The slightly negative FCT value suggests that, if anything, Armenian populations may harbor marginally greater within-group diversity than European populations on average, consistent with the high haplotype diversity observed across all three Armenian regions, although this difference was not statistically significant.
Taken together, the AMOVA results indicate an absence of significant genetic structure at both the within-Armenia and the Armenia-versus-Europe scales. Rather than reflecting a scale-dependent pattern of differentiation, these results point to the extensive contemporary gene flow connecting Armenian breeding populations both with one another and with the wider European population, consistent with the high dispersal capacity and weak philopatry characteristic of this species [8,21,23].
Haplotype networks for both mitochondrial COI and the nuclear SPIN intron were broadly consistent with this picture of high connectivity. Within Armenia, both loci exhibited star-like network topologies dominated by one or a few common haplotypes with several low-frequency derivatives, patterns commonly associated with shallow divergence and substantial haplotype sharing. As noted above, a star-like topology is expected for a single nuclear intron regardless of demographic history when coalescence is recent, so the SPIN network should be regarded as broadly consistent with, rather than independent confirmation of, the mitochondrial result [4,52].
The mitochondrial COI network similarly showed extensive haplotype sharing within Armenia. A small number of available European (n = 3) and East Asian (n = 3) reference sequences fell outside the main Armenian cluster, separated by several mutational steps. Given that COI is a marker specifically used to detect broad-scale divergence, this pattern warrants careful consideration; however, with only three sequences per region, it is not possible to distinguish between genuine large-scale geographic differentiation and a sampling artifact. This represents a limitation of the current COI dataset, and the pattern should neither be confidently interpreted as evidence of differentiation nor dismissed outright. The lack of significant structure in the D-loop AMOVA, which was based on a larger and more balanced European comparison dataset (n = 105 haplotypes representing 458 sequences), provides a broader context but does not resolve the COI network pattern given the different geographic coverage of the two datasets.
Comparisons with other taxa from the Caucasus region further illustrate the importance of species-specific dispersal capacity. Highly mobile taxa, such as White Storks and gray wolves, often exhibit weak regional structuring despite complex landscapes [63,64], whereas less mobile or habitat-restricted species can show pronounced phylogeographic breaks over relatively short distances [65]. A particularly instructive avian counterpoint is provided by partridges of the genus Alectoris, which are largely resident and incapable of sustained long-distance flight. Kabasakal et al. (2025) demonstrated pronounced transcontinental phylogeographic structure and deep mitochondrial lineage divergence across the Western Palearctic and Anatolia in Alectoris, with Anatolia serving as a key refugial and diversification center [66]. The contrast between this pattern and the panmixia observed here in the highly mobile White Stork illustrates how dispersal capacity, rather than landscape configuration alone, determines the degree of genetic structure in birds sharing the same geographic region.
Overall, mitochondrial and nuclear data jointly indicate high genetic connectivity and an absence of significant structure within Armenia and between Armenia and Europe. These findings are consistent with Armenian breeding populations forming part of a single, well-connected Western Palearctic population system, in which contemporary dispersal appears sufficient to prevent the build-up of detectable genetic differentiation at the spatial scales and markers examined [6,21,52].
4.4. Conservation and Ecological Implications
From a conservation perspective, the relatively high genetic diversity and weak internal population structure observed in White Storks suggest a generally favorable genetic context for populations in the South Caucasus region at the markers examined. Extensive haplotype sharing and low mitochondrial differentiation indicate that breeding areas across this region likely function as a well-connected system in which dispersal and gene flow may reduce the risk of genetic erosion or inbreeding, even in fragmented landscapes [4,6,21]. Maintaining landscape connectivity and coordinated conservation and demographic monitoring across the Caucasus and adjacent regions of Southwest Asia may therefore be important for long-term persistence.
At the same time, the consistent presence of divergent mitochondrial lineages suggests that Armenia and the wider Caucasus region may represent an area of historical lineage persistence and secondary contact, plausibly linked to Pleistocene climatic cycles. Comparable refugial and contact-zone regions in southern Europe (e.g., the Iberian and Balkan Peninsulas) and western Asia are known to harbor elevated genetic diversity and lineage admixture in Palearctic birds [4,6]. In this context, White Stork populations in the region may contribute disproportionately to mitochondrial lineage diversity within the species, a factor that could be considered in regional conservation planning [67].
These findings also provide useful context for conservation and restoration discussions involving long-distance migratory birds. Our results should be interpreted at the population level within a single species and do not imply that translocations or assisted movements are automatically advisable. Such decisions require broader evaluation of nuclear genomic variation, adaptive differentiation, migratory behavior, disease risk, ecological suitability, and local conservation objectives. Nevertheless, the mitochondrial D-loop data do not support the presence of strongly divergent or cryptic species-level units between Armenian and European White Stork breeding populations. Instead, the low and non-significant differentiation observed within Armenia and between Armenia and Europe indicates a broadly connected mitochondrial gene pool across the Western Palearctic populations examined. This provides an empirical baseline for evaluating claims of strong genetic incompatibility or “different genetic species” within this part of the White Stork range, while highlighting the need for future genome-wide analyses before drawing management conclusions about translocation or assisted migration.
4.5. Methodological Considerations and Limitations
Several methodological aspects should be considered when interpreting these results. We combined mitochondrial markers (control region and COI) with a nuclear intron (SPIN), providing complementary perspectives on demographic history and population structure. Mitochondrial loci are particularly sensitive to historical demographic processes due to their smaller effective population size and faster coalescence, whereas nuclear markers provide biparental information and reflect population processes across different temporal scales, typically with slower lineage sorting. These differences in marker behavior are well-documented in avian phylogeographic studies and support the value of integrating mitochondrial and nuclear loci, including highly polymorphic nuclear markers such as microsatellites, when assessing population structure and connectivity across spatial scales [4,52]. However, the marker set used here represents a limited portion of the genome, and subtle population structure, recent barriers to gene flow, or fine-scale demographic processes may remain undetected without more variable nuclear markers or genome-wide approaches. More broadly, a single non-recombining mitochondrial locus can misrepresent population history due to selection, genetic drift, and sex-biased processes acting specifically on the mitochondrial genome, a concern particularly relevant when interpreting patterns of divergence from a single marker [68]. The value of genome-wide approaches for resolving population history in a congener is illustrated by Yang et al., who employed chromosome-scale genomic data to investigate migration adaptation and conservation priorities in the endangered Oriental Stork (Ciconia boyciana), demonstrating the depth of inference that genome-wide data can provide relative to single-locus mitochondrial analyses [69].
Additionally, molecular sexing was not performed on sampled individuals; as SPIN1 is a Z-linked locus, hemizygous females (ZW) cannot be distinguished from homozygous males (ZZ) without sex determination, and only individuals showing heterozygosity—presumed to be males—were phased prior to network construction. This represents a limitation in the interpretation of the SPIN intron marker. Moreover, the COI reference dataset included only three European and three East Asian sequences, which is insufficient to evaluate whether the separation of these haplotypes from the main Armenian cluster in the COI haplotype network reflects genuine broad-scale geographic differentiation or a sampling artifact. Expanding the COI reference dataset across the species’ Eurasian range would be necessary to resolve this pattern, given that COI is specifically used as a barcode marker to detect broad-scale divergence.
Another methodological consideration is that mitochondrial inferences in this study were based on relatively short fragments, namely the mitochondrial control region/D-loop and COI, which were analyzed separately. Although this approach is appropriate for comparing marker-specific patterns of diversity and haplotype structure, the limited sequence length may reduce power to detect subtle genetic structure or older mitochondrial splits, particularly when differentiation is weak. As a complementary approach, future studies could concatenate mitochondrial fragments, where sequence coverage is comparable across samples, to increase the amount of phylogeographic information. Complete mitogenome sequencing would provide an even more comprehensive mitochondrial perspective by capturing both coding and non-coding variation across the entire mitochondrial genome.
Such approaches could improve power to detect subtle mitochondrial structure, weak differentiation, or older lineage splits if they exist. However, the present results remain important because the available mitochondrial markers consistently indicate low and non-significant differentiation among the Western Palearctic populations examined. Thus, longer mitochondrial datasets and complete mitogenomes represent valuable future extensions, while genome-wide nuclear data would ultimately be needed to test recent barriers to gene flow, adaptive differentiation, and fine-scale population structure.
Although sampling effort was proportional to regional population size, the small absolute sample sizes in the northwestern and particularly the southern population reflect the limited size of those breeding populations and may nonetheless reduce statistical power to detect subtle genetic differentiation or fine-scale demographic variation. Though consistent patterns were observed across multiple analytical approaches (diversity indices, AMOVA, mismatch distributions, and haplotype networks), the inclusion of highly polymorphic nuclear markers (e.g., microsatellites) or genome-wide datasets, together with expanded sampling across migratory flyways, would improve resolution of recent gene flow and fine-scale population structure and help clarify the extent to which populations in the South Caucasus are connected to broader Western Palearctic population systems [6,52]. A further limitation of the hierarchical AMOVA is the asymmetric grouping structure: the 105 European reference haplotypes, representing geographically diverse breeding populations from 17 countries [21], were treated as a single undifferentiated group, whereas the Armenian samples were subdivided into three regional populations. Given that European White Stork populations contain internal genetic structure [21], this asymmetry may influence ΦCT and ΦSC estimates, and the continental-scale connectivity conclusion should be interpreted with this caveat in mind. Future analyses incorporating a region-structured European reference dataset would provide a more rigorous comparison.
5. Conclusions
In summary, White Stork populations breeding in Armenia show high mitochondrial haplotype diversity and, based on the D-loop marker examined, no significant genetic differentiation among Armenian breeding regions or between Armenia and European reference samples. These results indicate that Armenian breeding populations are part of a broadly connected Western Palearctic mitochondrial gene pool, consistent with the high dispersal capacity of the species. Mismatch distributions revealed secondary peaks and heterogeneous demographic signals, suggesting possible historical mitochondrial complexity; however, these patterns should be interpreted cautiously because mismatch distributions alone cannot distinguish confidently among historical admixture, population structure, sampling effects, or marker-specific processes. Expanded genomic sampling across the South Caucasus and the broader Western Palearctic breeding range will be necessary to clarify the historical processes underlying mitochondrial diversity in this understudied part of the species’ range.
Supplementary Materials
The following supporting information can be downloaded at https://www.mdpi.com/article/10.3390/birds7030054/s1, Table S1. White stork blood samples database 2024. Table S2. List of haplotypes downloaded from GenBank.
Author Contributions
Conceptualization: L.A., S.A.A., M.R. Methodology: L.A., E.A., S.A.A., M.R. Software: M.R., S.A.A. Validation: L.A., S.A.A., M.R. Formal analysis: M.R. Investigation: L.A., M.A., N.T., E.A., M.G. Resources: L.A., S.A.A., M.G. and M.R. Data curation: L.A., S.A.A., M.R. Visualization: N.T. Writing—original draft: L.A. Writing—review and editing: S.A.A., M.R. Supervision: L.A., S.A.A., M.R. Project administration: L.A. Funding acquisition: L.A., M.A., S.A.A. All authors have read and agreed to the published version of the manuscript.
Funding
This research was funded by the Higher Education and Science Committee of the Ministry of Education, Science, Culture and Sport of the Republic of Armenia (Projects No. 22AA-1F024 and 24AA-1F032) and co-funded by the Armenian Branch of the German Nature Protection Union (NABU) within the White Stork research and conservation project in Armenia. The genetic analyses were supported by the Ministry of Science, Technological Development and Innovation of the Republic of Serbia (Grant No. 451-03-33/2026-03/200053). The Study was conducted in accordance with the United Nations Sustainable Development Goals (Agenda 2030), specifically Goal 15: Life on Land. The funders had no role in study design, data collection and analysis, decision to publish, or preparation of the manuscript.
Institutional Review Board Statement
All procedures involving animals were conducted in accordance with the ethical standards of the institution and under the permits issued by the Ministry of Environment of the Republic of Armenia (permit number 3/29.7/1684, issued to the Scientific Center of Zoology and Hydroecology NAS RA on 15 February 2024).
Informed Consent Statement
Not applicable.
Data Availability Statement
Sequences generated in this study have been deposited in GenBank under accession numbers PZ513498-PZ513587 (SPIN intron), PZ513588-PZ513677 (mitochondrial control region/D-loop), and PZ503283-PZ503377 (COI). Additional data supporting the reported results are available in the Supporting Information (Tables S1 and S2).
Acknowledgments
The authors thank the laboratory of Molecular Parasitology of the Scientific Center of Zoology and Hydroecology NAS RA for the Laboratory work support. We also thank Igor Khorozyan for valuable discussions. We also thank the anonymous reviewers for their valuable comments and suggestions, which greatly improved the quality of this manuscript. In addition, the authors used AI-assisted tools (Claude Sonnet 4.6, Anthropic, San Francisco, CA, USA) for language editing and proofreading during the preparation of this manuscript. The authors take full responsibility for the content and have reviewed and approved the final version.
Conflicts of Interest
The authors declare no conflicts of interest.
Abbreviations
The following abbreviations are used in this manuscript:
| COI | Cytochrome c Oxidase subunit I |
| SPIN | SPIN1 Z-linked intron |
| AMOVA | Analysis of Molecular Variance |
| FCT | Fixation index measuring differentiation among groups relative to total variation (in hierarchical AMOVA) |
| SSD | Sum of Squared Deviations |
| DNA | Deoxyribonucleic Acid |
| PCR | Polymerase Chain Reaction |
| FST | Fixation index (among populations within total) |
| ΦCT/ΦSC/ΦST | Hierarchical fixation indices |
References
- Hewitt, G. The Genetic Legacy of the Quaternary Ice Ages. Nature 2000, 405, 907–913. [Google Scholar] [CrossRef] [Scilit]
- Schmitt, T. Molecular Biogeography of Europe: Pleistocene Cycles and Postglacial Trends. Front. Zool. 2007, 4, 11. [Google Scholar] [CrossRef] [Scilit] [PubMed]
- Avise, J.C. Phylogeography: The History and Formation of Species; Harvard University Press: Cambridge, MA, USA, 2000. [Google Scholar]
- Drovetski, S.V.; Fadeev, I.V.; Raković, M.; Lopes, R.J.; Boano, G.; Pavia, M.; Koblik, E.A.; Lohman, Y.V.; Red’kin, Y.A.; Aghayan, S.A.; et al. A Test of the European Pleistocene Refugial Paradigm, Using a Western Palaearctic Endemic Bird Species. Proc. R. Soc. B Biol. Sci. 2018, 285, 20181606. [Google Scholar] [CrossRef] [Scilit] [PubMed]
- Zink, R.M.; Barrowclough, G.F. Mitochondrial DNA under Siege in Avian Phylogeography. Mol. Ecol. 2008, 17, 2107–2121. [Google Scholar] [CrossRef] [Scilit] [PubMed]
- Pârâu, L.G.; Wink, M. Common Patterns in the Molecular Phylogeography of Western Palearctic Birds: A Comprehensive Review. J. Ornithol. 2021, 162, 937–959. [Google Scholar] [CrossRef] [Scilit] [PubMed]
- Blas, J.; Salas, R.; Flack, A.; Torres-Medina, F.; Sergio, F.; Wikelski, M.; Fiedler, W. Overland and Oversea Migration of White Storks through the Water Barriers of the Straits of Gibraltar. Sci. Rep. 2020, 10, 20760. [Google Scholar] [CrossRef] [Scilit] [PubMed]
- Flack, A.; Fiedler, W.; Blas, J.; Pokrovsky, I.; Kaatz, M.; Mitropolsky, M.; Aghababyan, K.; Fakriadis, I.; Makrigianni, E.; Jerzak, L.; et al. Costs of Migratory Decisions: A Comparison across Eight White Stork Populations. Sci. Adv. 2016, 2, e1500931. [Google Scholar] [CrossRef] [Scilit] [PubMed]
- Gilbert, N.I.; Correia, R.A.; Silva, J.P.; Pacheco, C.; Catry, I.; Atkinson, P.W.; Gill, J.A.; Franco, A.M.A. Are White Storks Addicted to Junk Food? Impacts of Landfill Use on the Movement and Behaviour of Resident White Storks (Ciconia ciconia) from a Partially Migratory Population. Mov. Ecol. 2016, 4, 7. [Google Scholar] [CrossRef] [Scilit] [PubMed]
- Rotics, S.; Turjeman, S.; Kaatz, M.; Resheff, Y.S.; Zurell, D.; Sapir, N.; Eggers, U.; Fiedler, W.; Flack, A.; Jeltsch, F.; et al. Wintering in Europe Instead of Africa Enhances Juvenile Survival in a Long-Distance Migrant. Anim. Behav. 2017, 126, 79–88. [Google Scholar] [CrossRef] [Scilit]
- BirdLife International White Stork Ciconia ciconia Species Factsheet. Available online: https://datazone.birdlife.org/species/factsheet/white-stork-ciconia-ciconia (accessed on 28 January 2026).
- Bjedov, D.; Mikuška, A.; Velki, M. From Wetlands to Landfills: White Stork (Ciconia ciconia L., 1758) as a Reliable Bioindicator of Ecosystem Health. Arch. Ind. Hyg. Toxicol. 2025, 76, 1–15. [Google Scholar] [CrossRef] [Scilit] [PubMed]
- Fedorenko, V.; Zima, Y. Current Distribution of the Turkestan White Stork (Ciconia ciconia asiatica) in Kazakhstan. Int. J. Zool. 2024, 2024, 1–7. [Google Scholar] [CrossRef] [Scilit]
- Hancock, J.; Kushlan, J.A.; Kahl, M.P. Storks, Ibises and Spoonbills of the World; A&C Black: London, UK, 2010. [Google Scholar]
- Gula, J.; Sundar, K.S.G.; Willows-Munro, S.; Downs, C.T. The State of Stork Research Globally: A Systematic Review. Biol. Conserv. 2023, 280, 109969. [Google Scholar] [CrossRef] [Scilit]
- Archaux, F.; Balança, G.; Henry, P.-Y.; Zapata, G. Wintering of White Storks in Mediterranean France. Waterbirds 2004, 27, 441–445. [Google Scholar] [CrossRef] [Scilit]
- Catry, I.; Encarnação, V.; Pacheco, C.; Catry, T.; Tenreiro, P.; Leão, F.; Bally, F.; Roda, S.; Capela, C.; Alonso, H.; et al. Recent Changes on Migratory Behaviour of the White Stork (Ciconia ciconia) in Portugal: Towards the End of Migration? Airo 2017, 24, 28–35. [Google Scholar]
- Martín, B.; Onrubia, A.; Ferrer, M. Climate Change and the Spatiotemporal Variation in Survival of a Long-Distance Migrant (White Stork, Ciconia ciconia) across Western Europe. Birds 2021, 2, 362–380. [Google Scholar] [CrossRef] [Scilit]
- Mayall, E.; Groves, L.; Kennerley, R.; Hudson, M.; Franco, A. Demographic Consequences of Management Actions for the Successful Reintroduction of the White Stork Ciconia ciconia to the UK. Bird Conserv. Int. 2023, 33, e47. [Google Scholar] [CrossRef] [Scilit]
- Wuczyński, A.; Krogulec, G.; Jakubiec, Z.; Profus, P.; Neubauer, G. Population Size and Spatial Distribution of the White Stork Ciconia ciconia in Poland in 1958 with Insights into Long-Term Trends in Regional and Global Population. Eur. Zool. J. 2021, 88, 525–539. [Google Scholar] [CrossRef] [Scilit]
- Shephard, J.M.; Ogden, R.; Tryjanowski, P.; Olsson, O.; Galbusera, P. Is Population Structure in the European White Stork Determined by Flyway Permeability Rather than Translocation History? Ecol. Evol. 2013, 3, 4881–4895. [Google Scholar] [CrossRef] [Scilit] [PubMed]
- Itonaga, N.; Köppen, U.; Plath, M.; Wallschläger, D. Breeding Dispersal Directions in the White Stork (Ciconia ciconia) Are Affected by Spring Migration Routes. J. Ethol. 2010, 28, 393–397. [Google Scholar] [CrossRef] [Scilit]
- Vergara, P.; Aguirre, J.I.; Fargallo, J.A.; Dávila, J.A. Nest-site Fidelity and Breeding Success in White Stork Ciconia ciconia. Ibis 2006, 148, 672–677. [Google Scholar] [CrossRef] [Scilit]
- Bilgin, R.; Ebeoğlu, N.; İnak, S.; Kırpık, M.A.; Horns, J.J.; Şekercioğlu, Ç.H. DNA Barcoding of Birds at a Migratory Hotspot in Eastern Turkey Highlights Continental Phylogeographic Relationships. PLoS ONE 2016, 11, e0154454. [Google Scholar] [CrossRef] [Scilit] [PubMed]
- Fayvush, G.; Tamanyan, K.; Kalashyan, M.; Vitek, E. “Biodiversity Hotspots” in Armenia; Naturhistorisches Museum Wien: Vienna, Austria, 2013. [Google Scholar]
- Garroway, C.J.; Radersma, R.; Sepil, I.; Santure, A.W.; De Cauwer, I.; Slate, J.; Sheldon, B.C. Fine-Scale Genetic Structure in a Wild Bird Population: The Role of Limited Dispersal and Environmentally Based Selection as Causal Factors: Special Section. Evolution 2013, 67, 3488–3500. [Google Scholar] [CrossRef] [Scilit] [PubMed]
- Herman, R.W.; Winger, B.M.; Dittmann, D.L.; Harvey, M.G. Fine-Scale Population Genetic Structure and Barriers to Gene Flow in a Widespread Seabird (Ardenna pacifica). Biol. J. Linn. Soc. 2022, 137, 125–136. [Google Scholar] [CrossRef] [Scilit]
- Aghajanyan, L. White Stork Research and Conservation Project Annual Technical Progress Report 2024 Contact Information Branch of NABU in Armenia; NABU Armenia: Yerevan, Armenia, 2024. [Google Scholar]
- Seutin, G.; White, B.N.; Boag, P.T. Preservation of Avian Blood and Tissue Samples for DNA Analyses. Can. J. Zool. 1991, 69, 82–90. [Google Scholar] [CrossRef] [Scilit]
- Folmer, O.; Black, M.; Hoeh, W.; Lutz, R.; Vrijenhoek, R. DNA Primers for Amplification of Mitochondrial Cytochrome c Oxidase Subunit I from Diverse Metazoan Invertebrates. Mol. Mar. Biol. Biotechnol. 1994, 3, 294–299. [Google Scholar] [PubMed]
- Handley, L.-J.L.; Ceplitis, H.; Ellegren, H. Evolutionary Strata on the Chicken Z Chromosome: Implications for Sex Chromosome Evolution. Genetics 2004, 167, 367–376. [Google Scholar] [CrossRef] [Scilit] [PubMed]
- Stephens, M.; Smith, N.J.; Donnelly, P. A New Statistical Method for Haplotype Reconstruction from Population Data. Am. J. Hum. Genet. 2001, 68, 978–989. [Google Scholar] [CrossRef] [Scilit] [PubMed]
- Zhang, D.-X.; Hewitt, G.M. Nuclear Integrations: Challenges for Mitochondrial DNA Markers. Trends Ecol. Evol. 1996, 11, 247–251. [Google Scholar] [CrossRef] [Scilit] [PubMed]
- Sorenson, M.D.; Quinn, T.W. Numts: A Challenge for Avian Systematics and Population Biology. The Auk 1998, 115, 214–221. [Google Scholar] [CrossRef] [Scilit]
- Song, H.; Buhay, J.E.; Whiting, M.F.; Crandall, K.A. Many Species in One: DNA Barcoding Overestimates the Number of Species When Nuclear Mitochondrial Pseudogenes Are Coamplified. Proc. Natl. Acad. Sci. USA 2008, 105, 13486–13491. [Google Scholar] [CrossRef] [Scilit] [PubMed]
- Rozas, J.; Ferrer-Mata, A.; Sánchez-DelBarrio, J.C.; Guirao-Rico, S.; Librado, P.; Ramos-Onsins, S.E.; Sánchez-Gracia, A. DnaSP 6: DNA Sequence Polymorphism Analysis of Large Data Sets. Mol. Biol. Evol. 2017, 34, 3299–3302. [Google Scholar] [CrossRef] [Scilit] [PubMed]
- Fu, Y.-X. Statistical Tests of Neutrality of Mutations Against Population Growth, Hitchhiking and Background Selection. Genetics 1997, 147, 915–925. [Google Scholar] [CrossRef] [Scilit] [PubMed]
- Ramos-Onsins, S.E.; Rozas, J. Statistical Properties of New Neutrality Tests Against Population Growth. Mol. Biol. Evol. 2002, 19, 2092–2100. [Google Scholar] [CrossRef] [Scilit] [PubMed]
- Rogers, A.R.; Harpending, H. Population Growth Makes Waves in the Distribution of Pairwise Genetic Differences. Mol. Biol. Evol. 1992, 9, 552–569. [Google Scholar] [CrossRef] [Scilit] [PubMed]
- Excoffier, L.; Lischer, H.E.L. Arlequin Suite Ver 3.5: A New Series of Programs to Perform Population Genetics Analyses under Linux and Windows. Mol. Ecol. Resour. 2010, 10, 564–567. [Google Scholar] [CrossRef] [Scilit] [PubMed]
- Leigh, J.W.; Bryant, D. Popart: Full-Feature Software for Haplotype Network Construction. Methods Ecol. Evol. 2015, 6, 1110–1116. [Google Scholar] [CrossRef] [Scilit]
- Bandelt, H.-J.; Forster, P.; Röhl, A. Median-Joining Networks for Inferring Intraspecific Phylogenies. Mol. Biol. Evol. 1999, 16, 37–48. [Google Scholar] [CrossRef] [Scilit] [PubMed]
- Avise, J.C.; Arnold, J.; Ball, R.M.; Bermingham, E.; Lamb, T.; Neigel, J.E.; Reeb, C.A.; Saunders, N.C. Intraspecific Phylogeography: The Mitochondrial DNA Bridge Between Population Genetics and Systematics. Annu. Rev. Ecol. Syst. 1987, 18, 489–522. [Google Scholar] [CrossRef]
- Grant, W. Shallow Population Histories in Deep Evolutionary Lineages of Marine Fishes: Insights from Sardines and Anchovies and Lessons for Conservation. J. Hered. 1998, 89, 415–426. [Google Scholar] [CrossRef] [Scilit]
- Zan, S.; Zhou, L.; Jiang, H.; Zhang, B.; Wu, Z.; Hou, Y. Genetic Structure of the Oriental White Stork (Ciconia boyciana): Implications for a Breeding Colony in a Non-breeding Area. Integr. Zool. 2008, 3, 235–244. [Google Scholar] [CrossRef] [Scilit] [PubMed]
- Tarkhnishvili, D.; Gavashelishvili, A.; Murtskhvaladze, M.; Latsuzbaia, A. Palaeoclimatic Models Help to Understand Current Distribution of Caucasian Forest Species. Biol. J. Linn. Soc. 2012, 105, 231–248. [Google Scholar] [CrossRef] [Scilit]
- Cumer, T.; Machado, A.P.; Dumont, G.; Bontzorlos, V.; Ceccherelli, R.; Charter, M.; Dichmann, K.; Kassinis, N.; Lourenço, R.; Manzia, F.; et al. Landscape and Climatic Variations Shaped Secondary Contacts amid Barn Owls of the Western Palearctic. Mol. Biol. Evol. 2022, 39, msab343. [Google Scholar] [CrossRef] [Scilit] [PubMed]
- Raković, M.; Neto, J.M.; Lopes, R.J.; Koblik, E.A.; Fadeev, I.V.; Lohman, Y.V.; Aghayan, S.A.; Boano, G.; Pavia, M.; Perlman, Y.; et al. Geographic Patterns of mtDNA and Z-Linked Sequence Variation in the Common Chiffchaff and the ‘Chiffchaff Complex’. PLoS ONE 2019, 14, e0210268. [Google Scholar] [CrossRef] [Scilit] [PubMed]
- Excoffier, L. Patterns of DNA Sequence Diversity and Genetic Structure after a Range Expansion: Lessons from the Infinite-Island Model. Mol. Ecol. 2004, 13, 853–864. [Google Scholar] [CrossRef] [Scilit] [PubMed]
- Pentzold, S.; Tritsch, C.; Martens, J.; Tietze, D.T.; Giacalone, G.; Valvo, M.L.; Nazarenko, A.A.; Kvist, L.; Päckert, M. Where Is the Line? Phylogeography and Secondary Contact of Western Palearctic Coal Tits (Periparus ater: Aves, Passeriformes, Paridae). Zool. Anz.-J. Comp. Zool. 2013, 252, 367–382. [Google Scholar] [CrossRef] [Scilit]
- Hogner, S.; Laskemoen, T.; Lifjeld, J.T.; Porkert, J.; Kleven, O.; Albayrak, T.; Kabasakal, B.; Johnsen, A. Deep Sympatric Mitochondrial Divergence without Reproductive Isolation in the Common Redstart P Hoenicurus Phoenicurus. Ecol. Evol. 2012, 2, 2974–2988. [Google Scholar] [CrossRef] [Scilit] [PubMed]
- Hung, C.-M.; Drovetski, S.V.; Zink, R.M. Matching Loci Surveyed to Questions Asked in Phylogeography. Proc. R. Soc. B Biol. Sci. 2016, 283, 20152340. [Google Scholar] [CrossRef] [Scilit] [PubMed]
- Kamp, L.; Pasinelli, G.; Milanesi, P.; Drovetski, S.V.; Kosiński, Z.; Kossenko, S.; Robles, H.; Schweizer, M. Significant Asia-Europe Divergence in the Middle Spotted Woodpecker (Aves, Picidae). Zool. Scr. 2019, 48, 17–32. [Google Scholar] [CrossRef] [Scilit]
- Goodall-Copestake, W.P.; Tarling, G.A.; Murphy, E.J. On the Comparison of Population-Level Estimates of Haplotype and Nucleotide Diversity: A Case Study Using the Gene Cox1 in Animals. Heredity 2012, 109, 50–56. [Google Scholar] [CrossRef] [Scilit] [PubMed]
- Lončar, V.; Kralj, J.; Stronen, A.V.; Grgurević, M.; Pavlinec, Ž.; Jurinović, L.; Svetličić, I.; Buzan, E.; Piro, S.; Herrmann, C.; et al. High Genetic Diversity yet Weak Population Genetic Structure in European Common Terns. Sci. Rep. 2024, 14, 29173. [Google Scholar] [CrossRef] [Scilit] [PubMed]
- Mysara, M.; Vandamme, P.; Props, R.; Kerckhof, F.-M.; Leys, N.; Boon, N.; Raes, J.; Monsieurs, P. Reconciliation between Operational Taxonomic Units and Species Boundaries. FEMS Microbiol. Ecol. 2017, 93, fix029. [Google Scholar] [CrossRef] [Scilit] [PubMed]
- Wright, S. Variability Within and Among Natural Populations. In Evolution and the Genetics of Populations; University of Chicago Press: Chicago, IL, USA, 1978; Volume 4. [Google Scholar]
- Irwin, D.E.; Milá, B.; Toews, D.P.L.; Brelsford, A.; Kenyon, H.L.; Porter, A.N.; Grossen, C.; Delmore, K.E.; Alcaide, M.; Irwin, J.H. A Comparison of Genomic Islands of Differentiation across Three Young Avian Species Pairs. Mol. Ecol. 2018, 27, 4839–4855. [Google Scholar] [CrossRef] [Scilit] [PubMed]
- Kekkonen, J.; Orell, M.; Rytkönen, S.; Merilä, J. Low Genetic Differentiation in a Sedentary Bird: House Sparrow Population Genetics in a Contiguous Landscape. Heredity 2011, 106, 587–596. [Google Scholar] [CrossRef] [Scilit] [PubMed]
- Toews, D.P.L.; Taylor, S.A.; Vallender, R.; Brelsford, A.; Butcher, B.G.; Messer, P.W.; Lovette, I.J. Plumage Genes and Little Else Distinguish the Genomes of Hybridizing Warblers. Curr. Biol. 2016, 26, 2313–2318. [Google Scholar] [CrossRef] [Scilit] [PubMed]
- Khimoun, A.; Arnoux, E.; Martel, G.; Pot, A.; Eraud, C.; Condé, B.; Loubon, M.; Théron, F.; Covas, R.; Faivre, B.; et al. Contrasted Patterns of Genetic Differentiation across Eight Bird Species in the Lesser Antilles. Genetica 2016, 144, 125–138. [Google Scholar] [CrossRef] [Scilit] [PubMed]
- Van Doren, B.M.; Campagna, L.; Helm, B.; Illera, J.C.; Lovette, I.J.; Liedvogel, M. Correlated Patterns of Genetic Diversity and Differentiation across an Avian Family. Mol. Ecol. 2017, 26, 3982–3997. [Google Scholar] [CrossRef] [Scilit] [PubMed]
- Ersmark, E.; Klütsch, C.F.C.; Chan, Y.L.; Sinding, M.-H.S.; Fain, S.R.; Illarionova, N.A.; Oskarsson, M.; Uhlén, M.; Zhang, Y.; Dalén, L.; et al. From the Past to the Present: Wolf Phylogeography and Demographic History Based on the Mitochondrial Control Region. Front. Ecol. Evol. 2016, 4, 134. [Google Scholar] [CrossRef] [Scilit]
- Pilot, M.; Dąbrowski, M.J.; Hayrapetyan, V.; Yavruyan, E.G.; Kopaliani, N.; Tsingarska, E.; Bujalska, B.; Kamiński, S.; Bogdanowicz, W. Genetic Variability of the Grey Wolf Canis Lupus in the Caucasus in Comparison with Europe and the Middle East: Distinct or Intermediary Population? PLoS ONE 2014, 9, e93828. [Google Scholar] [CrossRef] [Scilit] [PubMed]
- Ahmadzadeh, F.; Flecks, M.; Carretero, M.A.; Mozaffari, O.; Böhme, W.; Harris, D.J.; Freitas, S.; Rödder, D. Cryptic Speciation Patterns in Iranian Rock Lizards Uncovered by Integrative Taxonomy. PLoS ONE 2013, 8, e80563. [Google Scholar] [CrossRef] [Scilit] [PubMed]
- Kabasakal, B.; Doğru, H.; Erdoğan, A.; Kaya, S. Transcontinental Evolutionary Dynamics and Phylogeography of Alectoris (Aves: Galliformes): Identifying Refugia, Dispersal Corridors, and Cryptic Diversity in the Palearctic Region. Avian Res. 2025, 16, 100262. [Google Scholar] [CrossRef] [Scilit]
- Olsson, O. Genetic Origin and Success of Reintroduced White Storks. Conserv. Biol. 2007, 21, 1196–1206. [Google Scholar] [CrossRef] [Scilit] [PubMed]
- Galtier, N.; Nabholz, B.; Glémin, S.; Hurst, G.D.D. Mitochondrial DNA as a Marker of Molecular Diversity: A Reappraisal. Mol. Ecol. 2009, 18, 4541–4550. [Google Scholar] [CrossRef] [Scilit]
- Yang, S.; Liu, Y.; Zhao, X.; Chen, J.; Li, H.; Liang, H.; Fan, J.; Zhou, M.; Wang, S.; Zhang, X.; et al. Genomic Exploration of the Endangered Oriental Stork, Ciconia Boyciana, Sheds Light on Migration Adaptation and Future Conservation. GigaScience 2024, 13, giae081. [Google Scholar] [CrossRef] [Scilit] [PubMed]
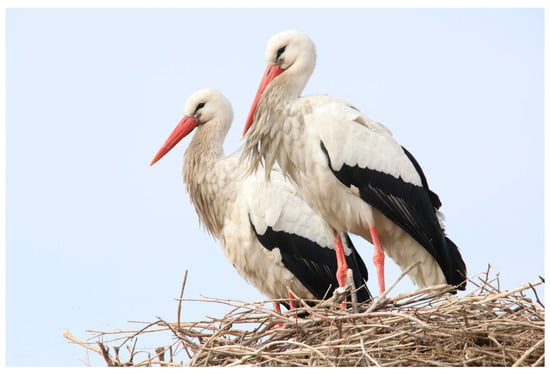
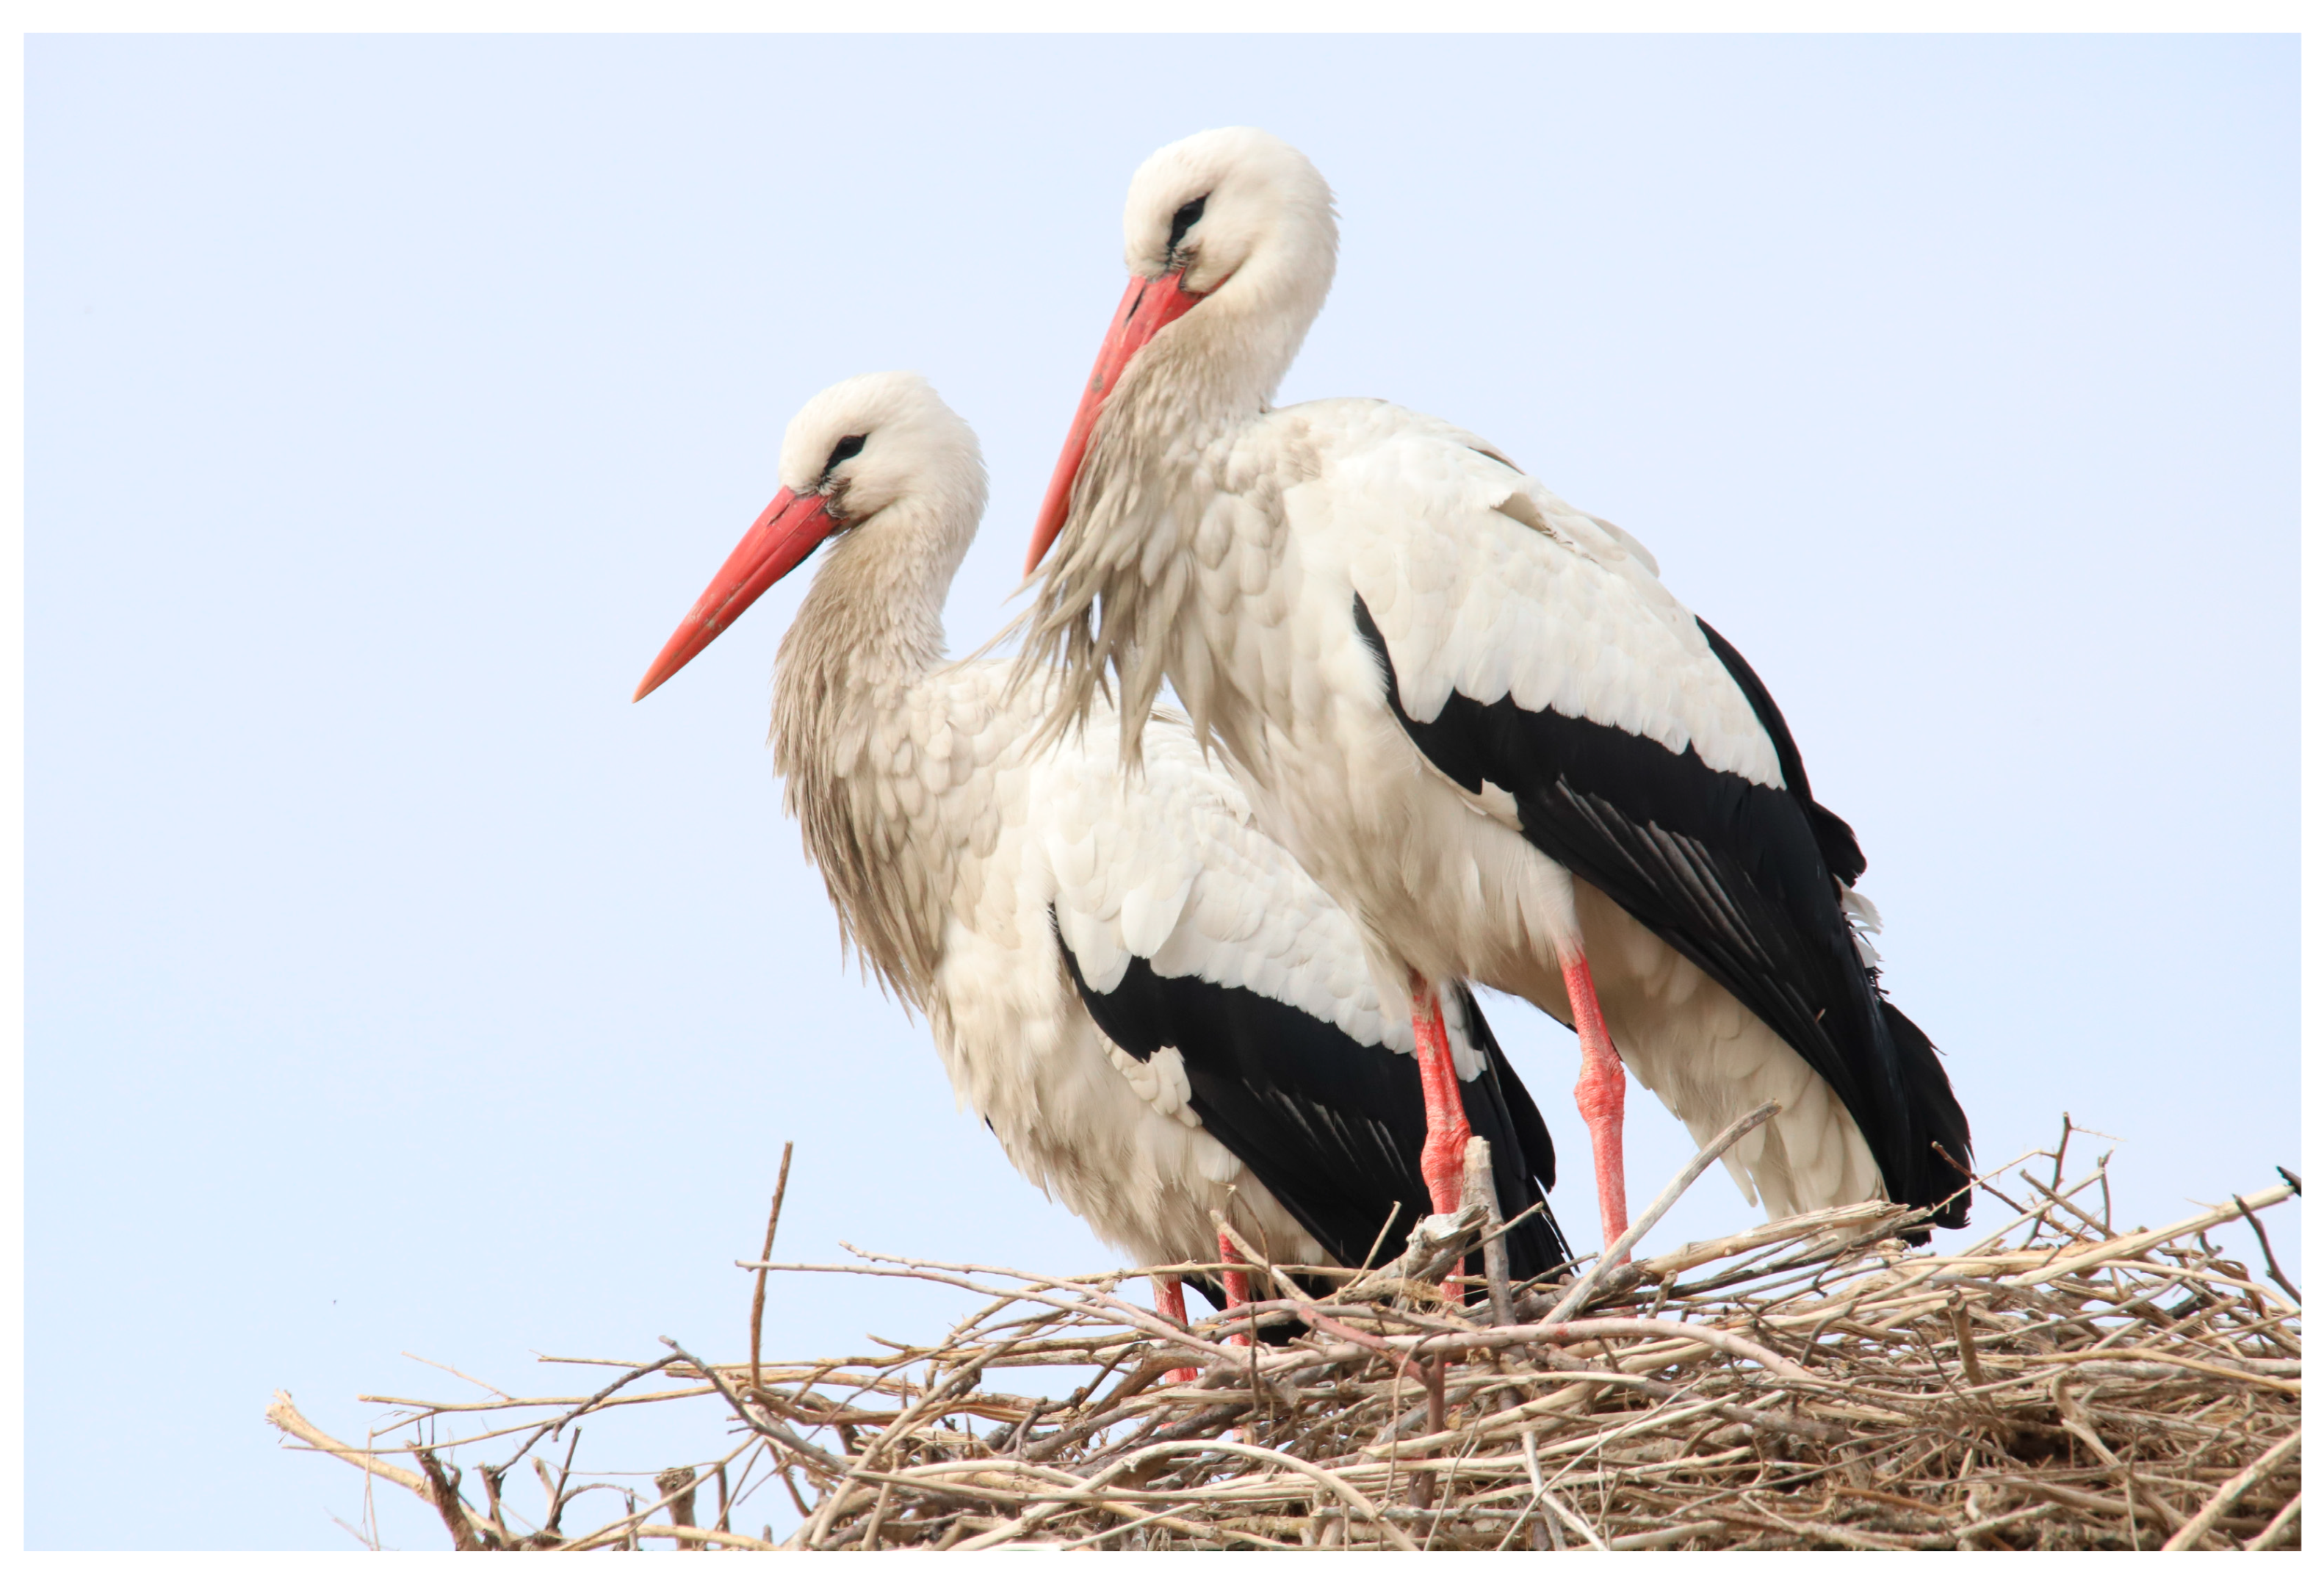
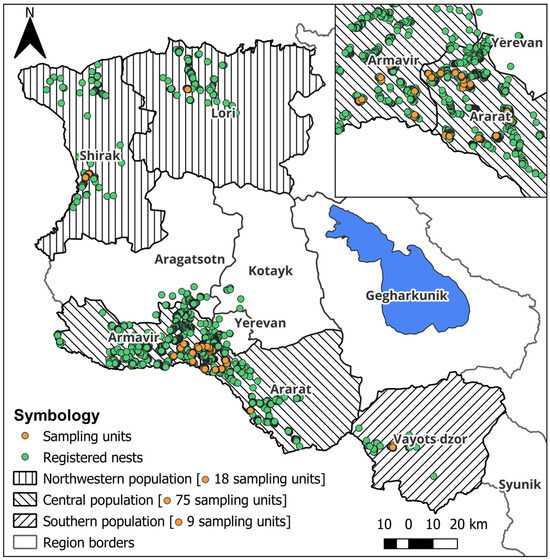
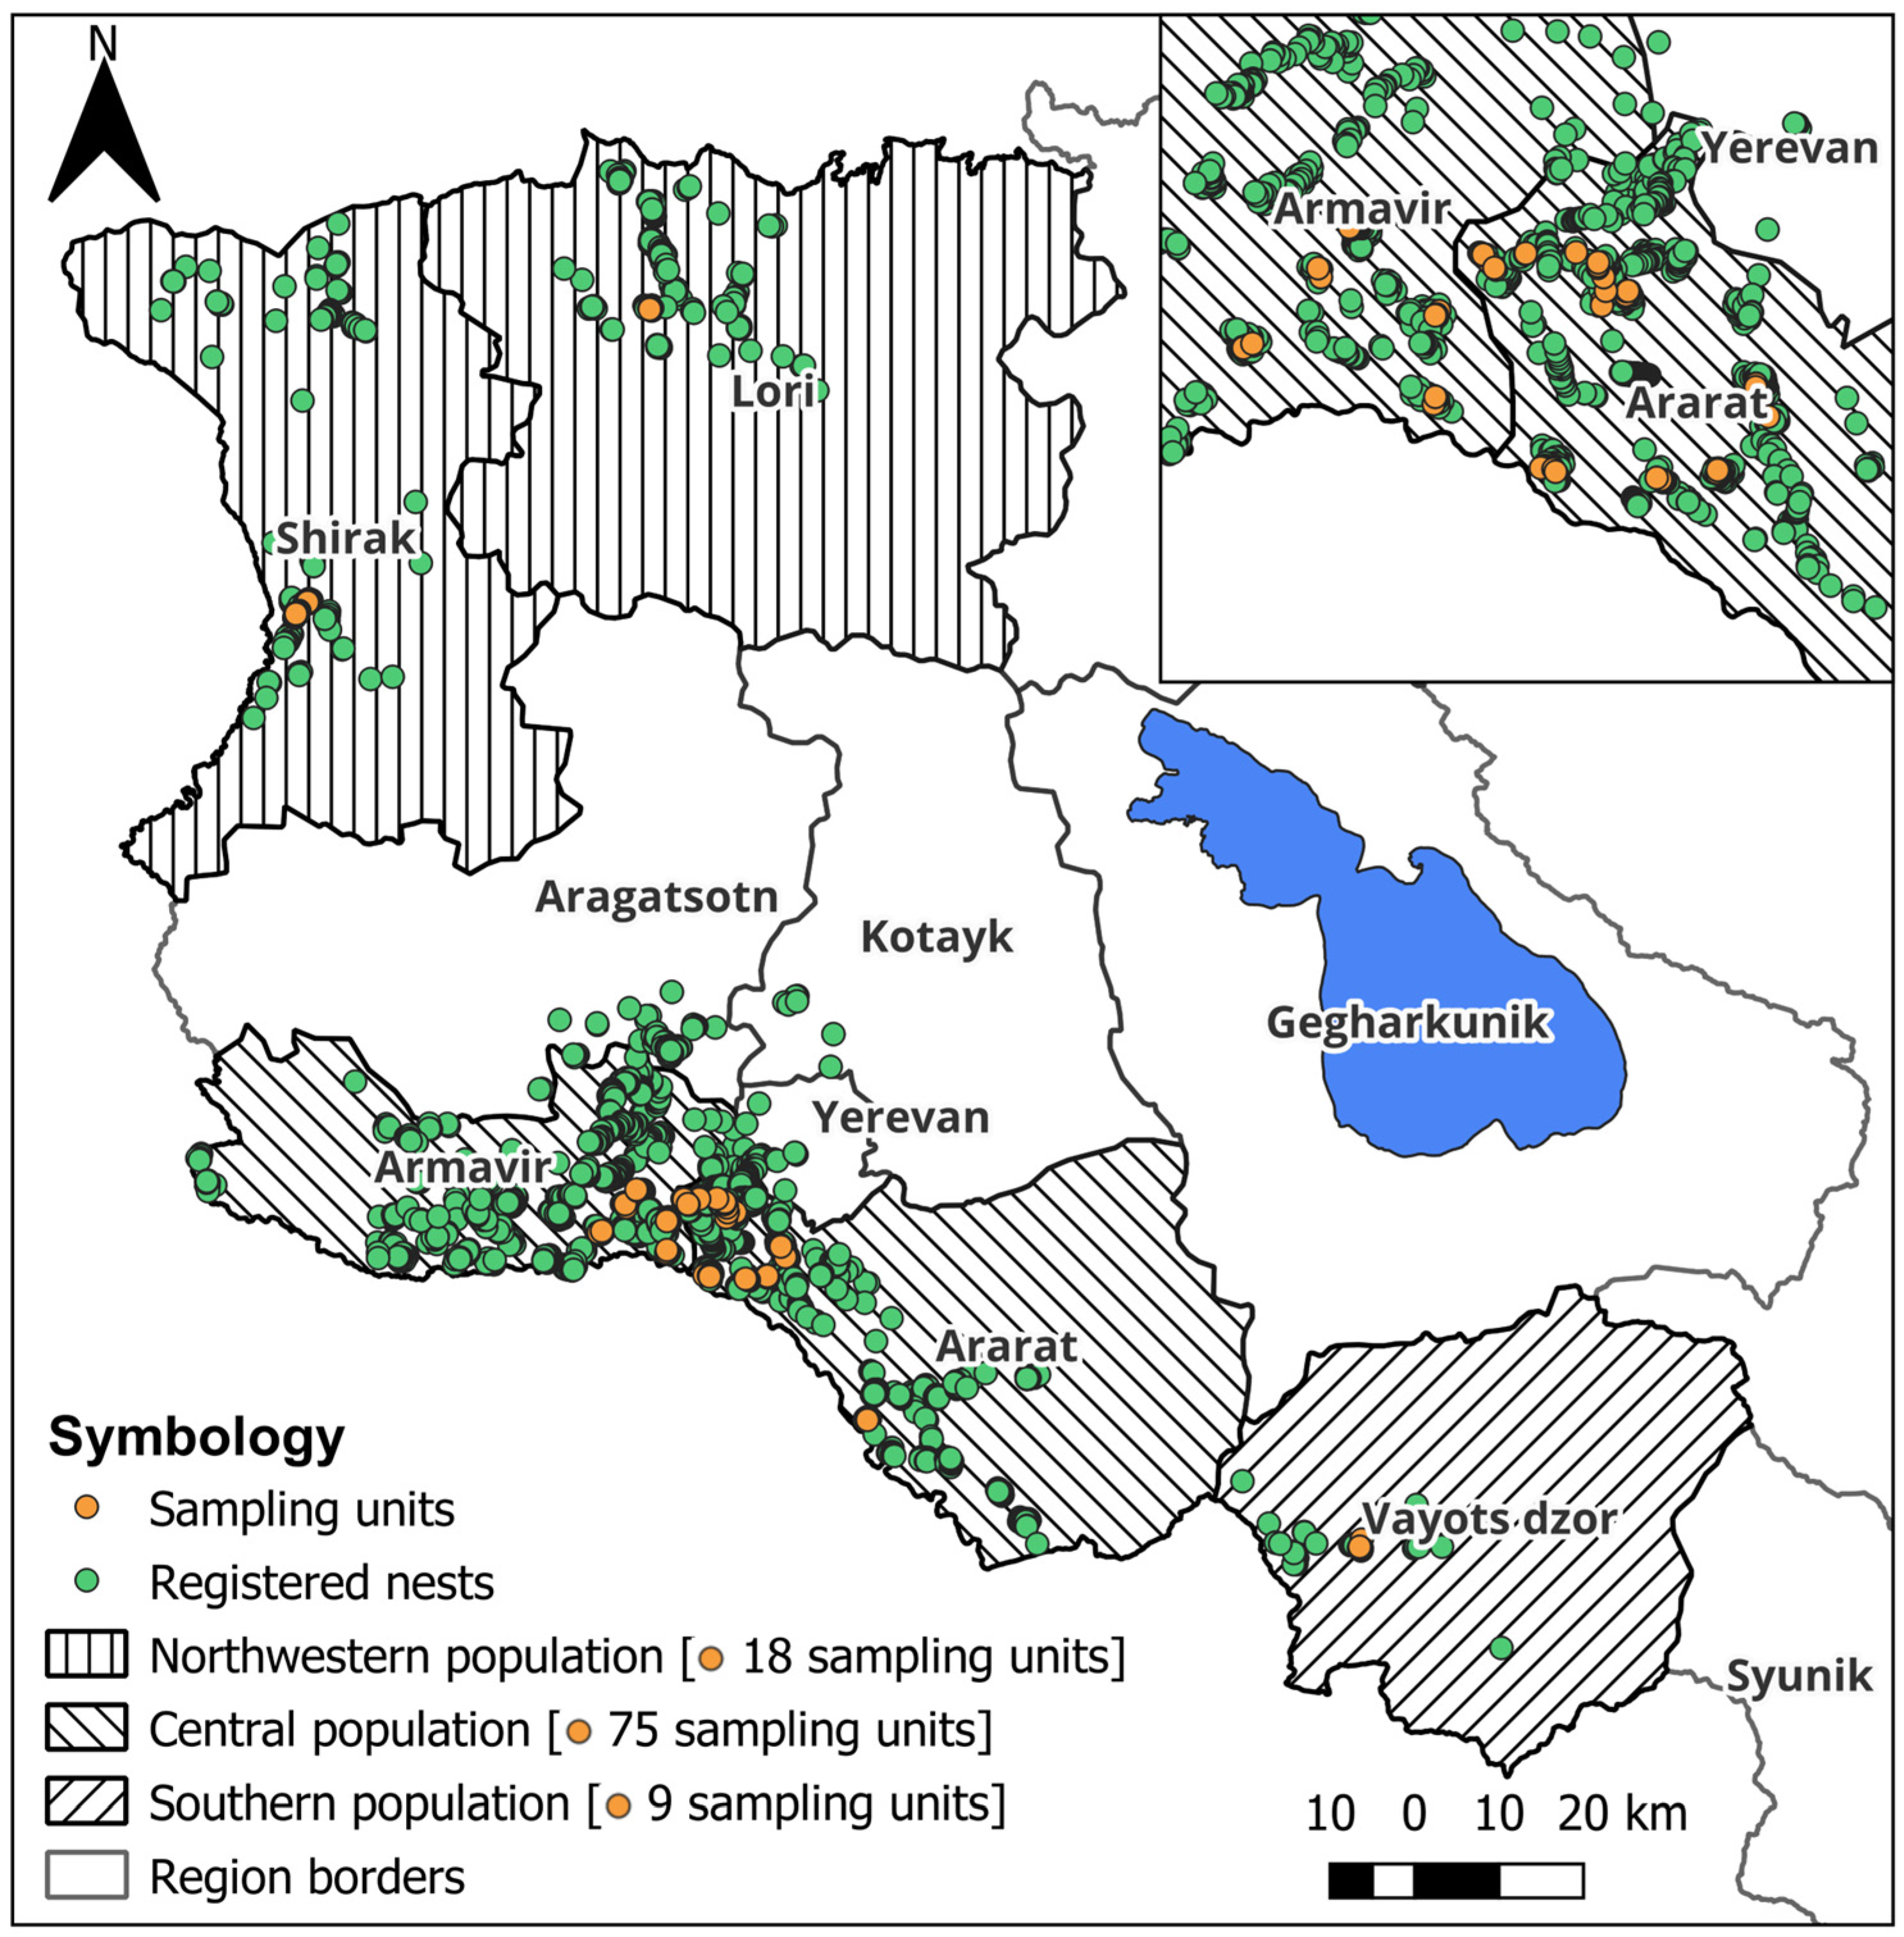
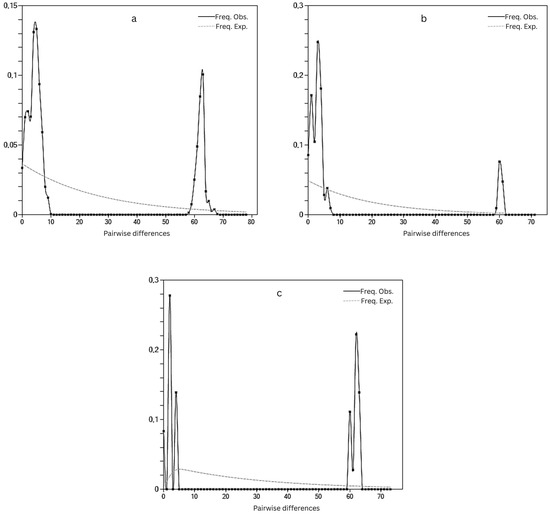
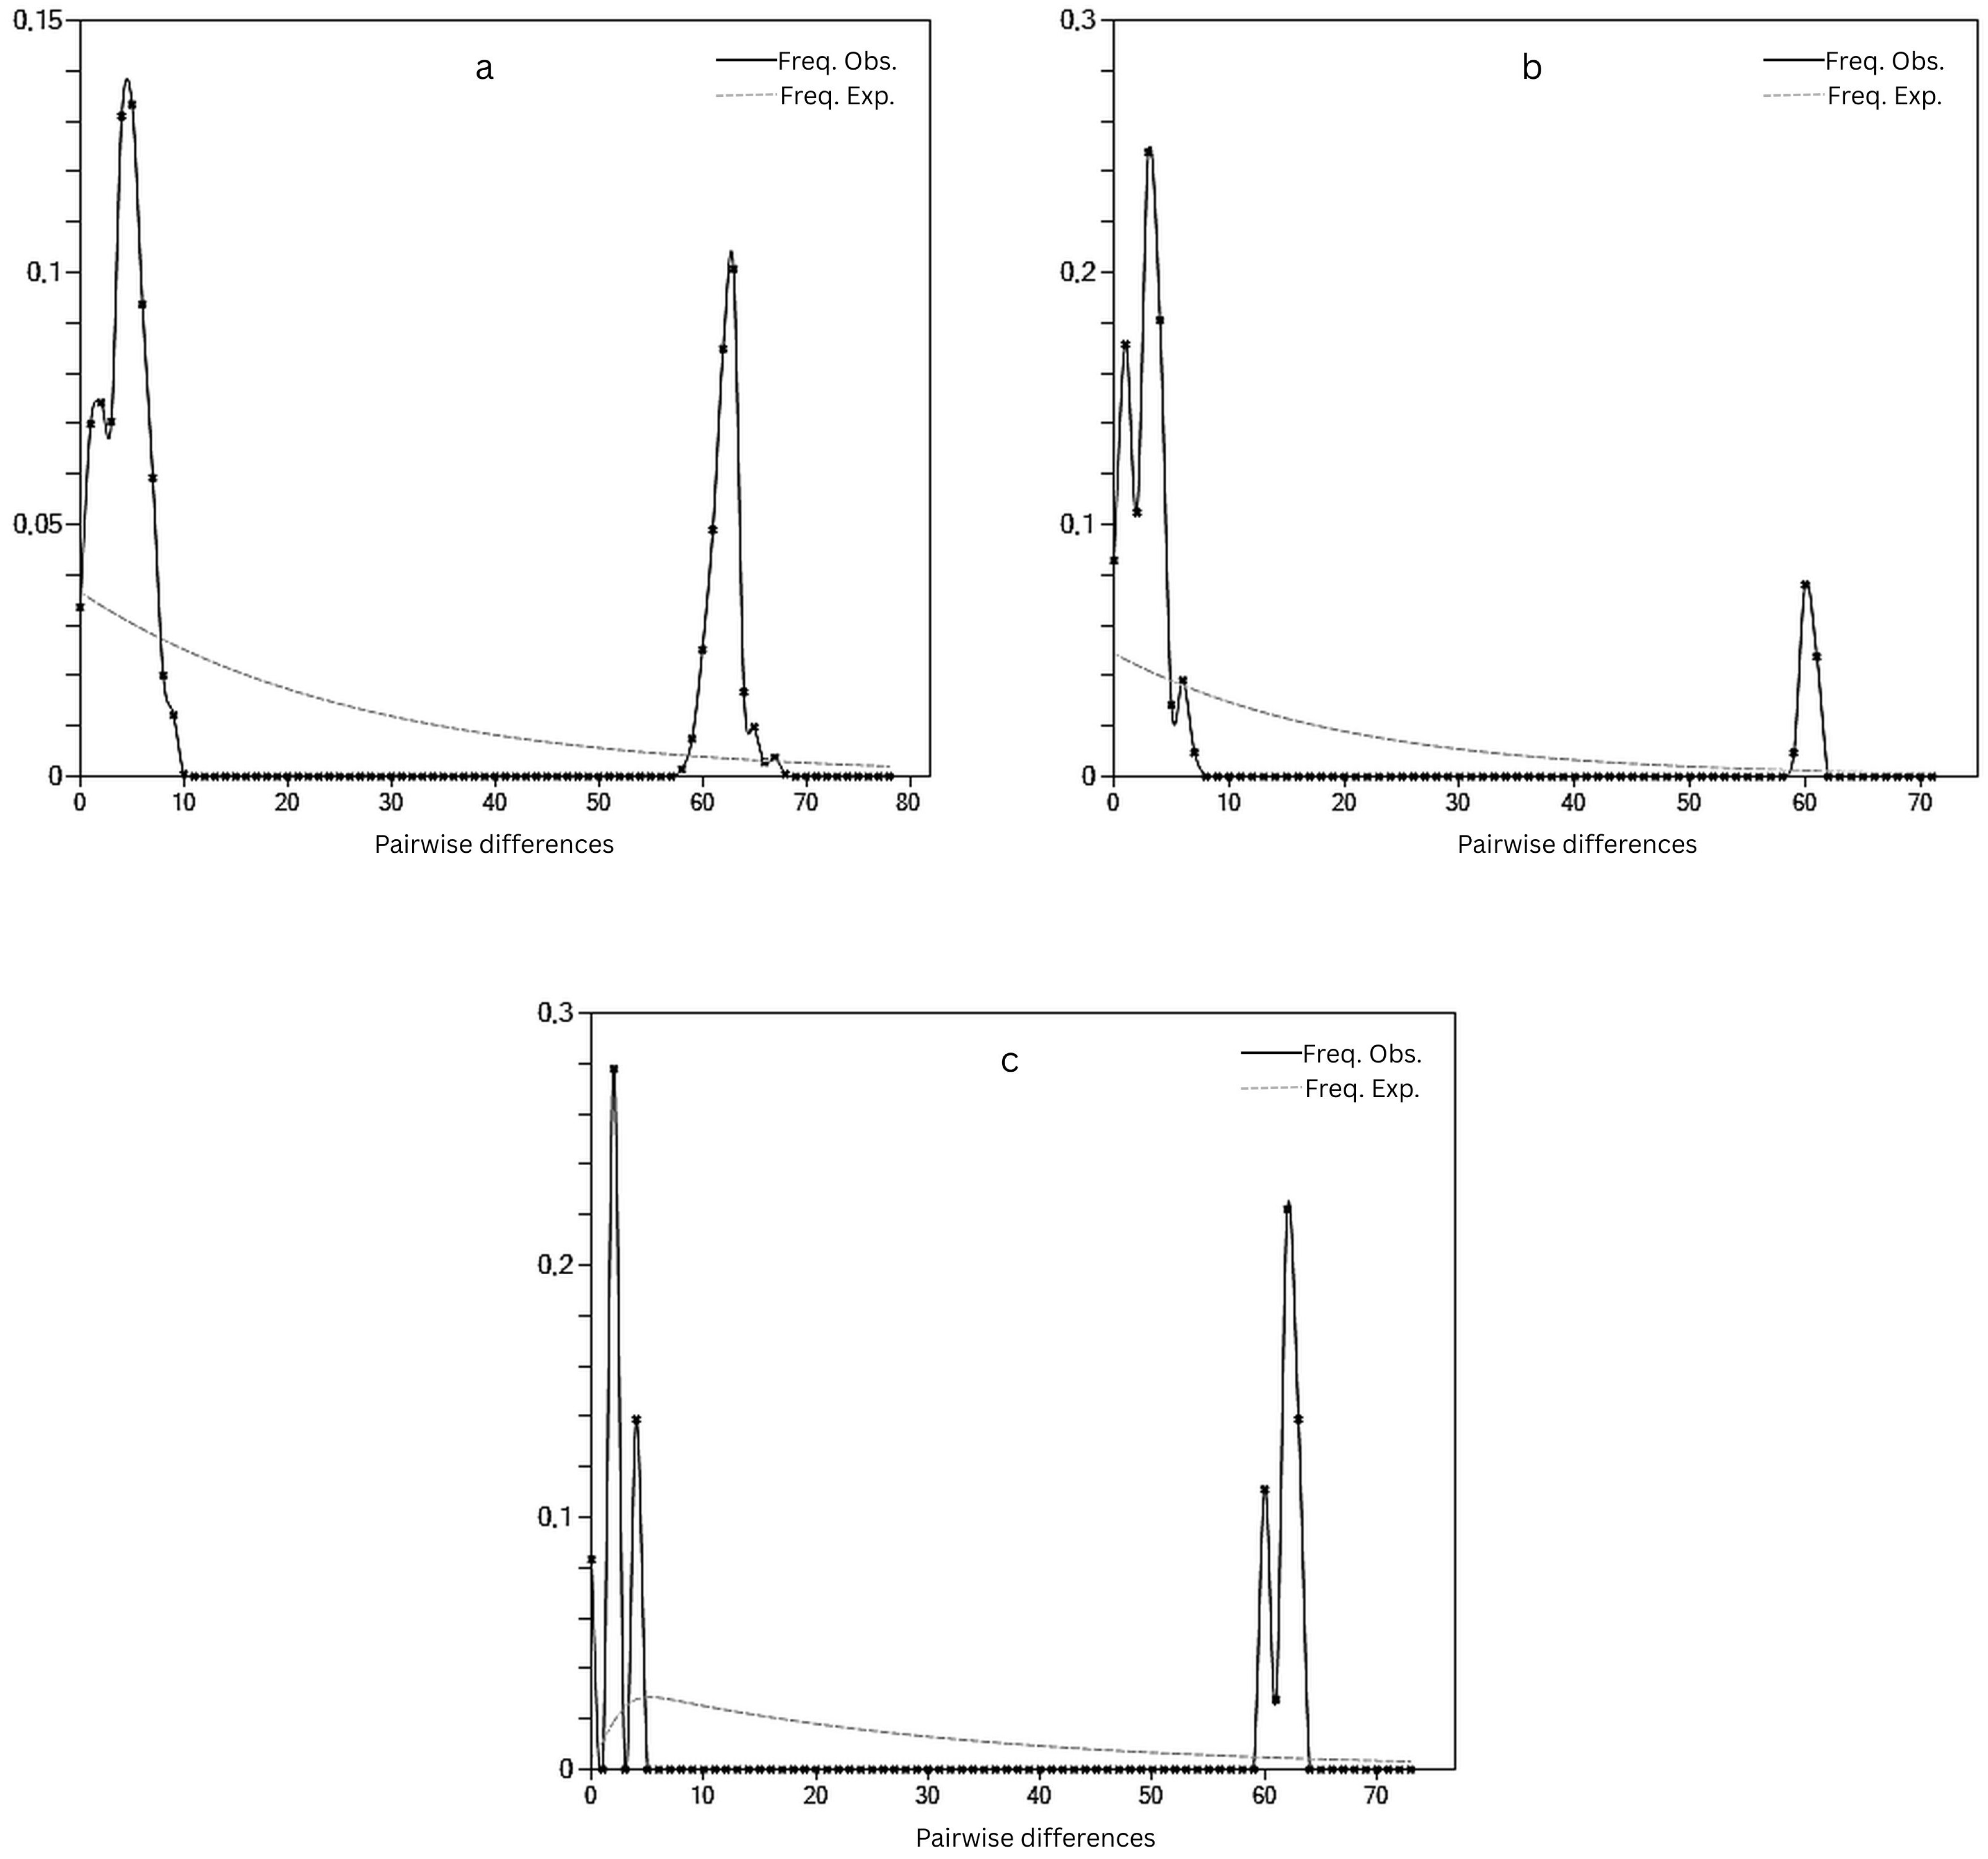
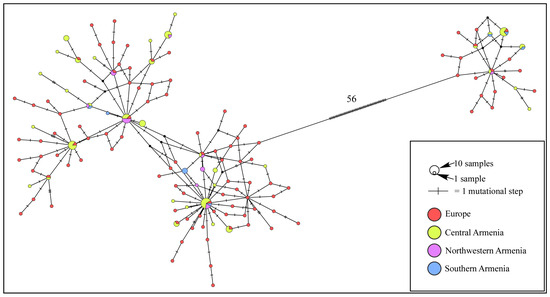
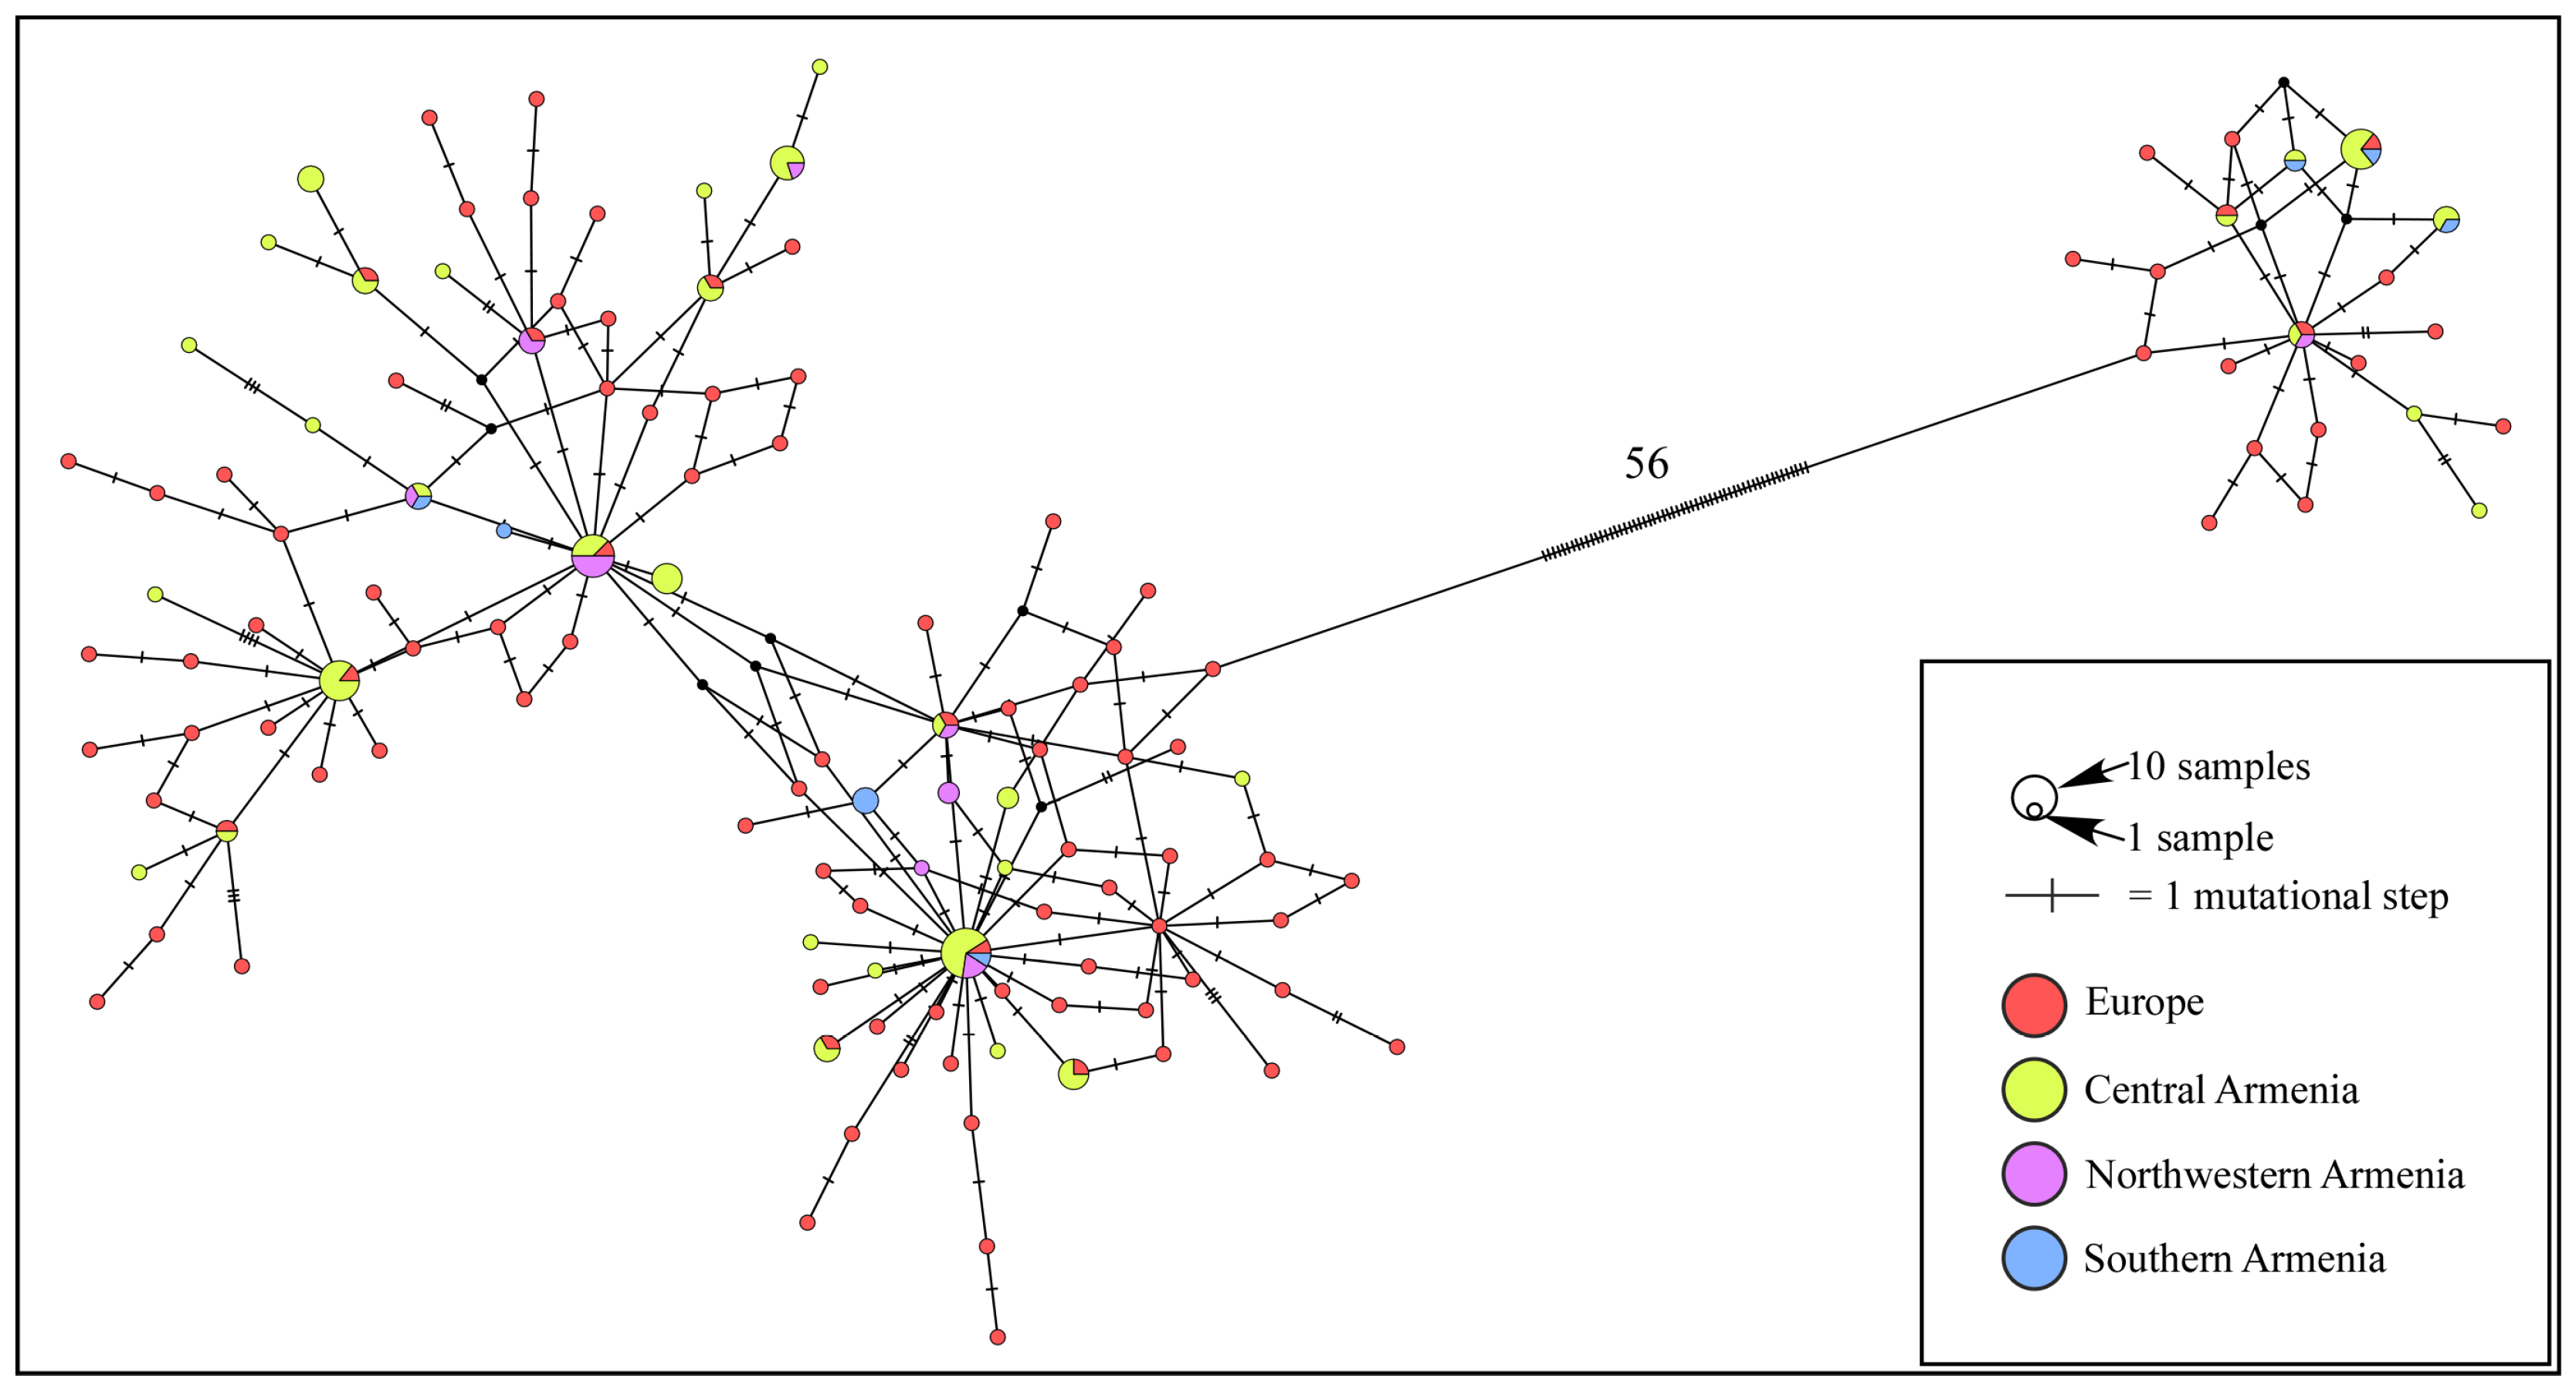
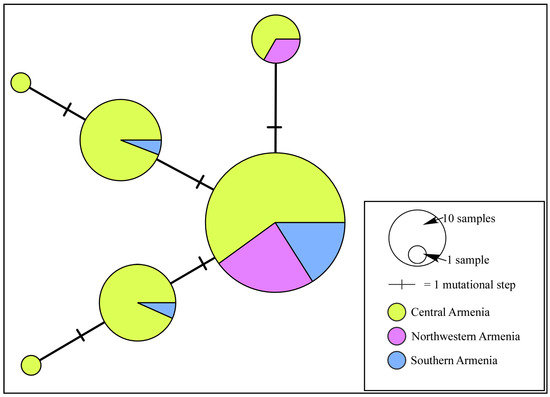
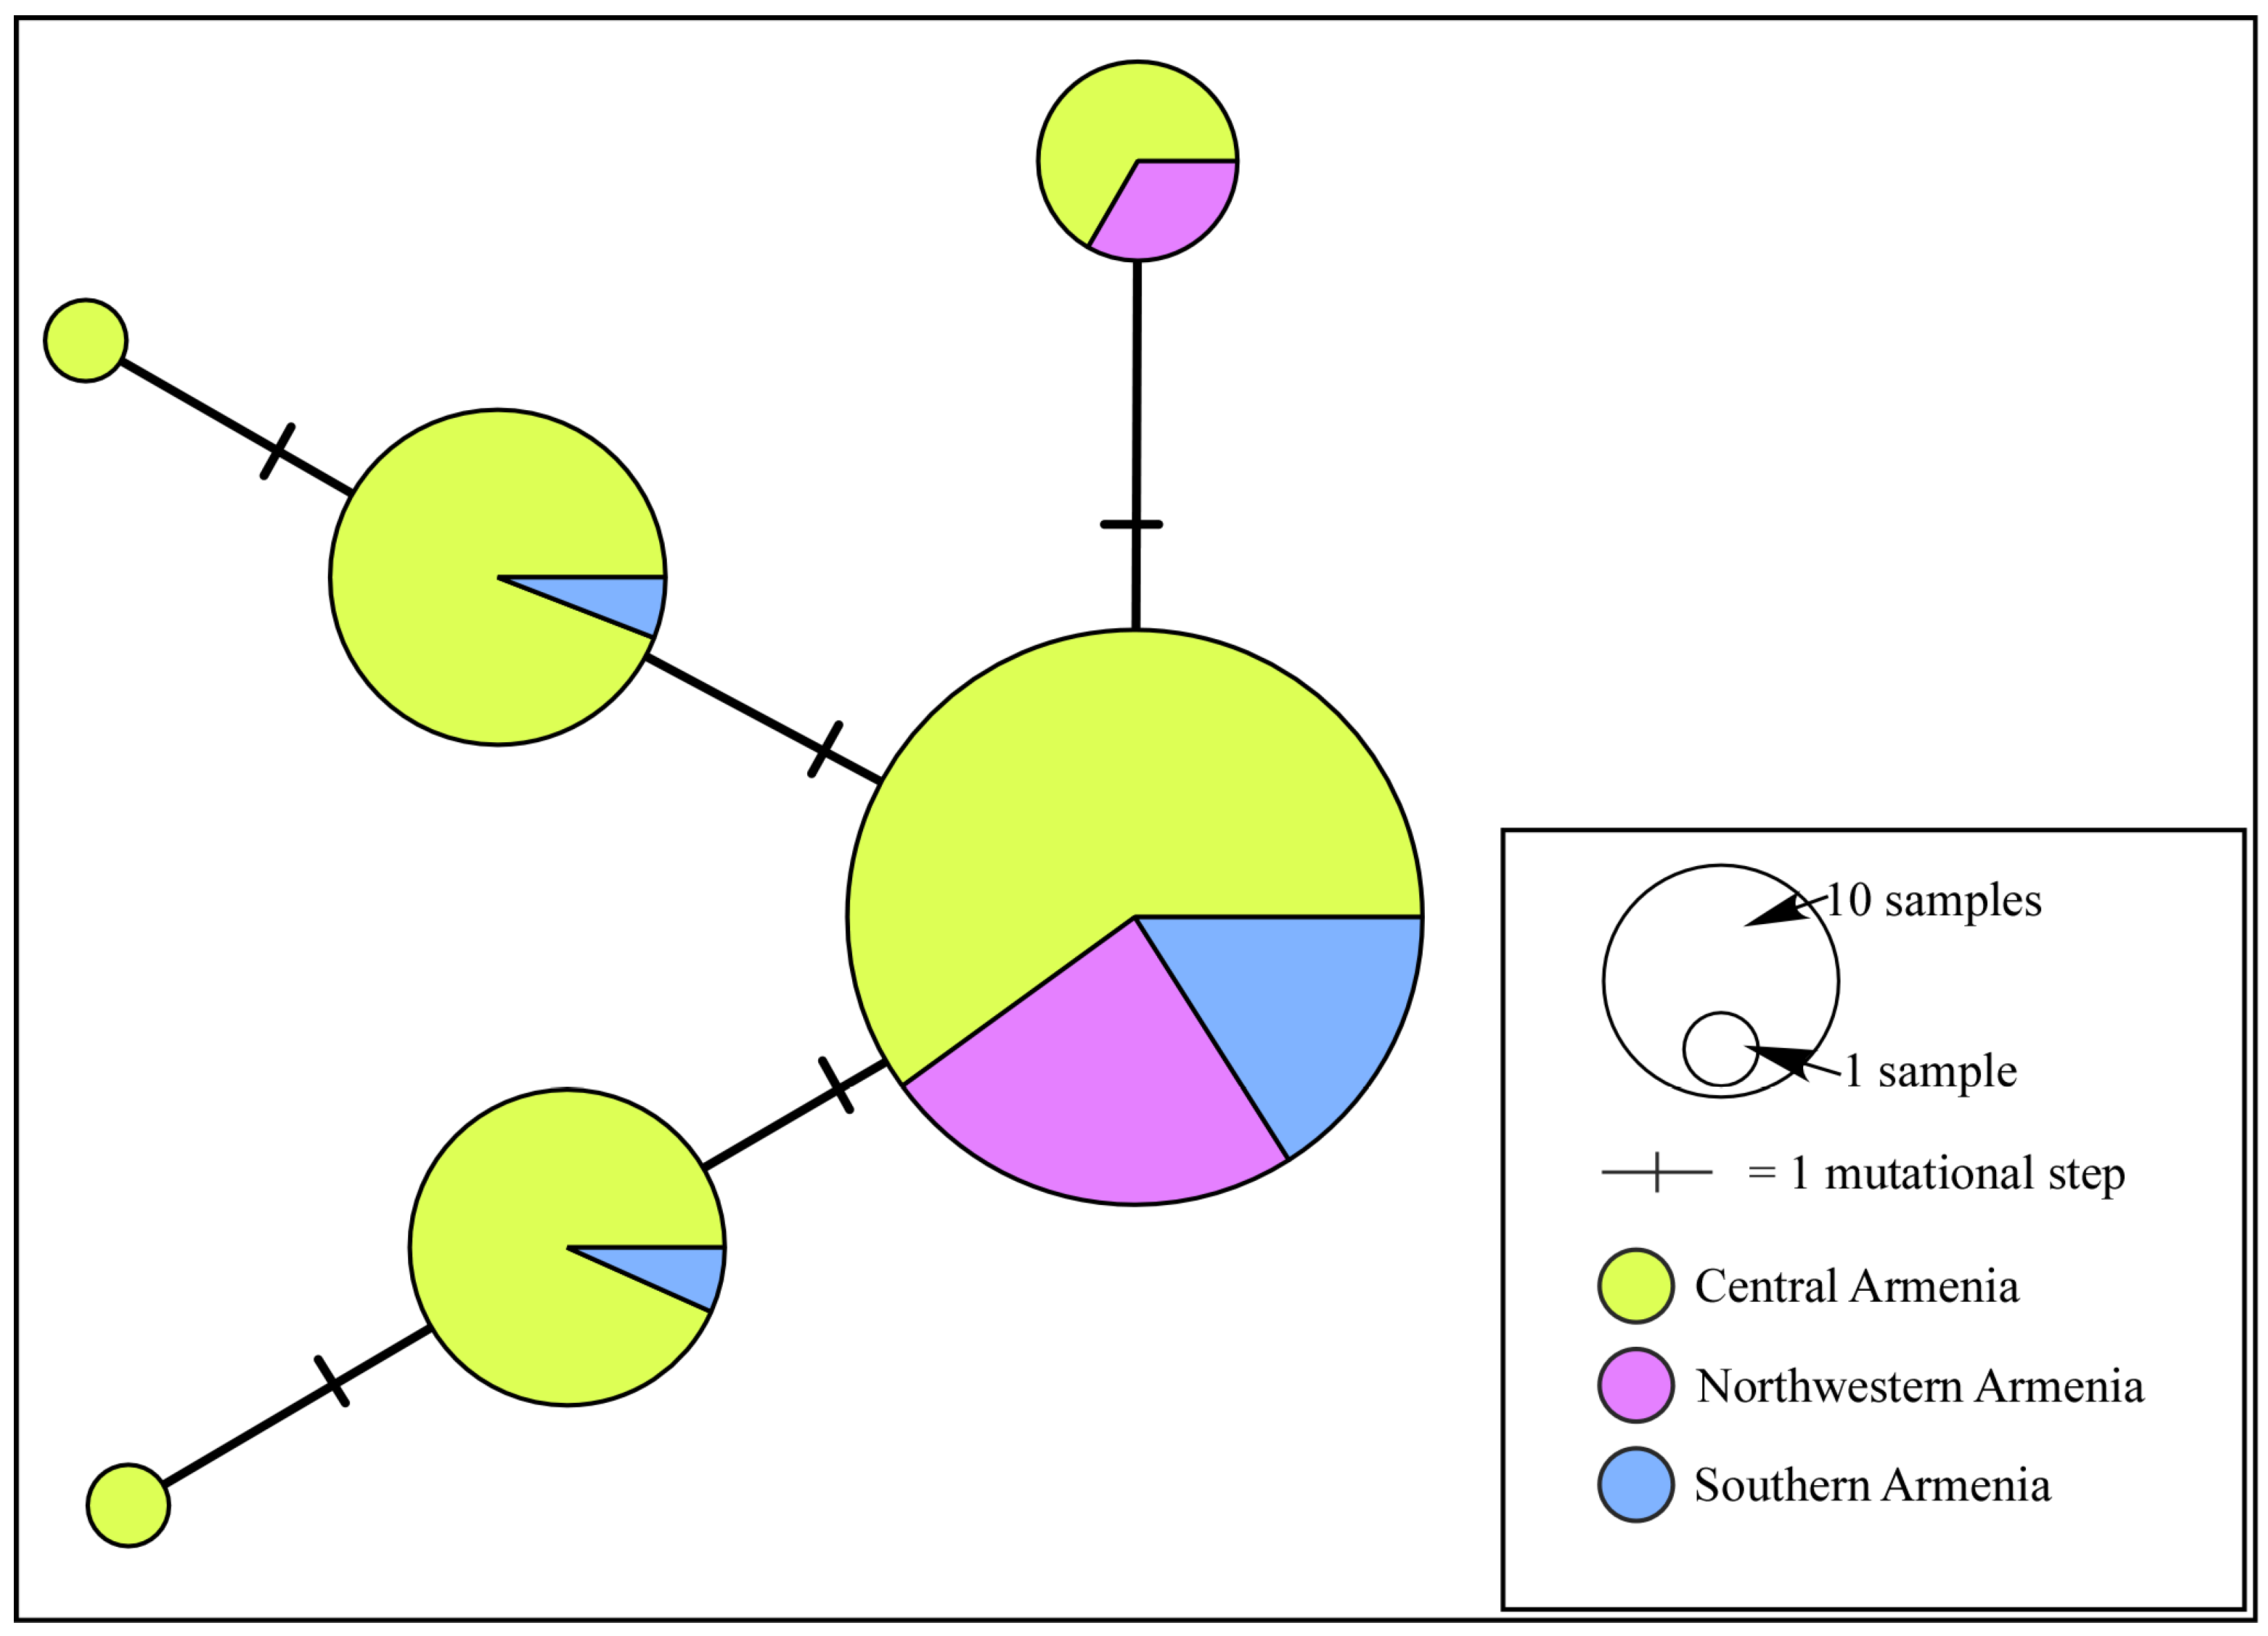
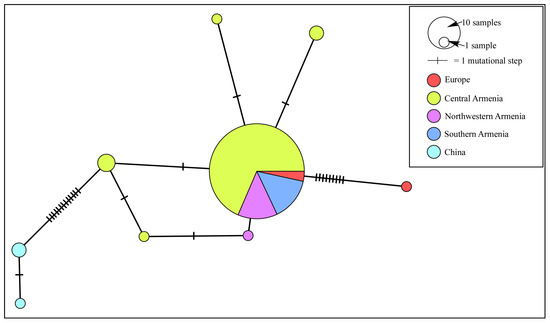
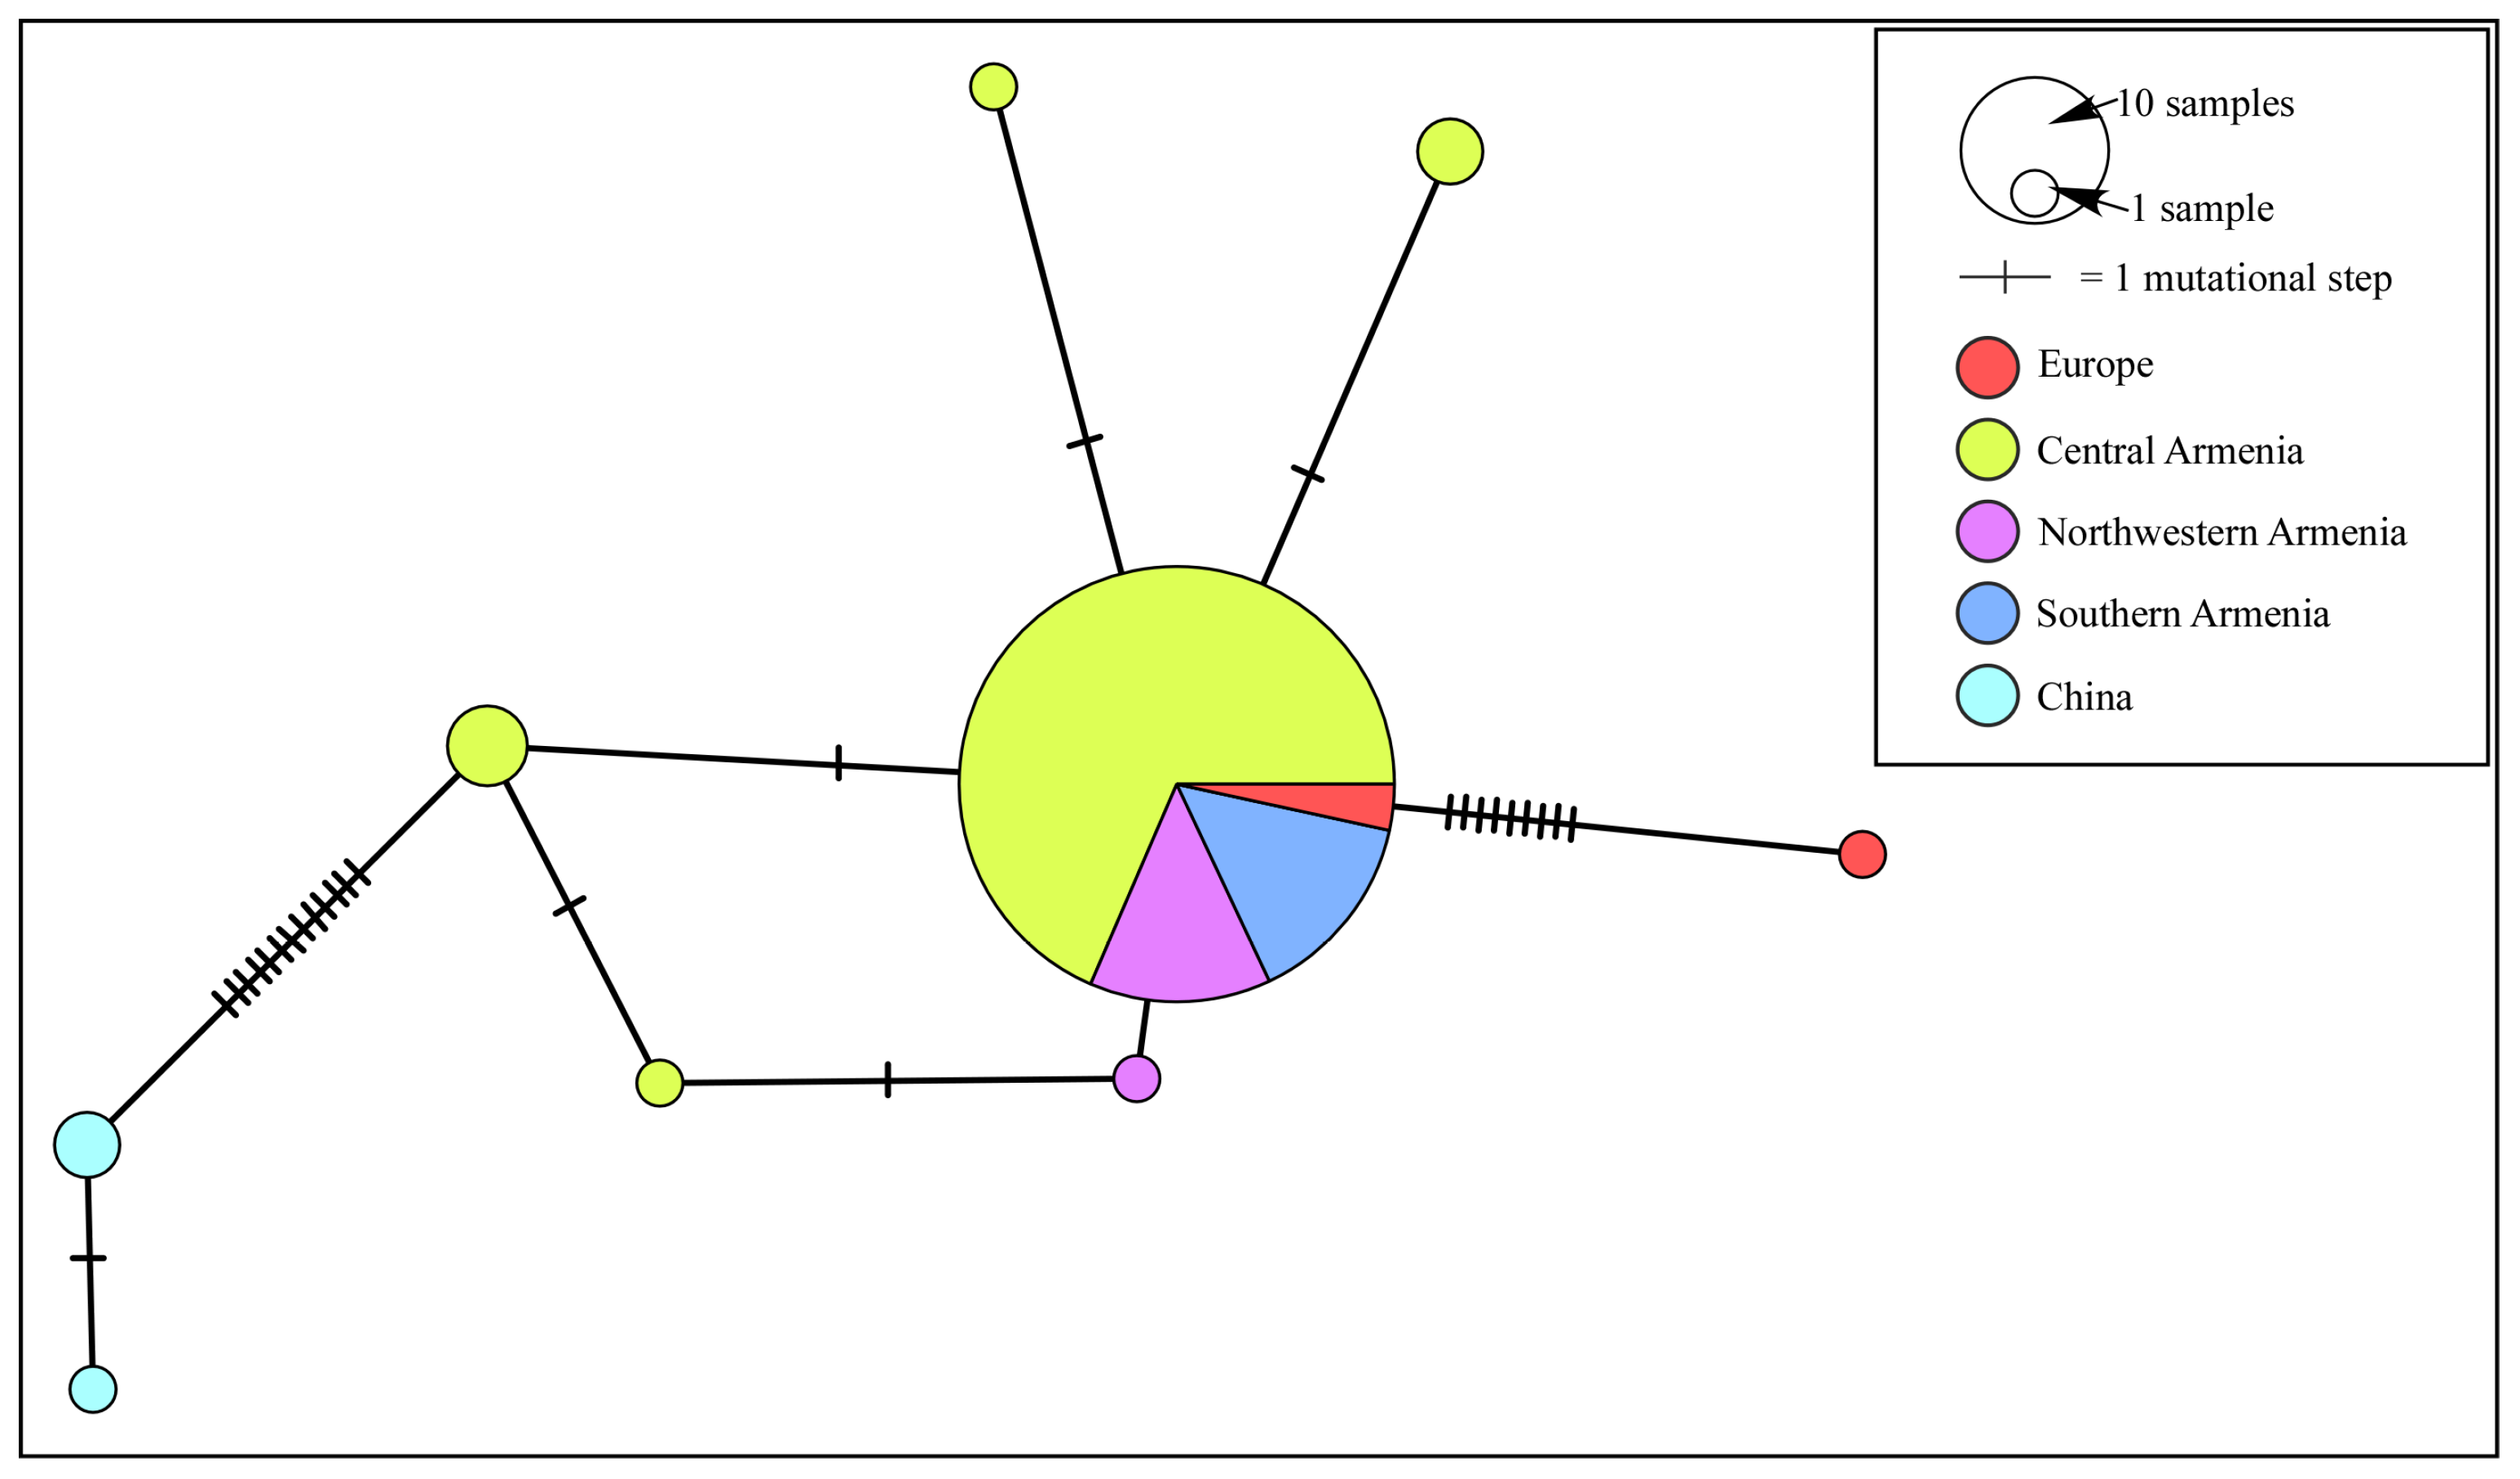
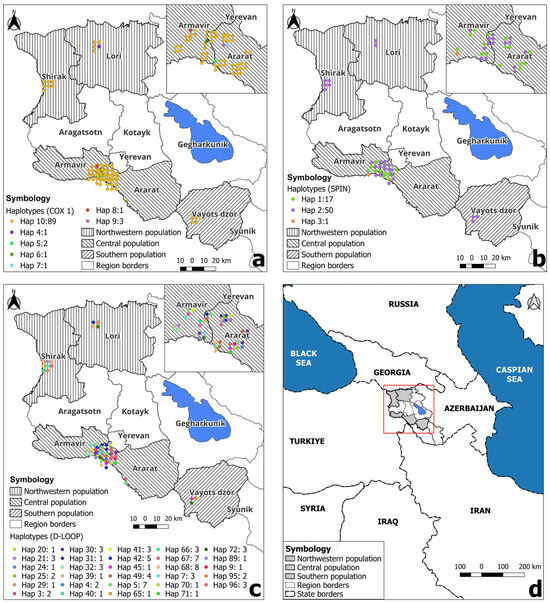
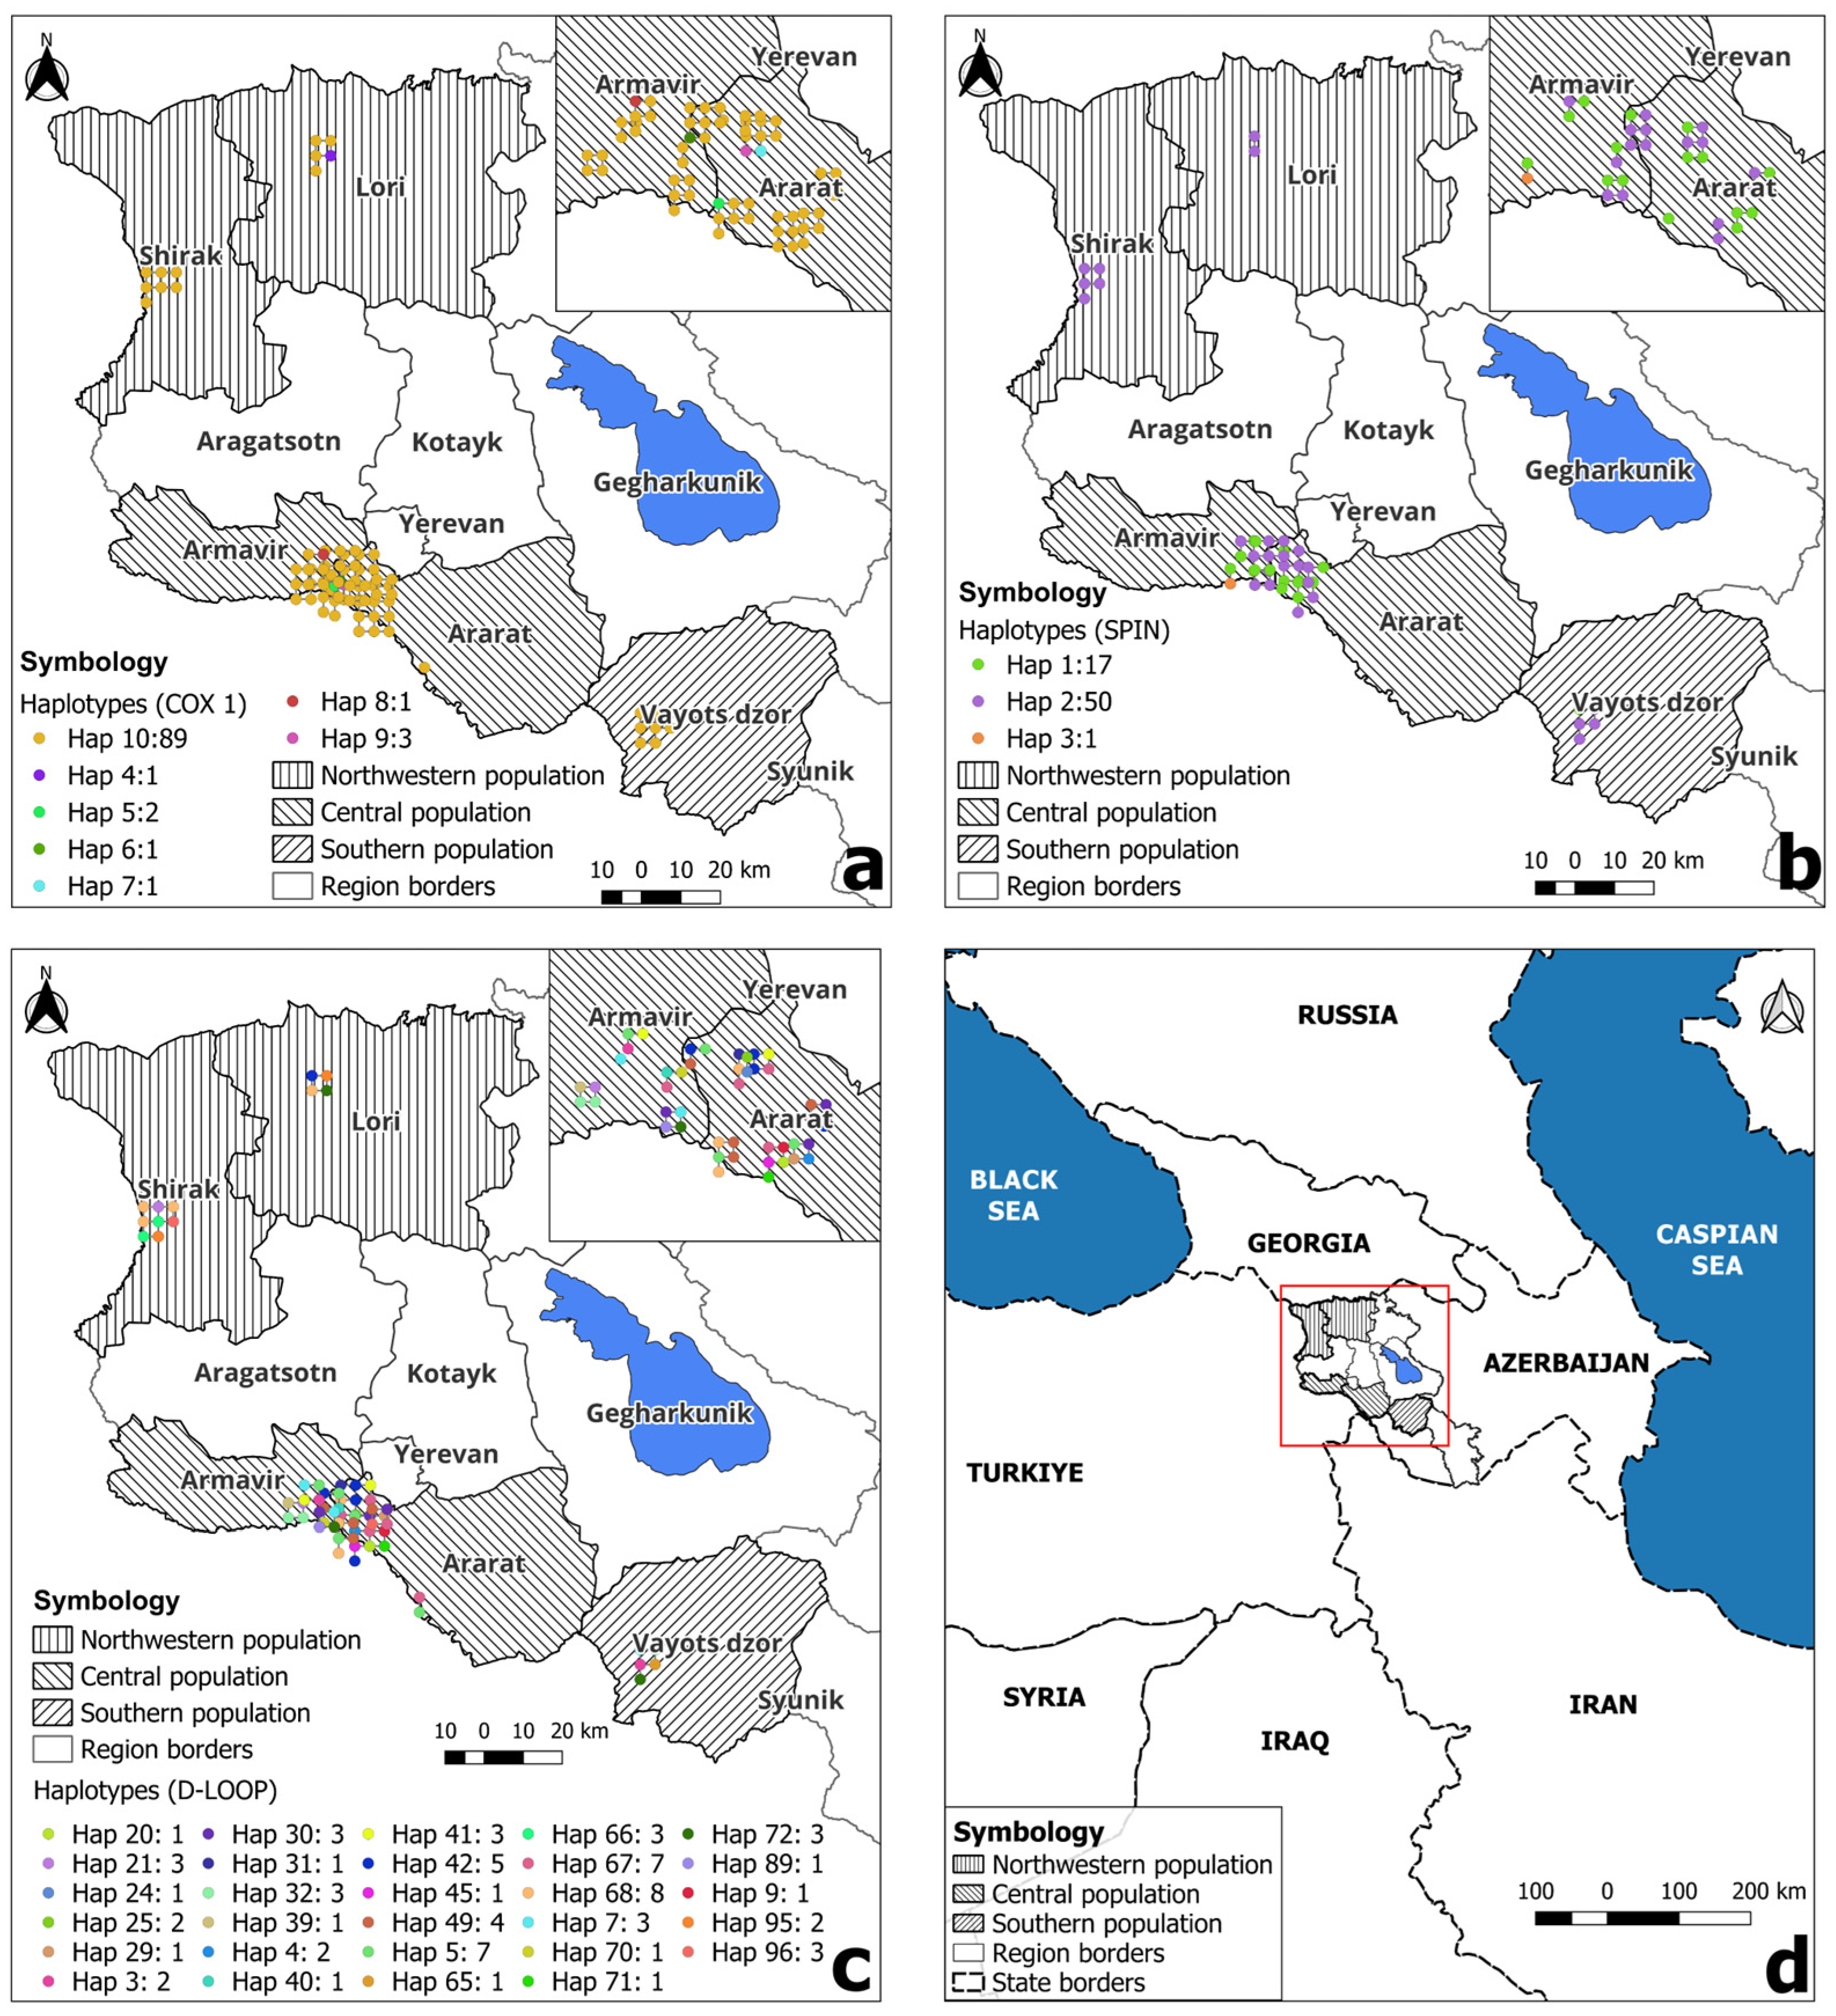

Disclaimer/Publisher’s Note: The statements, opinions and data contained in all publications are solely those of the individual author(s) and contributor(s) and not of MDPI and/or the editor(s). MDPI and/or the editor(s) disclaim responsibility for any injury to people or property resulting from any ideas, methods, instructions or products referred to in the content. |
© 2026 by the authors. Licensee MDPI, Basel, Switzerland. This article is an open access article distributed under the terms and conditions of the Creative Commons Attribution (CC BY) license.