


Simple Summary
Hurricanes can rapidly alter Caribbean forests and the food and shelter available to wildlife, but the responses of many island species remain poorly understood. We examined how the Puerto Rican Emerald, a hummingbird found only in Puerto Rico, responded across periods before and after Hurricanes María and Fiona. We analyzed 89,682 birdwatching checklists collected between 2013 and 2025 and combined them with satellite information on vegetation greenness and elevation. Reports of the species were lowest during the period following Hurricane María and increased during the period after Hurricane Fiona. The probability of reporting the hummingbird increased at higher elevations and in greener areas. Higher-elevation and greener sites also had a lower estimated probability of losing the species locally over time. These results show that reporting patterns and persistence were not uniform across Puerto Rico but were associated with environmental conditions. The findings can support conservation planning by identifying landscape conditions associated with greater persistence after major hurricanes.
Abstract
Tropical cyclones can rapidly alter vegetation structure and resource availability in Caribbean island ecosystems, yet species-specific, island-wide assessments of avian resilience remain limited. We integrated remotely sensed vegetation greenness, topographic data, and citizen-science observations to evaluate post-hurricane resilience in the Puerto Rican Emerald (Riccordia maugaeus), an endemic hummingbird of Puerto Rico. We defined resilience through post-disturbance decline, recovery toward baseline reporting probability, and local persistence. We analyzed 89,682 filtered eBird checklists from 2013 to 2025 across three hurricane-related periods: Pre-Maria, Inter-Hurricanes, and Post-Fiona. Landsat 8-derived Normalized Difference Vegetation Index (NDVI) and Shuttle Radar Topography Mission elevation data were linked to checklist locations to quantify environmental gradients associated with reporting probability and occupancy dynamics. Binomial generalized linear models showed that reporting probability was strongly associated with elevation, NDVI, sampling effort, and a Period × Elevation interaction. Predicted reporting probabilities were lowest during the Inter-Hurricanes period and were closer to Pre-Maria levels in the Post-Fiona period, particularly at higher elevations. Dynamic multi-season occupancy models showed that initial occupancy increased with elevation and NDVI, whereas local extinction probability decreased with both elevation and NDVI. These findings indicate that post-hurricane reporting probability and local persistence in the Puerto Rican Emerald were associated with elevation and vegetation condition, with higher-elevation and greener sites representing candidate areas for monitoring and potential conservation action.
1. Introduction
Tropical cyclones are recurrent ecological disturbances in Caribbean island ecosystems, where high winds, extreme rainfall, landslides, and flooding can rapidly alter forest structure, canopy cover, and vegetation condition [1,2,3]. For birds, hurricane effects may operate through both direct and indirect pathways. Direct effects include mortality, injury, and wind-driven displacement, whereas indirect effects include loss of vegetation cover, reduced food availability, altered foraging substrates, changes in nesting or roosting sites, shifts in microclimate, and changes in detectability after disturbance [4,5]. More recent studies have reinforced this framework, showing that hurricane responses in island bird assemblages are often species-specific and mediated by changes in forest structure, food resources, and habitat conditions [6,7,8].
These effects may be especially important on islands, where endemic species often have restricted ranges and where suitable habitats can be strongly structured by elevation, forest type, and local climatic gradients [9,10]. Puerto Rico provides a useful system for evaluating avian responses to hurricane-related disturbance because strong environmental heterogeneity occurs across a relatively small geographic area. Elevation, precipitation, temperature, vegetation structure, and land-use history create a mosaic of ecological life zones and forest types across the island [11,12,13,14]. These gradients may influence both bird occurrence and post-disturbance habitat recovery. Following Hurricane María, remote-sensing and field-based studies documented widespread canopy damage, defoliation, biomass loss, and abrupt declines in vegetation greenness across Puerto Rico, with recovery varying spatially across the landscape [2,3,15].
Hummingbirds may be particularly sensitive to disturbance-driven changes in vegetation and flowering resources because nectar is a central energetic resource for these small-bodied birds. Although hummingbirds also consume arthropods, floral nectar strongly shapes their foraging ecology and their interactions with plant communities [16,17]. In the Caribbean, plant–hummingbird interactions are structured by environmental gradients, floral traits, nectar rewards, hummingbird morphology, and island biogeographic context, indicating that changes in vegetation condition may influence the availability and spatial distribution of resources used by nectar-feeding birds [17,18].
The Puerto Rican Emerald is an endemic resident hummingbird of Puerto Rico. Species accounts and conservation assessments describe it as associated with forested habitats, including mountain forests, forest edges, shade coffee plantations, lowland wooded areas, mangroves, and gardens [19,20,21]. The Puerto Rico Breeding Bird Atlas documents breeding evidence across multiple ecological life zones, including subtropical moist forest and subtropical wet or lower montane wet forest, indicating that forested and higher-elevation habitats are important components of the species’ distribution [20]. However, species-specific quantitative studies of the Puerto Rican Emerald remain limited. Its strict insular endemism, year-round residency, dependence on vegetation-linked food resources, and occurrence across a broad elevational gradient make the Puerto Rican Emerald a particularly informative focal species for evaluating environmentally structured responses to hurricane disturbance.
Previous work has contributed important but more focused information on the species and its ecological context. Schubert described nesting behavior and nestling parasitism by botflies in a monitored nest of the Puerto Rican Emerald [22]. Gleffe et al. examined avian reproduction and the conservation value of shaded coffee plantations in Puerto Rico, including nesting records of the Puerto Rican Emerald [23]. The Puerto Rico Breeding Bird Atlas provided island-wide breeding evidence and habitat associations for the species [20]. Studies of plant–hummingbird interactions have included Puerto Rican hummingbirds within broader analyses of floral specialization and nectar-based interactions in the West Indies [17,18]. In addition, post-hurricane bird studies in Puerto Rico have evaluated forest-bird communities after Hurricanes Irma and María, but not as species-specific, island-wide assessments of the Puerto Rican Emerald occupancy dynamics [7].
Thus, although the Puerto Rican Emerald has been described in terms of distribution, breeding, habitat use, and participation in plant–hummingbird interactions, there remains limited quantitative assessment of how its reporting probability and occupancy dynamics vary jointly with elevation, vegetation condition, sampling effort, and sequential hurricane-related periods. This gap is important because descriptive habitat accounts alone cannot determine whether apparent post-hurricane changes reflect broad temporal effects, environmental gradients, imperfect detection, observer behavior, or spatially structured persistence. By moving beyond occurrence descriptions, this study provides a quantitative, island-wide, and detection-aware assessment of the Puerto Rican Emerald occurrence patterns across sequential hurricane-related periods.
In this context, ecological resilience can be evaluated through multiple complementary signals, including resistance to disturbance, recovery toward pre-disturbance conditions, and persistence of occupied sites across environmentally heterogeneous landscapes. For community-science datasets, these signals must be interpreted cautiously because reporting probability may reflect both biological processes and observation-related variation. Therefore, in this study, we treat post-hurricane resilience not as a direct demographic measure, but as an integrated pattern involving temporal change in reporting probability, recovery toward baseline-like conditions, and occupancy-based estimates of local persistence across elevation and vegetation-greenness gradients.
In this study, we evaluated spatial and temporal variation in Puerto Rican Emerald reporting probability and occupancy dynamics across hurricane-related periods in Puerto Rico. We hypothesized that reporting probability and occupancy would be positively associated with elevation and vegetation greenness. We further expected reporting probability to be lower during the post-María Inter-Hurricanes period than during the Pre-Maria baseline.
2. Materials and Methods
2.1. Study Area and Target Species
The study was conducted across the island of Puerto Rico, a topographically complex island within the Caribbean archipelago. Puerto Rico contains strong environmental gradients associated with elevation, rainfall, vegetation structure, and land-use history, which together shape a diverse mosaic of subtropical forest types and ecological life zones [11,12,13,14].
We selected the Puerto Rican Emerald as the focal species to evaluate post-hurricane responses along environmental and elevational gradients. It is strictly endemic to Puerto Rico and is the only extant representative of the genus Riccordia occurring in Puerto Rico [24]. Phylogenetic evidence places the species within a West Indian lineage of emerald hummingbirds and supports its reassignment from Chlorostilbon to Riccordia [25,26,27]. As a resident nectarivorous hummingbird, the Puerto Rican Emerald depends substantially on floral resources, although it also consumes small arthropods, making it potentially responsive to hurricane-induced changes in vegetation and resource availability. This is particularly relevant because nectarivorous birds can exhibit delayed declines following severe hurricane disturbance [28]. The species occurs across a broad range of Puerto Rican habitats, from lowlands to montane forests and including secondary forest and coffee plantations [24], while local surveys have documented a significant association with forest habitat relative to increasingly urbanized environments [29]. This combination of restricted geographic distribution, residency, trophic dependence on vegetation resources, and occurrence across a broad elevational gradient makes the Puerto Rican Emerald an appropriate focal taxon for testing whether elevation and post-disturbance vegetation condition are associated with post-hurricane reporting patterns and local persistence.
To visualize the study area, topographic context, and spatial sampling coverage, we mapped unique eBird checklist coordinates retained for the 2013–2025 study period over a Shuttle Radar Topography Mission (SRTM; USGS/SRTMGL1_003) elevation background. Repeated checklists sharing identical geographic coordinates were displayed once to reduce overplotting, resulting in 24,876 unique sampling locations, including 1900 unique locations at which the Puerto Rican Emerald was reported at least once. For cartographic display only, the SRTM raster was aggregated from its native ~30-m resolution to approximately 120 m; this display aggregation did not alter the checklist-level or grid-cell elevation covariates used in the statistical analyses (Figure 1).
Figure 1.
Study area, topography, and spatial distribution of filtered eBird checklist locations used in this study across Puerto Rico (2013–2025). Background shading represents elevation derived from the Shuttle Radar Topography Mission (SRTM). Gray points indicate 24,876 unique sampling locations corresponding to 89,682 filtered complete checklists, and red points indicate 1900 unique locations where the Puerto Rican Emerald was reported at least once. Repeated checklists sharing identical geographic coordinates are displayed once to reduce overplotting. The inset shows the geographic location of Puerto Rico within the Caribbean region.
2.2. Avian Occurrence Data and Filtering Criteria
Checklist-level occurrence data for the Puerto Rican Emerald were obtained from eBird [30], a global participatory science database widely used in avian ecology and conservation research [31]. Because semi-structured community-science data may be influenced by opportunistic observer behavior, spatial clustering, variation in sampling effort, and imperfect detection, we applied standardized filtering criteria and incorporated sampling-effort covariates and occupancy models in subsequent analyses [32].
Sampling-event information and species-occurrence records were imported into R version 4.5.2 (31 October 2025, ucrt) and linked using the unique eBird Sampling Event Identifier. The dataset was restricted to complete eBird checklists recorded using standardized Stationary or Traveling protocols; incidental observations were excluded. Stationary and Traveling protocols were retained because they provide explicit sampling-effort information and allow more consistent comparison among checklists than incidental observations. However, these semi-structured protocols do not eliminate heterogeneity in observer skill, site selection, accessibility, or species detectability. Complete checklists were used because they indicate that observers reported all species detected during the sampling event, allowing non-reported species to be treated as checklist-level non-detections. Accordingly, a value of 0 in the checklist-level response indicated that the Puerto Rican Emerald was not reported during that sampling event and was interpreted as a non-detection rather than evidence of true absence from the site. To standardize sampling effort and exclude unusually short or long surveys, only checklists lasting 5–240 min were retained. Traveling checklists were restricted to distances of ≤5 km to limit spatial heterogeneity within individual sampling events and improve correspondence between checklist coordinates and local environmental covariates. Checklists without a reported travel distance were retained and assigned a distance of 0 km in the standardized dataset.
To reduce repeated representation of sampling activity at the same place and time, one sampling event was retained for each exact combination of observation date, latitude, and longitude. When multiple records shared the same date and coordinates, the first record in the original sampling-event order was retained. Analyses were restricted to records collected between 1 January 2013 and 31 December 2025.
Each retained date–location combination was treated as a distinct sampling occasion for checklist-level analyses. Checklist-level reporting was coded as a binary response, where 1 indicated that the Puerto Rican Emerald was reported and 0 indicated that the species was not reported. Checklist duration and distance traveled were retained as sampling-effort covariates in the binomial GLM analyses to account for variation in observer effort among checklists. Longer surveys and greater distances traveled can increase the opportunity to encounter and report a species; therefore, both variables were included to reduce variation in reporting probability attributable to sampling effort rather than to ecological or temporal conditions. The filtering and integration procedure produced a dataset that included 89,682 checklists.
2.3. Hurricane-Related Environmental Periods
Checklist records were classified into three hurricane-related environmental periods based on the date of each checklist. Period boundaries were defined around the landfall dates of Hurricane María and Hurricane Fiona in Puerto Rico, as reported by the National Hurricane Center [33,34]. The Pre-Maria baseline period included checklists collected from 1 January 2013 through 19 September 2017, representing the interval before Hurricane María made landfall in Puerto Rico. The Inter-Hurricanes period began on 20 September 2017, the date of Hurricane María’s landfall in Puerto Rico, and extended through 17 September 2022, the day before Hurricane Fiona’s landfall. The Post-Fiona period began on 18 September 2022 and extended through 31 December 2025. These periods were used as hurricane-related temporal categories rather than as direct measures of hurricane impact; therefore, results were interpreted as temporal associations, not causal estimates of storm effects. The period variable was used as a categorical predictor in checklist-level GLMs and in the detection component of the dynamic occupancy model.
2.4. Environmental Covariates and Spatiotemporal Coupling
Environmental covariates were extracted for checklist locations using Google Earth Engine (GEE), a cloud-based geospatial analysis platform for large-scale remote-sensing data processing [35]. The standardized sampling-event dataset generated in R was uploaded to GEE as a point FeatureCollection using the longitude and latitude of each checklist. Checklist coordinates were spatially coupled with topographic and vegetation covariates at the observation location. Environmental values were extracted from the pixel containing each checklist coordinate at a nominal spatial resolution of 30 m. For checklist-level models, covariates were linked directly to each checklist. For dynamic occupancy models, covariates were summarized at the spatial grid-cell level and used as site-level covariates.
2.4.1. Topographic Elevation
Topographic elevation was extracted from the NASA Shuttle Radar Topography Mission (SRTM) Digital Elevation Model (USGS/SRTMGL1_003), which provides elevation data at approximately 1 arc-s spatial resolution (~30 m) [36]. For checklist-level analyses, elevation values were extracted from the pixel containing the geographic coordinate of each eBird checklist. Negative or unavailable elevation values were assigned a value of 0 m during extraction. For dynamic occupancy models, elevation was summarized at the 0.01° × 0.01° grid-cell level as mean elevation and used as a site-level covariate. Elevation was expressed in 100-m units in checklist-level GLMs to improve coefficient interpretability, whereas grid-cell mean elevation was standardized as a z-score prior to dynamic occupancy modeling.
2.4.2. Vegetation Greenness (NDVI)
Vegetation greenness was quantified using the Normalized Difference Vegetation Index (NDVI), a remote-sensing index derived from red and near-infrared reflectance that is widely used to characterize vegetation greenness and condition [37]. NDVI was derived from Landsat 8 surface reflectance imagery in GEE. Landsat surface reflectance products provide atmospherically corrected reflectance data at 30-m spatial resolution, allowing checklist locations to be linked with local vegetation conditions [38,39].
Landsat 8 Collection 2 Tier 1 Level 2 imagery (LANDSAT/LC08/C02/T1_L2) was used. The red (SR_B4) and near-infrared (SR_B5) bands were converted to surface reflectance using the officially specified Collection 2 multiplicative scale factor of 0.0000275 and additive offset of −0.2 [38]. Pixels identified as fill, dilated cloud, cirrus, cloud, or cloud shadow in the QA_PIXEL band were excluded, as were radiometrically saturated pixels identified in the QA_RADSAT band.
NDVI was calculated from the scaled surface-reflectance values using the normalized difference between near-infrared (NIR) and red reflectance (Red):
Pixels with a denominator equal to zero were treated as unavailable, and NDVI values were constrained to the theoretical range from −1 to 1.
For each checklist, Landsat 8 imagery was filtered using a ±16-day temporal window centered on the observation date. This window was selected to encompass one nominal Landsat 8 repeat cycle before and after each checklist date, thereby increasing the likelihood of obtaining a valid cloud-free observation while limiting temporal mismatch between the eBird record and vegetation conditions [40]. Among the images with a valid, unmasked pixel at the checklist coordinate, the Landsat observation temporally closest to the eBird observation date was selected. When valid observations before and after the checklist were equally distant in time, the earlier observation was prioritized. The NDVI value was extracted from the pixel containing the checklist coordinate at 30-m spatial resolution.
To prevent the temporal search window from crossing hurricane-period boundaries, Pre-Maria checklists could not receive imagery acquired on or after 20 September 2017; Inter-Hurricanes checklists could not receive imagery acquired before 20 September 2017 or on or after 18 September 2022; and Post-Fiona checklists could not receive imagery acquired before 18 September 2022.
The acquisition date of the selected Landsat image and its temporal difference from the eBird observation date were retained for quality control. When no valid Landsat pixel was available within the permitted temporal window, NDVI was recorded as missing rather than interpolated or replaced.
For checklist-level GLMs, NDVI was linked directly to each checklist based on its geographic coordinate and observation date. For dynamic occupancy models, NDVI values were summarized at the grid-cell level and standardized as z-scores prior to model fitting.
Because NDVI values were unavailable for a subset of checklist records, models that included NDVI were fitted using complete cases with available NDVI values. The full 2013–2025 checklist dataset included 89,682 checklists, whereas the NDVI-complete subset used for environmental GLMs included 68,976 checklists.
2.4.3. Alternative Vegetation Index (EVI2)
As an alternative measure of vegetation greenness, the two-band Enhanced Vegetation Index (EVI2) was calculated using the red and near-infrared surface-reflectance bands from Landsat 8 [41]:
Pixels with a denominator equal to zero were treated as unavailable. EVI2 was derived using the same Landsat collection, surface-reflectance scaling, pixel-quality masks, radiometric-saturation mask, 30-m spatial resolution, ±16-day temporal window, hurricane-period restrictions, and nearest-valid-observation selection procedure used for NDVI. Thus, the two vegetation indices were generated under equivalent spatial, temporal, and quality-control conditions. EVI2 was evaluated as an alternative vegetation index in the sensitivity analysis described in Section 2.8.
2.5. Descriptive Encounter-Rate Analyses
Raw checklist-level encounter rates were calculated as the proportion of checklists in which the Puerto Rican Emerald was reported. Encounter rates were summarized by hurricane-related period and by calendar year. Annual observed encounter rates and associated 95% binomial confidence intervals were used to visualize temporal patterns before and after Hurricane María and Hurricane Fiona. These descriptive summaries were not interpreted as corrected estimates of abundance or occupancy because raw encounter rates may be influenced by variation in sampling effort, observer behavior, and spatial coverage.
As a complementary post hoc summary of elevational patterns, predicted elevational centroids were calculated for each hurricane-related period by weighting elevations from a uniform prediction grid spanning 0–1300 m at 10-m intervals by their corresponding GLM-predicted reporting probabilities.
2.6. Checklist-Level Binomial GLMs
To evaluate checklist-level reporting probability while accounting for sampling effort and environmental covariates, we fitted binomial Generalized Linear Models (GLMs) with a logit link function. The response variable was a binary checklist-level reporting outcome, where 1 indicated that the Puerto Rican Emerald was reported and 0 indicated that it was not reported. Hurricane-related environmental period was included as a categorical predictor with three levels: Pre-Maria baseline, Inter-Hurricanes, and Post-Fiona. The Pre-Maria baseline was used as the reference category. Sampling-effort covariates included checklist duration in minutes and distance traveled in kilometers. Environmental covariates included elevation and NDVI. Elevation was expressed in 100-m units to improve the biological interpretability of coefficient estimates.
We evaluated a set of candidate GLMs representing increasing ecological and observational complexity. All candidate models were fitted to the same analytical subset of 68,976 checklists with complete NDVI data to ensure direct comparability of AIC values. The candidate set included the following model structures:
- m0: Presence~1
- m1: Presence~Period
- m2: Presence~Period + Duration_min + Distance_km
- m3: Presence~Period + Elevation_100m + NDVI + Duration_min + Distance_km
- m4: Presence~Period × Elevation_100m + NDVI + Duration_min + Distance_km
The interaction model was included to evaluate whether elevational patterns in checklist-level reporting probability differed among hurricane-related periods. Candidate models were compared using Akaike’s Information Criterion (AIC), ΔAIC, and Akaike weights [42]. Model explanatory performance was summarized using McFadden’s pseudo-R2 [43]. For the best-supported model, coefficients were converted to odds ratios to quantify the magnitude and direction of predictor effects. Predicted checklist-level reporting probabilities were generated across a representative elevational gradient for each hurricane-related period while holding NDVI, checklist duration, and distance traveled at their mean values. These predictions were used to visualize how checklist-level reporting probability varied jointly across elevation and hurricane-related environmental period.
Temporal Sensitivity Analysis: Secondary GLMs
To evaluate the robustness of our temporal classification, we implemented secondary GLMs using both calendar years and continuous time-since-disturbance predictors. By evaluating the interaction between time post-María and elevation, we specifically tested whether temporal trajectories in adjusted reporting probability differed across the altitudinal gradient while controlling for sampling effort and vegetation greenness (NDVI). The annual model replaced hurricane-related period with calendar year as a categorical predictor while retaining elevation, NDVI, checklist duration, and distance traveled as covariates. We also evaluated continuous time since Hurricane María during the Inter-Hurricanes period only, to avoid mixing the post-María trajectory with the subsequent Fiona disturbance. Time since María was calculated in days from 20 September 2017 and expressed in years for interpretation. We compared an additive model with a model including a Years since María × Elevation interaction using AIC. A parallel exploratory Post-Fiona time-since-disturbance analysis was also conducted. Although this secondary analysis improved temporal resolution within the Inter-Hurricanes interval, the Inter-Hurricanes category in the primary period-based models remained a broad analytical grouping. Therefore, estimates for this period were interpreted as average conditions across a heterogeneous post-María/pre-Fiona interval, rather than as a single biologically uniform post-disturbance state.
2.7. Dynamic Multi-Season Occupancy Modeling
To account for imperfect detection and evaluate site-level occupancy dynamics, we implemented multi-season dynamic occupancy models using a colonization-extinction framework [44] with the colext() function in the unmarked package (version 1.5.1) in R [45]. This framework estimates the probability that a site is occupied while explicitly accounting for the possibility that the species may be present but not detected during a given survey.
For the dynamic occupancy analysis, Puerto Rico was divided into spatial sites by rounding checklist longitude and latitude to two decimal places and combining the resulting coordinates into a unique site identifier. In the dynamic occupancy framework, each spatial grid cell represented a site, the three hurricane-related periods represented primary seasons, and up to three selected checklists within each site-period represented secondary sampling occasions. Thus, a retained date-location sampling event could contribute a secondary survey occasion within a site-period but was not treated as an independent occupancy site. Checklists were assigned to three primary periods: Pre-Maria, Inter-Hurricanes, and Post-Fiona. Sites were initially retained when they contained at least one eligible checklist in each of the three periods; no minimum greater than one checklist per site and period was required. Consequently, no retained site had a completely unsampled primary period. This procedure identified 1048 initially eligible sites.
Site-level mean elevation and mean NDVI were calculated from all eligible checklists recorded within each initially retained site across 2013–2025, before selecting the secondary sampling occasions. Missing values were excluded from the calculation of each mean. Four sites had no valid NDVI observations and were therefore excluded, resulting in a final dataset of 1044 spatial sites. Mean elevation and mean NDVI were subsequently standardized as z-scores across the final set of sites.
Within each site and primary period, checklists were ordered by year and then by their original row order in the analytical dataset, which provided a deterministic ordering within years. The first three checklists were retained as secondary sampling occasions. This cap standardized the maximum number of secondary occasions across site-period combinations and prevented heavily sampled sites from contributing disproportionate numbers of surveys. Site-period combinations containing only one or two eligible checklists were retained, and the remaining occasions were coded as missing values. Detection histories were coded as 1 when the Puerto Rican Emerald was reported and 0 when it was not reported on a complete checklist. The resulting detection-history matrix contained 1044 sites and nine columns, corresponding to three secondary occasions in each of the three primary periods, with 7908 observed survey occasions and 1488 missing occasions. Because each primary period spanned multiple years, closure among secondary occasions within a period could not be guaranteed. Dynamic parameters were therefore interpreted as broad occupancy transitions among hurricane-related periods rather than as annual demographic rates.
The dynamic occupancy model estimated four parameters: initial occupancy probability (ψ), colonization probability (γ), local extinction probability (ε), and detection probability (p). Initial occupancy represents the probability that a site was occupied during the first primary period. Colonization represents the probability that a site unoccupied during one primary season became occupied in the following primary period. Local extinction represents the probability that a site occupied during one primary season became unoccupied in the following primary period. Detection probability represents the probability of detecting the species during a secondary survey, given that the site was occupied.
The standardized site-level mean elevation and mean NDVI covariates were used in the dynamic occupancy models. The best-supported model included elevation and NDVI as predictors of initial occupancy, NDVI as a predictor of colonization, elevation and NDVI as predictors of local extinction, and hurricane-related period as a predictor of detection probability:
- ψ~Elevation + NDVI
- γ~NDVI
- ε~Elevation + NDVI
- p~Period
Under this parameterization, elevation and NDVI were evaluated as site-level covariates associated with initial occupancy and local persistence, while period was included in the detection component to allow detection probability to vary among hurricane-related periods. Period was not modeled as a direct predictor of colonization or local extinction in the final selected model; therefore, dynamic parameters were interpreted in relation to elevation and NDVI rather than as direct causal effects of hurricane periods.
Candidate dynamic occupancy models were compared using AIC, ΔAIC, and Akaike weights. Model convergence was inspected before interpretation. Predicted local extinction probabilities were generated across the elevational gradient while holding NDVI at its mean standardized value. For spatial visualization, predicted local extinction probabilities were also generated for each retained grid cell using its site-level elevation and NDVI values and mapped across Puerto Rico. All dynamic occupancy analyses were conducted in R using the unmarked package.
2.8. Sensitivity Analysis Using EVI2
As a sensitivity analysis, the checklist-level GLM and dynamic occupancy model were refitted by replacing NDVI with EVI2 while retaining the same observations, sites, detection histories, covariates, and model structures. NDVI and EVI2 were evaluated in separate models and were not included simultaneously. Model performance was compared using AIC, and the direction and ecological interpretation of the estimated effects were examined for consistency between indices.
2.9. Software
Initial integration and filtering of the eBird sampling-event and species-occurrence information were conducted in R. Elevation, NDVI, and EVI2 were extracted using Google Earth Engine. Subsequent data manipulation, statistical modeling, spatial visualization, and figure generation were conducted in R version 4.5.2 (31 October 2025, ucrt) [46]. Data import and manipulation were performed using data.table version 1.18.2.1 and the tidyverse packages readr version 2.2.0, dplyr version 1.2.0, and tidyr version 1.3.2 [47]. Checklist-level binomial GLMs were fitted using the glm() function with a binomial error distribution and logit link. Dynamic multi-season occupancy models were fitted using colext() from unmarked version 1.5.1 [45]. Spatial visualization was conducted using sf version 1.1.0 [48], and figures were generated using ggplot2 version 4.0.2 [49] and scales version 1.4.0. Model summaries and coefficient tables were processed using broom version 1.0.12.
We evaluated post-hurricane resilience using three complementary model-based indicators: (1) reduction in reporting probability during the Inter-Hurricanes period relative to the Pre-Maria baseline, interpreted as an apparent post-disturbance response; (2) convergence of Post-Fiona reporting probabilities toward Pre-Maria values, interpreted as partial recovery at the checklist level; and (3) lower estimated local extinction probability in higher-elevation or greener sites, interpreted as evidence of spatially structured persistence. These indicators were interpreted jointly rather than as direct measures of abundance or demographic recovery.
The complete reproducibility package, including the data-preparation and environmental-covariate workflows, the primary analysis and figure-generation workflow, the NDVI–EVI2 sensitivity analysis, the secondary temporal sensitivity analysis, derived datasets, model outputs, data dictionaries, and validation files, is provided as File Riccordia maugaeus reproducibility package (ZIP archive) in the Supplementary Materials.
3. Results
3.1. Dataset Overview and Sampling Effort
A total of 89,682 eBird checklists from Puerto Rico spanning 2013–2025 were analyzed. The Puerto Rican Emerald was reported in 5174 checklists, representing an overall observed encounter frequency of 5.77%, and was not reported in 84,508 checklists (94.23%). Sampling effort varied across hurricane-related periods: 37,701 checklists (42.0%) corresponded to the Inter-Hurricanes period, 37,253 checklists (41.5%) to the Post-Fiona period, and 14,728 checklists (16.4%) to the Pre-Maria baseline. NDVI values were missing for 20,706 checklists, representing 23.1% of the 2013–2025 dataset; therefore, models including NDVI were fitted using the subset of 68,976 checklists with complete NDVI values. Sampling effort and observed encounter frequencies by hurricane-related period are summarized in Table 1. Descriptive NDVI values by checklist-level reporting status and NDVI availability by period are provided in Supplementary Tables S2 and S3, respectively.
Table 1.
Sampling effort and observed encounter frequency of the Puerto Rican Emerald in Puerto Rico across environmental periods (2013–2025).
3.2. Post-María Decline and Partial Recovery in Observed Encounter Rates
Observed encounter frequencies of the Puerto Rican Emerald varied across hurricane-related periods. The highest observed encounter frequency was recorded during the Pre-Maria baseline (7.59%, n = 1118), despite this period having the lowest number of checklists. Observed encounter frequency decreased to its lowest value during the Inter-Hurricanes period (4.62%, n = 1742), followed by a partial increase during the Post-Fiona period (6.21%, n = 2314).
Annual observed encounter rates showed a marked temporal decline following Hurricane María. Encounter rates were relatively high during the pre-hurricane years, decreased sharply after 2017, and reached their lowest values during 2018–2019. After this low point, encounter rates increased gradually through the Post-Fiona period. No comparable multi-year decline was evident in the annual encounter rates following Hurricane Fiona, and values during 2023–2025 were closer to pre-Maria levels than to the low values observed during 2018–2019.
Together, these descriptive patterns suggest a reduction in checklist-level encounter frequency during the Inter-Hurricanes period, followed by an increase during the Post-Fiona period. Because observed encounter frequencies and annual encounter rates can be influenced by variation in sampling effort and environmental conditions, these patterns were subsequently evaluated using binomial GLMs that accounted for checklist duration, distance traveled, elevation, and NDVI. These annual encounter-rate patterns are shown in Figure 2.
Figure 2.
Annual observed encounter rate of the Puerto Rican Emerald in Puerto Rico from 2013 to 2025, expressed as the proportion of eBird checklists reporting the species. Points represent annual encounter rates, and error bars represent 95% confidence intervals. Vertical dashed lines indicate the timing of Hurricane María in 2017 and Hurricane Fiona in 2022. The intervals before the Hurricane María line, between the Hurricane María and Hurricane Fiona lines, and after the Hurricane Fiona line correspond to the Pre-Maria, Inter-Hurricanes, and Post-Fiona periods, respectively. This figure represents descriptive annual patterns and does not account for sampling-effort or environmental covariates.
3.3. Binomial GLM: Model Selection and Predictors of Reporting Probability
Model selection strongly favored GLMs that incorporated environmental predictors and sampling-effort covariates over models based only on hurricane-related period. The best-supported model included an interaction between hurricane-related period and elevation, together with NDVI, checklist duration, and distance traveled (AIC = 21,373.31, Akaike weight = 0.776). The additive model without the Period × Elevation interaction was the second-ranked model (ΔAIC = 2.49, Akaike weight = 0.224). The top-ranked model had a McFadden pseudo-R2 of 0.207.
In the best-supported model, elevation and NDVI were strong positive predictors of the Puerto Rican Emerald reporting probability. In the interaction model, the total effect of elevation corresponded to increases in the odds of reporting of approximately 43% per 100 m during the Pre-Maria baseline, 48.3% during Inter-Hurricanes, and 50.0% during Post-Fiona. NDVI also had a strong positive association with reporting probability, indicating that greener or more productive vegetation conditions were linked to a higher probability of reporting the species. Sampling effort was also associated with reporting probability: longer checklist duration increased the odds of reporting, and distance traveled had a small positive effect in the full environmental models. Because the top-ranked model included a Period × Elevation interaction, period effects were interpreted using predicted reporting probabilities across the elevational gradient.
3.4. Elevation-Structured Recovery in Predicted Reporting Probability
Predicted checklist-level reporting probability from the best-supported GLM showed a strong elevational gradient across all hurricane-related periods. Holding NDVI, checklist duration, and distance traveled at their mean values, predicted reporting probability increased from 3.77% at 100 m to 40.58% at 900 m during the Pre-Maria baseline. During the Inter-Hurricanes period, predicted reporting probability ranged from 2.40% at 100 m to 36.52% at 900 m. Post-Fiona predictions ranged from 3.08% at 100 m to 44.89% at 900 m.
Post-Fiona predictions were broadly similar to Pre-Maria values. At low and mid elevations, Post-Fiona reporting probabilities remained slightly below Pre-Maria estimates, whereas at higher elevations they were comparable to or slightly higher than baseline values. At 900 m, predicted reporting probability was 40.58% during Pre-Maria, 36.52% during Inter-Hurricanes, and 44.89% during Post-Fiona. These results indicate that checklist-level reporting probability was lower during the Inter-Hurricanes period but returned to baseline-like levels during the Post-Fiona period, particularly at higher elevations. These modeled elevational patterns are shown in Figure 3.
Figure 3.
Predicted reporting probability of the Puerto Rican Emerald across elevation and hurricane-related periods based on the best-supported binomial GLM. Predictions were generated while holding NDVI, checklist duration, and distance traveled at their mean values. Shaded areas represent 95% confidence intervals.
Complementary elevational centroid analysis. The predicted elevational centroid increased by 28.5 m during the Inter-Hurricanes period relative to Pre-Maria and remained +13.9 m above baseline during the Post-Fiona period, indicating a modest upward redistribution of model-predicted reporting probability followed by a partial return toward baseline (Figure 4).
Figure 4.
Predicted elevational centroid of the Puerto Rican Emerald across hurricane-related periods. Centroids were calculated by weighting elevations from a uniform prediction grid spanning 0–1300 m at 10-m intervals by their corresponding GLM-predicted reporting probabilities, while holding NDVI, checklist duration, and distance traveled at their mean values. The dotted vertical line represents the Pre-Maria centroid. Labels show the predicted centroid for each period and its change relative to the Pre-Maria baseline. Values represent model-based point estimates and are presented as a complementary summary of elevational reporting patterns.
3.5. Temporal Sensitivity Analysis from Secondary GLMs
The adjusted annual GLM showed a pattern consistent with the descriptive annual encounter rates: adjusted reporting probability declined after Hurricane María, reached its lowest value in 2018, and increased gradually during later years (Figure S1). In the continuous time-since-María analysis (N = 28,707), the model including a Years since María × Elevation interaction was better supported than the additive time model (AIC = 7716 versus 7724; ΔAIC = 7.98; Akaike weight = 0.982; Table S5). The interaction was positive and significant (β = 0.0265 ± 0.00839 SE, p = 0.0016), indicating that adjusted reporting probability increased more strongly through time at higher elevations during the Inter-Hurricanes period (Figure S2). In the exploratory Post-Fiona analysis (N = 29,580), model support was divided between the additive model (AIC = 9497; Akaike weight = 0.624) and the Years since Fiona × Elevation interaction model (AIC = 9498; ΔAIC = 1.02; Akaike weight = 0.376). The additive temporal effect was positive but not statistically significant (β = 0.0457 ± 0.0294 SE, p = 0.121), providing weaker evidence for a systematic temporal trajectory after Fiona (Table S5).
3.6. Dynamic Occupancy Model
The best-supported dynamic multi-season occupancy model included 1044 spatial sites across Puerto Rico and estimated initial occupancy (ψ), colonization (γ), local extinction (ε), and detection probability (p) while accounting for imperfect detection. The selected model included elevation and NDVI as predictors of initial occupancy, NDVI as a predictor of colonization, elevation and NDVI as predictors of local extinction, and hurricane-related period as a predictor of detection probability. This model had the lowest AIC among the candidate dynamic occupancy models (AIC = 2878.81) and converged successfully. The complete candidate-model comparison is provided in Supplementary Table S1.
Initial occupancy was positively associated with both elevation and NDVI. Elevation had a strong positive effect on ψ (β = 1.544 ± 0.238 SE, p < 0.001), and NDVI also had a positive effect (β = 0.613 ± 0.177 SE, p < 0.001), indicating that higher-elevation and greener sites had greater estimated initial occupancy probabilities. Colonization probability was not significantly associated with NDVI (β = 0.074 ± 0.170 SE, p = 0.665).
Local extinction probability was negatively associated with both elevation and NDVI. Elevation had a significant negative effect on local extinction (β = −0.830 ± 0.296 SE, p = 0.005), indicating greater local persistence at higher elevations. NDVI also had a significant negative effect on local extinction probability (β = −0.840 ± 0.337 SE, p = 0.013), suggesting greater local persistence at sites with higher mean NDVI.
Detection probability varied among hurricane-related periods. The Inter-Hurricanes period was the reference level for the detection component. Post-Fiona detection probability did not differ significantly from the Inter-Hurricanes period (β = 0.120 ± 0.146 SE, p = 0.411), whereas Pre-Maria detection probability was significantly lower than during the Inter-Hurricanes reference period (β = −0.566 ± 0.190 SE, p = 0.003). On the probability scale, estimated detection probability was approximately 32.4% during the Inter-Hurricanes reference period, 35.1% during Post-Fiona, and 21.4% during Pre-Maria. These estimates represent detection probability conditional on occupancy and should not be interpreted as direct changes in abundance. Complete parameter estimates for the selected model are reported in Table 2.
Table 2.
Parameter estimates from the dynamic multi-season occupancy model for the Puerto Rican Emerald in Puerto Rico, 2013–2025. Standard errors are reported on the logit scale.
3.7. Sensitivity Analysis Using EVI2
Models using NDVI received greater support than the corresponding EVI2 models. In the checklist-level analysis, the NDVI model had an AIC of 21,373.31, compared with 21,462.08 for EVI2 (ΔAIC = 88.76). In the dynamic occupancy analysis, the NDVI model also had the lower AIC (2878.81 versus 2887.29; ΔAIC = 8.48). Because EVI2 produced generally similar ecological patterns but consistently lower model support, NDVI was retained as the primary vegetation index (Supplementary Table S4).
3.8. Elevation-Associated Local Persistence
To visualize the strongest dynamic component of the occupancy model, we predicted local extinction probability across the elevational gradient while holding NDVI at its mean standardized value. Predicted local extinction probability declined sharply with increasing elevation, consistent with the negative effect of elevation on ε. This pattern indicates that higher-elevation sites had lower estimated probabilities of local extinction and may have supported greater local persistence of the Puerto Rican Emerald during the study period. This modeled relationship is shown in Figure 5.
Figure 5.
Predicted local extinction probability (ε) of the Puerto Rican Emerald across the elevational gradient in Puerto Rico. Estimates were derived from the best-supported dynamic multi-season occupancy model while holding NDVI at its mean standardized value. Shaded areas represent 95% confidence intervals.
3.9. Spatial Structure of Local Persistence Across Puerto Rico
To visualize the spatial expression of the dynamic occupancy model, predicted local extinction probability was mapped across the grid cells retained for the multi-season analysis. The resulting spatial pattern showed lower predicted local extinction probabilities in many interior and higher-elevation areas, whereas higher predicted values were more frequent in lowland and coastal portions of the island. This spatial pattern was consistent with the negative associations of local extinction probability with both elevation and NDVI in the dynamic occupancy model. The spatial distribution of predicted local extinction probability is shown in Figure 6.
Figure 6.
Spatial distribution of predicted local extinction probability (ε) for the Puerto Rican Emerald across dynamic occupancy grid cells in Puerto Rico. Predictions were derived from the best-supported dynamic multi-season occupancy model using elevation and NDVI as site-level covariates. Darker green indicates lower predicted local extinction probability, whereas lighter yellow indicates higher predicted local extinction probability.
Overall, our results indicate that variation in the Puerto Rican Emerald reporting probability and estimated occupancy dynamics was strongly associated with elevation and vegetation condition. Across 89,682 eBird checklists from 2013 to 2025, observed encounter rates declined after Hurricane María and increased partially during the Post-Fiona period. However, model-based results showed that these temporal patterns were not explained by hurricane-related period alone. The best-supported binomial GLM included elevation, NDVI, sampling-effort covariates, and a Period × Elevation interaction, indicating that reporting probability increased strongly with elevation across periods and was higher in areas with greater vegetation greenness.
Predicted reporting probabilities were lowest during the Inter-Hurricanes period and became more similar to Pre-Maria values during the Post-Fiona period, particularly at higher elevations. A complementary elevational centroid analysis showed only a modest apparent upward shift during the Inter-Hurricanes period, followed by a partial return toward baseline in the Post-Fiona period. Dynamic occupancy models further supported the importance of environmental gradients: initial occupancy increased with elevation and NDVI, whereas local extinction probability decreased significantly with both elevation and NDVI.
4. Discussion
Here, we use post-hurricane resilience in an explicitly ecological and operational sense: the capacity of the Puerto Rican Emerald to persist across disturbance-related periods, recolonize sites where occurrence was lost, and recover toward pre-disturbance conditions following hurricane impacts [50,51]. In our analyses, these components are evaluated most directly through dynamic occupancy parameters, particularly persistence (1 − ε), local extinction (ε), and colonization (γ), an approach previously applied to avian resilience following hurricanes in Puerto Rico [52]. In contrast, the GLM estimates reporting probability rather than population abundance or demographic recovery. Thus, the partial return of reporting probability toward Pre-Maria levels during the Post-Fiona period represents a statistical pattern consistent with ecological recovery but should not itself be interpreted as direct evidence of demographic resilience. Likewise, occupancy describes spatial occurrence rather than the number of individuals occupying a site. Accordingly, our evidence of post-hurricane resilience is restricted to recovery and persistence in occurrence patterns; population-level resilience in abundance, survival, or reproduction cannot be evaluated with these data.
The contrasting temporal responses observed after Hurricanes María and Fiona should be interpreted in light of the distinct ecological disturbance mechanisms generated by the two storms. María crossed Puerto Rico as a high-end Category 4 hurricane and produced extensive wind-driven forest disturbance, including canopy disruption, defoliation, branch loss, and changes in forest structure across large portions of the island [15,33,53]. Such structural disturbance can affect birds not only through direct mortality or displacement, but also indirectly through reductions or redistribution of food resources, loss of foraging and shelter substrates, and altered post-storm microclimatic conditions [4,54]. Fiona, by contrast, made landfall in southwestern Puerto Rico as a Category 1 hurricane and generated a disturbance regime dominated more strongly by extreme rainfall, flooding, streamflow, and landslides rather than the broad high-intensity wind exposure characteristic of María [34,55]. Thus, the two hurricane-related intervals represent ecologically different disturbances rather than comparable events differing only in storm intensity. This ecological contrast also provides the context for interpreting the different elevation-dependent temporal trajectories identified by the secondary time-since-disturbance analyses.
The partial return of Post-Fiona reporting probabilities toward Pre-Maria values should therefore not be interpreted simply as recovery following a less intense second hurricane. Fiona affected a landscape that had undergone approximately five years of vegetation recovery after María while imposing a second, spatially heterogeneous disturbance dominated more strongly by hydrological processes. The Post-Fiona pattern may consequently reflect the combined effects of post-María vegetation recovery, differential persistence across the landscape, and Fiona’s distinct spatial and ecological footprint. This interpretation is consistent with reporting probabilities being lowest during the Inter-Hurricanes period and becoming more similar to Pre-Maria values during Post-Fiona, particularly at higher elevations. The secondary temporal analysis further qualified this interpretation: in contrast to the clear post-María trajectory, the Post-Fiona analysis showed only a weak, non-significant temporal increase in adjusted reporting probability, with model support divided between the additive and time × elevation formulations. This provided substantially weaker evidence for a systematic post-Fiona temporal trajectory or for consistent elevation-dependent change during the shorter Post-Fiona interval.
The lower reporting probabilities observed during the Inter-Hurricanes period are consistent with the severe disturbance caused by María. However, the temporal sensitivity analysis shows that this broad category should not be interpreted as a temporally homogeneous post-María condition. Adjusted reporting probability declined sharply following María, reached its lowest annual value in 2018, and subsequently increased through the Inter-Hurricanes interval. Moreover, this temporal increase was strongly elevation dependent: the Years since María × Elevation model received substantially greater support than the additive model (ΔAIC = 7.98; Akaike weight = 0.982), with adjusted reporting probability increasing more strongly through time at higher elevations. Thus, the Inter-Hurricanes category in the primary period-based GLM summarizes observations spanning both the immediate post-María decline and the subsequent temporal increase before Fiona, rather than representing a single persistent post-hurricane state. Direct effects of hurricanes on birds can include mortality, injury, and wind-driven displacement, particularly during intense storms; however, these processes cannot be quantified directly from checklist data alone [4]. Therefore, the post-María decline observed here is best interpreted as an apparent decline in reporting probability that may reflect a combination of direct storm effects, displacement, reduced detectability, altered observer access, and habitat-mediated changes. This interpretation is consistent with broader Caribbean literature showing that hurricane effects on birds often arise through both immediate storm exposure and delayed indirect effects on vegetation, food resources, foraging substrates, roosting sites, and microclimate [4,5].
The contrasting post-storm temporal patterns are unlikely to reflect major differences in the overall amount of information available for the two secondary analyses, because both were supported by large and broadly comparable numbers of eligible checklists (post-María: N = 28,707; Post-Fiona: N = 29,580), while checklist duration, distance traveled, elevation, and NDVI were included as covariates. Nevertheless, comparable sample sizes do not eliminate potential differences in spatial sampling, accessibility, observer behavior, or detectability between periods. The stronger elevation-dependent temporal trajectory following María is therefore best interpreted as an adjusted observational pattern that is ecologically consistent with the broader and more topographically structured disturbance generated by María, rather than as direct evidence that the hurricane itself caused differential recovery across elevations.
4.1. Study Limitations and Ecological Interpretation
Although the secondary GLMs improve temporal resolution beyond the three broad hurricane-related categories, they do not fully disentangle hurricane effects from the passage of time or from other unmeasured temporal and environmental changes. Accordingly, the time-since-disturbance patterns should be interpreted as adjusted temporal associations rather than causal estimates of hurricane-driven recovery.
An additional limitation arises from the semi-structured nature of eBird sampling. Although we restricted analyses to complete Stationary and Traveling checklists, filtered survey duration and travel distance, and included effort covariates in the checklist-level GLMs, these steps cannot fully remove spatial and temporal heterogeneity in observer activity. Hurricane-related changes in road access, site accessibility, birding intensity, observer composition, and the geographic distribution of checklists could alter where and when observations were collected, while detectability may also vary with vegetation structure and post-storm conditions. The dynamic occupancy model explicitly accounted for imperfect detection and allowed detection probability to vary among hurricane-related periods, but residual sampling bias may remain. Accordingly, period-related differences in reporting probability and occupancy dynamics should be interpreted as adjusted observational patterns rather than as fully sampling-standardized estimates of population change.
Indirect habitat-mediated effects are especially relevant for the Puerto Rican Emerald. Previous species accounts and conservation assessments describe the Puerto Rican Emerald as occurring primarily in mountain forests and forest edges, including shade coffee plantations, while also using lowland wooded areas and mangroves [19,21]. The Puerto Rico Breeding Bird Atlas further documents breeding activity across several ecological life zones, including subtropical moist forest and subtropical wet or lower montane wet forest, supporting the view that forested and higher-elevation habitats are important components of the species’ distribution [20]. Our results strengthen this knowledge by showing, with island-wide checklist data and explicit environmental modeling, that reporting probability increased strongly with elevation and that local extinction probability decreased with elevation.
As a nectar-feeding hummingbird that also consumes small arthropods, the Puerto Rican Emerald depends on vegetation not only for floral resources but also for foraging substrates, shelter, and breeding habitat. Hurricane-driven canopy loss and defoliation can alter flowering resources and forest structure while simultaneously modifying understory light, temperature, humidity, and arthropod communities [4,54,56]. Such changes could reduce or redistribute nectar and prey resources and alter local habitat suitability even where forest cover remains. This mechanistic expectation is consistent with our statistical results: reporting probability increased with NDVI, while dynamic occupancy models indicated greater occupancy and lower local extinction in greener sites. NDVI should nevertheless be interpreted as an integrative proxy for vegetation condition rather than a direct measure of flower abundance or flowering phenology, nectar availability, canopy structure, or microclimate. Consequently, these mechanisms remain biologically plausible explanations for the observed patterns rather than demonstrated causal pathways.
Remote-sensing and forest-structure studies provide contextual support for the vegetation changes underlying this ecological interpretation. Hu and Smith documented abrupt post-María declines in NDVI across Puerto Rico, indicating substantial loss of green vegetation [2]. Hall et al. estimated large losses of aboveground forest biomass after Hurricanes Irma and María and found that storm-related rainfall was a stronger predictor of forest damage than maximum wind speed [3]. Leitold et al. further showed widespread canopy-height loss, branch loss, tree damage, defoliation, and spatially heterogeneous canopy recovery after María [15]. The positive NDVI effect in our GLM is therefore consistent with the interpretation that greener or more productive areas supported higher probabilities of reporting the Puerto Rican Emerald.
The environmentally structured response observed in the Puerto Rican Emerald is consistent with broader evidence that hurricane effects on Caribbean island birds are highly species-specific and depend on habitat and ecological context. Studies in Puerto Rico, the U.S. Virgin Islands, and Cozumel have documented substantial variation among species in post-hurricane declines, persistence, and recovery, with some taxa showing rapid rebounds and others exhibiting prolonged reductions or altered occurrence patterns [4,6,7,8]. Rather than indicating a uniform response of island birds to tropical cyclones, these studies emphasize that resilience is mediated by species traits, resource dependence, habitat use, and the spatial characteristics of disturbance. Our results extend this regional pattern to the Puerto Rican Emerald by showing that its reporting probability and modeled local persistence were consistently associated with elevation and vegetation greenness.
The complementary elevational centroid analysis provides an indirect summary of a modest upward redistribution in model-predicted reporting patterns. The predicted centroid shifted upward by 28.5 m during the Inter-Hurricanes period and then moved closer to the Pre-Maria baseline during Post-Fiona, remaining 13.9 m above baseline. Although modest in magnitude, this pattern is consistent with a temporary redistribution of model-predicted reporting probability toward higher elevations after Hurricane María. This pattern could reflect differential persistence in higher-elevation or greener areas, greater post-disturbance loss of suitable conditions at lower elevations, or spatial variation in vegetation recovery. This interpretation is directionally consistent with the temporal sensitivity analysis, which also showed that adjusted reporting probability increased more strongly through time at higher elevations following María. Together, the centroid and time-since-María analyses indicate elevation-structured changes in reporting patterns rather than demonstrated altitudinal movement. Confirming movement of individual birds would require targeted field surveys or tracking data.
The dynamic occupancy results reinforce the conservation relevance of elevation and vegetation condition. Initial occupancy increased with both site-level mean elevation and mean NDVI, while local extinction probability decreased significantly with both covariates. These findings indicate that higher-elevation and greener sites were associated with greater modeled persistence of the Puerto Rican Emerald across disturbance-related intervals. These site-level occupancy results complement, but are not equivalent to, the checklist-level temporal sensitivity analysis. Taken together, the analyses indicate that elevation structured two distinct aspects of the observed response: the temporal increase in reporting probability following María and the spatial pattern of modeled local persistence across disturbance-related intervals. This pattern should not be interpreted as evidence that high-elevation forests escaped hurricane disturbance, because Hurricane María caused substantial forest damage across a wide range of elevations and topographic settings [53]. Rather, elevation and vegetation condition were associated with modeled persistence following disturbance. This does not imply that lowland habitats are unimportant, since the species is known to use a wide range of wooded environments. Rather, the results indicate that persistence and reporting probability were not spatially uniform across Puerto Rico and that higher-elevation and greener areas may be particularly important for maintaining occupancy after major disturbance events. An important limitation is that each primary period encompassed multiple years; therefore, closure among secondary occasions within a period could not be guaranteed. Colonization and local extinction estimates should consequently be interpreted as broad transitions among the three hurricane-related periods rather than as annual demographic rates.
Tracking individual hummingbirds remains technically challenging because their small body mass limits the size and weight of transmitters, while conventional banding provides movement information only when marked birds are recaptured or resighted. Although lightweight harnesses have expanded telemetry options for hummingbirds, recent work emphasizes the need to evaluate possible behavioral effects of attached devices [57,58]. Because the present study did not track marked individuals, it cannot demonstrate individual displacement; nevertheless, the integration of island-wide community-science data, environmental covariates, and occupancy models accounting for imperfect detection provides complementary evidence of landscape-level changes in reporting probability and local persistence during extreme climatic events such as hurricanes.
4.2. Conservation Implications and Future Directions
From a conservation perspective, this study contributes to three important advances. First, it provides an island-wide, quantitative assessment of the Puerto Rican Emerald reporting patterns across a 13-year period that includes two major hurricane-related intervals. Second, it links citizen-science observations with remotely sensed vegetation condition and elevation, allowing the species’ apparent response to disturbance to be interpreted through environmental gradients rather than temporal categories alone. Third, it identifies elevation and vegetation greenness as key predictors of reporting probability and occupancy dynamics, suggesting that conservation planning and monitoring for this endemic hummingbird should consider not only species presence, but also the condition and recovery of wooded habitats across the full elevational gradient.
These findings are especially relevant in the hurricane-prone Caribbean, where recurrent tropical cyclones can repeatedly alter forest structure and resources [1,2,3,4,5]. For a small endemic nectar-feeding bird, the conservation value of forested habitats depends not only on structural cover but also on the availability and recovery of floral resources. Maintaining and monitoring native and mixed forest habitats across elevational gradients, shade coffee systems, and forest edges, may therefore be important for supporting post-disturbance persistence. Future work should combine standardized field surveys with direct measurements of flowering phenology, nectar availability, arthropod resources, and fine-scale forest structure, while also incorporating additional environmental drivers not explicitly modeled here, including precipitation anomalies, temperature, land-use and forest-cover change, and post-disturbance changes in habitat structure and resource availability. Integrating these variables would help determine whether the patterns observed here reflect demographic change, altered detectability, habitat redistribution, resource-driven shifts in local occurrence, or interactions among climatic and landscape processes.
By identifying the environmental conditions associated with partial recovery and local persistence, this study contributes to understanding how an endemic Caribbean bird responds to recurrent environmental disruption and highlights the importance of spatially heterogeneous landscapes in supporting avian resilience.
5. Conclusions
Our results indicate that post-hurricane reporting probability and modeled local persistence of the Puerto Rican Emerald were spatially structured, with higher-elevation and greener sites showing higher reporting probability and lower estimated local extinction across disturbance-related periods. Temporal analyses further showed that reporting probability increased following the post-María decline, with stronger increases at higher elevations, whereas the Post-Fiona temporal trajectory was less pronounced. However, these patterns should not be interpreted as evidence that high-elevation areas function as demographic refugia, because abundance, survival, reproduction, and long-term population viability were not directly measured. Instead, higher-elevation and greener sites should be considered priority candidates for monitoring and potential conservation action, while maintaining conservation attention across the full elevational range used by the species, including lowland wooded habitats. Community-science data from eBird provide a valuable tool for detecting broad-scale spatial and temporal patterns, but should complement, rather than replace, standardized field monitoring designed to quantify abundance, demographic responses, habitat structure, and resource availability. Together, these approaches can improve future assessment of the long-term resilience of endemic Caribbean birds to recurrent tropical cyclones.
Supplementary Materials
The following supporting information can be downloaded at https://www.mdpi.com/article/10.3390/birds7030055/s1: Table S1, Candidate dynamic occupancy model selection using the NDVI dataset; Table S2, Descriptive summary of NDVI by checklist-level reporting status of Riccordia maugaeus; Table S3, Availability of NDVI by hurricane-related period; Table S4, Direct comparison of equivalent models using NDVI and EVI2 as alternative vegetation-greenness indices; Table S5, Comparison of secondary continuous time-since-disturbance GLMs for the Inter-Hurricanes and Post-Fiona periods; Figure S1, Adjusted annual reporting probability of Riccordia maugaeus from 2013 to 2025 based on a binomial GLM controlling for elevation, NDVI, checklist duration, and distance traveled; Figure S2, Adjusted reporting probability of Riccordia maugaeus as a function of years since Hurricane María across representative elevations (100, 500, and 900 m), based on the Years since María × Elevation interaction GLM; File Riccordia maugaeus reproducibility package (ZIP archive), containing the data-preparation and environmental-covariate workflows, primary analysis workflow and figures, NDVI–EVI2 sensitivity analysis, secondary temporal sensitivity analysis, derived datasets, model outputs, data dictionaries, and validation files.
Author Contributions
Conceptualization, B.M.O.-A.; methodology, B.M.O.-A. and A.R.-P.; software, B.M.O.-A. and A.R.-P.; validation, B.M.O.-A. and A.R.-P.; formal analysis, B.M.O.-A.; investigation, B.M.O.-A. and A.R.-P.; resources, B.M.O.-A. and A.R.-P.; data curation, A.R.-P.; writing—original draft preparation, B.M.O.-A.; writing—review and editing, B.M.O.-A. and A.R.-P.; visualization, B.M.O.-A.; supervision, B.M.O.-A.; project administration, B.M.O.-A. and A.R.-P.; funding acquisition, B.M.O.-A. and A.R.-P. All authors have read and agreed to the published version of the manuscript.
Funding
This research received no external funding.
Institutional Review Board Statement
Not applicable. This study relied exclusively on existing eBird data and involved no direct interaction with or manipulation of animals by the authors.
Informed Consent Statement
Not applicable.
Data Availability Statement
The original eBird source files used in this study are available through the eBird Basic Dataset upon submission of a data request and acceptance of the applicable eBird data-access terms. In accordance with those terms, the original downloaded eBird files are not redistributed with this article. The derived filtered checklist data, derived Landsat 8 and SRTM environmental covariates, model-ready datasets, model outputs, and R and Google Earth Engine scripts supporting the reported results are provided in File Riccordia maugaeus reproducibility package (ZIP archive) in the Supplementary Materials. Landsat 8 surface-reflectance imagery and Shuttle Radar Topography Mission elevation data are publicly available through Google Earth Engine and the corresponding data providers.
Acknowledgments
The authors acknowledge support from the University of Puerto Rico Center for Resilience to Climate Change (UPR-CRCC), funded by the U.S. Department of Education under award number P116H240025, and thank the eBird contributors and the Cornell Lab of Ornithology for making community-science bird observations available for research. We also acknowledge the public availability of Landsat and Shuttle Radar Topography Mission data through Google Earth Engine, which supported the spatial and remote-sensing components of this study. OpenAI’s ChatGPT 5.5 was used to assist with code review and refinement. The authors reviewed and edited all AI-assisted outputs and take full responsibility for the content of this publication.
Conflicts of Interest
The authors declare no conflicts of interest.
References
- López-Marrero, T.; Heartsill-Scalley, T.; Rivera-López, C.F.; Escalera-García, I.A.; Echevarría-Ramos, M. Broadening Our Understanding of Hurricanes and Forests on the Caribbean Island of Puerto Rico: Where and What Should We Study Now? Forests 2019, 10, 710. [Google Scholar] [CrossRef] [Scilit]
- Hu, T.; Smith, R.B. The Impact of Hurricane Maria on the Vegetation of Dominica and Puerto Rico Using Multispectral Remote Sensing. Remote Sens. 2018, 10, 827. [Google Scholar] [CrossRef] [Scilit]
- Hall, J.; Muscarella, R.; Quebbeman, A.; Arellano, G.; Thompson, J.; Zimmerman, J.K.; Uriarte, M. Hurricane-Induced Rainfall is a Stronger Predictor of Tropical Forest Damage in Puerto Rico Than Maximum Wind Speeds. Sci. Rep. 2020, 10, 4318. [Google Scholar] [CrossRef] [Scilit] [PubMed]
- Wiley, J.W.; Wunderle, J.M. The effects of hurricanes on birds, with special reference to Caribbean islands. Bird Conserv. Int. 1993, 3, 319–349. [Google Scholar] [CrossRef] [Scilit]
- Wunderle, J.M., Jr. Responses of Bird Populations in a Puerto Rican Forest to Hurricane Hugo: The First 18 Months. Condor Ornithol. Appl. 1995, 97, 879–896. [Google Scholar] [CrossRef] [Scilit]
- Perdomo-Velázquez, H.; Andresen, E.; Vega, E.; Schondube, J.E.; Cuarón, A.D. Effects of Hurricanes on the Understory Forest Birds of Cozumel Island. Trop. Conserv. Sci. 2017, 10, 1940082917737759. [Google Scholar] [CrossRef] [Scilit]
- Lloyd, J.D.; Rimmer, C.C.; Salguero-Faría, J.A. Short-term effects of hurricanes Maria and Irma on forest birds of Puerto Rico. PLoS ONE 2019, 14, e0214432. [Google Scholar] [CrossRef] [Scilit] [PubMed]
- Askins, R.A.; Ewert, D.N. Resistance and resilience of Virgin Islands bird populations following severe hurricanes. Wilson J. Ornithol. 2020, 132, 898–910. [Google Scholar] [CrossRef] [PubMed]
- Gould, W.A.; Castro-Prieto, J.; Álvarez-Berríos, N.L. Climate Change and Biodiversity Conservation in the Caribbean Islands. In Encyclopedia of the World’s Biomes; Elsevier: Amsterdam, The Netherlands, 2020; pp. 114–125. [Google Scholar]
- Nelson, H.P.; Devenish-Nelson, E.S. The future of Caribbean endemic bird conservation in the Anthropocene. J. Caribb. Ornithol. 2022, 35, 96–107. [Google Scholar] [CrossRef] [Scilit]
- Holdridge, L.R. Life Zone Ecology, rev. ed.; Tropical Science Center: San José, Costa Rica, 1967. [Google Scholar]
- Ewel, J.J.; Whitmore, J.L. The Ecological Life Zones of Puerto Rico and the U.S. Virgin Islands; U.S. Department of Agriculture, Forest Service, Institute of Tropical Forestry: Rio Piedras, PR, USA, 1973.
- Daly, C.; Helmer, E.H.; Quiñones, M. Mapping the climate of Puerto Rico, Vieques and Culebra. Int. J. Climatol. 2003, 23, 1359–1381. [Google Scholar] [CrossRef] [Scilit]
- Helmer, E.H.; Ramos, O.; López, T.D.M.; Quiñones, M.; Diaz, W. Mapping the Forest Type and Land Cover of Puerto Rico, a Component of the Caribbean Biodiversity Hotspot. Caribb. J. Sci. 2002, 38, 165–183. [Google Scholar]
- Leitold, V.; Morton, D.C.; Martinuzzi, S.; Paynter, I.; Uriarte, M.; Keller, M.; Ferraz, A.; Cook, B.D.; Corp, L.A.; González, G. Tracking the Rates and Mechanisms of Canopy Damage and Recovery Following Hurricane Maria Using Multitemporal Lidar Data. Ecosystems 2022, 25, 892–910. [Google Scholar] [CrossRef] [Scilit]
- Nicolson, S.W.; Fleming, P.A. Nectar as food for birds: The physiological consequences of drinking dilute sugar solutions. Plant Syst. Evol. 2003, 238, 139–153. [Google Scholar] [CrossRef] [Scilit]
- Dalsgaard, B.; Martín-González, A.M.; Olesen, J.M.; Ollerton, J.; Timmermann, A.; Andersen, L.H.; Tossas, A.G. Plant–hummingbird interactions in the West Indies: Floral specialisation gradients associated with environment and hummingbird size. Oecologia 2009, 159, 757–766. [Google Scholar] [CrossRef] [Scilit] [PubMed]
- Vollstädt, M.G.R.; Jensen, R.D.; Maruyama, P.K.; Schleuning, M.; Araújo-Hoffmann, F.P.; Sazima, M.; Sonne, J.; Schrøder, T.S.O.; Møller-Stranges, F.; Abrahamczyk, S.; et al. The role of insularity: Plants have few ornithophilous traits but are visited by morphologically more distinct hummingbirds in the Caribbean islands. Funct. Ecol. 2025, 39, 1678–1692. [Google Scholar] [CrossRef] [Scilit]
- Puerto Rico Department of Natural and Environmental Resources. Puerto Rico State Wildlife Action Plan 2015; Department of Natural and Environmental Resources: San Juan, PR, USA, 2015.
- Castro-Prieto, J.; Wunderle, J.M.; Salguero-Faría, J.A.; Soto-Bayó, S.; Crespo-Zapata, J.D.; Gould, W.A. The Puerto Rico Breeding Bird Atlas; U.S. Department of Agriculture, Forest Service, International Institute of Tropical Forestry: Rio Piedras, PR, USA, 2021.
- Bündgen, R.; Boesman, P.F.D. Puerto Rican Emerald (Riccordia maugaeus), version 1.1. In Birds of the World; Hoyo, J.D., Elliott, A., Sargatal, J., Christie, D.A., de Juana, E., Eds.; Cornell Lab of Ornithology: Ithaca, NY, USA, 2021. [Google Scholar]
- Schubert, S.C. Nesting of the Puerto Rican Emerald (Chlorostilbon maugaeus) and a record of nestling parasitism by botflies (Philornis sp.). J. Caribb. Ornithol. 2018, 31, 77–82. [Google Scholar] [CrossRef] [Scilit]
- Gleffe, J.D.; Collazo, J.A.; Groom, M.J.; Miranda, L. Avian Reproduction and the Conservation Value of Shaded Coffee Plantations. Ornitol. Neotrop. 2006, 17, 271–282. [Google Scholar]
- Raffaele, H.A.; Petrovic, C.; López, S.A.C.; Yntema, L.D.; Faria, J.A.S. Birds of Puerto Rico and the Virgin Islands, 3rd ed.; Princeton University Press: Princeton, NJ, USA, 2021. [Google Scholar]
- McGuire, J.A.; Witt, C.C.; Remsen, J.; Corl, A.; Rabosky, D.L.; Altshuler, D.L.; Dudley, R. Molecular Phylogenetics and the Diversification of Hummingbirds. Curr. Biol. 2014, 24, 910–916. [Google Scholar] [CrossRef] [Scilit] [PubMed]
- Stiles, F.G.; Remsen, J.V., Jr.; McGuire, J.A. The generic classification of the Trochilini (Aves: Trochilidae): Reconciling taxonomy with phylogeny. Zootaxa 2017, 4353, 401–424. [Google Scholar] [CrossRef] [Scilit] [PubMed]
- Hernández-Baños, B.E.; Zamudio-Beltrán, L.E.; Milá, B. Phylogenetic relationships and systematics of a subclade of Mesoamerican emerald hummingbirds (Aves: Trochilidae: Trochilini). Zootaxa 2020, 4748, 581–591. [Google Scholar] [CrossRef] [Scilit] [PubMed]
- Johnson, A.B.; Winker, K. Short-Term Hurricane Impacts on a Neotropical Community of Marked Birds and Implications for Early-Stage Community Resilience. PLoS ONE 2010, 5, e15109. [Google Scholar] [CrossRef] [Scilit] [PubMed]
- Vázquez-Plass, E.O.; Wunderle, J.M., Jr. Avian distribution along a gradient of urbanization in northeastern Puerto Rico. Ecol. Bull. 2013, 54, 141–156. [Google Scholar]
- eBird. eBird Basic Dataset. Version: EBD_relJan-2026; Cornell Lab of Ornithology: Ithaca, NY, USA, 2026. [Google Scholar]
- Sullivan, B.L.; Wood, C.L.; Iliff, M.J.; Bonney, R.E.; Fink, D.; Kelling, S. eBird: A citizen-based bird observation network in the biological sciences. Biol. Conserv. 2009, 142, 2282–2292. [Google Scholar] [CrossRef] [Scilit]
- Johnston, A.; Hochachka, W.M.; Strimas-Mackey, M.E.; Gutierrez, V.R.; Robinson, O.J.; Miller, E.T.; Auer, T.; Kelling, S.T.; Fink, D. Analytical guidelines to increase the value of community science data: An example using eBird data to estimate species distributions. Divers. Distrib. 2021, 27, 1265–1277. [Google Scholar] [CrossRef] [Scilit]
- Pasch, R.J.; Penny, A.B.; Berg, R. National Hurricane Center Tropical Cyclone Report: Hurricane Maria (16–30 September 2017); National Oceanic and Atmospheric Administration, National Weather Service, National Hurricane Center: Miami, FL, USA, 2023.
- Pasch, R.J.; Reinhart, B.J.; Alaka, L. National Hurricane Center Tropical Cyclone Report: Hurricane Fiona (14–24 September 2022); National Oceanic and Atmospheric Administration, National Weather Service, National Hurricane Center: Miami, FL, USA, 2023.
- Gorelick, N.; Hancher, M.; Dixon, M.; Ilyushchenko, S.; Thau, D.; Moore, R. Google Earth Engine: Planetary-scale geospatial analysis for everyone. Remote Sens. Environ. 2017, 202, 18–27. [Google Scholar] [CrossRef] [Scilit]
- Farr, T.G.; Rosen, P.; Caro, E.; Crippen, R.; Duren, R.; Hensley, S.; Kobrick, M.; Paller, M.; Rodriguez, E.; Roth, L.; et al. The Shuttle Radar Topography Mission. Rev. Geophys. 2007, 45, RG2004. [Google Scholar] [CrossRef] [Scilit]
- Tucker, C.J. Red and photographic infrared linear combinations for monitoring vegetation. Remote Sens. Environ. 1979, 8, 127–150. [Google Scholar] [CrossRef] [Scilit]
- U.S. Geological Survey. Landsat Collection 2 Surface Reflectance; U.S. Geological Survey: Reston, VA, USA, 2020.
- U.S. Geological Survey. Landsat 8 Collection 2 Level 2 Science Products; USGS EROS Center/Google Earth Engine: Sioux Falls, SD, USA, 2020.
- U.S. Geological Survey. Landsat 8; U.S. Geological Survey: Reston, VA, USA, 2013.
- Jiang, Z.; Huete, A.R.; Didan, K.; Miura, T. Development of a two-band enhanced vegetation index without a blue band. Remote Sens. Environ. 2008, 112, 3833–3845. [Google Scholar] [CrossRef] [Scilit]
- Burnham, K.P.; Anderson, D.R. Model Selection and Multimodel Inference: A Practical Information-Theoretic Approach, 2nd ed.; Springer: New York, NY, USA, 2002. [Google Scholar]
- McFadden, D. Conditional Logit Analysis of Qualitative Choice Behavior. In Frontiers in Econometrics; Zarembka, P., Ed.; Academic Press: New York, NY, USA, 1974; pp. 105–142. [Google Scholar]
- MacKenzie, D.I.; Nichols, J.D.; Hines, J.E.; Knutson, M.G.; Franklin, A.B. Estimating site occupancy, colonization, and local extinction when a species is detected imperfectly. Ecology 2003, 84, 2200–2207. [Google Scholar] [CrossRef] [Scilit]
- Fiske, I.; Chandler, R. unmarked: An R Package for Fitting Hierarchical Models of Wildlife Occurrence and Abundance. J. Stat. Softw. 2011, 43, 1–23. [Google Scholar] [CrossRef] [Scilit]
- R Core Team. R: A Language and Environment for Statistical Computing; R Foundation for Statistical Computing: Vienna, Austria, 2025. [Google Scholar]
- Wickham, H.; Averick, M.; Bryan, J.; Chang, W.; McGowan, L.D.A.; François, R.; Grolemund, G.; Hayes, A.; Henry, L.; Hester, J.; et al. Welcome to the Tidyverse. J. Open Source Softw. 2019, 4, 1686. [Google Scholar] [CrossRef] [Scilit]
- Pebesma, E. Simple Features for R: Standardized Support for Spatial Vector Data. R J. 2018, 10, 439–446. [Google Scholar] [CrossRef] [Scilit]
- Wickham, H. ggplot2: Elegant Graphics for Data Analysis; Springer: Cham, Switzerland, 2016. [Google Scholar]
- Holling, C.S. Resilience and Stability of Ecological Systems. Annu. Rev. Ecol. Evol. Syst. 1973, 4, 1–23. [Google Scholar] [CrossRef] [Scilit]
- Gunderson, L.H. Ecological Resilience—In Theory and Application. Annu. Rev. Ecol. Evol. Syst. 2000, 31, 425–439. [Google Scholar] [CrossRef] [Scilit]
- Irizarry, A.D.; Collazo, J.A.; Vandermeer, J.; Perfecto, I. Coffee plantations, hurricanes and avian resiliency: Insights from occupancy, and local colonization and extinction rates in Puerto Rico. Glob. Ecol. Conserv. 2021, 27, e01579. [Google Scholar] [CrossRef] [Scilit]
- Feng, Y.; Negrón-Juárez, R.I.; Chambers, J.Q. Remote sensing and statistical analysis of the effects of hurricane María on the forests of Puerto Rico. Remote Sens. Environ. 2020, 247, 111940. [Google Scholar] [CrossRef] [Scilit]
- Shiels, A.B.; González, G.; Willig, M.R. Responses to canopy loss and debris deposition in a tropical forest ecosystem: Synthesis from an experimental manipulation simulating effects of hurricane disturbance. For. Ecol. Manag. 2014, 332, 124–133. [Google Scholar] [CrossRef] [Scilit]
- Ramos Scharrón, C.E.; Hernández Ayala, J.J.; Arima, E.Y.; Russell, F. Preliminary Analyses of the Hydro-Meteorological Characteristics of Hurricane Fiona in Puerto Rico. Hydrology 2023, 10, 40. [Google Scholar] [CrossRef] [Scilit]
- Koen, E.L.; Meliane, M.K.; Holmes, Z.B.; Miller, K.E.; Barichivich, W.J.; Dedeban, E.; Furst, A.; Imeri, M.; Niebanck, P.E.; Nunn, S.; et al. How wildlife respond to tropical cyclones: Short-term tactics and long-term impacts. Biol. Rev. 2026. Early View. [Google Scholar] [CrossRef] [Scilit] [PubMed]
- Williamson, J.L.; Witt, C.C. A lightweight backpack harness for tracking hummingbirds. J. Avian Biol. 2021, 52, e02802. [Google Scholar] [CrossRef] [Scilit]
- Sargent, A.J.; Fernandes, A.M.; Clarkson, A.E.; Martinez, S.-L.; Coenen, A.; Hansell, L.; Talwekar, Y.P.; Amaya, M.A.M.; Téllez-Colmenares, N.; Elting, R.; et al. Variable evidence of radio-tag backpacks affecting hummingbird time budgets in captivity. Anim. Biotelem. 2026, 14, 11. [Google Scholar] [CrossRef] [Scilit]
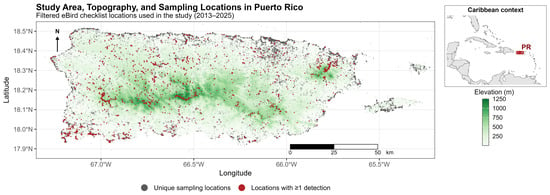
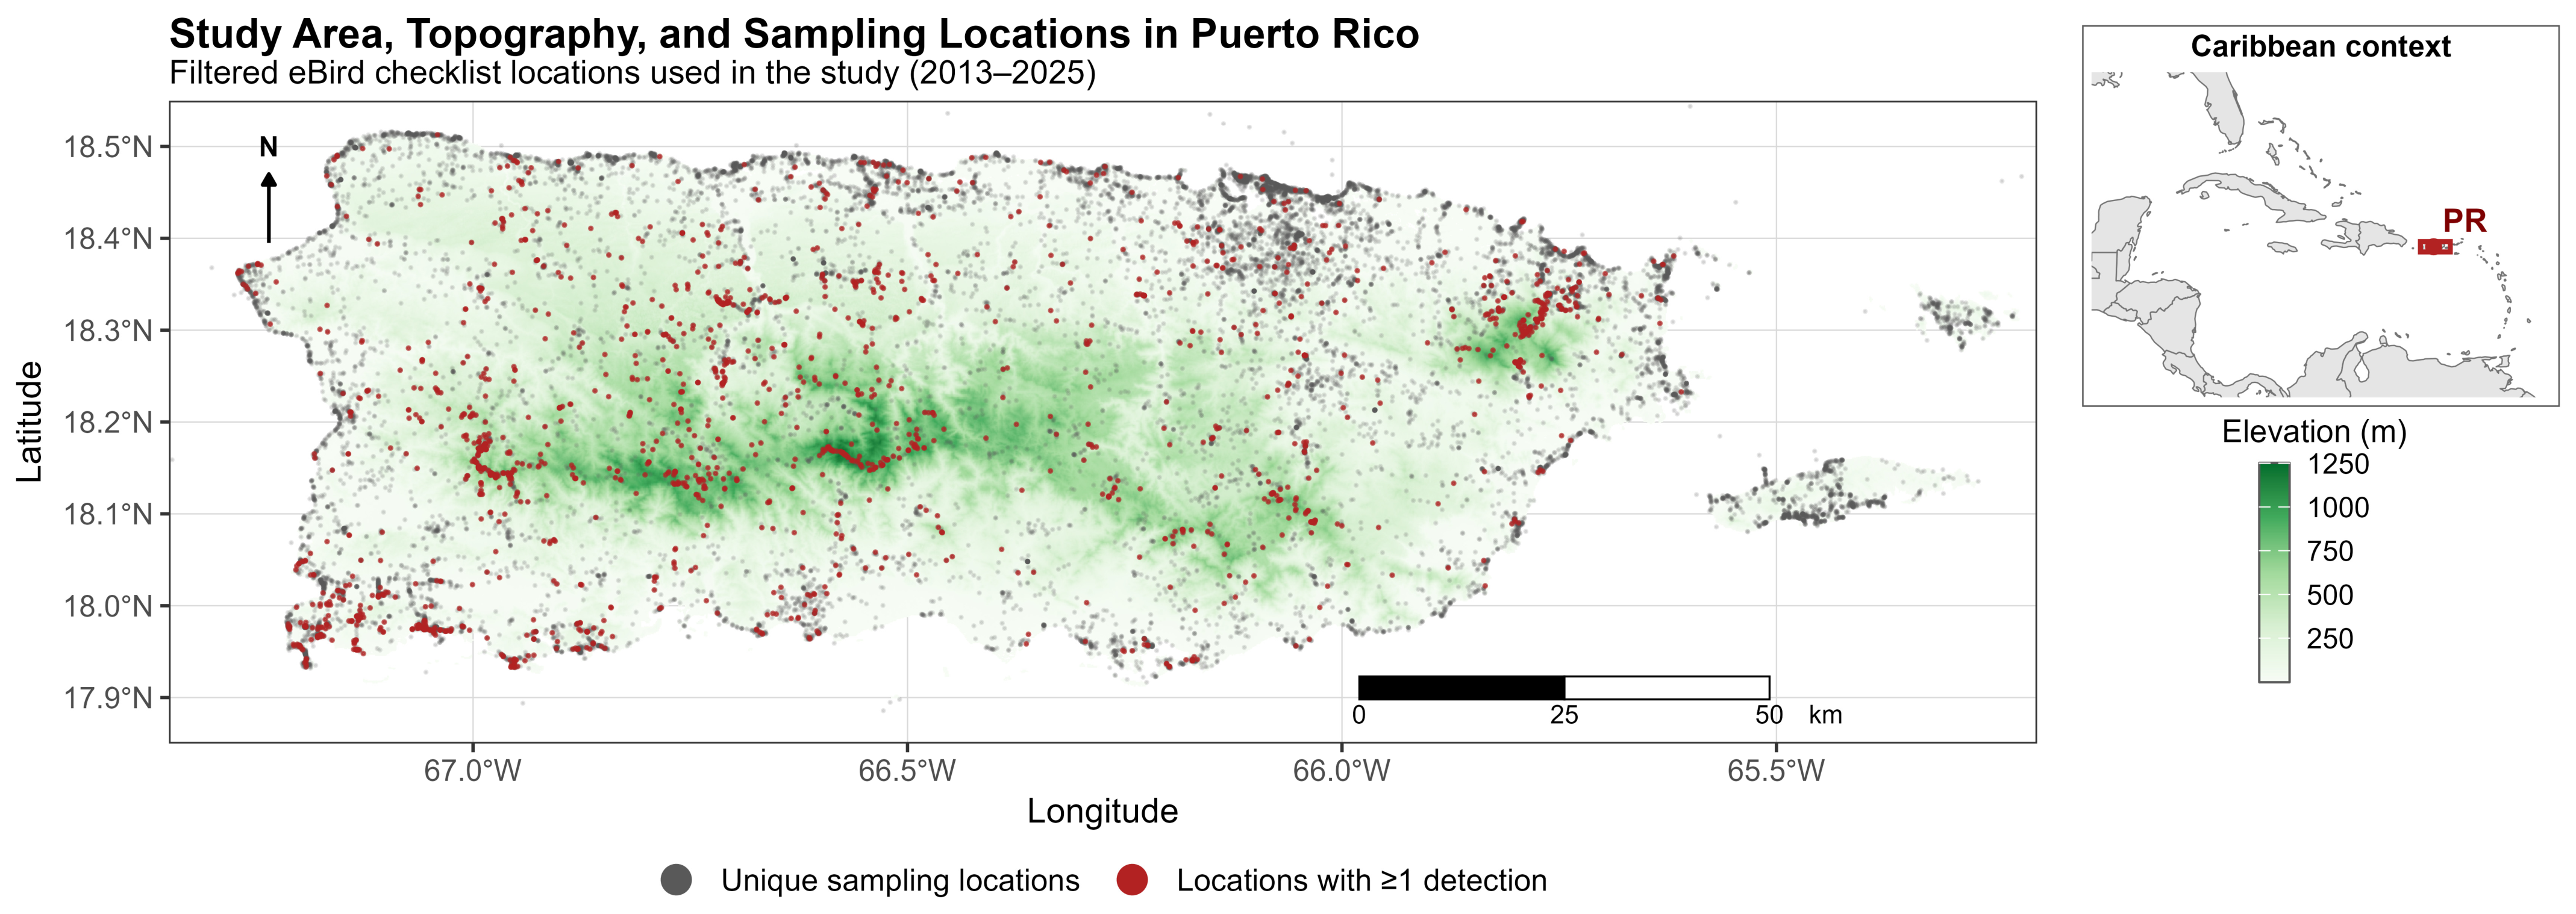
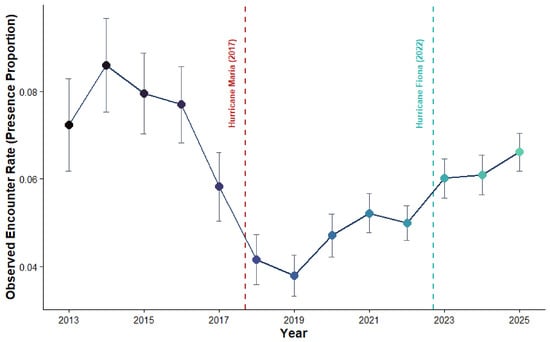
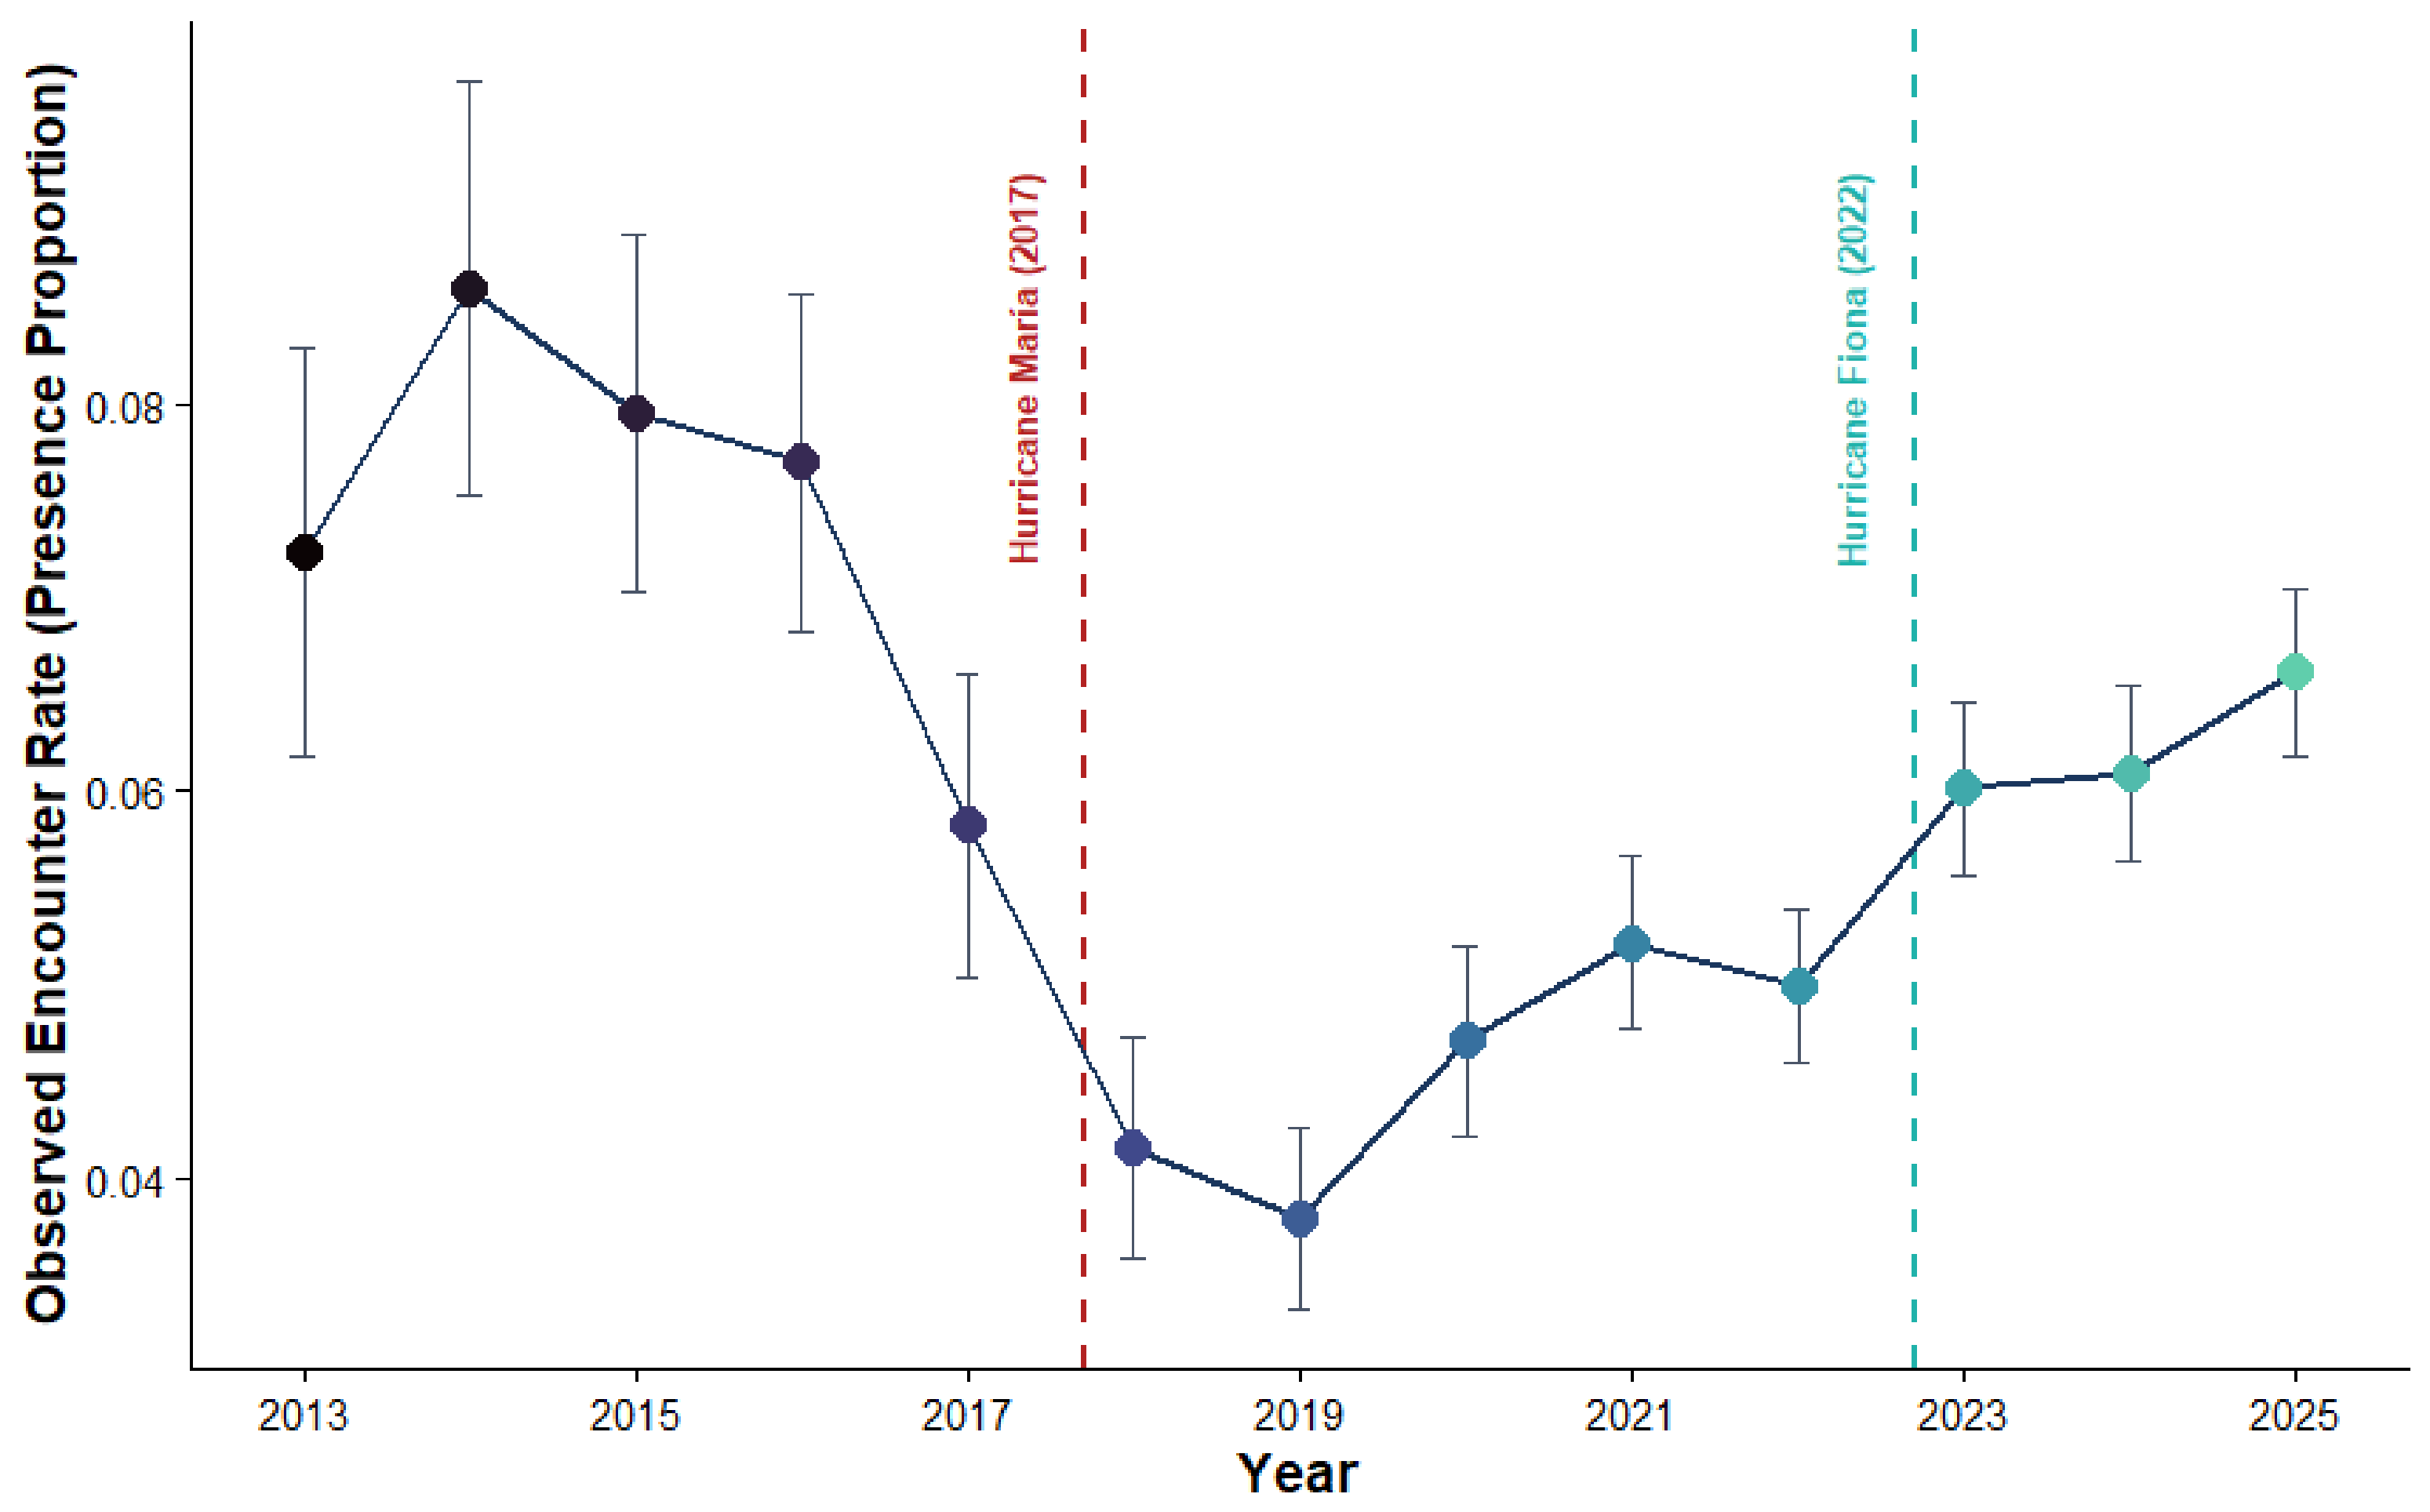
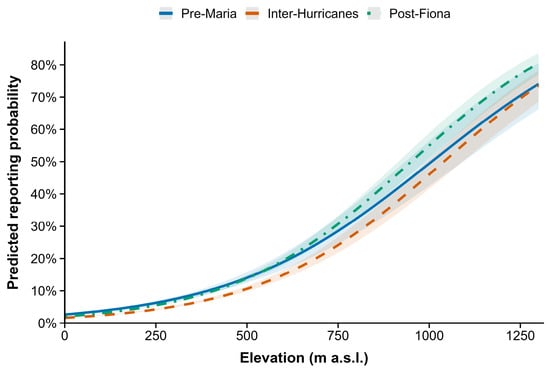
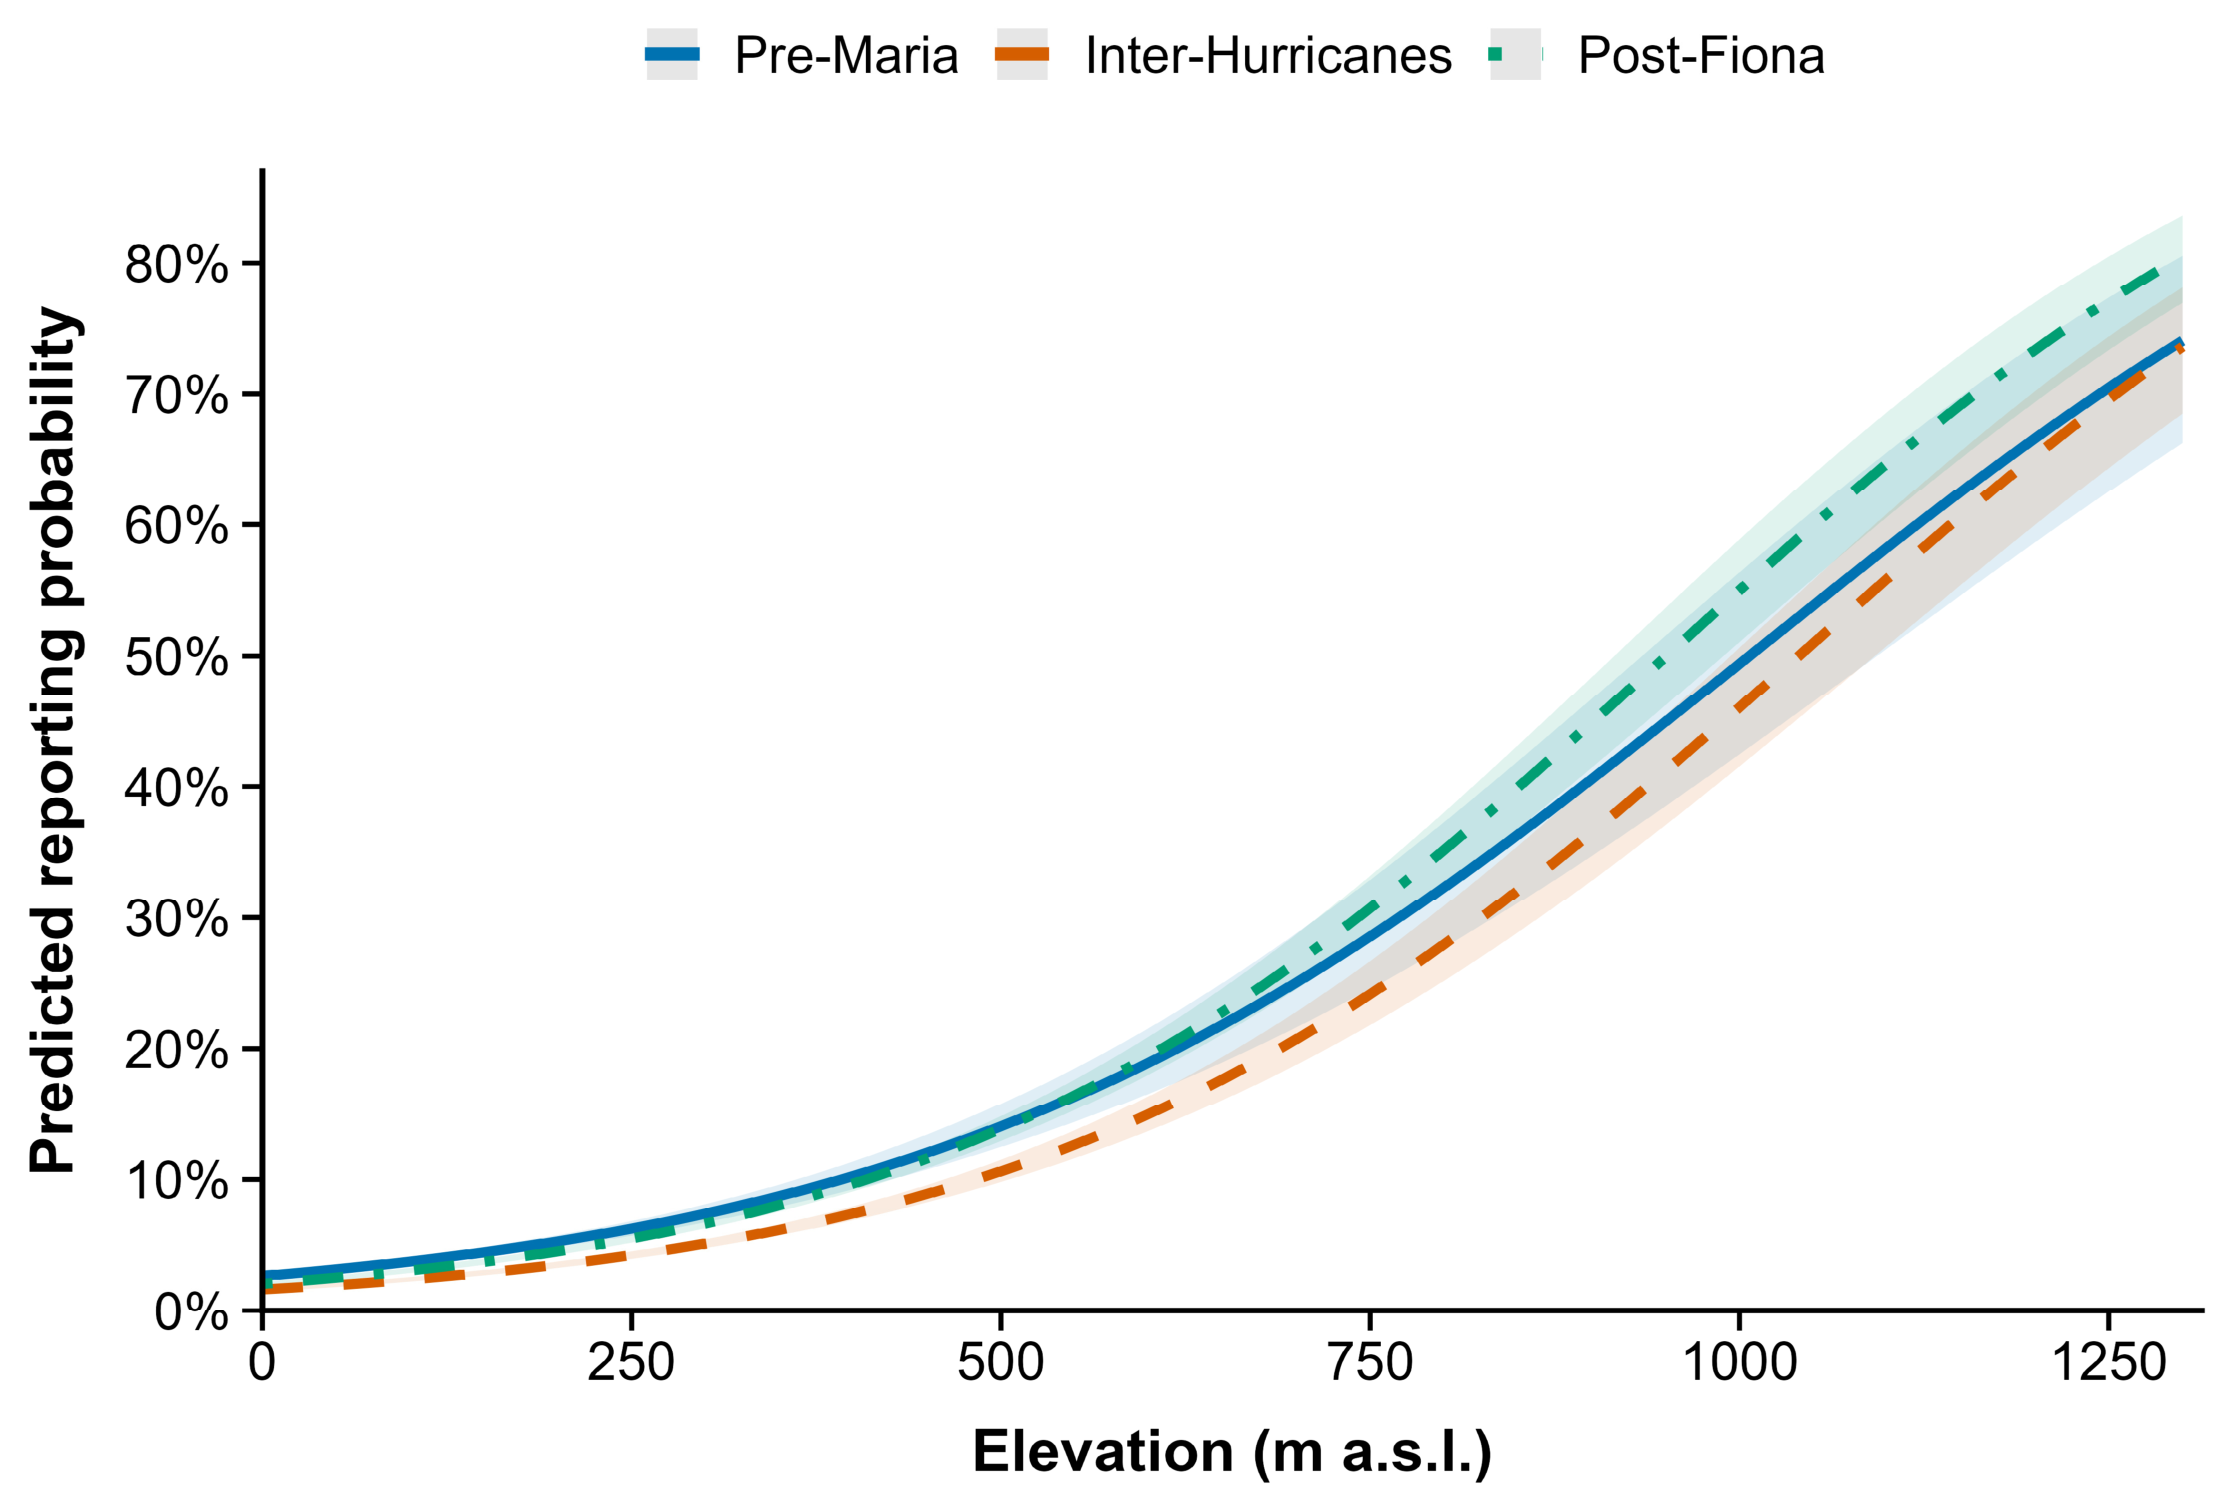
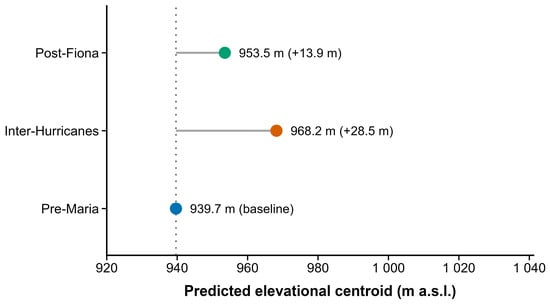
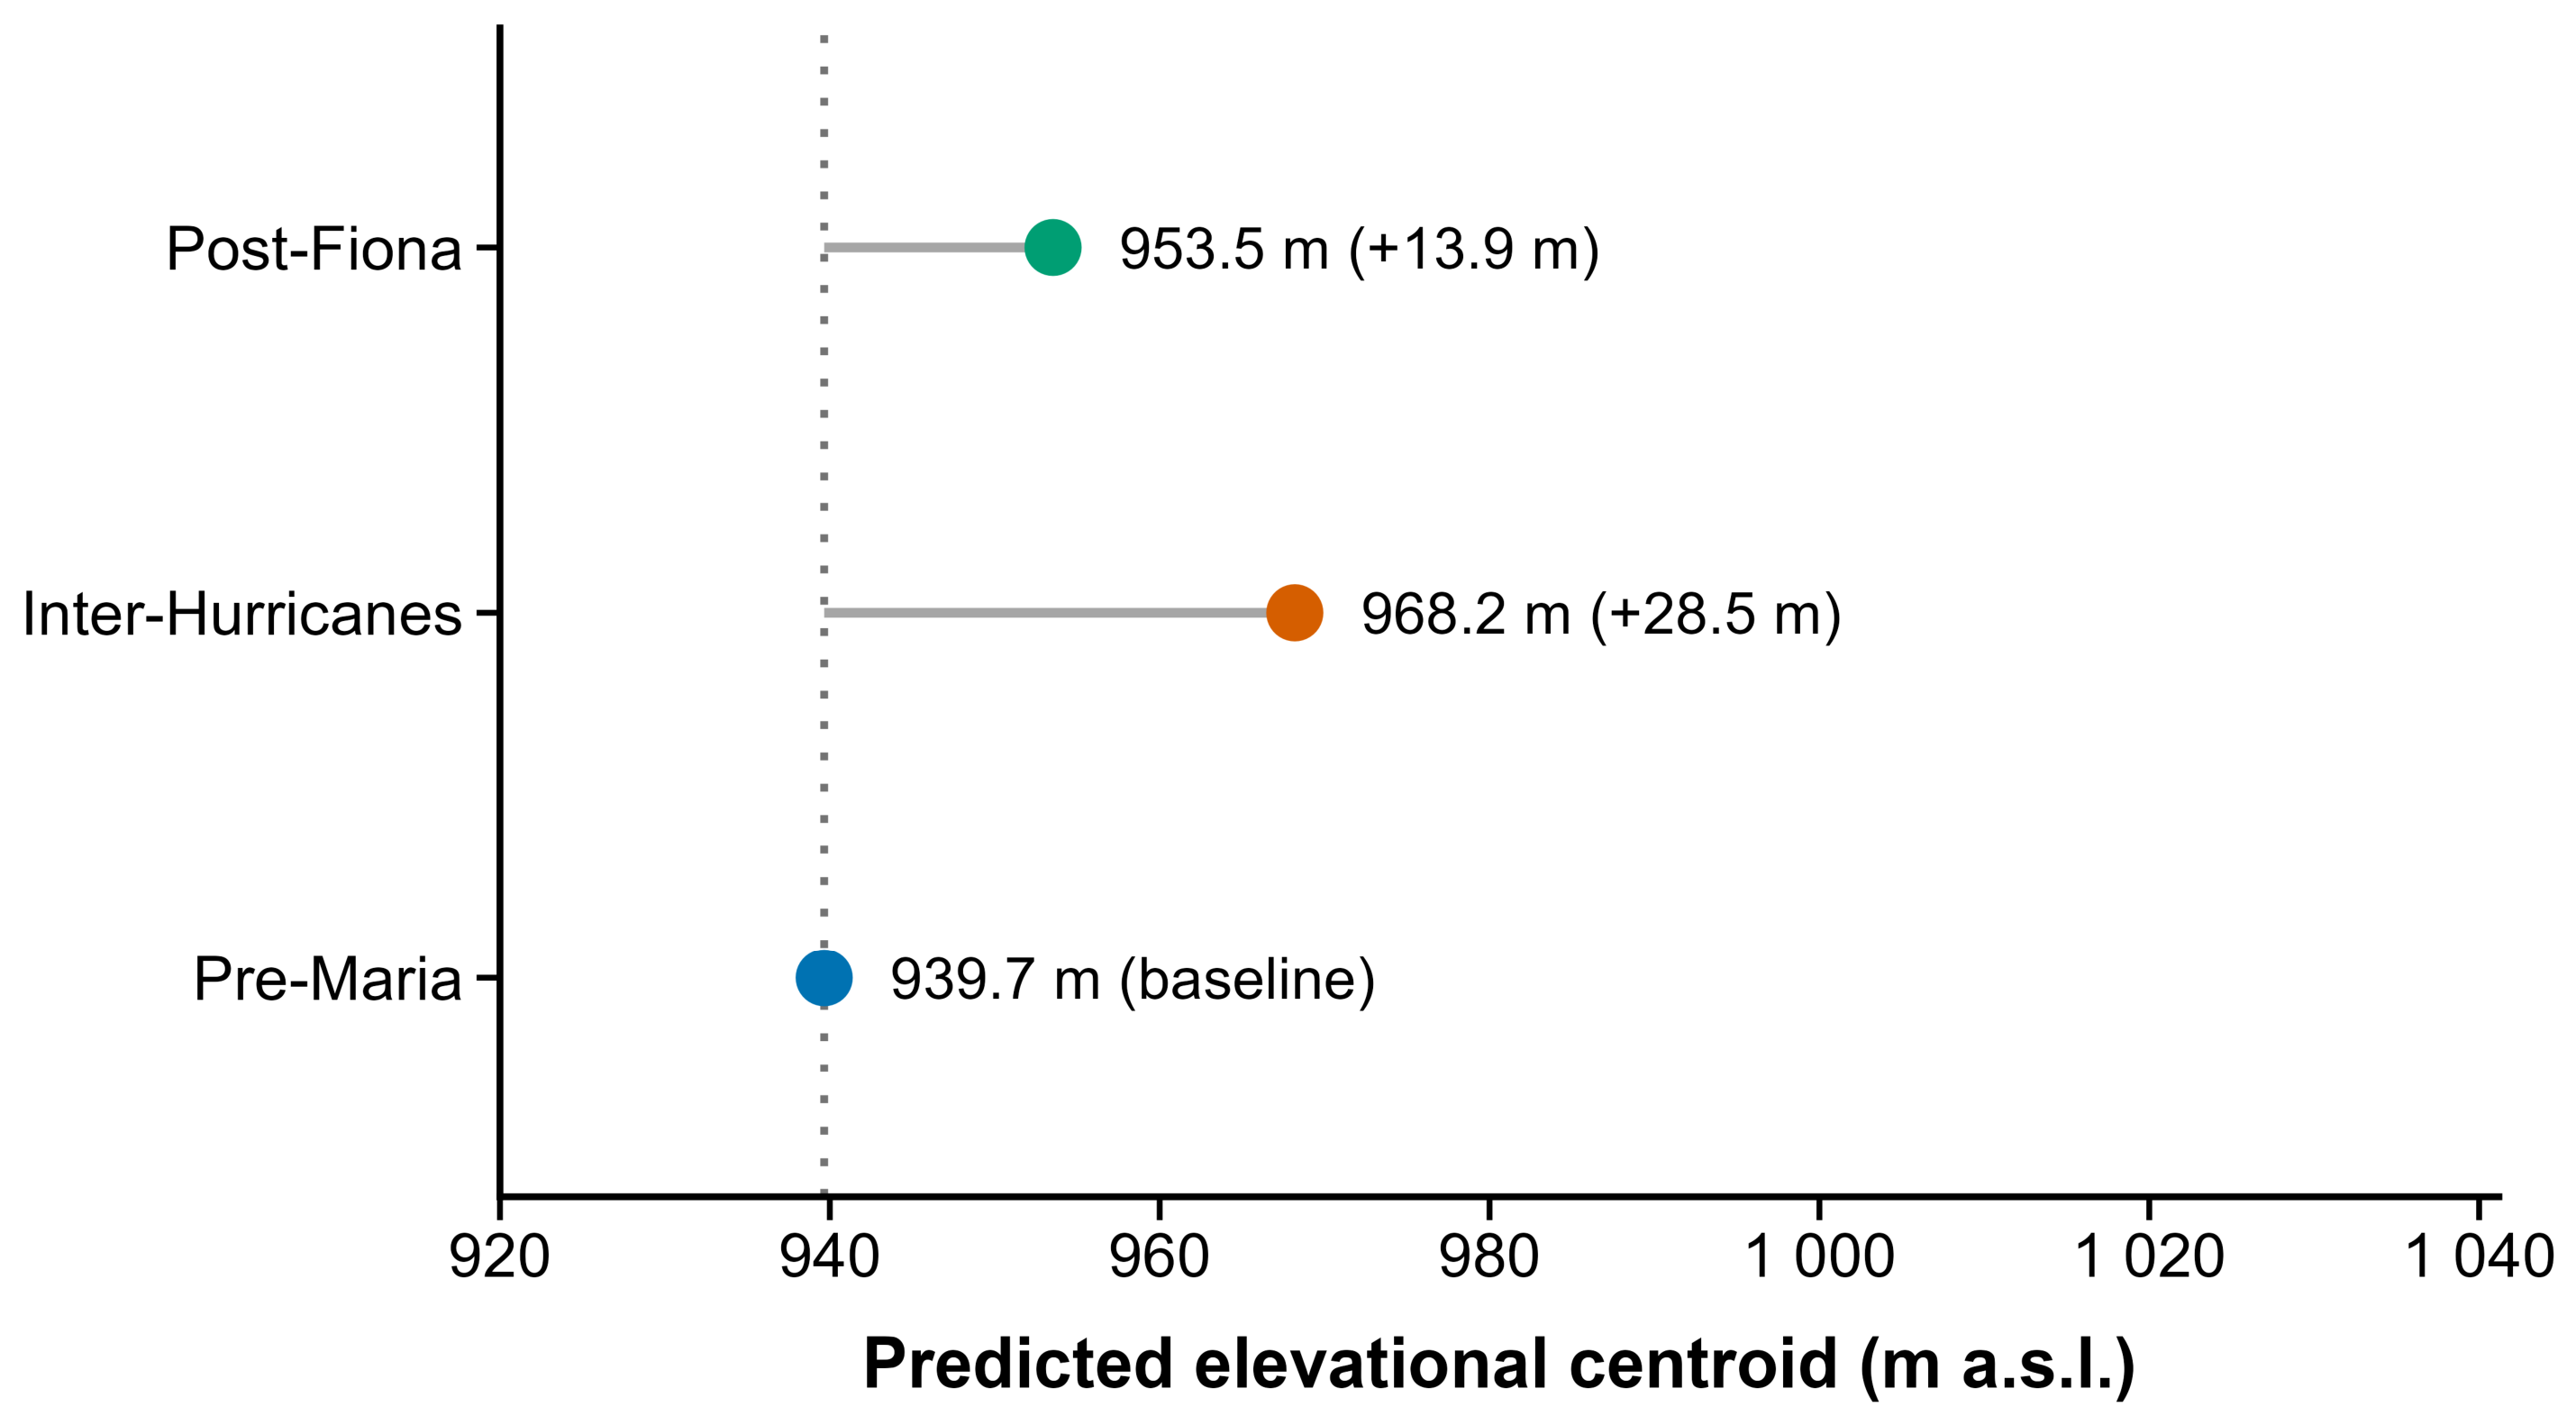
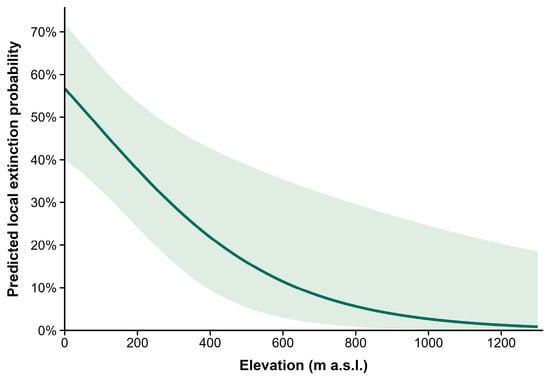
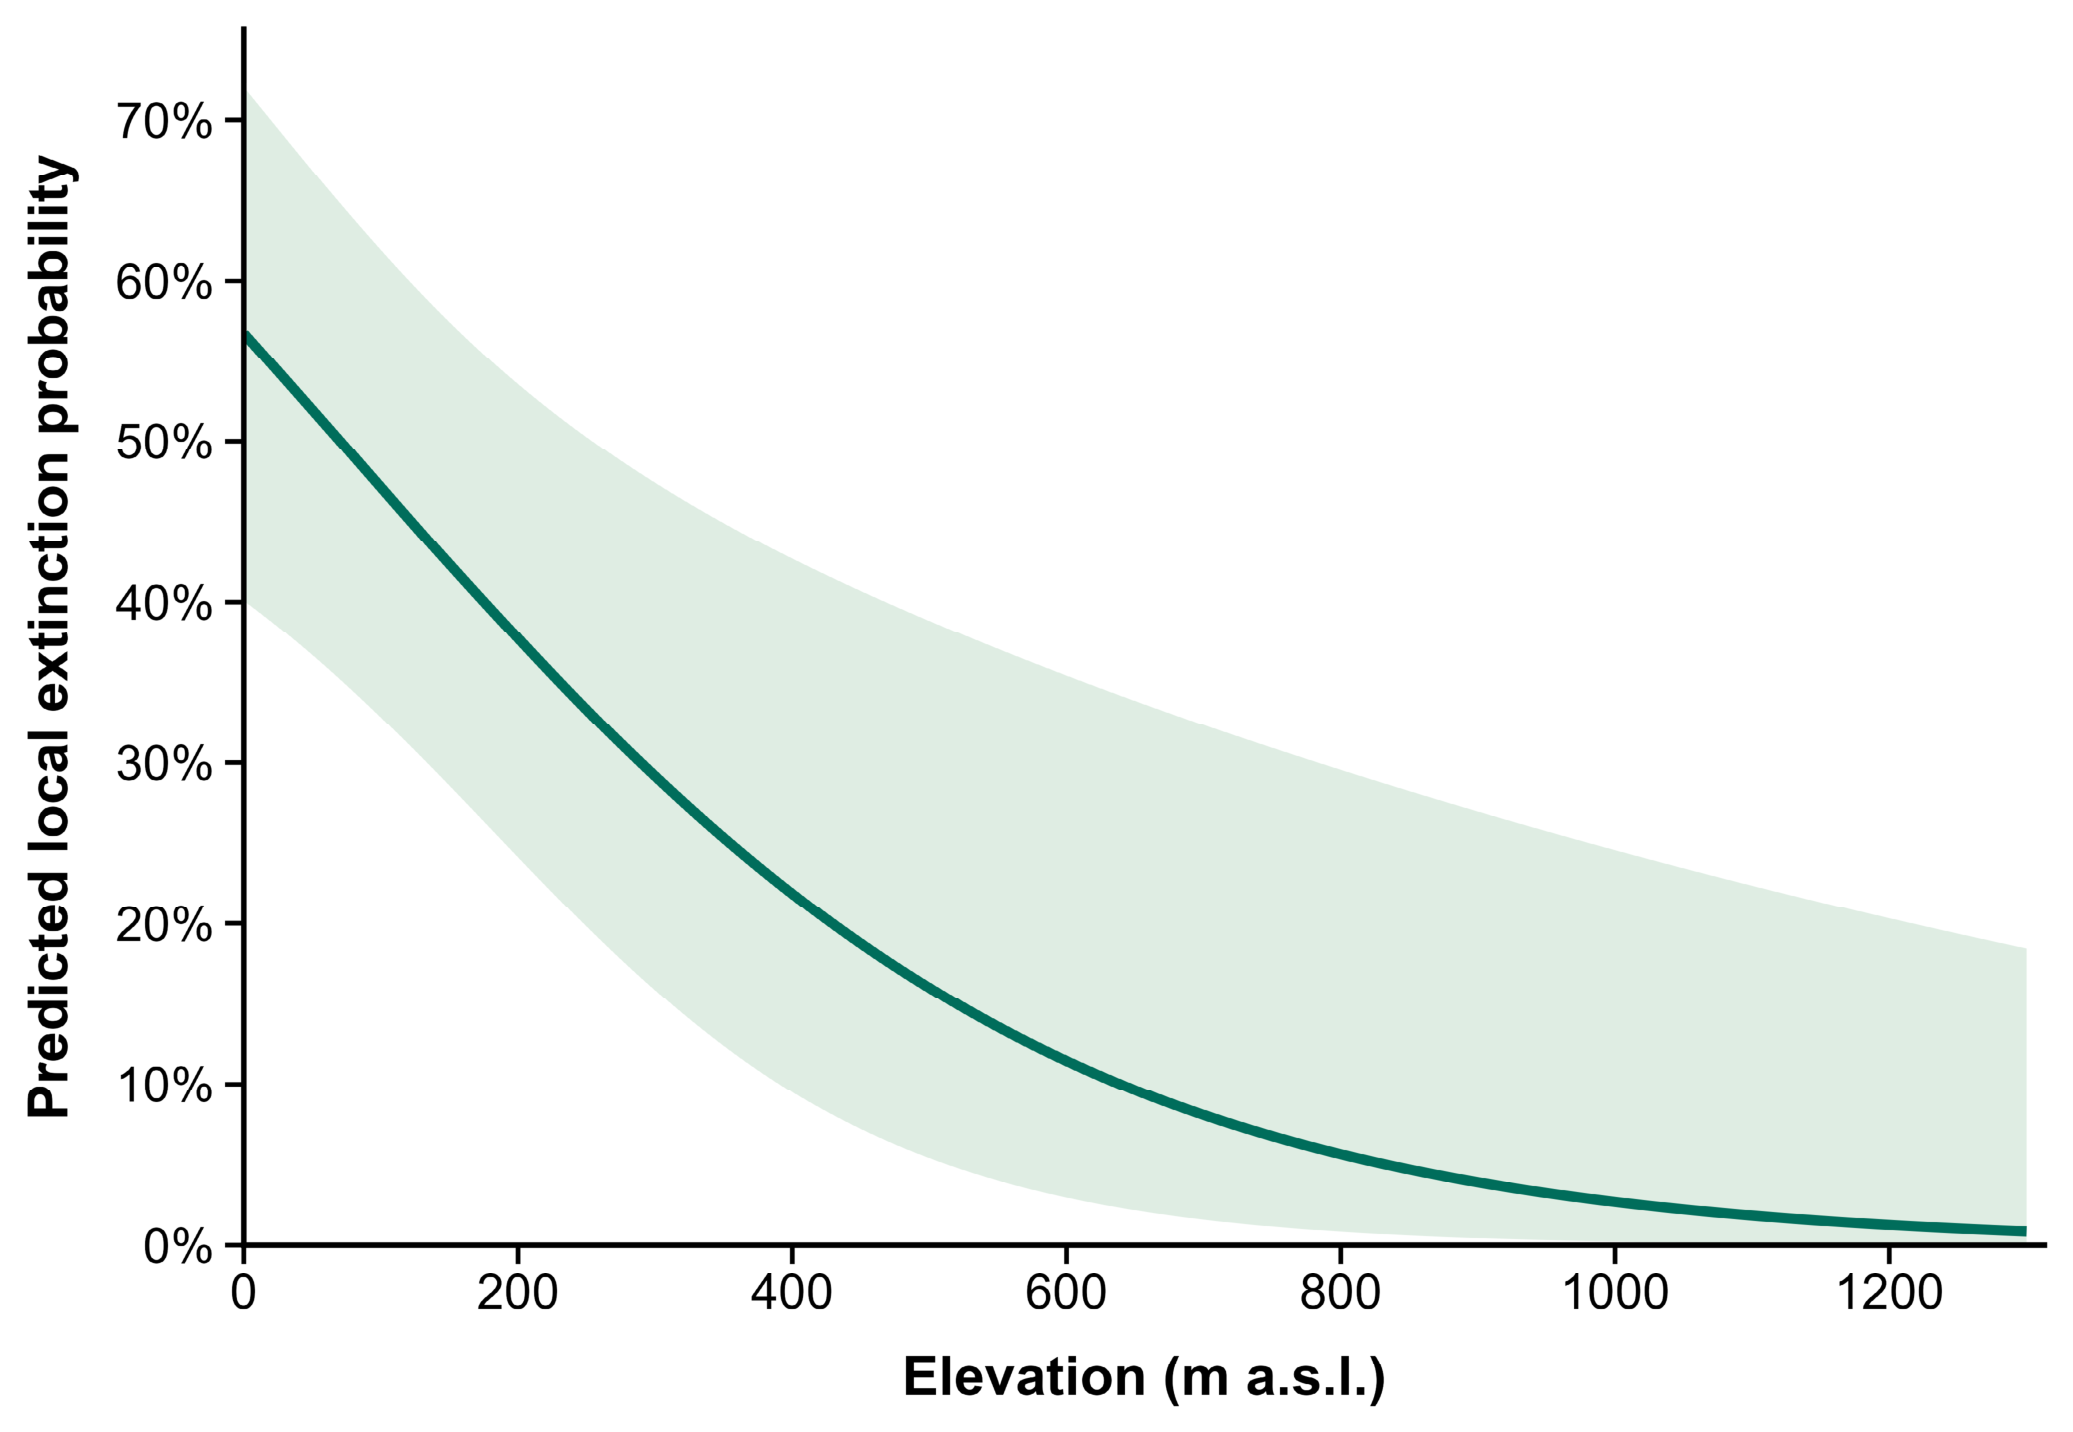
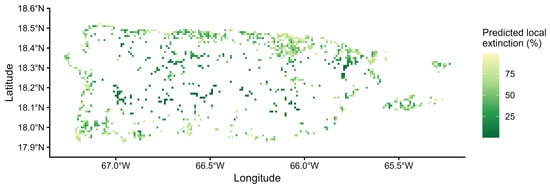
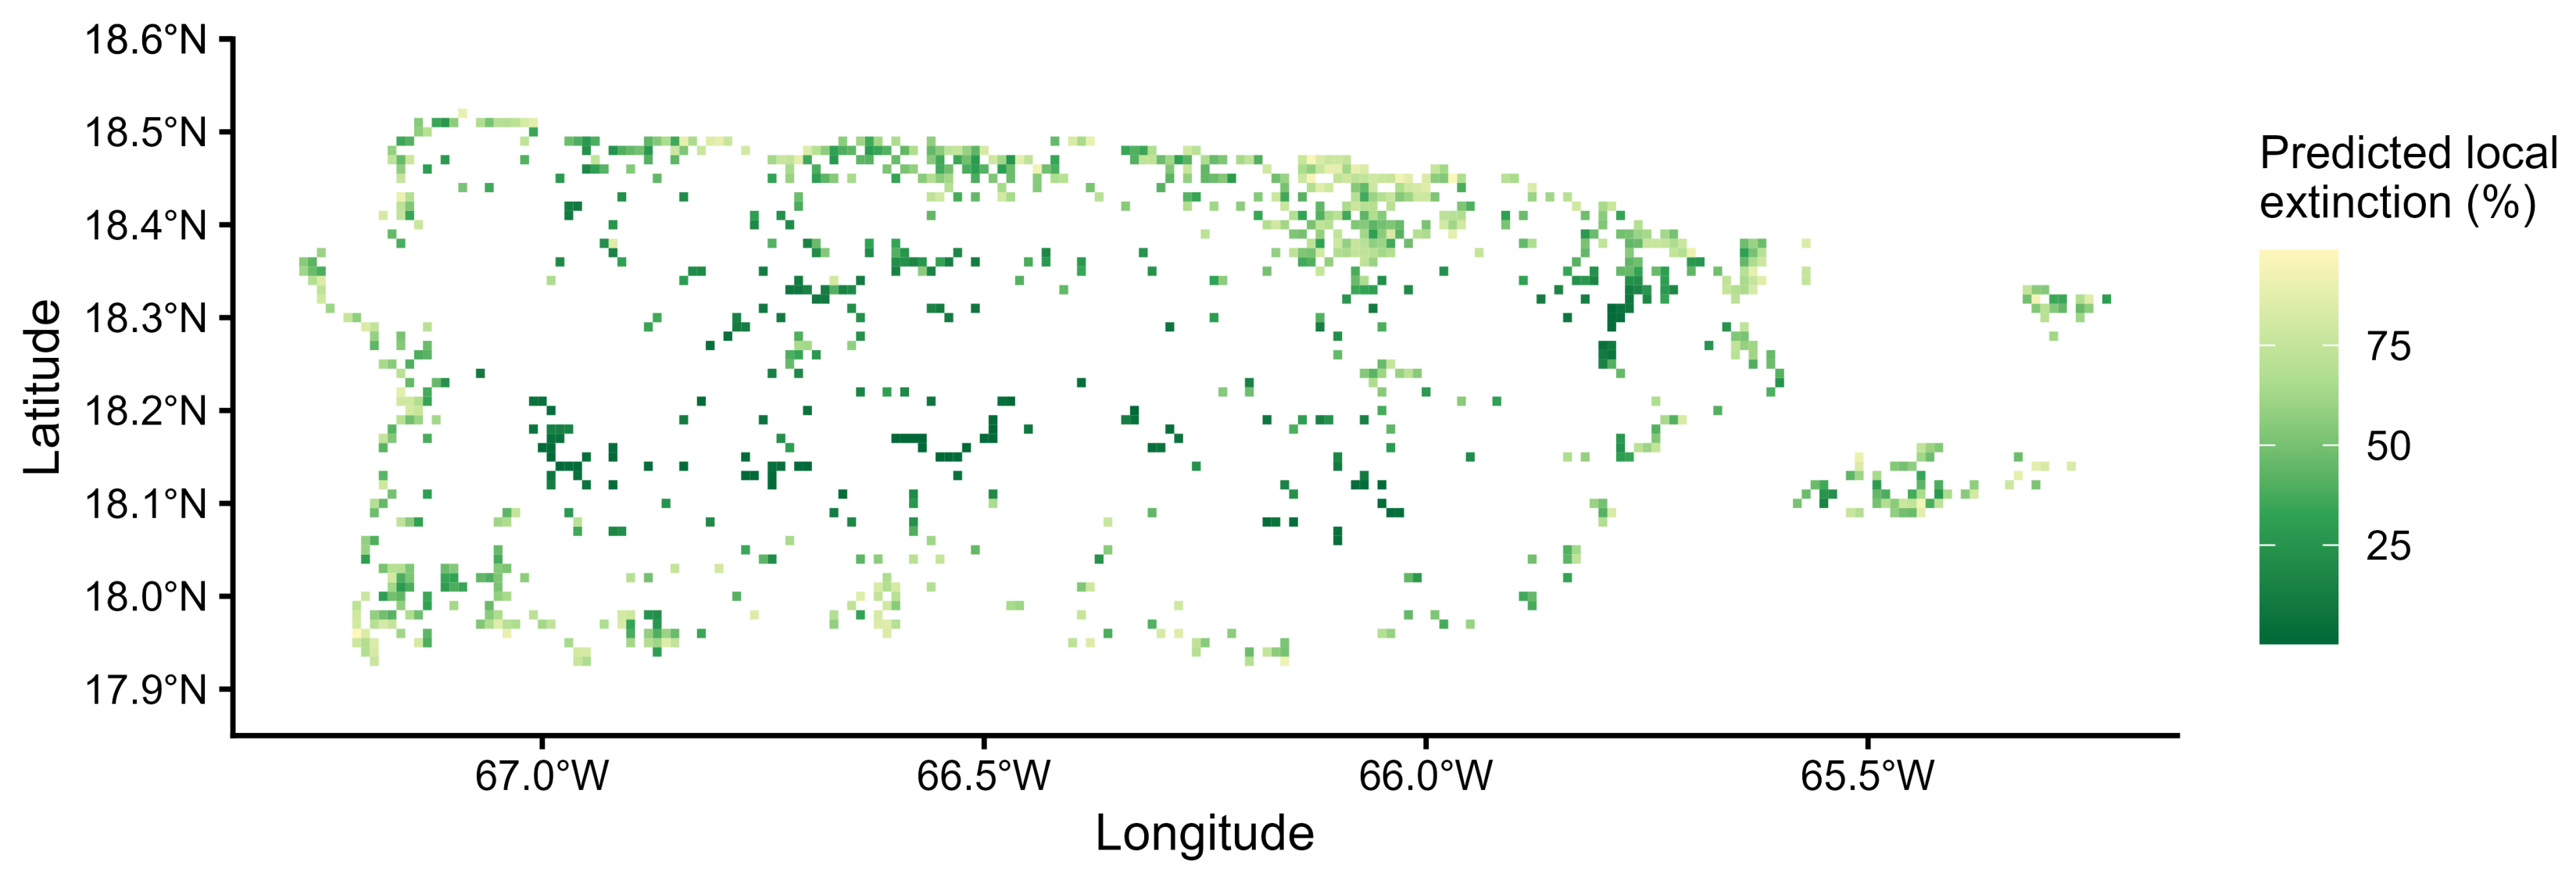

Disclaimer/Publisher’s Note: The statements, opinions and data contained in all publications are solely those of the individual author(s) and contributor(s) and not of MDPI and/or the editor(s). MDPI and/or the editor(s) disclaim responsibility for any injury to people or property resulting from any ideas, methods, instructions or products referred to in the content. |
© 2026 by the authors. Licensee MDPI, Basel, Switzerland. This article is an open access article distributed under the terms and conditions of the Creative Commons Attribution (CC BY) license.