


Highlights
What are the main findings?
- The COVID-19 pandemic caused a significant decline in tourism across the Visegrád countries, particularly affecting international tourism and air transport, while domestic tourism showed greater resilience.
- Recovery accelerated notably from 2022 onwards, but at varying speeds across countries; Poland and Czechia experienced faster recovery compared to Hungary and Slovakia. Tourism revenues rebounded more quickly than visitor numbers or employment, with employment—especially part-time positions—remaining below pre-pandemic levels.
What are the implications of the main findings?
- The tourism sector’s revenue recovered faster than visitor numbers or employment, suggesting possible adaptive capacity, though this study does not directly test the underlying mechanisms.
- Pandemic impacts posed complex challenges extending beyond tourism flows, affecting labour markets and transport systems as well, highlighting the need for multidisciplinary recovery strategies.
Abstract
The COVID-19 pandemic severely disrupted tourism globally, with considerable variation in impact and recovery across regions. This study examines how tourism demand, revenue, employment, and transport evolved in the Visegrád Four (V4) countries—Czechia, Hungary, Poland, and Slovakia—between 2015 and 2025, assessing recovery speed and sectoral resilience across nine indicators. The modelled window varies by indicator: 2015–2023 for revenue indicators, 2015–2024 for visitor-flow indicators, and 2015–2025 for employment and air passenger indicators. Annual data from Eurostat and the Hungarian Central Statistical Office were analysed using descriptive comparative methods, linear mixed-effects models, and interrupted time series analysis with counterfactual projections. All indicators showed sustained pre-pandemic growth followed by a statistically significant 2020 shock. International demand fell roughly twice as sharply as domestic demand, and air passenger traffic suffered the largest absolute collapse. Revenue recovered fastest, surpassing pre-pandemic levels by 2023–2024 in all countries, while guest-volume recovery is projected only by 2025–2027. Part-time employment remained below 2015 levels in three of four countries despite volume and revenue recovery, indicating structural labour market adjustment. Slovakia consistently showed non-significant post-shock recovery slopes in seven of nine indicators, emerging as the region’s weakest performer. These findings indicate that COVID-19 produced uneven, revenue-led recovery across V4, and the employment paradox and Slovakia’s underperformance underscore the need for diversified, evidence-based tourism crisis management.
Keywords:
COVID-19; tourism; recovery; Visegrád countries; resilience; tourism resilience; Central Europe 1. Introduction
Tourism is one of the most important and dynamically developing sectors of modern economies, generating substantial direct and indirect multiplier effects on national economies. It increases national income and wealth, stimulates investment, creates employment opportunities—particularly for low-skilled and seasonal workers—and contributes significantly to reducing regional economic disparities (Brida et al., 2014; Stabler et al., 2010). Consequently, many countries regard tourism as a strategic pillar of economic development and seek to strengthen its performance through targeted development policies (Khan et al., 2020).
Europe is particularly well positioned in this respect. The continent possesses exceptional natural and cultural resources that support a wide variety of tourism activities, ranging from seaside holidays and winter sports tourism to health and wellness tourism based on thermal waters. These advantages are further enhanced by the Schengen Agreement, which enables the free movement of people across national borders, considerably facilitating intra-European travel and contributing to Europe’s position as one of the world’s leading international tourism destinations (Gyuricza, 2009; Miczek, 1998).
Despite its economic importance, tourism is structurally vulnerable and highly sensitive to external shocks. Security threats, political instability, migration pressure—such as the uncontrolled migration wave experienced in 2015—and infectious disease outbreaks can fundamentally influence travel decisions and tourism demand (Khalid et al., 2021). Tourists’ decisions are shaped not only by objective conditions but also by previous experiences, perceptions, and their subjective sense of safety, all of which jointly determine the attractiveness and competitiveness of tourism destinations (Michalkó, 2007).
Within this context, the COVID-19 pandemic, which emerged in China at the end of 2019 and developed into a global pandemic by March 2020, posed an unprecedented challenge worldwide and had particularly severe consequences for the tourism sector. As a result of the pandemic and the accompanying government restrictions, air transport came to an almost complete standstill, tourism demand collapsed dramatically, and massive job losses occurred across the globe (Zenker & Kock, 2020). The European Union experienced its most severe economic downturn since the 2008 financial crisis, with GDP declining by 2.6%, while considerable differences emerged among Member States regarding both pandemic management strategies and the magnitude of the resulting economic impacts.
The Visegrád countries (V4)—Czechia, Hungary, Poland, and Slovakia—reported their first confirmed COVID-19 cases during the first days of March 2020. Within a relatively short period, all four governments declared a state of emergency and introduced comprehensive containment measures (Kovalcsik et al., 2021; Wardman & Lofstedt, 2020). Nevertheless, the economic contraction in the V4 countries proved to be less severe than the European Union average, partly owing to the rapid and coordinated governmental response (Dániel et al., 2021). However, the precise magnitude and mechanisms through which the pandemic affected the tourism sector across these countries have not yet been fully explored.
The V4 countries also sought to cooperate in preventing the spread of the virus through various forms of regional collaboration while continuously balancing public health priorities against economic and social considerations (I. Tóth & Hudácskó, 2020). Nevertheless, despite this cooperation, the specific public health measures and the strictness of restrictions differed considerably among the individual countries.
Given the scale of this global public health crisis, monitoring the pandemic and understanding its trends, policy responses, and consequences across European countries remain essential.
Therefore, the aim of this study is to provide a comprehensive assessment of the impact of the COVID-19 pandemic on tourism in the Visegrád countries. The analysis examines changes in guest arrivals and guest nights at commercial accommodation establishments, the turnover of the accommodation and hospitality sectors, employment in tourism-related industries, and air passenger transport. The findings contribute to a better understanding of tourism resilience and provide evidence to support the development of future crisis-management and recovery strategies.
The present study seeks to answer the following research questions:
- How did tourism demand, tourism revenues, employment, and tourism-related transport change in the Visegrád countries before, during, and after the COVID-19 pandemic?
- At what pace did domestic and international tourism recover in the Visegrád countries following the COVID-19 pandemic?
- Which countries and tourism indicators demonstrated the strongest and weakest recovery within the Visegrád region?
- How did the resilience of the tourism sector evolve in the V4 countries during the pandemic, and which factors contributed to the differences observed among the individual countries?
Throughout this article, the term “recovery” refers to the empirically measured phenomenon—the magnitude of the pandemic-era shock (β2) and the subsequent post-shock trend change (β3) estimated by the interrupted time series models. “Resilience” is used in a broader, interpretive sense to denote the sector’s inferred capacity to absorb and adapt to this shock; it is not directly measured but is inferred from the observed recovery patterns and is used accordingly in the Discussion and Conclusions.
2. Literature Review
2.1. The Economic Role and Structural Characteristics of Tourism
Tourism is one of the fastest-growing sectors of the global economy in the twenty-first century, exerting substantial direct, indirect, and induced effects on national economies. The literature consistently highlights the multiplier effect of tourism, whereby tourism expenditures generate economic activity not only within the tourism sector itself but also across numerous related industries—including food production, transportation, construction, and various service sectors—thereby producing considerably greater overall economic benefits than those resulting solely from direct tourism expenditure (Brida et al., 2014; Stabler et al., 2010). This multiplier effect explains why policymakers, particularly in developing countries, frequently regard tourism as one of the principal drivers of economic development and an important instrument for economic convergence (Khan et al., 2020).
Tourism also plays a significant role in employment generation. The sector creates numerous job opportunities that are accessible to lower-skilled workers and provides employment even in rural, peripheral, or economically disadvantaged regions where alternative industries are often underdeveloped. Consequently, tourism contributes to reducing regional economic disparities (Brida et al., 2014). At the same time, the predominance of seasonal employment represents one of the sector’s well-recognised structural weaknesses, making tourism employment particularly vulnerable during periods of economic crisis.
Within the global tourism market, Europe occupies an exceptionally strong competitive position. The continent’s rich cultural heritage, diverse natural attractions, and highly developed tourism infrastructure are complemented by the free movement guaranteed under the Schengen Agreement, which facilitates cross-border travel and substantially promotes tourism flows within the region (Gyuricza, 2009; Miczek, 1998). As a result, Europe has consistently remained the world’s leading destination for international tourist arrivals.
2.2. Tourism Vulnerability and the Role of Safety in Travel Decisions
Alongside its economic strengths, the tourism sector is widely recognised as being highly vulnerable to external disturbances. Tourism demand responds rapidly to changes in the external environment, including geopolitical conflicts, natural disasters, terrorist threats, political instability, and infectious disease outbreaks, all of which can dramatically reduce tourist flows within a relatively short period (Khalid et al., 2021).
Travel decisions are influenced by complex psychological processes. Tourists not only evaluate objective risks but are also strongly affected by their subjective perception of safety, previous experiences, destination image, and expectations, which collectively shape the perceived attractiveness of tourism destinations (Michalkó, 2007).
Safety has therefore become one of the most influential determinants of travel behaviour. Keller and Tóth-Kaszás (2020) argue that disease outbreaks generate anxiety among travellers, causing tourism demand to decline even before formal government restrictions are introduced, primarily as a consequence of public perceptions and media coverage. Research conducted in Hungary indicates that travellers generally perceive public safety, food safety, and public transportation safety positively, whereas the safety of public events and road transport is evaluated less favourably (Rácz, 2019). These findings suggest that safety is not perceived as a single, homogeneous concept but rather as a multidimensional factor whose importance varies across destinations and travel contexts.
2.3. Global and European Impacts of the COVID-19 Pandemic on Tourism
The COVID-19 pandemic, first identified in China at the end of 2019 and declared a global pandemic by the spring of 2020, arguably caused the greatest shock in the history of the tourism industry. The hotel and aviation sectors—which play a fundamental role in gross domestic product (GDP), employment generation, and socio-economic development in many countries—became among the sectors most severely affected by the pandemic, experiencing both a dramatic collapse in supply and an unprecedented decline in demand (Christidis & Christodoulou, 2020; Ocheni et al., 2020; Tretheway & Markhvida, 2014). During the spring of 2020, mobility restrictions affected approximately 90% of the world’s population and almost completely eliminated access to tourism destinations (Gössling et al., 2021; Fotiadis et al., 2021).
The lockdown measures not only wiped out the revenues of accommodation providers and airlines but also had profound consequences for the hospitality industry, as well as cultural and entertainment institutions. In some cases, visitor numbers to restaurants and public cultural institutions declined by 50–60% or even more. The year 2020 produced highly heterogeneous outcomes for the hospitality sector: while many establishments temporarily suspended their operations in anticipation of the end of the pandemic, others were forced to close permanently (Ahmad et al., 2020). The decline was driven not only by government restrictions but also by widespread fear and the climate of uncertainty created by the pandemic (Chemli et al., 2020).
Zenker and Kock (2020) argued that the COVID-19 pandemic resulted not merely in a temporary decline in tourism demand but also in profound and long-lasting changes in tourists’ attitudes and travel behaviour. Building on preferences already noted before the pandemic—for shorter but more frequent trips, unique and less crowded experiences, and greater attention to the hygiene standards of accommodation establishments and tourism service providers (Kulcsár & Grotte, 2018)—the pandemic further intensified these shifts and added a new emphasis on flexible booking and cancellation policies, as travellers began incorporating pandemic-related uncertainty about future travel conditions into their decision-making processes (Csapó & Törőcsik, 2019, 2020).
2.4. Pandemic Management in the Visegrád Countries: Public Health Measures and Economic Policy Responses
The COVID-19 pandemic reached the Central European region almost simultaneously. The first confirmed cases were reported on 1 March 2020 in Czechia, 4 March 2020 in Hungary and Poland, and 6 March 2020 in Slovakia (Kovalcsik et al., 2021). Within less than three weeks of the first confirmed infections, all Visegrád (V4) governments declared a state of emergency and introduced comprehensive containment measures. Nevertheless, several preventive actions had already been implemented before the first domestic cases were detected. Czechia suspended the issuance of visas to Chinese citizens, while Slovakia introduced random border controls. Overall, the V4 countries responded more rapidly and decisively than many of their Western European counterparts, which, according to the literature, provided a measurable advantage in mitigating the first wave of the pandemic (Sevcik et al., 2020).
Public life was reduced to a minimum. Schools, restaurants, cafés, and shopping centres were closed; mass gatherings were prohibited; mandatory quarantine was imposed on individuals returning from abroad; and the wearing of face masks or other face coverings became compulsory (Á. Kovács & Zsigmond, 2020). However, the strictness of these measures differed across the four countries. Slovakia implemented the most stringent restrictions by introducing a complete nationwide lockdown for two weeks, during which only essential services remained open. Hungary adopted a unique local measure by introducing dedicated shopping hours for elderly citizens to reduce their risk of infection (Sikos et al., 2021). By contrast, Czechia and Poland initially imposed less restrictive measures. In Czechia, delayed interventions contributed to a sharp increase in the number of infections during the second wave of the pandemic.
During the first wave, mortality rates in the V4 countries remained substantially below the European average. Among the four countries, Hungary recorded the highest mortality rate, approaching 17.5 deaths per 100,000 inhabitants. However, following the relaxation of restrictions during the summer of 2020, the second wave was characterised by increasing infection rates across all V4 countries, as the easing of public health measures facilitated more rapid virus transmission. Poland experienced the smallest economic contraction (−7.9%), while all four countries performed better than the European Union average. This relatively favourable performance can be attributed partly to the rapid governmental response and partly to the implementation of extensive economic support measures (Dániel et al., 2021).
To mitigate the economic consequences of the pandemic, the V4 governments implemented a broad range of fiscal and economic policy interventions. To preserve employment, governments covered 40–80% of wage costs in certain sectors through wage compensation schemes, tax relief, and social security contribution exemptions, while also financing sickness benefits for employees during mandatory quarantine. Businesses received support through low-interest loans, non-repayable grants, and government-backed loan guarantees. In addition, payment and administrative moratoria—such as extensions of tax filing deadlines—were introduced, and legal protection was provided for tenants unable to pay commercial rents during the emergency period (S. Kovács, 2020). In Hungary, the local business tax for small and medium-sized enterprises (SMEs) was reduced by 50%, although this measure substantially decreased municipal revenues (S. Kovács, 2020). Czechia and Poland also implemented monetary easing by reducing their policy interest rates by 75 and 140 basis points, respectively (Demertzis et al., 2020). As a result of these coordinated policy responses, the overall economic downturn in the V4 countries was less severe than the European Union average and considerably milder than many experts had initially anticipated (Konrad-Adenauer-Stiftung, 2022).
2.5. Challenges and Future Perspectives for Tourism Recovery
One of the long-term consequences of the COVID-19 pandemic was a substantial shift in the tourism labour market. Following the lockdowns in 2020, many employees became disillusioned with the tourism industry and sought employment in other sectors. Owing to the high level of uncertainty and vulnerability experienced during the crisis, many were reluctant to return to an industry perceived as particularly unstable (L. Kovács et al., 2021). As a result, labour shortages emerged as a major structural challenge, becoming one of the principal obstacles to the sector’s recovery.
From the perspective of crisis management, tourism organisations can be broadly classified into two groups. The larger group regarded the pandemic-related shutdowns as a temporary disruption and focused primarily on maintaining operations and ensuring organisational survival. A smaller group, however, viewed the crisis as an opportunity for strategic renewal. These organisations developed new business strategies, modernised their communication channels, invested in staff training, and sought to reposition their destinations for the post-pandemic tourism market (Nod et al., 2021).
In the post-COVID-19 period, the financial vulnerability of highly leveraged tourism enterprises has intensified. The influence of the real effective exchange rate and the service-sector price index on business performance has become more pronounced, while the combined effects of psychological stress and increasing financial burdens have constrained strategic flexibility, thereby affecting long-term competitiveness (Helhel, 2026). Accordingly, the resilience of the tourism sector depends on maintaining an appropriate balance between psychological stability, financial security, and strategic adaptability (Papadam et al., 2026). Although visiting friends and relatives (VFR) travel declined substantially during the pandemic, demand rebounded strongly following the lifting of restrictions as the value of personal relationships and face-to-face interactions increased (Zentweld, 2026).
The long-term recovery of tourism requires comprehensive planning and coordinated action across the entire tourism ecosystem, particularly given the slow and uneven recovery of international tourism demand (Tandrayen-Ragoobur et al., 2024). Tourism service providers must continue to offer flexible booking and cancellation policies while maintaining high standards of hygiene and health protection, although these measures inevitably increase operating costs and service prices (Felkai, 2021; Csapó & Törőcsik, 2019, 2020).
At the same time, the COVID-19 pandemic has created an opportunity to promote a more sustainable model of tourism development. Both the adverse impacts of overtourism and the lessons learned from the pandemic have strengthened demand for higher-quality, less crowded, and more environmentally sustainable forms of travel (Neumanné Virág & Fehérvölgyi, 2021). Furthermore, government financial incentive programmes may reduce the likelihood of future disruptions within the tourism sector. Tourism can also serve as an effective policy instrument for increasing vaccination uptake by offering more favourable travel conditions and incentives to fully vaccinated travellers (Gudkov, 2024).
3. Materials and Methods
3.1. Study Design and Data Sources
This study employed a quantitative, descriptive research design based on secondary data analysis. The data used in the analysis were drawn from the Eurostat tourism statistics database (datasets tour_occ_arnat, tour_occ_ninat, sts_setu, tour_lfs6r2, avia_paoc, rail_pa, and road_pa) and from the statistical database of the Hungarian Central Statistical Office (HCSO, dataset stadat-sza0016-24.1.1.16). All data were publicly available, aggregated, and non-identifiable at the individual level. The dataset covered the four Visegrád Group countries (Czechia, Hungary, Poland, and Slovakia) for the period 2015–2025, with the exact modelled window varying by indicator (Table 1), and were retrieved on 27–30. April 2026.
Table 1.
Data availability and model window by indicator, reconstructed from SPSS output files (Visegrád Group countries, 2015–2025).
Data for 2015 were used as a baseline to characterise long-term trends preceding the COVID-19 pandemic. To assess the impact of the pandemic, 2019 was selected as the reference year, and subsequent changes were evaluated relative to the corresponding periods of that year; in several instances, changes relative to the equivalent period in 2015 were also presented to further contextualise the magnitude of the observed effects.
3.2. Indicators and Variables
The study examined, annually, domestic and international hotel guest arrivals, guest nights, accommodation and food-service turnover, and full-time/part-time tourism employment across pre-pandemic, pandemic, and post-pandemic periods. Guest traffic growth was described using percentage changes relative to 2015, and one guest-volume indicator (guests per 10,000 inhabitants) was additionally constructed to allow comparison across countries of different population sizes. Accommodation and food-service turnover indicators were expressed as base indices (2015 = 100) rather than nominal currency values; guest nights were reported in millions, and domestic/international guest arrivals, employment, and air passenger volume were reported as raw counts.
Rail, bus, and passenger car transport data were incorporated alongside air transport statistics to assess tourism-related mobility. Air transport data were complete and detailed; rail, bus, and car data were fragmentary, limiting analysis of these modes.
Nine indicators were analysed: guests per 10,000 inhabitants (Guests10000), domestic guests (DomesticGuest), international guests (InternationalGuest), guest nights in millions (GuestsnightsM), accommodation revenue (RevenueAccommodation), total tourism revenue (RevenueTotal), part-time employment (EmploymentPart), full-time employment (EmploymentFull), and air passenger volume (AirPassenger). Total tourism revenue (RevenueTotal) was defined as the combined turnover of the accommodation and food-service (hospitality) sectors, whereas accommodation revenue (RevenueAccommodation) covers commercial accommodation establishments only.
Temporal trends were assessed via time series and comparative statistics (means, base and chain indices, absolute differences), processed in Microsoft Excel.
3.3. Linear Mixed-Effects Model
To evaluate longitudinal COVID-19 effects while accounting for repeated within-country measurements, linear mixed-effects models were estimated separately for each of the nine indicators using IBM SPSS Statistics 24 (IBM Corp.), with restricted maximum likelihood (REML) estimation and a first-order autoregressive (AR(1)) covariance structure for temporal autocorrelation.
Country was a fixed categorical factor; Time (continuous pre-COVID-19 linear trend), COVID (binary, 0 before 2020, 1 from 2020), and TimeAfterCOVID (continuous, 0 before 2020, then 1, 2, 3… from 2020) were explanatory variables. Country × COVID and Country × TimeAfterCOVID interactions tested whether shock magnitude and recovery speed differed across countries. Type III tests of fixed effects were reported (p < 0.05).
3.4. Interrupted Time Series Analysis
An interrupted time series (ITS) analysis quantified the pandemic as a discrete intervention, using the segmented regression model:
where Y(t) is the indicator value at time t; Time is a continuous index (t = 1 for 2015 … t = 9 for 2023); COVID is binary (0 before 2020, 1 from 2020); TimeAfterCOVID is the time elapsed since onset (0 before 2020; 1 in 2020, 2, 3, … thereafter); β0 is the intercept; β1 is the pre-COVID-19 trend; β2 is the immediate level shock; β3 is the post-shock slope change (recovery trajectory); and ε is the error term.
Y(t) = β0 + β1·Time + β2·COVID + β3·TimeAfterCOVID + ε
Models were estimated per country via OLS in IBM SPSS Statistics 24.0 (36 models: 9 indicators × 4 countries; n = 9 annual observations each). Durbin–Watson statistics ranged from 1.6 to 3.3. Values close to 2 suggest limited autocorrelation, though values above 2 in some models may indicate mild negative autocorrelation; given the very small number of annual observations per country-specific model (n = 9), these diagnostics should be interpreted with caution.
3.5. Counterfactual Analysis
For each ITS model, extrapolating the pre-COVID-19 trend (β0 + β1·Time) beyond 2020 gave a counterfactual projection; the gap versus actual fitted values quantified the cumulative COVID-19 impact. Projected recovery year was estimated as t_recovery = 5 − (β2/β3), converted via recovery year = 2014 + t_recovery. No recovery projection was reported where β3 was non-significant or negative.
3.6. Ethical Considerations
No ethical approval was required for this study, as the research was based exclusively on publicly available, aggregated data that did not permit identification of individuals.
4. Results
4.1. Pre-COVID-19 Growth Trends (2015–2019)
Tourism in the Visegrád Four (V4)—Czechia, Hungary, Poland, and Slovakia—followed a consistent three-phase pattern between 2015 and 2024: sustained pre-pandemic growth (2015–2019), pandemic collapse (2020–2021), and uneven recovery (2022–2024). This structure appears across guest arrivals, guest nights, revenue, employment, and transport, and is confirmed statistically by linear mixed-effects and interrupted time series (ITS) models, which decompose each series into a pre-COVID-19 trend (β1), a COVID-19-era level shift (β2), and a post-shock trend change (β3).
All four countries grew continuously through the first phase, with 2019 marking the pre-pandemic peak on nearly every metric. Growth magnitude varied: Slovakia showed the fastest pre-COVID-19 rise in guest arrivals (+47%, 2015–2019), followed by Poland (+33%), Czechia (+28%), and Hungary (+23%, the slowest). This ranking—Slovakia and Poland expanding fastest from low bases, and Hungary most modestly—recurs throughout the results and foreshadows later divergent recovery paths. This tripartite structure is visible across guest arrivals, guest nights, revenue, employment, and transport indicators alike, and is corroborated statistically by both the pooled mixed-effects models and the country-specific ITS models reported in Table 2 and Table 3.
Table 2.
Type III test results (F-statistics and p-values) from linear mixed-effects models for nine tourism-related indicators in the Visegrád Group countries. Modelled periods vary by indicator (see Table 1).
Table 3.
Summary of interrupted time series regression coefficients (β1: pre-existing trend; β2: level change at intervention; β3: slope change post-intervention) by country and tourism indicator.
4.2. Guest Arrivals and Tourism Demand
Guest arrivals provide the most direct measure of tourism demand and show the clearest three-phase pattern of any indicator examined in this study. In 2020, guest numbers fell by roughly half in every V4 country. This matches the ITS results for population-adjusted Guests10000, which found significant negative level shifts (β2) from −6049 (Poland) to −14,264 (Czechia), with Hungary (−10,390) and Slovakia (−7830) in between (Table 3). Czechia, with the highest pre-pandemic per capita guest levels, absorbed the largest absolute shock.
Recovery began unevenly in 2021: Slovakia showed no meaningful improvement, and Czechia, Hungary, and Slovakia remained 30–40% below 2015 levels, while Poland stood only 18% below, reflecting its larger pre-COVID-19 growth base and, as shown later, its distinct recovery slope. By 2022, recovery accelerated sharply—Poland’s arrivals rose 54% year-on-year, and the others over 70%—and all four countries surpassed their 2015 levels, indicating that the acute phase of the crisis had passed even though pre-pandemic peaks had not yet been regained.
By 2024, recovery had bifurcated: Czechia and Poland exceeded their 2019 peaks, while Hungary and Slovakia remained below theirs. This matches the ITS recovery slopes (β3): those of Czechia (+1936/year), Hungary (+1488/year), and Poland (+940/year) were significant, while Slovakia’s (+689/year) was not (ns), signalling a structurally weaker recovery (Table 3).
Per 10,000 inhabitants, country rankings stayed stable throughout 2015–2024: Czechia’s was highest, followed by Hungary and Slovakia, and Poland’s was lowest—despite Poland’s largest absolute guest numbers. Poland briefly overtook Slovakia during recovery but reverted to last place by 2023, confirming its advantage lies in market size rather than per capita intensity (Figure 1).
Figure 1.
Actual vs. counterfactual number of visitors per 10,000 inhabitants in the Visegrád countries between 2015 and 2024.
4.3. Guest Arrivals: Domestic vs. International Divergence
International guest arrivals fell 60–70% during the crisis, roughly double the 30–45% domestic decline, reflecting cross-border restrictions and a compensatory shift to domestic leisure travel (Figure 2).
Figure 2.
Actual vs. counterfactual number of domestic and international visitors in the Visegrád countries between 2015 and 2024 (per million people).
Pre-pandemic domestic guest-arrival growth (2015–2019) ranged from +22% in Hungary to +50% in Slovakia. ITS pre-COVID-19 domestic trends (b1) show Poland growing fastest in absolute terms (+1,697,430/year), ahead of Czechia (+680,680), Hungary (+342,618), and Slovakia (+289,552) (Table 3). International trends were less consistent: Czechia’s (+565,713/year) and Slovakia’s (+163,491/year) growth was non-significant, while Hungary’s (+312,341) and Poland’s (+426,539) was significant.
The 2020 shock hit domestic demand mildly in Czechia and Slovakia (−5–12% vs. 2015) but harder in Hungary and Poland (−25–30%). Internationally, Hungary suffered the worst collapse (−72% vs. 2015), with the others also severely affected. ITS level shifts for InternationalGuest show Czechia absorbing the largest absolute loss (−11,235,628), followed by Poland (−7,160,455), Hungary (−6,294,239), and Slovakia (−2,207,394) (Table 3); relative to the counterfactual trend, losses reached about −92% (Czechia), −77% (Hungary), and −74% (Poland)—among the most severe shocks in this study.
The year 2021 brought uneven recovery. Domestically, all countries but Slovakia improved: Poland +26%, and Czechia and Hungary about +10%; Czechia surpassed its 2015 domestic baseline first. Internationally, Hungary rose 37% and Poland (+11%) and Czechia (+8%) showed modest gains, but Slovakia fell a further 32%—an early signal of the non-significant recovery slopes Slovakia shows across most ITS models (Table 3).
By 2022, international guest arrivals roughly doubled across all four countries. Poland reached its 2015 international baseline, though all countries remained below their 2019 peaks. By 2024, all four stood 20–40% above 2015 international levels, but only Poland had fully regained its 2019 peak.
Guest nights followed a similar arc, with Slovakia the slowest to recover on all volume indicators: after a 45% decline in 2020, it fell a further 16% in 2021—the only country with two consecutive declines. The others returned to growth in 2021 (Czechia +2%, Hungary +19%, Poland +22%). ITS pre-COVID-19 trends confirm Poland’s advantage (+5.368 million/year vs. +2.568 million for Czechia, +1.485 million for Hungary, and +1.139 million for Slovakia) (Table 3). By 2022, all four grew 45–70% year-on-year, and by 2024 all exceeded 2015 levels, though only Czechia and Poland had surpassed their 2019 peaks.
4.4. Revenue Indicators
Revenue from commercial accommodation fell sharply in 2020, with declines of 45–55% across all four countries (Figure 3). Combined accommodation and hospitality revenue fell a comparatively contained 18% in Slovakia versus 28–38% elsewhere. ITS level shifts confirm this: for accommodation revenue, Hungary suffered the largest shock (b2 = −156.59), followed by Poland (−129.59), Slovakia (−120.96), and Czechia (−102.47) (Table 3). For total revenue, Hungary again led (−133.81), followed by Poland (−96.57), Czechia (−90.74), and Slovakia (−74.22, the smallest).
Figure 3.
Actual vs. counterfactual revenue of accommodation and services as a percentage in the Visegrád countries between 2015 and 2023 (2015 = 100%).
In 2021, Czechia, Hungary, and Poland achieved revenue gains of 5–30%, while Slovakia’s revenue fell a further 16%—mirroring its guest-night setback. From 2022 onward, revenue recovery accelerated sharply everywhere: by 2023–2024, every country’s revenue exceeded both 2015 and 2019 levels, unlike most volume indicators.
ITS recovery slopes (b3) confirm strong, significant post-shock growth for accommodation revenue in Czechia (+19.21/year), Hungary (+43.98), and Poland (+35.88), with Slovakia (+25.48) only borderline significant (p = 0.050). For total revenue, the growth of Czechia (+20.16), Hungary (+46.95), and Poland (+30.74) was significant; Slovakia’s (+20.78) was not (Table 3). Hungary’s trajectory stands out, with the largest COVID-19-era shock combined with the steepest recovery, implying a compressed boom–bust–rebound cycle.
4.5. Employment in Tourism
Tourism employment, measured per 10,000 inhabitants, followed a substantially different and considerably more heterogeneous trajectory than either guest volume or revenue.
Full-time employment shows no uniform trend. Hungary alone declined or stagnated continuously, remaining below 2015 levels most years. Czechia and Slovakia fluctuated without clear direction, while Poland trended upward, exceeding its 2015 level by over 30% before the pandemic. The 2020 shock was mild in Hungary, Slovakia, and Poland (−5–6%) but severe in Czechia (−31%). ITS models reflect this heterogeneity: Czechia’s pre-COVID-19 trend was significant and negative (β1 = −1.398/year), and its level shift non-significant (β2 = −9.541, ns); Slovakia’s shift was significant and large (β2 = −34.919); Hungary’s and Poland’s models were unreliable overall (ns) (Table 3). By 2025, full-time employment exceeded 2015 levels everywhere except Hungary: Poland doubled, Slovakia rose 84%, Czechia rose 27%, and Hungary remained 2% below the 2015 level.
Part-time employment declined pre-pandemic in Czechia, Hungary, and Slovakia, but not Poland. The 2020 shock cut part-time employment 8–15% year-on-year (8–22% vs. 2015). Recovery was weaker than for revenue or volume: three countries continued to decline or stagnate afterward. By 2025, part-time employment remained below 2015 levels in Hungary (−9%), Slovakia (−20%), and Czechia (−24%), while only Poland gained (+10%). According to the ITS results, Czechia had a significant positive pre-COVID-19 trend (β1 = +0.890/year) and significant negative shock (β2 = −12.44), with a non-significant recovery slope (β3 = +1.884); Slovakia’s pre-COVID-19 trend and shock were non-significant, but its recovery slope was significant (β3 = +2.617)—its only significant β3 outside revenue; Poland’s coefficients were all non-significant; and Hungary’s model was unreliable overall (Table 3).
These results point to an employment paradox: tourism employment, especially part-time, recovered more slowly and unevenly than revenue or guest volume, even where the latter had surpassed pre-pandemic benchmarks by 2022–2024. This is more consistent with structural adjustment than with a data artefact—plausibly reflecting productivity gains, business consolidation, leaner staffing models, and post-pandemic labour shortages, though these mechanisms are not directly tested here—and is reinforced by full-time employment’s strong recovery in three of four countries even as part-time employment stagnated.
4.6. Transport and Mobility
Air passenger transport displayed the most volatile trajectory of any indicator examined in this study, combining the strongest pre-COVID-19 growth, the deepest pandemic-era collapse, and one of the strongest recoveries (Figure 4). Pre-pandemic growth (2015–2019) was substantial: Hungary +63%, Poland +60%, Czechia +48%, Slovakia +45%. ITS pre-COVID-19 trends confirm Poland grew fastest (β1 = +156,902/year), followed by Czechia (+55,723) and Hungary (+53,930); Slovakia’s trend (+8332) was non-significant (Table 3).
Figure 4.
Actual vs. counterfactual number of air transport passengers in the Visegrád countries between 2015 and 2023.
The 2020 collapse was the most severe shock of any indicator: passengers fell 76% (Hungary), 79% (Czechia), 82% (Slovakia), and 70% (Poland). In absolute terms, this was the largest shock recorded overall: Poland lost an estimated 5,550,784 passengers relative to counterfactual numbers, followed by Czechia (−2,351,253), Hungary (−2,016,313), and Slovakia (−378,167, the smallest, reflecting its modest base) (Table 3).
Recovery in 2021 was modest (+15–30%). It accelerated in 2022: Hungary and Poland surpassed their 2015 levels by 21–35%. Czechia rose 143% relative to 2021 but stayed 9% below 2015; Slovakia nearly tripled but still did not reach 2015 levels. By 2025, all four exceeded 2015 levels: Hungary (+92%), Poland (+116%), Slovakia (+67%), Czechia (+51%). ITS recovery slopes (β3) confirm strong, significant growth for Czechia (+51,680/year), Hungary (+54,066), and Poland (+189,711); Slovakia’s (+10,258) was non-significant (Table 3). All four countries show a consistent seasonal pattern, with Q3 as the annual peak and Q1 the trough, persisting through the pandemic and recovery.
The negative fitted values represent a mathematical artefact of the linear interrupted time series model, resulting from the combination of a pronounced negative level change (β2) and a relatively small positive recovery slope (β3). They should not be interpreted literally as negative passenger numbers but rather as reflecting passenger volumes that fell substantially below the projected pre-pandemic trend and approached zero. In reality, the observed air passenger traffic in 2020 remained close to zero and was constrained by the non-negative nature of the outcome variable.
Rail transport followed a smaller-scale version of this pattern. Pre-COVID-19 growth was modest: Hungary +2%, Czechia +10%, Poland +23%, Slovakia +34%. The 2020 shock (−30–40%) was roughly half the aviation collapse, and recovery was faster: all four countries regained 2015 rail levels by 2022, nearing their 2019 peaks by 2025. Slovakia again lagged, declining further in 2021 while others began recovering.
Road and bus transport data are less reliable, but show declines of 30–45% in 2020, comparable to rail, with substantive recovery only from 2022 onward—slower than rail’s.
4.7. Linear Mixed-Effects Model Analysis
A linear mixed-effects model was fitted for each of the nine tourism indicators at the pooled V4 level, with fixed effects for Time (pre-COVID-19 trend), COVID (level shift), TimeAfterCOVID (recovery slope), Country, and Country interactions. Full Type III statistics appear in Table 2.
The mixed-effects results confirm, with a high degree of statistical confidence, the three-phase pattern already established descriptively. The COVID effect was significant for all nine indicators (p < 0.01, and p < 0.001 for seven of nine), ranging from F = 9.96 (full-time employment) to F = 360.17 (international guest arrivals)—by far the largest, confirming international demand as the most severely disrupted segment of the system. Guest volume (F = 206.07) and accommodation revenue (F = 152.45) also showed substantial shocks, while air passenger transport (F = 88.67) and total tourism revenue (F = 88.97) showed comparable, moderately strong effects.
TimeAfterCOVID was significant (p < 0.05) for seven of nine indicators, confirming a genuine recovery phase. International guest arrivals produced the strongest recovery signal overall (F = 76.08), followed by accommodation revenue (F = 52.59) and total tourism revenue (F = 43.50). Employment again stood apart: EmploymentPart showed a comparatively weak recovery signal (F = 7.32, p = 0.038), and EmploymentFull’s pre-COVID-19 trend was clearly non-significant (F = 0.002, p = 0.965), with weaker overall model fit (R2 as low as 0.50)—consistent with the frequent non-significant employment coefficients in the ITS models.
Country × COVID and Country × TimeAfterCOVID interactions were significant for eight of the nine indicators; both terms were jointly significant for guest volume, international guest arrivals, and air passengers, confirming that shock magnitude and recovery speed differed systematically by country. The Country × COVID interaction was largest for international guest arrivals, reflecting the wide dispersion in relative losses (−74% to −92%). For domestic arrivals, accommodation revenue, and total tourism revenue, only the Country × TimeAfterCOVID term was significant; for guest nights and part-time employment this interaction was non-significant or borderline (F = 6.41, p = 0.114 and F = 3.72, p = 0.058, respectively). Full-time employment was the only indicator for which neither interaction term was significant.
Taken together, these results provide the statistical foundation for the country-specific analyses that follow. They establish, at a pooled and more conservative level of inference, that the COVID-19 shock was universally significant but highly heterogeneous in magnitude, most extreme in air travel and international demand; that a statistically distinct recovery phase is detectable for nearly all indicators, strongest for revenue and air transport and weakest for employment; and that the significant country interaction terms justify, and are subsequently unpacked by, the disaggregated ITS models.
4.8. Interrupted Time Series Analysis
4.8.1. Pre-COVID-19 Trends and COVID-19 Shocks (β1 and β2)
This section formalises the descriptive patterns reported above by refining the pooled mixed-effects results into country-specific estimates. The ITS models, summarised in Table 3, decompose each indicator into a linear pre-pandemic trend (β1), a discrete level shift coinciding with the onset of COVID-19 in 2020 (β2), and a change in the post-shock trend (β3).
Pre-COVID-19 trends were mostly positive and significant, confirming sustained growth. Exceptions cluster in two areas. International guest arrivals showed non-significant trends in Czechia (+565,713/year) and Slovakia (+163,491/year), despite significant domestic growth in both. Employment trends were often unreliable: Hungary’s and Poland’s full-time models did not converge; Slovakia’s negative trend (−3.371/year) was non-significant. Only Czechia yielded significant employment trends for both full-time (−1.398/year, contracting) and part-time (+0.890/year, growing) employment.
The COVID-19-era level shift (β2) was significant, large, and negative across nearly every indicator and country. The largest relative shocks occurred in international guest arrivals (−92% Czechia, −77% Hungary, −74% Poland) and revenue, where Hungary’s losses (−156.59 accommodation, −133.81 total) were the largest of any country. In absolute terms, the largest shock overall was air transport in Poland (−5.55 million passengers).
Employment again diverged: several shocks were non-significant despite visible declines—full-time employment in Czechia (b2 = −9.541, ns), part-time in Slovakia (−3.325, ns) and Poland (−3.625, ns)—while Hungary’s and Poland’s full-time models, and Hungary’s part-time model, were uninterpretable. Only Slovakia’s full-time shock (−34.919) and Czechia’s part-time shock (−12.44) reached significance.
4.8.2. Recovery Trajectories (β3)
The post-shock trend change (β3) tests whether recovery represented a distinct accelerated phase beyond the pre-COVID-19 growth rate. A clear pattern emerges: Czechia, Hungary, and Poland show significant, substantial positive recovery slopes across most guest-volume, guest-night, and revenue indicators, while Slovakia’s slope is non-significant in seven of nine core indicators (guests per 10,000 inhabitants, domestic arrivals, international arrivals, guests nights, total tourism revenue, full-time employment, air passengers)—only accommodation revenue (borderline, p = 0.050) and part-time employment reach significance.
This Slovak pattern is the study’s most consistent finding. For guest arrivals, Slovakia’s slope (+689/year) is positive but statistically flat, unlike Czechia (+1936), Hungary (+1488), and Poland (+940), which are all significant. Domestic arrivals show that only Poland was significant (+2,320,455/year); international arrivals show that Czechia (+1,671,886), Hungary (+999,043), and Poland (+1,152,285) were significant, while Slovakia was not. Total guest nights mirror this structure (Czechia +4.995 million/year, Hungary +3.267 million, Poland +6.882 million, all significant; Slovakia +0.551 million, ns).
Revenue is a partial exception: Slovakia’s accommodation-revenue slope (+25.48/year) is borderline significant (p = 0.050), though its total-revenue slope (+20.78) is not—suggesting revenue recovery in Slovakia, unlike volume, was close to detectable acceleration, plausibly reflecting price/cost inflation independent of visitor recovery.
Employment recovery slopes are the least robust category overall, consistent with EmploymentPart’s weak mixed-effects signal (F = 7.32, p = 0.038). Full-time slopes were non-significant for Czechia (−1.982) and Slovakia (+6.498); Hungary’s and Poland’s models were uninterpretable. Part-time slopes were non-significant for Czechia (+1.884) and Poland (−0.103), while Hungary’s was uninterpretable; Slovakia alone was significant (+2.617)—its only significant b3 in the entire study. Air transport follows the familiar pattern: Czechia (+51.680), Hungary (+54.066), and Poland (+189.711) were significant; Slovakia (+10.258) was not.
Overall, Czechia, Hungary, and Poland show a consistent pattern of significant pre-COVID-19 growth, significant shocks, and significant post-shock acceleration across guest volume, guest nights, and revenue. Slovakia is a structural outlier, showing little statistical evidence of a distinct recovery phase despite visible absolute recovery by 2022–2024.
4.9. Counterfactual Analysis and Recovery Projections
Building on the ITS coefficients, a counterfactual analysis estimated, for each indicator and country, the projected year in which actual values would return to the pre-COVID-19 counterfactual trend line—the trajectory each indicator would have followed in the absence of the pandemic, extrapolated forward from the pre-COVID-19 trend (β1) (Table 4).
Table 4.
Cross-indicator recovery summary.
For guest-volume indicators, projected recovery clusters in 2025–2027 for Czechia, Hungary, and Poland. Guests per 10,000 inhabitants is projected to converge at 2026.4 (Czechia), 2026.0 (Hungary), and 2025.4 (Poland); Slovakia cannot be projected (non-significant β3). International guest arrivals converge at 2025.7, 2025.3, and 2025.2 respectively, again with no Slovak projection. Total guest nights converge at 2026.0, 2026.1, and 2026.5. Domestic guest arrivals are weakest: only Poland’s slope is significant (2025.8); Czechia, Hungary, and Slovakia cannot be projected (non-significant β3).
Revenue converges much earlier, in several cases within the observation window itself. Accommodation revenue converges at 2024.3 (Czechia), 2022.6 (Hungary), 2022.6 (Poland), and 2023.7 (Slovakia, borderline). Total revenue converges even earlier: 2023.5 (Czechia), 2021.9 (Hungary), and 2022.1 (Poland); Slovakia cannot be projected (non-significant β3). Hungary’s convergence is earliest of all countries on both measures, consistent with its combination of largest shock and steepest recovery.
Employment projections are the least reliable: no country has a statistically valid recovery projection for either part-time employment (Czechia’s recovery slope and Slovakia’s level-shift are both non-significant; Hungary and Poland cannot be projected) or full-time employment (Slovakia’s recovery slope is non-significant; other country models are non-significant)—underscoring that employment did not follow a simple shock recovery dynamic.
Air transport recovery, once corrected for the quarterly indexing of the underlying Eurostat source series, converges at 2031.1 (Czechia), 2029.1 (Hungary), and 2027.1 (Poland), with no Slovak projection. These dates are broadly in line with, if somewhat later than, the other guest-volume indicators, consistent with air passenger traffic having suffered the largest absolute collapse of any indicator examined.
Cumulative losses over 2020–2023 further illustrate the revenue–volume divergence: revenue gaps closed comparatively quickly, while volume indicators accumulated substantial negative gaps. For example, Czechia’s cumulative 2020–2023 shortfall for Guests10000 is approximately −45,440, reflecting a large initial level shock only partially offset by subsequent recovery-slope gains. For Slovakia, non-significant recovery slopes across most volume indicators imply non-converging cumulative gaps, with no modelled basis for expecting closure within a realistic time horizon.
Projected recovery years were calculated as the intersection between the observed post-pandemic recovery trajectory and the extrapolated pre-pandemic counterfactual trend. Because annual data were analysed, decimal year values indicate the approximate timing of convergence within a given calendar year rather than specific months.
These recovery years should be interpreted as model-based projections rather than precise forecasts, as they rely on the assumption that the estimated post-pandemic recovery trend remains unchanged beyond the observation period.
4.10. Summary of Key Findings
First, all four countries followed a common three-phase trajectory, but shock depth, recovery pace, and convergence varied by country and indicator; Czechia and Poland generally exceeded 2019 guest-volume peaks by 2024, while Hungary and Slovakia did not.
Second, international demand fell roughly twice as steeply as domestic demand in 2020 (60–70% vs. 30–45%) and recovered more slowly; only Poland fully regained its 2019 international benchmark by 2024.
Third, revenue recovered faster than volume: by 2023–2024, revenue exceeded both 2015 and 2019 levels everywhere, even where guest arrivals had not returned to 2019 peaks. This revenue–volume divergence—the study’s most robust finding, confirmed by the strongest TimeAfterCOVID effects and earlier counterfactual convergence for revenue—likely reflects post-pandemic price and cost inflation.
Fourth, an employment paradox emerged: part-time employment in three of four countries remained below 2015 levels by 2025 even as revenue and volume surpassed pre-pandemic benchmarks, more plausibly explained by structural adjustment—productivity gains, business consolidation, and leaner staffing models, though these mechanisms are not directly tested here—than by incomplete recovery.
Fifth, air transport suffered the largest absolute shock (up to −5.55 million passengers in Poland) but also achieved one of the strongest recoveries, with three countries exceeding 2015 volumes by 51–116% by 2025.
Sixth, Slovakia was a consistent structural outlier, with non-significant β3 in seven of nine indicators, no reliable counterfactual convergence for most volume measures, and several cumulative gaps with no modelled basis for closure—showing that a shared regional shock can produce fundamentally different national recovery trajectories.
5. Discussion
Beyond describing the temporal pattern of the shock and the subsequent recovery, these findings can be situated within the broader theoretical literature on tourism resilience. Sharma et al. (2021) identify government response, technological innovation, and local/community belongingness as the principal levers available to destinations recovering from a systemic shock; the V4 evidence reported here maps most closely onto the first of these levers, with the timing and stringency of national restriction regimes, and the design of subsequent reopening sequences, emerging as first-order determinants of both shock depth and recovery speed. The persistently weak and non-significant recovery observed in Slovakia is, in turn, consistent with conservation-of-resources accounts of destination resilience (Prayag et al., 2024), in which the capacity to absorb and redeploy resources after a shock depends on the pre-existing resource base—here, the breadth of a country’s source-market portfolio and its fiscal capacity for targeted support. The following sections address the study’s four research questions in turn, in light of this framework.
5.1. Pre-COVID-19 Trends and the Immediate Impact of the Pandemic
Addressing the first research question—how tourism demand, revenues, employment, and transport changed before, during, and after the pandemic—the results confirm a clear three-phase pattern. Before the pandemic, all nine analysed indicators (Guests10000, DomesticGuest, InternationalGuest, GuestsnightsM, RevenueAccommodation, RevenueTotal, EmploymentPart, EmploymentFull, and AirPassenger) rose steadily through 2019 in every observed country, and the ITS models confirm this quantitatively with positive, mostly statistically significant, pre-COVID-19 trend coefficients (β1) across the region.
The onset of the pandemic produced an abrupt, and in relative terms unprecedented, level break (β2) in every indicator, confirmed as statistically significant by the mixed-effects models; significant country-interaction terms indicate that the magnitude of the shock varied meaningfully across the region. Air passenger traffic absorbed the largest shock in absolute terms (β2: Czechia −2.35 million, Hungary −2.02 million, Poland −5.55 million, Slovakia −378,000), while international guest arrivals suffered the most severe relative contraction (approximately 92% in Czechia, 77% in Hungary, and 74% in Poland), and Guests10000 registered a significant negative shock in all four countries. A clear divergence between domestic and international guest patterns emerged, attributable primarily to border closures rather than a uniform collapse in demand; even peak 2020 guest-night values remained far below pre-pandemic levels for both segments.
The Hungarian case illustrates how policy timing shaped shock depth. The government’s decree of 10 November 2020—prohibiting on-site restaurant service, barring hotels from accepting tourists, and banning public events—deepened the decline in domestic turnover and guest nights during this period, a pattern echoed across the European Union under comparable restrictions at the time. This study analysed commercial accommodation data only, since business-purpose accommodation data were not available; analysing the November-decree period specifically for business travel could be informative in future work. The accommodation and hospitality sector was the hardest hit in 2020, with performance falling by nearly 60% relative to the previous year, compounded by a broader macroeconomic contraction (Hungary’s GDP fell 4.7% in the third quarter of 2020, year-on-year).
5.2. Speed and Pattern of Recovery
Addressing the second research question—the pace of recovery—results diverge markedly between revenue and volume indicators, and between domestic and international demand. The ITS recovery slopes (β3) show that revenue indicators recovered fastest: RevenueTotal exhibited the strongest post-shock trajectories, with Hungary (β3 = +46.95) and Poland (β3 = +30.74) showing large, statistically significant slopes, while RevenueAccommodation followed a similar pattern (among significant countries, Hungary was fastest with β3 = +43.98, and Czechia was slowest with β3 = +19.21). The counterfactual analysis translates these slopes into concrete timelines: RevenueTotal crossed its pre-COVID-19 counterfactual trajectory by 2021.9 in Hungary, 2022.1 in Poland, and 2023.5 in Czechia.
Guest-volume indicators recovered considerably more slowly, with counterfactual crossing points estimated at 2025–2027 for Czechia, Hungary, and Poland, and air passenger traffic later still (roughly 2027–2031)—consistent with air travel having suffered the largest absolute collapse of any indicator. This gap between revenue and volume recovery is itself informative: it suggests that turnover recovered ahead of visitor numbers, implying higher average spending per guest during the recovery phase rather than a full rebound in visitation, plausibly reflecting price adjustments or a shift toward higher-value travel segments, though these mechanisms are not directly tested here. Domestic tourism proved substantially more resilient than international tourism throughout the recovery period, partially offsetting the loss of international demand; this is consistent with the non-significant InternationalGuest recovery slope estimated for Slovakia, compared with the general resilience of domestic indicators elsewhere in the region.
This recovery pathway echoes, but does not replicate, the region’s experience following the 2008–2009 global financial crisis, when Hungarian tourism was affected only gradually and hotels had returned to solid results within three years (G. Tóth & Dávid, 2010; Magyar Turizmus Zrt, 2013). The COVID-19 shock instead struck immediately, the downturn persisted into 2021, and although growth resumed from 2022 onward, most indicators had still not returned to pre-pandemic (2019) levels by 2024–2025—a markedly slower and more protracted recovery than after the 2008 crisis.
5.3. Cross-Country Heterogeneity: Strongest and Weakest Recovery
Addressing the third research question, the results reveal a clear cross-country gradient in both shock depth and recovery pace. Poland experienced the largest absolute losses across several indicators—consistent with its position as the largest V4 economy and tourism market—yet also displayed the fastest and most robust recovery, with statistically significant β3 recovery slopes across most indicators, including RevenueTotal (β3 = +30.74).
Hungary demonstrated the strongest revenue-side recovery in the region, with its RevenueTotal counterfactual crossing (2021.9) earliest among all four countries and its RevenueAccommodation recovery slope (β3 = +43.98) exceeding that of the other three countries—a notable finding given the severity of the initial shock associated with the November 2020 decree (Section 5.1), suggesting that the subsequent rapid, structured reopening sequence contributed meaningfully to the turnaround. Czechia occupies an intermediate position, with significant recovery slopes in most volume indicators but a later projected RevenueTotal crossing point (2023.5) and a comparatively modest RevenueAccommodation recovery slope (β3 = +19.21).
Slovakia consistently emerges as the weakest performer: across the nine indicators, seven showed non-significant β3 recovery slopes, including InternationalGuest, Guests10000, GuestsnightsM, and RevenueTotal, precluding meaningful counterfactual projections for most Slovak indicators—a pattern plausibly linked to a narrower base of source markets and greater dependence on a small number of international visitor segments (Section 5.4).
Employment indicators followed a distinct pattern that sets them apart from demand- and revenue-based measures: for EmploymentFull, the COVID-19 shock term (β2) was not significant for Czechia, and the entire ITS model was non-significant for both Hungary and Poland; similarly, the EmploymentPart model was non-significant overall for Hungary, and neither the shock nor the recovery term was significant for Poland. As discussed in Section 5.4, these null results are best interpreted as evidence of structural resilience in labour markets rather than as unreliable data.
5.4. Sectoral Resilience and Influencing Factors
Addressing the fourth research question, several interacting factors help explain the region’s heterogeneous resilience. First, the balance between domestic and international tourism functioned as a key resilience mechanism: countries and indicators more reliant on domestic demand recovered faster, since domestic travel was less exposed to border closures and could partially substitute for lost international visitation. This resilience-enhancing role should, however, be interpreted with some caution: consistent with the OECD’s (2022) assessment that domestic tourism sustained the sector once mobility restrictions eased but did not compensate for the loss of international visitation in destinations with a substantial inbound base, the present results show that revenue indicators—more sensitive to spending intensity than to visitor counts—recovered markedly faster than volume indicators, and international guest arrivals in several V4 countries had still not returned to pre-pandemic levels by 2024–2025. Domestic demand therefore appears to have cushioned, rather than eliminated, the shock, with its benefits concentrated in revenue rather than volume recovery.
Second, the structure of each country’s tourism market—particularly its degree of dependence on a concentrated set of source markets—helps explain much of the cross-country variation documented in Section 5.3; Slovakia’s persistently non-significant recovery slopes are consistent with a narrower, less diversified visitor base offering fewer alternative demand channels during the crisis. Third, the speed and stringency of government intervention shaped both shock depth and recovery timing: as noted in Section 5.1, Hungary’s severe but time-limited restriction regime, followed by a structured six-phase reopening from 27 March 2021, corresponds to a sharp shock followed by a comparatively fast revenue rebound—a sharp-shock, fast-release pattern rather than a prolonged, incremental easing. Fourth, air transport emerged as the most volatile and slowest-normalising channel (Section 5.2), consistent with the international nature of aviation demand, the persistence of cross-border restrictions and traveller caution, and the capital-intensive, slow-to-reconfigure nature of airline capacity.
Fifth, employment proved the most structurally stable of the nine indicators, but this stability warrants a qualification that aggregate, country-level data alone cannot resolve. Evidence from other European tourism labour markets indicates that job-retention and furlough schemes, while limiting headline job losses during the acute phase of the crisis, imposed considerable financial and psychological costs on affected workers and did not prevent a subsequent wave of voluntary departures from the sector once demand recovered (Kimbu et al., 2023); consistent with this, the OECD (2024) attributes much of the labour and skills shortage that emerged across European tourism markets in 2022–2023 to workers who, having been furloughed or exposed to prolonged uncertainty, chose not to return to tourism employment once activity picked up. The non-significant COVID-19 shock and recovery terms estimated here for EmploymentFull and EmploymentPart in several V4 countries should therefore be read as evidence of short-run headcount buffering rather than as an indication that the sector’s labour market was unaffected by the pandemic in any deeper sense.
Underlying all of these mechanisms is the changing role of safety in tourist decision-making. As Rácz (2019) and Csapó and Törőcsik (2019, 2020) established, safety has long been a central concern for tourists, and the pandemic intensified and reinforced this need, now expressed specifically through demand for hygiene and physical distancing. Even after the immediate containment of the virus, sustaining a high-quality guest experience while managing reduced guest contact remains a central operational challenge for the sector, reinforcing the case—developed further in Section 5.5—for prioritising the development and promotion of domestic tourism.
5.5. Policy Implications
These findings carry several practical implications for tourism policymakers in the V4 region. First, Slovakia’s persistently weak and statistically non-significant recovery trajectory highlights the risks of dependence on a narrow set of international source markets, and points to diversification of visitor origin markets as a priority for long-term resilience. Second, the demonstrated resilience of domestic tourism relative to international tourism supports the case for domestic tourism promotion as a buffer strategy during future shocks, consistent with the priority the authors place on strengthening domestic demand. Third, the faster recovery of revenue relative to volume indicators suggests that revenue-oriented support schemes—rather than measures targeting visitor counts alone—may more accurately capture, and more effectively reinforce, the sector’s underlying economic recovery. Fourth, the structural stability of employment indicators, particularly the non-significant shock and recovery terms observed for EmploymentFull and EmploymentPart in Hungary and Poland, implies that broad employment support may be less necessary going forward than targeted assistance for the specific sub-segments and firms that remain exposed to demand volatility. Finally, policymakers and researchers alike should evaluate recovery against the pre-COVID-19 trend line—not merely the pre-COVID-19 level—since several indicators that appear to have recovered relative to 2019 values may still lag substantially behind where they would have stood in the absence of the pandemic, risking a premature declaration of full recovery.
5.6. Limitations
Several limitations of this study should be acknowledged. The use of annual data restricts the ability to capture within-year seasonal dynamics and the precise timing of policy-driven fluctuations, such as the effects of the November 2020 Hungarian decree or the phased 2021 reopening. The linear specification of the ITS model, while suitable for most indicators, assumes a constant post-shock recovery slope and may not fully capture non-linear rebound dynamics such as those in air passenger traffic; a non-linear or piecewise recovery model could offer a useful robustness check. The non-significance of the full ITS model for EmploymentFull and EmploymentPart in Hungary and Poland limits the strength of conclusions that can be drawn about employment dynamics in those countries, and these results should be interpreted as suggestive of structural resilience rather than definitive evidence. Finally, the analysis was restricted to commercial accommodation statistics; business-purpose accommodation data were excluded owing to limited availability, meaning that the full impact of measures such as the November 2020 decree—which specifically curtailed tourist but not business travel—could not be fully assessed and represents a promising direction for future research.
Two further limitations follow from the country-level design adopted here. First, the analysis treats each V4 country as an independent unit, whereas spatial-econometric evidence on European tourism suggests that COVID-19’s impact propagated through geographically clustered demand, mobility, and epidemiological linkages across borders (Saputra, 2023); the cross-country heterogeneity documented in Section 5.3 may therefore partly reflect each country’s position within this wider web of regional interdependence, a dimension the present ITS and mixed-effects specifications cannot capture directly. Second, the resilience mechanisms proposed in Section 5.4 are inferred from aggregate national indicators rather than tested at the level of firms or individual workers; the broader tourism-resilience literature identifies leadership behaviour, technological adaptation, and workforce well-being as proximate drivers of the aggregate patterns observed here (Prayag et al., 2024; Sharma et al., 2021), and future work combining the present macro-level approach with firm-level or survey-based evidence would help establish whether these mechanisms operate as hypothesised at the micro level.
6. Conclusions
The aim of the present study was to examine the impact of the COVID-19 pandemic on tourism in the Visegrád countries and to assess the extent to which the sector recovered during the post-pandemic period. Combining an interrupted time series (ITS) framework, mixed-effects modelling, and counterfactual projection, the analysis quantified the pandemic’s effects through explicit estimates of pre-pandemic trends, shock magnitude, and recovery speed across nine tourism indicators in four countries. The results show that the pandemic caused a substantial and statistically robust decline in every indicator examined, while the pace and extent of recovery differed considerably among countries and indicator types.
Tourism revenues recovered considerably faster than tourism demand: counterfactual crossing points for total revenue were reached by 2021.9 in Hungary, 2022.1 in Poland, and 2023.5 in Czechia, whereas guest-volume indicators are not projected to fully recover until 2025–2027, implying higher average spending per guest during the recovery phase rather than a full rebound in visitation. International tourism proved far more exposed to the shock than domestic tourism, with international guest arrivals falling by 92% in Czechia, 77% in Hungary, and 74% in Poland, and domestic demand cushioning—though not eliminating—the overall shock. Across countries, Poland combined the largest absolute losses with the fastest recovery, Hungary recovered revenue fastest of all four countries, and Slovakia stands out as the persistent outlier, with non-significant recovery slopes in seven of nine indicators. Employment revealed a structural resilience paradox: full-time employment recovery was non-significant in Hungary and Poland even as revenues rebounded strongly, most plausibly reflecting job-retention and furlough schemes that buffered headcount from short-term demand fluctuations rather than an absence of pandemic impact on the sector’s labour market. Taken together, these findings confirm that COVID-19 caused an unprecedented, statistically verified disruption to Visegrád tourism, followed by resilience that was real but incomplete and unevenly distributed across countries and indicators.
This study is limited by its reliance on national aggregate indicators, which may mask sub-regional and firm-level heterogeneity, and by the linear specification of the counterfactual model, which may over- or under-state recovery timing for indicators with non-linear rebound patterns such as air passenger traffic. Future research should employ non-linear or saturation-based counterfactual models, incorporate sub-national and enterprise-level data, and investigate the employment paradox through qualitative labour-market analysis; methodologically, the results also show that tourism recovery cannot be assessed from visitor-based indicators alone, and that revenue, employment, and transport data must be examined jointly to obtain an accurate picture of post-pandemic recovery.
7. Databases
Eurostat:
- https://ec.europa.eu/eurostat/databrowser/view/tour_occ_arnat__custom_21193330/default/table (accessed on 27 April 2026)
- https://ec.europa.eu/eurostat/databrowser/view/tour_occ_ninat__custom_21193538/default/table (accessed on 27 April 2026)
- https://ec.europa.eu/eurostat/databrowser/view/sts_setu_a__custom_21195591/default/table (accessed on 27 April 2026)
- https://ec.europa.eu/eurostat/databrowser/view/tour_lfs6r2__custom_21192636/default/table (accessed on 27 April 2026)
- https://ec.europa.eu/eurostat/databrowser/view/avia_paoc__custom_21252237/default/table (accessed on 30 April 2026)
- https://ec.europa.eu/eurostat/databrowser/view/rail_pa_total__custom_21252779/default/table (accessed on 30 April 2026)
- https://ec.europa.eu/eurostat/databrowser/view/road_pa_mov__custom_21253742/default/table (accessed on 30 April 2026)
Hungarian Central Statistical Office (HCSO):
- https://www.ksh.hu/stadat_files/sza/en/sza0016.html (accessed on 30 April 2026)
Author Contributions
Conceptualization, K.P. and I.B.; methodology, K.P.; validation, H.P., T.C.; formal analysis, K.P.; investigation, K.P., H.P., T.C.; data curation, K.P.; writing—original draft preparation, K.P.; writing—review and editing, H.P., I.B.; visualisation, K.P.; supervision, I.B. All authors have read and agreed to the published version of the manuscript.
Funding
This research received no external funding.
Institutional Review Board Statement
Not applicable.
Informed Consent Statement
Not applicable.
Data Availability Statement
The original data presented in this study are openly available at the Hungarian Central Statistical Office and at Eurostat.
Acknowledgments
During the preparation of this manuscript, the authors used Perplexity AI (Perplexity Computer) to assist with language editing, improving the clarity of scientific writing, and refining the presentation of the results. The authors critically reviewed, revised, and validated all AI-generated content and take full responsibility for the content of this publication.
Conflicts of Interest
The authors declare no conflicts of interest.
Abbreviation
The following abbreviation is used in this manuscript:
| HCSO | Hungarian Central Statistical Office |
References
- Ahmad, A., Jamaludin, A., Zuraimi, N. S. M., & Valeri, M. (2020). Visit intention and destination image in post-COVID-19 crisis recovery. Current Issues in Tourism, 24(17), 2392–2397. [Google Scholar] [CrossRef] [Scilit]
- Brida, J. G., Cortes-Jimenez, I., & Pulina, M. (2014). Has the tourism-led growth hypothesis been validated? A literature review. Current Issues in Tourism, 19(5), 394–430. [Google Scholar] [CrossRef] [Scilit]
- Chemli, S., Toanoglou, M., & Valeri, M. (2020). The impact of COVID-19 media coverage on tourist’s awareness for future travelling. Current Issues in Tourism, 25(2), 179–186. [Google Scholar] [CrossRef] [Scilit]
- Christidis, P., & Christodoulou, A. (2020). The predictive capacity of air travel patterns during the global spread of the COVID-19 pandemic: Risk, uncertainty and randomness. International Journal of Environmental Research and Public Health, 17(10), 3356. [Google Scholar] [CrossRef] [Scilit] [PubMed]
- Csapó, J., & Törőcsik, M. (2019). Turizmus és biztonság: A magyar lakosság utazási szokásaihoz köthető, biztonsággal kapcsolatos attitűdök vizsgálata. Turizmus Bulletin, 19(3), 13–20. [Google Scholar] [CrossRef] [Scilit]
- Csapó, J., & Törőcsik, M. (2020). A turizmus jövője, a nemzetközi és hazai turizmus legújabb trendjeinek elemzése. Pécsi Tudományegyetem. [Google Scholar]
- Dániel, Z. A., Molnárné, B. K., & Molnár, T. (2021). Koronavírus-járvány a V4-orszgokban—Társadalmi, gazdasági hatások, regionális összefüggések, kormányzati beavatkozások. Területi Statisztika, 61(5), 555–576. [Google Scholar] [CrossRef] [Scilit]
- Demertzis, M., Sapir, A., Tagliapietra, S., & Wolff, G. (2020). An effective economic response to the coronavirus in Europe. Policy Contribution. Available online: https://www.bruegel.org/2020/03/economic-response-coronavirus/ (accessed on 6 August 2025).
- Felkai, P. (2021). Hogyan utazzunk a COVID-járvány után? Turizmus Bulletin, 21(1), 44–49. [Google Scholar] [CrossRef] [Scilit]
- Fotiadis, A., Polyzos, S., & Huan, T. C. T. (2021). The good, the bad and the ugly on COVID-19 tourism recovery. Annals of Tourism Research, 87, 103117. [Google Scholar] [CrossRef] [Scilit] [PubMed]
- Gössling, S., Scott, D., & Hall, C. M. (2021). Pandemics, tourism and global change: A rapid assessment of COVID-19. Journal of Sustainable Tourism, 29(1), 1–20. [Google Scholar] [CrossRef] [Scilit]
- Gudkov, A. (2024). Does the tourism industry help to fight COVID-19? Journal of Policy Research in Tourism, Leisure and Events, 16(1), 111–116. [Google Scholar] [CrossRef] [Scilit]
- Gyuricza, L. (2009). A turizmus nemzetközi földrajza. Dialóg Campus. [Google Scholar]
- Helhel, Y. (2026). When does leverage become dangerous? Threshold effects and post-COVID financial fragility of Turkish tourism firms. Tourism and Hospitality, 7(5), 128. [Google Scholar] [CrossRef] [Scilit]
- Keller, K., & Tóth-Kaszás, N. (2020). A koronavírus-járvány hatásai a hazai turisztikai szolgáltatók körében. In L. Kovács (Ed.), Globális kihívás—Lokális válaszok (pp. 51–64). Savaria University Press. [Google Scholar]
- Khalid, U., Okafor, L. E., & Burzynska, K. (2021). Does the size of the tourism sector influence the economic policy response to the COVID-19 pandemic? Current Issues in Tourism, 24(19), 2801–2820. [Google Scholar] [CrossRef] [Scilit]
- Khan, A., Bibi, S., Lorenzo, A., Lyu, J., & Babar, Z. U. (2020). Tourism and development in developing economies: A policy implication perspective. Sustainability, 12(4), 1618. [Google Scholar] [CrossRef] [Scilit]
- Kimbu, A. N., Adam, I., Dayour, F., & de Jong, A. (2023). COVID-19-induced redundancy and socio-psychological well-being of tourism employees: Implications for organizational recovery in a resource-scarce context. Journal of Travel Research, 62(1), 3–19. [Google Scholar] [CrossRef] [Scilit] [PubMed]
- Konrad-Adenauer-Stiftung. (2022). A visegrádi négyek a koronavírus után. Via Wayback Machine Archive. [Google Scholar]
- Kovalcsik, T., Boros, L., & Pál, V. (2021). A COVID-19-járvány első két hullámának területisége. Közép-Európában Területi Statisztika, 61(3), 263–290. [Google Scholar] [CrossRef] [Scilit]
- Kovács, Á., & Zsigmond, T. (2020). A COVID-19 világjárvány hatásai a V4 országainak gazdaságára. In E. Korcsmáros (Ed.), 12th international conference of J. Selye university. economics section. Conference proceedings (pp. 259–272). J. Selye University. [Google Scholar] [CrossRef] [Scilit]
- Kovács, L., Keller, K., Tóth-Kaszás, N., & Szőke, V. (2021). A COVID-19-járvány hatása egyes turisztikai szolgáltatók működésére. TVT Turisztikai és Vidékfejlesztési Tanulmányok, 6(2), 6–24. [Google Scholar] [CrossRef] [Scilit]
- Kovács, S. (2020). Települési önkormányzatokat érintő bevételkiesések a járványhelyzetben. Tér És Társadalom, 34(2), 189–194. [Google Scholar] [CrossRef] [Scilit]
- Kulcsár, N., & Grotte, J. (2018). Mit várunk a szállodáktól? Turizmus Bulletin, 17(3), 4–14. [Google Scholar] [CrossRef] [Scilit]
- Magyar Turizmus Zrt. (2013). Utazások a válság után—Az európai turizmus alakulása 2008 és 2013 között. Turizmus Bulletin, 15(2), 53–57. [Google Scholar]
- Michalkó, G. (2007). A turizmuselmélet alapjai. Kodolányi János Főiskola. [Google Scholar]
- Miczek, G. (1998). Idegenforgalmi földrajz. KJK-KERSZÖV. [Google Scholar]
- Neumanné Virág, I., & Fehérvölgyi, B. (2021). A COVID-19 hatása a turizmusra és a klímaváltozásra. In N. Mezőfi, K. Németh, E. Péter, & K. Püspök (Eds.), V. Turizmus és biztonság nemzetközi tudományos konferencia tanulmánykötet (pp. 205–220). Pannon Egyetem. [Google Scholar]
- Nod, G., Mókusné, P. A., & Aubert, A. (2021). Kispadra ültetett desztinációmenedzsment a pandémia félidejében(?). Turizmus Bulletin, 21(2), 43–54. [Google Scholar] [CrossRef] [Scilit]
- Ocheni, S. I., Ogaboh Agba, A. M., Agba, M. S., & Eteng, F. O. (2020). COVID-19 and the tourism industry: Critical overview, lessons and policy options. Academic Journal of Interdisciplinary Studies, 9(6), 114–129. [Google Scholar] [CrossRef] [Scilit]
- OECD. (2022). Building resilience in the tourism ecosystem. In OECD tourism trends and policies 2022. OECD Publishing. [Google Scholar] [CrossRef] [Scilit]
- OECD. (2024). Strengthening the tourism workforce. In OECD tourism trends and policies 2024. OECD Publishing. [Google Scholar] [CrossRef] [Scilit]
- Papadam, A., Gavriilidis, G., & Metaxas, T. (2026). Pandemics and tourism: Empirical evidence from Greek hospitality industry during the COVID-19 period. Tourism and Hospitality, 7(5), 121. [Google Scholar] [CrossRef] [Scilit]
- Prayag, G., Muskat, B., & Dassanayake, C. (2024). Leading for resilience: Fostering employee and organizational resilience in tourism firms. Journal of Travel Research, 63(3), 663–681. [Google Scholar] [CrossRef] [Scilit]
- Rácz, A. (2019). Magyarország országképe és a turizmusbiztonság. Turizmus Bulletin, 19(4), 41–48. [Google Scholar] [CrossRef] [Scilit]
- Saputra, P. M. A. (2023). COVID-19 and tourism industry: An investigation of spatial dependence in Europe. Cogent Social Sciences, 9(1), 2282413. [Google Scholar] [CrossRef] [Scilit]
- Sevcik, M., Koten, M., & Lubor, S. (2020, June 23–24). Failure of European Union institutions in resolving coronavirus crisis and in subsequent redistribution of funds. 13th Economics & Finance Virtual Conference, Prague, Czech Republic. [Google Scholar] [CrossRef] [Scilit]
- Sharma, G. D., Thomas, A., & Paul, J. (2021). Reviving tourism industry post-COVID-19: A resilience-based framework. Tourism Management Perspectives, 37, 100786. [Google Scholar] [CrossRef] [Scilit] [PubMed]
- Sikos, T. T., Papp, V., & Kovács, A. (2021). A hazai vásárlói magatartás változása a COVID-19-járvány első hullámában. Területi Statisztika, 61(2), 135–152. [Google Scholar] [CrossRef] [Scilit]
- Stabler, M. J., Papatheodorou, A., & Sinclair, M. T. (2010). The economics of tourism (2nd ed.). Routledge. [Google Scholar] [CrossRef] [Scilit]
- Tandrayen-Ragoobur, V., Tengur, N. D., & Fauzel, S. (2024). COVID-19 and Mauritius’ tourism industry: An island perspective. Journal of Policy Research in Tourism, Leisure and Events, 16(4), 768–784. [Google Scholar] [CrossRef] [Scilit]
- Tóth, G., & Dávid, L. (2010). A gazdasági-pénzügyi válság hatása Észak-Magyarország turizmusára. Turizmus Bulletin, 14(1–2), 60–63. [Google Scholar]
- Tóth, I., & Hudácskó, S. (2020). A koronavírus-járvány társadalmi hatásai a közvéleménykutatások tükrében. In T. Kolosi, I. Szelényi, & I. Tóth (Eds.), Társadalmi riport (pp. 553–572). Tárki. [Google Scholar]
- Tretheway, M. W., & Markhvida, K. (2014). The aviation value chain: Economic returns and policy issues. Journal of Air Transport Management, 41, 3–16. [Google Scholar] [CrossRef] [Scilit]
- Wardman, J., & Lofstedt, R. (2020). COVID-19: Confronting a new world risk. Journal of Risk Research, 23(7–8), 833–837. [Google Scholar] [CrossRef] [Scilit]
- Zenker, S., & Kock, F. (2020). The coronavirus pandemic—A critical discussion of a tourism research agenda. Tourism Management, 81, 104164. [Google Scholar] [CrossRef] [Scilit] [PubMed]
- Zentweld, E. (2026). Visiting friends and relatives (VFR) travel in a post-COVID world. Tourism and Hospitality, 7(4), 116. [Google Scholar] [CrossRef] [Scilit]
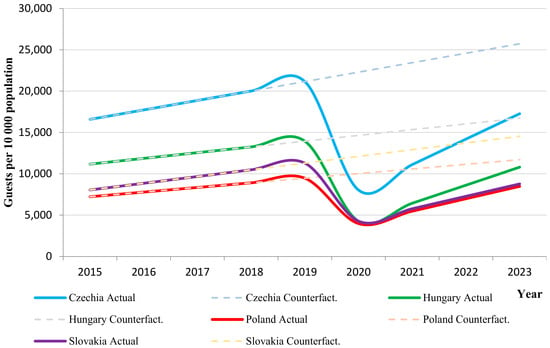
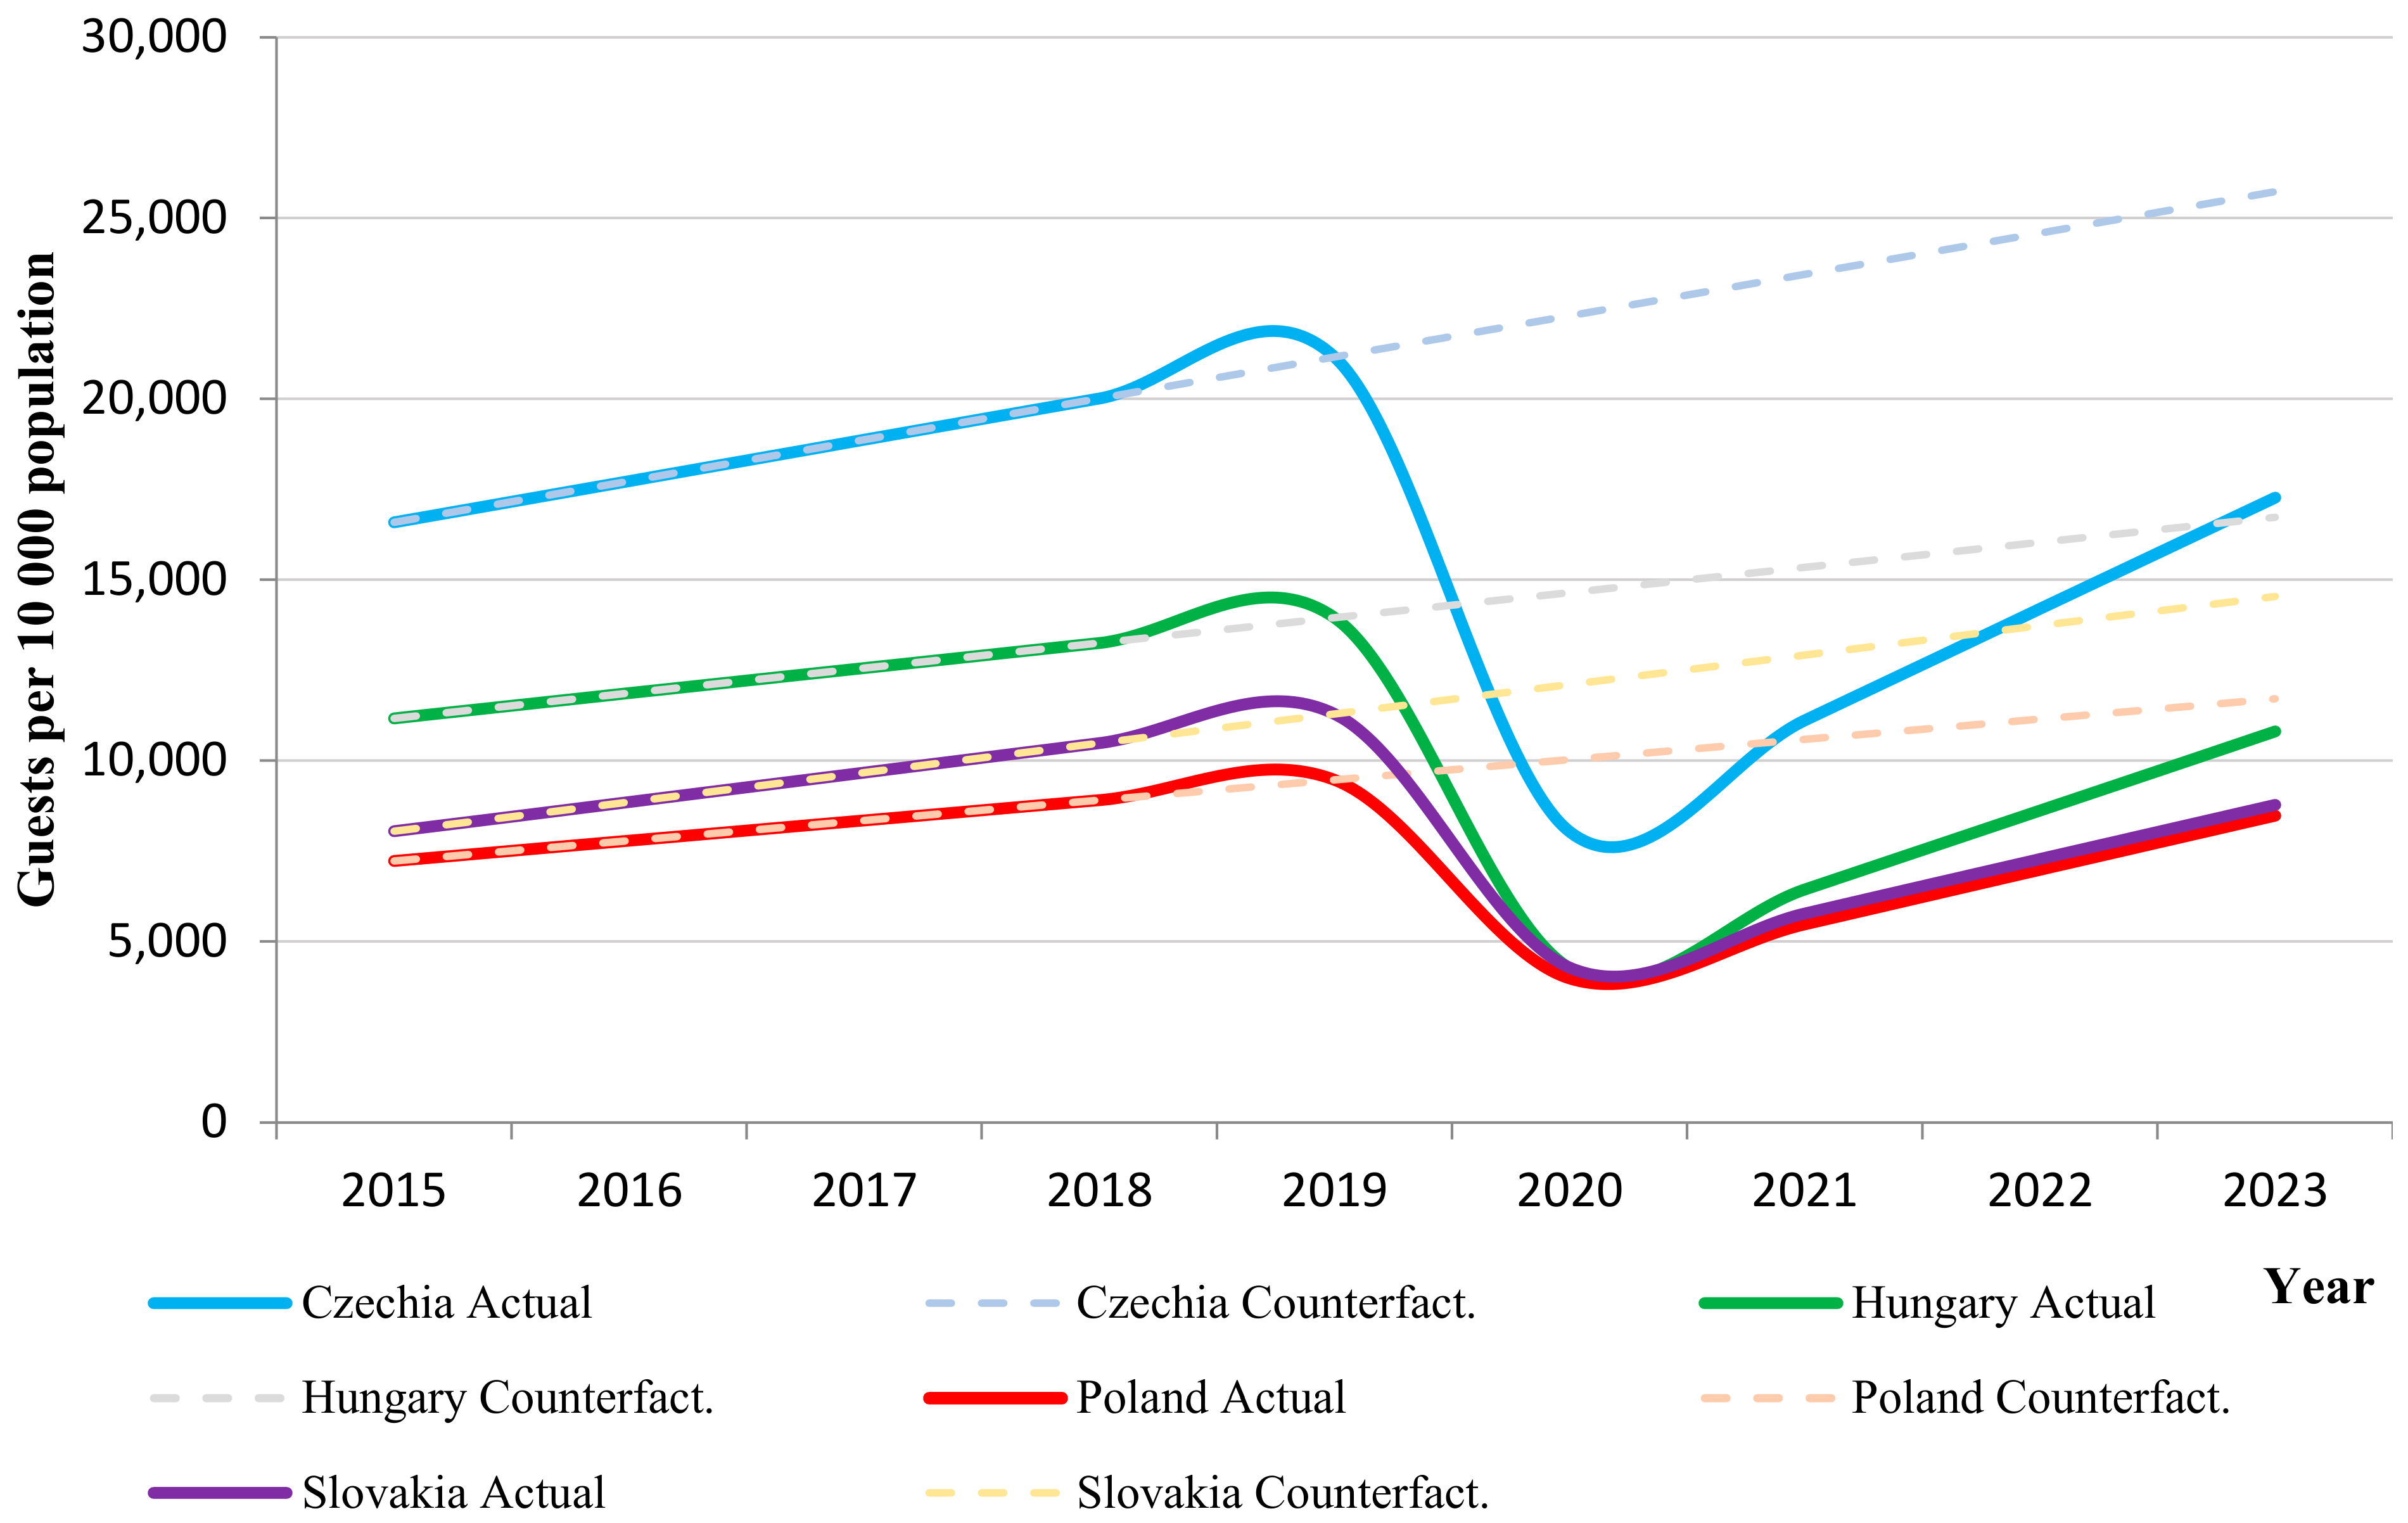
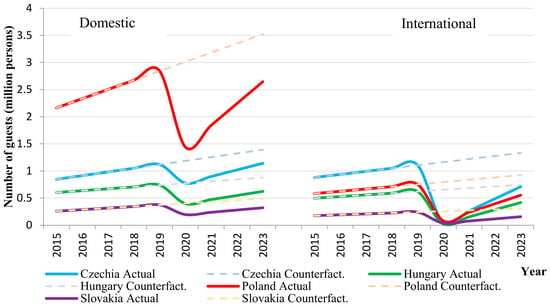
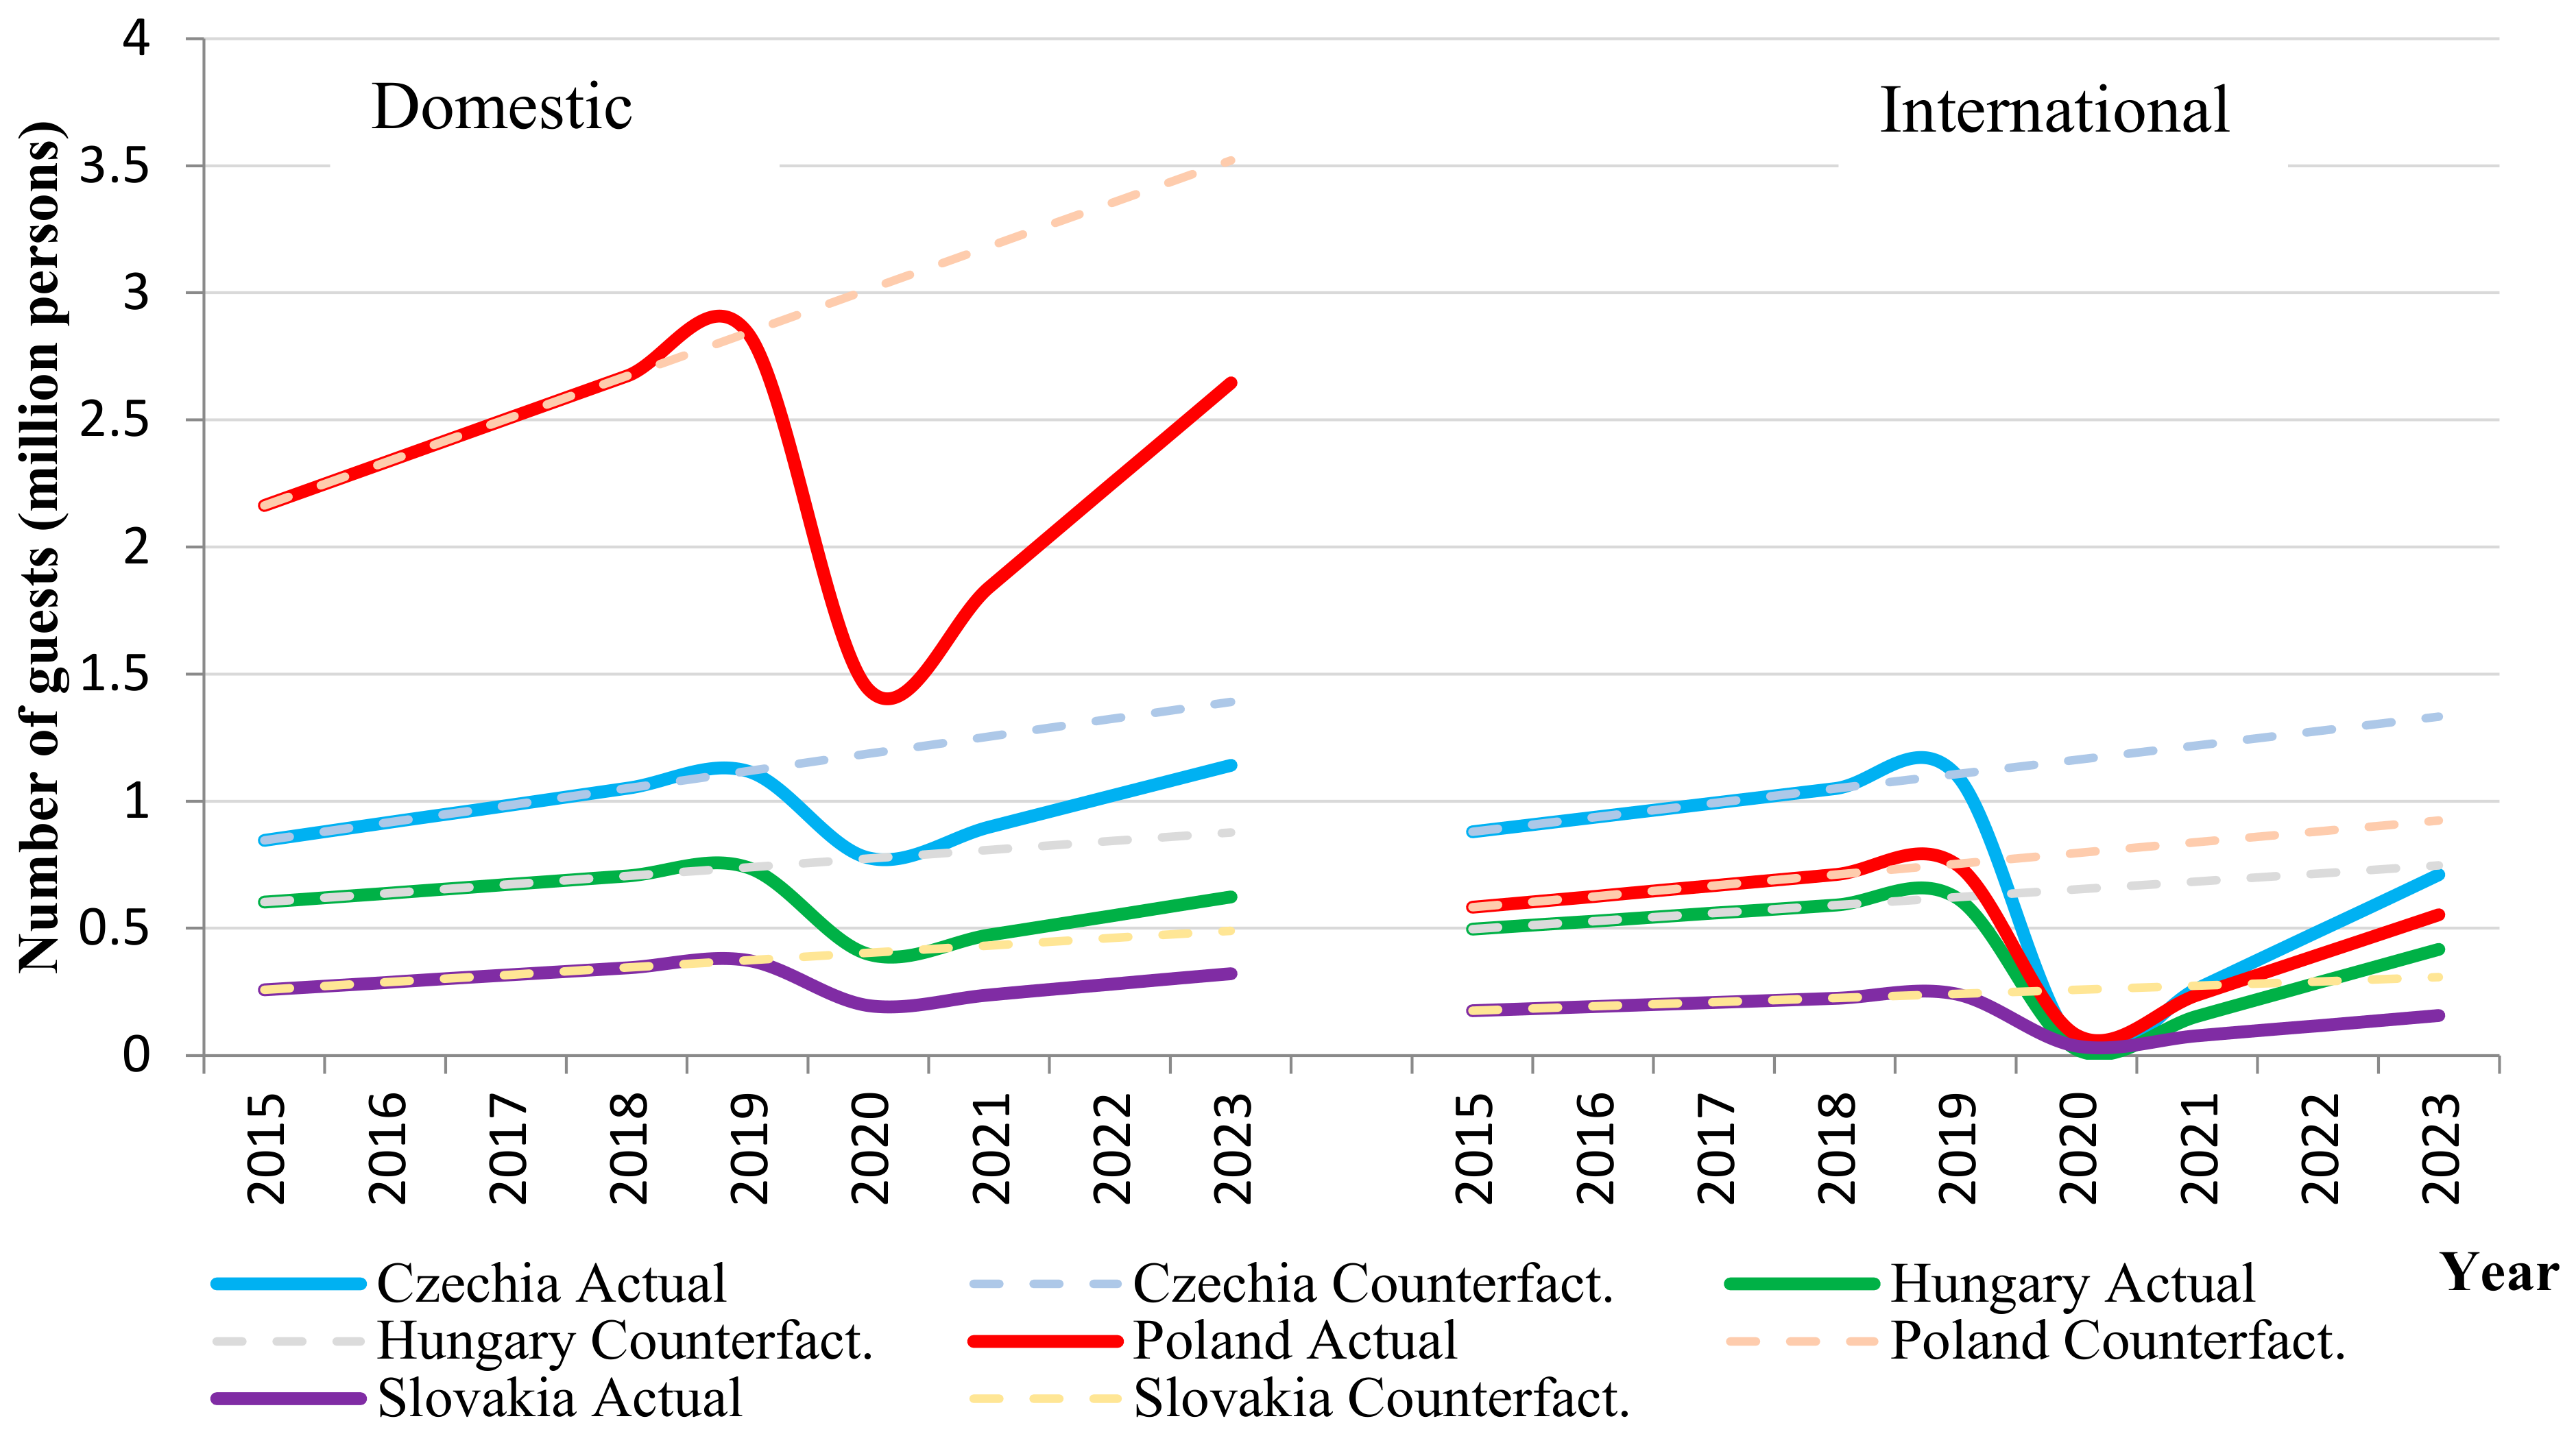
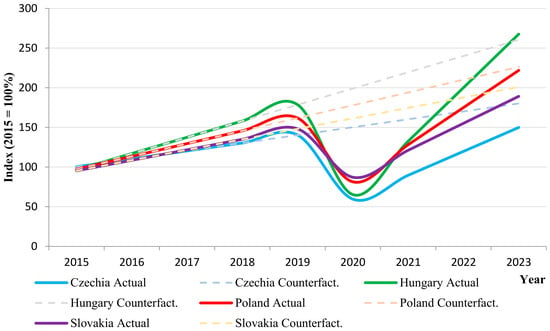
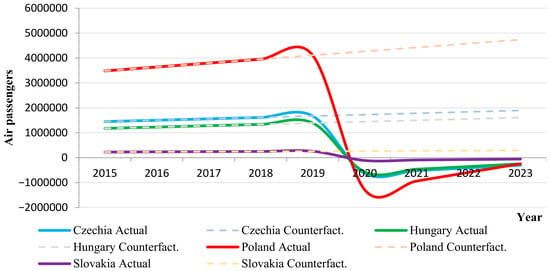

Disclaimer/Publisher’s Note: The statements, opinions and data contained in all publications are solely those of the individual author(s) and contributor(s) and not of MDPI and/or the editor(s). MDPI and/or the editor(s) disclaim responsibility for any injury to people or property resulting from any ideas, methods, instructions or products referred to in the content. |
© 2026 by the authors. Licensee MDPI, Basel, Switzerland. This article is an open access article distributed under the terms and conditions of the Creative Commons Attribution (CC BY) license.