


Abstract
Urbanization and climate change are exerting increasing pressure on biodiversity, particularly in rapidly growing cities of the southwestern United States. While urban development is generally associated with reduced species richness, responses among insect pollinators, including butterflies, are highly variable and shaped by habitat availability, resource distribution, and landscape structure. Concurrently, increasing aridity and extreme heat events linked to climate change pose additional risks to ectothermic organisms such as butterflies. Urban green spaces can function as hotspots, yet the role of zoological gardens in supporting local pollinator biodiversity remains poorly understood. Here, we use community science data from eButterfly and iNaturalist to compare butterfly species richness and diversity within zoos to those of their surrounding urban landscapes across five southwestern USA cities. Contrary to previous work comparing botanical gardens, we found that zoos consistently exhibited low to moderate species richness and diversity relative to comparable areas within their respective cities, falling well below our predetermined hotspot thresholds. We conclude that while zoological gardens, unlike botanical gardens, may not currently function as localized biodiversity hotspots within their urban matrix in these arid environments, they support functional urban pollinator communities. Thus, the current and future local conservation value of zoos could be substantially enhanced through targeted pollinator habitat management and expanded community science monitoring.
1. Introduction
As the global human population grows, shifts in land use and accelerating urbanization place mounting pressure on ecosystems, resulting in declines in biodiversity. Urban development is associated with higher levels of pollutants, higher ambient temperatures, greater coverage of impervious surfaces, reduced green spaces, habitat fragmentation, and vegetative simplification [1,2,3]. Together, these factors contribute to spatial and temporal shifts and/or losses in biodiversity of a given system. The effects of urbanization on species richness and diversity have been well documented across taxa. In general, urbanization results in a decrease in species richness and diversity. However, the effects vary significantly within and between taxonomic groups, particularly at moderate levels of development [3]. Avian species often experience declines in urban environments [3,4]. In contrast, insect pollinators can experience a range of negative, neutral, or even positive effects on abundance and richness due to urbanization [5]. This variation is the result of multiple factors, including, but not limited to, the state of naturalness of non-urban control habitats, the progression of urban densification versus urban sprawl, differences in life history and functional traits, climatic and geographic regions, and resource availability [5,6].
The impacts of development on urban pollinators are varied. Some research indicates that urbanization reduces suitable habitat and increases fragmentation, raising concern for species diversity [3,5,6]. Other findings suggest that urbanized areas can maintain or even enhance connectivity between suitable habitats, including parks, gardens, and remnant patches of native habitats, particularly in cities shaped by urban sprawl [5,7,8]. Positive effects on insect pollinators and butterflies are most likely related to host species and nectar availability, disturbance intensity, and pollinator community composition in surrounding areas [7,9]. The effects of climate change are becoming increasingly more pronounced in the American Southwest. Each year, these already arid regions undergo hotter climate extremes, drier soils, and more severe drought [10]. Insect pollinators are experiencing increasing declines in response to climate change, with butterfly abundance in the American West decreasing by an estimated rate of 1.6% each year [11]. Ectothermic insects are highly vulnerable to dehydration and heat stress because their body temperatures and water balance are closely tied to environmental conditions [9,12]. As a result, the increasing aridity associated with climate change presents substantial risks to their survival. Intermittent green spaces can serve as crucial refugia and biodiversity hotspots, or climatically stable areas, for urban species to find shelter from the consequences of climate change [13].
Urban biodiversity hotspots consist of small, local habitats within cities that support the survival of an unexpected number of species given the surrounding species richness and diversity [13]. Urban hotspots have been noted in green spaces like urban forests, grasslands, parks, gardens, and more unconventional places such as cemeteries, universities, and railroads [13,14,15]. Green spaces in cities have also been found to be beneficial to human physical, mental, social, and psychological well-being [16,17,18,19]; therefore, they increase biodiversity while providing an additional place for promoting human well-being and connection in urban environments [20,21]. Zoological gardens are one type of urban green space, and an old one at that [22]. They evolved from ancient royal menageries, which were status symbols, to modern conservation centers focused on education, science, and habitat simulation. The earliest known collections date back to Egypt in 3500 BCE, while the first modern scientific zoo, Tiergarten Schönbrunn, opened in 1752 in Vienna [22,23].
Once exclusively for entertainment, modern zoological gardens are now leaders of wildlife conservation. This centuries-long transition was punctuated by key milestones that reformed wild animal exploitation into a mission of protection. Zoo-based wildlife conservation facilitates new scientific knowledge, public education, and strategic breeding to maintain genetic diversity in imperiled species [22,23]. Prioritizing animal welfare management is a key advancement for modern zoos, as it lessens stress and improves quality of life for both the animals and the humans who visit them [24]. While much research has demonstrated the positive impacts of zoological gardens on biodiversity conservation, population management, conservation education, and human experiences, we know less about how zoos might also serve as urban refugia and hotspots for local species such as birds, mammals, and insects. Zoological gardens, like botanical gardens, are well equipped to not only support exotic animals but also provide habitat for many local animals common in an urban matrix [9,25].
Citizen, or community, science is a rapidly growing field that facilitates research on large temporal and spatial scales while raising community awareness of science [26]. Citizen science projects have explored a wide variety of topics in conservation, including, but not limited to, invasive species, ecological restoration, climate change, and biodiversity [14,26,27]. Projects are organized and implemented in a variety of ways depending on the goals of a specific project. Bioblitzes are short- to medium-duration surveys focused on identifying as many species as possible in a specific location and timeframe and are particularly useful for biodiversity research projects, as they allow researchers to collect data and observe trends over larger areas and longer time periods [14]. iNaturalist and eButterfly are popular citizen science platforms, particularly related to Bioblitz events. eButterfly focuses solely on butterfly observations in a checklist format while iNaturalist collects unstructured data across a much broader variety of taxa. Both allow users to upload photos or audio recordings of individual organisms, which are then identified by a combination of automated identification tools and manual verification by other users. Data is also annotated with metadata, such as date, time, longitude and latitude, and taxonomic identification, and deposited for open, shared usage in the Global Biodiversity Information Facility (GBIF). Both eButterfly and iNaturalist data are often collected in zoological and botanical gardens as either an ad hoc visitor activity or as a structured informal education event facilitated by the institution.
This study addresses the research question: Do individual zoological gardens function as local butterfly species richness and diversity hotspots relative to their surrounding host metropolitan areas? Rather than establishing a cross-institutional hierarchy among zoos, our analysis evaluates each institution strictly within its local urban landscape matrix to assess its ecological performance relative to equal-sized spatial patches in the same city. We compared butterfly species richness and diversity estimates in the zoological gardens of five urban areas in the southwest region of the United States using observational data derived from eButterfly [28] and iNaturalist [29] community science projects. We predicted that zoos would contain a large proportion of a city’s overall butterfly diversity despite occupying only a limited spatial scale, meaning zoological gardens were better, maybe even exceptional habitats for local species. To evaluate this, we applied permutation-based analyses to generate spatially appropriate comparisons between each zoological garden and its corresponding urban landscape. We then discussed the implications of the results on butterfly richness and diversity and the ways in which these zoological spaces could serve as vital refugia or even hotspots for urban wildlife alongside their many other functions.
2. Materials and Methods
2.1. Study Sites
The study was originally conducted in six urban cities of the southwestern United States of America: Tucson and Phoenix, Arizona; Los Angeles and San Diego, California; Albuquerque, New Mexico; and San Antonio, Texas. Each city has a population of over 550,000 residents. Each city also includes at least one zoological institution dedicated to conserving wildlife through research, breeding programs, and public education. Occurrence data were initially gathered across six southwestern urban cities; however, the Albuquerque Biological Park was excluded due to insufficient observation counts (n < 35), restricting active analysis to five host cities with 35 or more community science observations. The cities and zoos discussed in the study are shown in Table 1.
Table 1.
Location and areas of zoos included in the study. Areas are measured in square kilometers. % City Area is the size of the zoo relative to the size of the corresponding city.
2.2. Data Collection
Butterfly occurrence records were compiled from two community science programs: eButterfly [28], a platform dedicated solely to butterfly sightings, and iNaturalist [29], which collects observations across all taxonomic groups. Data was retrieved from the Global Biodiversity Information Facility (GBIF) [30] using the R statistical computing environment [31] and the rgbif package [30]. Prior to submission to GBIF, records from eButterfly and iNaturalist underwent independent vetting procedures, and taxonomic inconsistencies were subsequently reconciled by GBIF; iNaturalist records were restricted to observations classified as Research Grade. All data were unstructured presence-only data without information on sampling effort or observer expertise. Butterfly occurrence data was downloaded for each zoological institution using geographic coordinates defining a bounding rectangle encompassing the zoo. City-level data was obtained using boundary datasets from the OpenStreetMap project via the R packages osmdata [32] and sf [33]. All records were limited to observations collected between 1 January 2000 and 5 August 2025.
2.3. Statistical Analysis
Both species richness and diversity were evaluated because they assess two distinct ecological properties: raw species richness quantifies overall species presence, whereas diversity accounts for relative abundance and community evenness. Species richness was defined as the total number of unique species observed, while diversity was estimated using the oft-used Shannon–Weaver Diversity Index [34]. Reporting both metrics provides a broader assessment of community structure and aligns with established butterfly monitoring frameworks. For each zoo, butterfly species richness and diversity were evaluated in relation to those of the surrounding city, aggregated over the 25-year time period. Prior to analysis, duplicate records were removed based on matching geographic coordinates, observation date, and species identification. Both species richness and diversity were calculated for each zoo, with the number of observations per species used for abundance in diversity calculations.
Because our hypothesis evaluates each zoological garden relative to its host city’s local species pool and spatial matrix, our permutation model standardizes geographic footprint (km2) rather than applying individual-based sample size rarefaction across different cities. Downsampling all records across host cities to a single universal minimum count (e.g., N = 35) would discard over 90% of documented community science records in some cities (e.g., San Antonio and San Diego), artificially obscuring real spatial observation density within those host metropolitan areas. Because no statistical tests directly compare one zoo against another across cities, area-standardized spatial permutation provides the most appropriate null model for evaluating within-city hotspot status.
To assess whether zoo-level richness and diversity exceeded city-level values, a permutation-based sampling approach was used to generate distributions of richness and diversity for each city accounting for spatial bias common in this type of unstructured data. For each permutation, a rectangular area matching the dimensions of the associated zoo was selected within the city. Because some cities had large portions that lacked observational data, sampling was not conducted uniformly. Instead, all unique observation coordinate pairs within the city were used as potential centroids for sampling rectangles. Centering sampling centroid rectangles on existing observation coordinates intentionally conditions the null distribution on urban areas with documented butterfly occurrence records. This controls for severe spatial sampling bias and prevents zoos from being evaluated against unobserved, unsampled, or non-habitat urban areas. Rectangles centered on these coordinates were randomly selected, and all observations within each rectangle were used to calculate a single estimate of city-level richness and diversity. The null distribution was intentionally conditioned on areas with documented butterfly observations, rather than on arbitrary portions of the city, because large areas without observations may reflect sampling gaps rather than true absence. For each city, 1000 sampling replicates were conducted to generate distributions of city species richness and diversity. To ensure a less biased comparison, all observations originating from within the zoo boundaries were excluded from city observation calculations. Zoo species richness and diversity values were then compared to the corresponding city distributions and expressed as percentiles relative to the 1000 permutation replicates. Urban butterfly hotspots were defined as any zoo exceeding the 75th percentile of the permutation distribution, specifically for qualitative comparison with botanical gardens in the same region [9].
Percentile values for all zoos are reported to facilitate future comparisons. All statistical analyses were conducted in R [31] using the dplyr [35], tidyr [36], and vegan packages, and data visualization was performed with ggplot2 [37], ggpubr [38], and stringr [39]. The complete code used for data collection, analysis, and visualization is publicly available on GitHub: https://github.com/Big-Biodiversity-Collaborative/ZooHotspot (accessed on 19 September 2026).
3. Results
3.1. Summary of Community Science Data
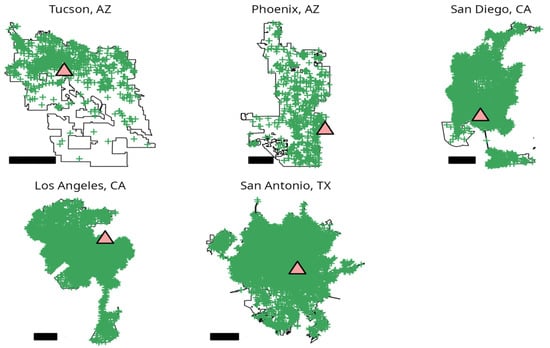
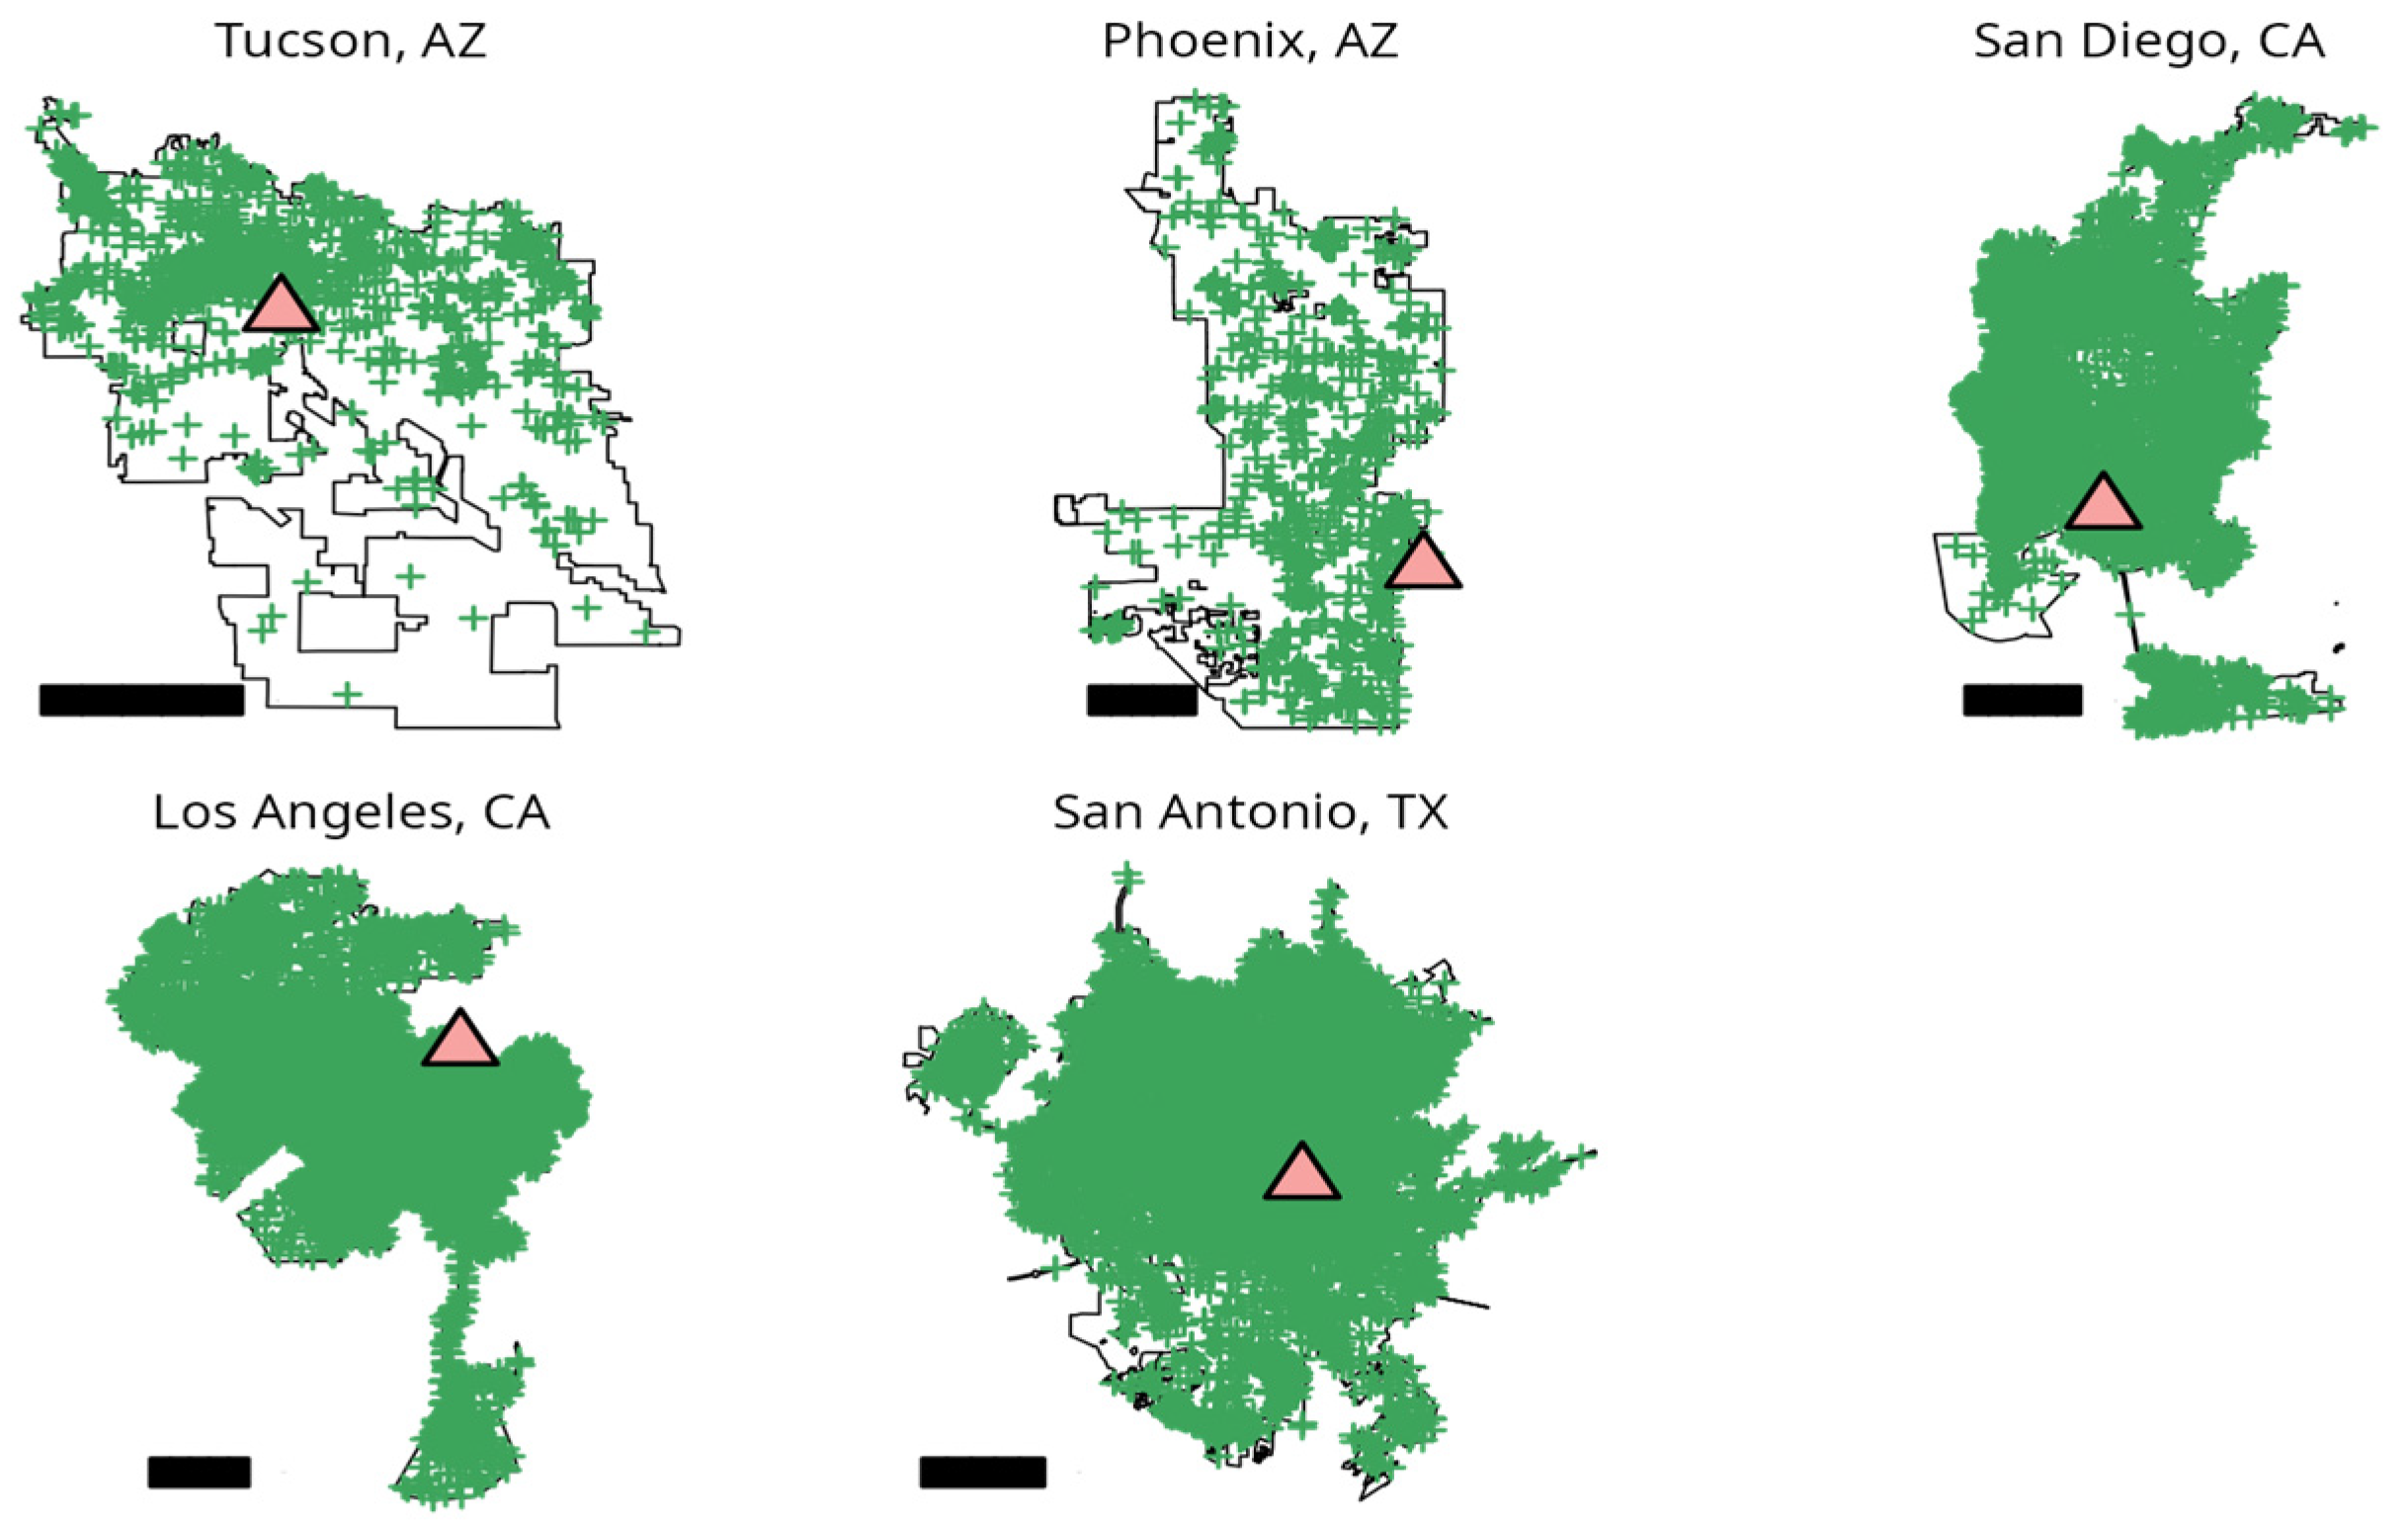
The dataset for the five zoological gardens and five cities included 101,323 total observations after de-duplication of records (Figure 1 and Table 2), including 262 unique species. eButterfly had 1988 observations, while iNaturalist had 100,495 observations. As some records are present in both datasets, the total number of observations between datasets is greater than the number of records after data cleaning.
Figure 1.
Locations of boundaries, zoos (orange triangles), and community science observations (green crosses) used in the current study. Relative scale bars (10 km) in the bottom left of each panel. City boundaries based on data from OpenStreetMap (2017).
Table 2.
Total number of unique observations for cities and corresponding zoos.
3.2. Species Richness and Diversity
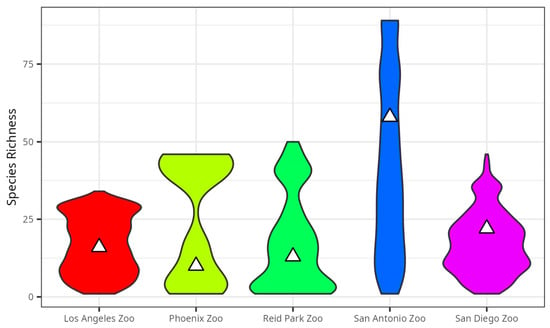
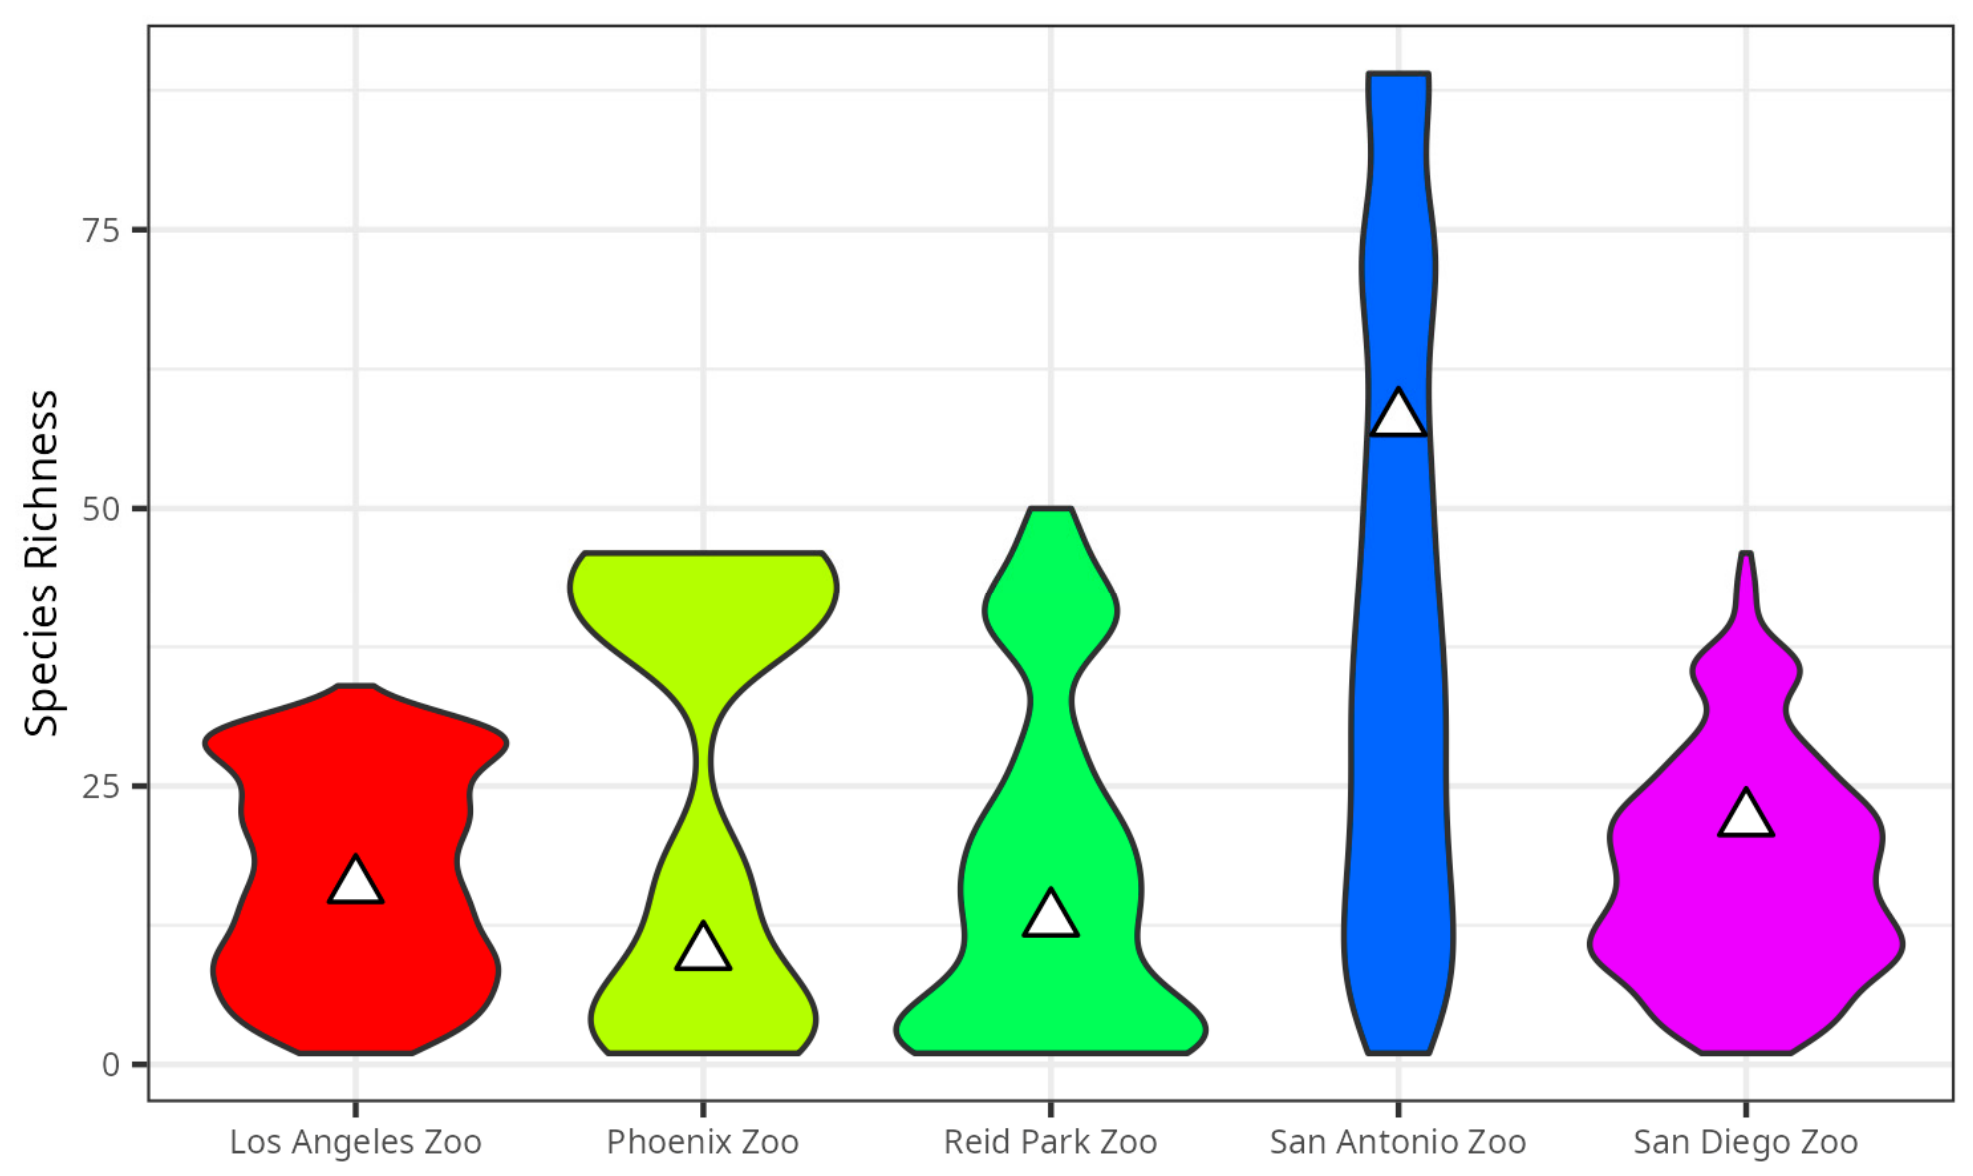
Across all five zoological gardens, butterfly species richness was moderate relative to equal-sized sampling patches in their host cities (Figure 2, Table 3). Species richness ranked in the 36.76th percentile for Phoenix Zoo, 48.33rd percentile for Reid Park Zoo, 51.04th percentile for Los Angeles Zoo, 69.79th percentile for San Antonio Zoo, and 71.85th percentile for San Diego Zoo (Table 3). Although San Diego Zoo and San Antonio Zoo approached the upper quartile of city-level permutation distributions, no zoo met or exceeded our predefined 75th percentile threshold to qualify as an urban species richness hotspot (Figure 2, Table 3).
Figure 2.
Comparison of butterfly species richness in zoos to samples of the same geographic size within city boundaries. Violins show the distribution of richness based on 1000 replicates, and triangles show observed species richness for corresponding zoos.
Table 3.
Butterfly species richness and diversity (Shannon–Weaver Index) reported for each zoo. Percentiles are observed richness and diversity values relative to 1000 permutation sampling replicates in each corresponding city (non-parametric statistical tests). Our predetermined threshold for a local butterfly hotspot was at or above the 75th percentile; none of the zoos across the 5 cities met this criterion. For species richness comparisons between cities, we provide the rarefaction-corrected species richness, S.
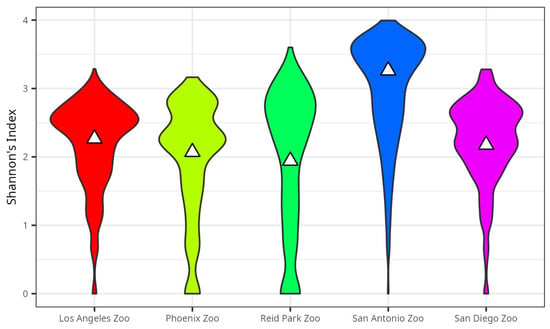
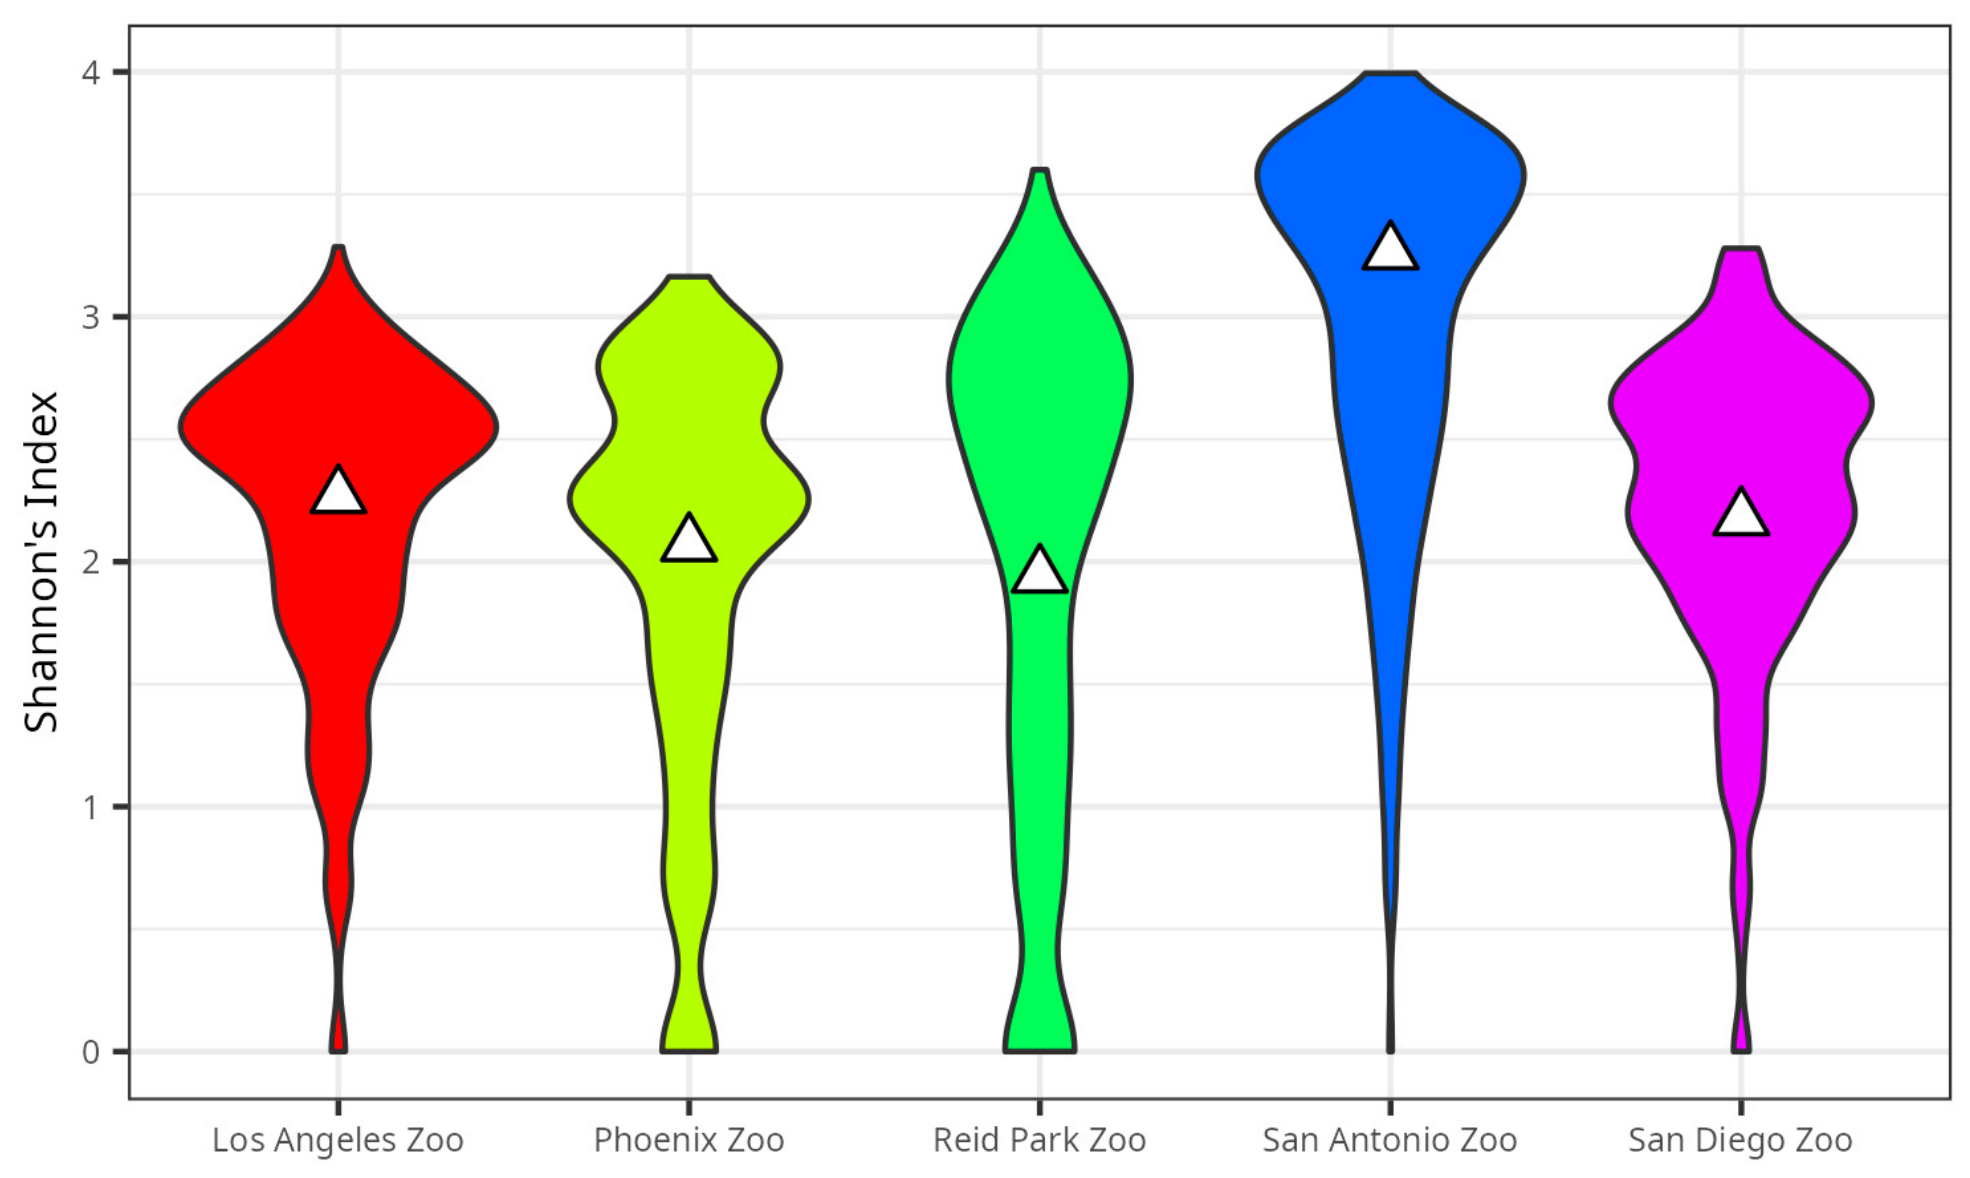
Butterfly species diversity within zoological gardens showed similar moderate trends, falling within average citywide distributions (Figure 3, Table 3). Diversity percentiles ranged from the 38.19th percentile at Reid Park Zoo, 39.30th percentile at Phoenix Zoo, 40.61st percentile at San Diego Zoo, 42.77th percentile at Los Angeles Zoo, to the 51.54th percentile at San Antonio Zoo (Table 3). Because all institutions fell below the predetermined 75th percentile threshold, no zoological garden qualified as a local hotspot for butterfly diversity (Figure 3, Table 3).
Figure 3.
Comparison of butterfly diversity in zoos to samples of the same geographic size within city boundaries. Violins show distribution of richness based on 1000 replicates, and triangles show observed species richness for corresponding zoos.
4. Discussion
Our analysis evaluated butterfly species richness and diversity across five zoological gardens in the southwestern United States using 101,323 de-duplicated community science records compiled from eButterfly and iNaturalist between 2000 and 2025 (Table 2). Across all five zoos, species richness was low to moderate, ranging between the 36th and 72nd percentiles of citywide permutation distributions (Figure 2, Table 3), with San Diego Zoo and San Antonio Zoo being closest to the threshold. Similarly, species diversity was also low to moderate, ranging between the 38th and 52nd percentiles (Figure 3, Table 3), with San Antonio Zoo at the highest percentile. None of the zoological gardens met or exceeded our predefined 75th percentile threshold for either species richness or diversity hotspots. Thus, while zoological gardens maintain functional green infrastructure supporting typical urban butterfly assemblages, they do not operate as localized biodiversity hotspots relative to other urban areas of similar size.
The lower species richness and diversity observed within zoological gardens compared to surrounding urban baselines is likely driven by specific institutional land management practices and landscape features [22]. In contrast to natural green spaces, vegetation within zoos is primarily selected for exhibit aesthetics, animal shade, browse for captive inhabitants, visual barrier management, or even enclosure containment rather than the ecological requirements of native fauna [22,25]. Consequently, zoo habitats frequently feature non-native ornamental plantings instead of larval host plants and adult nectar resources required by local butterfly species. Intense human foot traffic, built infrastructure density, and active pest management further constrain insect pollinator habitat [22,25]. These findings align with the broader zoo habitat literature, demonstrating that enclosure design, structural complexity, and vegetation management strongly shape free-ranging animal diversity and community assemblages within zoo grounds [23,40]. Furthermore, surrounding landscape context and connectivity may play a key role; zoos embedded within contiguous green corridors or adjacent to major river networks [22], such as the San Antonio Zoo near the San Antonio River Basin, may benefit from enhanced species movement across the broader urban matrix compared to zoos embedded in more built environs.
Other factors may be influencing these results and their interpretation. Sampling effort and volunteer engagement were highly uneven between the study regions. Climatically moderate cities (San Diego, San Antonio, and Los Angeles) generated far higher observation volumes than desert cities (Phoenix and Tucson) that experience extreme summer temperatures, which likely suppress diurnal volunteer recording activity. Also, community science footprints varied significantly. Although Phoenix possesses a similar city area and population (1374 km2, 1.66 million inhabitants) to San Antonio (1389 km2, 1.55 million inhabitants) (Table 1), Phoenix exhibited a much smaller community science footprint (3656 Phoenix City records vs. 32,663 San Antonio City observations). This order-of-magnitude disparity is reflected at the zoo observation level as well: the Phoenix Zoo yielded 35 observations, compared to 475 observations at the San Antonio Zoo (Table 2).
These observed richness and diversity differences may also be influenced by program offerings within the zoos and around the host cities. Los Angeles [41], Phoenix [42], San Antonio [43], San Diego [44], and Tucson [45] host coordinated multi-day, city-wide annual BioBlitz events, such as the iNaturalist City Nature Challenge [14], but they vary tremendously in participation and total observations. Zoo-focused BioBlitzes are fewer, organized by Los Angeles Zoo [46] and Reid Park Zoo [47], although all zoos allow ad hoc iNaturalist and eButterfly submissions in their gardens. These patterns indicate that community science datasets may also reflect public engagement effort and volunteer participation across cities and zoos rather than just biological absence alone. Zoological gardens are uniquely positioned to bridge these data gaps by expanding their public conservation programming [45]. Hosting regular zoo BioBlitzes, establishing zoo-based iNaturalist projects, and engaging visitors in pollinator monitoring directly align with the educational and conservation missions of modern zoos. Further, adopting targeted habitat enrichment practices, such as establishing native nectar corridors, incorporating larval host plants into perimeter landscaping, and reducing pesticide applications, can significantly enhance the capacity of zoological gardens to function as vital urban hotspots within broader regional biodiversity networks [9,22].
New zoological management practices to increase pollinator habitat can be conceptually drawn from urban botanical gardens in arid and semi-arid environments, which have been broadly identified as local hotspots for butterfly species richness and diversity [9]. While percentile rankings between botanical and zoological gardens are not directly comparable due to differing temporal windows and exact locations, this contrast highlights important differences in land management priorities. Botanical gardens are designed to cultivate diverse plant assemblages, often including nectar-rich flora and larval host plants that support local pollinator populations. In contrast, zoological gardens manage extensive built infrastructure primarily to support wild animal containment, zoo animal welfare, and visitor movement and safety, where vegetation often plays a more secondary role. To bridge this operational divide, zoological gardens can strategically borrow garden management practices from botanical gardens by integrating native larval host plants and adult nectar corridors into perimeter buffer zones and non-exhibit green spaces [25]. Pairing such targeted habitat enrichment with structured public BioBlitz events would allow zoos to simultaneously enhance their ecological functionality for local butterflies and advance their broader public engagement missions [9,14].
Although this study’s findings provide a valuable first step in evaluating zoological gardens as urban butterfly hotspots, presence-only community science data on relative abundance can confound ecological trends with observer and detectability biases not entirely accounted for in these data and methods. Additionally, pooling 25 years of occurrence data (2000–2025) captures long-term spatial presence but lacks fine-scale temporal controls, particularly given that community science participation accelerated dramatically after 2010 and COVID-19 [48]. Untangling these complexities through more stringent occupancy modeling approaches is desirable and requires structured presence–absence data with more standardized sampling protocols, e.g., [49,50,51]. Executing these structured surveys across multiple zoological gardens involves significant financial and logistical challenges, including unique safety constraints near or in captive wildlife exhibits. Future research combining structured surveys with opportunistic community science records will be essential to separate bias from underlying ecological patterns, especially as zoos improve their local pollinator habitat.
5. Conclusions
Here we evaluated whether zoological gardens function as butterfly species richness and diversity hotspots within urban environments of the southwestern United States using community science data. Across all five institutions, neither species richness nor species diversity exceeded our 75th percentile hotspot threshold relative to surrounding host cities. Zoos exhibited moderate species richness and species diversity, indicating that zoological gardens currently support typical urban pollinator communities rather than localized hotspots.
Differences in observation density among cities highlight the strong influence of sampling effort and public engagement on biodiversity estimates, emphasizing the value of expanding zoo-based BioBlitzes. Although current zoo landscapes may not inherently maximize butterfly diversity, their managed vegetation, public access, and conservation infrastructure offer clear opportunities for improvement. Implementing targeted habitat management such as establishing native larval host plant corridors and reducing chemical pest control could elevate zoological gardens into active urban biodiversity hotspots.
Author Contributions
Conceptualization, L.E. and K.L.P.; data analysis, L.E. and K.L.P.; methodology and writing—original draft preparation, L.E.; writing—review and editing, L.E. and K.L.P.; data visualization, L.E. and K.L.P.; funding acquisition, K.L.P. All authors have read and agreed to the published version of the manuscript.
Funding
Funding was provided by the University of Arizona College of Agriculture, Life Sciences and Environmental Sciences and the National Science Foundation Harnessing the Data Revolution: Data Science Corp (2122967) to K.L.P.
Institutional Review Board Statement
Not applicable.
Data Availability Statement
The data used in this work, along with all source codes for data processing and analysis, are available on GitHub at https://github.com/Big-Biodiversity-Collaborative/ZooHotspot (accessed on 19 September 2026).
Acknowledgments
We thank the eButterfly and iNaturalist community scientists for their effort, enthusiasm, and skill. Their collaboration makes research like this possible. Additionally, we thank the zoological garden volunteer and outreach coordinators whose leadership helped educate the public and train community scientists on the importance of pollinators and how to identify them. We thank the University of Arizona Honors College for their intellectual and administrative support. Finally, we thank Jeff Oliver at the University of Arizona Libraries for R, data wrangling, and data visualization help.
Conflicts of Interest
The authors declare no conflicts of interest.
References
- Chapman, S.; Watson, J.E.M.; Salazar, A.; Thatcher, M.; McAlpine, C.A. The Impact of Urbanization and Climate Change on Urban Temperatures: A Systematic Review. Landsc. Ecol. 2017, 32, 1921–1935. [Google Scholar] [CrossRef] [Scilit]
- Grimm, N.B.; Foster, D.; Groffman, P.; Grove, J.M.; Hopkinson, C.S.; Nadelhoffer, K.J.; Pataki, D.E.; Peters, D.P. The Changing Landscape: Ecosystem Responses to Urbanization and Pollution across Climatic and Societal Gradients. Front. Ecol. Environ. 2008, 6, 264–272. [Google Scholar] [CrossRef] [Scilit]
- McKinney, M.L. Effects of Urbanization on Species Richness: A Review of Plants and Animals. Urban Ecosyst. 2008, 11, 161–176. [Google Scholar] [CrossRef] [Scilit]
- Aronson, M.F.J.; La Sorte, F.A.; Nilon, C.H.; Katti, M.; Goddard, M.A.; Lepczyk, C.A.; Warren, P.S.; Williams, N.S.G.; Cilliers, S.; Clarkson, B.D.; et al. A Global Analysis of the Impacts of Urbanization on Bird and Plant Diversity Reveals Key Anthropogenic Drivers. Proc. Biol. Sci. 2014, 281, 20133330. [Google Scholar] [CrossRef] [Scilit] [PubMed]
- Wenzel, A.; Grass, I.; Belavadi, V.V.; Tscharntke, T. How Urbanization Is Driving Pollinator Diversity and Pollination—A Systematic Review. Biol. Conserv. 2020, 241, 108321. [Google Scholar] [CrossRef] [Scilit]
- Liang, H.; He, Y.; Theodorou, P.; Yang, C. The Effects of Urbanization on Pollinators and Pollination: A Meta-analysis. Ecol. Lett. 2023, 26, 1629–1642. [Google Scholar] [CrossRef] [Scilit] [PubMed]
- Ramírez-Restrepo, L.; MacGregor-Fors, I. Butterflies in the City: A Review of Urban Diurnal Lepidoptera. Urban Ecosyst. 2017, 20, 171–182. [Google Scholar] [CrossRef] [Scilit]
- Hall, D.M.; Camilo, G.R.; Tonietto, R.K.; Ollerton, J.; Ahrné, K.; Arduser, M.; Ascher, J.S.; Baldock, K.C.R.; Fowler, R.; Frankie, G.; et al. The City as a Refuge for Insect Pollinators. Conserv. Biol. 2017, 31, 24–29. [Google Scholar] [CrossRef] [Scilit] [PubMed]
- Prudic, K.L.; Cruz, T.M.P.; Winzer, J.I.B.; Oliver, J.C.; Melkonoff, N.A.; Verbais, H.; Hogan, A. Botanical Gardens Are Local Hotspots for Urban Butterflies in Arid Environments. Insects 2022, 13, 865. [Google Scholar] [CrossRef] [Scilit] [PubMed]
- Overpeck, J.T.; Udall, B. Climate Change and the Aridification of North America. Proc. Natl. Acad. Sci. USA 2020, 117, 11856–11858. [Google Scholar] [CrossRef] [Scilit] [PubMed]
- Forister, M.L.; Halsch, C.A.; Nice, C.C.; Fordyce, J.A.; Dilts, T.E.; Oliver, J.C.; Prudic, K.L.; Shapiro, A.M.; Wilson, J.K.; Glassberg, J. Fewer Butterflies Seen by Community Scientists across the Warming and Drying Landscapes of the American West. Science 2021, 371, 1042–1045. [Google Scholar] [CrossRef] [Scilit] [PubMed]
- Kumar, H.; Sagar, D.; Verma, S.; Rajarushi, C.N.; Godavari, J.S.; Sujatha, G.S. Heat Stress and Thermoregulation in Insects: Unveiling Molecular and Physiological Responses in Light of Climate Change. J. Adv. Biol. Biotechnol. 2024, 27, 820–834. [Google Scholar] [CrossRef] [Scilit]
- Gentili, R.; Quaglini, L.A.; Galasso, G.; Montagnani, C.; Caronni, S.; Cardarelli, E.; Citterio, S. Urban Refugia Sheltering Biodiversity across World Cities. Urban Ecosyst. 2024, 27, 219–230. [Google Scholar] [CrossRef] [Scilit]
- Palma, E.; Mata, L.; Cohen, K.; Evans, D.; Gandy, B.; Gaskell, N.; Hatchman, H.; Mezzetti, A.; Neumann, D.; O’Keefe, J.; et al. The City Nature Challenge: A Global Citizen Science Phenomenon Contributing to Biodiversity Knowledge and Informing Local Government Practices. BioScience 2024, 74, 290–299. [Google Scholar] [CrossRef] [Scilit] [PubMed]
- MacGregor-Fors, I.; Escobar, F.; Rueda-Hernández, R.; Avendaño-Reyes, S.; Baena, M.; Bandala, V.; Chacón-Zapata, S.; Guillén-Servent, A.; González-García, F.; Lorea-Hernández, F.; et al. City “Green” Contributions: The Role of Urban Greenspaces as Reservoirs for Biodiversity. Forests 2016, 7, 146. [Google Scholar] [CrossRef] [Scilit]
- Jabbar, M.; Yusoff, M.M.; Shafie, A. Assessing the Role of Urban Green Spaces for Human Well-Being: A Systematic Review. GeoJournal 2022, 87, 4405–4423. [Google Scholar] [CrossRef] [Scilit] [PubMed]
- Larson, L.R.; Jennings, V.; Cloutier, S.A. Public Parks and Wellbeing in Urban Areas of the United States. PLoS ONE 2016, 11, e0153211. [Google Scholar] [CrossRef] [Scilit] [PubMed]
- Wood, L.; Hooper, P.; Foster, S.; Bull, F. Public Green Spaces and Positive Mental Health—Investigating the Relationship between Access, Quantity and Types of Parks and Mental Wellbeing. Health Place 2017, 48, 63–71. [Google Scholar] [CrossRef] [Scilit] [PubMed]
- Enssle, F.; Kabisch, N. Urban Green Spaces for the Social Interaction, Health and Well-Being of Older People—An Integrated View of Urban Ecosystem Services and Socio-Environmental Justice. Environ. Sci. Policy 2020, 109, 36–44. [Google Scholar] [CrossRef] [Scilit]
- Mavoa, S.; Davern, M.; Breed, M.; Hahs, A. Higher Levels of Greenness and Biodiversity Associate with Greater Subjective Wellbeing in Adults Living in Melbourne, Australia. Health Place 2019, 57, 321–329. [Google Scholar] [CrossRef] [Scilit] [PubMed]
- Schebella, M.F.; Weber, D.; Schultz, L.; Weinstein, P. The Wellbeing Benefits Associated with Perceived and Measured Biodiversity in Australian Urban Green Spaces. Sustainability 2019, 11, 802. [Google Scholar] [CrossRef] [Scilit]
- Bisgrove, D. Zooscape Ecology: A Conceptual Analysis of Zoos and Landscape Ecology. Landsc. Ecol. 2022, 37, 1733–1745. [Google Scholar] [CrossRef] [Scilit] [PubMed]
- Beer, H.N.; Shrader, T.C.; Schmidt, T.B.; Yates, D.T. The Evolution of Zoos as Conservation Institutions: A Summary of the Transition from Menageries to Zoological Gardens and Parallel Improvement of Mammalian Welfare Management. J. Zool. Bot. Gard. 2023, 4, 648–664. [Google Scholar] [CrossRef] [Scilit]
- Greenwell, P.J.; Riley, L.M.; Lemos De Figueiredo, R.; Brereton, J.E.; Mooney, A.; Rose, P.E. The Societal Value of the Modern Zoo: A Commentary on How Zoos Can Positively Impact on Human Populations Locally and Globally. J. Zool. Bot. Gard. 2023, 4, 53–69. [Google Scholar] [CrossRef] [Scilit]
- Hambly, N.; Marshall, A.R. Zoo BAPs: Biodiversity Action Plans for Conserving Native Wildlife in and around Zoological Gardens. J. Zoo Aquar. Res. 2014, 2, 18–21. [Google Scholar] [CrossRef] [Scilit]
- Baker, P.M.; Samuels, B.; Hain, T.J.A. Using Citizen Science to Document Biodiversity on a University Campus: A Year-Long Case Study. Conservation 2024, 4, 533–546. [Google Scholar] [CrossRef] [Scilit]
- Tiago, P.; Evaristo, I.; Pinto, B. The Role of BioBlitzes in Citizen Science: Insights from Participants and Experts. Front. Environ. Sci. 2024, 12, 1347428. [Google Scholar] [CrossRef] [Scilit]
- Prudic, K.L.; McFarland, K.P.; Oliver, J.C.; Hutchinson, R.A.; Long, E.C.; Kerr, J.T.; Larrivee, M. eButterfly: Leveraging Massive Online Citizen Science for Butterfly Conservation. Insects 2017, 8, 53. [Google Scholar] [CrossRef] [Scilit] [PubMed]
- Ueda, K.; Belmonte, J.; Shepherd, A.; Leary, P.; Loarie, S. iNaturalist. 2026. Available online: https://www.inaturalist.org (accessed on 1 June 2026).
- Chamberlain, S.; Barve, V.; Mcglinn, D.; Oldoni, D.; Desmet, P.; Geffert, L.; Ram, K. Rgbif: Interface to the Global Biodiversity Information Facility. 2026. Available online: https://CRAN.R-project.org/package=rgbif (accessed on 1 June 2026).
- Posit Team 2025. RStudio: Integrated Development Environment for R. Posit Software. 2026. Available online: http://www.posit.co (accessed on 1 June 2026).
- Padgham, M.; Lovelace, R.; Salmon, M.; Rudis, B. osmdata. J. Open Source Softw. 2017, 2, 14. [Google Scholar] [CrossRef] [Scilit]
- Pebesma, E.; Bivand, R. Spatial Data Science: With Applications in R; Chapman and Hall, CRC Press: Boca Raton, FL, USA, 2023. [Google Scholar]
- Shannon, C.E.; Weaver, W. The Mathematical Theory of Communication; University of Illinois Press: Champaign, IL, USA, 1949. [Google Scholar]
- Wickham, H.; François, R.; Henry, L.; Müller, K. Dplyr: A Grammar of Data Manipulation. 2022. Available online: https://CRAN.R-project.org/package=dplyr (accessed on 1 June 2026).
- Wickham, H.; Girlich, M. Tidyr: Tidy Messy Data. 2022. Available online: https://CRAN.R-project.org/package=tidyr (accessed on 1 June 2026).
- Wickham, H. Ggplot2: Elegant Graphics for Data Analysis; Springer: New York, NY, USA, 2016. [Google Scholar]
- Kassambara, A. Ggpubr: “ggplot2” Based Publication Ready Plots. 2025. Available online: https://cran.r-project.org/web/packages/ggpubr/index.html (accessed on 1 June 2026).
- Wickham, H. Stringr: Simple, Consistent Wrappers for Common String Operations. 2025. Available online: https://stringr.tidyverse.org/ (accessed on 1 June 2026).
- Entap, E.N.; Faizatul-Azreen, A.; Songodan, T.; Mohd-Taib, F.S. The Influence of Zoo Habitat Settings on the Species Diversity and Assemblage of Free-Ranging Animals. Zoo Biol. 2026, 45, 459–477. [Google Scholar] [CrossRef] [Scilit] [PubMed]
- City Nature Challenge. Natural History Museum of Los Angeles County. Los Angeles, CA, USA. 2026. Available online: https://www.citynaturechallenge.org (accessed on 15 September 2026).
- City Nature Challenge 2026: Maricopa County. Arizona Master Naturalists. Phoenix, AZ, USA. 2026. Available online: https://azmnmcp.org/phx-city-nature-challenge (accessed on 19 September 2026).
- San Antonio River Basin Bioblitz. San Antonio River Authority. San Antonio, TX, USA. 2026. Available online: https://www.sariverauthority.org/event/san-antonio-river-basin-bioblitz (accessed on 1 June 2026).
- City Nature Challenge 2026: San Diego County. San Diego Museum of Natural History. San Diego, CA, USA. 2026. Available online: https://www.sdnhm.org/education/community-science/city-nature-challenge (accessed on 19 September 2026).
- City Nature Challenge 2026: Pima County. Arizona Master Naturalists. Tucson, AZ, USA. 2026. Available online: https://pimamasternaturalists.org/community-science (accessed on 19 September 2026).
- LA Zoo Neighborhood BioBlitz. Los Angeles Zoo. Los Angeles, CA, USA. 2026. Available online: https://www.inaturalist.org/projects/l-a-zoo-neighborhood (accessed on 19 September 2026).
- Parks for Pollinators. Reid Park Zoo. Tucson, AZ, USA. 2026. Available online: https://reidparkzoo.org/event/parks-for-pollinators-bioblitz (accessed on 19 September 2026).
- Crimmins, T.M.; Posthumus, E.; Schaffer, S.; Prudic, K.L. COVID-19 impacts on participation in large scale biodiversity-themed community science projects in the United States. Biol. Conserv. 2021, 256, 109017. [Google Scholar] [CrossRef] [Scilit] [PubMed]
- Altwegg, R.; Nichols, J.D. Occupancy models for citizen-science data. Methods Ecol. Evol. 2019, 10, 8–21. [Google Scholar] [CrossRef] [Scilit]
- Jha, A.; Praveen, J.; Nameer, P.O. Contrasting occupancy models with presence-only models: Does accounting for detection lead to better predictions? Ecol. Model. 2022, 472, 110105. [Google Scholar] [CrossRef] [Scilit]
- Savery, M.; Luca, S. Bayesian adaptive design for citizen science data collection: Exploring tensions between data and design. EcoEvoRxiv 2026. [Google Scholar] [CrossRef] [Scilit]

Disclaimer/Publisher’s Note: The statements, opinions and data contained in all publications are solely those of the individual author(s) and contributor(s) and not of MDPI and/or the editor(s). MDPI and/or the editor(s) disclaim responsibility for any injury to people or property resulting from any ideas, methods, instructions or products referred to in the content. |
© 2026 by the authors. Licensee MDPI, Basel, Switzerland. This article is an open access article distributed under the terms and conditions of the Creative Commons Attribution (CC BY) license.