


Abstract
Living collections in botanical gardens play important roles in conservation, research, and education, but their potential to generate interpretable biological information for teaching and management is often underused. This study reports a teaching experience based on dendrometric data from the arboretum of the Rio de Janeiro Botanical Garden in a graduate course on applied statistics. The course combined R programming with a problem-oriented pedagogical approach, using a census dataset of 4621 individuals with DBH ≥ 10 cm as a common object of investigation. The dataset served as a common framework for linking statistical procedures, from exploratory analysis to model-based approaches, with botanical interpretation and management-oriented questions. Analytical outputs showed that taxonomic abundance, dominated by Arecaceae and Fabaceae, did not always correspond to structural dominance measured by total basal area. In addition, height–DBH models fitted for Roystonea and Carapa highlighted interspecific and between-bed variation within the arboretum. Student submissions reproduced and adapted the analytical workflows, while instructor feedback identified difficulties in regression interpretation and model diagnostics. Overall, the experience illustrates how dendrometric data from a living collection can be incorporated into applied statistics teaching while also providing information for collection assessment and future monitoring.
1. Introduction
Living collections in botanical gardens are curated and documented resources that support plant conservation, botanical research, environmental education, public engagement with plants, and higher education in plant sciences [1,2]. Collectively, botanical gardens worldwide maintain at least 30% of known plant species and more than 41% of known threatened plant species [3]. This ex situ representation reinforces the importance of botanical gardens for conserving plant diversity amid accelerating biodiversity loss [1,3]. In addition to maintaining taxonomical diversity, these collections generate institutional records and biological data that can inform cultivation practices, documentation, conservation planning, and the management of taxonomically and structurally heterogeneous plant collections [1,4,5].
Despite their potential, tree measurement data from living collections remain underused in long-term monitoring. A recent global review found that fewer than 1% of botanical gardens and arboreta worldwide had published long-term monitoring studies using their living collections [2]. In a single census, dendrometric variables such as diameter at breast height (DBH) and total height can characterize the current size structure of a tree collection [6], while derived measures such as basal area and height–DBH relationships can reveal structural dominance and variation among taxa and planting areas [7,8]. When the same individuals are reassessed, these records provide a baseline for detecting changes in tree size and collection structure over time [9]. Their usefulness for living collection assessment depends on consistent data organization, statistical analysis, and biological interpretation, while their application to monitoring additionally requires comparable repeated measurements.
The established role of botanical gardens and arboreta in plant science education also creates opportunities to use data from their living collections to teach methodological and quantitative subjects, including applied statistics and data analysis, through authentic botanical problems [4]. This is particularly relevant in graduate training, where researchers must move beyond biological data collection and develop the ability to manage, process, analyze, integrate, and interpret complex botanical datasets [10]. These competencies are important not only for conducting botanical research but also for transforming collection records into reproducible evidence that can support the assessment and future monitoring of living collections.
Nevertheless, statistics is often taught in an abstract or isolated manner, with limited connection to authentic biological problems and datasets, which may reduce students’ interest and hinder their ability to apply statistical methods in research and professional practice [11,12,13,14]. Teaching strategies based on real-world data and biologically meaningful problems can help connect statistical methods to disciplinary reasoning [13,14]. Although previous studies have integrated biology and statistics in higher education through authentic research experiences or public datasets [12,13,14], the pedagogical use of dendrometric data from living collections, particularly tropical arboreta, has received little attention [2,15]. These datasets can combine tree measurements with taxonomic and planting-area information, providing opportunities to teach data management, descriptive and inferential analyses, sampling, and statistical modeling through questions grounded in the structure of an actual plant collection. At the same time, the resulting analyses can characterize the current structure of the collection and provide a quantitative baseline for future reassessment.
This study has two complementary objectives. First, it describes and discusses the use of dendrometric census data from a tropical arboretum as an authentic dataset in a graduate course on applied statistics, documenting the pedagogical design and analytical activities without formally assessing learning outcomes. Second, it uses the resulting analyses to characterize the taxonomic and dendrometric structure of the living collection, including patterns of abundance, basal area, multiple stems, and height–DBH relationships, and examines their potential to provide a baseline for future reassessment and to inform collection management.
2. Materials and Methods
2.1. Study Area Characterization
The study was conducted in the arboretum of the Rio de Janeiro Botanical Garden Research Institute (JBRJ), located in Rio de Janeiro, Brazil, at approximately −22.967689, −43.224081. Founded in 1808, the JBRJ houses a historic tropical living plant collection that covers 37.70 ha and is organized into planting beds, which function as spatial and management units and were considered in some of the analyses presented in this study.
The site exhibits considerable environmental heterogeneity, particularly in relation to soil conditions, drainage, and groundwater table depth, and this heterogeneity is also associated with different historical periods, planting decisions, and management practices [16]. Its soils are anthropogenic and have been substantially modified by landfilling and drainage works [16].
According to Almeida et al. [17], the living collection comprises 6960 specimens, distributed among 134 families and 1420 species. More than 60% of these species are native to Brazil, whereas the remainder originate from different parts of the world, mostly tropical and subtropical regions. The arboretum includes plants at different developmental stages and sizes, with diverse growth patterns, trunk forms, and crown architectures, as well as uncommon dimensions and structural conformations, including individuals with multiple bifurcations, leaning stems, and unbalanced crowns.
2.2. Dendrometric Data
The dendrometric data used in this study were collected between 2021 and 2022 during a census of the planted area of the JBRJ arboretum. These data also supported previous studies on carbon stocks and aboveground biomass estimation in the arboretum [6,18]. The census adopted diameter at breast height (DBH) ≥ 10 cm as the inclusion criterion.
Circumference at breast height (CBH) was measured with a measuring tape and converted to DBH as DBH = CBH/π. When necessary, the measurement point was adjusted according to stem morphology, for example in trees with buttress roots or other irregularities at breast height. DBH was used as the inclusion criterion, as the main stem-size variable, and as the basis for deriving other variables.
Total plant height was measured using a Bosch GLM 120 C (Robert Bosch Power Tools GmbH, Bayan Lepas, Malaysia) laser distance meter. For arborescent monocots, Cycadaceae, and Zamiaceae, the recorded height corresponded to stem height. Wood density values were primarily obtained from the Global Wood Density Database [19]. Plant locations, including geographic coordinates and planting bed information, had been recorded before the dendrometric measurements during a previous inventory of the living collection and were used to assign individuals to spatial units within the arboretum. Taxonomic information was obtained from institutional records. Some individuals were unidentified, whereas others were identified only to the family or genus level. Individuals were retained in dendrometric summaries and in taxonomic analyses compatible with their available level of identification; they were excluded only from analyses requiring finer taxonomic resolution.
Growth habit was assigned based on species classifications available in the R packages BIEN, version 1.2.8 [20]; GIFT, version 1.3.3 [21]; and florabr, version 1.4.0 [22], as well as on field-based classification considering the observed size, architecture, and morphology of each plant under arboretum conditions. Plants with DBH ≥ 10 cm belonging to Arecaceae, Asparagaceae, Cactaceae, Cycadaceae, Pandanaceae, Strelitziaceae, and Zamiaceae were classified as arborescent.
The raw and processed datasets are available in the project repository, in the “data” folder.
2.3. Pedagogical Design of the Course
The applied statistics course was offered within the Graduate Program in Botany of the National School of Tropical Botany (ENBT) at the JBRJ. This setting allowed the arboretum dendrometric dataset to be used as an authentic teaching resource for applied statistics in the context of a living plant collection.
Because the dendrometric census had been conducted before the course, students did not participate in the original DBH and height measurements or in any other field procedures. The pedagogical focus was therefore on the statistical analysis and interpretation of a pre-existing field dataset.
The pedagogical design was guided by strategies associated with problem-based learning (PBL), although the course did not adopt the full PBL method as a formal instructional model. At the beginning of the course, students were presented with the following guiding problem: “How can the statistical topics taught in the course be used to support the monitoring and management of a tropical arboretum?” This question provided a common thread connecting all the course content.
The course content included data preparation, descriptive analysis, probability, inference, hypothesis testing, and regression analysis, as detailed in Supplementary Table S1. During the classes, students had access to the repository and followed the analyses using the available scripts [23] while the instructor demonstrated the procedures in R. The interpretation of results was conducted collectively, with students encouraged to examine the outputs, question the suitability of the methods, and relate statistical results to biological and management-oriented questions in the arboretum. Peer learning was encouraged during practical activities, group discussions, and interpretation exercises.
For the course assessment, students worked in two groups: one analyzed Arecaceae and the other analyzed trees. The assignment began during the final class on 29 May, and students had two weeks to submit an R Markdown file containing R code, graphical and statistical outputs, and written interpretations. The tasks addressed taxonomic composition, dendrometric structure, height–DBH relationships, atypical dendrometric patterns, and group comparisons.
The submissions were qualitatively reviewed by the instructor based on workflow organization and reproducibility, data filtering, graphical presentation, statistical procedures, assessment of model assumptions, and interpretation of results. Comments were added directly to the files presented in the repository [23].
The workflows demonstrated during the course are documented in scripts 1–5 of the project repository [23]. The student submissions adapted these workflows and informed the selection of analyses for the manuscript. However, all botanical results reported in Section 3.2 were checked, rerun, and, when necessary, refined during manuscript preparation using “6_manuscript_code.Rmd” from the repository [23]. None are presented as unmodified student outputs.
Because the course was not designed to experimentally assess learning outcomes, it is reported as a pedagogical experience documented through teaching materials, student submissions, and instructor feedback.
2.4. Data Preparation and Statistical Analysis
All data processing and analyses were performed in R version 4.6.0, using functions from base packages, including base, stats, and utils [24], as well as the tidyverse R metapackage, version 2.0.0 [25]. When statistical tests or model significance was tested, results were evaluated at α = 0.05. A script containing all code used to produce and present the results included in this article, together with additional analyses conducted during the selection and refinement of the results, was made available as ‘6_manuscript_code.Rmd’ in the “code” folder of the repository [23].
During data preprocessing, the taxon field, which occupied a single column in the original dataset, was split into family, genus, and species, and an additional column combining genus and species was created. Taxonomic classification was checked and updated when applicable using the R Package, rgbif version 3.8.5 [26]. Inconsistencies were corrected mainly in the height, DBH, and growth habit variables. Records identified as dead were removed. After the processing of multiple-stem individuals and the inspection of height and DBH values, records considered likely measurement or data-entry errors were excluded. Additional variables were then derived, including equivalent diameter (√ΣDBH2), basal area (π(DBH/200)2), slenderness (H/DBH), and the occurrence and number of multiple stems below 1.30 m above ground level. For plants with multiple stems below 1.30 m, each individual was treated as a single record, and equivalent diameter was calculated regardless of family, including the Arecaceae and other arborescent plants.
Descriptive analyses were used to characterize the taxonomic and dendrometric structure of the arboretum dataset. Frequency tables were prepared for the most abundant families and genera, and these results were visualized using a treemap relating both taxonomic levels, produced with the R package, treemapify version 2.6.0 [27]. The distributions of height and DBH for Arecaceae and trees were summarized using frequency tables and visualized with histograms. To compare numerical abundance with structural dominance, the most abundant tree families and Arecaceae genera were ranked by number of individuals and total basal area and visualized using bump charts.
The association between the occurrence of multiple stems below 1.30 m above ground and the 10 most frequent botanical families was evaluated using a contingency table. The significance of the association was assessed with a chi-square test, and Pearson’s contingency coefficient was calculated as a measure of association. For the 10 most frequent genera of Fabaceae, the probability of occurrence of multiple stems below 1.30 m above ground was also evaluated as a function of height and genus. For this purpose, a generalized linear model with a binomial distribution and logit link function was fitted. The significance of the explanatory terms was assessed through analysis of deviance, using likelihood-ratio chi-square tests.
Different models were fitted for the genera Roystonea O.F.Cook (Arecaceae) and Carapa Aubl. (Meliaceae) as case studies of height–DBH relationships. For both genera, linear models, quadratic models, and models with log-transformed DBH were fitted to compare alternative representations of the height–DBH relationship. For Roystonea, species was evaluated as a fixed effect, and interactions between species and DBH were tested to assess whether the height–DBH relationship differed among species within the genus. For Carapa, mixed-effects models with arboretum beds as a random intercept were evaluated to describe the relationship between height and DBH while accounting for variation among beds. For this analysis, the dataset was filtered to retain only planting beds with three or more individuals of the genus.
Model evaluation considered goodness-of-fit measures, the Akaike Information Criterion (AIC), the Bayesian Information Criterion (BIC), and residual diagnostics. The AIC and BIC were used to compare candidate models because they balance model fit and model complexity [28]. Lower values indicate a better fit–parsimony trade-off, with the BIC applying a stronger penalty for model complexity [28]. Model performance was also summarized using R2 or marginal and conditional R2 for mixed-effects models, as appropriate. Assumptions were assessed using diagnostic plots and simulated residuals generated with the R package, DHARMa version 0.5.0 [29]. For models with acceptable diagnostics, the significance of relevant model terms was evaluated.
During the analyses and preparation of the manuscript, ChatGPT with the GPT-5.4, 5.5, and 5.6 models [30] was used as a tool to support language revision, translation, refinement of textual structure, condensation of repetitive sections, discussion of alternative formulations for methodological and statistical descriptions, as well as generation, checking, troubleshooting, and refinement of R code. AI assistance was used iteratively and was more substantial in textual revision and organization than in scientific interpretation. All AI-assisted content was reviewed, tested, edited, and validated by the authors, who assume responsibility for the analyses, interpretations, and conclusions of the manuscript.
3. Results
3.1. Arboretum Dendrometric Data as a Teaching Resource
The arboretum dendrometric dataset provided a common empirical framework for the different statistical topics addressed during this course. Because the dataset included categorical, taxonomic, spatial, and quantitative variables, it allowed the same biological context to be modified across successive analytical steps, from data preprocessing and descriptive summaries to hypothesis testing, regression, generalized linear models, mixed-effects models, and diagnostic procedures.
The classroom activities produced a set of reproducible scripts organized according to the pedagogical progression of the course (Supplementary Table S2). These scripts documented the transition from data preparation and exploratory analysis to inferential and model-based approaches, and provided students with a consistent analytical workflow in R.
The assessment-related tasks also generated analytical products that were subsequently reviewed and used to guide the selection and refinement of the results presented in this manuscript (Supplementary Table S3). The submitted R Markdown files documented students’ reproduction and adaptation of several procedures demonstrated during the course, particularly those related to data organization, descriptive statistics, data visualization, and group comparisons. Instructor comments identified difficulties in regression-based tasks, especially in model specification, evaluation of assumptions, and the interpretation of outputs.
3.2. Analytical Outputs for Living Collection Assessment
3.2.1. Taxonomic Composition and Dendrometric Structure
After preprocessing the census data, the final analytical dataset comprised 4621 individuals, including 3007 trees, 1357 individuals of Arecaceae, and 257 other arborescent plants. The subsequent analyses focused mainly on trees and Arecaceae. Therefore, the remaining arborescent plants were retained in the general dataset but were not included in these two group-specific analyses.
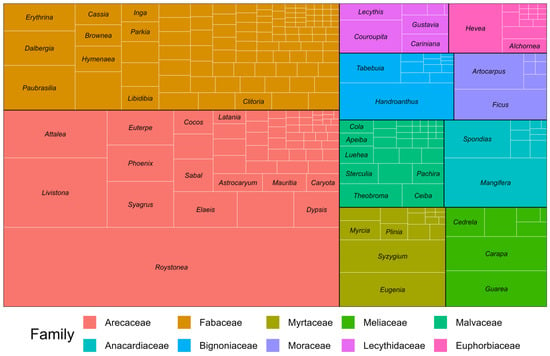
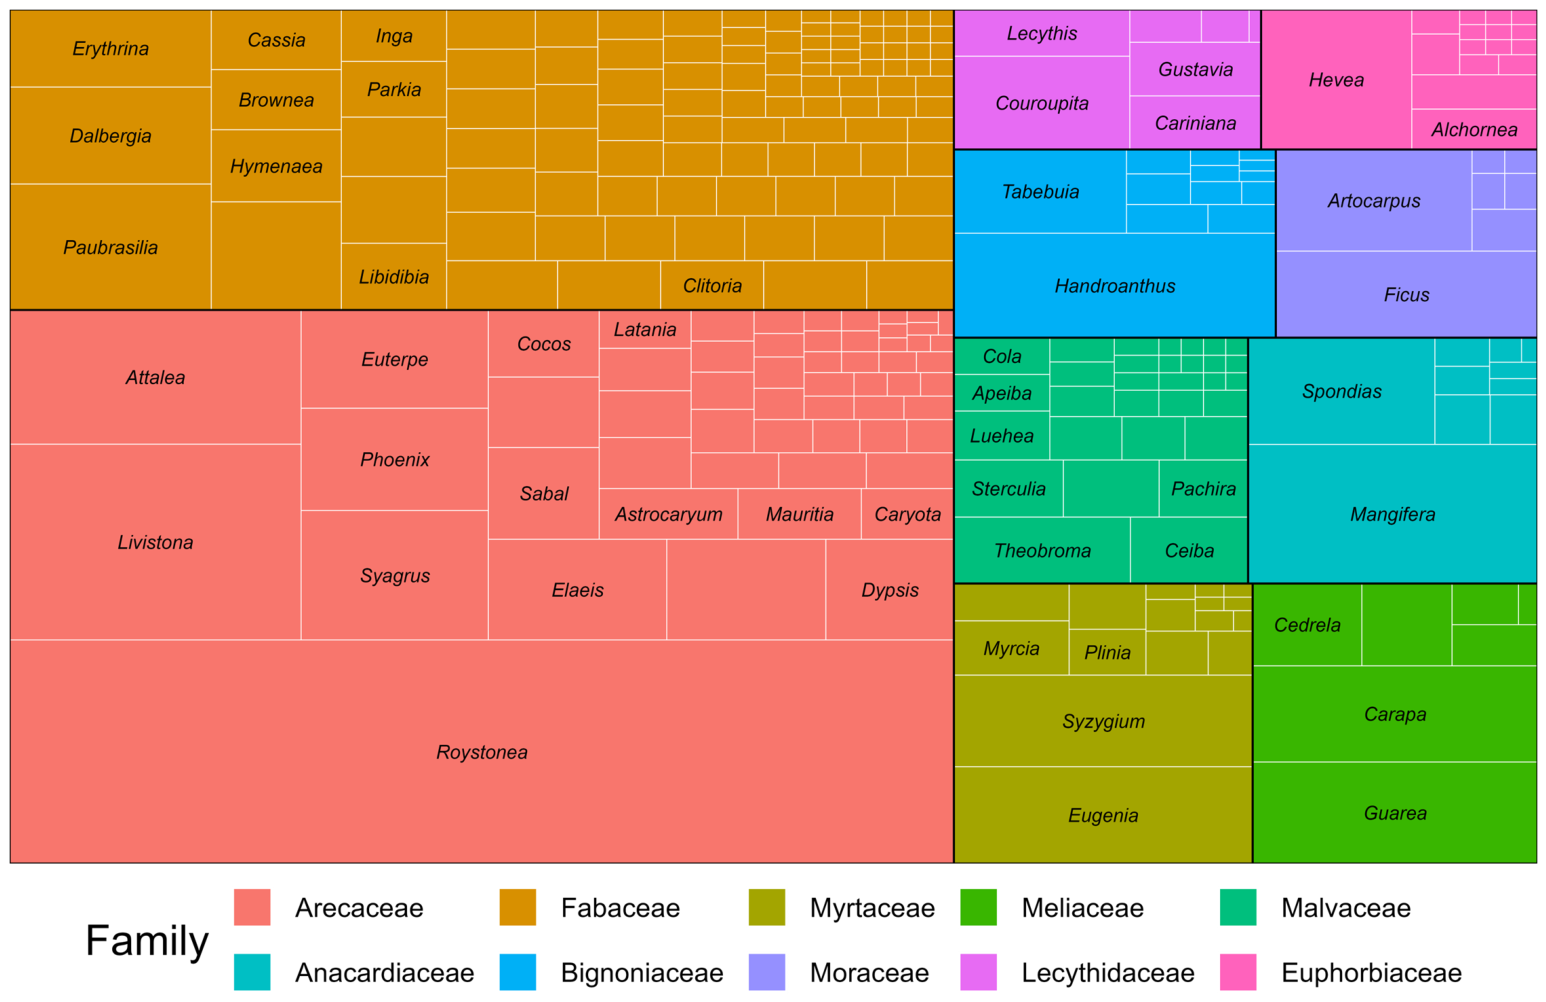
The treemap showed a marked concentration of individuals in a small number of families, especially Arecaceae and Fabaceae, which had the highest abundances in the analyzed dataset (Figure 1). In Arecaceae, abundance was strongly influenced by genera such as Roystonea, Livistona R. Br., Attalea Kunth, Euterpe Gaertn., Phoenix L., and Syagrus Mart. In Fabaceae, individuals were distributed among a larger set of genera, with expressive representation of Paubrasilia Gagnon, H.C. Lima & G.P. Lewis, Dalbergia L.f., Erythrina L., Brownea Jacq., Hymenaea L., and Centrolobium Mart. ex Benth.
Figure 1.
Treemap of individual abundance by genus within the ten most abundant families in the arboretum of the Rio de Janeiro Botanical Garden. Rectangle size is proportional to the number of individuals recorded in each family and genus.
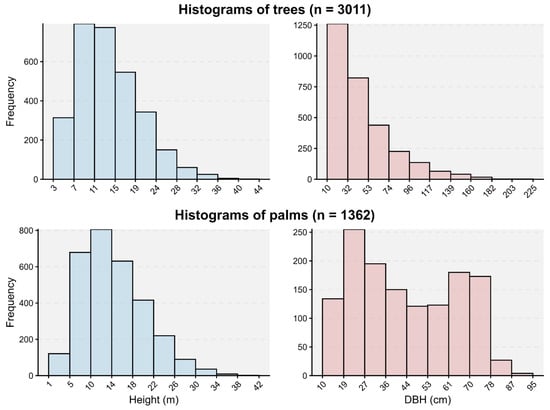
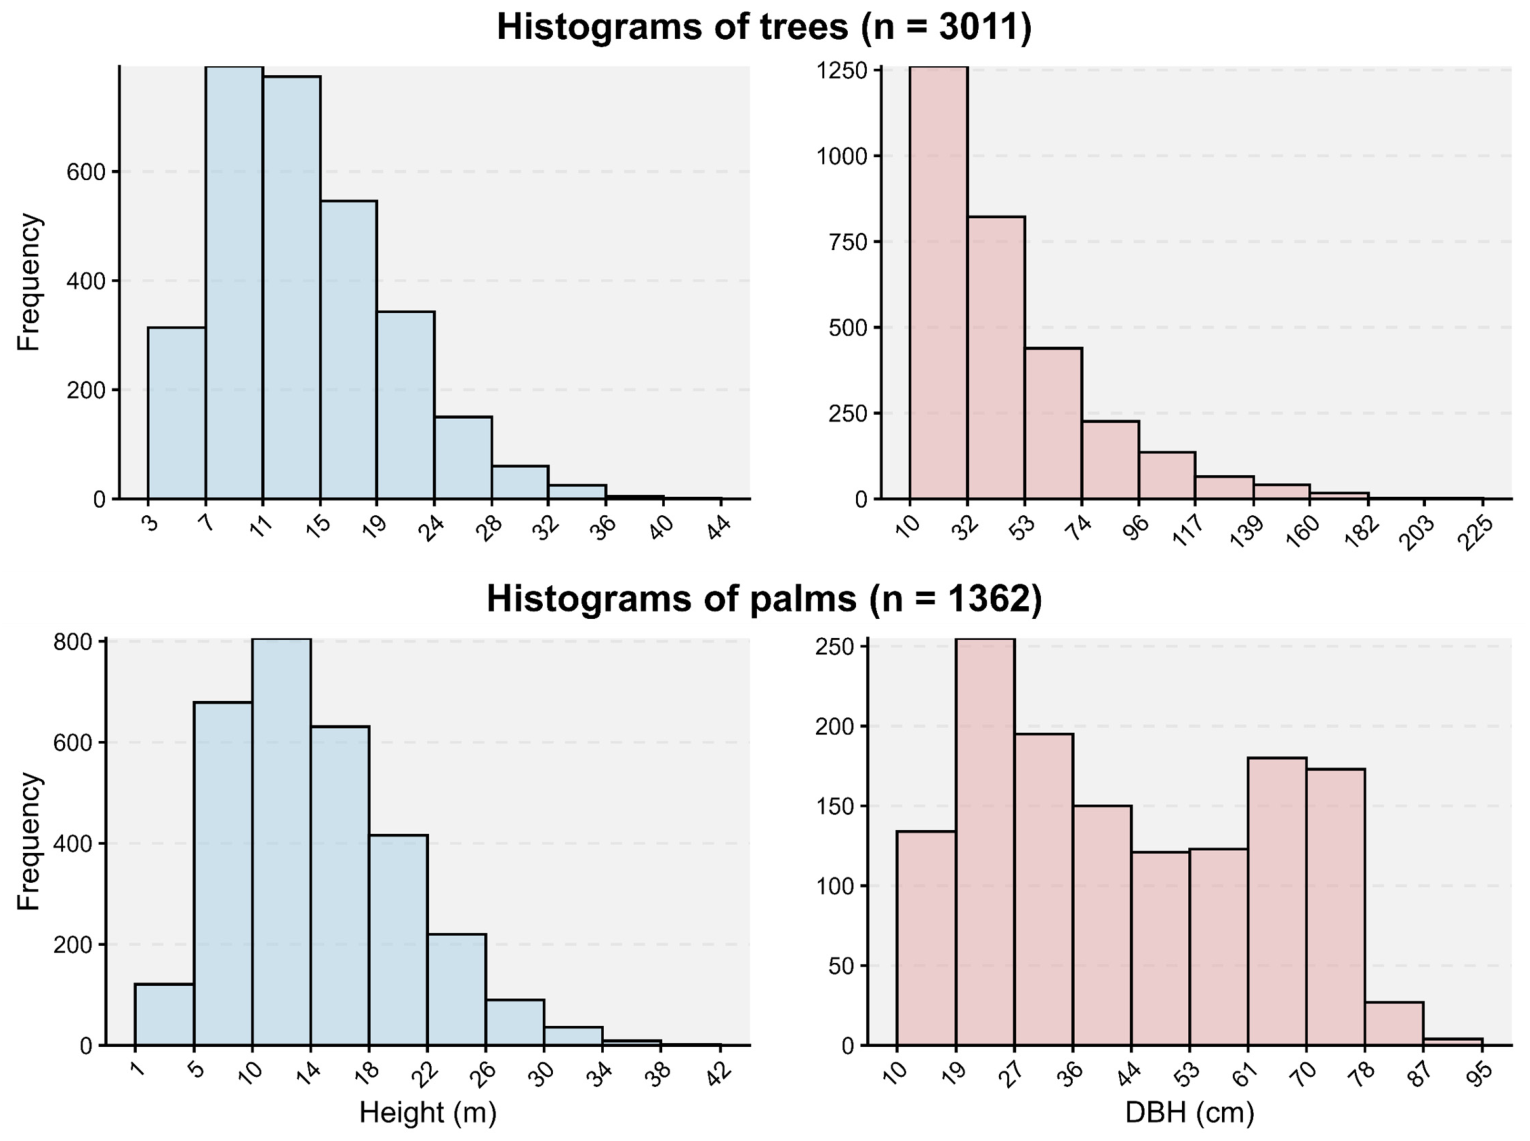
Among the other abundant families, different internal patterns were observed. Anacardiaceae was strongly represented by Mangifera L. and Spondias L.; Moraceae by Ficus L. and Artocarpus J.R. Forst. & G. Forst.; Bignoniaceae by Handroanthus Mattos and Tabebuia Gomes ex D.C.; and Euphorbiaceae by Hevea Aubl. In contrast, Lecythidaceae, Malvaceae, Myrtaceae, and Meliaceae were more evenly distributed among their genera. Some families were dominated by one or a few genera, whereas others showed a more even distribution of individuals across several genera. The height and DBH histograms indicated distinct dendrometric patterns between trees and Arecaceae (Figure 2). Among trees, both height and DBH showed right-skewed distributions, with a higher concentration of individuals in the lower and intermediate classes and a progressive reduction in frequency toward the upper classes. The DBH distribution was particularly concentrated near the lower classes defined by the census inclusion criterion, followed by a long right tail representing individuals with larger diameters.
Figure 2.
Frequency distributions of height and diameter at breast height (DBH) for trees and Arecaceae individuals in the arboretum of the Rio de Janeiro Botanical Garden. The panels show height (m) distributions on the left and DBH (cm) distributions on the right.
For Arecaceae, height was more broadly distributed across classes than for trees, although most individuals in both groups were concentrated approximately between 7 and 20 m. In contrast to the DBH distribution of trees, the Arecaceae histogram showed a bimodal pattern. Comparison with genus-level summaries indicated that the second DBH peak coincided with the central values observed for Roystonea (median = 66.3 cm; mean = 63.0 cm), whereas the first peak was closer to those of the remaining Arecaceae (median = 28.0 cm; mean = 31.2 cm). Thus, the high abundance and larger diameters of Roystonea strongly influenced the DBH distribution observed for Arecaceae.
3.2.2. Numerical and Structural Dominance
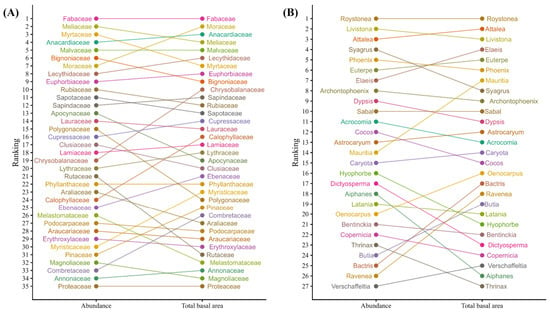
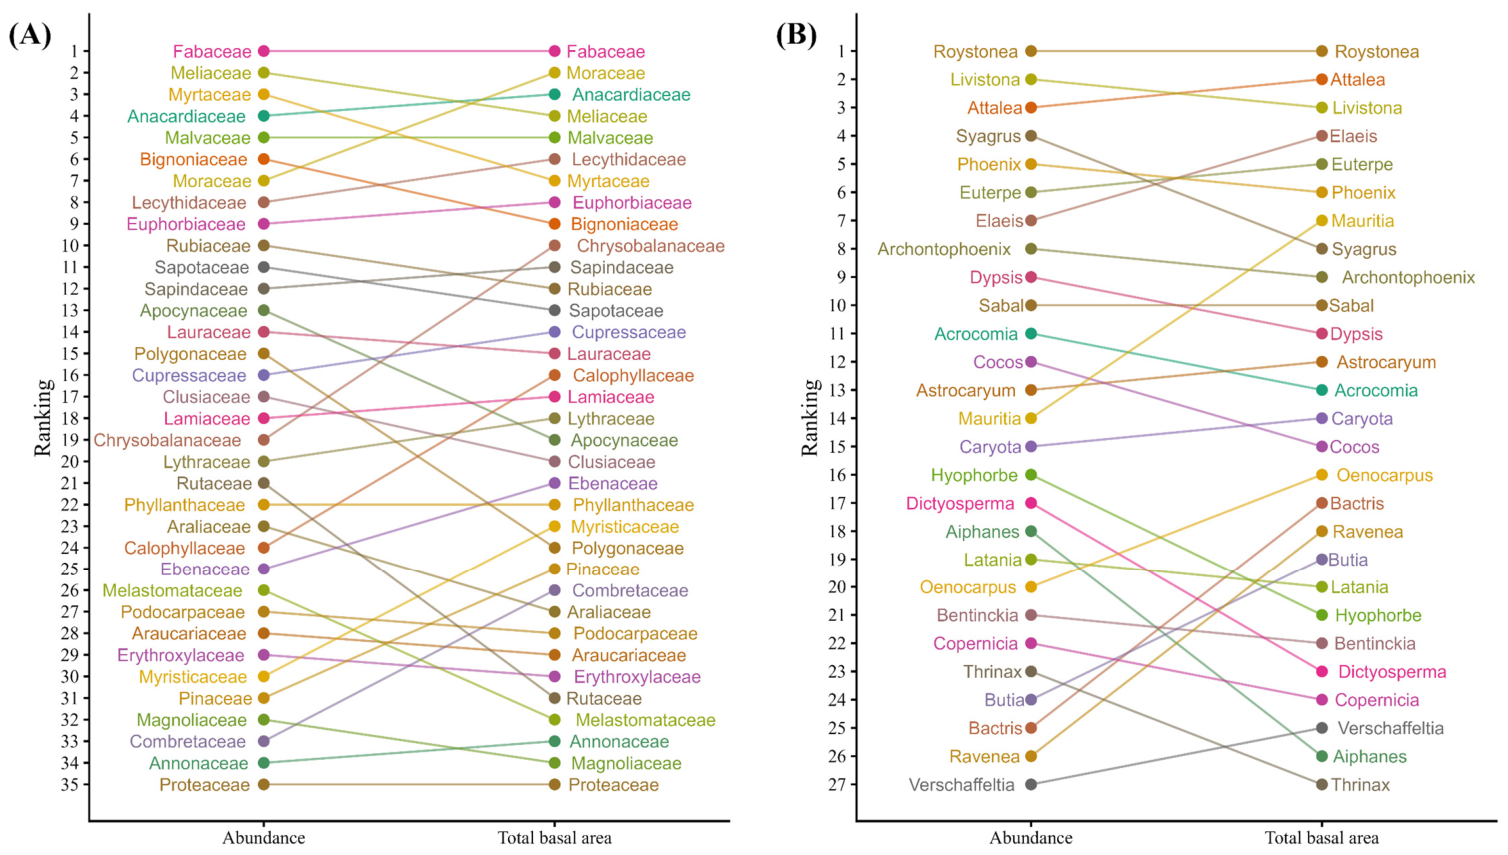
The comparison between abundance and total basal area rankings revealed differences in the relative positions of Arecaceae genera and tree families (Figure 3). Among Arecaceae, Roystonea ranked first in both abundance (n = 544) and total basal area. Livistona and Attalea also occupied the highest positions in both rankings, with a slight inversion between metrics: Livistona ranked second in abundance and third in total basal area, whereas Attalea ranked third in abundance and second in total basal area. Other Arecaceae genera showed larger discrepancies between the two metrics. For instance, Mauritia L.f. ranked 14th in abundance and 7th in total basal area, while Ravenea C.D.Bouché ranked 26th in abundance and 18th in total basal area. In contrast, Syagrus ranked 4th in abundance and 8th in total basal area, and Cocos L. ranked 12th in abundance and 15th in total basal area.
Figure 3.
Comparison of the ranking positions of taxonomic groups based on abundance and total basal area in the arboretum of the Rio de Janeiro Botanical Garden. (A) Tree families represented by 10 or more individuals. (B) Arecaceae genera represented by 5 or more individuals. Lines connect the ranking positions of each taxonomic group across the two metrics.
Among tree families, Fabaceae ranked first in both abundance and total basal area. Malvaceae consistently occupied fifth place in both rankings. Moraceae exhibited one of the largest increases between the two metrics, moving from seventh in abundance to second in total basal area. Conversely, Myrtaceae displayed the opposite pattern, ranking third in abundance and seventh in total basal area. Chrysobalanaceae also advanced in position, from 19th in abundance to 10th in total basal area, whereas Rubiaceae dropped from 10th to 12th, respectively. Thus, taxonomic groups with the highest number of individuals were not always those with the highest total basal area.
3.2.3. Multiple-Stem Occurrence
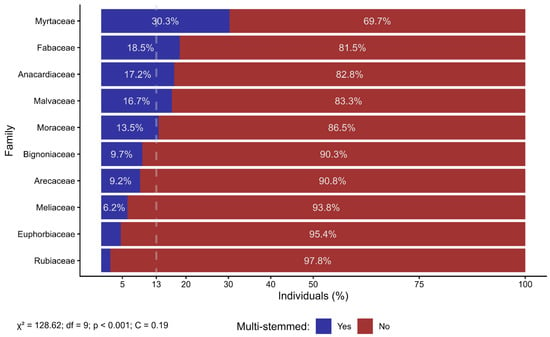
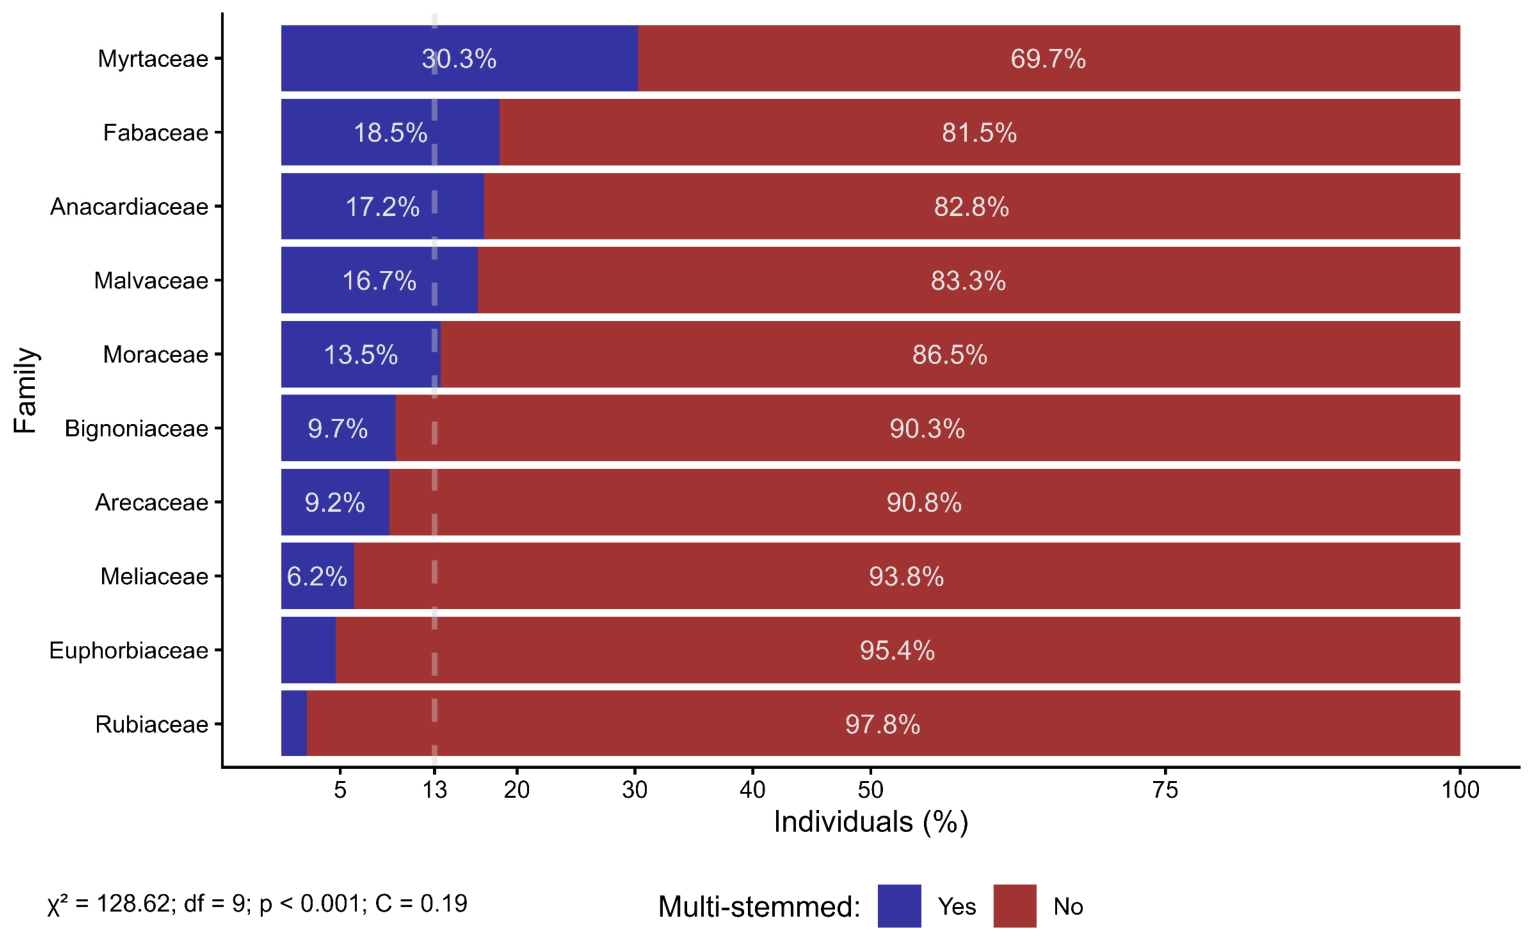
The occurrence of multiple stems below 1.30 m above ground varied among the ten most abundant families in the dataset (Figure 4). However, the association between family and stem condition was weak, as indicated by Pearson’s contingency coefficient (C = 0.190, p < 0.001). The mosaic plot revealed that individuals with multiple stems were not uniformly distributed among families. Myrtaceae and Fabaceae exhibited the clearest positive deviations for the presence of multiple stems, whereas Arecaceae, Rubiaceae, Meliaceae, and Euphorbiaceae displayed a lower occurrence of this condition than expected under independence. These results indicate that stem condition varied among families, although the association was weak.
Figure 4.
Proportion of individuals with and without multiple stems below 1.30 m above ground among the ten most abundant families in the arboretum of the Rio de Janeiro Botanical Garden. The dashed vertical line indicates the overall proportion of individuals with multiple stems in the analyzed families.
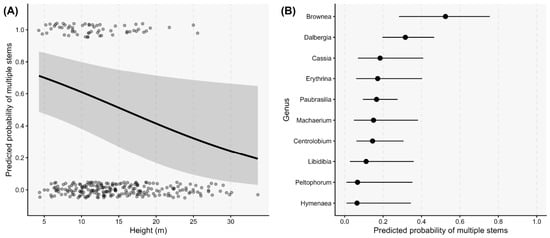
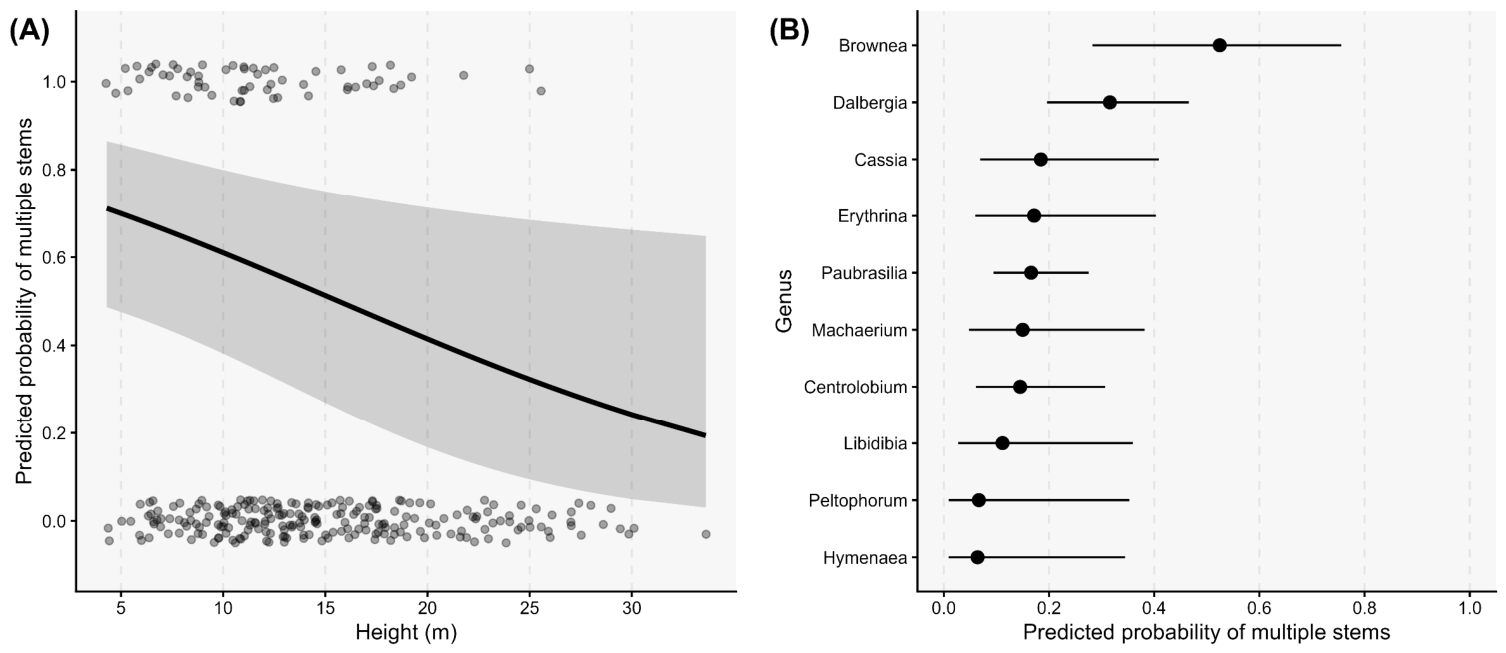
The binomial model indicated that the occurrence of multiple stems below 1.30 m above ground in Fabaceae was associated with both height and genus (Figure 5). Single-term deletion tests showed that height contributed to the model after accounting for genus (LRT = 5.27, df = 1, p = 0.022), while genus remained significant after accounting for height (LRT = 20.02, df = 9, p = 0.018). The predicted probability of multiple stems decreased with increasing height, indicating higher predicted probabilities among shorter individuals (Figure 5A). Genus-level predictions varied among the ten most abundant genera, with the highest estimate observed for Brownea Jacq. and the lowest estimates for Hymenaea L. and Peltophorum (Vogel) Benth. (Figure 5B). However, the overlap among confidence intervals suggests that genus-level differences should be interpreted with caution.
Figure 5.
Predicted probability of multiple stems occurring below 1.30 m above ground level in trees belonging to the ten most frequent Fabaceae genera in the arboretum of the Rio de Janeiro Botanical Garden, estimated using a binomial model. (A) Predicted probability as a function of individual height. Gray points represent the observed binary outcomes, the black line represents the model-predicted probability, and the gray band represents the 95% confidence interval. (B) Predicted probability by genus, where points indicate model estimates and lines indicate confidence intervals.
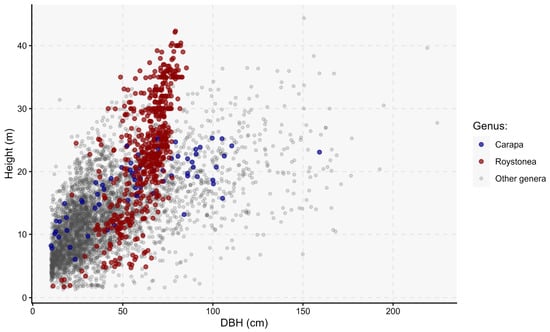
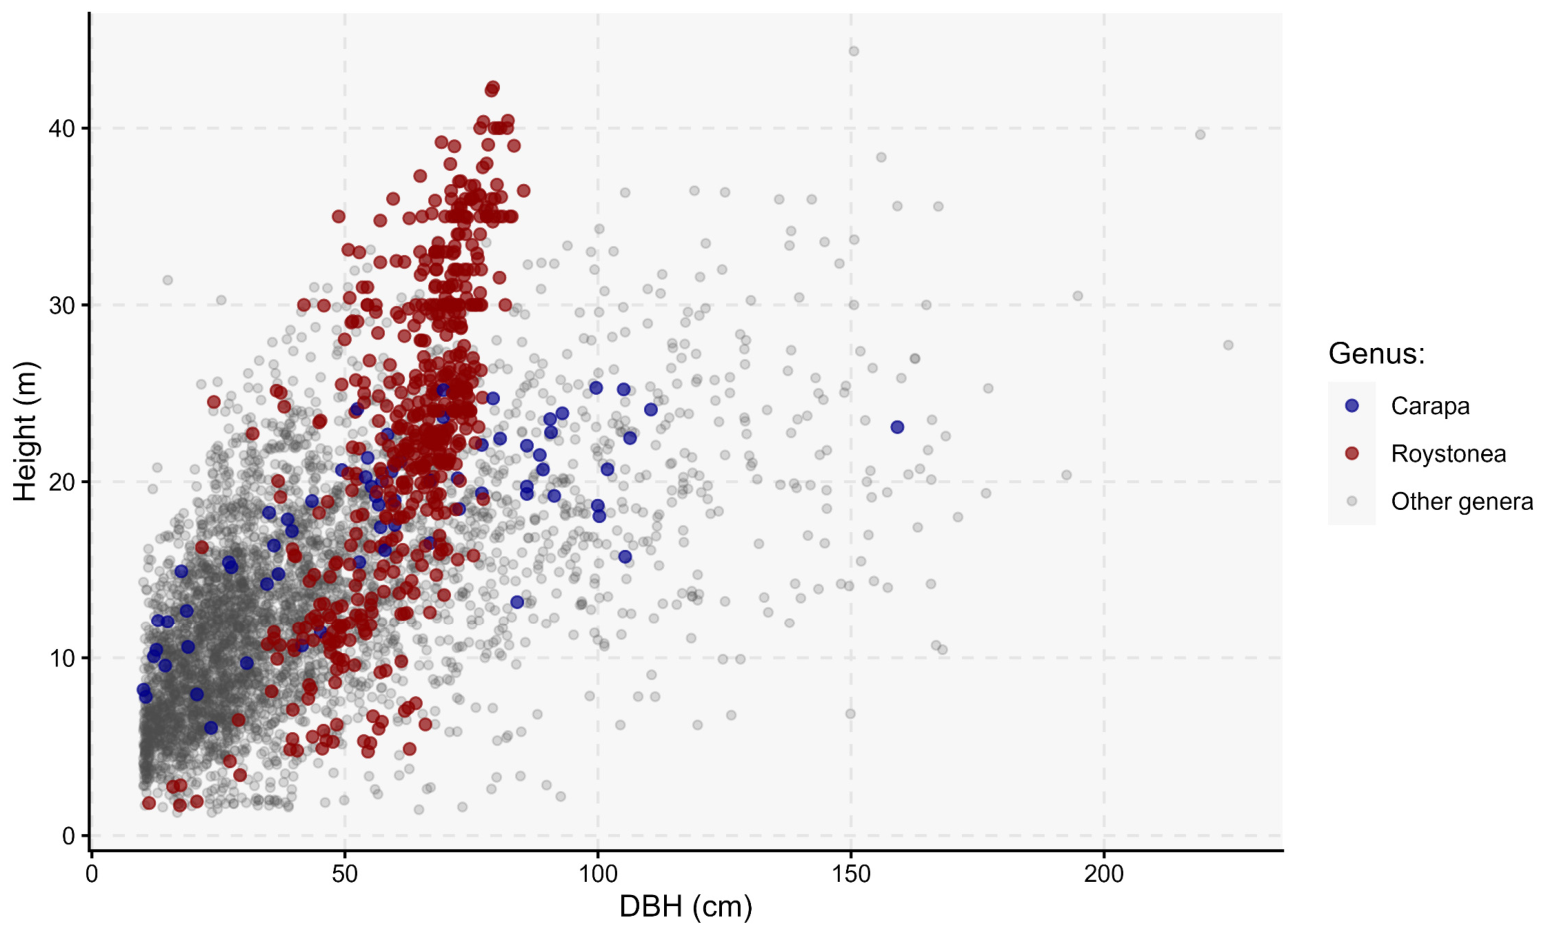
Based on the models fitted during the classes to describe the relationship between DBH and height (5_regression.Rmd) [23], global models including all individuals showed limitations in adequately representing the heterogeneity of the collection (Figure 6). For this reason, models were fitted for more restricted taxonomic groups, using the genera Roystonea, among Arecaceae, and Carapa, among trees, as case studies.
Figure 6.
Relationship between diameter at breast height (DBH) and height for individuals in the arboretum of the Rio de Janeiro Botanical Garden, highlighting the genera Roystonea and Carapa. Gray points represent individuals from other genera.
3.2.4. Height–DBH Relationships
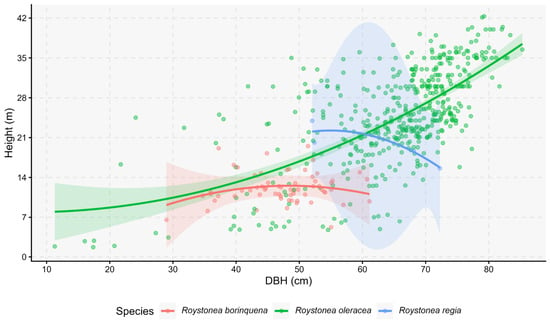
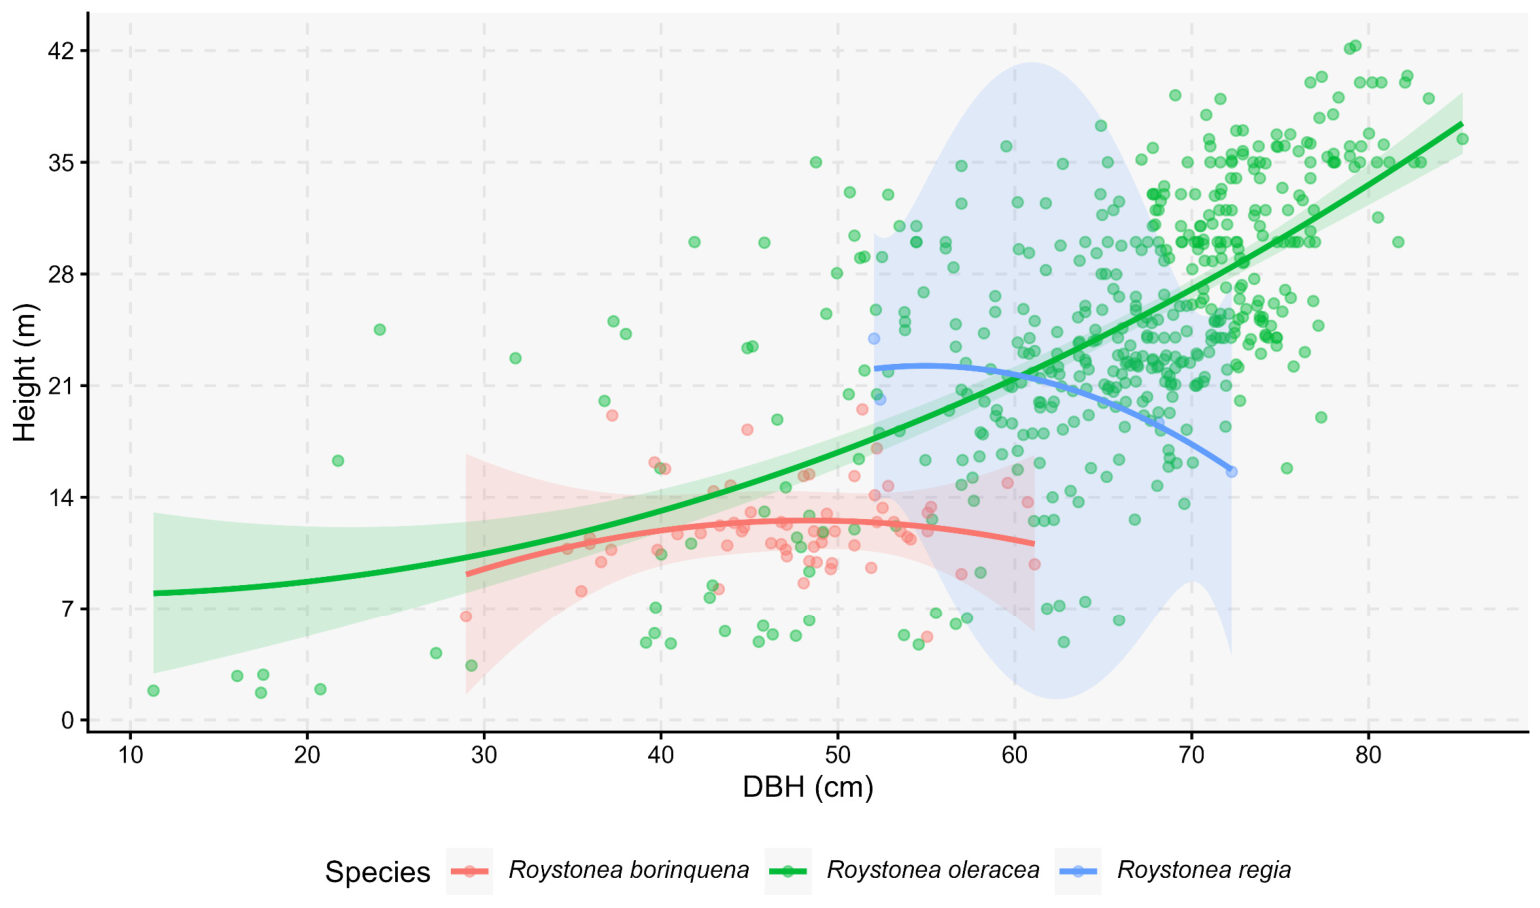
For Roystonea, the analytical subset included 539 individuals with 472 R. oleracea, 63 R. borinquena, and 4 R. regia. Model evaluation revealed that the height–DBH relationship was better represented by a quadratic structure than by either a simple linear or log-transformed DBH model. Incorporating the interaction between species and the quadratic DBH term significantly improved model fit compared with the model without interaction (F = 3.87, p = 0.004). In the final model, species, the quadratic DBH term, and their interaction were significant predictors of height, explaining approximately 55% of the observed variation. Residual diagnostics indicated no major deviations, despite the detection of a few influential observations.
The fitted curves exhibited distinct height–DBH relationships among Roystonea species (Figure 7). The curve for R. oleracea showed a consistent positive, curvilinear pattern across the observed DBH range, closely aligning with the main distribution of the data. In contrast, the curves for R. borinquena (n = 63) and R. regia (n = 4) displayed greater uncertainty and should be interpreted cautiously.
Figure 7.
Predicted height as a function of diameter at breast height (DBH) for Roystonea species, based on a quadratic model with interaction between species and DBH. Points represent observed individuals, lines represent model predictions, and shaded bands represent 95% confidence intervals.
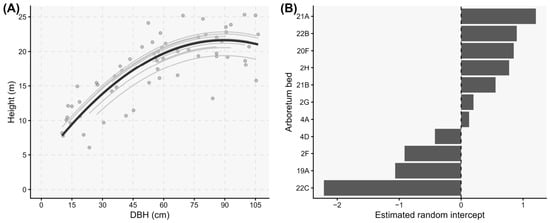
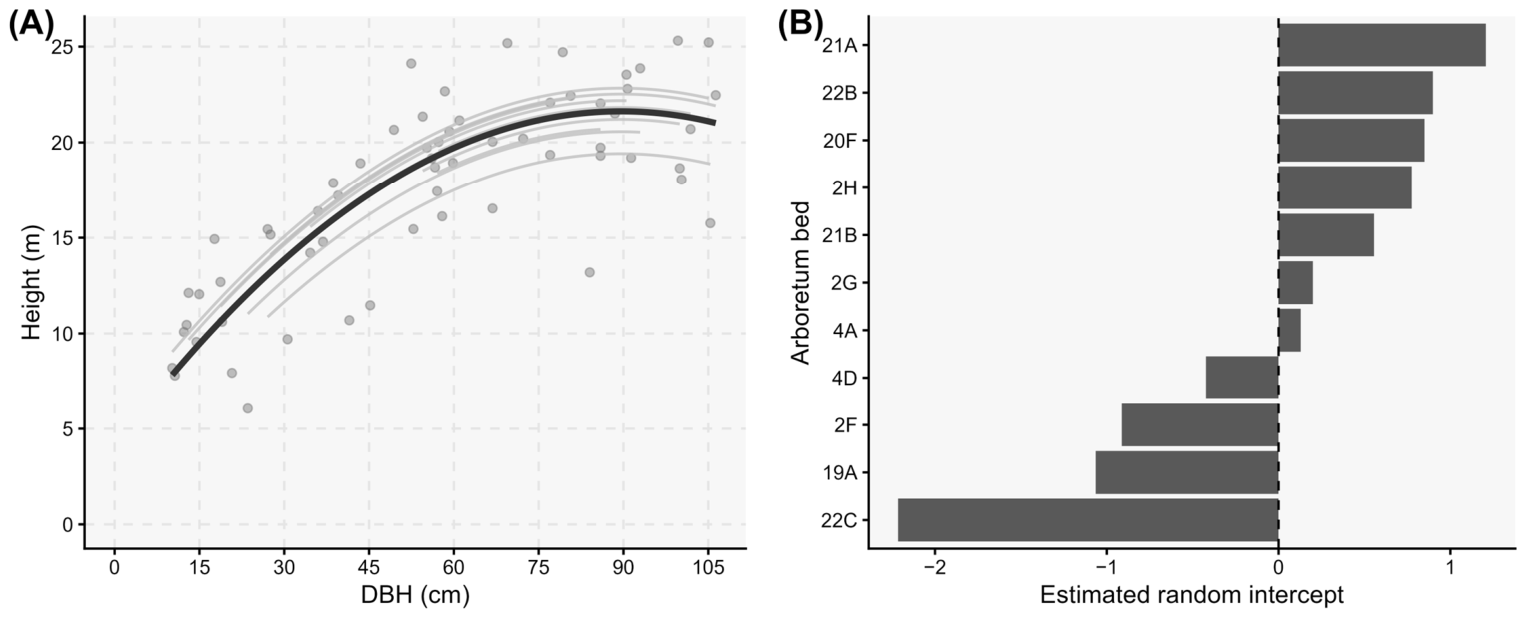
The hypsometric relationship of Carapa individuals cultivated in the arboretum was better described using a quadratic mixed-effects model, with DBH included as a second-degree polynomial fixed effect and arboretum bed included as a random intercept. The model explained 76% of the total variation in height when both fixed and random effects were considered (conditional R2 = 0.76), whereas the fixed effects explained 70% of the variation (marginal R2 = 0.70). The linear and quadratic polynomial components were significant, and the negative quadratic coefficient indicated that height gain decreased as DBH increased, resulting in a curve tending toward stabilization in the larger diameter classes (Figure 8). The estimated random intercepts indicated variation among beds after accounting for DBH ranging from −2.21 m in bed 22C to +1.21 m in bed 21A relative to the population-level curve, resulting in a maximum model-predicted difference of 3.42 m among beds for individuals with the same DBH.
Figure 8.
Height–DBH relationship for Carapa individuals based on a quadratic mixed-effects model with arboretum bed as a random intercept. (A) Observed individuals and fitted curves; the black line represents the population-level prediction and gray lines represent bed-specific predictions. (B) Arboretum beds ranked by estimated random intercept.
4. Discussion
4.1. Arboretum Dendrometric Data as a Teaching Resource
Using the arboretum census throughout the course made it possible to treat statistical analysis as an integral part of biological interpretation, rather than as a sequence of disconnected procedures. Unlike simplified teaching datasets, the arboretum census also preserved challenges inherent to real-world data, including data-quality issues, heterogeneous biological groups, unbalanced observations, and limitations in the applicability and interpretation of statistical models. This pedagogical framework is consistent with previous experiences in biology education that emphasize the value of linking statistical methods to disciplinary questions and real-world datasets [11,13]. The course structure, scripts available in the open repository [23], and analytical examples presented here may support future offerings of statistics disciplines at ENBT and be adapted by other educational institutions or botanical gardens with comparable datasets.
The need for instructor feedback during the final assignments highlights an important feature of teaching with authentic data. Producing statistical outputs does not necessarily ensure that the analyses are appropriate or biologically interpretable [31]. Decisions concerning model adequacy, analytical assumptions, and the limits of inference require explicit attention during instruction [31,32]. However, because the feedback was not examined through a standardized assessment framework, it identifies areas requiring instructional support rather than providing comparative evidence of student difficulty.
Although developed for graduate training, selected activities may also be adapted to other educational levels, particularly exercises involving tree measurements, DBH and basal-area calculations, data visualization, and interpretation of frequency distributions. At the JBRJ, such adaptations could support environmental education and undergraduate research while promoting engagement with plant diversity and plant awareness [33].
4.2. Analytical Outputs for Living Collection Assessment
4.2.1. Taxonomic Composition and Dendrometric Structure
The taxonomic composition of the arboretum cannot be understood by considering only its role in ex situ plant conservation. The abundance of particular families and genera also reflect the role of the JBRJ as both a living collection and historic garden, shaped by its planting history and curatorial and management decisions (Figure 1) [17]. This interpretation is consistent with previous studies showing that approximately 40% of the species in the JBRJ living collection are non-native to Brazil [17] and that these taxa contribute substantially to its structural dominance and aboveground carbon stocks [6]. These findings are also relevant to collection management implications because prioritization criteria may consider not only rarity or extinction risk, but also historical, landscape, educational, and heritage values.
Nevertheless, the interpretation of species origin also requires caution. The JBRJ inventory classifies species according to whether they are native to Brazil [17], whereas a biogeographical classification considers their natural distribution more specifically. Consequently, species originating from other Brazilian biomes may still be considered non-native to the Atlantic Forest site where the arboretum is located [34,35,36].
Although the DBH distribution of trees resembled the reverse-J pattern commonly reported for tropical forests [37,38], it should not be interpreted as evidence of age structure or natural regeneration in the arboretum (Figure 2). In this living collection, the observed distribution also reflects planting history, management practices, and the DBH ≥ 10 cm census inclusion criterion. This caution is particularly relevant in managed tree collections and urban forests, where size distributions may reflect human interference as well as demographic processes [39,40]. The contrast between trees and Arecaceae further indicates that height and DBH provide complementary views of collection structure. In particular, the DBH distribution of Arecaceae was strongly influenced by their distinct stem architecture and by the abundance of large-diameter Roystonea individuals.
The taxonomic composition and the DBH and height distributions characterize the current state of the living collection and provide a baseline for continued monitoring. Future comparisons may reveal changes in the numerical representation of taxonomic groups, shifts in size structure, growth of surviving individuals, and the loss or replacement of large trees [9,40]. These changes may help identify taxonomic groups or components of the collection undergoing structural decline, expansion, or renewal and, when interpreted alongside climatic and environmental records, may support the investigation of their associations with changes in climate and local growing conditions [2,15,40].
From a management perspective, individuals in the upper height and DBH classes may be prioritized for monitoring because of their landscape or historical importance and [41], when located near circulation areas, the potential consequences of structural failure [42,43]. However, size alone is not sufficient for tree risk assessment. Further evaluation should include phytosanitary and structural inspections, the spatial analysis of tree location and potential targets, and other site-specific conditions [41]. Incorporating these variables into future censuses or complementary inventories could support a more comprehensive assessment of tree condition and management priorities within the arboretum.
4.2.2. Numerical and Structural Dominance
Fabaceae ranked first among tree families in both abundance and total basal area, indicating its importance to both the numerical composition and structural organization of the arboretum (Figure 3A). The family is also frequently among the most abundant and dominant groups in tropical forest inventories [44,45,46]. This agreement between metrics distinguishes Fabaceae from other well-represented families in the arboretum whose numerical abundance was not matched by an equivalent contribution to total basal area.
The prominence of Fabaceae also has a conservation-related dimension because Paubrasilia echinata, the most abundant species of the family in the arboretum, is currently classified as Endangered in Brazil [47]. Its numerical representation provides a basis for curatorial and dendrometric monitoring, although the ex situ conservation value of these individuals also depends on their provenance, genetic diversity, and collection history [5,48].
The contrasting rankings of Myrtaceae and Moraceae illustrate why abundance alone does not adequately describe structural dominance. Myrtaceae was represented by numerous relatively small individuals, a pattern compatible with the occurrence of many species of this family in lower forest strata and shaded environments in the Atlantic Forest [49,50]. Conversely, the high basal-area ranking of Moraceae reflected the presence of large individuals, particularly Ficus. This genus includes long-lived and hemiepiphytic trees capable of producing adventitious roots and complex trunk structures that contribute to large diameters and basal area [51,52].
Among Arecaceae, Roystonea ranked first in both abundance and total basal area, while Attalea and Livistona showed only minor shifts between the two rankings (Figure 3B). This relative consistency indicates that a small number of abundant genera strongly influence the structural profile of Arecaceae in the arboretum. These patterns likely reflect a combination of stem architecture, planting history, and the long-standing role of palms in the arboretum landscape [17,53].
Together, abundance and total basal area provide complementary information for managing and planning the living collection, which may lead to different priorities. Numerically well-represented groups may require attention to their taxonomic composition and redundancy [5], whereas groups represented by a few large individuals may have disproportionate structural, landscape, or historical importance [41]. Consequently, the loss of only a few large trees could substantially alter the structural and landscape character of the collection without a major reduction in the total number of individuals. These metrics may therefore inform replacement and planting decisions but should be complemented by field-based assessments of individual tree health and structural condition [42,43].
4.2.3. Multiple-Stem Occurrence
The weak association between botanical family and the occurrence of multiple stems below 1.30 m indicated that taxonomic identity accounts for only part of this architectural variation (Figure 4). Multiple-stemmed forms may result from species-specific growth habits and resprouting capacity, but they can also be influenced by disturbances and growing conditions, including wind exposure, fire, light availability, and soil nutrient availability [54,55,56]. The differences observed among families in the JBRJ arboretum may therefore reflect both the growth habits and the ecological characteristics of the cultivated groups. Families associated with understory conditions [57], or with high resprouting capacity, such as Myrtaceae [58] and Fabaceae [59,60], may express greater architectural and phenotypic plasticity. In contrast, families commonly represented by canopy or emergent trees, such as Lecythidaceae [61] and Meliaceae [62], are more likely to retain architectural strategies associated with vertical investment in a main stem.
The genus-level differences in the probability of multiple stems are biologically plausible given the remarkable diversity of Fabaceae (Figure 5B), one of the largest angiosperm families, comprising approximately 765 genera and 19,500 species [63,64]. This taxonomic diversity encompasses trees, shrubs, lianas, and herbs with contrasting growth forms, branching patterns, phenological strategies, and responses to environmental conditions [65,66,67].
The association with height may therefore reflect differences among genera in architecture and mature size (Figure 5A), with multi-stemmed forms occurring more frequently among smaller plants and genera. This interpretation is supported by the higher probability estimated for Brownea, a genus composed mainly of small understory trees, and by the predominance of Brownea grandiceps [68].
From a management perspective, the identification of trees with multiple stems provides useful information about tree architecture and may support the selection of individuals for closer field inspection. Multiple stems should not be interpreted as defective or evidence of risk by itself [69], particularly when they represent the natural growth form of a species. Management concern depends instead on the characteristics of stem unions and on associated defects, such as codominant stems with narrow V-shaped unions, included bark, decay, cavities, or previous branch failures [70,71]. Mapping and monitoring individuals with multiple stems may therefore support periodic structural assessment and, when appropriate, early formative pruning, while helping ensure that management interventions respect the natural architecture of each taxonomic group [72].
4.2.4. Height–DBH Relationships
The broad variation in height–DBH patterns across the living collection (Figure 6) illustrates why a single global relationship would not adequately represent its taxonomic heterogeneity and supports the use of taxon-specific models.
Among Roystonea species, the height–DBH relationship in R. oleracea provided the most consistent basis for interpretation because it was better represented in the dataset and covered a broader dendrometric gradient (Figure 7). The observed pattern is consistent with the description of the species as a large, single-stemmed palm capable of reaching substantial height and diameter under favorable conditions [73,74]. In contrast, the fitted curves for R. regia and R. borinquena should be regarded as exploratory because their smaller number of individuals and more restricted dendrometric ranges provide less information about their height–DBH relationships. The interaction between species and DBH nevertheless indicates that a single relationship should not be assumed to represent all three species.
These results suggest that for collection management, species-specific allometric models may help describe structural patterns and identify individuals or groups that deviate from expected trends [75,76], but they should be considered complementary to field inspection and tree health assessment. This caution is especially relevant for palms, for which external dimensions alone may be insufficient to assess mechanical condition or stability [77].
For Carapa, the saturating relationship is consistent with height–diameter patterns commonly reported for tropical forests (Figure 8A), in which height increments tend to decline as stem diameter increases [8,78,79]. The additional variation associated with planting beds is also relevant because most sampled individuals occur along the same walkway (Figure 8B). The difference between the marginal and conditional R2 values indicate that the random effect captured variation among arboretum beds beyond that explained by DBH alone. This variation may be related to local growing conditions, competition, planting history, or management, suggesting that height–DBH relationships may vary among arboretum beds even for taxonomically related and closely located individuals.
The Roystonea and Carapa models show that height–DBH relationships are particularly useful for well-represented taxa of ecological, ornamental, or economic interest, as they may provide taxon-specific references for cultivation, collection management, and monitoring-oriented research. This applies to Carapa guianensis, a species of silvicultural and economic importance because of its seed oil and timber [80], and to Roystonea species, which have a prominent role in tropical landscaping [73]. When height and DBH are remeasured for the same individuals, the resulting longitudinal data could be used to characterize growth trajectories and determine whether height–DBH relationships remain stable or vary in association with location, management, and environmental conditions [2,9,40]. The large number of R. oleracea individuals in the JBRJ arboretum offers a particularly valuable basis for developing more specific models and examining how age, site conditions, and management history influence its dendrometric development.
4.3. Limitations and Future Directions
Although this study was not designed as a formal Scholarship of Teaching and Learning investigation, it shares features of reflective pedagogical practice by making the teaching materials, analytical scripts, and student-generated outputs publicly available [23,81,82]. Its main limitation as an educational report is the absence of a formal evaluation of learning outcomes, such as pre- and post-course assessments or measures of knowledge retention [82]. Future offerings of the course could incorporate structured assessment instruments to evaluate the evolution of students’ statistical understanding throughout the course, particularly for advanced topics such as model selection, diagnostic procedures, and the interpretation of regression-based analyses.
The main limitation of the dataset is that it represents a single census conducted in 2021–2022 and therefore characterizes the collection at that moment rather than its dynamics over time. A further limitation is its restricted set of variables, which primarily describes plant size and taxonomic composition. To address these limitations, continued monitoring should include repeated dendrometric measurements and consistent records of recruitment, mortality, removal, replacement, and management interventions [2,9,40]. Future assessments should also incorporate plant-level variables related to phytosanitary status, structural integrity, and reproductive phenology [2,42,43,83], together with accession history [5]. Environmental variables, including soil conditions, light availability, temperature, rainfall, and exposure to extreme events, would further allow changes in plant growth and condition to be examined in relation to local environmental and climatic variation [84,85,86].
Because the analyses were developed within the scope of the course, they focused on selected statistical methods and did not provide a comprehensive assessment of spatial dependence, complex nonlinear relationships, heterogeneous growing conditions, multivariate patterns, or other sources of variation within the arboretum. With the collection of additional plant-level and environmental data, future studies could extend the approaches presented here by applying multivariate, spatial, and multilevel models to distinguish variation among taxa, planting beds, and individual plants [40,78,85]. Once repeated measurements become available, longitudinal methods could additionally account for variation among individuals and measurement periods [2,9].
5. Conclusions
This study documents two complementary applications of a pre-existing dendrometric census: as an authentic dataset for teaching applied statistics and as a quantitative baseline for living collection assessment. In the exploratory educational component, data from the JBRJ arboretum provided a common biological context for applying statistical procedures, interpreting their outputs, and developing reproducible analytical workflows. The course materials and analytical examples may be reused and adapted in future courses, including through closer integration with field activities to connect data analysis with the observation and measurement of living plants.
From the perspective of the living collection, the analyses characterized its current taxonomic composition and dendrometric structure, identified patterns relevant to management-oriented interpretation, and established variables and analytical procedures that can be applied in future reassessments. These results provide a basis for structuring continued monitoring through repeated measurements and the incorporation of health, structural, spatial, environmental, and curatorial information. Over time, such an expanded framework may support the assessment of changes in the collection, inform management and ex situ conservation planning, and contribute to investigating species responses to changing environmental conditions.
Supplementary Materials
The following supporting information can be downloaded at https://www.mdpi.com/article/10.3390/jzbg7040045/s1. All R scripts, R Markdown files, and the corresponding outputs used to produce the analyses and figures presented in this study are available in the GitHub repository, version 1.0.0 [23]. Table S1. Course schedule, statistical topics, and pedagogical progression of the Applied Statistics for Botany course using arboretum dendrometric data; Table S2. Scripts and analytical procedures used in classroom demonstrations with the Rio de Janeiro Botanical Garden arboretum dendrometric data; Table S3. Student-generated analytical products and their potential relevance for the Rio de Janeiro Botanical Garden arboretum monitoring and management.
Author Contributions
Conceptualization, J.M.A.; methodology, J.M.A. and B.C.K.; software, J.M.A.; validation, L.C.M.L. and B.C.K.; formal analysis, J.M.A., L.R.T.B., J.C., M.C., Á.D.P.-C., N.C.C., L.F.F., L.R., R.A.S.M.M., M.V.C.d.S.O. and L.G.M.P.d.S.; investigation, B.C.K.; resources, B.C.K.; data curation, J.M.A. and B.C.K.; writing—original draft preparation, J.M.A., L.C.M.L., L.R.T.B., J.C., M.C., Á.D.P.-C., N.C.C., L.F.F., L.R., R.A.S.M.M., M.V.C.d.S.O. and L.G.M.P.d.S.; writing—review and editing, J.M.A., L.C.M.L., L.R.T.B., J.C., M.C., Á.D.P.-C., N.C.C., L.F.F., L.R., R.A.S.M.M., M.V.C.d.S.O., L.G.M.P.d.S. and B.C.K.; visualization, J.M.A., L.R.T.B., J.C., M.C., Á.D.P.-C., N.C.C., L.F.F., L.R., R.A.S.M.M., M.V.C.d.S.O. and L.G.M.P.d.S.; supervision, J.M.A. and B.C.K.; project administration, J.M.A. and B.C.K.; funding acquisition, B.C.K. All authors have read and agreed to the published version of the manuscript.
Funding
This research was funded by Coordenação de Aperfeiçoamento de Pessoal de Nível Superior—Brasil (CAPES), Finance Code 001, and the National Council for Scientific and Technological Development—CNPq (Grants: 141398/2025-6 to L.G.M.P.S., 140795/2026-0 to Á.D.P.-C., 141748/2025-7 to M.C., 131193/2025-2 to N.C.C., 140433/2026-0 to L.F.F., 131157/2025-6 to R.A.S.M.M.).
Data Availability Statement
The raw and processed data used in this study are published and available in the GitHub repository, version 1.0.0 [23].
Acknowledgments
We thank the JBRJ Directorate of Knowledge, Environment, and Technology (DICAT), especially the Coordination for Green Area Conservation (CCAV), as well as the Coordination for Visitation (CV) and the Coordination for Living Collections (CCV), for their support during this work. ChatGPT, using the GPT-5.4, 5.5 and 5.6 models, was used as a tool to support language revision, refinement of textual structure, translation, discussion of methodological and statistical approaches, and the generation, checking, and refinement of R code. The authors reviewed and edited the outputs and take full responsibility for the content of this publication.
Conflicts of Interest
The authors declare no conflicts of interest.
References
- Breman, E.; Ballesteros, D.; Castillo-Lorenzo, E.; Cockel, C.; Dickie, J.; Faruk, A.; O’Donnell, K.; Offord, C.A.; Pironon, S.; Ulian, T. Plant Diversity Conservation Challenges and Prospects—The Perspective of Botanic Gardens and the Millennium Seed Bank. Plants 2021, 10, 2371. [Google Scholar] [CrossRef] [Scilit]
- Yajima, M.; Murray, M.; Chondrogiannis, C.; Waldren, S.; McElwain, J. A framework for long-term environmental monitoring using living plant collections in botanic gardens: A global review and case study from Trinity College Botanic Garden. Plants People Planet 2025, 7, 954–968. [Google Scholar] [CrossRef] [Scilit]
- Faraji, L.; Karimi, M. Botanical gardens as valuable resources in plant sciences. Biodivers. Conserv. 2022, 31, 2905–2926. [Google Scholar] [CrossRef] [Scilit]
- Cano, Á.; Powell, J.; Aiello, A.S.; Andersen, H.L.; Arbour, T.; Balzer, A.; Bauer, D.S.; Bugarchich, J.; Cano, F.; Contreras, M.P.; et al. Insights from a century of data reveal global trends in ex situ living plant collections. Nat. Ecol. Evol. 2025, 9, 214–224. [Google Scholar] [CrossRef] [Scilit]
- Mounce, R.; Smith, P.; Brockington, S. Ex situ conservation of plant diversity in the world’s botanic gardens. Nat. Plants 2017, 3, 795–802. [Google Scholar] [CrossRef] [Scilit]
- Kurtz, B.C.; de Almeida, T.M.H.; Coelho, M.A.N.; Deccache, L.S.J.; Tortorelli, R.M.; Gonzaga, D.R.; Madureira, L.K.; Guedes-Oliveira, R.; Barros, C.F.; de Siqueira, M.F. Quantifying the Carbon Stocks in Urban Trees: The Rio de Janeiro Botanical Garden as an Important Tropical Carbon Sink. J. Zool. Bot. Gard. 2024, 5, 579–589. [Google Scholar] [CrossRef] [Scilit]
- De Cáceres, M.; Martín-Alcón, S.; González-Olabarria, J.R.; Coll, L. A general method for the classification of forest stands using species composition and vertical and horizontal structure. Ann. For. Sci. 2019, 76, 40. [Google Scholar] [CrossRef] [Scilit]
- Feldpausch, T.R.; Banin, L.; Phillips, O.L.; Baker, T.R.; Lewis, S.L.; Quesada, C.A.; Affum-Baffoe, K.; Arets, E.J.M.M.; Berry, N.J.; Bird, M.; et al. Height-diameter allometry of tropical forest trees. Biogeosciences 2011, 8, 1081–1106. [Google Scholar] [CrossRef] [Scilit]
- Lewis, S.L.; Phillips, O.L.; Baker, T.R.; Lloyd, J.; Malhi, Y.; Almeida, S.; Higuchi, N.; Laurance, W.F.; Neill, D.A.; Silva, J.N.M.; et al. Concerted changes in tropical forest structure and dynamics: Evidence from 50 South American long-term plots. Philos. Trans. R. Soc. Lond. B Biol. Sci. 2004, 359, 421–436. [Google Scholar] [CrossRef] [Scilit]
- Krantz, M.; Zimmer, D.; Adler, S.O.; Kitashova, A.; Klipp, E.; Mühlhaus, T.; Nägele, T. Data management and modeling in plant biology. Front. Plant Sci. 2021, 12, 717958. [Google Scholar] [CrossRef] [Scilit]
- Kelly, M. Teaching statistics to biologists. J. Biol. Educ. 1992, 26, 200–203. [Google Scholar] [CrossRef] [Scilit]
- Ojeda, M.M.; Sosa, V. An applied statistics course for systematics and ecology PhD students. Int. J. Math. Educ. Sci. Technol. 2002, 33, 199–211. [Google Scholar] [CrossRef] [Scilit]
- Ward, J.R.; Clarke, H.D.; Horton, J.L. Effects of a research-infused botanical curriculum on undergraduates’ content knowledge, STEM competencies, and attitudes toward plant sciences. CBE Life Sci. Educ. 2014, 13, 387–396. [Google Scholar] [CrossRef] [Scilit]
- Tyce, C.; Goudsouzian, L.K. Outside the Norm: Using Public Ecology Database Information to Teach Biostatistics. CourseSource 2023, 10, 38. [Google Scholar] [CrossRef] [Scilit]
- Teixeira, C.P.; Ferreira, V.R. Mapping arboretum research: Trends, gaps, and opportunities for biodiversity conservation, society, and climate resilience. Plants People Planet 2026, 8, 1457–1475. [Google Scholar] [CrossRef] [Scilit]
- Calderano Filho, B.; Wittern, K.P.; Conceição, M.; Tavares, N.P.; Fagundes, S.R.F. Identificação de Limitações Pedológicas e Ambientais Causadoras da Degradação de Áreas do Jardim Botânico do Rio de Janeiro; Estudos e Contribuições, No. 10; IBAMA/EMBRAPA-SNLCS: Rio de Janeiro, Brazil, 1992; p. 101. [Google Scholar]
- Almeida, T.M.H.; Coelho, M.A.N.; Peixoto, A.L. Rio de Janeiro Botanical Garden: Biodiversity Conservation in a Tropical Arboretum. J. Zool. Bot. Gard. 2024, 5, 378–394. [Google Scholar] [CrossRef] [Scilit]
- Ferreira, M.P.; Martins, G.B.; Almeida, T.M.H.; Ribeiro, R.S.; Veiga Júnior, V.F.; Paz, I.S.R.; Siqueira, M.F.; Kurtz, B.C. Estimating aboveground biomass of tropical urban forests with UAV-borne hyperspectral and LiDAR data. Urban For. Urban Green. 2024, 96, 128362. [Google Scholar] [CrossRef] [Scilit]
- Chave, J.; Coomes, D.; Jansen, S.; Lewis, S.L.; Swenson, N.G.; Zanne, A.E. Towards a worldwide wood economics spectrum. Ecol. Lett. 2009, 12, 351–366. [Google Scholar] [CrossRef] [Scilit]
- Maitner, B. BIEN: Tools for Accessing the Botanical Information and Ecology Network Database, R Package Version 1.2.8; University of California: Santa Barbara, CA, USA, 2026. [CrossRef] [Scilit]
- Denelle, P.; Weigelt, P. GIFT: Access to the Global Inventory of Floras and Traits (GIFT), R Package Version 1.3.3; University of Göttingen: Göttingen, Germany, 2024. [CrossRef] [Scilit]
- Trindade, W.C.F. florabr: An R package to explore and spatialize species distribution using Flora e Funga do Brasil. Appl. Plant Sci. 2024, 12, e11616. [Google Scholar] [CrossRef] [Scilit]
- Alonso, J.M.; Coelho, M.A.N.; Kurtz, B.C.; Almeida, T.M.H. Applied Statistics for a Tropical Arboretum: Dendrometric Data, Teaching Materials, and Analytical Code, version 1.0.0; Zenodo: Geneva, Switzerland, 2026. [Google Scholar] [CrossRef]
- R Core Team. R: A Language and Environment for Statistical Computing; R Foundation for Statistical Computing: Vienna, Austria, 2026; Available online: https://www.R-project.org/ (accessed on 23 September 2026).
- Wickham, H.; Averick, M.; Bryan, J.; Chang, W.; McGowan, L.D.; François, R.; Grolemund, G.; Hayes, A.; Henry, L.; Hester, J.; et al. Welcome to the tidyverse. J. Open Source Softw. 2019, 4, 1686. [Google Scholar] [CrossRef] [Scilit]
- Chamberlain, S.; Barve, V.; McGlinn, D.; Oldoni, D.; Desmet, P.; Geffert, L.; Ram, K. Interface to the Global Biodiversity Information Facility API, R Package version 3.8.5; rgbif: 2026. Available online: https://CRAN.R-project.org/package=rgbif (accessed on 23 September 2026).
- Wilkins, D. Draw Treemaps in ‘ggplot2’, R Package Version 2.6.0; Comprehensive R Archive Network (CRAN): Vienna, Austria, 2025. [CrossRef] [Scilit]
- Kuha, J. AIC and BIC: Comparisons of assumptions and performance. Sociol. Methods Res. 2004, 33, 188–229. [Google Scholar] [CrossRef] [Scilit]
- Hartig, F. Residual Diagnostics for Hierarchical (Multi-Level/Mixed) Regression Models, R Package Version 0.5.0; Comprehensive R Archive Network (CRAN): Vienna, Austria, 2026. [CrossRef] [Scilit]
- OpenAI. ChatGPT (GPT-5.5). Large Language Model, 2026. Available online: https://chatgpt.com (accessed on 30 June 2026).
- Carlin, J.B.; Moreno-Betancur, M. On the uses and abuses of regression models: A call for reform of statistical practice and teaching. Stat. Med. 2025, 44, e10244. [Google Scholar] [CrossRef] [Scilit]
- Silk, M.J.; Harrison, X.A.; Hodgson, D.J. Perils and pitfalls of mixed-effects regression models in biology. PeerJ 2020, 8, e9522. [Google Scholar] [CrossRef] [Scilit]
- Ursi, S.; Salatino, A. Scientific Note—It is time to overcome ableist terms in biology teaching: “impercepção botânica”/“plant unawareness”, as an alternative to “cegueira botânica”/“plant blindness”. Bol. Bot. Univ. São Paulo 2022, 39, 1–4. [Google Scholar] [CrossRef] [Scilit]
- Richardson, D.M.; Pyšek, P.; Rejmánek, M.; Barbour, M.G.; Panetta, F.D.; West, C.J. Naturalization and invasion of alien plants: Concepts and definitions. Divers. Distrib. 2000, 6, 93–107. [Google Scholar] [CrossRef] [Scilit]
- Pyšek, P.; Richardson, D.M.; Rejmánek, M.; Webster, G.L.; Williamson, M.; Kirschner, J. Alien plants in checklists and floras: Towards better communication between taxonomists and ecologists. Taxon 2004, 53, 131–143. [Google Scholar] [CrossRef] [Scilit]
- Moro, M.F.; Souza, V.C.; Oliveira-Filho, A.T.; Queiroz, L.P.; Fraga, C.N.; Rodal, M.J.N.; Araújo, F.S.; Martins, F.R. Alienígenas na sala: O que fazer com espécies exóticas em trabalhos de taxonomia, florística e fitossociologia? Acta Bot. Bras. 2012, 26, 991–999. [Google Scholar] [CrossRef] [Scilit]
- Piotto, D.; Montagnini, F.; Thomas, W.W.; Ashton, M.; Oliver, C. Forest recovery after swidden cultivation across a 40-year chronosequence in the Atlantic forest of southern Bahia, Brazil. Plant Ecol. 2009, 205, 261–272. [Google Scholar] [CrossRef] [Scilit]
- Lopes, L.C.M.; Mariano-Neto, E.; Amorim, A.M.A. Estrutura e composição florística da comunidade lenhosa do sub-bosque em uma floresta tropical no Brasil. Bol. Mus. Biol. Mello Leitão 2015, 37, 361–391. Available online: http://boletim.sambio.org.br/pdf/37_4_02.pdf (accessed on 23 September 2026).
- Morgenroth, J.; Nowak, D.J.; Koeser, A.K. DBH distributions in America’s urban forests—An overview of structural diversity. Forests 2020, 11, 135. [Google Scholar] [CrossRef] [Scilit]
- Kwong, I.H. Physical environment, species choice and spatio-temporal patterns of urban roadside trees in Hong Kong. Trees For. People 2022, 10, 100358. [Google Scholar] [CrossRef] [Scilit]
- Fröhlich, A.; Przepióra, F.; Drobniak, S.; Mikusiński, G.; Ciach, M. Public safety considerations constraint the conservation of large old trees and their crucial ecological heritage in urban green spaces. Sci. Total Environ. 2024, 948, 174919. [Google Scholar] [CrossRef] [Scilit]
- Jodas, D.S.; Brazolin, S.; Velasco, G.D.N.; Lima, R.A.; Yojo, T.; Papa, J.P. Urban tree failure probability prediction based on dendrometric aspects and machine learning models. Comput. Environ. Urban Syst. 2024, 108, 102074. [Google Scholar] [CrossRef] [Scilit]
- van Haaften, M.; Liu, Y.; Wang, Y.; Zhang, Y.; Gardebroek, C.; Heijman, W.; Meuwissen, M. Understanding tree failure—A systematic review and meta-analysis. PLoS ONE 2021, 16, e0246805. [Google Scholar] [CrossRef] [Scilit]
- Brewer, S.W.; Webb, M.A.H. A seasonal evergreen forest in Belize: Unusually high tree species richness for northern Central America. Bot. J. Linn. Soc. 2002, 138, 275–296. [Google Scholar] [CrossRef] [Scilit]
- Myster, R.W. The contributions of Neotropical tree families to the structure of common Amazon forest-types. Int. J. Plant Biol. 2023, 14, 339–346. [Google Scholar] [CrossRef] [Scilit]
- Valente, C.; Moura, C.; Hollunder, R.; Cabral, R.; Rodrigues, N.; Lobato, L.; Dias, H.; da Silva, G. Diversity and structure of tree and regenerating strata in fragments at different successional stages in the Atlantic Forest of Brazil. Phytocoenologia 2024, 52, 71–85. [Google Scholar] [CrossRef] [Scilit]
- Ministério do Meio Ambiente. Portaria MMA n° 148, de 7 de junho de 2022: Altera os Anexos das Portarias n° 443, n° 444 e n° 445, de 17 de Dezembro de 2014, Referentes à Atualização da Lista Nacional de Espécies Ameaçadas de Extinção. Diário Of. União 2022, 108, 74. Available online: https://www.gov.br/icmbio/pt-br/assuntos/centros-de-pesquisa/aves-silvestres/arquivos/portaria-148-2022.pdf (accessed on 15 September 2026).
- Cavender, N.; Westwood, M.; Bechtoldt, C.; Donnelly, G.; Oldfield, S.; Gardner, M.; Rae, D.; McNamara, W. Strengthening the conservation value of ex situ tree collections. Oryx 2015, 49, 416–424. [Google Scholar] [CrossRef] [Scilit]
- Lucas, E.J.; Bunger, M.O. Myrtaceae in the Atlantic Forest: Their role as a ‘model’ group. Biodivers. Conserv. 2015, 24, 2165–2180. [Google Scholar] [CrossRef] [Scilit]
- Gomes-Westphalen, J.S.; Lins-e-Silva, A.C.B.; de Araújo, F.S. Who is who in the understory: The contribution of resident and transitory groups of species to plant richness in forest assemblages. Rev. Biol. Trop. 2012, 60, 1025–1040. [Google Scholar] [CrossRef] [Scilit][Green Version]
- Berg, C.C. Moreae, Artocarpeae, and Dorstenia (Moraceae) with introductions to the family and Ficus and with additions and corrections to Flora Neotropica Monograph 7. Flora Neotrop. 2001, 83, 1–346. [Google Scholar]
- Zotz, G.; Almeda, F.; Bautista-Bello, A.P.; Eskov, A.; Giraldo-Cañas, D.; Hammel, B.; Harrison, R.; Köster, N.; Krömer, T.; Lowry, P.; et al. Hemiepiphytes revisited. Perspect. Plant Ecol. Evol. Syst. 2021, 51, 125620. [Google Scholar] [CrossRef] [Scilit]
- Tomlinson, P.B.; Horn, J.W.; Fisher, J.B. The Anatomy of Palms; Oxford University Press: Oxford, UK, 2011. [Google Scholar] [CrossRef] [Scilit]
- Bellingham, P.J.; Sparrow, A.D. Multi-stemmed trees in montane rain forests: Their frequency and demography in relation to elevation, soil nutrients and disturbance. J. Ecol. 2009, 97, 472–483. [Google Scholar] [CrossRef] [Scilit]
- Miura, M.; Yamamoto, S. Structure and dynamics of a Castanopsis cuspidata var. sieboldii population in an old-growth, evergreen, broad-leaved forest: The importance of sprout regeneration. Ecol. Res. 2003, 18, 115–129. [Google Scholar] [CrossRef] [Scilit]
- Bond, W.J.; Van Wilgen, B.W. Fire and Plants; Springer: Dordrecht, The Netherlands, 1996. [Google Scholar] [CrossRef] [Scilit]
- de Souza, A.C.R.; de Almeida, E.B., Jr.; Zickel, C.S. Riqueza de espécies de sub-bosque em um fragmento florestal urbano, Pernambuco, Brasil. Biotemas 2011, 22, 57–66. [Google Scholar] [CrossRef] [Scilit][Green Version]
- Sosa, C.M.; Puntieri, J.G. Crecimiento anual de cuatro especies arbóreas con yemas desnudas nativas de los bosques templados húmedos de Patagonia. Bol. Soc. Argent. Bot. 2016, 51, 643–655. [Google Scholar] [CrossRef] [Scilit]
- Leal, A.S.; Cozin, B.B.; Leite, M.C.M.; Martins, A.R. How do legumes cope with environmental filters in savanna ecosystems? Analysis of morphoanatomical and ultrastructural traits of legumes aerial organs and ecological implications. Braz. J. Bot. 2026, 49, 9. [Google Scholar] [CrossRef] [Scilit]
- Zupo, T.; Daibes, L.F.; Pausas, J.G.; Fidelis, A. Post-fire regeneration strategies in a frequently burned Cerrado community. J. Veg. Sci. 2021, 32, e12968. [Google Scholar] [CrossRef] [Scilit]
- Prance, G.T.; Mori, S.A. Lecythidaceae. In Flowering Plants. Dicotyledons: Celastrales, Oxalidales, Rosales, Cornales, Ericales; Kubitzki, K., Ed.; The Families and Genera of Vascular Plants; Springer: Berlin/Heidelberg, Germany, 2004; Volume 6, pp. 221–232. [Google Scholar] [CrossRef] [Scilit]
- Pennington, T.D.; Styles, B.T. A generic monograph of the Meliaceae. Blumea 1975, 22, 419–540. Available online: https://repository.naturalis.nl/pub/524789 (accessed on 23 September 2026).
- LPWG. A new subfamily classification of the Leguminosae based on a taxonomically comprehensive phylogeny. Taxon 2017, 66, 44–77. [Google Scholar] [CrossRef] [Scilit]
- Zhao, Y.; Zhang, R.; Jiang, K.; Qi, J.; Hu, Y.; Guo, J.; Zhu, R.; Zhang, T.; Egan, A.N.; Yi, T.; et al. Nuclear phylotranscriptomics/phylogenomics support numerous polyploidization events and hypotheses for the evolution of rhizobial nitrogen-fixing symbiosis in Fabaceae. Mol. Plant 2021, 14, 748–773. [Google Scholar] [CrossRef] [Scilit]
- Ibarra-Manríquez, G.; Urrea-Galeano, L.A.; Cortés-Flores, J.; Hernández-Esquivel, K.B.; Navarrete-Segueda, A.; Ek-Rodríguez, I.L. Plant community attributes of a tropical dry forest physiognomically dominated by Heteroflorum sclerocarpum (Fabaceae). Bot. Sci. 2022, 101, 57–75. [Google Scholar] [CrossRef] [Scilit]
- Meena, K.; Singh, N.; Bhandoria, M.S.; Bansal, P.; Yadav, S.S. Floristic diversity of the family Fabaceae (Leguminosae) in community forests of South Haryana, India. Legume Res. 2025, 48, 1712–1720. [Google Scholar] [CrossRef] [Scilit]
- Siddiqui, S. Global patterns and drivers of species and genera richness of Fabaceae. Front. Plant Sci. 2025, 16, 1581814. [Google Scholar] [CrossRef] [Scilit]
- Klitgaard, B.B. Ecuadorian Brownea and Browneopsis (Leguminosae-Caesalpinioideae): Taxonomy, palynology, and morphology. Nord. J. Bot. 1991, 11, 433–449. [Google Scholar] [CrossRef] [Scilit]
- Rust, S. Trees adjust the shape of branch unions to increase their load-bearing capacity. Forests 2023, 14, 1041. [Google Scholar] [CrossRef] [Scilit]
- Gilman, E.F. Branch-to-stem diameter ratio affects strength of attachment. J. Arboric. 2003, 29, 291–294. [Google Scholar] [CrossRef] [Scilit]
- Kane, B.; Farrell, R.; Zedaker, S.M.; Loferski, J.R.; Smith, D.W. Failure mode and prediction of the strength of branch attachments. Arboric. Urban For. 2008, 34, 308–316. [Google Scholar] [CrossRef] [Scilit]
- Kerr, G.; Morgan, G. Does formative pruning improve the form of broadleaved trees? Can. J. For. Res. 2006, 36, 132–141. [Google Scholar] [CrossRef] [Scilit]
- D’Elboux, R. A promenade in the tropics: The imperial palms between Rio de Janeiro and São Paulo. Stud. Hist. Gard. Des. Landsc. 2013, 33, 148–156. [Google Scholar] [CrossRef] [Scilit]
- Monteiro, V.A.; Gomes, F.R.; Ragagnin, A.L.R.; Somera, A.; Silveira Neto, A.N.; Assunção, H.F.; Hurtado-Salazar, A.; Silva, D.F.P. Early growth of imperial palm (Roystonea oleracea) in tropical environments. Rev. Cienc. Agríc. 2025, 42, e3271. [Google Scholar] [CrossRef] [Scilit]
- Mankou, G.S.; Ligot, G.; Loubota Panzou, G.J.; Boyemba, F.; Loumeto, J.J.; Ngomanda, A.; Obiang, D.; Rossi, V.; Sonké, B.; Yongo, O.D.; et al. Tropical tree allometry and crown allocation, and their relationship with species traits in Central Africa. For. Ecol. Manag. 2021, 493, 119262. [Google Scholar] [CrossRef] [Scilit]
- Mulatu, A.; Negash, M.; Asrat, Z. Species-specific allometric models for reducing uncertainty in estimating above ground biomass at Moist Evergreen Afromontane Forest of Ethiopia. Sci. Rep. 2024, 14, 1147. [Google Scholar] [CrossRef] [Scilit]
- Sterken, P. The quest for a unified theory on biomechanical palm risk assessment through theoretical analysis and observation. Sci. Rep. 2021, 11, 22134. [Google Scholar] [CrossRef] [Scilit]
- Martínez Cano, I.; Muller-Landau, H.C.; Wright, S.J.; Bohlman, S.A.; Pacala, S.W. Tropical tree height and crown allometries for the Barro Colorado Nature Monument, Panama: A comparison of alternative hierarchical models incorporating interspecific variation in relation to life history traits. Biogeosciences 2019, 16, 847–862. [Google Scholar] [CrossRef] [Scilit]
- Lima, R.B.; Silva, J.A.A.; Ferreira, R.L.C.; Silva, E.A.; Silva, J.R.M.; Santos, F.G. Height-diameter allometry for tropical forest in northern Amazonia. PLoS ONE 2021, 16, e0255197. [Google Scholar] [CrossRef] [Scilit]
- Klimas, C.A.; Kainer, K.A.; Wadt, L.H.O. The economic value of sustainable seed and timber harvests of multi-use species: An example using Carapa guianensis. For. Ecol. Manag. 2012, 268, 81–91. [Google Scholar] [CrossRef] [Scilit]
- Trigwell, K.; Shale, S. Student learning and the scholarship of university teaching. Stud. High. Educ. 2004, 29, 523–536. [Google Scholar] [CrossRef] [Scilit]
- Pownall, M.; Azevedo, F.; König, L.M.; Slack, H.R.; Evans, T.R.; Flack, Z.; Grinschgl, S.; Elsherif, M.; Gilligan-Lee, K.A.; de Oliveira, C.M.F.; et al. Framework for Open and Reproducible Research Training. Teaching open and reproducible scholarship: A critical review of the evidence base for current pedagogical methods and their outcomes. R. Soc. Open Sci. 2023, 10, 221255. [Google Scholar] [CrossRef] [Scilit]
- Chen, G.; Sun, W. The role of botanical gardens in scientific research, conservation, and citizen science. Plant Divers. 2018, 40, 181–188. [Google Scholar] [CrossRef] [Scilit]
- Thomas, G.; Sucher, R.; Wyatt, A.; Jiménez, I. Ex situ species conservation: Predicting plant survival in botanic gardens based on climatic provenance. Biol. Conserv. 2022, 265, 109410. [Google Scholar] [CrossRef] [Scilit]
- Joswig, J.S.; Wirth, C.; Schuman, M.C.; Kattge, J.; Reu, B.; Wright, I.J.; Sippel, S.D.; Rüger, N.; Schaepman, M.E.; van Bodegom, P.M.; et al. Climatic and soil factors explain the two-dimensional spectrum of global plant trait variation. Nat. Ecol. Evol. 2022, 6, 1226–1233. [Google Scholar] [CrossRef] [Scilit]
- Li, R.; Cheng, X.; Dai, P.; Zhang, M.; Li, M.; Chen, J.; Hassan, W.U.; Wang, Y. Plant architectural structure and leaf trait responses to environmental change: A meta-analysis. Plants 2025, 14, 1717. [Google Scholar] [CrossRef] [Scilit]
Disclaimer/Publisher’s Note: The statements, opinions and data contained in all publications are solely those of the individual author(s) and contributor(s) and not of MDPI and/or the editor(s). MDPI and/or the editor(s) disclaim responsibility for any injury to people or property resulting from any ideas, methods, instructions or products referred to in the content. |
© 2026 by the authors. Licensee MDPI, Basel, Switzerland. This article is an open access article distributed under the terms and conditions of the Creative Commons Attribution (CC BY) license.