


Abstract
Gardens provide several ecosystem services, including functioning as a habitat for diverse taxa and promoting users’ well-being. Soil biodiversity is considered an important factor in the capacity of the soil to provide ecosystem services. Nematodes are widely used as environmental indicators based on their key roles in the soil food web. Nematode and plant communities were studied across five different areas in a garden in Ireland as part of an assessment of soil health, as well as to explore their distribution patterns inside the garden. The aims of the study were to contribute to the exploration of soil biodiversity and soil health in built environments, and to study nematode communities in different plant assemblages. Using nematode morphology, a total of 33 terrestrial nematode families were identified across the garden, indicating similar levels of soil ecosystem enrichment and food web structure among different plant assemblages. A total of 25 plant families were identified in the five areas, revealing distinct plant communities inside the gardens. The study was limited to a single sampling event and the taxonomic identification of nematode and plants at the family level. However, the results highlight the use of nematodes as environmental indicators for soil health assessments in gardens, and provided baseline information that could potentially inform on soil biodiversity and plant management strategies.
1. Introduction
Gardens have been recognised for contributing to the provision of ecosystem services, including water retention, climate regulation, functioning as a habitat for diverse taxa, and promoting users’ well-being [1,2,3,4,5]. Ornamental plant species in gardens provide opportunities to improve mental health, creativity, serve as educational resources on biodiversity, and foster a sense of responsibility for the environment [6,7,8]. The promotion of mental health and well-being, established and appreciated in UNSDG Goal 3, Good health and well-being [9], has been linked with ecosystem services provided by gardens [10,11]. In addition, research suggests [12] that the promotion of mental health and well-being need the acknowledgment of the interdependency of human and environmental health. Gardens often have unique ecological and biodiversity characteristics because they are composed of different mixtures of plant species that usually include native and non-native specimens [13]. The provision of ecosystem services and the benefits that gardens confer depend largely on their soil and plant biodiversity [14,15,16].
Soil biodiversity assembles into the soil food web, a complex network of ecological interactions among organisms that enable energy flow [17,18]. The structure of the soil food web is an indicator of the status and change in the soil ecosystem [19,20,21,22,23]. For instance, evidence suggests [24] that high soil biodiversity is associated with resilience to perturbations and the provision of ecosystem services. As Ferris et al. [25] highlighted, knowledge on the presence and abundance of soil organisms that integrate successfully into the food web is fundamental for environmental stewardship.
Nematodes are central to terrestrial ecosystems due to their key roles in the soil food web [25]. Their ecological functions include the decomposition of organic matter, mineralisation of nutrients, degradation of contaminants, the regulation of plant disease agents, and influencing plant community structure [26,27,28]. Nematodes are classified according to their feeding group as bacterivores, fungivores, herbivores, predators, and omnivores. The analysis of the nematode community is a widely used approach for the assessment of the status of soil ecosystems [18,29], as the response of nematodes to perturbations and new resources can be measured and studied [27,29]. For environmental analysis purposes, nematodes are divided according to feeding behaviour, reproductive potential, and life history [26]. Based on these characteristics, nematodes are categorised in a coloniser–persister (c-p) scale [26], ranging from 1 for early colonisers of new resources, to 5 for persisters in undisturbed environments [27].
The c-p scale gives a structured modelling of the soil ecosystem. For instance, an undisturbed environment will usually present abundant specialist predators (including the orders Mononchidia and Diplogastrida) and generalist predators (order Dorylaimida) [19]. Diversity indices of nematode assemblages are used to infer the structure and resilience of soil ecosystems [21]. The change in the relative abundances of different feeding groups of nematodes reflects a change in the soil food web structure and decomposition pathways [29]. The abundance of free-living nematodes and their effect on ecosystems vary in different geographies and soil use [30]. In this sense, food web diagnostics give information about the functional structure of the nematode assemblages [27] and can be assessed through nematode-based indices (NBIs) [31].
NBIs have been developed to assess the community structure of nematodes based on the c-p scale and their feeding habits. The NBIs are standard measures of nematode analysis and indicate levels of food availability, food web structure, and environmental and anthropogenic disturbances. Extensively used NBIs include the Sigma Maturity Index (∑MI), which represents an indicator of disturbance in non-agricultural soils with values ranging from less than 2.0 in disturbed environments to 4.0 in undisturbed ones, the Enrichment Index (EI), whose values indicate corresponding levels of nutrient enrichment and food availability, and the Structure Index (SI), which gives information on the levels of soil food web complexity and structure [26].
The NBIs have been widely used to assess soil conditions for agricultural land use and natural environments, and only a small percentage of studies have reported [18] the use of NBIs for built environments, like parks, gardens, industrial, and mining areas. The study of soil health (SH) using nematodes as environmental indicators in other ecosystems, different from agricultural and natural environments, remains a largely unexplored area [18,32]. Therefore, it is important to deepen our knowledge of soil biodiversity in different soil ecosystems that provide environmental services (i.e., gardens) to explore soil biodiversity patterns and dynamics.
Above- and below-ground interactions affect plant and soil nematode communities [33,34,35]. For instance, evidence suggests [36] that plants and their associated soils have unique communities of soil invertebrates. Free-living nematodes, including bacterivores, fungivores, omnivores and predators, are considered to promote plant health and growth [37,38,39]. In addition, higher abundance and richness of bacteria-feeding nematodes, omnivores, and predators are found in plant communities with higher species richness [28], while plant-parasitic nematodes (PPNs) accumulate in plant communities with low diversity. Few studies have addressed [40] the relationship between distinct plant assemblages and their below-ground nematode communities to explore SH in built environments like gardens. Little has been discussed in relation to indicators or approaches to SH assessments, beyond the agricultural productivity associated with soil [41,42].
In this context, the objective of this study was to explore the terrestrial nematode and plant diversity community patterns in a public ornamental garden in Ireland to (1) contribute to the exploration and study of soil biodiversity and SH in built environments, and (2) to study nematode communities in different plant assemblages. The study was driven by the hypothesis that the ornamental garden would exhibit distinct nematode communities based on the distribution of different ornamental plants. This study represents a novel approach to exploring SH in a garden using nematodes as environmental indicators, contributing to the knowledge of soil biodiversity and its associated plant communities. In addition, the study aimed to provide baseline information that could potentially inform management and conservation strategies, and advance SH comparative studies for a broad range of habitats and land-use types in the European region [43,44,45].
2. Materials and Methods
2.1. Study Site
The study was conducted in Mount Congreve Gardens (MCG), Kilmeaden, in the south-east of Ireland (52°14′15″ N latitude, 7°12′44″ W longitude). The elevation of the area is approximately 120 m Above Mean Sea Level [46]. Soils in the region are categorised as grey-brown podzolics, with an influence or domination of limestone as the parent material. The Kilmeaden Series is characterised by deep well-drained soils [46]. MCG was selected as a study site because of its unique characteristics in the south-east region of Ireland. MCG is located on the shores of the River Suir estuary. The lower River Suir is a Special Area of Conservation (SAC 002137) for old oak woodlands, alluvial forests, and yew woodlands, as listed in the E.U. Habitats Directive [47,48]. MCG has been recognised as one of the great gardens of the world [49]. It comprises 70 acres of planted woodland (PW) and four acres of walled gardens (WG), with more than 3000 plant species of international note [50].
MCG hosts different varieties of Rhododendron sp., Magnolia sp., Camellia sp., Dahlia sp., and Hydrangea sp., among other ornamental plant species [50]. With a history that dates from the 1600s, the Estate was profoundly transformed in the 1960s when Mr. Ambrose Congreve employed Mr. Herman Dool, a Dutch horticulturist, as a head gardener. They began a journey of plant-collecting and garden design that spanned for more than four decades [50]. After the death of Mr. Congreve in 2011, MCG was held in Trust for the State. Mr. Congreve’s and Mr. Dool’s legacies continue to date, for instance, by taking care of and sustaining the plant collections that started in the 1960s and by acquiring new plant specimens. The soil biodiversity at MCG has been relatively unexplored.
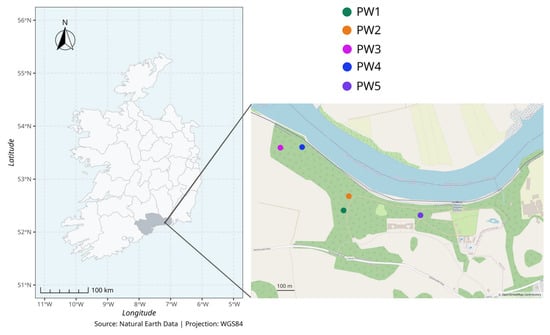
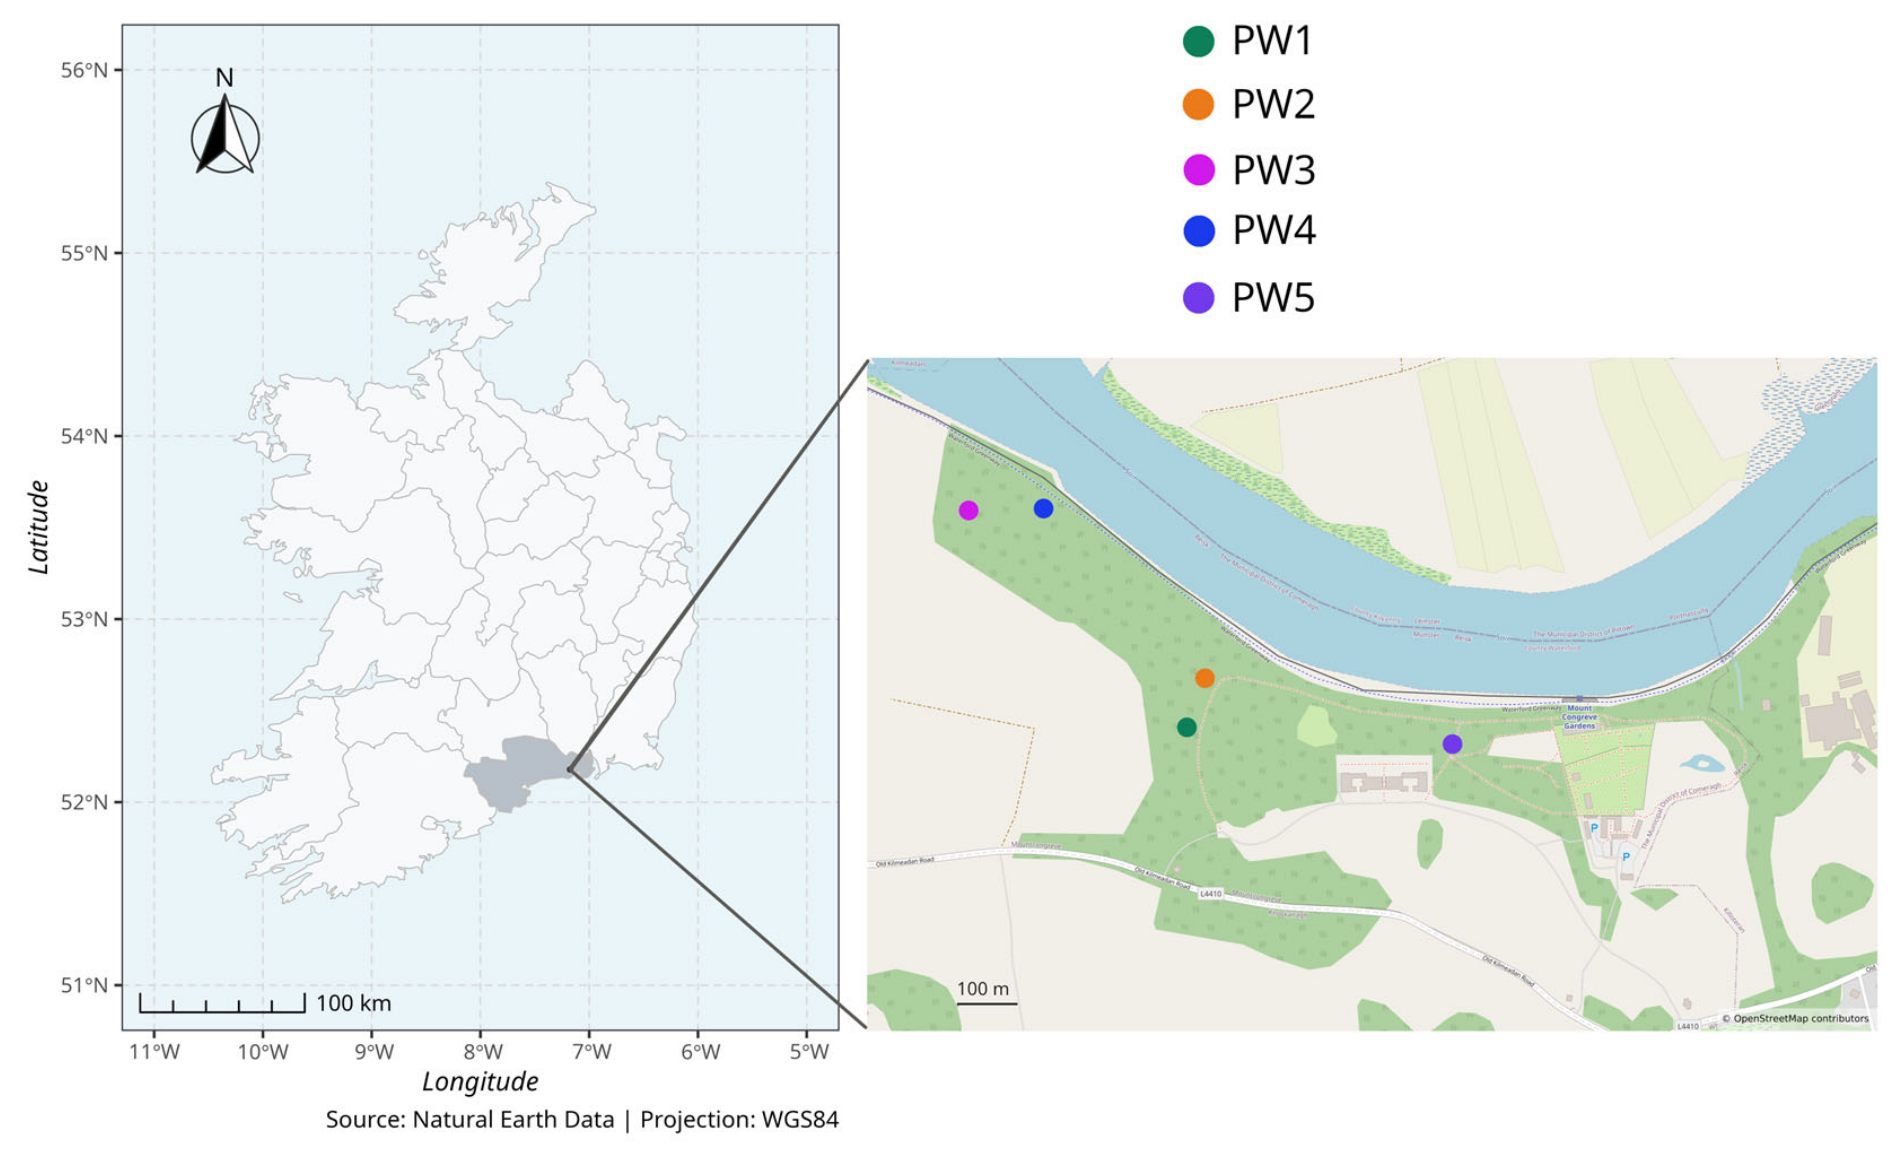
Five plots of 100 m2 (20 m × 5 m) in size were selected throughout MCG in the PW areas based on the differential distribution of ornamental plants (Figure 1 and Table 1) [51,52]. For each plot, nematode and plant diversity were studied.
Figure 1.
Location of MCG and colour-coded sampling areas (modified from OpenStreetMap).
Table 1.
Areas for soil and plant diversity sampling in MCG, Waterford, Ireland.
2.2. Soil Sampling and Nematode Extraction
Soil sampling was conducted in October 2024. A total of 15 samples (5 areas × 3 replicates) from the upper 10 cm of soil were collected with an auger. Each replicate consisted of a composite sample of five soil cores collected in a “W” shaped pattern. The soil corer was rinsed with 70% ethanol between sampling areas to avoid cross-contamination. Samples were stored at 4 °C until processing. Live nematodes were extracted from 100 g of soil following a modified Baermann funnel method at room temperature [53]. Nematode suspensions were recovered after 72 h and stored at 4 °C until processing within the following 72 h.
2.3. Nematode Abundance, Diversity, Community Structure, and Food Web Analysis
After extraction from the soil, nematode abundance was estimated by counting nematodes per 100 mL of soil under an Olympus SZX7 stereomicroscope (Olympus Corporation, Tokyo, Japan) following Van Bezooijen [54]. Nematodes were then permanently fixed using a 4% formalin solution and mounted on microscope slides [54]. A total of 100 nematodes from each sampling area were randomly selected and inspected under a Euromex Holland Delphi-X microscope (Euromex Microscopen, Duiven, The Netherlands) to morphologically identify them at the family taxonomical level after Bongers [55] and Manzanilla-López et al. [56]. Nematodes were also classified according to their feeding group. The identification of nematodes at the family level is a common practice to elucidate the food web structure, since c-p values are assigned to this taxonomic rank. In this sense, nematode families provide necessary information for the calculation of NBIs and faunal profiles [18,25,57].
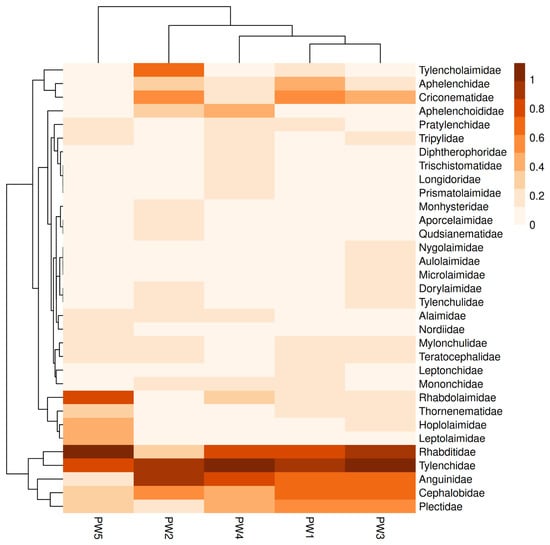
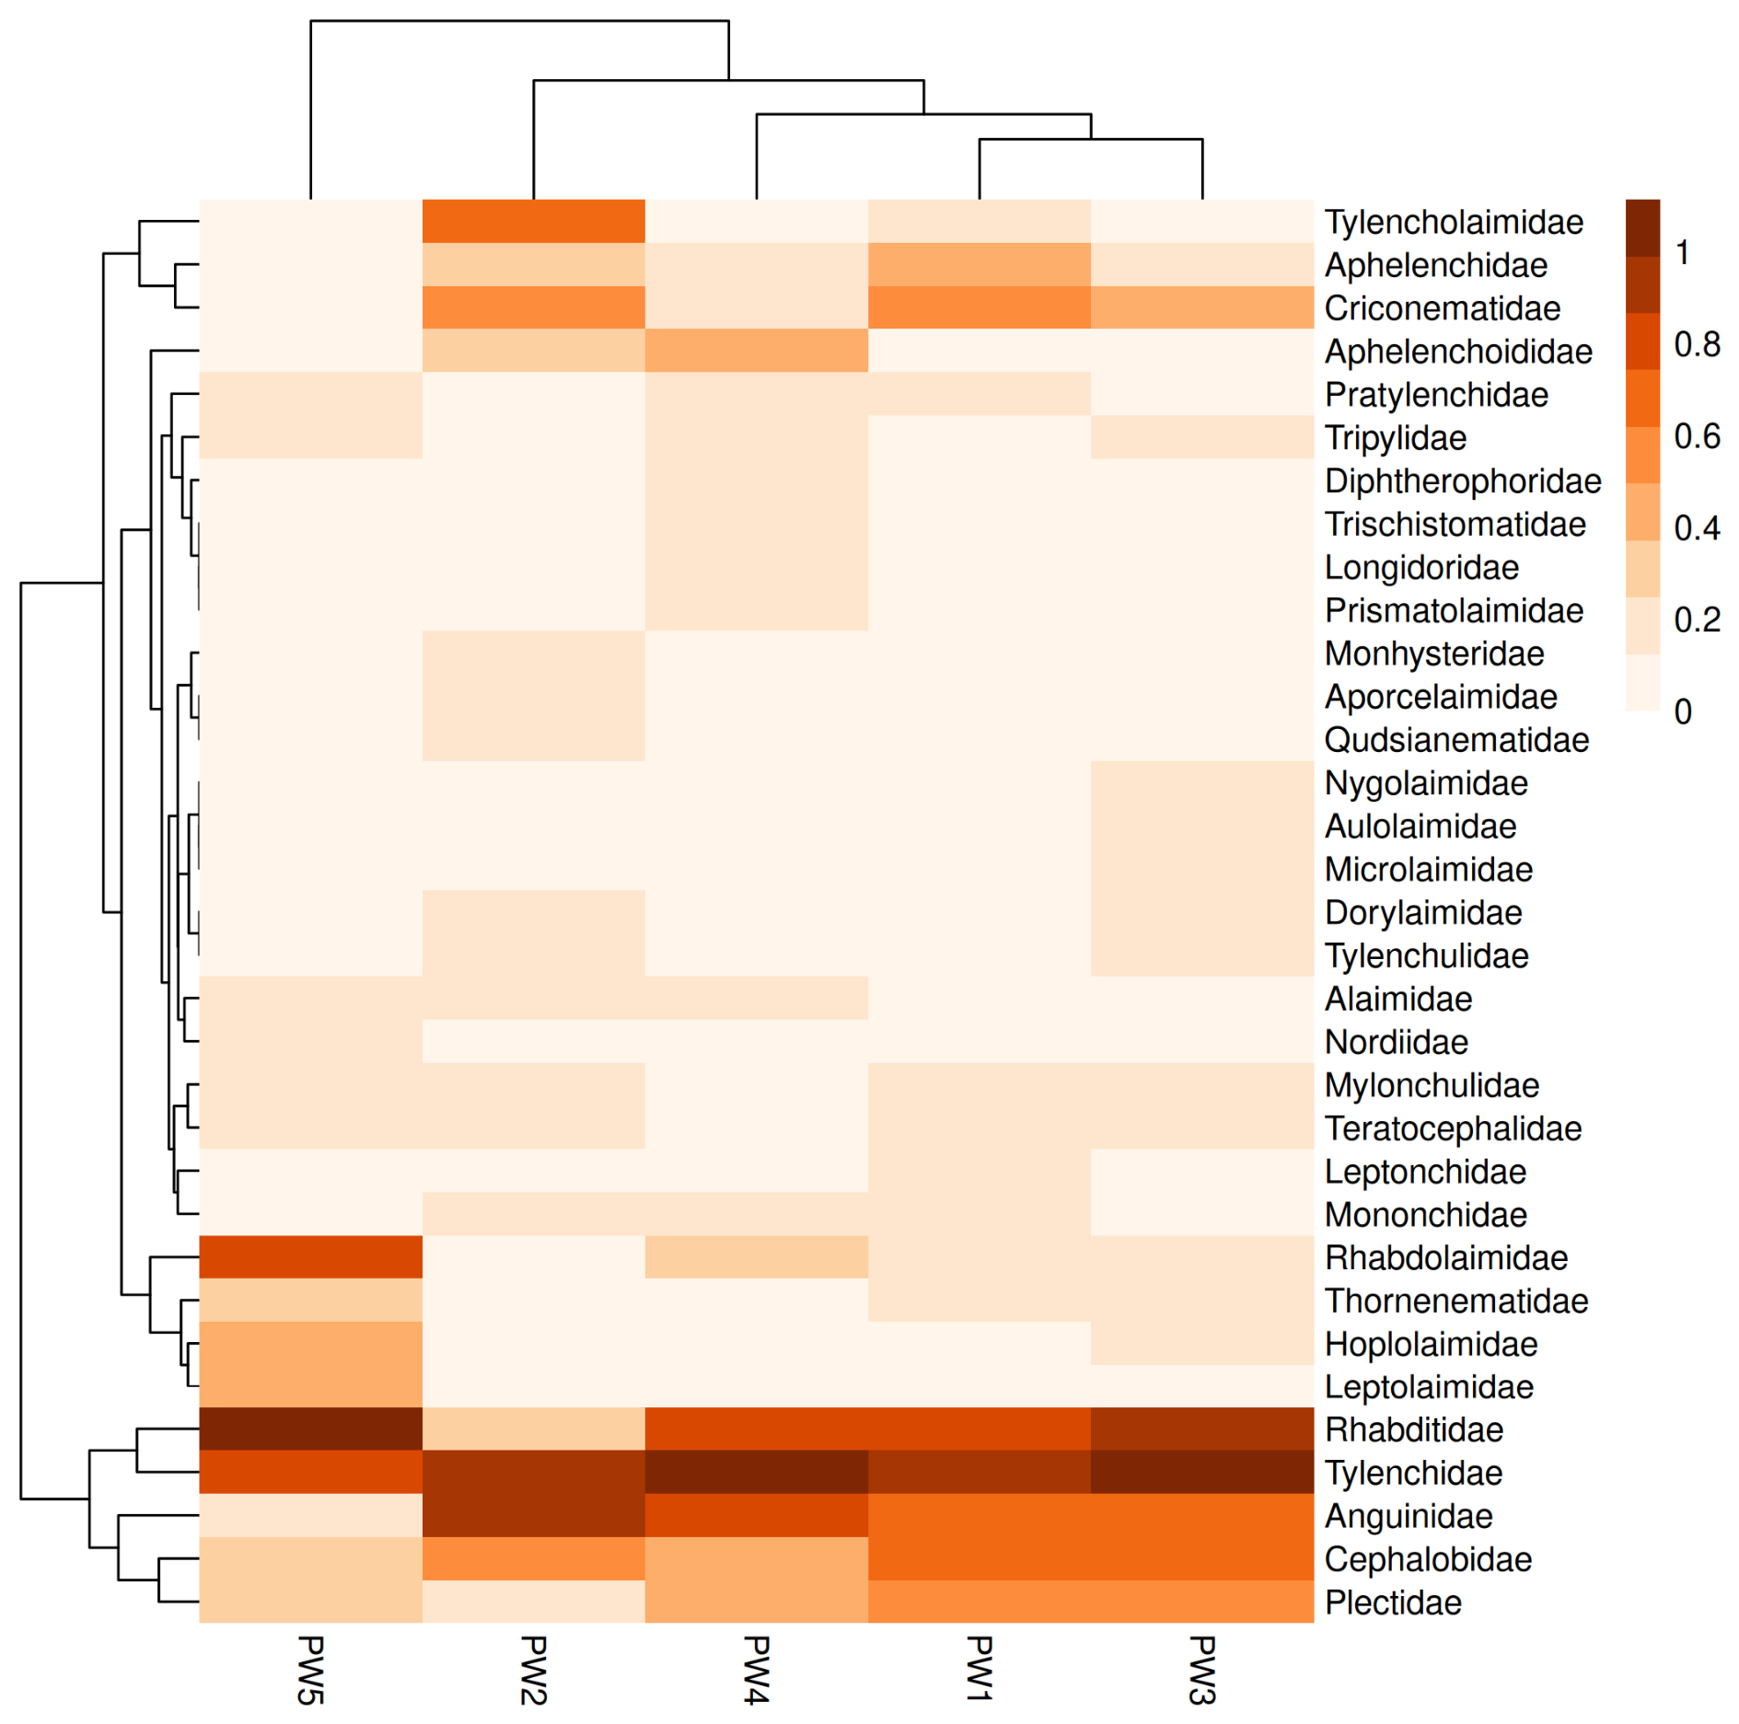
A heatmap was created using the pheatmap package version 1.0.12 [58] in R version 4.3.3 [59] to visualise the abundance of nematode individuals per family for each sampling area.
The alpha diversity of the nematode assemblages was calculated using the Shannon–Wiener index (H′) as follows:
where pi is the proportion of individuals in the ith taxon, and s is the total number of nematode taxa in the assemblage [60,61]. The Shannon–Wiener index and family richness were calculated using the abdiv package version 0.2.0 [62] in R.
H′ = −Σsi=1 pi × ln(pi)
The EI and the SI were calculated as:
where e is the enrichment component, b is the basal component, and s is the structure component of the nematode assemblage [25]. The online platform Nematode INdicator Joint Analysis NINJA; https://shiny.wur.nl/ninja/ (accessed on 22 June 2026) [31] was used to calculate the faunal profiles that represent the structure and enrichment conditions of the soil food web.
EI = 100 × e/e + b
SI = 100 × s/s + b
Differences in nematode community structure were analysed using a Principal Coordinates Analysis (PCoA) based on Bray–Curtis distances. Analyses were performed with the vegan version 2.7.5 [63] and ggplot2 version 4.0.2 [64] packages in R to visualise nematode community composition differences between sampling areas. An upset plot was created using the UpSetR package version 1.4.1 [65] to visualise the number of unique and shared nematode families between sampling areas.
2.4. Plant Diversity
For each plot, a vegetation survey to estimate plant diversity was performed. All trees with a diameter greater than or equal to 10 cm at breast height (dbh ≥ 10 cm) were recorded, counted [66], and photographed. All shrubs within the plot were recorded, counted, and photographed. For the understory herbaceous community, each plot was divided into a grid of 1 m2 squared subplots. A total of 30 non-contiguous subplots were sampled, recording all herbaceous species below 1 m in height [67].
The multi-taxon citizen science platform iNaturalist https://www.inaturalist.org/ (accessed on 3 June 2025) and the plant identification platform PlantNet https://identify.plantnet.org/ (accessed on 3 June 2025) were used to identify plant specimens at the family level. Photographs that contained a combination of different parts of the plant (flowers, vegetative parts) were included, as these can enhance the accuracy of identification platforms [68]. The PlantNet platform was used because of its high identification accuracy for Western Europe [68] and Irish herbaceous plants [69]. Plant automated identification tools have been previously used to assist plant surveys in ecological studies [70,71], with percentages above 80% of correct identifications at the species level [68,69]. The identification of each specimen was corroborated by both platforms. In addition, identification was aided and corroborated for native plants using the Collins pocket guide of Wild Flowers of Britain and Northern Europe [72], and the vegetative key to the British flora [73]. To decrease the risk of incorrectly identifying the specimens and increase the reliability of data, a family-level identification was followed in this survey because of observer limitations [74,75].
In the same way as with nematode diversity, the Shannon–Wiener index (H′) and family richness were calculated to estimate plant alpha diversity using the abdiv package version 0.2.0 [62] in R. Differences in plant community structure were analysed using a Principal Coordinates Analysis (PCoA) based on Bray–Curtis distances and performed with the vegan version 2.7.5 [63] and ggplot2 version 4.0.2 [64] packages in R to visualise plant community composition differences between sampling areas. An upset plot was created using the UpSetR package version 1.4.1 [65] to visualise the number of unique and shared plant families between sampling areas.
2.5. Data Analysis
Statistical analyses and data visualisation were performed using R version 4.3.3 [59]. Before analysis, the data were checked for normal distribution using the Shapiro–Wilk test and homogeneity of variance using the Levene’s test. Differences in means between sampling areas for nematode abundance, nematode taxon richness, and plant taxon Shannon–Wiener index, were tested using one-way analysis of variance (ANOVA) and Tukey’s Honestly Significant Difference (HSD) post hoc tests. For non-normally distributed data, like the abundance of bacterivores, nematode taxon Shannon–Wiener index and plant taxon richness, a Kruskal–Wallis’s test was used to investigate the differences between samples. A Dunn’s post hoc test was performed for pairwise comparisons between samples using the rstatix version 0.7.3 [66] package.
Data visualisation was performed using the ggplot2 version 4.0.2 [64] and multcompView version 0.1.10 [76] packages in R. The differences in plant and nematode community structures were tested using permutational analysis of variance (PERMANOVA) with 9999 permutations using the “adonis” function in the vegan version 2.7.5 [63] package.
3. Results
3.1. Nematode Abundance, Diversity, Community Structure, and Food Web Analysis
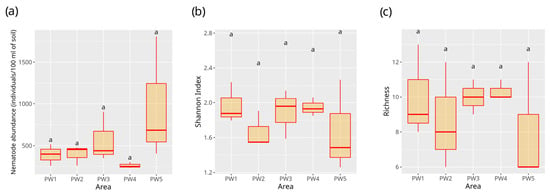
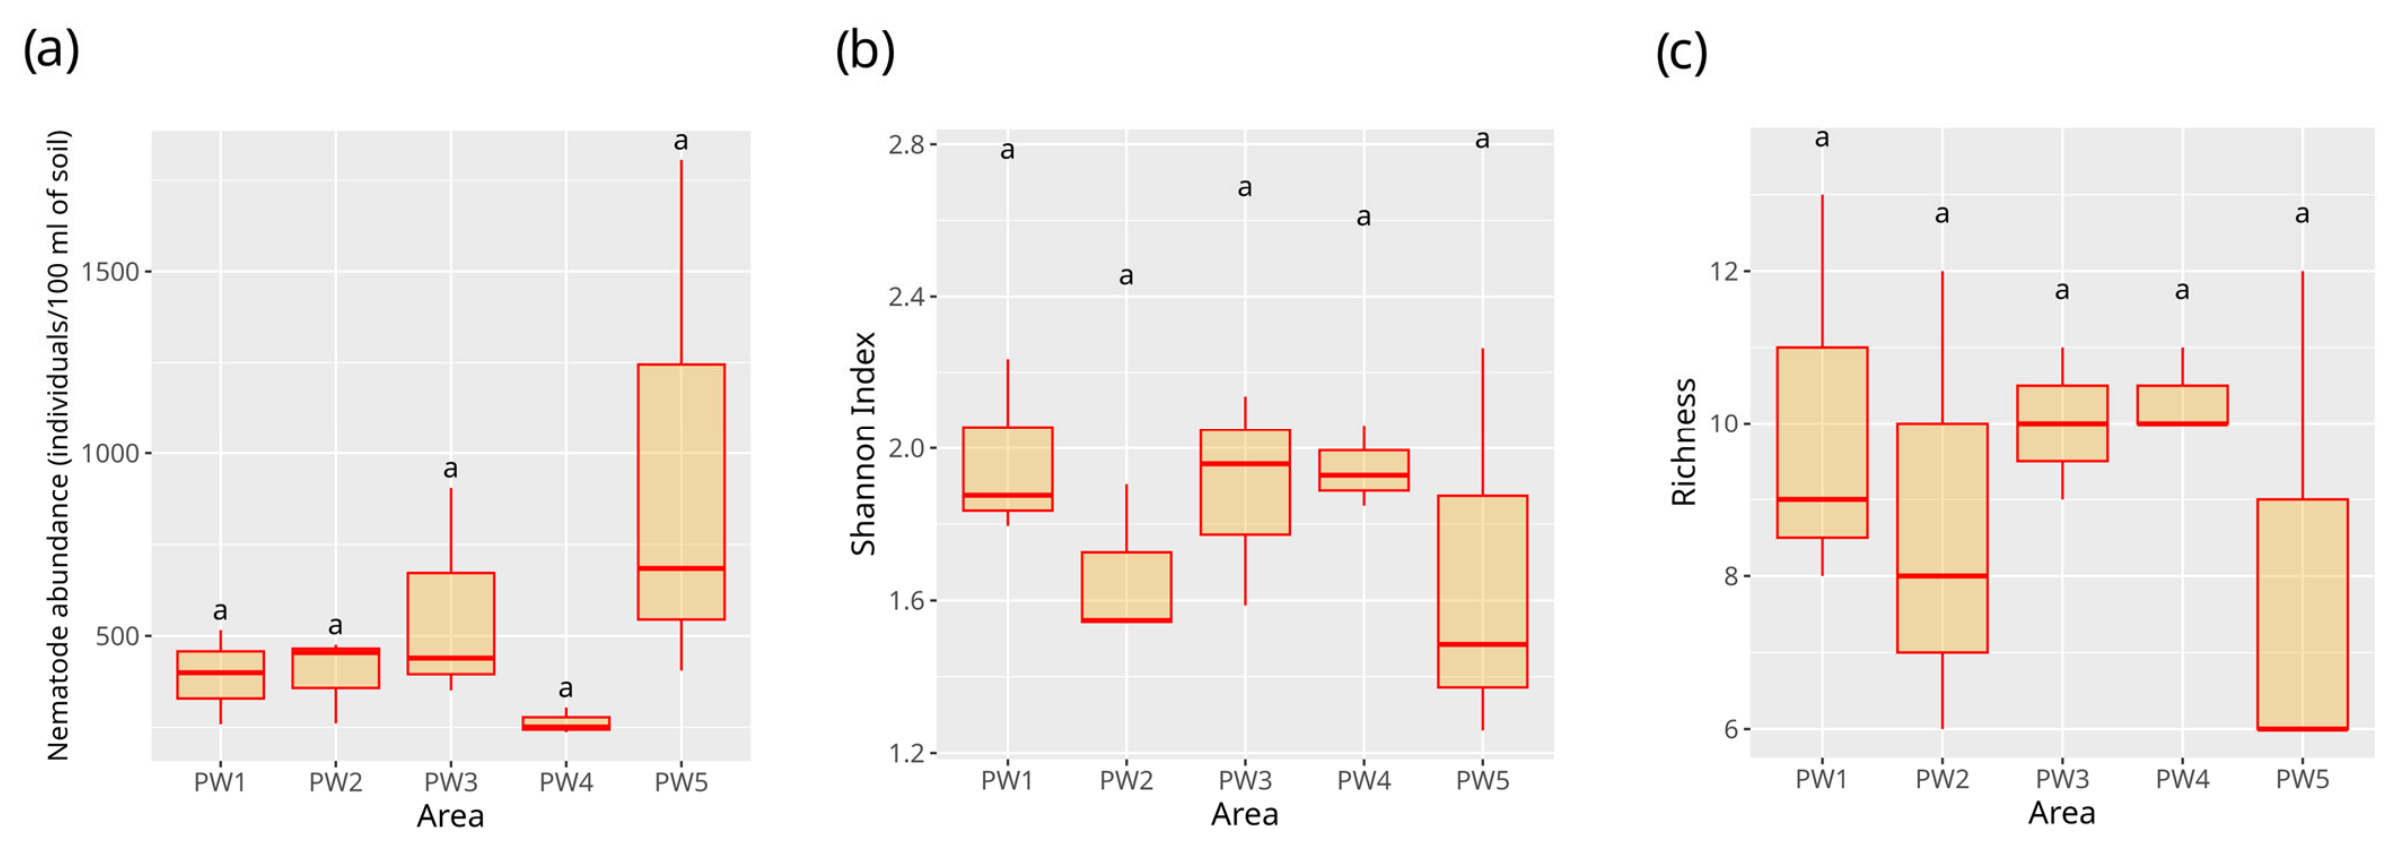
Nematode abundance, the Shannon–Wiener index, and taxon richness did not differ significantly between sampling areas (Figure 2). The Shannon–Wiener index values for all sampling areas were less than 2.2.
Figure 2.
(a) Nematode abundance expressed in the number of individuals per volume of soil; (b) Shannon–Wiener index of nematode taxa; (c) nematode taxon richness. For all graphs, the minimum, first quartile (Q1), median, third quartile (Q3), and maximum values are shown. Same lowercase letters indicate non-significant differences between different sampling areas (p > 0.05).
A total of 33 nematode families were identified for all sampling areas. Figure 3 shows the absolute abundance (log-transformed) and distribution of nematode families per sampling area. The bacterivore families Cephalobidae, Plectidae, and Rhabditidae, and the herbivore families Tylenchidae and Anguinidae, were present in all sampling areas.
Figure 3.
Absolute abundance (log-transformed) and distribution of nematode families per sampling area.
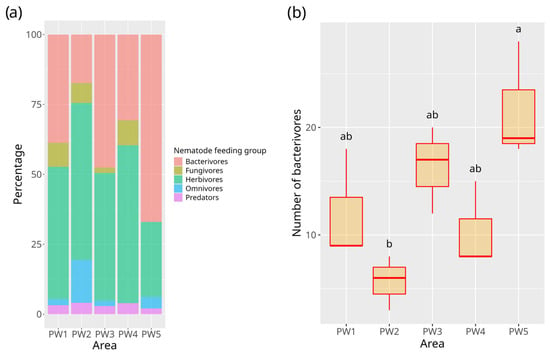
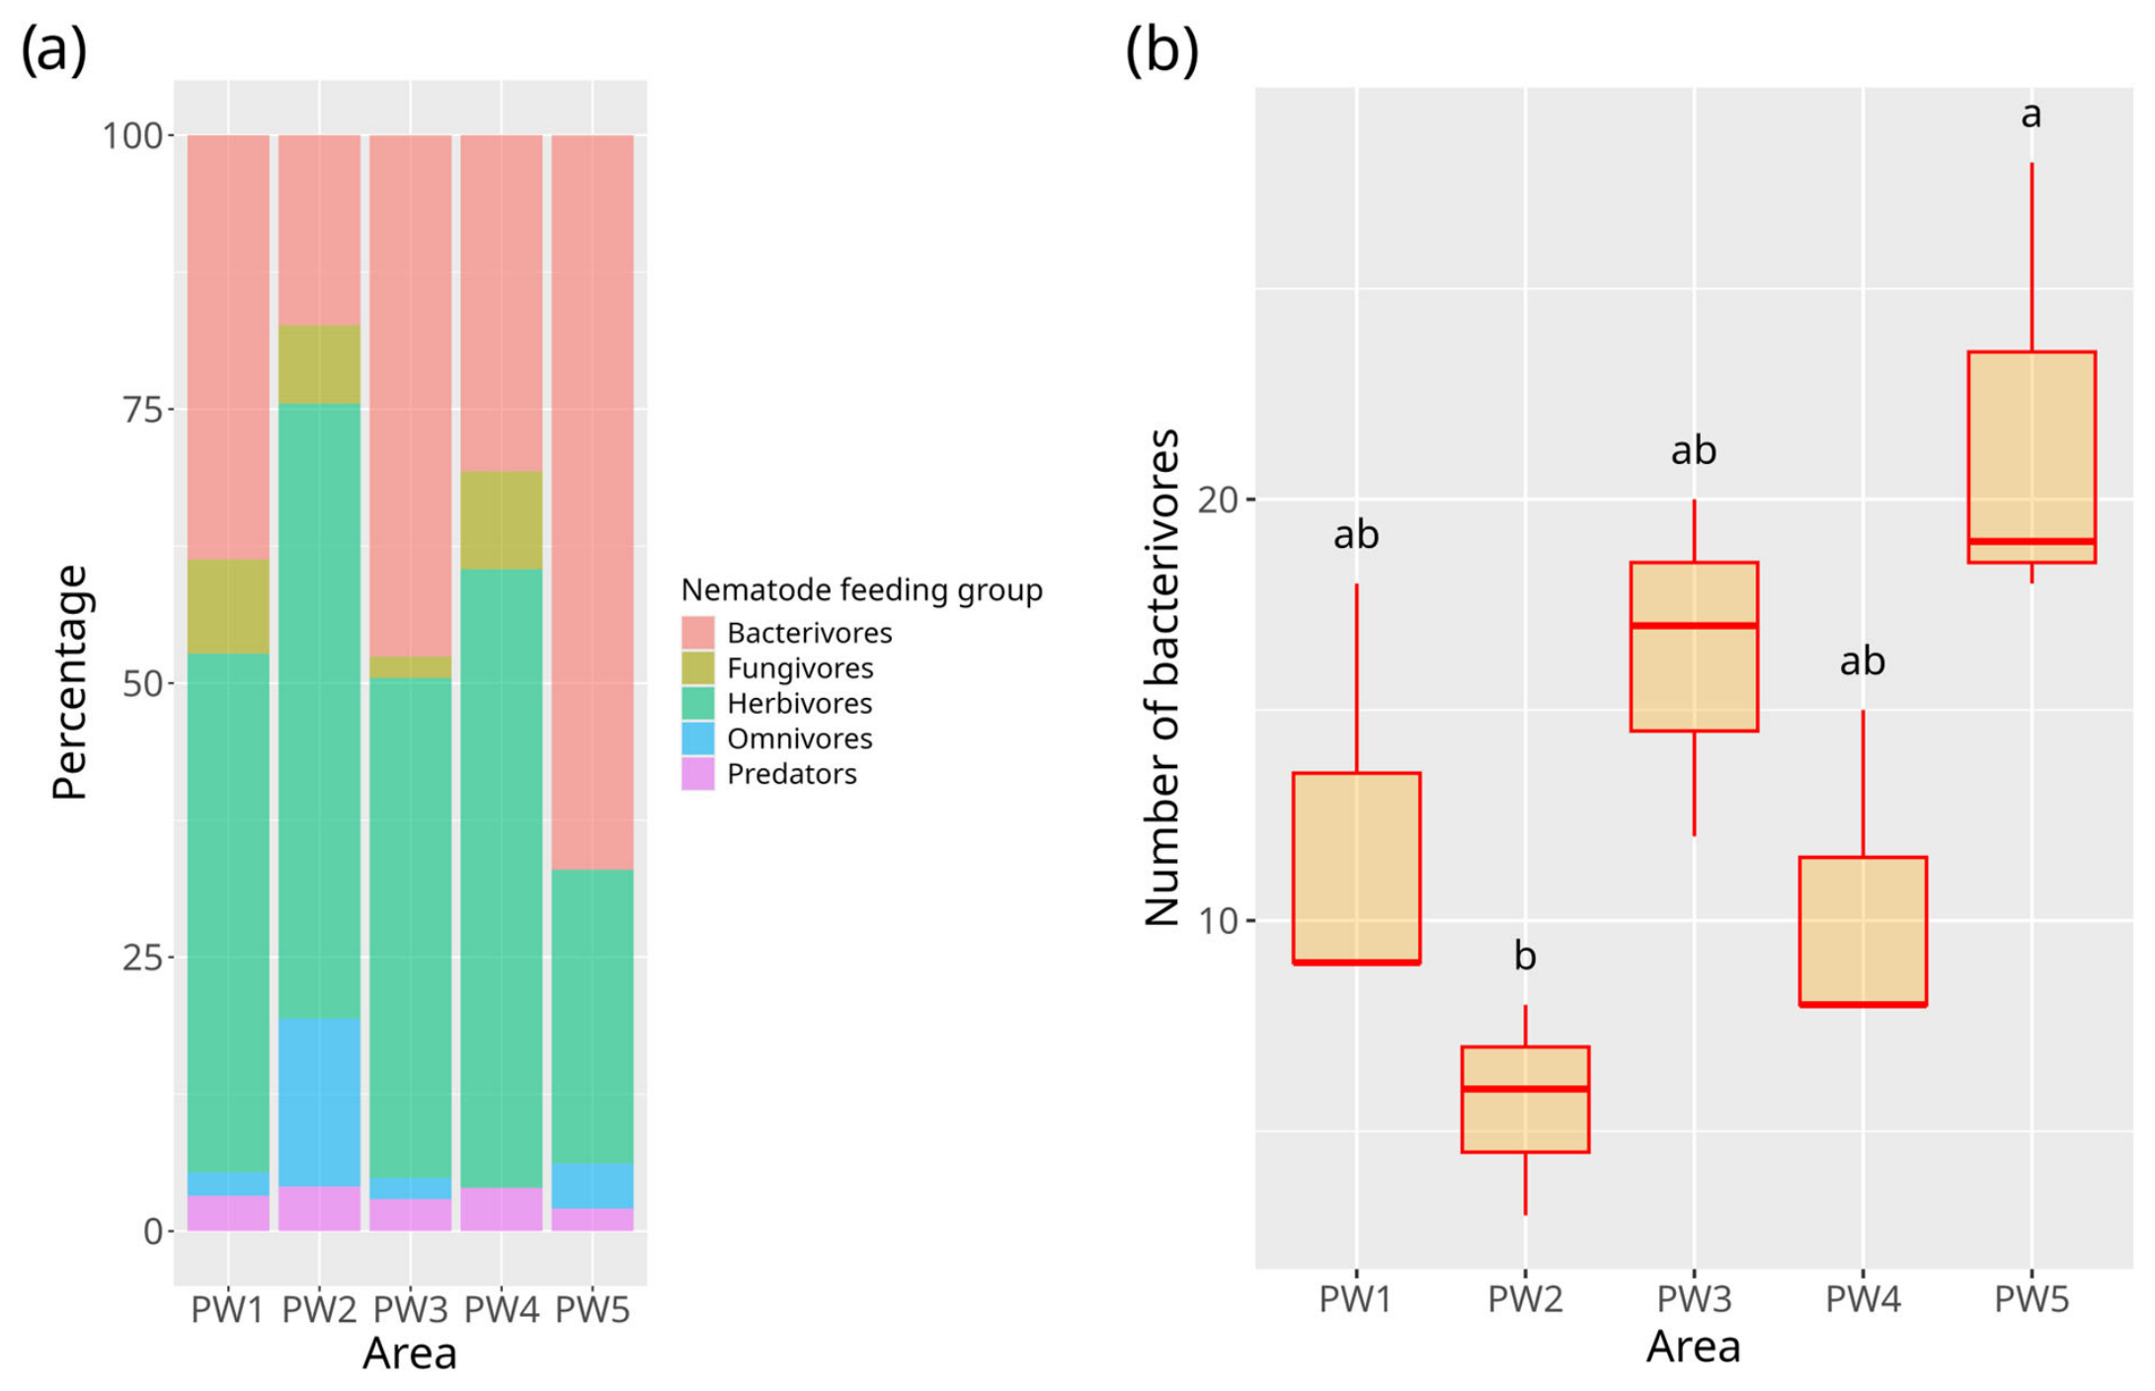
Bacterivores and herbivores were the predominant feeding groups across all sampling areas (Figure 4a). The PW5 area had a statistically higher proportion of bacterivores than the PW2 area but did not statistically differ from the rest of the areas (Figure 4b).
Figure 4.
(a) Feeding type composition of the nematode assemblage per sampling area; (b) differences in bacterivore abundances per sampling area. The minimum, first quartile (Q1), median, third quartile (Q3), and maximum values are shown. Different lowercase letters on the boxplots indicate significant differences (p < 0.05).
Table 2 shows the distribution of nematode indicators of enrichment (c-p 1), basal (c-p 2), and mature (c-p 3, 4, 5) soil conditions per sampling area. Members of the family Rhabditidae (enrichment c-p 1) were present in all sampling areas. Families Aphelenchidae and Aphelenchoididae (enrichment c-p 1 and basal c-p 2 indicators) were absent from sampling area PW5.
Table 2.
Presence of enrichment, basal, and maturity indicators per sampling area. Based on Bongers [77] and Bongers and Bongers [29].
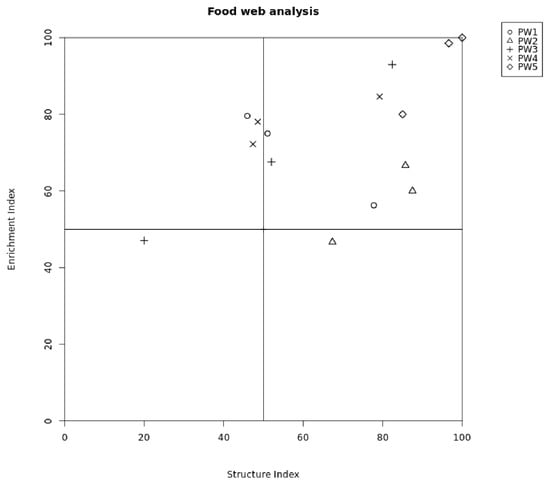
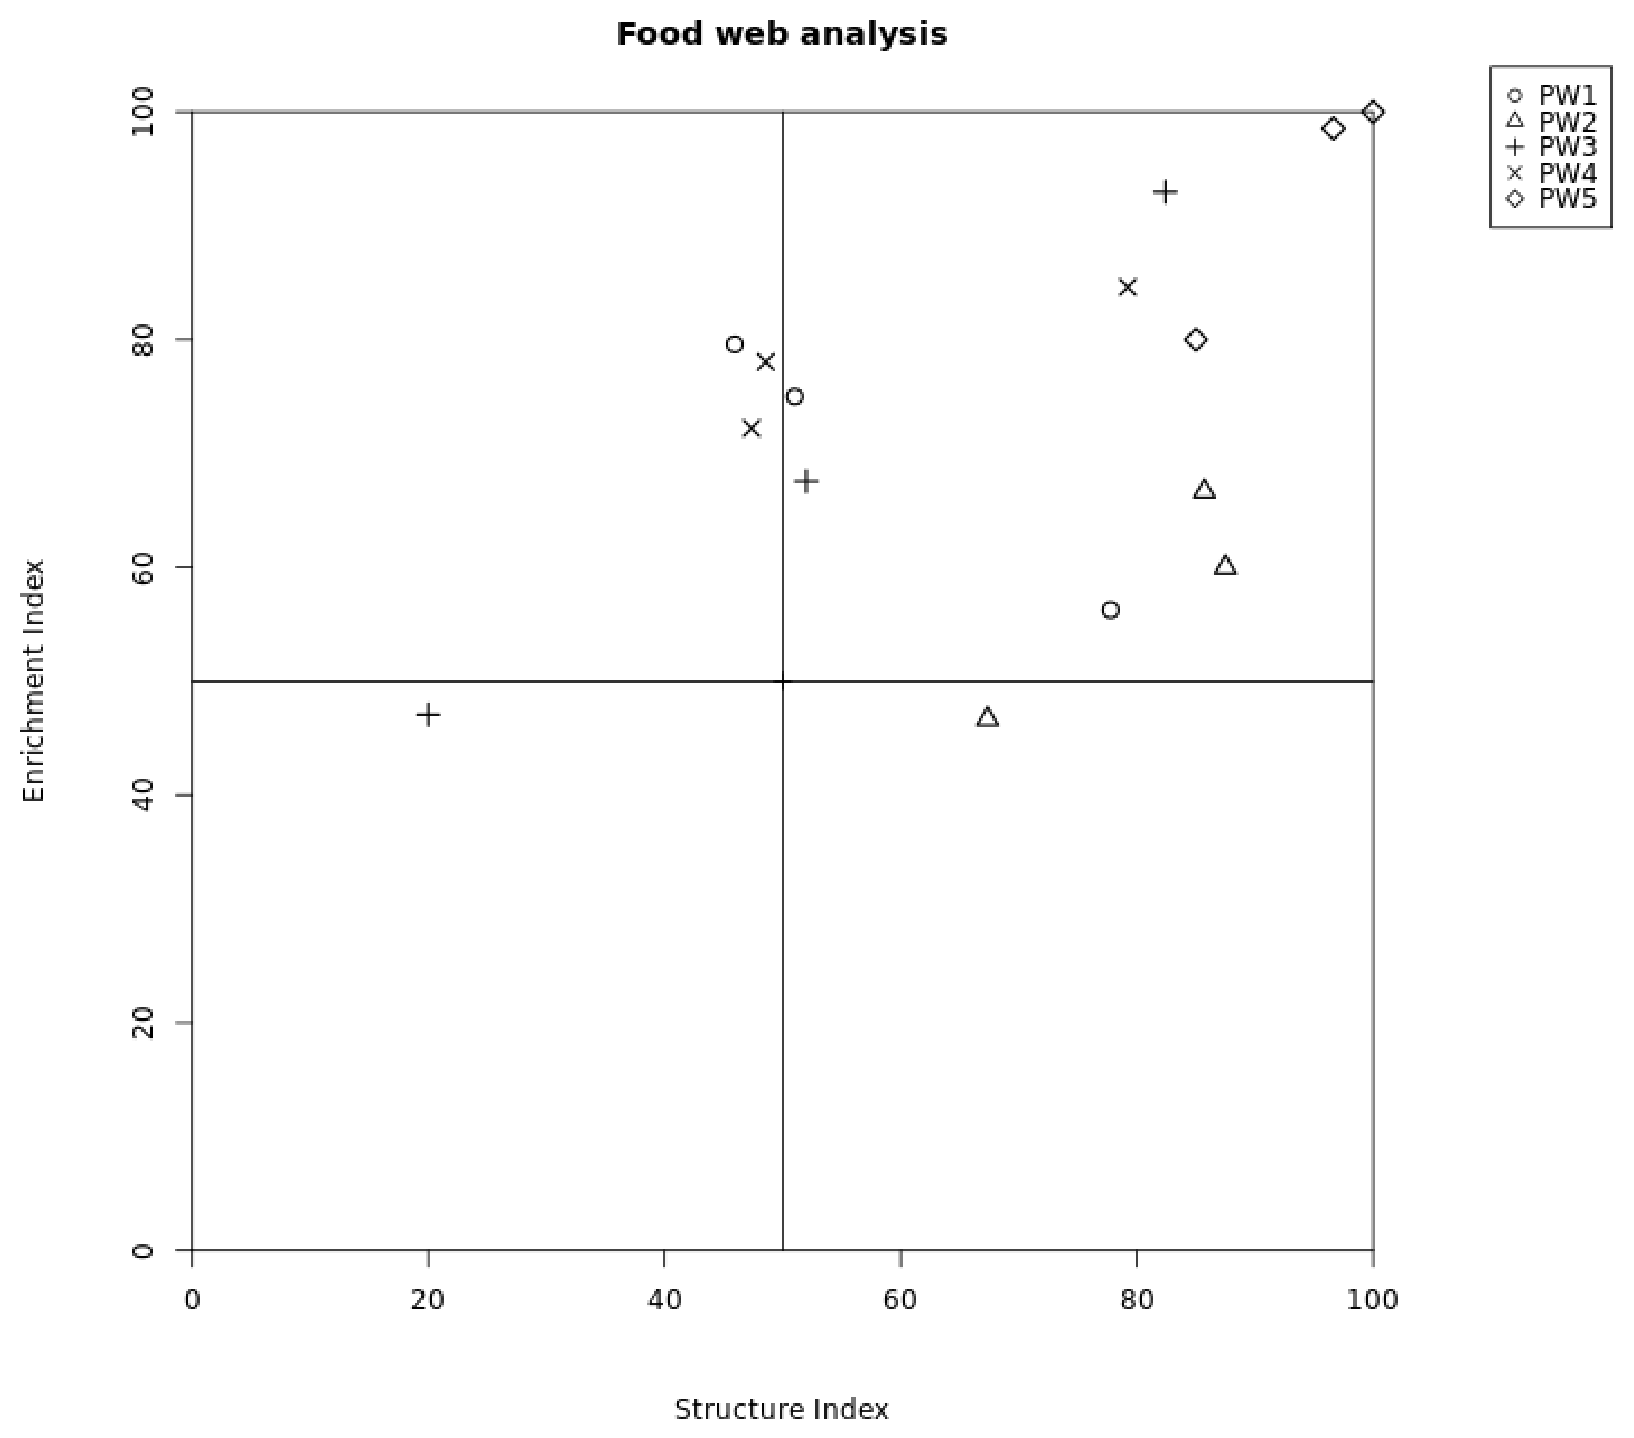
Faunal profiles representing the structure (SI) and enrichment (EI) conditions of the soil food web, based on the distribution of nematode families, suggested that most sampling areas had high values of nutrient enrichment expressed in the EI > 50 (Table 2 and Figure 5). In a similar way, the majority of sampling areas had values > 40 for the SI (Figure 5) indicated by the presence of the Alaimidae, Aporcelaimidae, Diphtherophoridae, Dorylaimidae, Leptonchidae, Nygolaimidae, Prismatolaimidae, Qudsianematidae, Rhabdolaimidae, Thornenematidae, Teratocephalidae, and Tripylidae families (Table 2).
Figure 5.
Faunal profiles representing the conditions of the soil food web expressed in the EI (y axis) and SI (x axis) per sampling area.
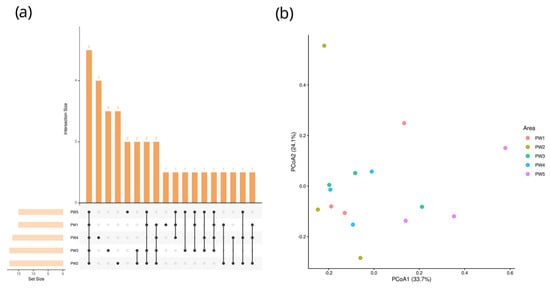
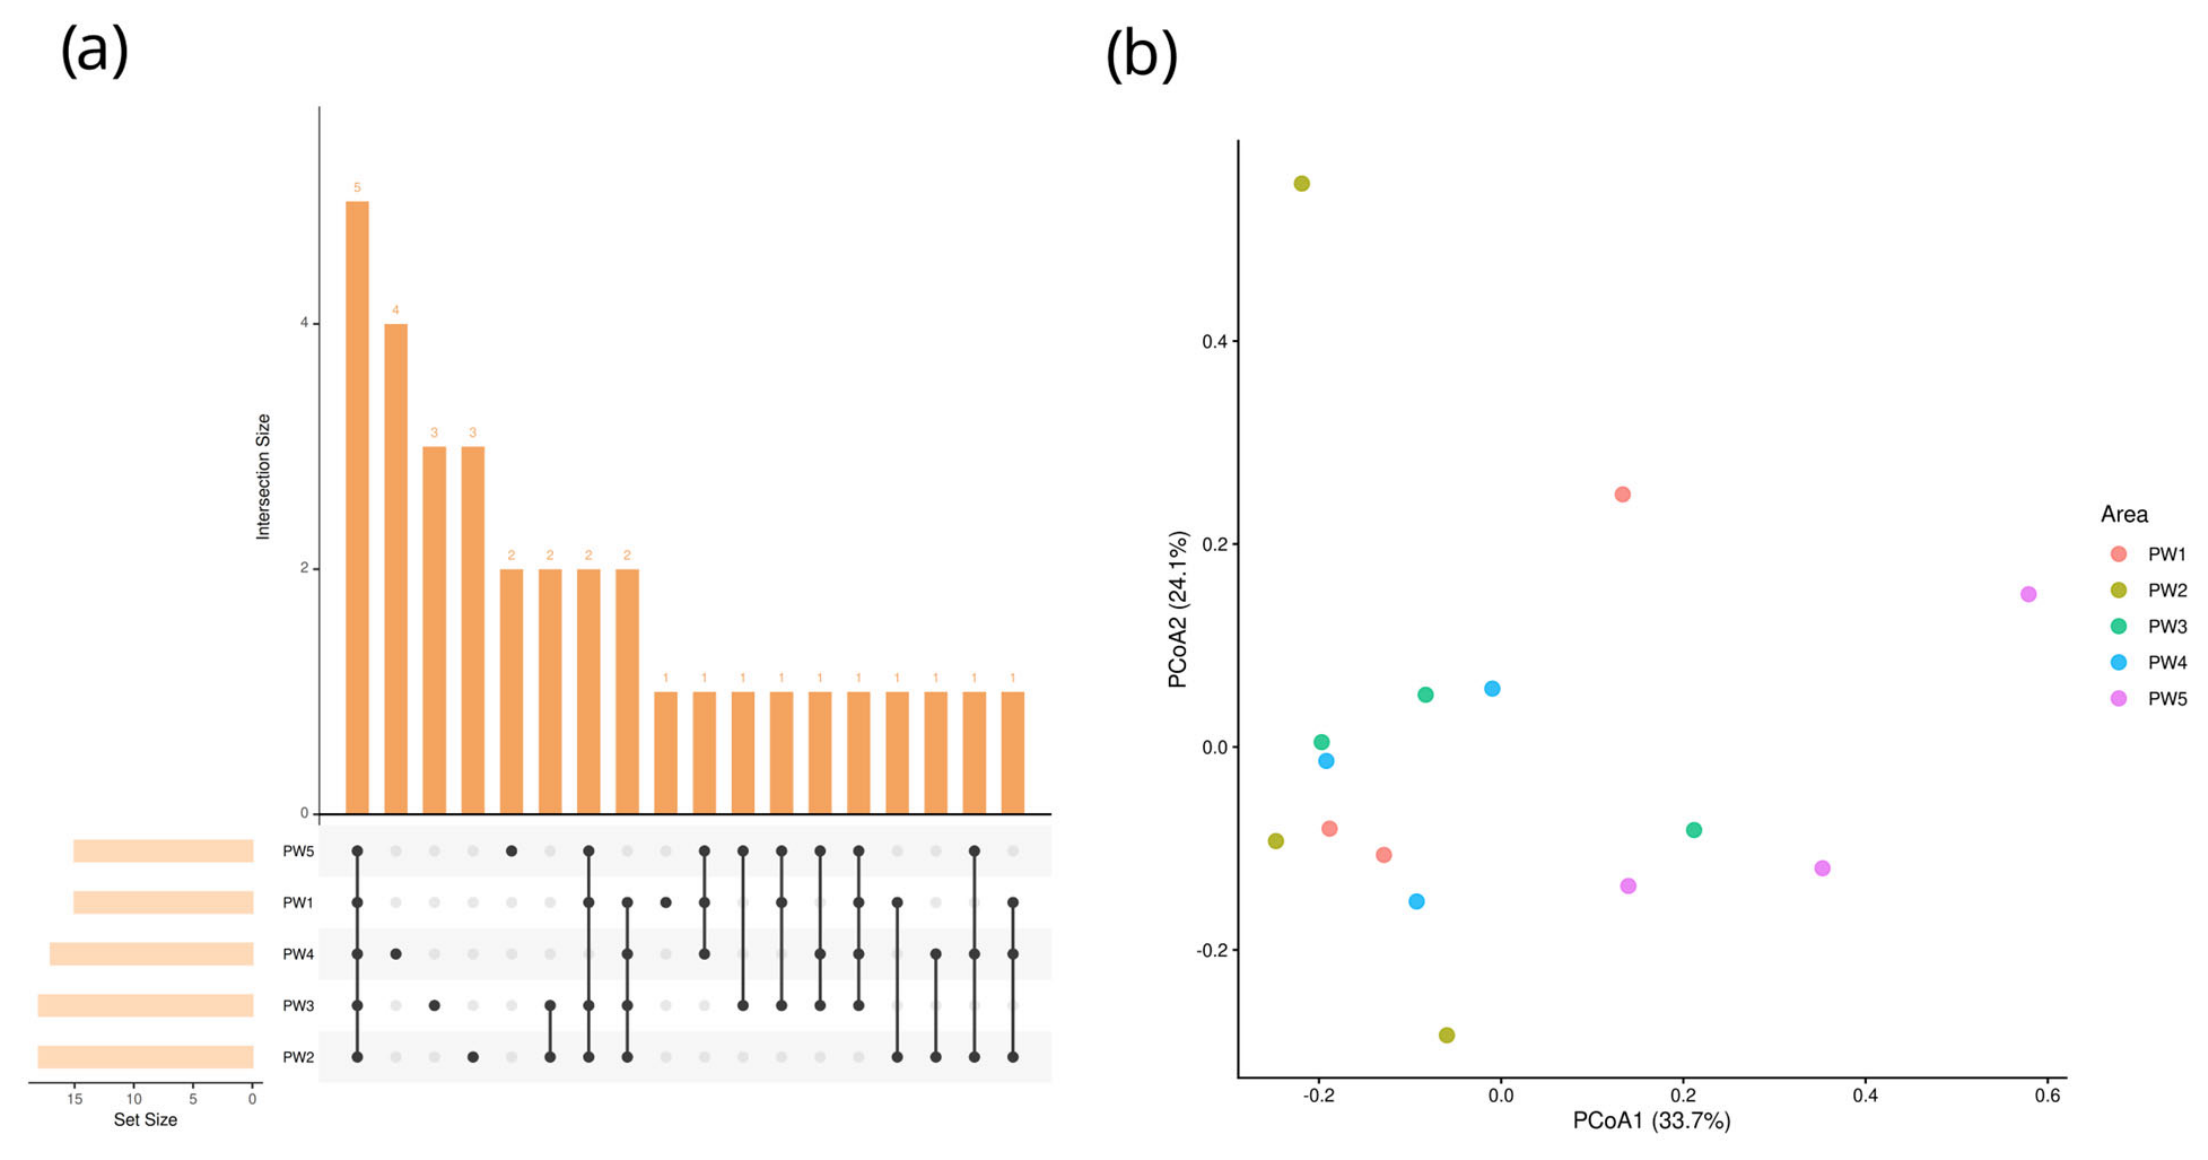
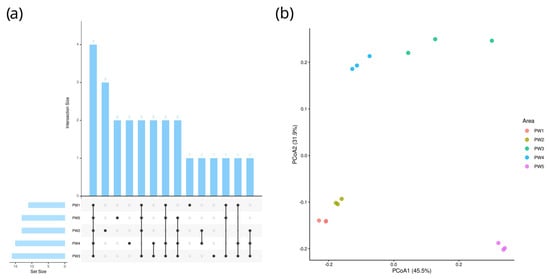
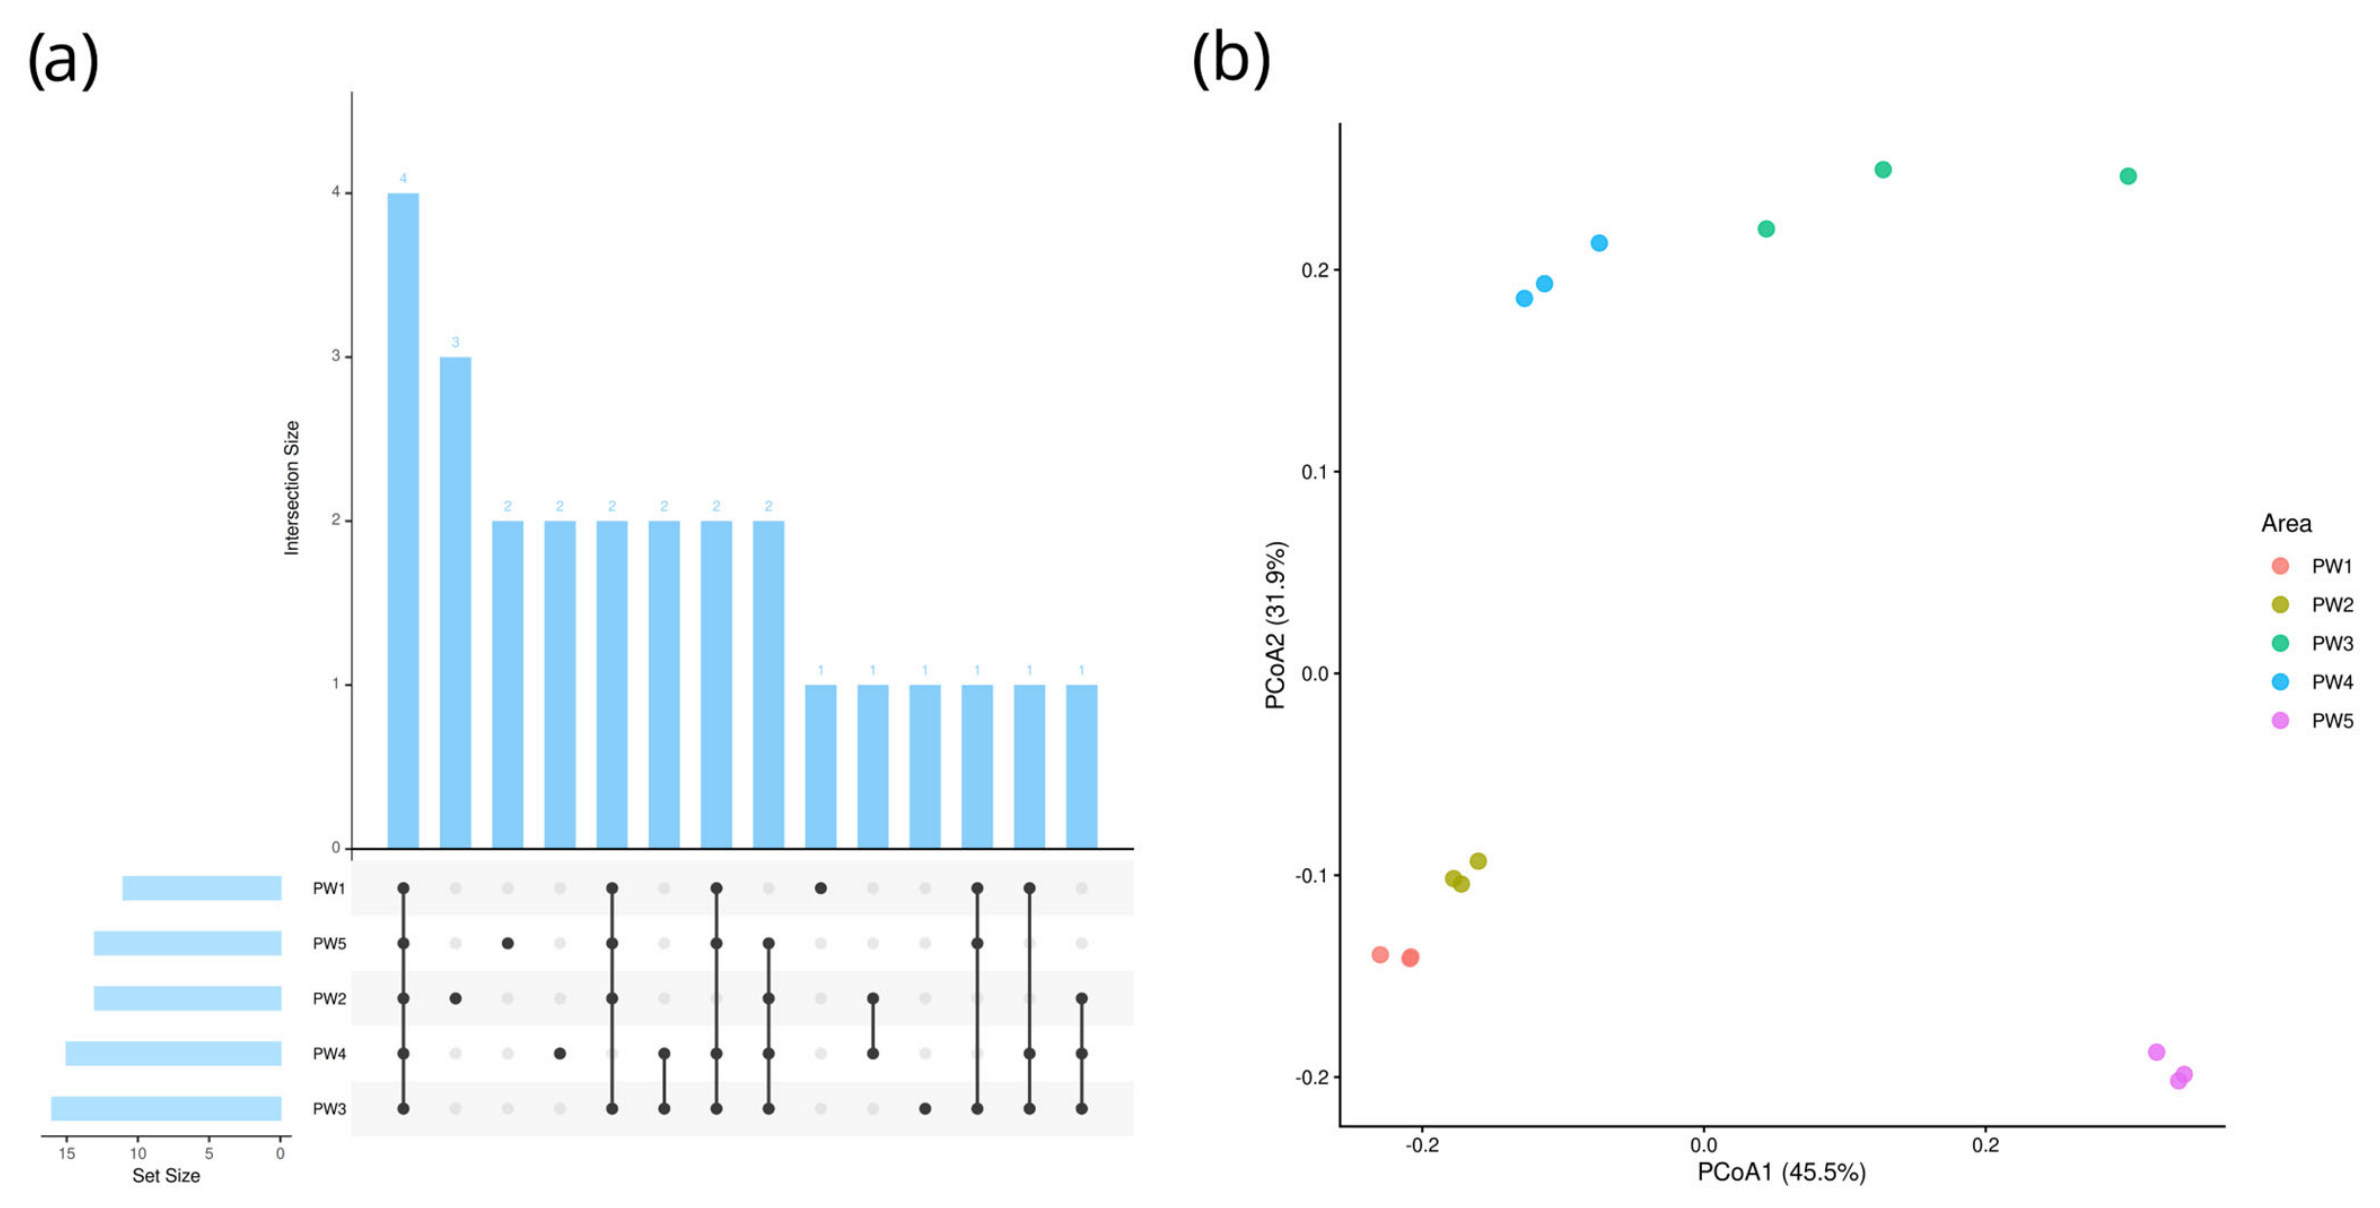
The families Anguinidae, Cephalobidae, Plectidae, Rhabditidae, and Tylenchidae were present in all sampling areas (Figure 6a). The PW4 area had four unique nematode families: Diphtherophoridae, Longidoridae, Prismatolaimidae, and Trischistomatidae.
Figure 6.
(a) Number of nematode families (horizontal bars) and number of unique or shared nematode families (vertical bars and individual or connected dots) in each sampling area. (b) Bray–Curtis dissimilarity PCoA ordination of nematode communities per sampling area.
The family Leptonchidae was unique to the PW1 area. The PW2 and PW3 areas had three unique nematode families. The families Monhysteridae, Aporcelaimidae, and Qudsianematidae were only present in the PW2 sampling area, whereas the families Aulolaimidae, Microlaimidae, and Nygolaimidae were unique for the PW3 area. The families Leptolaimidae and Nordiidae were only present in the PW5 area (Figure 6a).
Beta-diversity analyses for nematode assemblages showed that different sampling areas did not support different nematode communities (PERMANOVA, p > 0.05; Figure 6b). In addition, the PCoA ordination did not suggest strong groupings of nematode families on the primary axes, indicating that all sampling areas showed a similar composition of nematode communities.
3.2. Plant Diversity
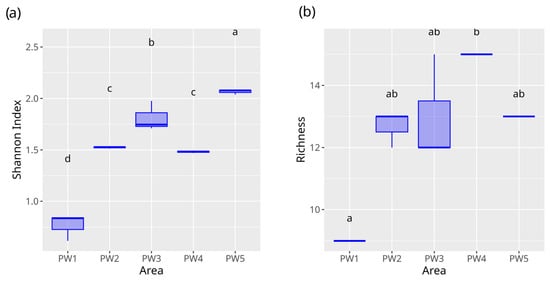
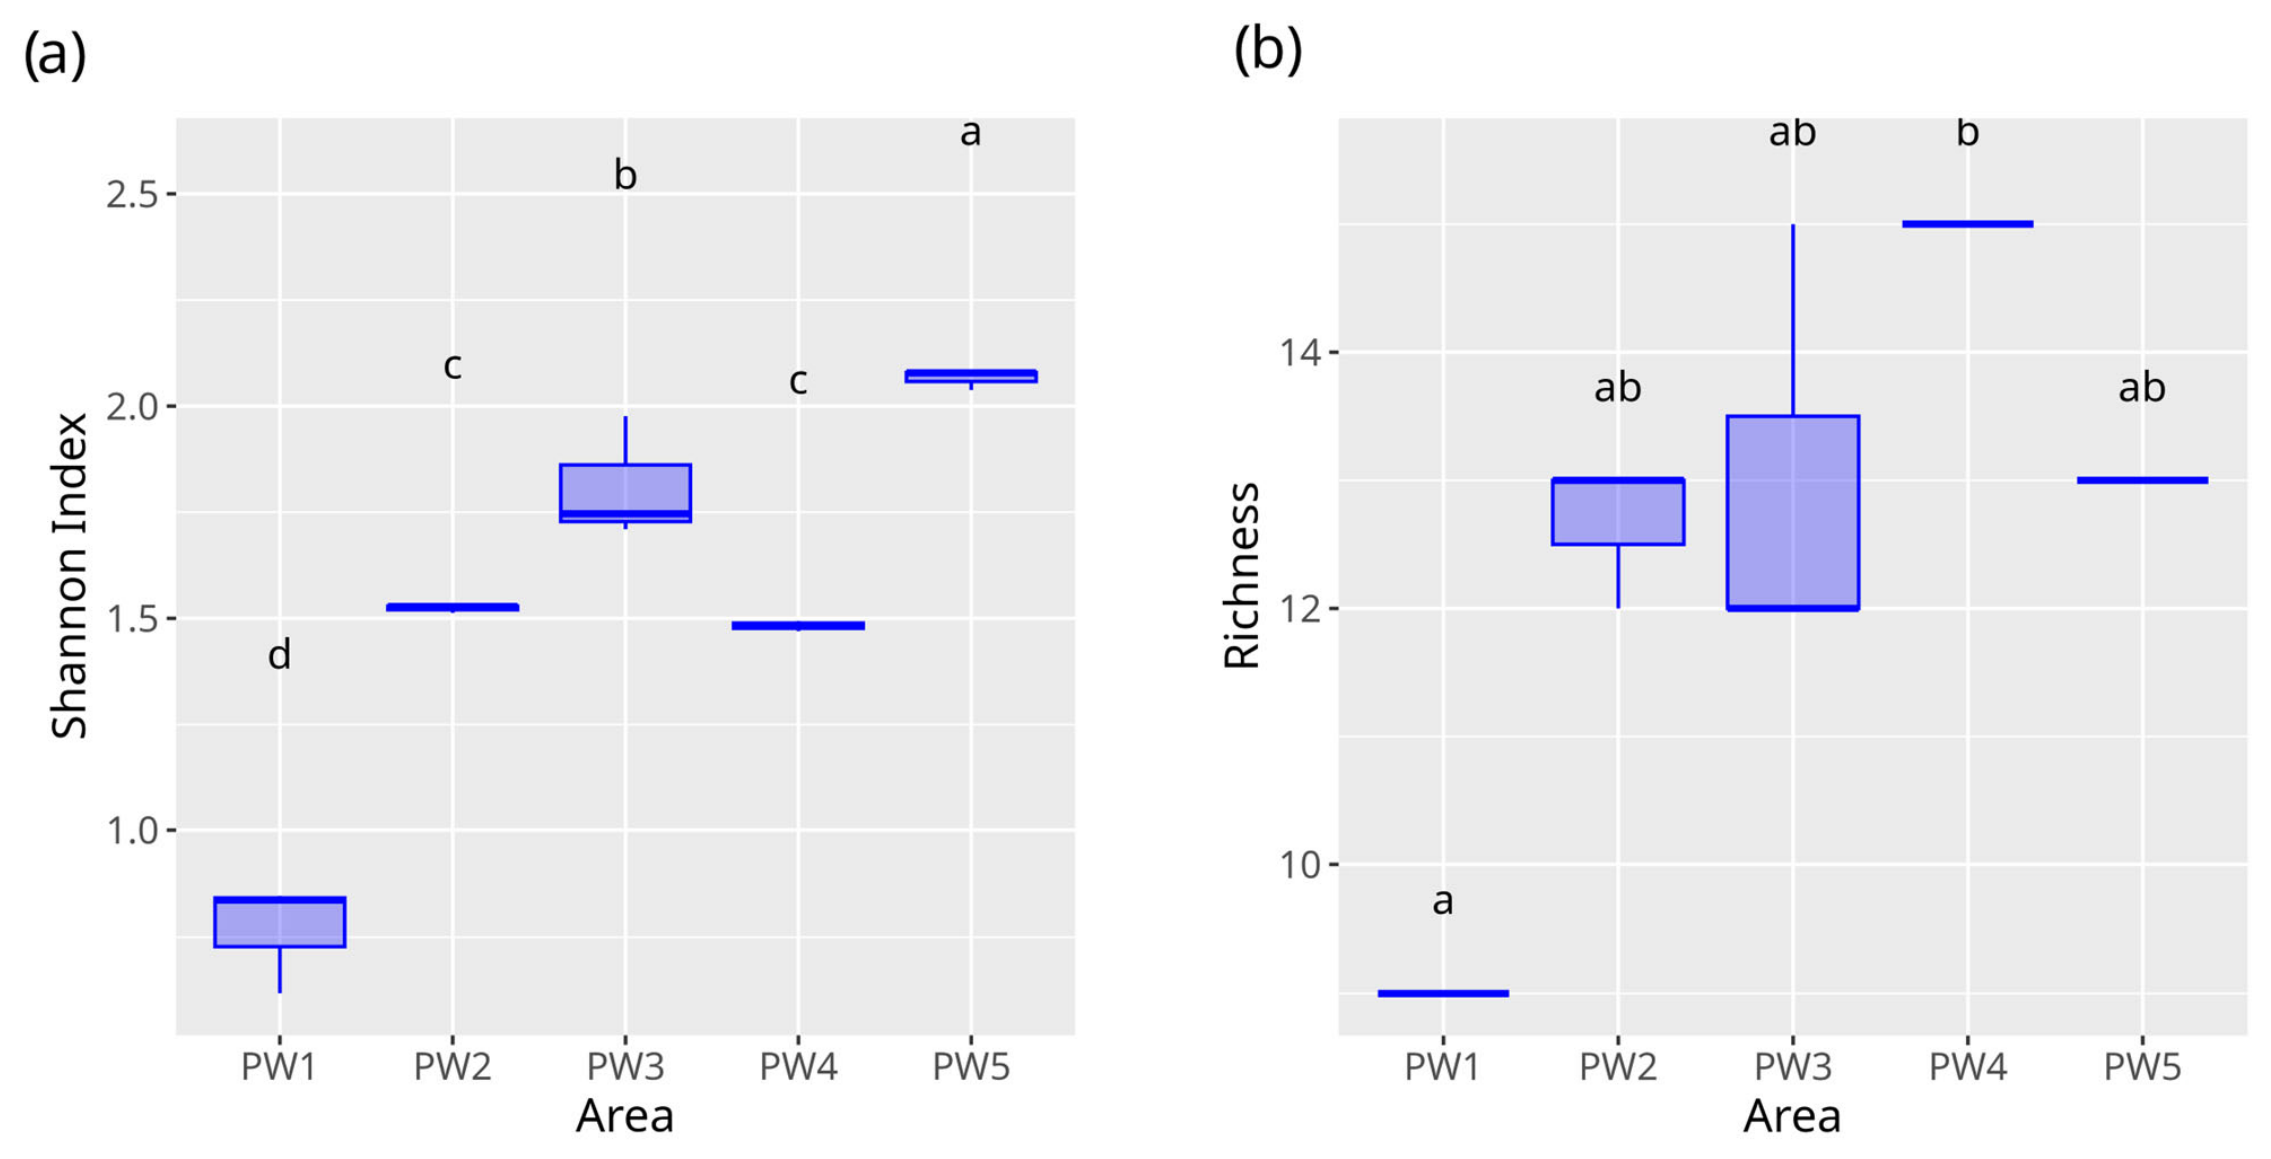
Plant diversity, expressed in the Shannon–Wiener index, differed between sampling areas (p < 0.05; Figure 7a).
Figure 7.
(a) Shannon–Wiener index of plant taxa; (b) plant taxon richness. Boxplots show median and interquartile ranges. Different lowercase letters indicate significant differences between different sampling areas (p < 0.05).
The PW5 area had the highest Shannon–Wiener index mean value (2.07), followed by the PW3 area (1.81). PW2 (1.52) and PW4 (1.48) areas did not differ in their Shannon–Wiener index mean values. The PW1 sampling area had the lowest mean value for the Shannon–Wiener index (0.77).
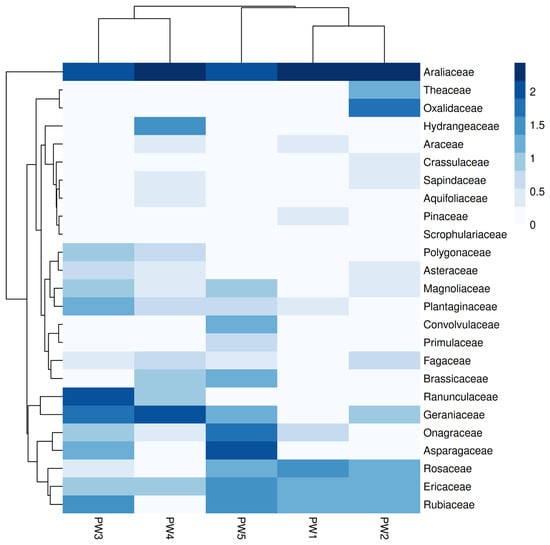
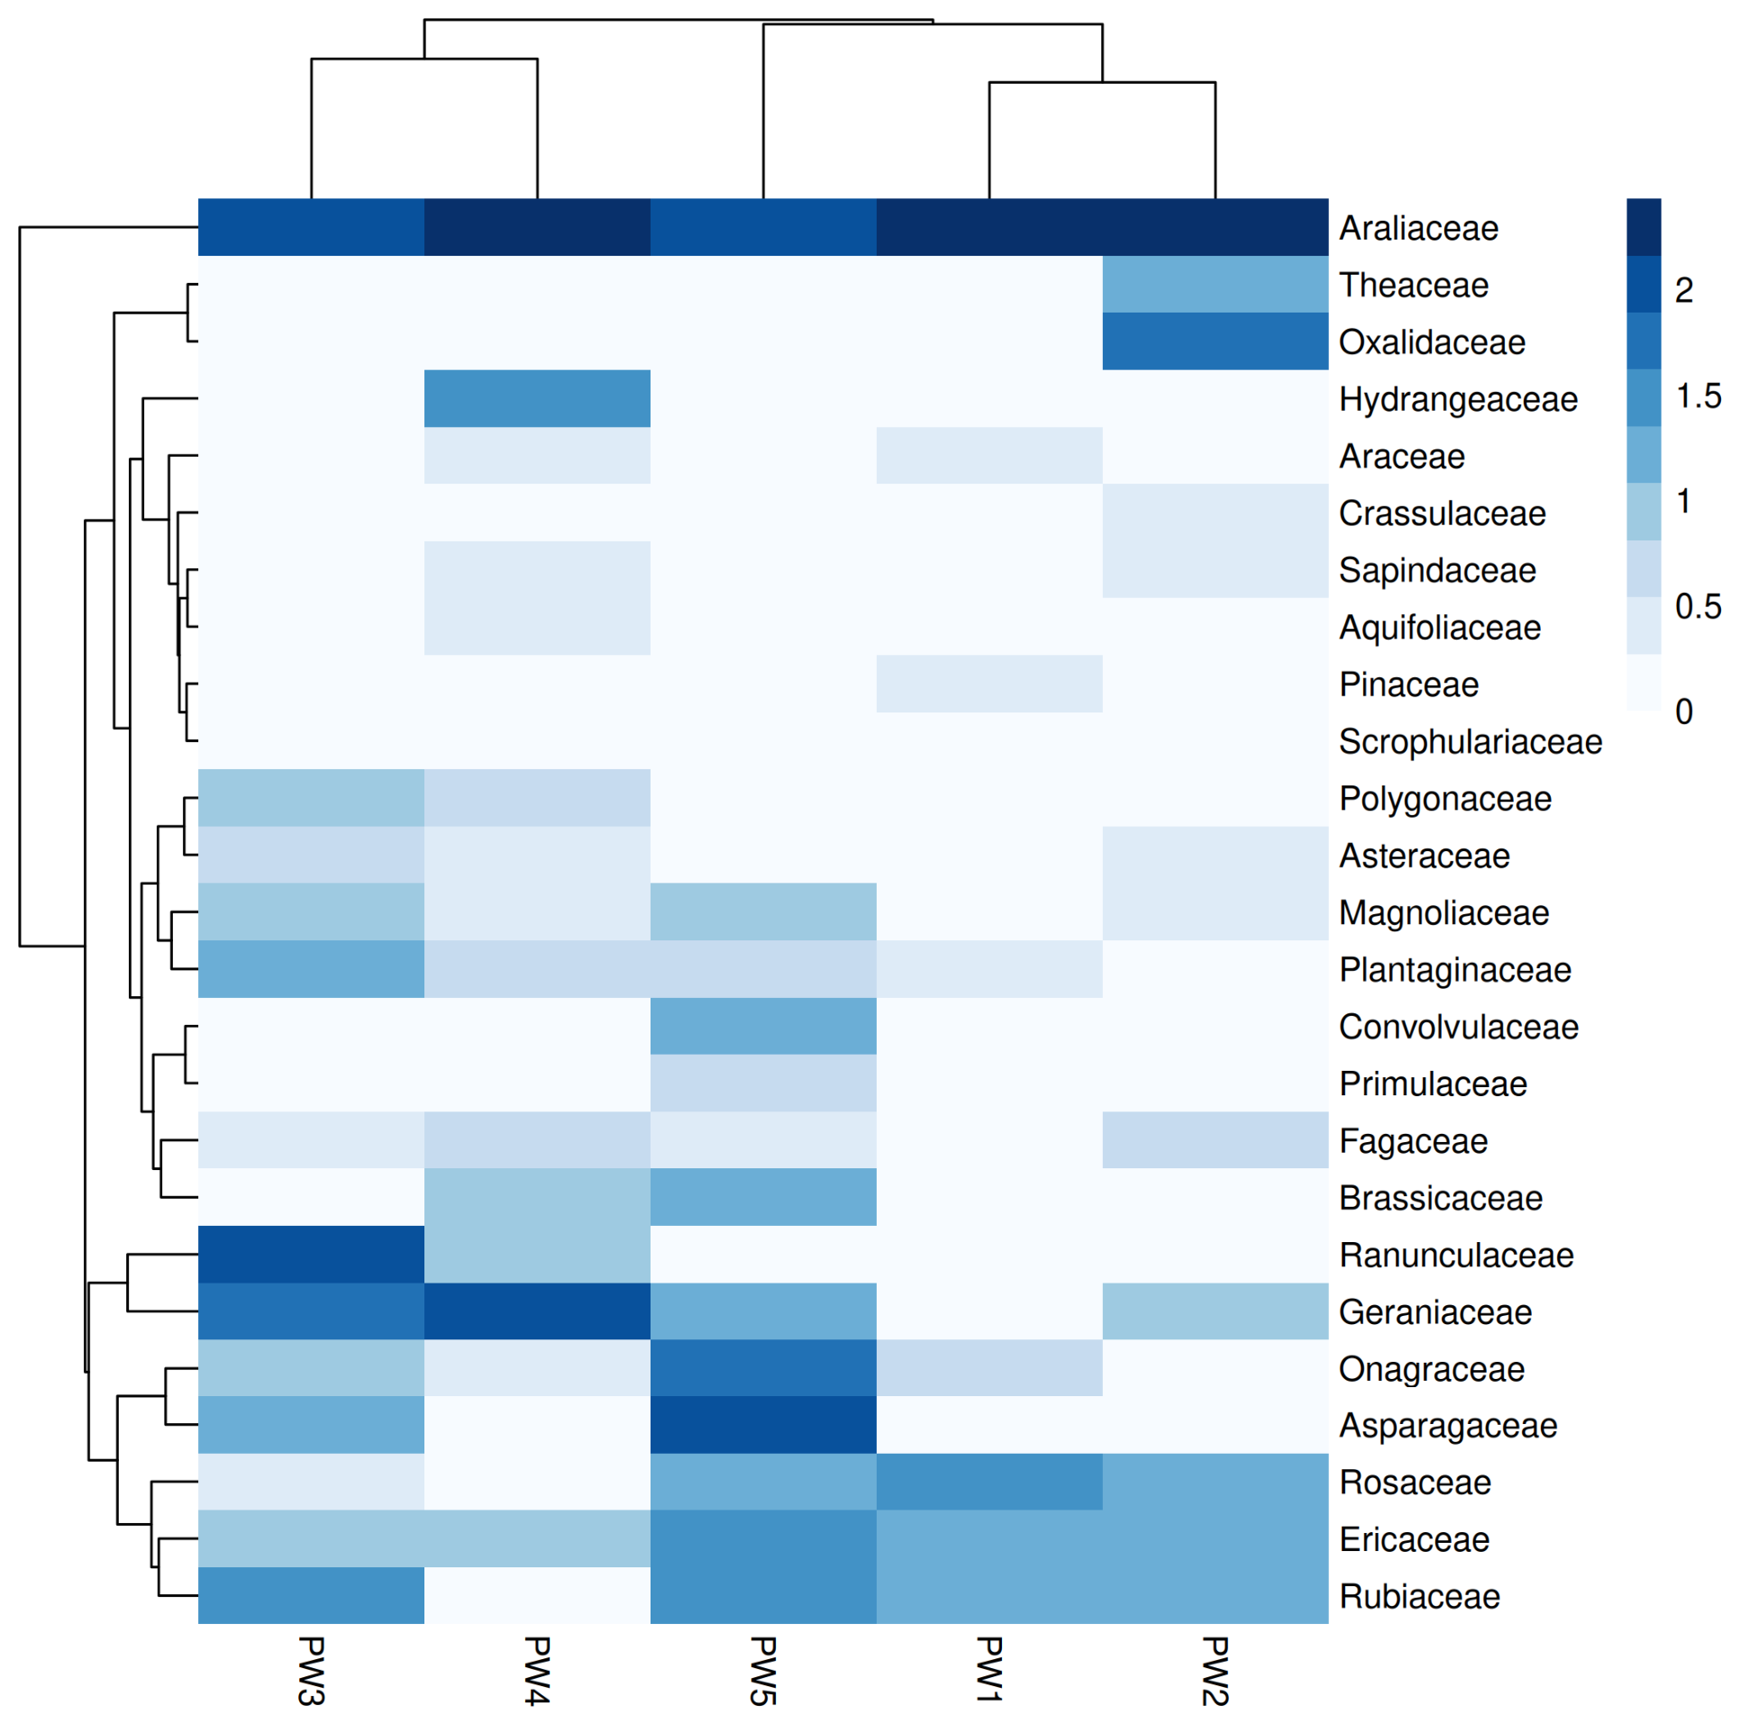
Sampling areas differed in plant diversity expressed in the taxon richness (p < 0.05; Figure 7b). The PW1 area had the lowest mean value (9) and did not significantly differ from the PW2 (12.67), PW3 (13), and PW5 (13) areas. However, it did differ significantly from the PW4 (15) area, which had the highest richness value. A total of 25 plant families were identified across all sampling areas. Figure 8 shows the absolute abundance (log-transformed) and distribution of plant families per sampling area. The families Ericaceae (i.e., Rhododendron sp.), Onagraceae (i.e., Epilobium sp.), Fagaceae (i.e., Quercus sp.), and Araliaceae (i.e., Hedera sp.) were present in all sampling areas. The PW5 area had the presence of the Magnoliaceae (i.e., Magnolia sp.), Plantaginaceae (i.e., Veronica sp.), Convolvulaceae (i.e., Calystegia sp.), Primulaceae (Lysimachia sp.), Fagaceae (i.e., Fagus sp.), Brassicaceae (i.e., Cardamine sp.), Araliaceae (i.e., Hedera sp.), Geraniaceae (i.e., Geranium sp.), Onagraceae (i.e., Epilobium sp.), Asparagaceae (i.e., Hyacinthoides sp.), Rosaceae (i.e., Rubus sp.), Ericaceae (i.e., Rhododendron sp.) and Rubiaceae (i.e., Galium sp.) families. The PW1 area had the presence of the Araliaceae, Araceae (i.e., Arum sp.), Pinaceae (i.e., Abies sp.), Plantaginaceae, Onagraceae, Rosaceae, Ericaceae, and Rubiaceae families.
Figure 8.
Absolute abundance (log-transformed) and distribution of plant families per sampling area.
The families Theaceae, Oxalidaceae, and Crassulaceae were unique for the PW2 area. The Hydrangeaceae and Aquifoliaceae families were only present in the PW4 area, whereas the families Convolvulaceae and the Primulaceae were unique in the PW5 area. The Pinaceae family was only present in the PW1 area, and the Scrophulariaceae family in the PW3 area (Figure 9a). Beta-diversity analyses for plant assemblages showed that different sampling areas supported different plant communities (PERMANOVA, p < 0.05; Figure 9b), and the PCoA ordination suggested strong groupings of plant families on the primary axes, indicating that all sampling areas showed different compositions of plant communities.
Figure 9.
(a) Number of plant families (horizontal bars) and number of unique or shared plant families (vertical bars and individual or collected dots) in each sampling area. (b) Bray–Curtis dissimilarity PCoA ordination of plant communities per sampling area. The PCoA ordination suggests groupings of plant families per sampling area on the primary axes.
4. Discussion
This study explored the distribution and diversity patterns of nematode and plant families in MCG and examined SH in different sampling areas based on nematode assemblages.
4.1. Nematode Abundance, Diversity, Community Structure, and Food Web Analysis
No differences between sampling areas for nematode abundance, Shannon–Wiener index and taxon richness were observed. Nematode abundance in all sampling sites was similar to those reported by Song et al. [78] for crop fields and gardens (1500 individuals per 100 g of soil), and by Hou et al. [79] for a botanical garden (200–500 individuals per 100 g of soil). Shannon–Wiener index values for nematode diversity for all sampling areas were in the range of 1.2 and 2.2, in accordance with those reported for croplands, with mean values of 2.1 [61,80]. Similarly, Wang et al. [81] found mean Shannon–Wiener index values of 2.2 for naturally covered and mixed cover species patterns for tea gardens. While the use of a higher-taxon approach (i.e., families) [82,83,84] is useful to represent diversity of lower taxonomic categories (i.e., species) for ecological monitoring, a higher taxonomic resolution at the genus or species level would potentially unveil differences in nematode diversity at a small spatial scale [84]. The distribution of the enrichment indicator families (c-p 1) Aphelenchidae, Aphelenchoididae, and Rhabditidae explains the high values in the EI (>50) for all sampling areas. In a similar way, the presence and abundance of the basal indicator families (c-p 2) Cephalobidae and Plectidae, and of the PPN families Tylenchidae and Anguinidae, in all sampling areas, contribute to the absence of nematode community composition differences. All sampling sites had the presence of maturity indicator families (c-p 3, 4, and 5), which explains the >40 values for the SI. The distribution and proportions of nematode families across sampling areas are consistent with those found in agricultural soils [85], revealing similar levels of enrichment and food web structure. In addition, evidence shows [86] that the abundance of bacterivores is higher in woodlands. The absence of differences in the community composition between sampling areas in MCG indicated a soil environmental homogeneity. Nematode communities vary in different environmental conditions, indicating habitat specialisation; however, the nematode community homogeneity for the sampling areas might indicate a low level of specialisation among different plant assemblages inside MCG, similar to woodland areas, as discussed by Vazquez et al. [80]. This homogeneity has been highlighted in previous studies [87] as a factor in the vulnerability to perturbations of the soil ecosystem and in reducing its resilience.
Based on the interpretation of the faunal profiles for soil food web analysis by Ferris et al. [25], the PW1 and PW4 areas presented a disturbance level between moderate and high. In addition, their decomposition channels were bacterial and balanced between fungal and bacterial, and a food web condition that was disturbed, but maturing. In the PW1 area, the presence of the families Leptonchidae and Thornenematidae was an indicator of structure in the community [88], more links in the soil food web, and multitrophic interactions [89]. In the PW4 area, the presence of the Diphtherophoridae, Prismatolaimidae, and Tripylidae families indicated a rudimentary community structure [25]. The PW1 and PW4 areas were similar in their food web diagnostics, indicating similar levels of disturbance and maturing food webs. The PW2 area showed an undisturbed and low-to-moderate disturbed ecosystem status, with decomposition channels balanced between fungal and bacterial, and a food web condition between maturing and structured. This is explained by the presence of the families Dorylaimidae and Qudsianematidae [90].
The PW3 area revealed an environmental disturbance level between stressed and moderate, with decomposition channels that ranged between fungal and bacterial, and a food web condition between degraded and maturing [25]. In the PW3 area, the presence of the Tripylidae family was an indication of a rudimentary community structure [25]. On the other hand, the presence of the Dorylaimidae family indicated more links in the food web, and the presence of the Thornenematidae family indicated environmental stability based on the food web structure [25]. The PW5 area displayed a level of disturbance between low and moderate, with the decomposition channel balanced between bacterial and fungal, and a food web condition that was maturing [25]. Similar to the PW3 area, the presence of the family Tripylidae in the PW5 area indicates a rudimentary community structure, and the presence of the Thornenematidae family is an indication of a structured soil food web [25].
Although a higher number of individuals is considered ideal for the calculation of NBIs, the number of nematodes used in this study was sufficient to provide an indication and estimation of the nematode communities found in MCG [91,92,93]. The absence of differences in nematode communities and the faunal profiles that indicate food web diagnostics revealed similar levels of perturbation and community structure across the sampling areas. All areas had soil food web characteristics similar to those found in managed environments like grasslands, pastures, and annual and perennial crop agricultural lands [25,94].
4.2. Plant Diversity
Unlike nematode communities, the results of this study indicated that plant communities were different between sampling areas. The observed differences in the plant distribution pattern responded partially to the planting strategies and design at MCG [50]. According to this design, the sampling areas had different ornamental species. For instance, the family Theaceae was characteristic of the PW2 area, whereas the families Magnoliaceae and the Hydrangeaceae were distinctive of the PW3 and PW4 areas, respectively. The Ericaceae family was found in all sampling areas.
Cultivated plant families (i.e., Ericaceae, Theaceae, Magnoliaceae) and wild and native growing plant families (i.e., Araliaceae, Plantaginaceae) were found in all sampling areas, highlighting the importance of gardens as habitats for plant diversity and, therefore, the provision of ecosystem services [2]. This pattern supports (1) evidence that suggests [95] that wild plant species contribute to community composition heterogeneity in garden ecosystems, and (2) the importance of the cultivation of native plant species for biodiversity conservation in these spaces [96]. The homogeneity of nematode communities and the heterogeneity of plant assemblages could be explained because of the taxonomic level used for this study (family), as the spatial patterning of nematode communities in relation to plant species also depends on taxonomic resolution and spatial scales [35]. However, plant diversity at the family level provides a reliable prediction of plant genera diversity [97,98].
Previous studies have reported [28] positive effects of plant diversity on nematode abundance and richness of bacterivores, omnivores, and predators. Evidence also suggests [99] that the highest nematode abundance and a higher SI [57] can be found in more diverse plant communities. In a similar way, research indicates [100,101] that high plant species richness maintains diversity and abundance of higher trophic levels (predators and omnivores) of nematodes, maintaining soil food web structure and complexity. For the present study and in a similar way as Dietrich et al. [28], most nematode families were present in different areas with different plant richness levels.
The study of plant and nematode diversity distribution patterns in built environments, like gardens for SH assessments, could be greatly benefited by the knowledge of management practices in different areas of those environments. Future research could explore the interplay between nematode and plant diversity, and the management history of built environments, to elaborate specific recommendations for the improvement of SH. The results of this study have allowed the creation of baseline information [102,103] on the nematode and plant communities across an ornamental garden. In addition, the study represents a starting point for monitoring programmes to estimate soil ecosystem resilience [104] and to continue to inform management strategies [105]. Future research should focus on the potential correlations between nematode abundance and feeding groups with plant diversity in ornamental gardens.
4.3. Limitations of the Study
This study highlighted the use of nematodes as environmental indicators of SH and their associated plant communities in an ornamental garden. Evidence suggests [80] that terrestrial nematode populations and communities respond to different environmental and seasonal conditions, causing changes in abundance; this response varies across ecosystems [106] and land use [107]. It is important to consider that this study was based on a single sampling event, and that diversity and NBIs were calculated based on the identification of 100 nematodes per sampling area. Therefore, the results of this study should be approached as a single temporal snapshot evaluation of SH. Further studies are necessary to establish how nematode populations and communities change over time for this type of ecosystem.
It must be noted that a higher taxonomic resolution at the genus or species level would provide a more comprehensive understanding of the relationships between nematode and plant communities. For example, evidence suggests [108,109] that in experimental conditions, plant species identity affects nematode diversity, the ratio of bacterivores to fungivores, and nematodes associated with roots. Information regarding nematode and plant species would also inform on host-specific plant–parasite interactions [61] for ornamental gardens.
5. Conclusions
This study provided an assessment of SH in an ornamental garden using nematodes as environmental indicators and plant diversity. Nematode diversity did not differ between sampling areas, whereas plant diversity did. In a similar way, nematode community composition did not differ between sampling areas, whereas plant communities were different. The plant families Ericaceae, Onagraceae, Fagaceae, and Araliaceae were present in all sampling areas. The nematode families Anguinidae, Cephalobidae, Plectidae, Rhabditidae, and Tylenchidae were present in all sampling areas. Using faunal profiles of nematodes for the analysis of the soil food web structure, it was revealed that all areas had similar levels of enrichment, with indications of maturing environments. SH assessments using nematodes as environmental indicators have not been extensively studied in gardens, so this study represents a step in this direction. This study represents a contribution to the knowledge of terrestrial nematodes and their relationship with plant diversity in a European ornamental garden, and a basis for future studies. In addition, it is a step towards the elaboration of potential management recommendations for maintaining SH across different built environments.
Author Contributions
Conceptualisation, L.M., C.T.D., Z.D. and T.K.-D.; methodology, A.V.-R., L.M., C.T.D., Z.D. and T.K.-D.; validation, C.T.D., A.V.-R. and T.K.-D.; formal analysis, C.T.D., A.V.-R. and T.K.-D.; investigation, C.T.D., A.V.-R. and T.K.-D.; resources, T.K.-D.; data curation, A.V.-R. and T.K.-D.; writing—original draft preparation, A.V.-R. and T.K.-D.; writing—review and editing, L.M., T.K.-D. and A.V.-R.; visualisation, A.V.-R.; supervision, L.M., Z.D., C.T.D. and T.K.-D.; project administration, T.K.-D.; funding acquisition, T.K.-D. All authors have read and agreed to the published version of the manuscript.
Funding
This research was funded by the South East Technological University, Ireland, grant number CW_2023_26_WSCH.
Data Availability Statement
The raw and curated data supporting the conclusions of this study will be made available by the authors on request.
Acknowledgments
The authors wish to thank the Estate Management, gardeners, horticulturists, and staff in Mount Congreve Gardens for providing access to the gardens, and the Research Office at the South East Technological University for their administrative support. The authors would like to thank the anonymous reviewers for their valuable comments and suggestions.
Conflicts of Interest
The authors declare no conflicts of interest.
Abbreviations
The following abbreviations are used in this manuscript:
| SH | Soil health |
| UNSDGs | United Nations Sustainable Development Goals |
| NBIs | Nematode-based indices |
| c-p | Coloniser–persister |
| MCG | Mount Congreve Gardens |
| m | Metres |
| cm | Centimetres |
| dbh | Diameter at breast height |
| ANOVA | Analysis of variance |
| SI | Structure index |
| EI | Enrichment index |
| PERMANOVA | Permutational multivariate analysis of variance |
References
- Lin, B.B.; Meyers, J.; Beaty, M.; Barnett, G.B. Urban green infrastructure impacts on climate regulation services in Sydney, Australia. Sustainability 2016, 8, 788. [Google Scholar] [CrossRef] [Scilit]
- Seitz, B.; Buchholz, S.; Kowarik, I.; Herrmann, J.; Neuerburg, L.; Wendler, J.; Winker, L.; Egerer, M. Land sharing between cultivated and wild plants: Urban gardens as hotspots for plant diversity in cities. Urban Ecosyst. 2022, 25, 927–939. [Google Scholar] [CrossRef] [Scilit]
- Fan, K.; Chu, H.; Eldridge, D.J.; Gaitan, J.J.; Liu, Y.R.; Sokoya, B.; Wang, J.T.; Hu, H.W.; He, J.Z.; Sun, W.; et al. Soil biodiversity supports the delivery of multiple ecosystem functions in urban greenspaces. Nat. Ecol. Evol. 2023, 7, 113–126. [Google Scholar] [CrossRef] [Scilit]
- Eldridge, D.J.; Cui, H.; Ding, J.; Berdugo, M.; Sáez-Sandino, T.; Duran, J.; Gaitan, J.; Blanco-Pastor, J.L.; Rodriguez, A.; Plaza, C.; et al. Urban greenspaces and nearby natural areas support similar levels of soil ecosystem services. npj Urban Sustain. 2024, 4, 15. [Google Scholar] [CrossRef] [Scilit]
- Felgentreff, E.S.; Jakubka, D.; Knapp, S.; Bernhardt-Römermann, M. The garden biodiversity index: A self-assessment tool for evaluating biodiversity in private gardens. Landsc. Urban Plan. 2025, 263, 105449. [Google Scholar] [CrossRef] [Scilit]
- Carrus, G.; Scopelliti, M.; Panno, A.; Lafortezza, R.; Colangelo, G.; Pirchio, S.; Ferrini, F.; Salbitano, F.; Agrimi, M.; Portoghesi, L.; et al. A Different Way to Stay in Touch with ‘Urban Nature’: The Perceived Restorative Qualities of Botanical Gardens. Front. Psychol. 2017, 8, 914. [Google Scholar] [CrossRef] [Scilit]
- Ciftcioglu, G.C.; Ebedi, S.; Abak, K. Evaluation of the relationship between ornamental plants—Based ecosystem services and human wellbeing: A case study from Lefke Region of North Cyprus. Ecol. Indic. 2019, 102, 278–288. [Google Scholar] [CrossRef] [Scilit]
- Teuber, S. A cultural ecosystem service perspective on the interactions between humans and soils in gardens. People Nat. 2021, 3, 1025–1035. [Google Scholar] [CrossRef] [Scilit]
- United Nations (UN). Resolution adopted by the General Assembly on 25 September 2015, Transforming Our World: The 2030 Agenda for Sustainable Development; United Nations: New York, NY, USS, 2015. [Google Scholar]
- Lopez-Villalobos, A.; Bunsha, D.; Austin, D.; Caddy, L.; Douglas, J.; Hill, A.; Kubeck, K.; Lewis, P.; Stormes, B.; Sugiyama, R.; et al. Aligning to the UN Sustainable Development Goals: Assessing Contributions of UBC Botanical Garden. Sustainability 2022, 14, 6275. [Google Scholar] [CrossRef] [Scilit]
- Hassen, G.; Ketema, H.; Haile, G.; Muanenda, M. Governance and infrastructure as pillars of performance: A socio-ecological analysis of Ethiopian botanical gardens. Plants People Planet. 2026, 1–17. [Google Scholar] [CrossRef] [Scilit]
- Petelos, E.; Antonaki, D.; Angelaki, E.; Lemonakis, C.; Alexandros, G. Enhancing Public Health and SDG 3 Through Sustainable Agriculture and Tourism. Sustainability 2025, 17, 6253. [Google Scholar] [CrossRef] [Scilit]
- Salisbury, A.; Al-Beidh, S.; Armitage, J.; Bird, S.; Bostock, H.; Platoni, A.; Tatchell, M.; Thompson, K.; Perry, J. Enhancing gardens as habitats for plant-associated invertebrates: Should we plant native or exotic species? Biodivers. Conserv. 2017, 26, 2657–2673. [Google Scholar] [CrossRef] [Scilit]
- Tresch, S.; Frey, D.; Bayon, R.C.L.; Mäder, P.; Stehle, B.; Fliessbach, A.; Moretti, M. Direct and indirect effects of urban gardening on aboveground and belowground diversity influencing soil multifunctionality. Sci. Rep. 2019, 9, 9769. [Google Scholar] [CrossRef] [Scilit]
- FAO. Towards a Sefinition of Soil Health; ITPS Soil Letters, 1; FAO: Rome, Italy, 2020. [Google Scholar]
- European Commission (EU). Communication from the Commission to the European Parliament, the Council, the European Economic and Social Committee and the Committee of the Regions. EU Soil Strategy for 2030 Reaping the Benefits of Healthy Soils for People, Food, Nature and Climate; COM(2021)699 final; European Commission: Brussels, Belgium, 2021. [Google Scholar]
- Scheu, S. The soil food web: Structure and perspectives. Eur. J. Soil. Biol. 2002, 38, 11–20. [Google Scholar] [CrossRef] [Scilit]
- Du Preez, G.; Daneel, M.; De Goede, R.; Du Toit, M.J.; Ferris, H.; Fourie, H.; Geisen, S.; Kakouli-Duarte, T.; Korthals, G.; Sánchez-Moreno, S.; et al. Nematode-based indices in soil ecology: Application, utility, and future directions. Soil. Biol. Biochem. 2022, 169, 108640. [Google Scholar] [CrossRef] [Scilit]
- Yeates, G.W.; Ferris, H.; Moens, T.; Van der Putten, W.H. The Role of Nematodes in Ecosystems. In Nematodes as Environmental Indicators; Wilson, M.J., Kakouli-Duarte, T., Eds.; CAB International: Wallingford, UK, 2009; pp. 1–44. [Google Scholar]
- Van Elsas, J.D.; Chiurazzi, M.; Mallon, C.A.; Elhottovā, D.; Krištůfek, V.; Salles, J.F. Microbial diversity determines the invasion of soil by a bacterial pathogen. Proc. Natl. Acad. Sci. USA 2012, 109, 1159–1164. [Google Scholar] [CrossRef] [Scilit]
- Ferris, H.; Tuomisto, H. Unearthing the role of biological diversity in soil health. Soil Biol. Biochem. 2015, 85, 101–109. [Google Scholar] [CrossRef] [Scilit]
- Karpinska, A.; Ryan, D.; Germaine, K.; Dowling, D.; Forrestal, P.; Kakouli-Duarte, T. Soil Microbial and Nematode Community Response to the Field Application of Recycled Bio-Based Fertilisers in Irish Grassland. Sustainability 2021, 13, 12342. [Google Scholar] [CrossRef] [Scilit]
- Mukhopadhyay, M.; Mukherjee, A.; Ganguli, S.; Chakraborti, A.; Roy, S.; Choudhury, S.S.; Subramaniyan, V.; Kumarasamy, V.; Sayed, A.A.; El-Demerdash, F.M.; et al. Marvels of Bacilli in soil amendment for plant-growth promotion toward sustainable development having futuristic socio-economic implications. Front. Microbiol. 2023, 14, 1293302. [Google Scholar] [CrossRef] [Scilit]
- Kibblewhite, M.G.; Ritz, K.; Swift, M.J. Soil health in agricultural systems. Philos. Trans. R. Soc. B Biol. Sci. 2008, 363, 685–701. [Google Scholar] [CrossRef] [Scilit]
- Ferris, H.; Bongers, T.; de Goede, R.G. A framework for soil food web diagnostics: Extension of the nematode faunal analysis concept. Appl. Soil Ecol. 2001, 18, 13–29. [Google Scholar] [CrossRef] [Scilit]
- Bongers, T.; Ferris, H. Nematode community structure as a bioindicator in environmental monitoring. Trends Ecol. Evol. 1999, 14, 224–228. [Google Scholar] [CrossRef] [Scilit]
- Ferris, H.; Bongers, T. Indices developed specifically for analysis of nematode assemblages. In Nematodes as Environmental Indicators; Wilson, M.J., Kakouli-Duarte, T., Eds.; CAB International: Wallingford, UK, 2009; pp. 124–145. [Google Scholar]
- Dietrich, P.; Cesarz, S.; Liu, T.; Roscher, C.; Eisenhauer, N. Effects of plant species diversity on nematode community composition and diversity in a long-term biodiversity experiment. Oecologia 2021, 197, 297–311. [Google Scholar] [CrossRef] [Scilit]
- Bongers, T.; Bongers, M. Functional diversity of nematodes. Appl. Soil Ecol. 1998, 10, 239–251. [Google Scholar] [CrossRef] [Scilit]
- Neher, D.A. Ecology of plant and free-living nematodes in natural and agricultural soil. Annu. Rev. Phytopathol. 2010, 48, 371–394. [Google Scholar] [CrossRef] [Scilit]
- Sieriebriennikov, B.; Ferris, H.; de Goede, R.G.M. NINJA: An automated calculation system for nematode-based biological monitoring. Eur. J. Soil Biol. 2014, 6, 90–93. [Google Scholar] [CrossRef] [Scilit]
- Howland, A.D.; Quintanilla, M. Plant-Parasitic Nematodes and their Effects on Ornamental Plants: A Review. J. Nematol. 2023, 55, 20230007. [Google Scholar] [CrossRef] [Scilit]
- Veen, G.F.; Olff, H.; Duyts, H.; Van Der Putten, W.H. Vertebrate herbivores influence soil nematodes by modifying plant communities. Ecology 2010, 91, 828–835. [Google Scholar] [CrossRef] [Scilit]
- Van Der Putten, W.H. Belowground drivers of plant diversity. Science 2017, 355, 134–135. [Google Scholar] [CrossRef] [Scilit]
- Wilschut, R.; Geisen, S. Nematodes as Drivers of Plant Performance in Natural Systems. Trends Plant Sci. 2020, 26, 237–247. [Google Scholar] [CrossRef] [Scilit]
- Sylvain, Z.A.; Wall, D.H. Linking soil biodiversity and vegetation: Implications for a changing planet. Am. J. Bot. 2011, 98, 517–527. [Google Scholar] [CrossRef] [Scilit]
- Khan, Z.; Kim, Y.H. A review on the role of predatory soil nematodes in the biological control of plant parasitic nematodes. Appl. Soil Ecol. 2007, 35, 370–379. [Google Scholar] [CrossRef] [Scilit]
- Thakur, M.P.; Geisen, S. Trophic regulations of the soil microbiome. Trends Microbiol. 2019, 27, 771–780. [Google Scholar] [CrossRef] [Scilit]
- Li, G.; Liu, T.; Whalen, J.K.; Wei, Z. Nematodes: An overlooked tiny engineer of plant health. Trends Plant Sci. 2023, 29, 52–63. [Google Scholar] [CrossRef] [Scilit]
- Kalinkina, D.S.; Sushchuk, A.A.; Matveeva, E.M.; Zenkova, I.V. Communities of Soil Nematodes in the Subcrown Areas of Trees Introduced on the Territory of the Polar—Alpine Botanical Garden. Contemp. Probl. Ecol. 2019, 12, 59–70. [Google Scholar] [CrossRef] [Scilit]
- Harris, J.A.; Evans, D.L.; Mooney, S.J. A new theory for soil health. Eur. J. Soil Sci. 2022, 73, e13292. [Google Scholar] [CrossRef] [Scilit]
- Pawlett, M.; Hannam, J.A.; Knox, J.W. Redefining soil health. Microbiology 2021, 167, 001030. [Google Scholar] [CrossRef] [Scilit]
- Calderón-Sanou, I.; Ballabio, C.; Breitkreuz, C.; Eisenhauer, N.; Jones, A.; Köninger, J.; Küsel, K.; Orgiazzi, A.; Panagos, P.; Reitz, T.; et al. An Integrated Assessment of European Soil Health and Restoration Potential. J. Sustain. Agric. Environ. 2026, 5, e70163. [Google Scholar] [CrossRef] [Scilit]
- Geisen, S.; Wilschut, R.A.; Liu, M.; Wall, D.H.; Sánchez-Moreno, S. Soil Nematode Communities Across Large Spatial Scales. In Nematodes as Environmental Indicators: From Theory to Practice; Kakouli-Duarte, T., Korthals, G., Sánchez-Moreno, S., Du Preez, G., De Goede, R.G.M., Eds.; CAB International: Wallingford, UK, 2026; pp. 192–205. [Google Scholar]
- Stone, D.; Costa, D.; Daniell, T.J.; Mitchell, S.M.; Topp, C.F.E.; Griffiths, B.S. Using nematode communities to test a European scale soil biological monitoring programme for policy development. Appl. Soil Ecol. 2016, 97, 78–85. [Google Scholar] [CrossRef] [Scilit]
- Diamond, J.; Sills, P. Soils of Co. Waterford. In Teagasc, Soil Survey Bulletin No. 44; National Soil Survey of Ireland: Carlow, Ireland, 2011; p. 314. [Google Scholar]
- National Parks and Wildlife Service. Conservation Objectives: Lower River Suir SAC 002137, Version 1; National Parks and Wildlife Service, Department of Arts, Heritage, Regional, Rural and Gaeltacht Affairs: Dublin, Ireland, 2017. [Google Scholar]
- National Parks and Wildlife Service. Site synopsis: Lower River Suir SAC (Site Code: 002137); Department of Housing, Local Government and Heritage: Dublin, Ireland, 2026. [Google Scholar]
- Royal Horticultural Society of Ireland. Mount Congreve Gardens. 2026. Available online: https://rhsi.ie/partner/mount-congreve-gardens/ (accessed on 28 July 2026).
- Mount Congreve Gardens. Our Story. Available online: https://mountcongreve.com/our-story/ (accessed on 5 January 2026).
- Zhang, H.L.; Guo, L.Y.; Nizamani, M.M.; Wang, H.F. Distribution patterns and drivers of urban green space and plant diversity in Haikou, China. Front. Plant Sci. 2023, 14, 1202115. [Google Scholar] [CrossRef] [Scilit]
- Sadia, S.; Waheed, M.; Firdous, S.; Arshad, F.; Fonge, B.A.; Al-Andal, A. Ecological analysis of plant community structure and soil effects in subtropical forest ecosystem. BMC Plant Biol. 2024, 24, 1275. [Google Scholar] [CrossRef] [Scilit]
- Hallman, J.; Viaene, N. PM 7/119(1) Nematode extraction. EPPO Bull. 2013, 43, 471–495. [Google Scholar] [CrossRef] [Scilit]
- Van Bezooijen, J. Methods and Techniques in Nematology; Wageningen University: Wageningen, The Netherlands, 2006; 118p. [Google Scholar]
- Bongers, T. De Nematoden van Nederland; KNNV-Bibliotheekuitgave 46: Schoorl, The Netherlands, 1994; 408p. [Google Scholar]
- Manzanilla-López, R.H.; Hunt, D.; Marbán-Mendoza, N.; Infante-Gil, S. Practical Plant Nematology, 2nd ed.; CAB International: Wallingford, UK, 2025. [Google Scholar]
- Ikoyi, I.; Grange, G.; Finn, J.A.; Brennan, F.P. Plant diversity enhanced nematode-based soil quality indices and changed soil nematode community structure in intensively-managed agricultural grasslands. Eur. J. Soil Biol. 2023, 118, 103542. [Google Scholar] [CrossRef] [Scilit]
- Kolde, R. pheatmap: Pretty Heatmaps, 2019. R Package Version 1.0.12. Available online: https://CRAN.R-project.org/package=pheatmap (accessed on 16 April 2026).
- R Core Team. R: A Language and Environment for Statistical Computing; R Foundation for Statistical Computing: Vienna, Austria, 2024; Available online: https://www.R-project.org/ (accessed on 7 April 2026).
- Yeates, G.W.; Bongers, T. Nematode diversity in agroecosystems. Agric. Ecosyst. Environ. 1999, 74, 113–135. [Google Scholar] [CrossRef] [Scilit]
- Li, J.; Peng, P.; Zhao, J. Assessment of soil nematode diversity based on different taxonomic levels and functional groups. Soil. Ecol. Lett. 2020, 2, 33–39. [Google Scholar] [CrossRef] [Scilit]
- Bittinger, K. abdiv: Alpha and Beta Diversity Measures. R Package Version 0.2.0. 2020. Available online: https://CRAN.R-project.org/package=abdiv (accessed on 8 April 2026).
- Oksanen, J.; Simpson, G.; Blanchet, F.; Kindt, R.; Legendre, P.; Minchin, P.; O’Hara, R.; Solymos, P.; Stevens, M.; Szoecs, E.; et al. vegan: Community Ecology Package, 2026. R Package Version 2.7-5. 2026. Available online: https://CRAN.R-project.org/package=vegan (accessed on 9 June 2026).
- Wickham, H. ggplot2: Elegant Graphics for Data Analysis; Springer-Verlag New York: New York, NY, USA, 2016. [Google Scholar]
- Conway, J.; Gehlenborg, N. UpSetR: A More Scalable Alternative to Venn and Euler Diagrams for Visualizing Intersecting Sets. R Package Version 1.4.1. 2026. Available online: https://CRAN.R-project.org/package=UpSetR (accessed on 16 June 2026).
- Kassambara, A. rstatix: Pipe-Friendly Framework for Basic Statistical Tests. R Package Version 1.1.0. 2026. Available online: https://rpkgs.datanovia.com/rstatix/ (accessed on 12 September 2026).
- Bienu, S.A.; Lubalega, T.K.; Khasa, D.P.; Kombi kaviriri, D.; Yang, L.; Yuhua, L.; Eyul’Anki, D.M.; Tango, E.K.; Katula, H.B. Floristic diversity and structural parameters on the forest tree population in the Luki biosphere reserve, Democratic Republic of Congo. Glob. Ecol. Conserv. 2023, 44, e02489. [Google Scholar] [CrossRef] [Scilit]
- Knauer, A.; Betras, T.; Royo, A.A.; Diggins, T.P.; Carson, W.P. Understory plant communities fail to recover species diversity after excluding deer for nearly 20 years. Can. J. For. Res. 2023, 53, 379–390. [Google Scholar] [CrossRef] [Scilit]
- Popp, M.R.; Zimmermann, N.E.; Brun, P. Evaluating the use of automated plant identification tools in biodiversity monitoring—A case study in Switzerland. Ecol. Inform. 2025, 90, 103316. [Google Scholar] [CrossRef] [Scilit]
- Campbell, N.; Peacock, J.; Bacon, K.L. A repeatable scoring system for assessing Smartphone applications ability to identify herbaceous plants. PLoS ONE 2023, 18, e0283386. [Google Scholar] [CrossRef] [Scilit]
- Hart, A.G.; Bosley, H.; Hooper, C.; Perry, J.; Sellors-Moore, J.; Moore, O.; Goodenough, A.E. Assessing the accuracy of free automated plant identification applications. People Nat. 2023, 5, 929–937. [Google Scholar] [CrossRef] [Scilit]
- Melanson, J.B.; Kelly, T.T.; Waters, S.; Kremen, C.; Ponisio, L.C. Agricultural intensification shapes community composition and parasite prevalence of native but not introduced bumble bees. Basic. Appl. Ecol. 2026, 96, 151836. [Google Scholar] [CrossRef] [Scilit]
- Fitter, R.S.R.; Fitter, R.; Fitter, A.; Blamey, M. Wild Flowers of Britain and Northern Europe; HarperCollins: London, UK, 1996; 352p. [Google Scholar]
- Poland, J.; Clement, E.J. The Vegetative Key to the British flora: A New Approach to Naming British Vascular Plants Based on Vegetative Characters; John Poland: Southampton, UK, 2009; 526p. [Google Scholar]
- Wanigasinghe, I.M.; Haughland, D.L.; Pyle, L.A.; Villeneuve, M.A.L.; Nielsen, S.E. Evaluating species identification apps as a tool for small plot-based surveys of vascular plants in Alberta, Canada. AoB Plants 2026, 18, plag020. [Google Scholar] [CrossRef] [Scilit]
- Graves, S.; Piepho, H.; Selzer, L.; Dorai-Raj, S. multcompView: Visualizations of Paired Comparisons. R Package Version 0.1-10. 2024. Available online: https://CRAN.R-project.org/package=multcompView (accessed on 20 April 2026).
- Bongers, T. The maturity index: An ecological measure of environmental disturbance based on nematode species composition. Oecologia 1990, 83, 14–19. [Google Scholar] [CrossRef] [Scilit]
- Song, D.; Pan, K.; Tariq, A.; Sun, F.; Li, Z.; Sun, X.; Zhang, L.; Olusanya, O.A.; Wu, X. Large-scale patterns of distribution and diversity of terrestrial nematodes. Appl. Soil Ecol. 2017, 114, 161–169. [Google Scholar] [CrossRef] [Scilit]
- Hou, C.; Xia, S.; Liu, S.; Jiao, J.; Xiong, Y.; Chen, H.; Ma, C.; Wu, J. Plant phenological functional types shape soil nematode abundance and function by regulating aboveground biomass and soil dissolved organic carbon in tropical Xishuangbanna. Geoderma 2026, 466, 17665. [Google Scholar] [CrossRef] [Scilit]
- Vazquez, C.; de Goede, R.G.M.; Korthals, G.W.; Rutgers, M.; Schouten, A.J.; Creamer, R. The effects of increasing land use intensity on soil nematodes: A turn towards specialism. Funct. Ecol. 2019, 33, 2003–2016. [Google Scholar] [CrossRef] [Scilit]
- Wang, L.; Wang, Y.; Xiu, W.; Tan, B.; Li, G.; Zhao, J.; Yang, D.; Zhang, G.; Zhang, Y. Responses of Soil Microbial and Nematode Communities to Various Cover Crop Patterns in a Tea Garden of China. Int. J. Environ. Res. Public Health 2022, 19, 2695. [Google Scholar] [CrossRef] [Scilit]
- Tälle, M.; Ranius, T.; Öckinger, E. The usefulness of surrogates in biodiversity conservation: A synthesis. Biol. Conserv. 2023, 288, 110384. [Google Scholar] [CrossRef] [Scilit]
- Souza de Oliveira, S.; Ortega, J.C.G.; dos Santos Ribas, L.G.; Guimarães Lopes, V.; Bini, L.M. Higher taxa are sufficient to represent biodiversity patterns. Ecol. Indic. 2020, 111, 105994. [Google Scholar] [CrossRef] [Scilit]
- Pires, M.M.; Grech, M.G.; Stenert, C.; Maltchik, L.; Epele, L.B.; McLean, K.I.; Kneitel, J.M.; Bell, D.A.; Greig, H.S.; Gagne, C.R.; et al. Does taxonomic and numerical resolution affect the assessment of invertebrate community structure in New World freshwater wetlands? Ecol. Indic. 2021, 125, 107437. [Google Scholar] [CrossRef] [Scilit]
- Shaw, E.A.; Boot, C.M.; Moore, J.C.; Wall, D.H.; Baron, J.S. Long-term nitrogen addition shifts the soil nematode community to bacterivore-dominated and reduces its ecological maturity in a subalpine forest. Soil. Biol. Biochem. 2019, 130, 177–184. [Google Scholar] [CrossRef] [Scilit]
- Niu, X.; Wang, P.; Xie, Z.; Gao, M.; Qian, S.; Saifutdinov, R.; Aspe, N.M.; Wu, D.; Guan, P. Soil nematode metacommunities in different land covers: Assessment at the local and regional scales. Ecol. Evol. 2024, 14, e11468. [Google Scholar] [CrossRef] [Scilit]
- Ding, K.; Qiang, Z.; Hu, Z.; Cheng, S.; Sun, R.; Fang, H.; Zhang, Z.; Ma, C. Elevational Gradients of Soil Nematode Communities in Subtropical Forest Ecosystems. Forests 2024, 15, 2149. [Google Scholar] [CrossRef] [Scilit]
- Yi, H.; Ferlian, O.; Cesarz, S.; Ciobanu, M.; Eisenhauer, N. Tree Diversity Increases the Diversity of Soil Nematodes and the Density of Persisters in a Temperate Forest Experiment. Eur. J. Soil. Sci. 2025, 76, e70183. [Google Scholar] [CrossRef] [Scilit]
- Reichel, R.; Hänsch, M.; Brüggemann, N. Indication of rapid soil food web recovery by nematode-derived indices in restored agricultural soil after open-cast lignite mining. Soil Biol. Biochem. 2017, 115, 261–264. [Google Scholar] [CrossRef] [Scilit]
- Blanco-Pérez, R.; de Toro, M.; Álvarez-Ortega, S.; Pou, A.; Sánchez-Moreno, S.; Campos-Herrera, R. Metabarcoding-based characterization of soil nematode communities to assess soil health in viticulture. Ecol. Indic. 2025, 176, 113696. [Google Scholar] [CrossRef] [Scilit]
- Pulavarty, A.; Klappauf, T.; Singh, A.; Molero Molina, P.; Godjo, A.; Molleman, B.; McMillan, D.; Kakouli-Duarte, T. Prevalence and Diversity of Plant Parasitic Nematodes in Irish Peatlands. Diversity 2024, 16, 639. [Google Scholar] [CrossRef] [Scilit]
- Geisen, S.; Snoek, L.B.; ten Hooven, F.C.; Duyts, H.; Kostenko, O.; Bloem, J.; Martens, H.; Quist, C.W.; Helder, J.A.; Van Der Putten, W. Integrating quantitative morphological and qualitative molecular methods to analyse soil nematode community responses to plant range expansion. Methods Ecol. Evol. 2018, 9, 1366–1378. [Google Scholar] [CrossRef] [Scilit]
- De Goede, R.G.M.; Du Preez, G.; Geisen, S.; Höss, S.; Kakouli-Duarte, T. Protocols for Nematode Sampling, Extraction, Morphological and Molecular Identification, Index Calculation and Toxicity Testing. In Nematodes as Environmental Indicators: From Theory to Practice; Kakouli-Duarte, T., Korthals, G., Sánchez-Moreno, S., Du Preez, G., De Goede, R.G.M., Eds.; CAB International: Wallingford, UK, 2026; pp. 250–272. [Google Scholar] [CrossRef] [Scilit]
- Biswal, D. Nematodes as Ghosts of Land Use Past: Elucidating the Roles of Soil Nematode Community Studies as Indicators of Soil Health and Land Management Practices. Appl. Biochem. Biotechnol. 2022, 194, 2357–2417. [Google Scholar] [CrossRef] [Scilit]
- Sexton, A.N.; Conitz, F.; Sturm, U.; Egerer, M. Wild Plants Drive Biotic Differentiation Across Urban Gardens. Ecol. Evol. 2025, 15, e71527. [Google Scholar] [CrossRef] [Scilit]
- Barrico, L.; Castro, H.; Pereira Coutinho, A.; Gonçalves, M.T.; Freitas, H.; Castro, P. Plant and microbial biodiversity in urban forests and public gardens: Insights for cities’ sustainable development. Urban. For. Urban. Green. 2018, 29, 19–27. [Google Scholar] [CrossRef] [Scilit]
- Mazaris, A.D.; Kallimanis, A.S.; Tzanopoulos, J.; Sgardelis, S.P.; Pantis, J.D. Can we predict the number of plant species from the richness of a few common genera, families or orders? J. Appl. Ecol. 2010, 47, 662–670. [Google Scholar] [CrossRef] [Scilit]
- Mo, Y.; Li, T.; Bao, Y.; Zhang, J.; Zhao, Y.; Ye, J.; Zhang, Y.; Wu, W.; Tang, J.; Li, Z. Correlations and dominant climatic factors among diversity patterns of plant families, genera, and species. Front. Ecol. Evol. 2022, 10, 1010067. [Google Scholar] [CrossRef] [Scilit]
- Sohlenius, B.; Boström, S.; Viketoft, M. Effects of plant species and plant diversity on soil nematodes—A field experiment on grassland run for seven years. Nematology 2011, 13, 115–131. [Google Scholar] [CrossRef] [Scilit]
- Eisenhauer, N.; Migunova, V.D.; Ackermann, M.; Ruess, L.; Scheu, S. Changes in Plant Species Richness Induce Functional Shifts in Soil Nematode Communities in Experimental Grassland. PLoS ONE 2011, 6, e24087. [Google Scholar] [CrossRef] [Scilit]
- Cesarz, S.; Ciobanu, M.; Wright, A.J.; Ebeling, A.; Vogel, A.; Weisser, W.W.; Eisenhauer, N. Plant species richness sustains higher trophic levels of soil nematode communities after consecutive environmental perturbations. Oecologia 2017, 184, 715–728. [Google Scholar] [CrossRef] [Scilit]
- Treonis, A.M.; Unangst, S.K.; Kepler, R.M.; Buyer, J.; Cavigelli, M.A.; Mirsky, S.B.; Maul, J.E. Characterization of soil nematode communities in three cropping systems through morphological and DNA metabarcoding approaches. Sci. Rep. 2018, 8, 2004. [Google Scholar] [CrossRef] [Scilit]
- Mazeka, B.; Tshingana-Bali, B.; Murgatroyd, O.; Moser, J.; Ojemaye, C.Y.; Petrik, L.F.; Karenyi, N. Field-based assessment of selected pharmaceuticals, pesticides and sediment metals using macrofauna and nematode communities in False Bay, South Africa. Mar. Pollut. Bull. 2026, 231, 119940. [Google Scholar] [CrossRef] [Scilit]
- Altieri, G.M.; Garrido, J.; Mato, S.; Soto, B.; Santarcangelo, V.; Bari, G.; Tarasco, E. Monitoring Soil Biodiversity and Biological Resilience in Disturbed Ecosystems: First Application of the BSR Index. Soil Syst. 2025, 9, 134. [Google Scholar] [CrossRef] [Scilit]
- Zhang, Y.; Zhang, A.; Zhou, Z.; Tu, C.; Pang, X. The long-term effect of gap size on soil invertebrates in subalpine forest. Appl. Soil Ecol. 2025, 212, 106202. [Google Scholar] [CrossRef] [Scilit]
- Franco, A.L.C.; Gherardi, L.A.; de Tomasel, C.M.; Andriuzzi, W.S.; Ankrom, K.E.; Shaw, E.A.; Bach, E.M.; Sala, O.E.; Wall, D.H. Drought suppresses soil predators and promotes root herbivores in mesic, but not in xeric grasslands. Proc. Natl. Acad. Sci. USA 2019, 116, 12883–12888. [Google Scholar] [CrossRef] [Scilit]
- Siebert, J.; Ciobanu, M.; Schädler, M.; Eisenhauer, N. Climate change and land use induce functional shifts in soil nematode communities. Oecologia 2020, 192, 281–294. [Google Scholar] [CrossRef] [Scilit]
- Viketoft, M.; Palmborg, C.; Sohlenius, B.; Huss-Danell, K.; Bengtsson, J. Plant species effects on soil nematode communities in experimental grasslands. Appl. Soil Ecol. 2005, 30, 90–103. [Google Scholar] [CrossRef] [Scilit]
- De Deyn, G.B.; Raaijmakers, C.E.; Van Ruijven, J.; Berendse, F.; Van Der Putten, W.H. Plant species identity and diversity effects on different trophic levels of nematodes in the soil food web. Oikos 2004, 106, 576–586. [Google Scholar] [CrossRef] [Scilit]

Disclaimer/Publisher’s Note: The statements, opinions and data contained in all publications are solely those of the individual author(s) and contributor(s) and not of MDPI and/or the editor(s). MDPI and/or the editor(s) disclaim responsibility for any injury to people or property resulting from any ideas, methods, instructions or products referred to in the content. |
© 2026 by the authors. Licensee MDPI, Basel, Switzerland. This article is an open access article distributed under the terms and conditions of the Creative Commons Attribution (CC BY) license.