


Abstract
Radon (222Rn) is a noble, radioactive gas and tends to be accumulated in poorly ventilated enclosed spaces. Mainly due to its radioactive daughters and the α-particles emitted, 222Rn poses a risk of cancer and therefore its concentration in air and water should be kept under certain reference levels. Several methods have been developed to accurately measure 222Rn concentration in water, using α, β or γ counting. A well-established, but not the only, method involves γ-spectroscopy using a High-Purity Germanium (HPGe) detector to identify the 222Rn decay isotopes 214Pb and 214Bi, assuming they are in secular equilibrium with 222Rn. This technique requires costly, bulky equipment due to the HPGe’s operation at −196 °C and the need for substantial shielding. The present study introduces a more affordable and compact device, utilizing CdZnTe (CZT) crystals, which provide exceptional energy resolution in the 300 to 600 keV range, with nearly eight times the Full Width at Half Maximum (FWHM) of HPGe. Four stacked CZT detectors, each containing a 0.5 cm3 crystal, were compared with measurements from an HPGe detector. Water samples were collected from boreholes and taps in a region where radon concentration in water ranged from 10 to 900 Bq/L. The results are promising for samples around 100 Bq/L, considering the potential advancements of the device with larger CZT detectors. Additionally, the method has the potential for in situ use due to its handheld capability.
1. Introduction
Public health is protected against radiation exposure via three essential principles: justification, optimization and dose limits [1]. Monitoring radon in water is part of the quiver of radiation protection, as it is estimated by the Environmental Protection Agency of USA [2] that radon in drinking water causes about 168 cancer deaths per year: 89% from lung cancer caused by breathing radon released to the indoor air from water and 11% from stomach cancer caused by consuming water containing radon. The radiological risk to humans of drinking radon-contaminated water is surpassed by inhalation of radon progenies [3]. Epidemiological evidence reviewed by the WHO indicates there is no confirmed link between radon ingestion and an increased risk of stomach cancer in humans, even at higher drinking-water concentrations. The main health concern remains lung cancer via airborne radon progeny [4]. It is evident that more research on the health effects of radon in water needs to be conducted. Globally, national strategic legislation, concerning radon in water, has been developed and applied in most states. Greece applies the reference level of 100 Bq/L for the concentration of radon in consumable (by human) water [5].
Radon (222Rn) belongs to the uranium series of natural radionuclides and is colorless, odorless and tasteless. It is difficult to be detected by direct atomic counting, as its atomic concentration in ppt is significantly below any available chemical technique. Radon has a half-life time of 3.8 days and emits α-particles with kinetic energy of 5.49 MeV. Its progenies are also α and β emitters, but 214Pb and 214Bi emit additional γ-rays of 352 keV and 609 keV, respectively. These two progenies have similar half-life times, i.e., 26.8 min for 214Pb and 19.8 min for 214Bi. For isolated water in a sealed beaker, secular equilibrium between radon and its progenies 214Pb and 214Bi is expected after almost 4 h. Nevertheless, experiments conducted by Omirou et al. indicate that in a beaker that is not perfectly sealed, the active half-life of 222Rn is 98% of the physical half-life of 222Rn [6], implying that the escape of radon is not significant, especially for short time intervals. As a noble gas, 222Rn easily escapes from its rock or soil of origin. There are two ways for 222Rn to enter our common world: by air and by water. Water matrices are classified by their origin and composition. In particular the groundwater matrix may transfer radon exhaled underground to the surface of the earth’s crust.
The existing solutions for estimating the concentration of diluted radon in water are diverse. Some of them include technically demanding procedures which consume laboratory materials and preparation time. Liquid Scintillation Counting (LSC) exploits radon’s greater solubility in organic scintillation cocktails compared to water, allowing efficient extraction and subsequent measurement of alpha emissions from 222Rn and its short-lived progeny [7]. Recent optimization studies have focused on two-phase systems and pulse shape discrimination to enhance detection efficiency and reduce quenching, achieving lower minimum detectable activities (MDAs), usually exploiting ultra-low-level LSC. Portable LSC devices have also been developed and benchmarked against standard laboratory methods, demonstrating substantial reductions in analysis time and cost [8]. Although liquid scintillation counting often outperforms gamma spectrometry in terms of sensitivity for 222Rn, it also requires careful calibration and cocktail selection to manage sample quenching and achieve optimal detection thresholds.
High-resolution gamma spectrometry using HPGe detectors has long been used to measure radon indirectly in water by detecting the photopeaks of its progenies 214Pb and 214Bi once secular equilibrium with 222Rn is reached. This technique allows simultaneous determination of multiple gamma-emitting radionuclides, minimizing chemical preparation and providing high precision in quantifying activity concentrations in drinking water and groundwater [9]. Despite its advantages, HPGe-based measurements typically require cryogenic cooling and heavy shielding to achieve low background, which limits portability and field deployment.
For the method used in this work, it is useful to mention the categorization into direct and indirect methods concerning the solvent medium of radon gas. Indirect methods firstly transfer radon in air and then measure the air which contains the transferred radon [6]. Indirect methods incorporate the use of detectors which detect the α-particles, either in continuous mode or in cumulative mode [10]. In this work a more straight-forward method is exploited that can be categorized as a direct method, as it measures the radon, as it is diluted in the water sample, via γ-spectrometry. In particular, it exploits the γ-emissions of radon progenies, which are dissolved in the water and are in radioactive equilibrium with the dissolved radon gas. High-energy-resolution spectrometers can be used to discriminate the photopeaks of 214Pb and 214Bi and yield their activity concentration in the sample. Such spectrometers are the High-Purity Germanium (HPGe) detectors which exhibit superior energy-resolution. Their disadvantages are (a) the bulky peripheral components which include the liquid nitrogen storage dewar or the Peltier module and the lead shielding against background radiation, (b) the operational costs and (c) the cost of purchase.
Cadmium Zinc Telluride (CZT) detectors were developed in the early 2000s as an alternative to CdTe detectors. Their main advantage over the CdTe detectors is their stability, which is translated into lower leakage current versus irradiation time [11]. CZT detectors exhibit very good efficiency and energy resolution, especially for medium-energy gamma-rays up to few hundreds of keV photon energy. Nowadays, CZT spectroscopic sensors are almost 7 times cheaper than HPGe detectors. A disadvantage of CZT in γ-spectroscopy is the small size (e.g., 5 mm cube) in which the bulk CZT crystal can be grown. The small crystal size limits the efficiency of CZT detectors for photons with energies above ~600 keV. The latter can be translated into an advantage for the detection of photons below ~600 keV, because it reduces the background which otherwise is increased by the Compton effect of higher energy γ-rays [12]. Recent research on developing enhanced CZT detectors has demonstrated that quaternary Cd1−XZnXTe1−γSeγ (CZTS) semiconductors can substantially improve the performance and manufacturability of room-temperature gamma-ray detectors compared with conventional CZT. By incorporating selenium into the CZT lattice, Chaudhuri et al. reported a marked reduction in sub-grain boundary networks and extended crystal defects, leading to enhanced compositional homogeneity, higher charge-collection efficiency, and significantly improved crystal growth yield (>90% compared with ~33% for standard CZT). Prototype CZTS detectors achieved excellent spectroscopic performance, with energy resolutions approaching 0.8% at the photopeak of Cs-137 (662 keV), comparable to high-resolution room-temperature semiconductor benchmarks. These findings indicate that CZTS materials offer a promising pathway toward larger-volume, lower-cost, and more reliable portable gamma spectrometers suitable for environmental and in situ radiation monitoring applications, although hole transport limitations still constrain ultimate performance [13].
This work attempts to highlight an innovative γ-spectrometric method for the identification and quantification of radon in water using CZT detectors. The approach exploits the high energy resolution of CZT at room temperature to clearly resolve the characteristic photopeaks of radon progenies, i.e., 352 keV and 609 keV, enabling reliable spectral discrimination and quantitative analysis. Despite the relatively small detector volume, the system demonstrates adequate sensitivity to differentiate radon activity concentrations in water within environmentally relevant ranges.
The innovation of the method is based on the flexibility to be used as a portable device in challenging environments and isolated areas. This advantage is given by the small size, the robustness and the durability in humidity of the CZT detector.
Nevertheless, several technical challenges must be addressed for reliable field implementation. These include achieving sufficient detection sensitivity for low activity concentrations, minimizing background radiation and spectral noise through appropriate shielding and acquisition strategies, and ensuring accurate calibration and stability under varying environmental conditions. Addressing these factors is essential for robust performance in complex or real-time measurement scenarios.
2. Theoretical Calculations
The MDA calculation was performed according to the ISO 11929 [14] standard:
where .
The decision threshold is also calculated with the formula
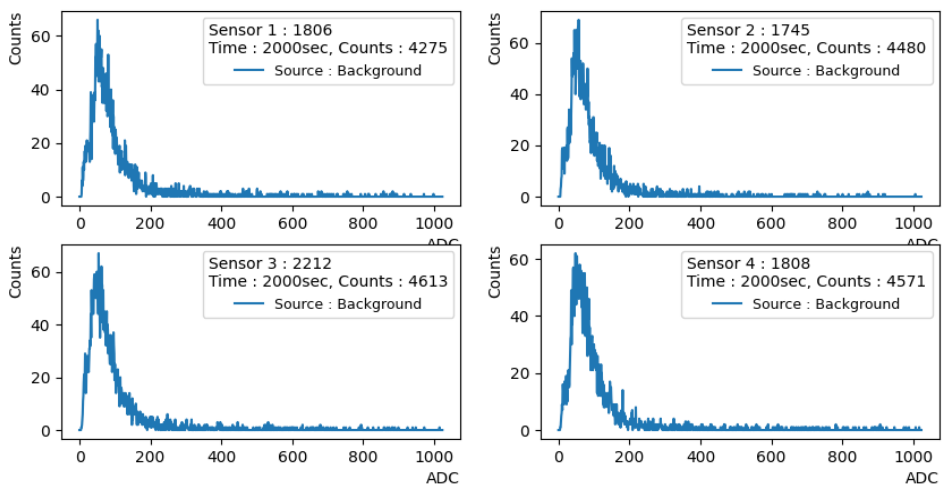
The parameters for the MDA calculation are the same for HPGe and CZT, except the background counts and the efficiency (Table 1). The background-spectra are presented in Appendix A.
Table 1.
MDA calculation parameters.
The MDA of the HPGe detector is noticeably better than the CZT (Table 2).
Table 2.
MDA calculation results.
3. Materials and Methods
We aimed to assess the capabilities of a prototype CZT detector, developed at the Institute of Nuclear and Particle Physics of the National Center for Scientific Research “Demokritos”, tested against a well-established method in the Nuclear Technology Laboratory of Aristotle University of Thessaloniki, exploiting a HPGe detector. The water samples were collected and transferred into the laboratory, to conduct γ-spectroscopic measurements with both CZT and HPGe. In the following, the sampling and the measurement methods are described.
Sampling: In this work the following rules of good practice in sampling natural radon-containing water were implemented:
- The sample was collected before it came into contact with air. This ensured that radon did not escape the water via any free surface to air.
- We used aluminum bottles with tightly closed lids filled with water samples of 600 mL volume. These bottles are able to hold diluted gases, and radon is one of these.
- The bottles were filled with a smooth flux of water and up to the rim, in order not to create bubbles, which can capture diluted radon within. Also, care was taken to fill each bottle to the top and, therefore, to minimize the gap of air underneath the bottle’s cap when it was firmly closed [6].
The samples of this work were collected from two boreholes and a tap in a region where constantly high concentrations of radon have been detected through continuous monitoring through the years [15]. To anticipate these high concentrations, nowadays a system of tanks collects the water for human consumption, where the water is stirred and the diluted radon gas escapes in the open air, before it reaches the villagers’ taps. The three water samples exhibit different radon concentrations in the range from 200 Bq/L to 900 Bq/L. The concentrations differ for several reasons. For instance, the underground, where the water flows before reaching the earth’s surface, consists of different compositions of plutonic rocks, which have different levels of natural radioactivity of the U-238 radioactive chain [15].
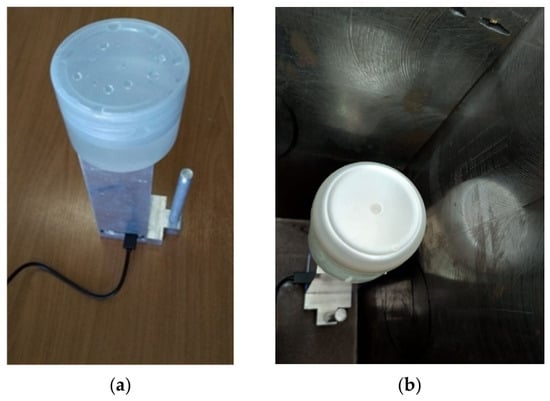
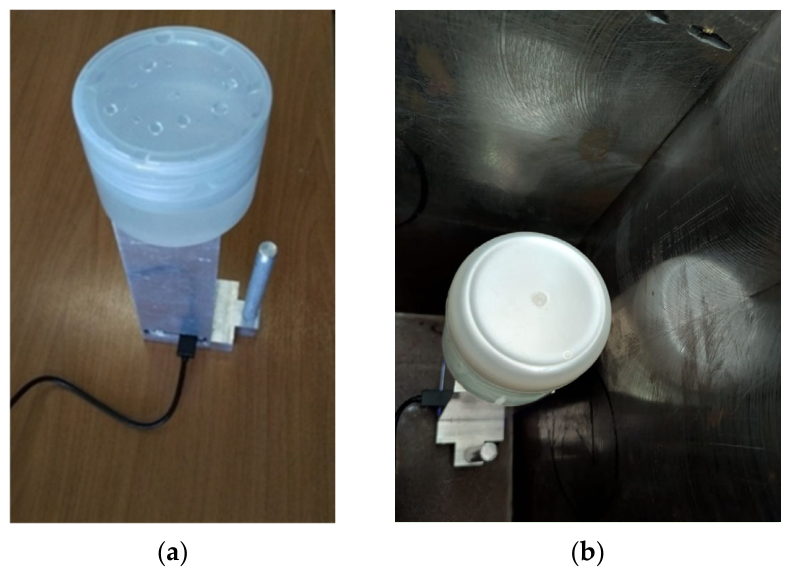
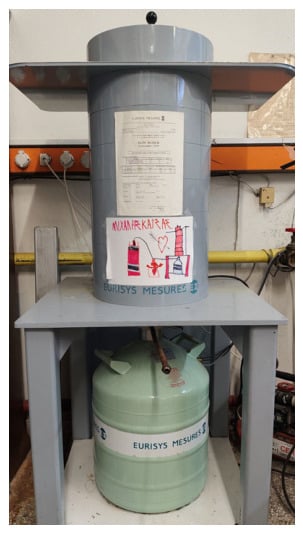
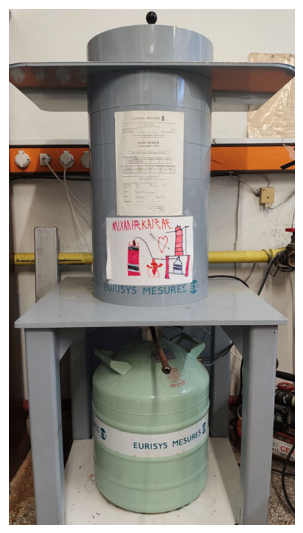
Measurements with HPGe and CZT detectors: Almost four hours after the collection of the samples, the closed aluminum bottles were gently shaken to homogenously distribute the progenies of 222Rn in the sample and poured in a beaker shown in Figure 1. To ensure the negligible leakage of radon and the homogeneous distribution of its progenies as long as the measurement lasted, the measuring time was kept short, i.e., 2000 s, and the beaker was firmly closed with its lid. Under these conditions, (a) no pretreatment actions, like acidifying, needed to be conducted on the samples, and (b) 222Rn γ-emitting progenies were considered in secular equilibrium with it. Therefore, defining the concentration of the progenies 214Pb and 214Bi defines the concentration of 222Rn. The concentrations of 214Pb and 214Bi were measured via the High-Purity Germanium γ-spectrometer of the Nuclear Technology Laboratory exploiting the photopeaks 352 keV of 214Pb and 609 keV of 214Bi. The detector used is the Eurisys EGPC 50-210-R High-Purity Germanium (HPGe), a French type P coaxial with 50.1% measured efficiency and 1.90 FWHM at 1332 KeV. The germanium crystal has an external diameter of 66.9 mm, length of 56.3 mm and active volume of 192 . This method exhibits a detection limit, i.e., MDC, of 5.27 Bq/L, using a 250 mL water sample in the appropriate-geometry beaker (see Figure 2). The sample was positioned on the top of the vertical aligned detector, inside a cylindrical shielding (see Figure 2), in order to minimize the background photons’ flux. The relative efficiency of the HPGe spectroscopic system is 50%. For its excellent sensitivity, the HPGe method used as the reference method in this work, to compare the results that the CZT method yields. For the CZT detector, sensitivity analysis measurements were performed at 800 s, 1600 s and 2000 s measurement time.
Figure 1.
CZT setup of four bulk detectors combined to achieve 2 active volume: (a) The beaker is positioned in contact with the four CZT detectors. The measurement geometry remains consistent in both apparatuses, with the detector in the vertical position and the sample on top. (b) The CZT detector inside the shielding.
Figure 2.
The cylindrical shielding of the HPGe detector.
The CZT technique uses the same measurement time and sample geometry as the HPGe technique, but with the absence of shielding. Therefore, the background photons reach the active volume of the four CZT semiconductor detectors, which are arranged vertical in a 2 × 2 matrix. Figure 1 shows the experimental setup of the CZT method.
Specifically, four μSPEC500 Gamma-Radiation CdZnTe (CZT) detectors, with 0.5 cm3 active volume each [16], have been integrated into a custom hand-held device at the Institute of Nuclear and Particle Physics, National Centre for Scientific Research “Demokritos.” Each detector is equipped with a low-power digital multichannel analyzer (MCA) from GBS-Elektronik GmbH.
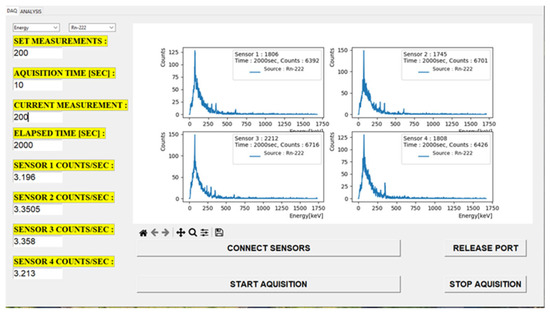
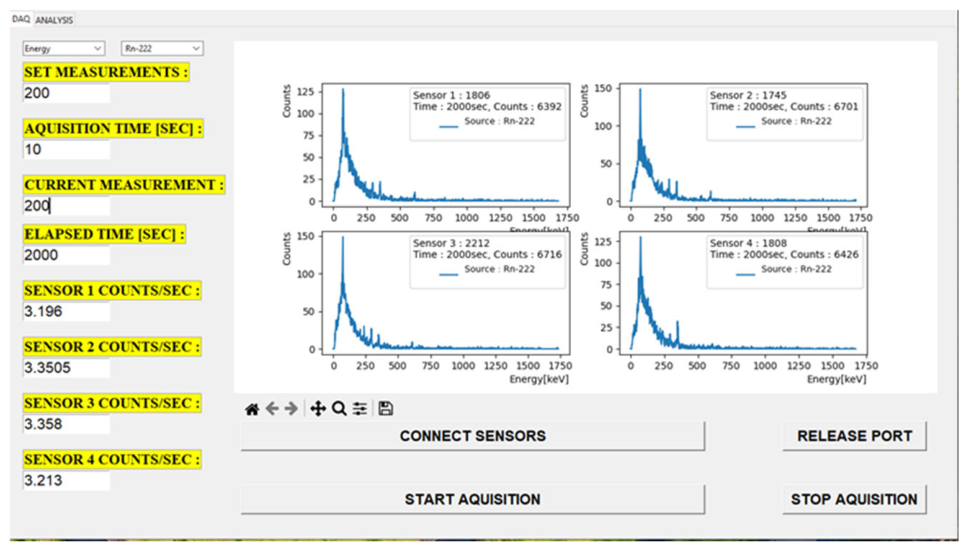
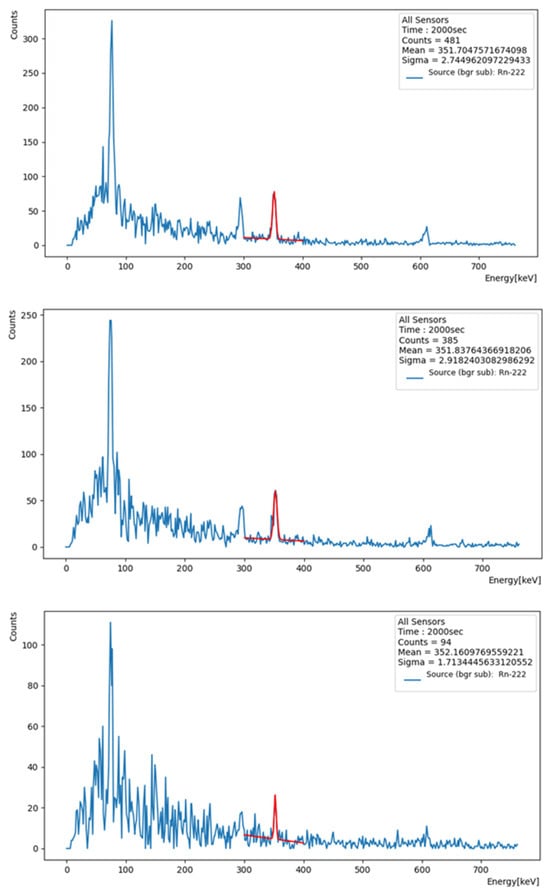
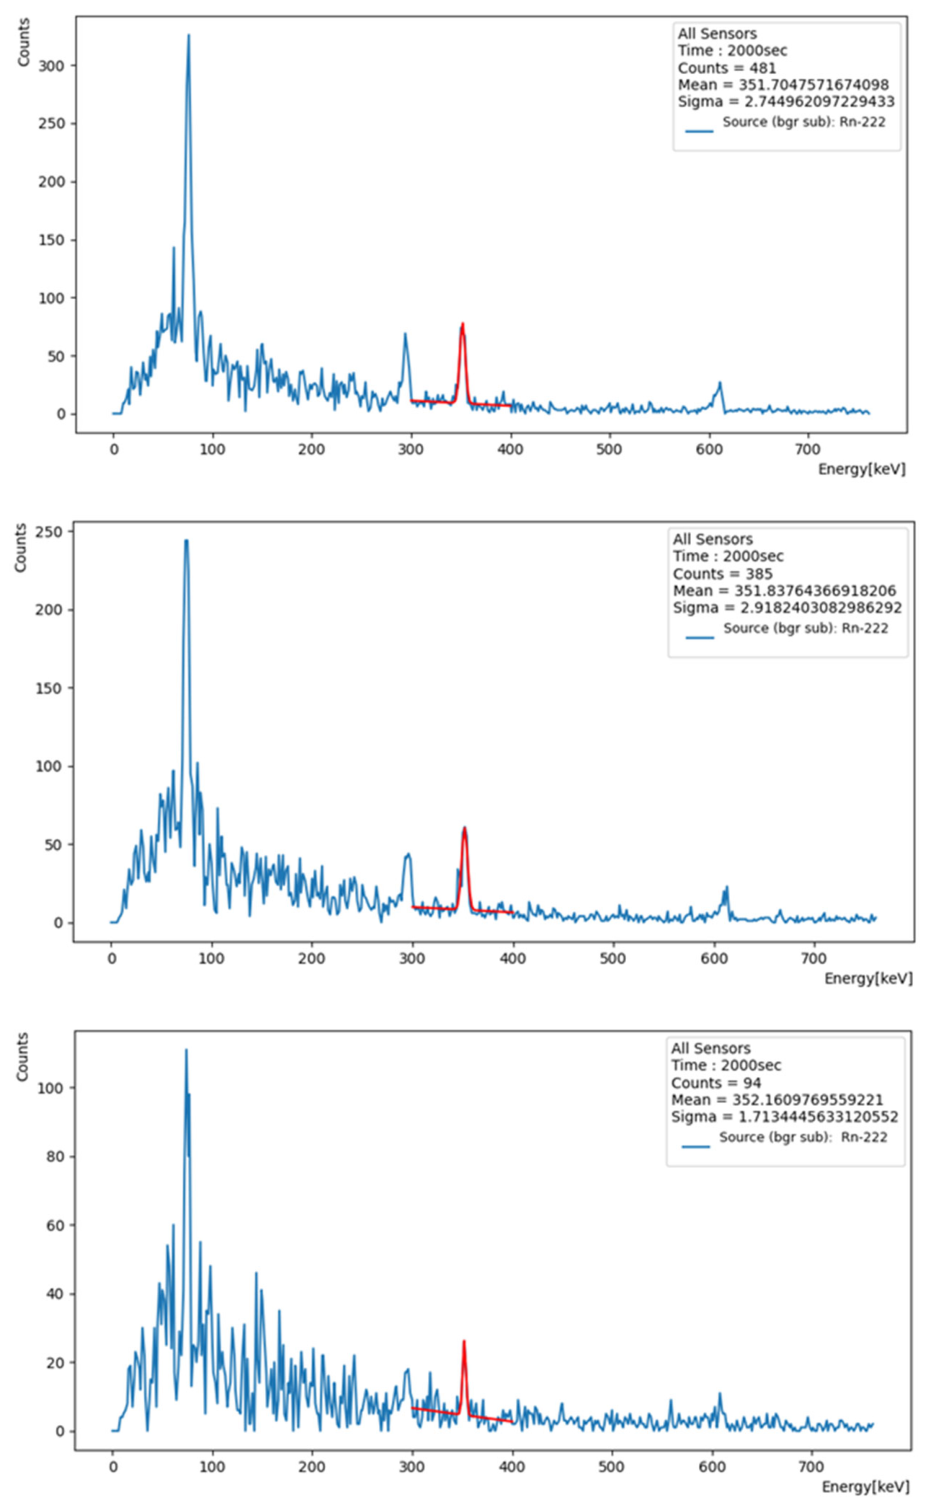
The μSPEC500 can measure γ-radiation spectra, via the data acquisition (DAQ) software that was developed by our research team. Its graphical user interface (GUI) is presented in Figure 3. The DAQ software is able to sum the spectra from all four CZT sensors, while taking into account the individual energy-calibration coefficients of each detector. This approach allows the photopeaks of interest to rise above the background level in the combined spectrum, even when they are not clearly visible in the individual spectra. Figure 4 exhibits an example of the combined spectrum. To the best of our knowledge, CZT detectors have not yet been used to determine radon concentrations in water samples. This highlights the innovative aspect of our work, which introduces a CZT-based technique that relies on γ-spectroscopy of radon progenies.
Figure 3.
The custom DAQ software displays the signals collected by the four CZT sensors from a water sample enriched in 222Rn. The photopeaks of 214Pb and 214Bi are visible in each spectrum. The energy and efficiency calibrations are presented in Appendix B.
Figure 4.
The DAQ software displays the combined spectrum of the four CZT sensors for the sample collected from location 1 (top), location 2 (middle) and location 3 (bottom). The Gaussian fitting of the photopeak of 214Pb is marked in red color and its total counts, mean and standard deviation are shown in the top-right legend.
Activity Calculations: For both methods the following parameters were used for calculating the initial (at the time of the water collection) activity concentration of 222Rn in Bq/kg:
- The sample mass, which was approximately 250 g.
- The time interval between sampling and measurement, which was approximately 4 h.
- The time interval of measurement, 2000 s.
- The net counts per second (cps) of the 352 keV photopeak and, specifically, to extract the background from the sample measurement:
- The net cps of the sample;
- The net cps of a background measurement.
- The fractional yield of the 352 keV photons emitted by 214Pb, that is, 0.356.
- The absolute efficiency for the above-described setups is the cps/photons emitted per second: for the HPGe setup, it is 0.029 and for the CZT setup it is 0.0034.
The absolute efficiency of the setups was derived using a BE-1847 multi-nuclide, gel source from Eckert & Ziegler. The characteristics of this volume source are presented in Appendix C). The beaker of this gel source has the same geometry and volume, i.e., 250 mL, as the ones used in the water measurement setups.
The concentration of activity (Bq/kg) was calculated with the formula
where cps is the net counts per second, m is the mass of the sample, Iγ is the fractional yield and eff is the absolute efficiency. To calculate the uncertainty of the concentration, the uncertainty propagation formula was applied:
where σm, σcps, σIγ, and σeff are the uncertainties of mass, cps, Iγ and eff, respectively.
The scale used has an accuracy of 5 mg, resulting in an uncertainty of 0.00002~0. We also consider the fraction yield uncertainty to be the one reported in Laboratoire National Henri Becquerel [17], i.e., for the 351 keV photopeak of Pb-214 the fraction yield is 35.60 and its uncertainty is 0.07. The uncertainty of cps is 0.0926 and the uncertainty of efficiency is 0.05. The room temperature was 23.4 and the RH 66.7%.
A second set of experiments was performed with the CZT placed inside a steel shielding appropriate for HPGe detectors with a wall thickness of 10 cm, to compare the two detectors on samples with lower concentrations. All other experiment parameters remained the same. This part of the experiment aims to eliminate the background effect on the CZT detector.
4. Results
The CZT method for determining the concentration levels of 222Rn in water was tested against the respective proven method of HPGe γ-spectroscopy. The eleven water samples are referenced with number indexing and descending values of radon concentrations (Table 3).
Table 3.
The measured concentrations of radon, along with their uncertainties for the two methods. For the CZT detector, samples 1 to 3 were measured without shielding and samples 4 to 11 were measured with shielding.
The combined spectra of the four CZT sensors were measured for the eleven samples, which were collected from different boreholes, springs and taps exhibiting high concentrations of 222Rn. In Figure 4, for samples 1 to 3, the photopeaks of 214Pb at 295 keV and 352 keV and the photopeak of 214Bi at 609 keV are distinguished and comprise an indicative signature of 222Rn presence in the tested water sample. The differences in the photopeaks’ heights are due to the dependence of the detector efficiency on the photon energy and the different fraction yield of each γ emission line. For its intensity, we choose the 352 keV photopeak of 214Pb to derive the concentration of 222Rn in water. The 352 keV photopeak consists of 481 counts for sample 1. The corresponding photopeaks for samples 2 and 3 are lower according to their lower values of radon concentration, and they consist of 385 counts and 94 counts, respectively.
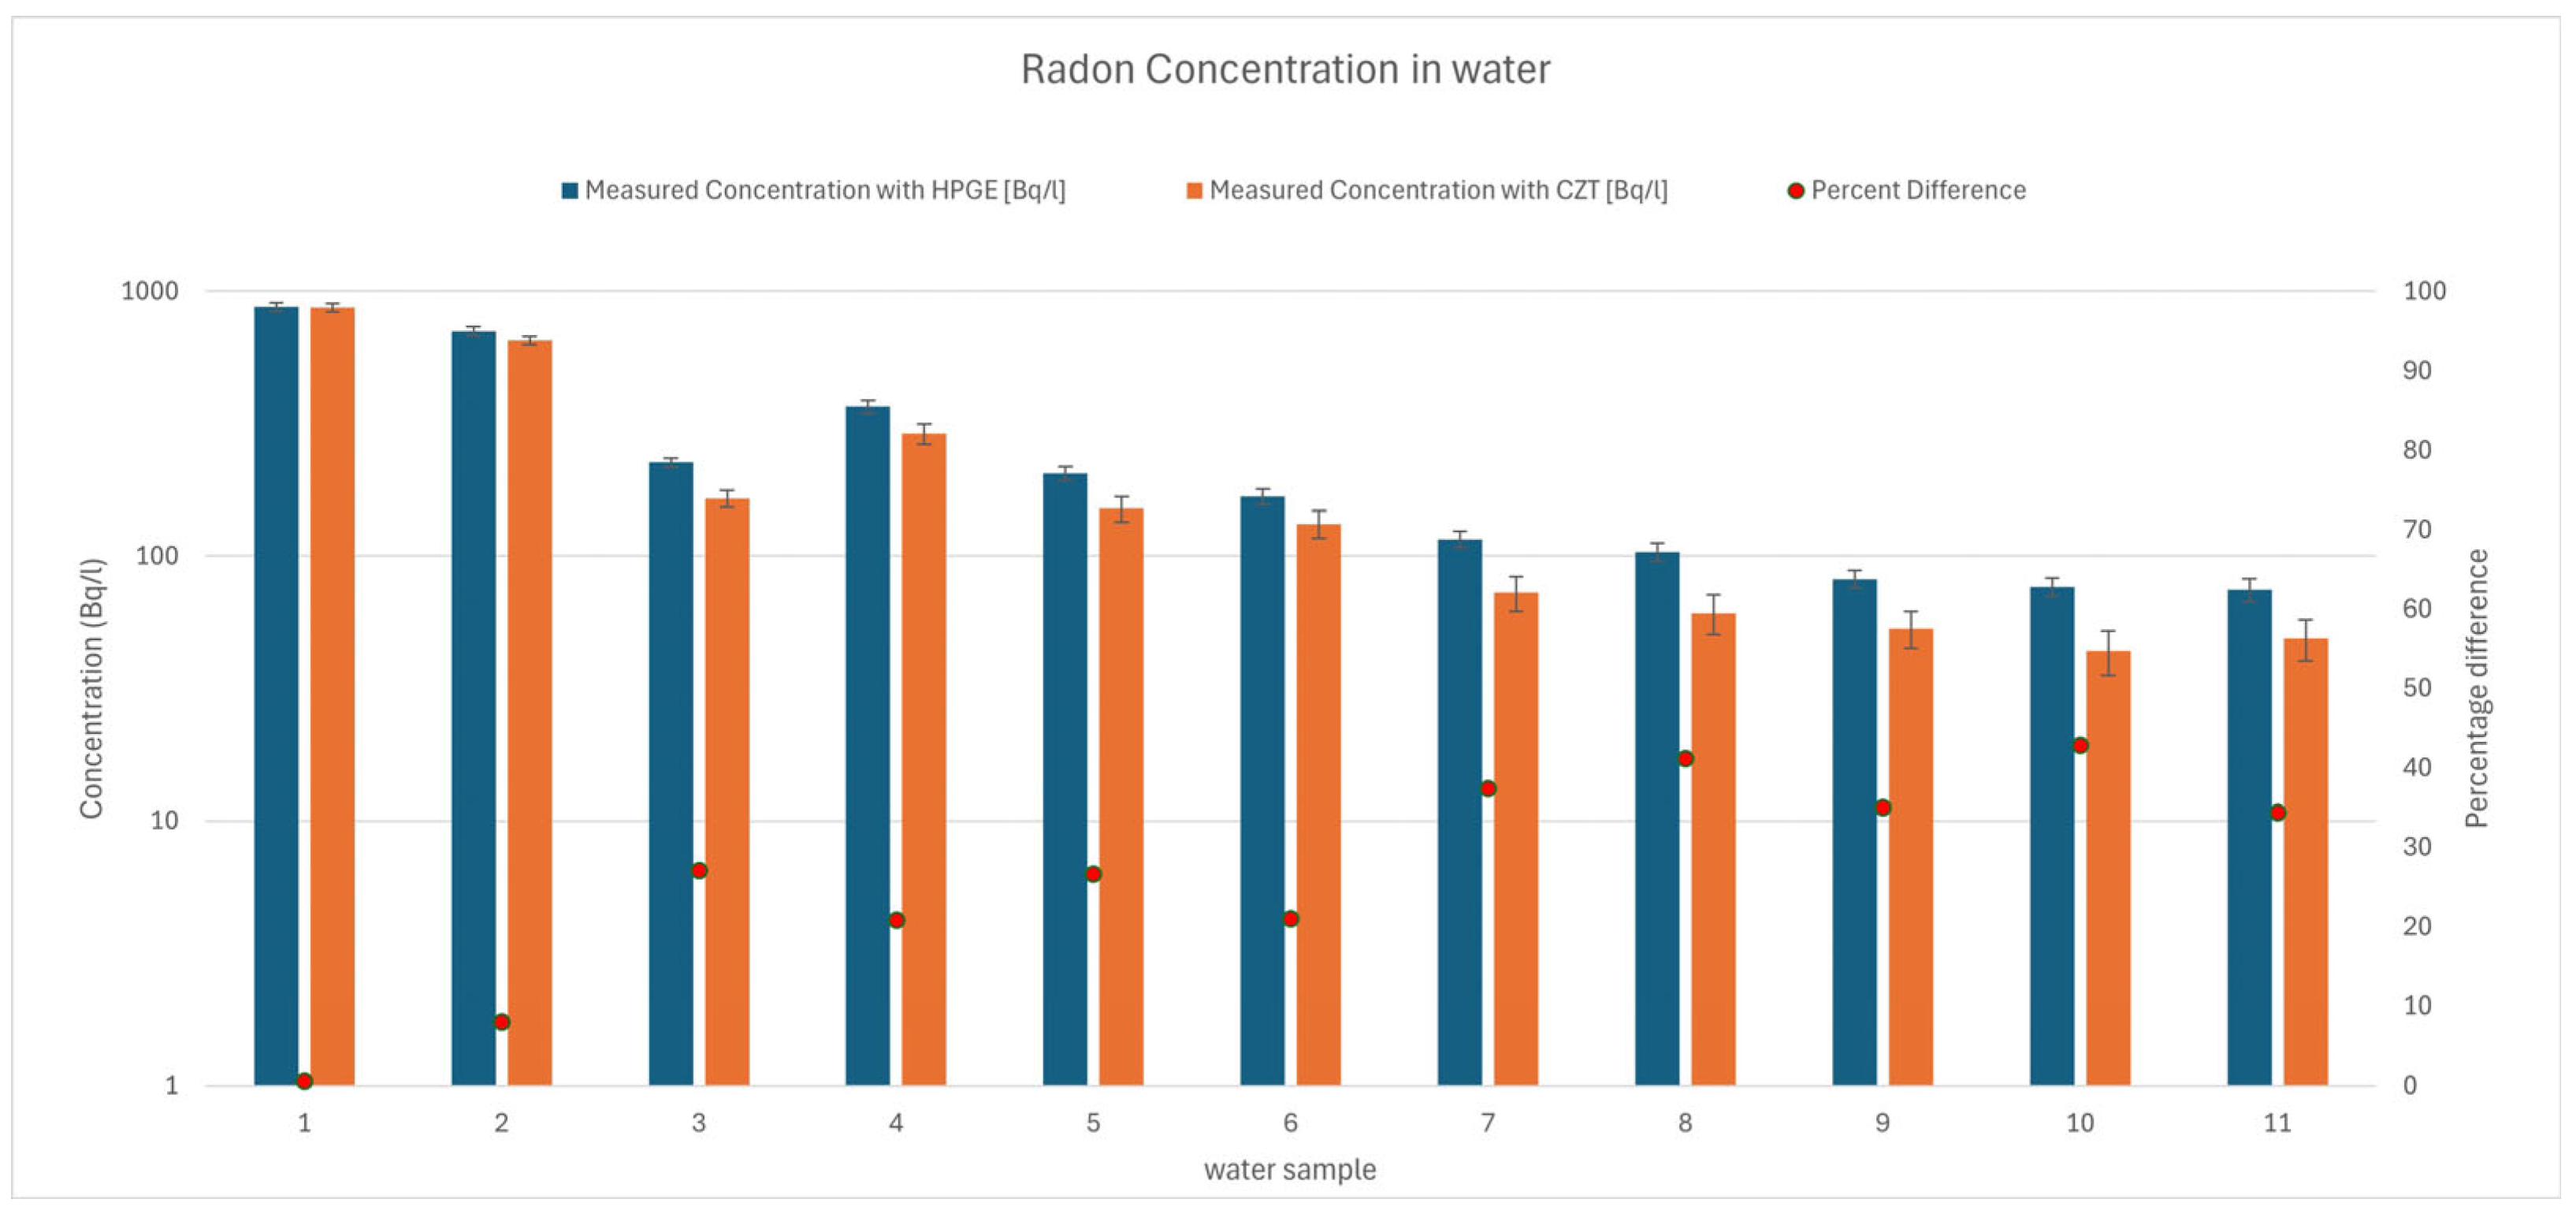
The comparison of the CZT method with the HPGe method can be conducted with the values of Table 3. The difference between the two methods is negligible for high-concentration sample 1. For sample 2 the percent difference is 8%, and for low-concentration sample 3 the percent difference is 27%. Applying linear regression, we can estimate that the difference exceeds 15% for reference concentrations below 500 Bq/L. Measurements with shielded CZT, for samples 4 to 11, exhibit an average percentage difference of 32%. Despite this finding, Section 5 presents an analysis that offers improved accuracy.
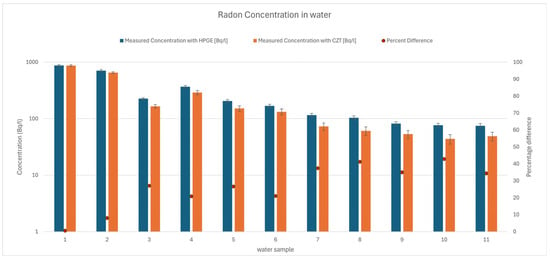
In Figure 5, the chart presents the differences in the measured concentration in logarithmic scale. Also, the percent difference between the CZT method and the HPGe method of measurement is presented for all eleven samples.
Figure 5.
The measured concentrations of each method in logarithmic scale. The uncertainty bars display the uncertainty of each measurement. The percent difference is shown with red dots and the values refer to the right-hand vertical linear axis.
To prove radon decay is not a contributing factor to our measurements, decay calculations were performed for the highest reference concentration, i.e., 872 ± 30 Bq/L:
and for the uncertainty
From these calculations, the concentration at the start of the measurement should be 875.7 ± 30.13, rather than the measured 872 ± 30 Bq/L. We consider these differences negligible, and even more so for the other samples that exhibit lower concentrations.
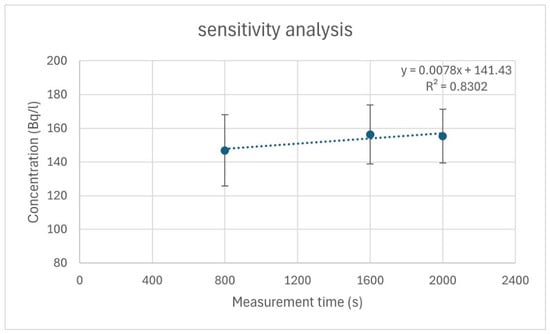
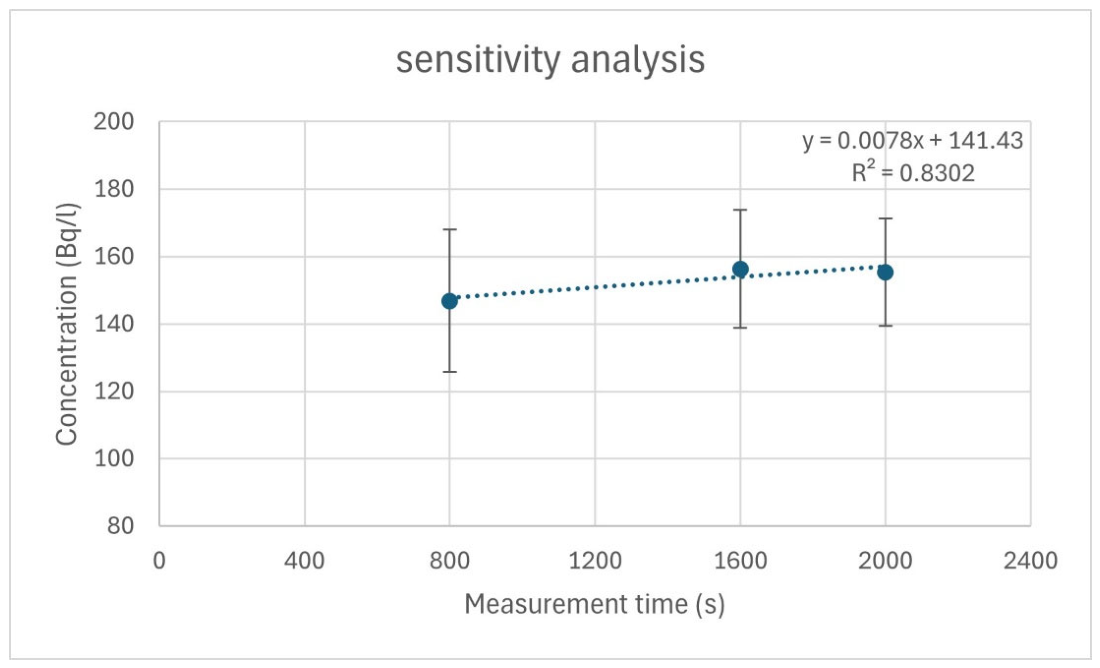
To present the sensitivity of the CZT system, a sensitivity analysis was performed. The concentration value stabilized as the measurement time increased from 800 s to 2000 s, as it is shown in Figure 6.
Figure 6.
Sensitivity analysis performed for sample 9. The uncertainty is provided as error bars and the linear fitting illustrates a negligible increase in concentration versus the measurement time.
5. Discussion
In the case of the unshielded CZT detector, the percentage differences between the CZT and the HPGe measurements increases from 0.6% to 27% (see Table 1) as the reference concentration decreases from 872 Bq/L to 226 Bq/L. Consequently, for lower concentrations, the percentage difference will increase further, even more than 50%, since the percentage difference seems to follow an exponential increase. Thus, the CZT configuration will not be able to provide reliable distinctions over or below the legal reference level of 100 Bq/L. For instance, if HPGe measures 100 Bq/L, the CZT will measure in the range of 50 Bq/L to 100 Bq/L, since the CZT values are always lower than the HPGe ones.
In the case of the shielded CZT, the detection limit improved and measurements even below 100 Bq/L could be performed with a percentage difference of around 35%. Considering that this prototype was developed as a preliminary model to demonstrate the capabilities of this innovative technique that uses CZT γ-spectroscopy to measure the radon concentration in water, this 35% percentage difference can be improved.
Taking into account that CZT detectors with bigger active volume are commercially available, the sensitivity of the CZT method can be improved to reliably discriminate radon concentrations in water even below 100 Bq/L. Upgrading by a small portion, the active volume almost proportionally rises the system’s efficiency and improves the energy resolution of the system [18,19]. Using theoretical calculations of interaction probability of 352 keV photons with the CZT crystal,
the increase in the dimensions of the CZT crystal from 2 × 2 × 0.5 cm3 to 2 × 2 × 1 cm3 improves the efficiency, i.e., , almost by 1.7, where μ is the attenuation coefficient and is equal to 0.792 cm−1. Further increasing the thickness to 1.5 cm, the ratio equals almost 2.1. Taking into account that the photons yielded by the Compton effect escape more difficultly from the thicker CZT crystal, the efficiency is expected to slightly increase. In addition, providing lead shielding to isolate the CZT detector and the measured sample from background radiation minimizes the background baseline of the acquired spectrum and thus provides clearer photopeaks.
Although CZT and CZTS exhibit nearly identical intrinsic gamma-ray attenuation coefficients μ, the improved crystal growth yield and the reduced extended defect density of CZTS enable fabrication of substantially larger detector volumes. Conventional CZT detectors are typically limited to thicknesses of 5–10 mm, whereas CZTS crystals of 15–25 mm thickness can be grown with high uniformity and >90% usable yield. Further increases in lateral area or detector arrays provide even larger sensitivity improvements. The principal advantage of CZTS arises not from higher stopping power but from the ability to realize larger, higher-quality active volumes that significantly enhance practical detection efficiency and lower detection limits. Thus, the benefit of CZTS is primarily technological rather than intrinsic to the photon interaction probability.
With the above improvements, namely increasing the active detector volume or employing CZTS crystals as an alternative to conventional CZT, the system would become capable of reliably distinguishing whether radon concentrations are below or above the reference level of 100 Bq/L [1,5], making it a low-cost, in situ tool that supports decision-making regarding the enforcement of the relevant legislation.
Summarizing the advantages of the CZT technique, we can mention:
- The absence of cooling requirements and bulky, escorting equipment.
- The mobility of the device, because of its hand-held operation. Therefore, on-site measurements can be achieved in difficult to access locations, like steep slopes on rural environments. Additionally, if required, lightweight shielding can be transported together with the CZT inside an automobile.
- The cost effectiveness, as the prices of bulk CZT detectors are affordable and the operational costs are negligible. CZT systems are almost 7 times cheaper than the HPGe systems, excluding the room-temperature operation.
These first results of measuring 222Rn with CZT detectors are promising for future applications of the method. For instance, a new method may be developed for measuring pipe-running water in difficult-to-access environments, taking into account the extra calibration procedure needed for the different geometries of the setups.
6. Conclusions
In this study, a comprehensive experiment was conducted for the evaluation of CZT detectors’ capabilities in measuring radon concentrations in water, utilizing γ-spectra of radon progenies, like 214Pb. Spectra were collected with both HPGe and CZT detectors and the method that uses the HPGe detector was considered as the reference method.
The results indicate that CZT detectors with 4 × 0.5 cm3 active volume are capable of measuring concentrations of 222Rn above the level of 200 Bq per liter of water. Meanwhile, we improve the accuracy at lower concentrations by utilizing lightweight shielding. To improve the CZT method, we propose (a) radiation shielding that surrounds the CZT detector and the beaker with the water sample and (b) extended active volumes of CZT crystals, beyond 2 cm3, or the use of CZTS crystals which exhibit reduced extended defects, substantially higher growth yield, and improved compositional uniformity. In this way, the CZT technique is expected to achieve higher sensitivity and distinguish concentrations of 222Rn on the order of tens of Bq per liter of water.
Author Contributions
Conceptualization, I.K. and A.K.; methodology, I.K. and A.K.; software, I.K., K.K. and A.K.; validation, I.K., K.K. and A.K.; formal analysis, I.K., P.P., K.K. and A.K.; investigation, I.K. and A.K.; resources, I.K. and A.K.; data curation, I.K., P.P., K.K. and A.K.; writing—original draft preparation, I.K. and A.K.; writing—review and editing, I.K., P.P., K.K. and A.K.; visualization, I.K., P.P. and A.K.; supervision, I.K. and A.K.; project administration, I.K.; funding acquisition, I.K. and A.K. All authors have read and agreed to the published version of the manuscript.
Funding
This research received no external funding.
Data Availability Statement
Dataset available on request from the authors.
Acknowledgments
The authors would like to thank Emeritus Alexandros Clouvas for the analytical conversations they have during this study.
Conflicts of Interest
The authors declare no conflicts of interest.
Abbreviations
The following abbreviations are used in this manuscript:
| CZT | Cadmium Zinc Telluride |
| DAQ | Data Acquisition |
| HPGe | High-Purity Germanium |
| MDA | Minimum Detectable Activity |
| MDC | Minimum Detectable Concentration |
Appendix A. Background Spectra
The background spectra were measured with a beaker filled with distilled water and with the same procedures as the test samples.
Figure A1.
HPGE background spectrum, measured for 2000 s.
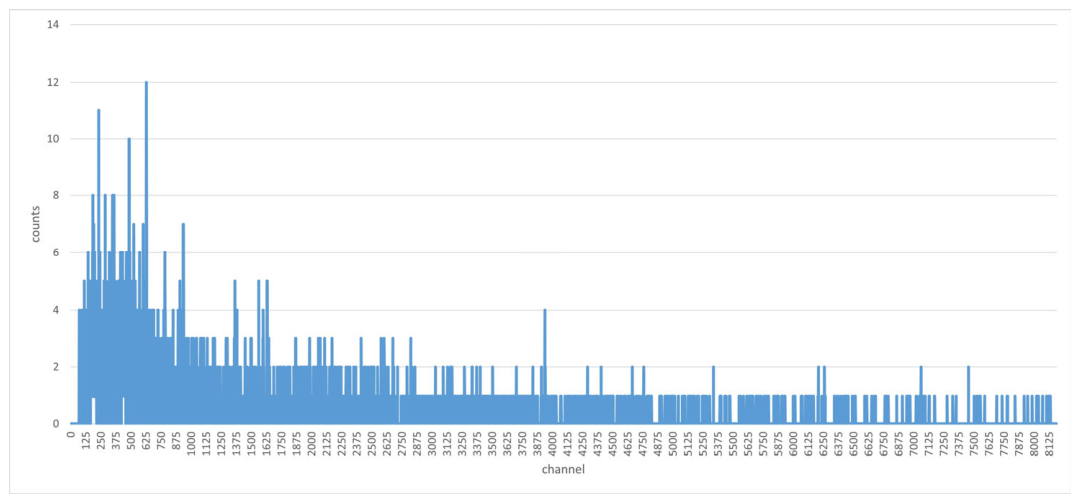
Figure A2.
Shielded CZT background spectrum, measured for 2000 s.
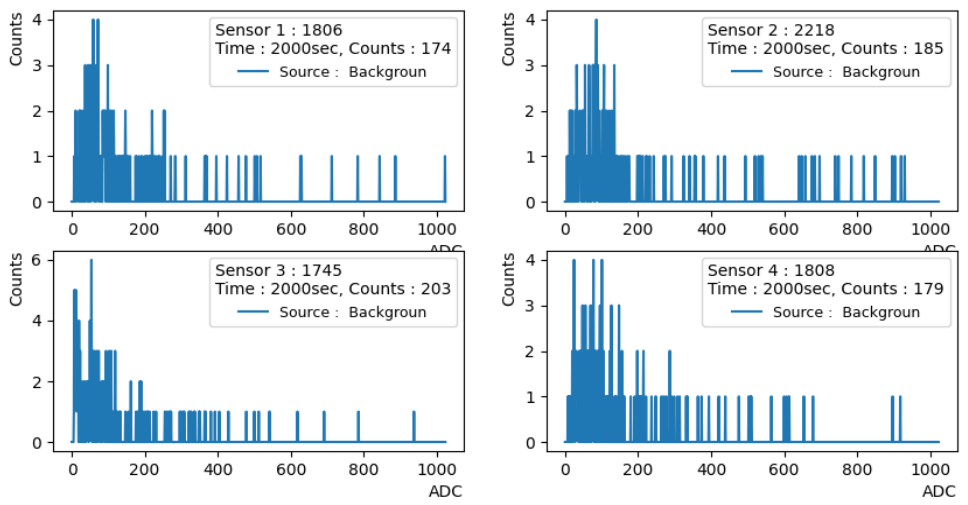
Figure A3.
Unshielded CZT background spectrum, measured for 2000 s.
Appendix B. Energy and Efficiency Calibration for the CZT Detector
Regarding the energy calibration: Energy calibration was performed using a Cs-137 source with an activity of 37 kBq. The characteristic photopeaks were identified at 662 keV and 32 keV.
The resulting linear calibration equations relating energy E to the ADC channel counts for each of the four detectors are defined as follows:
Detector 1: E1 = 1.647∙ADC channel − 1.2
Detector 2: E2 = 1.672∙ADC channel + 2.1
Detector 3: E3 = 1.695∙ADC channel + 1.6
Detector 4: E4 = 1.635∙ADC channel + 0.18
Regarding the efficiency calibration: Based on the experimental setup, the efficiency calibration should be treated collectively for the entire multi-detector system rather than evaluating each sensor in isolation.
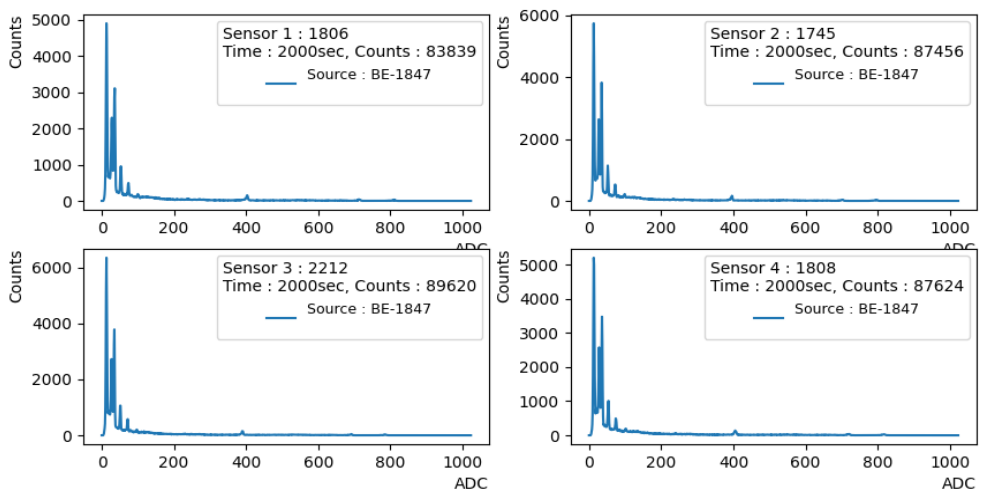
The calibration source was positioned precisely and symmetrically at the center, covering all four detectors. In this way, the amount of incident photons was the same across all detectors and the recorded counts from the standard source were virtually identical across all detectors, confirming that the individual detection efficiencies of the four sensors are practically equal, as seen on the image below.
Figure A4.
CZT spectra from BE-1847 source for 2000 s.
Appendix C. BE-1847 Source Isotopes and Activities
Table A1.
BE-1847 source by Eckert & Ziegler.
References
- EURATOM. Council Directive 2013/59/Euratom of 5 December 2013 laying down basic safety standards for protection against the dangers arising from exposure to ionising radiation. Off. J. Eur. Union 2013, L13, 1–73. Available online: https://eur-lex.europa.eu/legal-content/EN/ALL/?uri=CELEX:32013L0059 (accessed on 17 May 2026).
- Environmental Protection Agency (EPA). Basic Information About Radon in Drinking Water: Why Is Radon in Drinking Water a Health Concern? 2014. Available online: https://archive.epa.gov/water/archive/web/html/basicinformation-2.html (accessed on 17 May 2026).
- National Research Council. Risk Assessment of Radon in Drinking Water; National Academies Press: Washington, DC, USA, 1999. [Google Scholar] [CrossRef] [Scilit]
- World Health Organization (WHO). Guidelines for Drinking-Water Quality: Fourth Edition Incorporating the First and Second Addenda; WHO: Geneva, Switzerland, 2022; Available online: https://www.who.int/publications/i/item/9789240045064 (accessed on 17 May 2026).
- Greek Atomic Energy Commission (EEAE). Ministerial Decision Π/112/1057/2016/01-02-2016. ΦΕΚ 241/Β/09-02-2016. 2016. Available online: https://eeae.gr/wp-content/uploads/2025/10/code_1057.pdf (accessed on 17 May 2026).
- Omirou, M.; Clouvas, A.; Leontaris, F. Metrology aspects (sampling, storage, transportation, and measurement) of radon in water. J. Eur. Radon Assoc. 2022, 3, 8643. [Google Scholar] [CrossRef] [Scilit]
- Goswami, S.; Chitra, N.; Parthasarathy, K. Optimization of parameters for the measurement of radon-222 in water using two phase liquid scintillation counting. Appl. Radiat. Isot. 2025, 222, 111884. [Google Scholar] [CrossRef] [Scilit] [PubMed]
- Celaya, S.; Fuente, I.; Quindos, L.; Sainz, C. Optimization of a portable liquid scintillation counting device for determining Rn-222 in water. arXiv 2024, arXiv:2402.05609. Available online: https://arxiv.org/abs/2402.05609 (accessed on 12 February 2026).
- Cantaluppi, C.; de Felice, P.; Giancaterino, S.; Remetti, R. Methods for radioactivity measurements in drinking water using gamma spectrometry. J. Environ. Radioact. 2021, 232, 106566. [Google Scholar] [CrossRef] [Scilit] [PubMed]
- Ouzounis, A.; Kaissas, I. A review of methodologies for measuring geogenic Rn exhalation. HNPS Adv. Nucl. Phys. 2025, 31, 90–95. [Google Scholar] [CrossRef] [Scilit]
- Iniewski, K. Advanced X-Ray Detector Technologies Design and Applications; Springer Nature: Cham, Switzerland, 2022. [Google Scholar] [CrossRef] [Scilit]
- Quam, W. Cadmium-Zinc-Telluride (CZT) Gamma Ray Spectrometry; Technical Report DOE/NV/11718--654; OSTI ID 788884; Bechtel Nevada: Santa Barbara, CA, USA, 2001. Available online: https://www.osti.gov/servlets/purl/788884 (accessed on 17 May 2026).
- Chaudhuri, S.K.; Kleppinger, J.W.; Karadavut, O.; Nag, R.; Mandal, K.C. Quaternary semiconductor for high-resolution, room-temperature gamma-ray detection. Crystals 2021, 11, 827. [Google Scholar] [CrossRef] [Scilit]
- De Felice, P.; Jerome, S.; Petrucci, A. Practical implementation of ISO 11929: 2010. Appl. Radiat. Isot. 2017, 126, 256–262. [Google Scholar] [CrossRef] [Scilit] [PubMed]
- Omirou, M.; Clouvas, A.; Leontaris, F.; Kaissas, I. In-depth study of radon in water in a Greek village with enhanced radon concentrations. J. Environ. Radioact. 2023, 264, 107210. [Google Scholar] [CrossRef] [Scilit] [PubMed]
- RITEC. Nuclear Radiation Semiconductor Detectors and Associated Electronics, Specifications of μSPEC500. 2025. Available online: http://www.ritec.lv/html/uspec.html (accessed on 17 May 2026).
- Laboratoire National Henri Becquerel. Available online: http://www.lnhb.fr/nuclides/Pb-214_tables.pdf (accessed on 18 May 2026).
- Goodman, D.; Xia, J.; Sanders, J.; He, Z. FRAM v5.2 estimation of plutonium and uranium isotopics using digitized 3-D position-sensitive CdZnTe detectors. Nucl. Instrum. Methods Phys. Res. Sect. A 2020, 954, 161339. [Google Scholar] [CrossRef] [Scilit]
- Goodman, D.; H3D, Inc. Selecting a Plug-and-Play CZT Gamma-Ray Spectrometer. 2014. Available online: https://h3dgamma.com/ChoosingOEM.php (accessed on 17 May 2026).

Disclaimer/Publisher’s Note: The statements, opinions and data contained in all publications are solely those of the individual author(s) and contributor(s) and not of MDPI and/or the editor(s). MDPI and/or the editor(s) disclaim responsibility for any injury to people or property resulting from any ideas, methods, instructions or products referred to in the content. |
© 2026 by the authors. Licensee MDPI, Basel, Switzerland. This article is an open access article distributed under the terms and conditions of the Creative Commons Attribution (CC BY) license.